
Submitted:
15 September 2023
Posted:
18 September 2023
You are already at the latest version
Abstract
This article obtains data through questionnaire survey, and then uses the Multiple Indicators Multiple Causes (MIMIC) Model to establish the Taoyuan City’s quality of life quantifying framework in a city-level community context. Statistical test results show that the reliability of overall model is high and is suitable for policy analysis. There are thirteen variables in the structural model that significantly affect the quality of life as well as eleven indicators in the measurement model that can significantly measure the quality of life. Then, half of the observations are substituted back to calculate the quality of life. Via ArcGis operation, it finds that the quality of life of Longtan District is the best as well as Dayuan District is the worst one. LISA cluster of quality of life illustrates hot spots areas are distributed in Longtan, Daxi, and Pingzhen Districts.
Keywords:
quality of life
; community context
; policy implication
; MIMIC model
; ArcGis
1. Introduction
In addition to the workplace, the community in the city is the center of personal life. The most important thing for individuals in the community is the quality of life. The quality of life will not only affect the willingness of individuals to live, but also affect the value of the community. The quality of life is an individual's subjective evaluation of the community. The evaluation targets include various services provided by the community, such as: garbage disposal and removal, childcare, elderly care, convenient transportation, fire prevention, air quality improvement, and environmental maintenance. Personal subjective feelings will be affected by objective factors of individuals and communities [1,2,3,4,5,6,7,8,9,10,11,12,13,14,15,16].
No contents of quality of life can be defined from a single item. This article uses the MIMIC (Multiple Indicator Multiple Causes Model) model to establish a quality of life evaluation model. This model includes a latent variable that is the quality of life whose level is affected by objective factors, and the quality of life can be measured by personal subjective evaluation [17,18,19]. Taoyuan City in Taiwan is selected as the research scope of this article, and the data have been obtained through questionnaire surveys on the internet and social media. Quality of life in the MIMIC model is considered as the latent variable , a function of the observable causal variable vector x, where u is the random error vector. The quality of life can be measured by the observable variable y and represented as , where v is the random error vector.
The first economist to introduce hedonic pricing of methodology to measure quality of life in cities is Rosen [20]. Rosen (1974) [20] compared quality of life US cities with data on wages. Previous researches on quality of life can be divided into two developments, one is measurement and the other is determinants.
This article refers to the structural equations of [21,22,23] to construct structure equation model for the measurement and investigation of the determinants of quality of life for Taoyuan City, Taiwan. The questionnaire survey is designed to ask respondents: (1) the objective attributes of housing, community, and neighborhood, (2) the subjective satisfaction on housing, community, and neighborhood, (3) individual attributes. The information obtained from the questionnaire survey are used as research variables to estimate the coefficients of the variables in the MIMIC model. The individual evaluation on quality of life is forecasted based on the results, which is aggregated to district quality of life as the ranking outcome. Finally, local indicator of spatial autocorrelation and spatial lag regression model are applied to investigate the spatial autocorrelation and spatial effects of quality of life.
The remainder of this article is organized as follows. “Measurement on quality of life and related literature” section highlights recent trends in measurement on quality of life and a brief overview of theories and empirical research on quality of life. The “Current quality of life” section provides current situation on quality of life in Tauyan City, Taiwan. Data of this article is discussed in “Sampling design” and “Questionnaire design” sections, and an outline of the methodology applied, and the empirical models estimated are provided in “Methodological Approach” section. Results are illustrated in “Results” section. Finally, concluding remarks are provided in “Conclusion” section.
2. Materials and Methods
2.1. Relative Research
Marans and Kweon [24] used Detroit Area Study 2001 (DAS2001) to collect structured questionnaire survey data in Detroit, USA, and used the US census and secondary data to transform the respondents' community and real environment information. The quality of urban life is reflected in three levels: (1) personal home, (2) the neighborhood where the home is located, and (3) the city to which the neighborhood belongs. The approach of Marans and Kweon's research is to regard the quality of urban life as a potential variable, and take the satisfaction degree of personal residence, neighborhood community, and urban variables as predictive variables to establish a structural equation model of quality of life. MacCrea et al. [25] proposed a structural model of quality of life integrating subjective and objective aspects. The quality of life in the model is a potential subjective variable, which can be measured by the subjective satisfaction of communities, cities, and regions. Quality of life is affected by the underlying subjective perception of accessibility and crowding. The influencing variable of the potential subjective perception of accessibility is the objective accessibility index, the influencing variables of the potential subjective perception of congestion are the objective density and the housing cost. The six subjective and objective latent variables can be measured by the observable variables of schools, markets, sports grounds, hospitals, spatial distance, pollution, and crowding. Quality of life is an unobservable latent variable that belongs to the social science study. Social science research typically validates social discourses by quantifying probability estimates. The simplest way is to obtain quantitative data through survey or census. The researchers then used these data to analyze the birth rate, the proportion of households with pianos, income, and the proportion of schoolchildren who possessed marijuana, etc., and applied statistical test to examine the research hypotheses. In contrast, researchers must analyze the tendency of potential variables such as individual will and attitudes through the causal and effect framework, including the analysis of aggressiveness, deprivation, alienation, quality of life, sense of community, corporate reputation, morality, and happiness meanings that cannot be estimated directly. Latent variables must be evaluated in terms of potential linkages to other observed observable variables [26,27,28,29,30,31,32]. Mulligan et al. [33] believe that the quality of life is an individual's sense of satisfaction with the surrounding physical environment and human conditions, including geographical places of different scales and subjective feelings of different residents and manufacturers. Social science mostly starts with the measurement and evaluation of quality of life, analyzing the impact of quality of life on residents’ behavior [34,35,36,37]. Quality of life is important not only because it affects the behavior of residents, but also because it represents the satisfaction and happiness of residents, ie improved well-being. Quality of life at the metropolitan level has research and policy implications: (1) is the basis for public action needs [38,39], (2) directly affects the urban livability, providing policy decision makers political performance evaluation [40], (3) induces individual residential choice [41,42,43], (4) implies regional migration, district economic growth, and sustainability [44]. Residents migrate across cities because of differences in the quality of life among them [45,46,47,48]. The difference in employment opportunities in space is mostly due to gaps in quality of life [49,50,51] and differences in competitiveness among cities [52]. Similarly, population migration within a city is due to the fact that neighboring communities have different quality of life levels [45,46]. In order to understand the quality of life in different regions, indicators must be used to represent the level of well-being of the region, and even the temporal change trend of the level of well-being must be monitored to provide policy recommendations for public intervention. Once well-being changes, it must be analyzed why it improved or worsened. The analysis must include an assessment of the feasibility of public interventions that seek to improve. Cummins [53] believed that research on quality of life can be divided into two types: (1) objective research: analyze and report with secondary data including different spatial scales published by the government, usually combined with social index research (2) subjective research: use questionnaires to collect classified or personal primary data to analyze personal evaluation or behavioral responses to the quality of life. Marans and Stimson (2011) proposed the comparison of subjective and objective indicators of quality of life. The indicators are divided into three types: objective indicators, subjective indicators, and behavioral indicators.
Reports have presented evidence that geographic place is closely related to quality of life [54,55,56,57]. They established the system of objective and subjective indicators. The quality of life in the geographical space is the subjective feeling of each member and varies from person to person. Subjective feelings are different because they have different attributes, including past experience, and cognition and evaluation. Murans [40] constructed the satisfaction framework of neighborhood communities. For policymakers, the most effective way to improve life satisfaction is to determine the degree of satisfaction under objective conditions. Research agrees that satisfaction is the degree of well-being that represents the quality of life. Sun Yuzhen [58] used Taiwanese data to evaluate the quality of life of counties and cities by the Hedonic Price method and principal component analysis. The assessment of the former was divided into actual housing prices and implicit housing prices, the actual housing prices were the actual unit prices of housing in residential areas in each county and city. The implicit housing prices were the unit prices estimated by the Hedonic Price method. The latter used 12 variables to perform principal component analysis to extract three principal components and then convert the three principal components to obtain component scores and weights to calculate the quality of life of counties and cities. Liao Shurong [59] used five capital-oriented variables in eight townships in Taiwan to calculate the quality of life after calculating the weight and point value respectively. The five capitals are environment, society, economy, knowledge and culture capital. Environmental capital is divided into four criteria of rural safety, rural scenery, environmental quality, and leisure space; social capital is divided into six criteria of social organization, social reciprocal relationship, trust mechanism, interpersonal network relationship, common values, and social support; economic capital is divided into three criteria of work opportunities, industrial tourism benefits, and residents' income; intellectual capital is divided into four criteria of event organization, education and training, network system, and educational book equipment; cultural capital is divided into three criteria of historical culture, cultural participation, and unique cultural events. Khamis et al [60] used questionnaires to collect sample data from 248 college students, and used structural equation model to analyze factors that affect quality of life. The questionnaire was designed to ask respondents about their satisfaction with research, society, and equipment. The results showed that research and equipment significantly affected quality of life, while social items did not. Engel et al. [61] used 364 Canadian samples to analyze the relationship between personal unhealthiness and health-related quality of life, well-being ability, and social well-being with the path model. It was found that the personal unhealthiness with the highest degree of negative impacted on health-related quality of life.
Urban vulnerability is the possibility of a city being prone to disasters when it faces disasters or pressures. It is a negative description and can be the vulnerability of the city, population, infrastructure, and economy [62,63]. McDonald [64] believes that residential attributes and locations will widely affect the quality of life. Quality of life includes not only material level of well-being, but also factors such as health, safety, education, social connections, and the environment. There is a complex relationship between housing prices and quality of life. The high housing price means the high cost of providing the housing and the high quality of life for the families in its location. In addition to the housing price is the value of its own characteristics reflected in the market, the amenity and dis-amenity, the quality of public facilities and the tax burden paid to the local government will also affect the value of the housing. Tian et al. [65] used the Difference in Difference Model to analyze the impact of the COVID-19 epidemic on housing prices and found that the epidemic negatively impacted on housing prices. However, the more resilient cities are to the COVID-19 outbreak, the faster housing prices will recover. Barreca et al. [66] believed that urban vulnerability refers to the degree to which a city is exposed to disaster risk, and resilience refers to the ability of the city to return to its original state after a disaster occurs. In the case of Turin, the spatial regression model was used to analyze the impact on housing prices from vulnerability indicators, and the results showed that vulnerability would significantly negatively affect housing prices.
2.2. Current Quality of Life
Since Taoyuan was restructured and upgraded to the municipality directly under the central government policy in 2014, social welfare and public construction expenditures have been greatly increased compared with the level of Taipei City and New Taipei City. Moreover, price to income ratio makes it more livable than the two cities. It not only attracts the immigrants from surrounding areas, but also draws the working population of Taipei City and New Taipei City to move in and live. Steady population growth and multiple new industrial parks provide the city with a stable tax base and job opportunities, but the environmental amenities and liabilities brought about by economic development have become severe challenges for urban growth. Citizens must endure and bear the external costs brought about by various production activities1. Rivers and coastlines are polluted by heavy metal wastes. Illegal factories on agricultural land have even affected irrigation water sources. Taoyuan City has become the top three most polluted agricultural land in Taiwan. Besides, it suffers from congestion, noise, air pollution, and man-made disasters caused by the close development between industries and housing. Improve the quality of life is a top priority to be cornerstone of urban development.2
2.3. Sampling Design
This article adopts the stratified random sampling method to draw samples from thirteen districts of Taoyuan City. The period of questionnaire survey ranged from November 2020 to March 2021. Questionnaire was designed with Google forms and data was obtained through social media and on-site surveys. A total of 1215 observations were drawn according to the 2020 districted proportion of population. The significance level is 5% (), and the sampling error is 3%. The sample size required at least observations (n is the sample size; Table 1). Table 1 shows the distribution of the observations of the thirteen administrative districts. Chi-square statistics that used to test null hypothesis The sampling proportion of each district is the same as the population proportion of each district in 2020 shows to fall in the acceptance area (p>0.05). The decision to accept null hypothesis that these two distributions are consistent shows that the analyzed sample is representative.
2.4. Questionnaire Design
The main purpose of questionnaire design is to collect three patterns of data. The first is to collect objective data through the questions related to the residence, community, and neighborhood that the respondents answer. The second is to collect the satisfaction of the respondents with various public facilities and services. The last is to collect respondent's personal attribute information.
2.5. Method
Based on the MIMIC Model proposed by [18], the structural equation model of quality of life is established. It contains two econometric models: structure equation and measurement equation. The structure equation is as follows.
where is a latent variable representing quality of life, and is an observed variable vector of k individual attributes. is the estimated coefficient vector of k explanatory variables, and ε is the error term. The measurement equation is as follows.
where is a vector of observed variable, which is composed of m indicator variables, and is an estimated coefficient vector of quality of life , is the error term. Assume that all error terms are independent of each other and normal distributions with the mean equal to zero: ( is the standard deviation of ). In this article, maximum likelihood method is used to estimate the parameters in equation (1) and (2). With estimated coefficient of equation (1), the spatial lag regression equation of quality of life can be established as follows.
where , , and are parameters, W is matrix of space weight distance, is matrix of quality of life, and v and are matrix of error terms. Spatial weights play an important role in the spatial regression model, which differs from the ordinary least squares method. The spatial weight W is used to indicate spatial spillover effects, which include (1) the spillover effect of quality of life , and (2) the spillover effect of the error term of autoregression. There are two ways to calculate W. (1) The spillover effect is only distributed in adjacent districts, that is, "Contiguity" in Stata, (2) The spillover effect is proportional to the reciprocal of the spatial distance between districts.
3. Results
This article refers to the variables used in the relevant literature under the condition of the information provided from government for the framework of database and modelling to formulate quantifying quality of life [16,62,63,64,65,66,67]. There are twenty-four observed variables and one latent variable in this model. (Figure 1).
Figure 1 illustrates framework of MIMIC model including thirteen observed independent variables and eleven observed dependent variables. Quality of life that is a latent variable is determined by objective factors as well as determines the levels of subjective indicators.
The variables in the model were drawn from the questionnaire survey (Table 2). A total of 1215 respondents from 13 districts were drawn at the end of 2020 as an analysis sample. The questionnaire collected the respondents' subjective evaluation of various services in the community and the objective indicators of individuals and houses. In order to construct the MIMIC model of quality of life, these observed variables and latent variable are used to establish a system of simultaneous equations to indicate the cause- effect path of quality of life. Table 2 shows the descriptive statistics of research variables for the micro model.
4. Discussion
4.1. MIMIC Model Estimation
4.1.1. Structural and Measurement Model
Structural equation model is the most used technique to analyze the causality among variables. In this article, 1215 samples of residents in 13 administrative districts of Taoyuan City are drawn according to stratified random sampling by means of questionnaire survey. 608 observations in this sample are used to the estimation of the model, and the remaining 607 observations are used to predict the score of quality of life. Quality of life with the characteristics of multi-indicator and multi-cause is suitable to be investigated by MIMIC Model. Figure 2 illustrates quality of life is a latent dependent variable in the structural model and a latent independent variable in the measurement model. In this model, there are 13 observed independent variables that affects the quality of life that can be measured by 11 observed dependent indicators.
4.1.2. Goodness of Fit
The results of structural model that describes factors affecting quality of life is shown in Table 3. Table 3 shows that the log likelihood index under the maximum likelihood estimation method is -83139.637, and the relative statistics are as follows, 、、、SRMR=0.064、RMSEA=0.041、CD=0.595、CFI=0.952、TLI=0.937. It is proofed not to reject「: The fitted model is as good as the saturated model」 of likelihood-ratio test (<). All other statistics meet the conditions of , SRMR close to 0, RMSEA<0.05, CD, CFI, TLI close to 1, which means that the goodness of fit is good3.
The results are shown as follows. “Community size” is positively correlated with community relationship which is positively correlated with quality of life. It can be found that “community size” is positively correlated with quality of life. “Flooding distance” is negatively correlated with life risk which is negatively correlated with quality of life. It can be inferred that the relationship between “flooding distance” and quality of life is positively correlated. "Bus stop distance" is negatively correlated with accessibility which is positively correlated with quality of life. It is found a negatively correlation between “bus stop distance” and quality of life. “Neighborhood distance” is negatively correlated with leisure accessibility which is positively correlated with quality of life. It can be inferred that “neighborhood distance” is negatively correlated with quality of life. “Wholesale distance” is positively correlated with shopping accessibility which is positively correlated with quality of life. It is found that “wholesale distance” is negatively correlated with quality of life. “Hospital distance” is negatively correlated with accessibility to medical care which is positively correlated with quality of life. It is inferred that “hospital distance” is negatively correlated with quality of life. “Railway distance” is negatively correlated with noisy external costs which are negatively correlated with quality of life. It can be found that “railway distance” is positively correlated with quality of life. “Gathering and meals” is positively correlated with social network which is positively correlated with quality of life. It is inferred that “gathering and meals” is positively correlated with quality of life. “Earnings” is positively correlated with consumption availability which is positively correlated with quality of life. It can be inferred that “earnings” is positively correlated with quality of life. “Bedrooms” is negatively corelated with crowdedness which is negatively corelated with quality of life. It can be found that “bedrooms” is positively correlated with quality of life. "Floor area" is negatively correlated with space crowding which is negatively correlated with quality of life. It is inferred that “floor area” is positively correlated with quality of life. “Leisure hours” is positively correlated with life pleasure which is positively correlated with quality of life. It can be inferred that “leisure hours" is positively correlated with quality of life. "Freely hours" is positively correlated with available time for use which is positively correlated with quality of life. It can be inferred that “freely hours” is positively correlated with quality of life. It concludes that estimated model is consistent with the influence on quality of life from these independent variables in the reports of literatures.
The measurement model is to investigate the relationship between quality of life indicators with latent variable (Table 4). Table 4 shows that the coefficients of all independent variables are significantly different from zero at significant level of 10%, and they are all greater than zero, which is consistent with the results reported in the literature. The LR test results accept : the model is consistent with the saturated model, indicating that the model fits well. The impact of independent variables on quality of life is organized as follows. Respondents’ satisfaction with community public services is positively correlated with quality of life, including subjective evaluations of “waste disposal”, “environmental maintain”, “traffic order”, and “community landscape”. Respondents’ satisfaction with community care system is positively correlated with quality of life, including “children care” and “elderly care”. Respondents' subjective evaluation of disaster prevention and control in the community is positively correlated with quality of life, including “fire prevention”, “air quality”, “drinking water”, “drainage facilities”, and “environmental noise”. It concludes personal subjective evaluation positively correlates with quality of life.
The remaining 607 observations are drawn to the estimated results of the structural model to predict the quality of life (Figure 3 and Table 5). Figure 3 illustrates that the darker the district is, the higher score in quality of life will be. By using ArcGis cluster analysis, quality of life distribution is divided into five clusters. The first cluster is the combination with the best quality of life including only Longtan District. The next highest quality of life cluster includes Guanyin and Daxi Districts. The median cluster in quality of life embodies Yangmei, Pingzhen, Zhongli, Bade, and Fuxing Districts subsequently. The second poorest quality of life cluster includes Taoyuan, Guishan, Luzhu, and Xinwu Districts. The poorest cluster in quality of life contains only Dayuan District. Overall, the quality of life in South Taoyuan is better than that in North Taoyuan. Table 5 shows the descriptive statistics of quality of life for the thirteen districts. The district with the highest quality of life is Longtan District, followed by Daxi District and Guanyin District. The lowest district in quality of life is Dayuan District followed by Luzhu District and Xinwu District. Taoyuan District and Zhongli District are the core areas of Taoyuan City, and the quality of life are at the moderate level, ranking 9 and 4 respectively. The 13 observed exogenous variables include residential, community, and neighborhood environmental factors, all of which contain spatial implications. A large number of residents in the community implies that the living conditions are superior to those of others and the community environment is better, which highlights the advantages of the location and the better quality of life. It reflects the corresponding locational characteristics of the adjacent area, which will further affect the quality of life in adjacent area (Figure 4). Figure 4 illustrates that the hot areas with better quality of life are distributed in Longtan, Daxi, and Pingzhen Districts, while the cold areas are distributed in Luzhu District4.
4.2. Spatial Regression Model
The spatial effects of quality of life can be analyzed through the Spatial Regression Model (Table 6). Table 6 shows that is 0.67, which represents that the goodness of fit of the model is high. The quality of life in adjacent districts will significantly positively affect the quality of life with a tendency to concentrate in space.
5. Conclusions
The goal of urban development is to improve the quality of life, but each decision-maker of cities has a different interpretation of the quality of life. Therefore, the improvement of the quality of urban life varies from person to person, let alone whether the urban development achieves the set goals. A city that is pursuing abstract ideals builds its future success on an unstable foundation, which is a very dangerous bet. The multiple indicators multiple causes model does not try to define the quality of life, nor does it have to identify the meaning of the quality of life. Cooperate with the influencing factors and alternative indicators to blur the quality of life. In this way, the results of the model estimation can clearly grasp the causal path of the quality of life. Looking back at the existing data can quantify the quality of life for comparison and ranking.
Further suggestions are as follows. Improve the accessibility of the city as well as provide training for the unemployed to return to work. Build disaster prevention strategies and even resilient design and planning structures. Establish a good social network system to catch everyone who needs assistance as well as do a good job in community management systems to connect every resident. Formulate appropriate housing policies to improve the quality of living as well as enable everyone to live in a private and uncrowded space. Maintain communication and interaction between everyone. Quality of life can then be improved under the guarantee of policies.
Funding
This research was funded by National Science and Technology Council, NSTC 112-2221-E-130 -003 -MY3, and the APC was funded by National Science and Technology Council.
Institutional Review Board Statement
Not applicable for studies not involving humans or animals.
Informed Consent Statement
Not applicable for studies not involving humans.
Data Availability Statement
Please turn to the CRediT taxonomy for the term explanation.
Conflicts of Interest
The authors declare no conflict of interest.
References
- Hicks, Norman, and Paul Streeten. 1979. “Indicators of Development: The Search for a Basic Needs Yardstick.” World Development 7(6): 567-80. [CrossRef]
- Hicks, Norman. 1979. “Growth vs. Basic Needs: Is There a Trade-off?” World Development 7(11-12): 985-94.
- Drenowski, Jan. 1974. On Measuring and Planning the Quality of Life. The Hague: Mouton.
- Morris, David. 1979. Measuring the Conditions of the World Poor, the Physical Quality of Life Index. New York: Pergaman Press.
- Sen, Amartya K. 1973. “On the Development of Basic Economic Indicators to Supplement GNP Measures.” UN Economic Bulletin for Asia and the Far East 24 (2-3): 1-11.
- Streeten, Paul. 1994. “Human Development: Means and Ends.” The American Economic Review 84(2): 232-37.
- Dasgupta, Partha, and Martin Weale. 1992. “On Measuring the Quality of Life.” World Development 20 (1): 119-31.
- Kakwani, N. Kakwani, N. 1993. “Performance in Living Standards: An International Comparison.” Journal of Development Economics 41(2): 307-36. [CrossRef]
- Ram, Rati. 1982. “Composite Indices of Physical Quality of Life, Basic Needs Fulfillment, Income: A Principal Component Representation.” Journal of Development Economics 11(2): 227-47.
- Slottje, Daniel. 1991. “Measuring the Quality of Life across Countries.” Review of Economics and Statistics 73(4): 684-93. [CrossRef]
- Fayers, Peter M., and David J. Hand. 2002. “Causal Variables, Indicator Variables and Measurement Scales: An Example from Quality of Life.” Journal of the Royal Statistical Society Series A 165(2): 233-53. [CrossRef]
- Atanasova, Irena and Karashtranova Karashtranova. 2016. “A Novel Approach for Quality of Life Evaluation: Rule-Based Expert System.” Social Indicators Research 128(2): 709-22.
- Uysal, Muzaffer, Joseph M. Sirgy, Eunju Woo, and Hyelin Kim. 2016. “Quality of Life (QoL) and Well-Being Research in Tourism.” Tourism Management 53(C): 244-61. [CrossRef]
- Bini, Matilde, Maurizio Carpita, Donato Posa, and Pasquale Sarnacchiaro. 2019. “Socio-Economic Indicators for Performance Evaluation and Quality Assessment: Statistical Methods and Applications.” Social Indicators Research 146(1-2): 1-5. [CrossRef]
- Vachon,Maxime, Marie Papineau, Gilles Dupuis, and Pasquale Roberge. 2019. “Associations Between Systemic Quality of Life and Burnout Among French Canadian Workers.” Social Indicators Research 142(3): 1193-210. [CrossRef]
- Marans, Robert Warren. 2015. “Quality of Urban Life & Environmental Sustainability Studies: Future Linkage Opportunities.” Habitat International 45(1, January): 47-52. [CrossRef]
- Goldberger, Authur S. 1972. “Maximin-Likelihood Estimation of Regressions Containing Unobservable Independent Variables.” International Economic Review 13(1): 1-15.
- Joreskog, Karl G., and Arthur S. Goldberger. 1975. “Estimation of a Model with a Multiple Indicators and Multiple Causes of a Single Latent Variable.” Journal of the American Statistical Association 70(351a): 631-39.
- Robinson, Peter Michael, and M. C. Ferrara. 1977. Estimation of Model for An Unobservable Variable with Endogenous Causes, In: Aigner, D. J. (Ed.), Latent Variables in Socioeconomic Models. Amsterdam: North-Holland, 131-42.
- Rosen, S. 1974. “Hedonic Prices and Implicit Markets: Product Differentiation in Pure Competition.” Journal of Political Economy 82: 34-55. [CrossRef]
- Rahman, Tauhidur J., Ron C. Mittelhammer, and Philip Wandschneider. 2004. “A Latent Variable MIMIC Approach to Inferring the Quality of Life.” Paper Presented for Presentation at the American Agricultural Economics Association 1-4 August 2004, Denver, Colorado.
- Rahman, Tauhidur J., Ron C. Mittelhammer, and Philip Wandschneider. 2005. “Measuring the Quality of Life across Countries.” Paper Presented at the UNU-WIDER conference on Inequality, Poverty and Human Well-being 30-31 May 2003, Helsinki, Finland.
- Rahman, Tauhidur J., Ron C. Mittelhammer, and Philip Wandschneider. 2011. “Measuring Quality of Life across Countries: A Multiple Indicators and Multiple Causes Approach.” The Journal of Socio- Economics 40(1): 43-52. [CrossRef]
- Marans, Robert Warren, and Byoung- Suk Kweon. 2011. “The Quality of Life in Metro Detroit at the Beginning of the Millennium.” In Marans, Robert W. (Eds), Investigating Quality of Urban Life: Theory, Methods and Empirical Research. New York: Springer, Dordrecht.
- McCrea, Rod, Robert Stimson, and Robert Warren Marans. 2011. “The Evolution of Integrative Approaches to the Analysis of Quality of Urban Life.” In Marans, Robert W. (Eds), Investigating Quality of Urban Life: Theory, Methods and Empirical Research. New York: Springer, Dordrecht.
- Bartholomew, David J. 1998. “Scaling Unobservable Constructs in Social Science.” Journal of the Royal Statistical Society Series C Applied Statistics 47(1): 1-13. [CrossRef]
- Jose Paul E., and Bee Teng Lim. 2014. “Social Connectedness Predicts Lower Loneliness and Depressive Symptoms over Time in Adolescents.” Open Journal of Depression 3(4):154-63. [CrossRef]
- Tiran, Jernej. 2016. “Measuring Urban Quality of Life: Case Study of Ljubljana.” Acta Geographica Slovenica 56(1): 57-73. [CrossRef]
- Kachanoff, Frank, Yochanan Bigman, Kyra Kapsaskis, and Kurt Gray. 2020. “Measuring Realistic and Symbolic Threats of COVID-19 and Their Unique Impacts on Wellbeing and Adherence to Public Health Behaviors.” Social Psychological and Personality Science 1-99. [CrossRef]
- Folk, Dunigan, Karynna Okabe-Miyamoto, Elizabeth Dunn, and Sonja Lyubomirsky. 2020. “Did Social Connection Decline during the First Wave of COVID-19?: The Role of Extraversion.” Collabra: Psychology 6(1):37. [CrossRef]
- Lardone, Anna, Pierpaolo Sorrentino, Francesco Giancamilli, Tammosa Palombi, Trevor Simper, Laura Mandolesi, Fabio Lucidi1, Andrea Chirico, and Federica Galli1. 2020. “Psychosocial Variables and Quality of Life during the COVID-19 Lockdown: A Correlational Study on a Convenience Sample of Young Italians.” Peer J 8: e10611. [CrossRef]
- Cupples, Laura M. 2021. “Measure Development and the Hermeneutic Task.” Synthese 198: 2375-90. [CrossRef]
- Mulligan, Gordon, John Carruthers, and Meagan Cahill. 2004. Urban Quality of Life and Public Policy: A Survey. In Capello, R., and P. Nijkamp (Eds.), Advances in Urban Economics (pp. 729-802). Amsterdam: Elsevier Science B.
- Dissart, Jean-Christophe, and Steven C. Deller. 2000. “Quality of Life in the Planning Literature.” Journal of Planning Literature 15(1): 135-61. [CrossRef]
- , and Eunkook Suh. 1997. “Measuring Quality of Life: Economic, Social and Subjective Indicators.” Social Indicators Research 40(1-2):189-216. [CrossRef]
- Diener, Ed., and Robert Biswas-Diener. 2008. Happiness: Unlocking the Mysteries of Psychological Wealth. Malden: Blackwell Publishing.
- Lambiri, Dionysia, Bianca Biagi, and Vicente Royuela. 2007. “Quality of Life in the Economic and Urban Economic Literature.” Social Indicators Research 84(1): 1-25. [CrossRef]
- Dahmann, Donald C. 1985. “Assessments of Neighborhood Quality in Metropolitan America.” Urban Affairs Quarterly 20(4): 511-35. [CrossRef]
- Lu, Max. 1999. “Determinants of Residential Satisfaction: Ordered Logit vs. Regression Models.” Growth and Change 30(2): 264-87. [CrossRef]
- Marans, Robert Warren. 2003. “Understanding Environmental Quality through Quality of Life Studies: The 2001 DAS and Its Use of Subjective and Objective Indicators.” Landscape and Urban Planning 65(1): 73-83. [CrossRef]
- Campbell, Angus, Philip E. Converse, and Willard L. Rodgers. 1976. The Quality of American Life: Perceptions, Evaluations and Satisfactions. New York: Russell Sage Foundation.
- Golledge, Reginald G., and Robert J. Stimson. 1987. Analytical Behavioural Geography. London: Croom Helm.
- Zehner, Robert. 1977. Indicators of Quality of Life in New Communities. Cambridge: Ballinger Publishing Company.
- Kemp, Derek, M. Manicaros, P. Mullins, R. Simpson, R. Stimson, and J. Western. 1997. Urban Metabolism: A Framework for Evaluating the Viability, Livability and Sustainability of South East Queensland. Brisbane: The Australian Housing and Urban Research Institute.
- Keeble, David. 1990. “Small Firms, New Firms, and Uneven Regional Development in the United Kingdom.” Area 22(3): 234-45.
- Ley, David. 1996. The New Middle Class and the Remaking of the Central City. Oxford: Oxford University Press.
- Glaeser, Ed., Jed Kolko, and Albert Saiz. 2000. Consumer City (Working Paper 7790). Cambridge: National Bureau of Economic Research.
- Liaw, Kao Lee, William H. Frey, and Ji Ping Lin. 2002. “Location of Adult Children as an Attraction for Black and White Elderly Primary Migrants in the United States.” Environment and Planning A 34(2): 191-216. [CrossRef]
- Brotchie, John, Peter Newton, Peter Hall, and Peter Nijkamp. 1985. The Future of Urban Form. London: Coom Helm.
- Grayson, L., and K. Young. 1994. Quality of Life in Cities. London: British Library.
- Rogerson, Robert J. 1999. “Quality of Life and City Competitiveness.” Urban Studies 36(5-6): 969-85. [CrossRef]
- Sirgy, Joseph M., and Terri Cornwell. 2002. “How Neighboorhood Features Affect Quality of Life.” Social Indicators Research 59(1): 79-114. [CrossRef]
- Cummins, Robert A. 1996. “The Domain of Life Satisfaction: An Attempt to Order Chaos.” Social Indicators Research 38(3): 303-332. [CrossRef]
- Marans, Robert Warren, and W. Rodgers. 1975. Towards an Understanding of Community Satisfaction. In Hawley, A., and V. Rock (Eds.). Metropolitan America in Contemporary Perspective (pp. 299-352). New York: Halsted Press.
- Lee, Trevor, and Robert Warren Marans. 1980. “Objective and Subjective Indicators: Effects of Scale Discordance and Interrelationships.” Social Indicators Research 8(1): 47-64. [CrossRef]
- Connerly, Charles, and Robert Warren Marans. 1985. “Comparing Two Global Measures of Perceived Neighborhood Quality.” Social Indicators Research 17(1): 29-47. 2: Social Indicators Research 17(1). [CrossRef]
- Connerly, Charles, and Robert W. Marans. 1988. Neighborhood Quality: A Description and Analysis of Indicators, In Huttman, E., and W. van Vleit (Eds.). The US Handbook on Housing and Built Environment (pp. 37-61). Westwood: Greenwood Press.
- Sun, Yu-Chen. 2016. “The Analysis on Quality of Life of Cities/Counties in Taiwan.” Master thesis, Graduate Institute of Urban Planning, National Taipei University, New Taipei City, Taiwan.
- Liau, Shu-Jong. 2014. “Quality of Life Capital and Rural Development: A Comprehensive Study of Selected Countryside in Taiwan.” Journal of Taiwan Land Research 46: 70-7. [CrossRef]
- Khamis, Azme, and Nursu’aidah Binti Abd. Wahab. 2016. “Modeling Quality of Life of University Students Using Structural Equation Model.” Scientific Research Journal IV(IV): 17-24.
- Engel, Lidia, Stirling Bryan, Vanessa K. Noonan, and David G. T. Whitehurst. 2018. “Using Path Analysis to Investigate the Relationships between Standardized Instruments that Measure Health-Related Quality of Life, Capability Wellbeing and Subjective Wellbeing: An Application in the Context of Spinal Cord Injury.” Social Science & Medicine 213: 154-64. [CrossRef]
- Fussel Hans-Martin. 2007. “Vulnerability: A Generally Applicable Conceptual Framework for Climate Change Research.” Global Environmental Change 17(2):155-67. [CrossRef]
- Lankao, Patricia Romero, and Hua Qin. 2011. “Conceptualizing Urban Vulnerability to Global Climate and Environmental Change.” Current Opinion in Environmental Sustainability 3: 142-49. [CrossRef]
- McDonald, John F. 2012. “House Prices and Quality of Life: An Economic Analysis.” International Encyclopedia of Housing and Home 258-64.
- Tian, Chuanhao, Xintian Peng, and Xiang Zhang. 2021. “COVID-19 Pandemic, Urban Resilience and Real Estate Prices: The Experience of Cities in the Yangtze River Delta in China.” Land 10: 960. [CrossRef]
- Barreca, Alice, Rocco Curto, and Diana Rolando. 2018. “Housing Vulnerability and Property Prices: Spatial Analyses in the Turin Real Estate Market.” Sustainability 10: 3068. [CrossRef]
- Marans, Robert Warren, and Robert Stimson. 2011. Investigating Quality of Urban Life: Theory, Methods and Empirical Research. New York: Springer, Dordrecht.
| 1 | The negative externalities caused by production activities include Jili chemical pollution, Gaoyin chemical pollution, RCA pollution, Ximeipi pollution, CNPC oil refinery, Kwun Tong natural gas receiving station. |
| 2 | Please refer to “Taoyuan City,2021,Taoyuan City Land Plan”. |
| 3 | This article uses Stata 16 to operate MIMIC Model. The relevant indicators provided by this model are as follows. Standardized Root Mean Squared Residual (SRMR); Root Mean Squared Error of Approximation(RMSEA); Coefficient of Determination(CD); Comparative Fit Index(CFI); Tucker-Lewis Index(TLI). |
| 4 | Local Moran’s I Statistics is the calculation method of global spatial autocorrelation statistics by applying Moran’s I to obtain regional autocorrelation statistics. Set the spatial autocorrelation statistics of the region as the X coordinate, and the spatial autocorrelation statistics of the adjacent regions as the Y coordinate. This coordinate system is divided into four quadrants. The first quadrant represents that the distribution of statistical variables in the region and adjacent regions has a central tendency, which is a hot zone. The third quadrant represents that the distribution of statistical variables between the region and the adjacent regions has a tendency to disperse, which is a cold region. The second and the fourth quadrants indicate that the regions or adjacent regions have opposite distribution trends of the statistical variable, one of which is concentrated while the other adjacent region is dispersed, or vice versa. |
Figure 1.
MIMIC Model with a latent variable of quality of life.
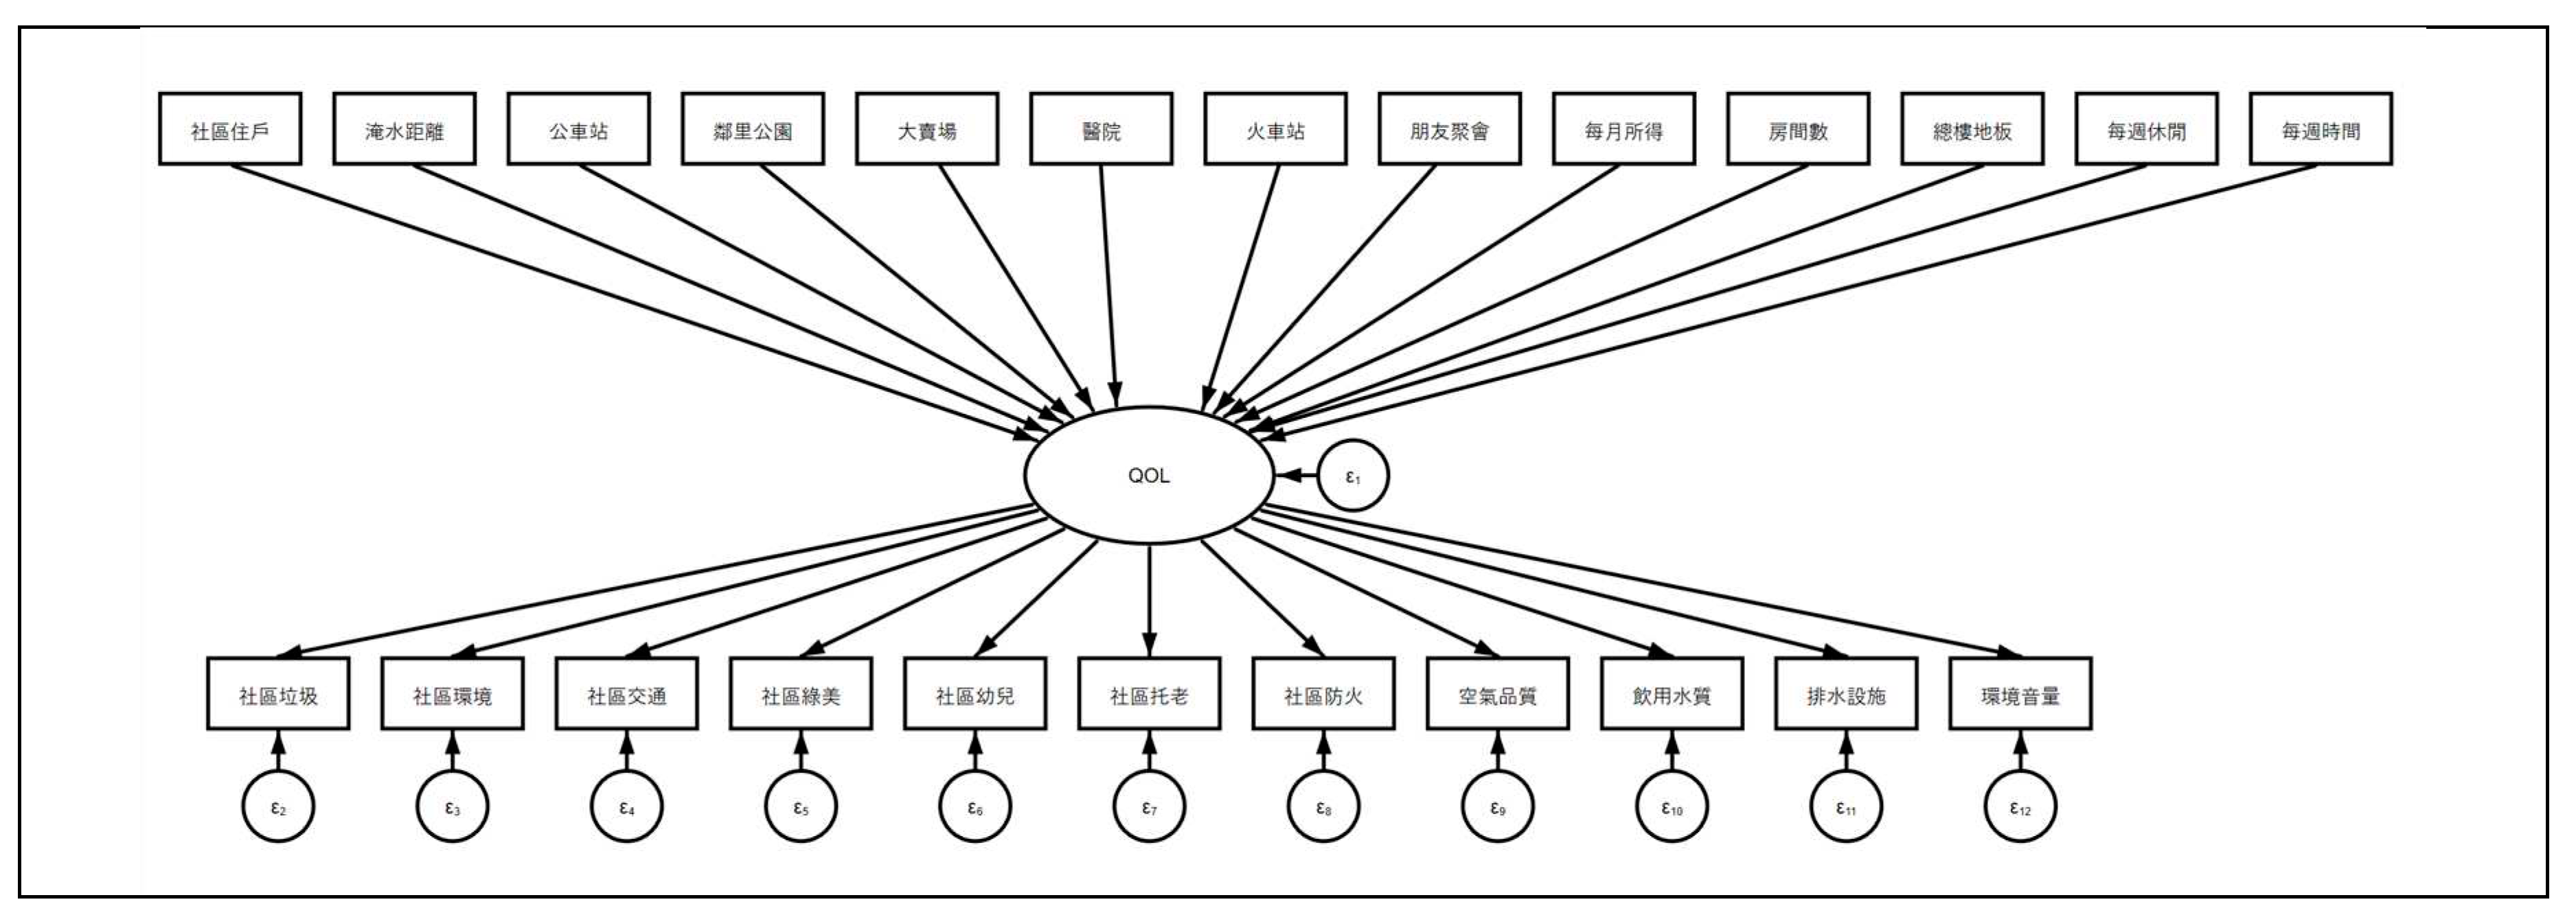
Figure 2.
Estimation on MIMIC Model of quality of life for Taoyuan City.
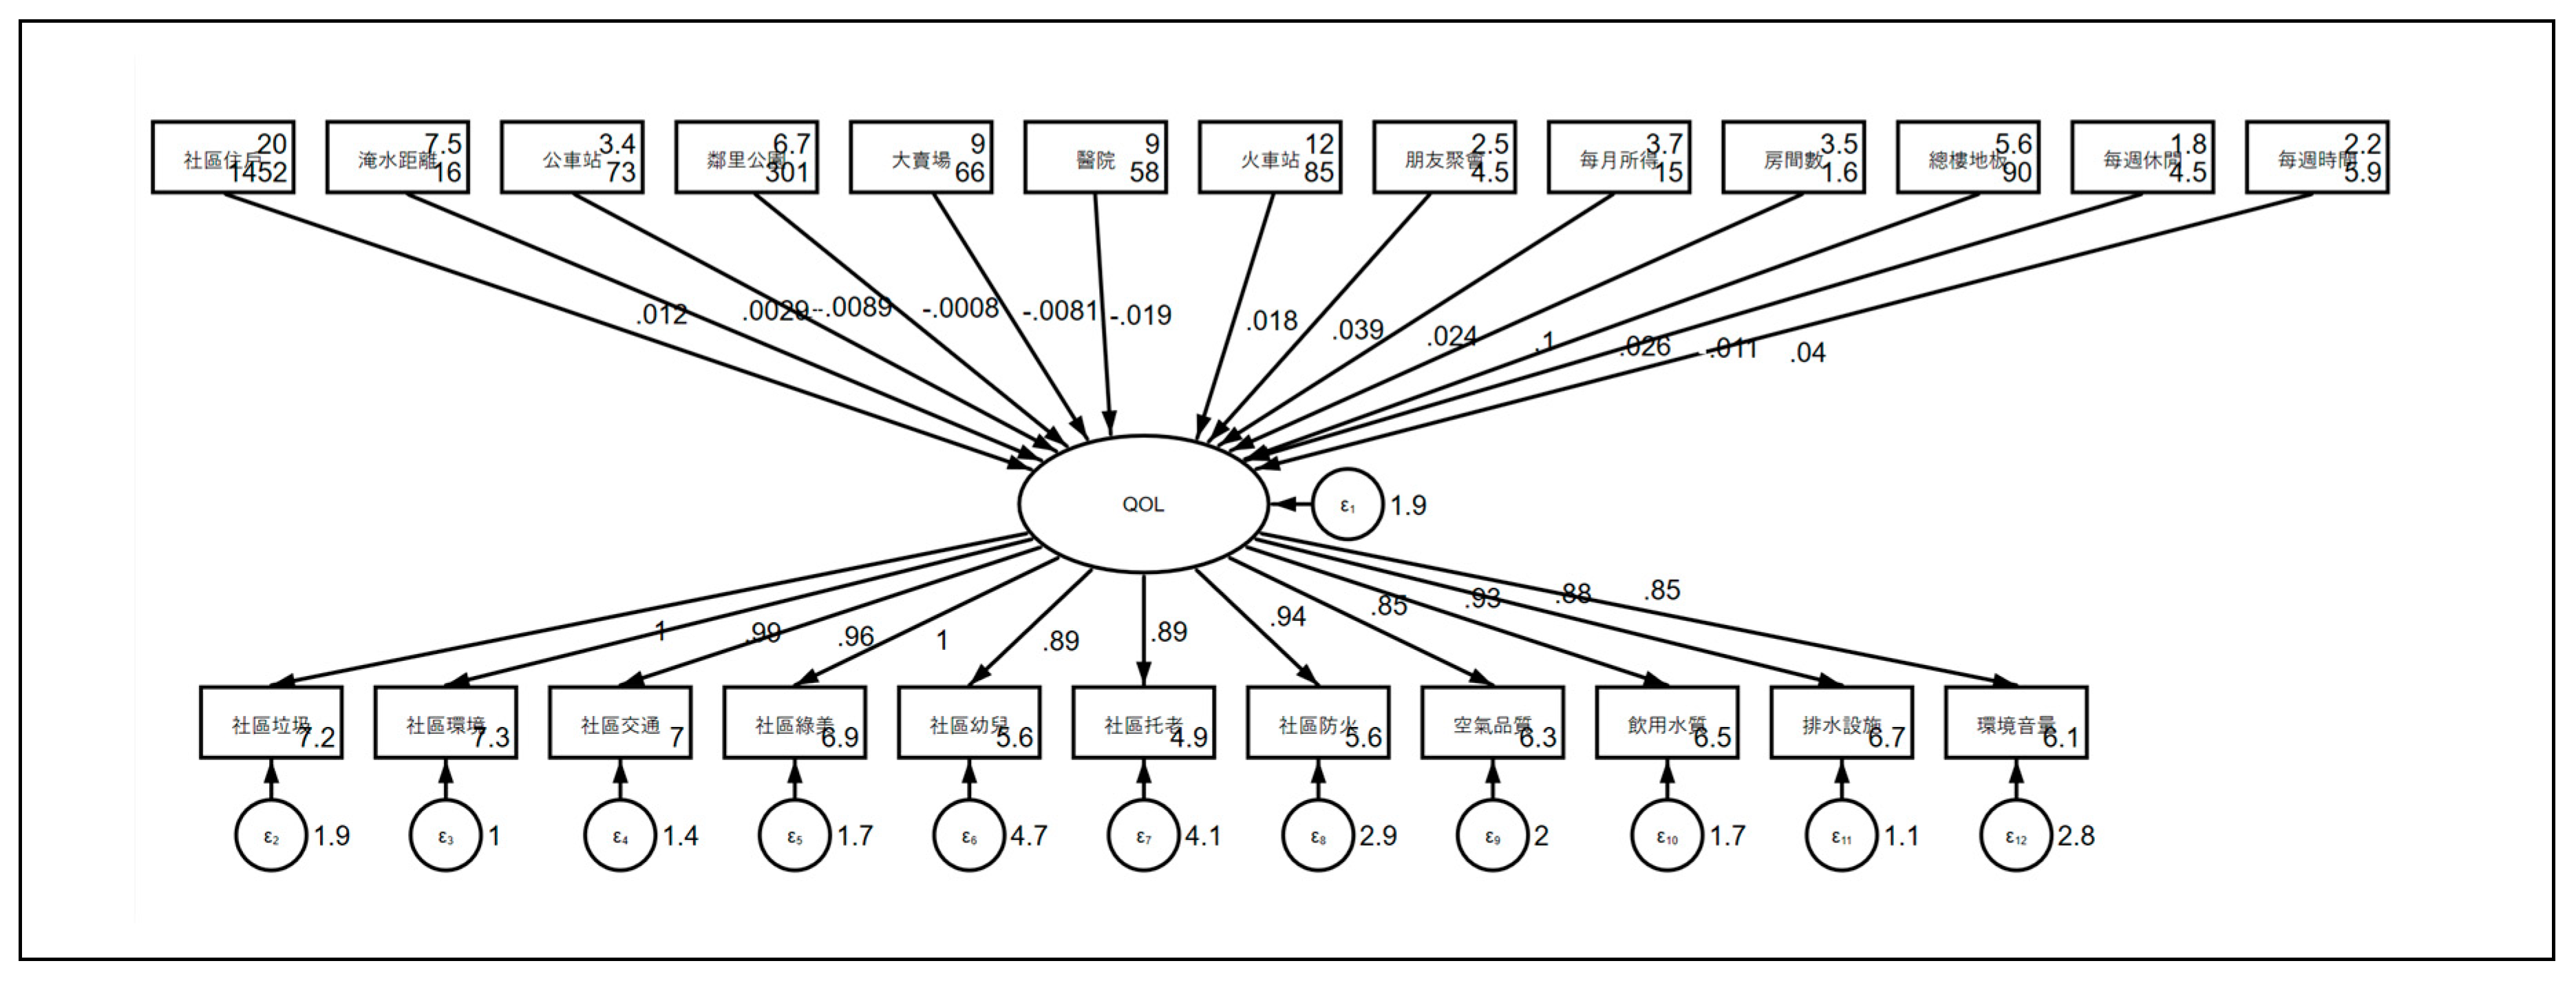
Figure 3.
Quality of life scores forecasted distribution in MIMIC Model for Taoyuan City.
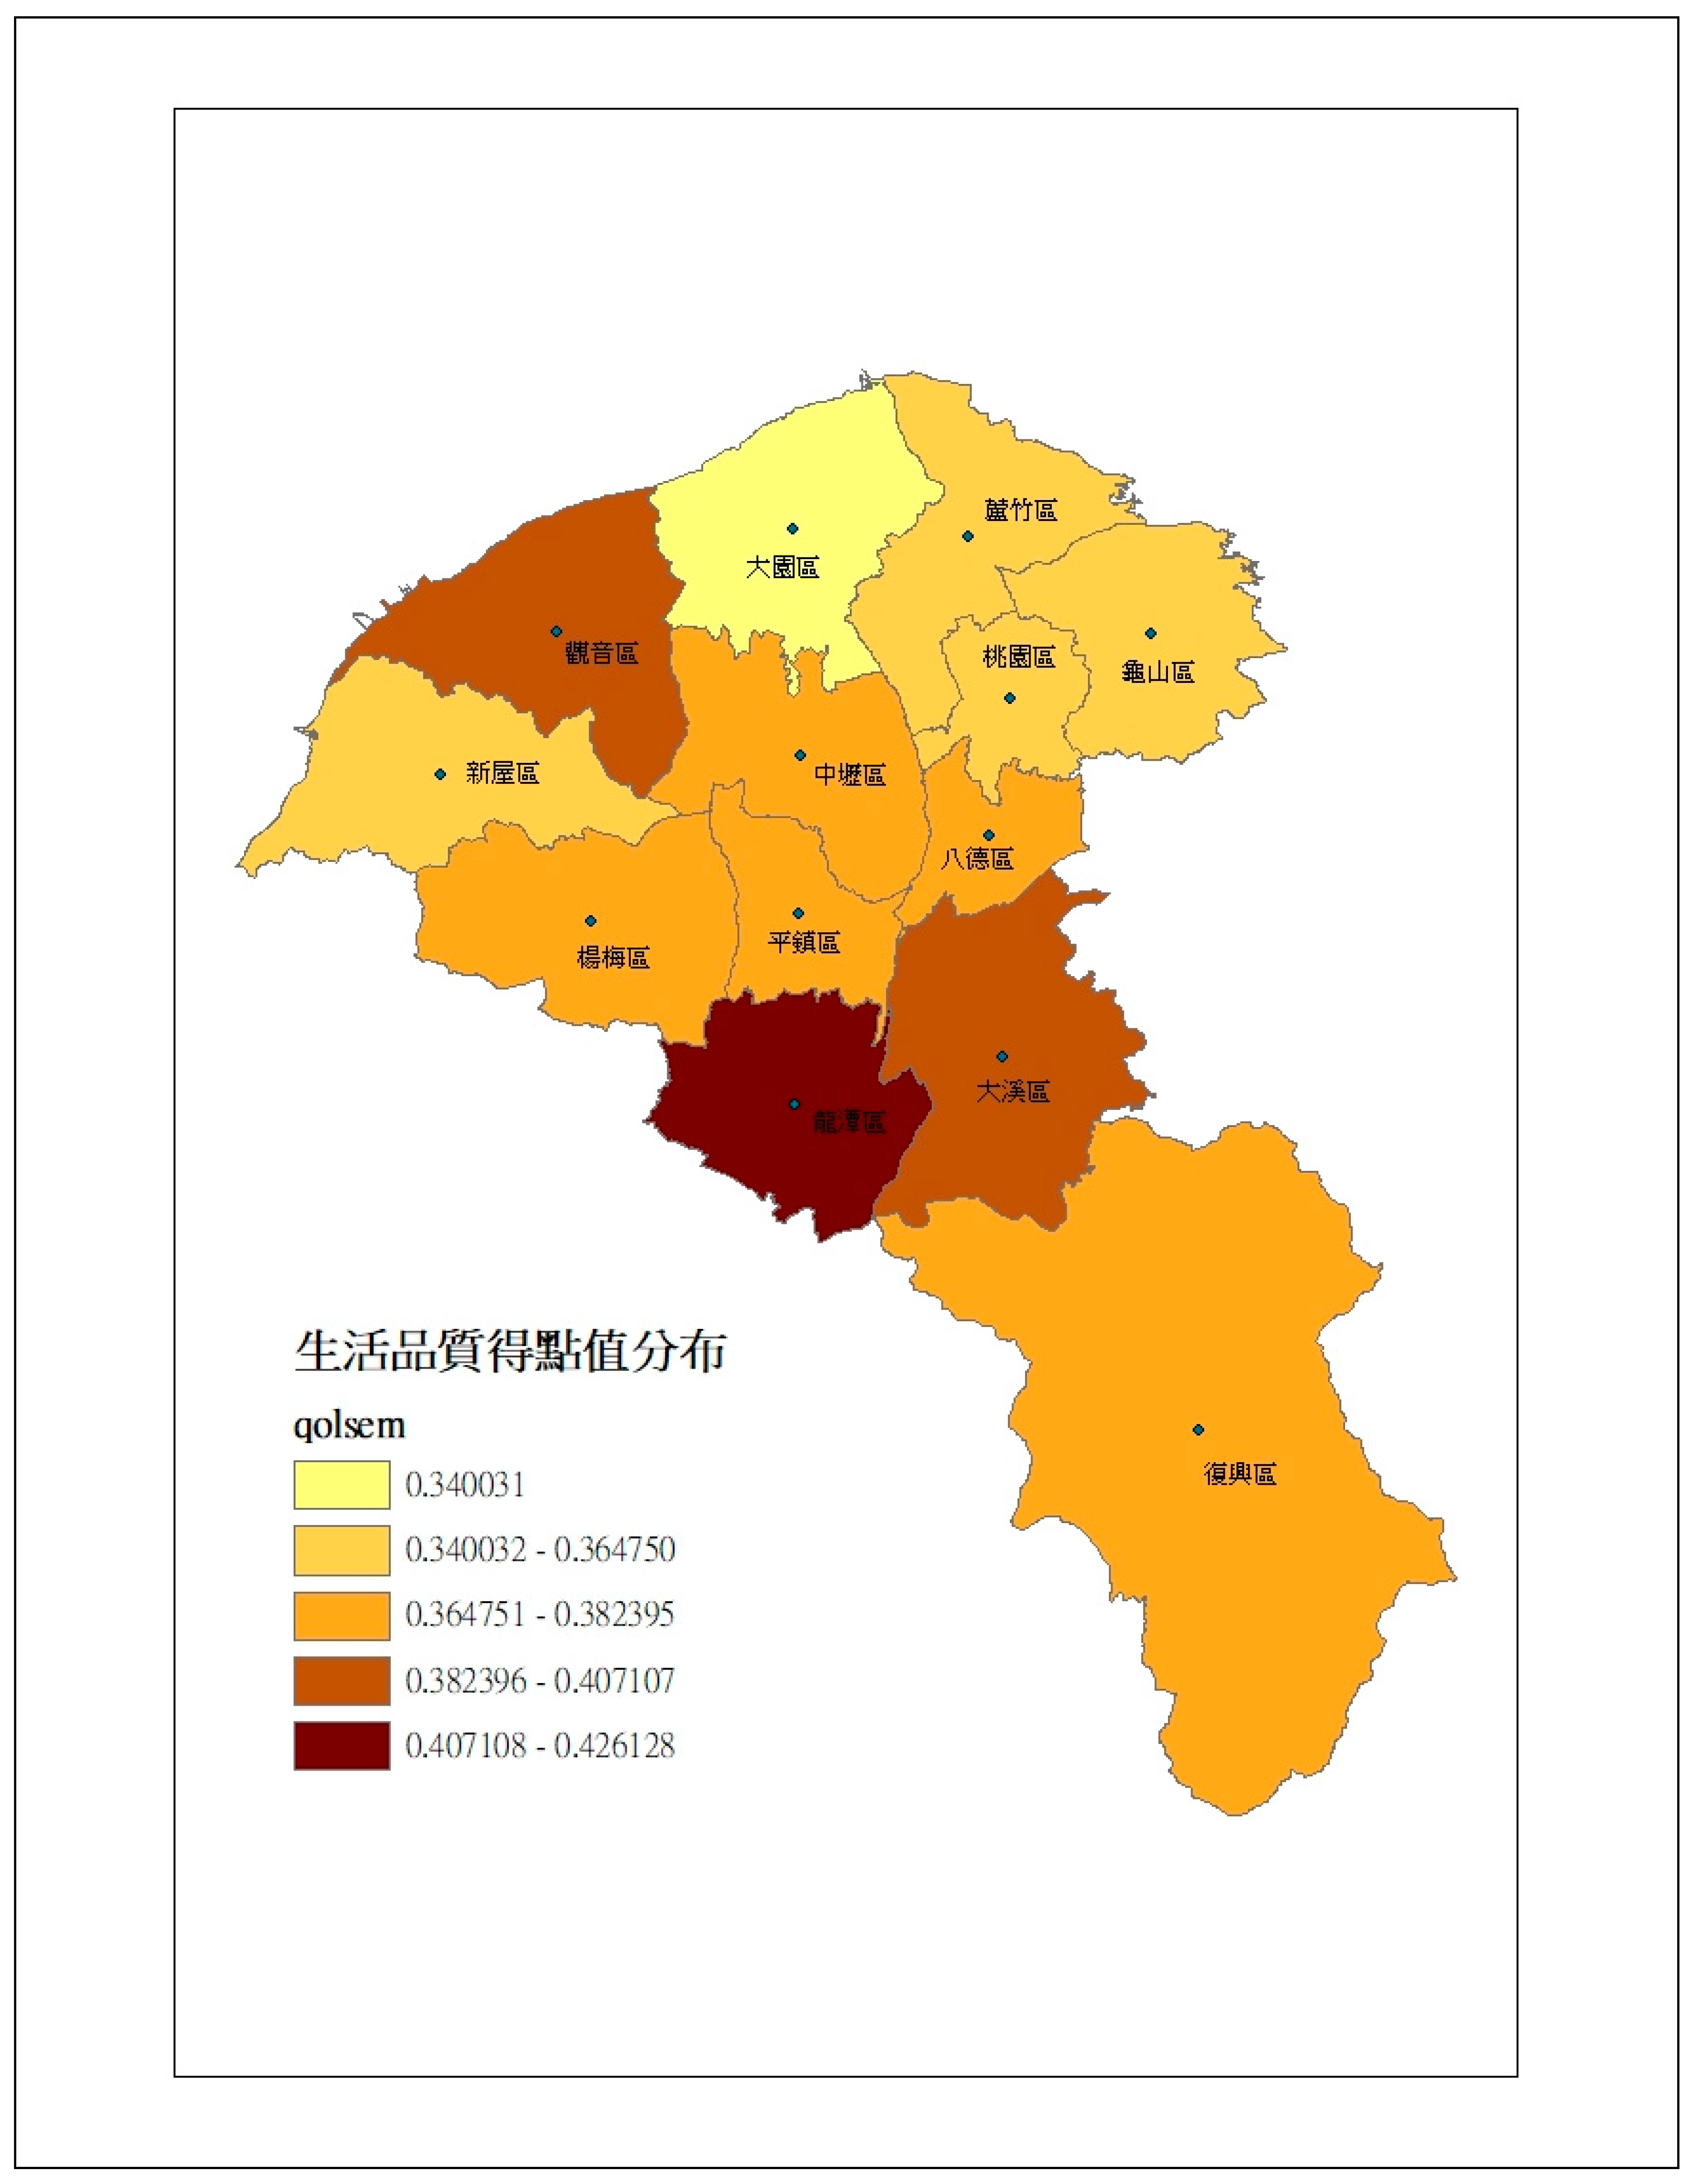
Figure 4.
LISA clusters of quality of life for Taoyuan City.
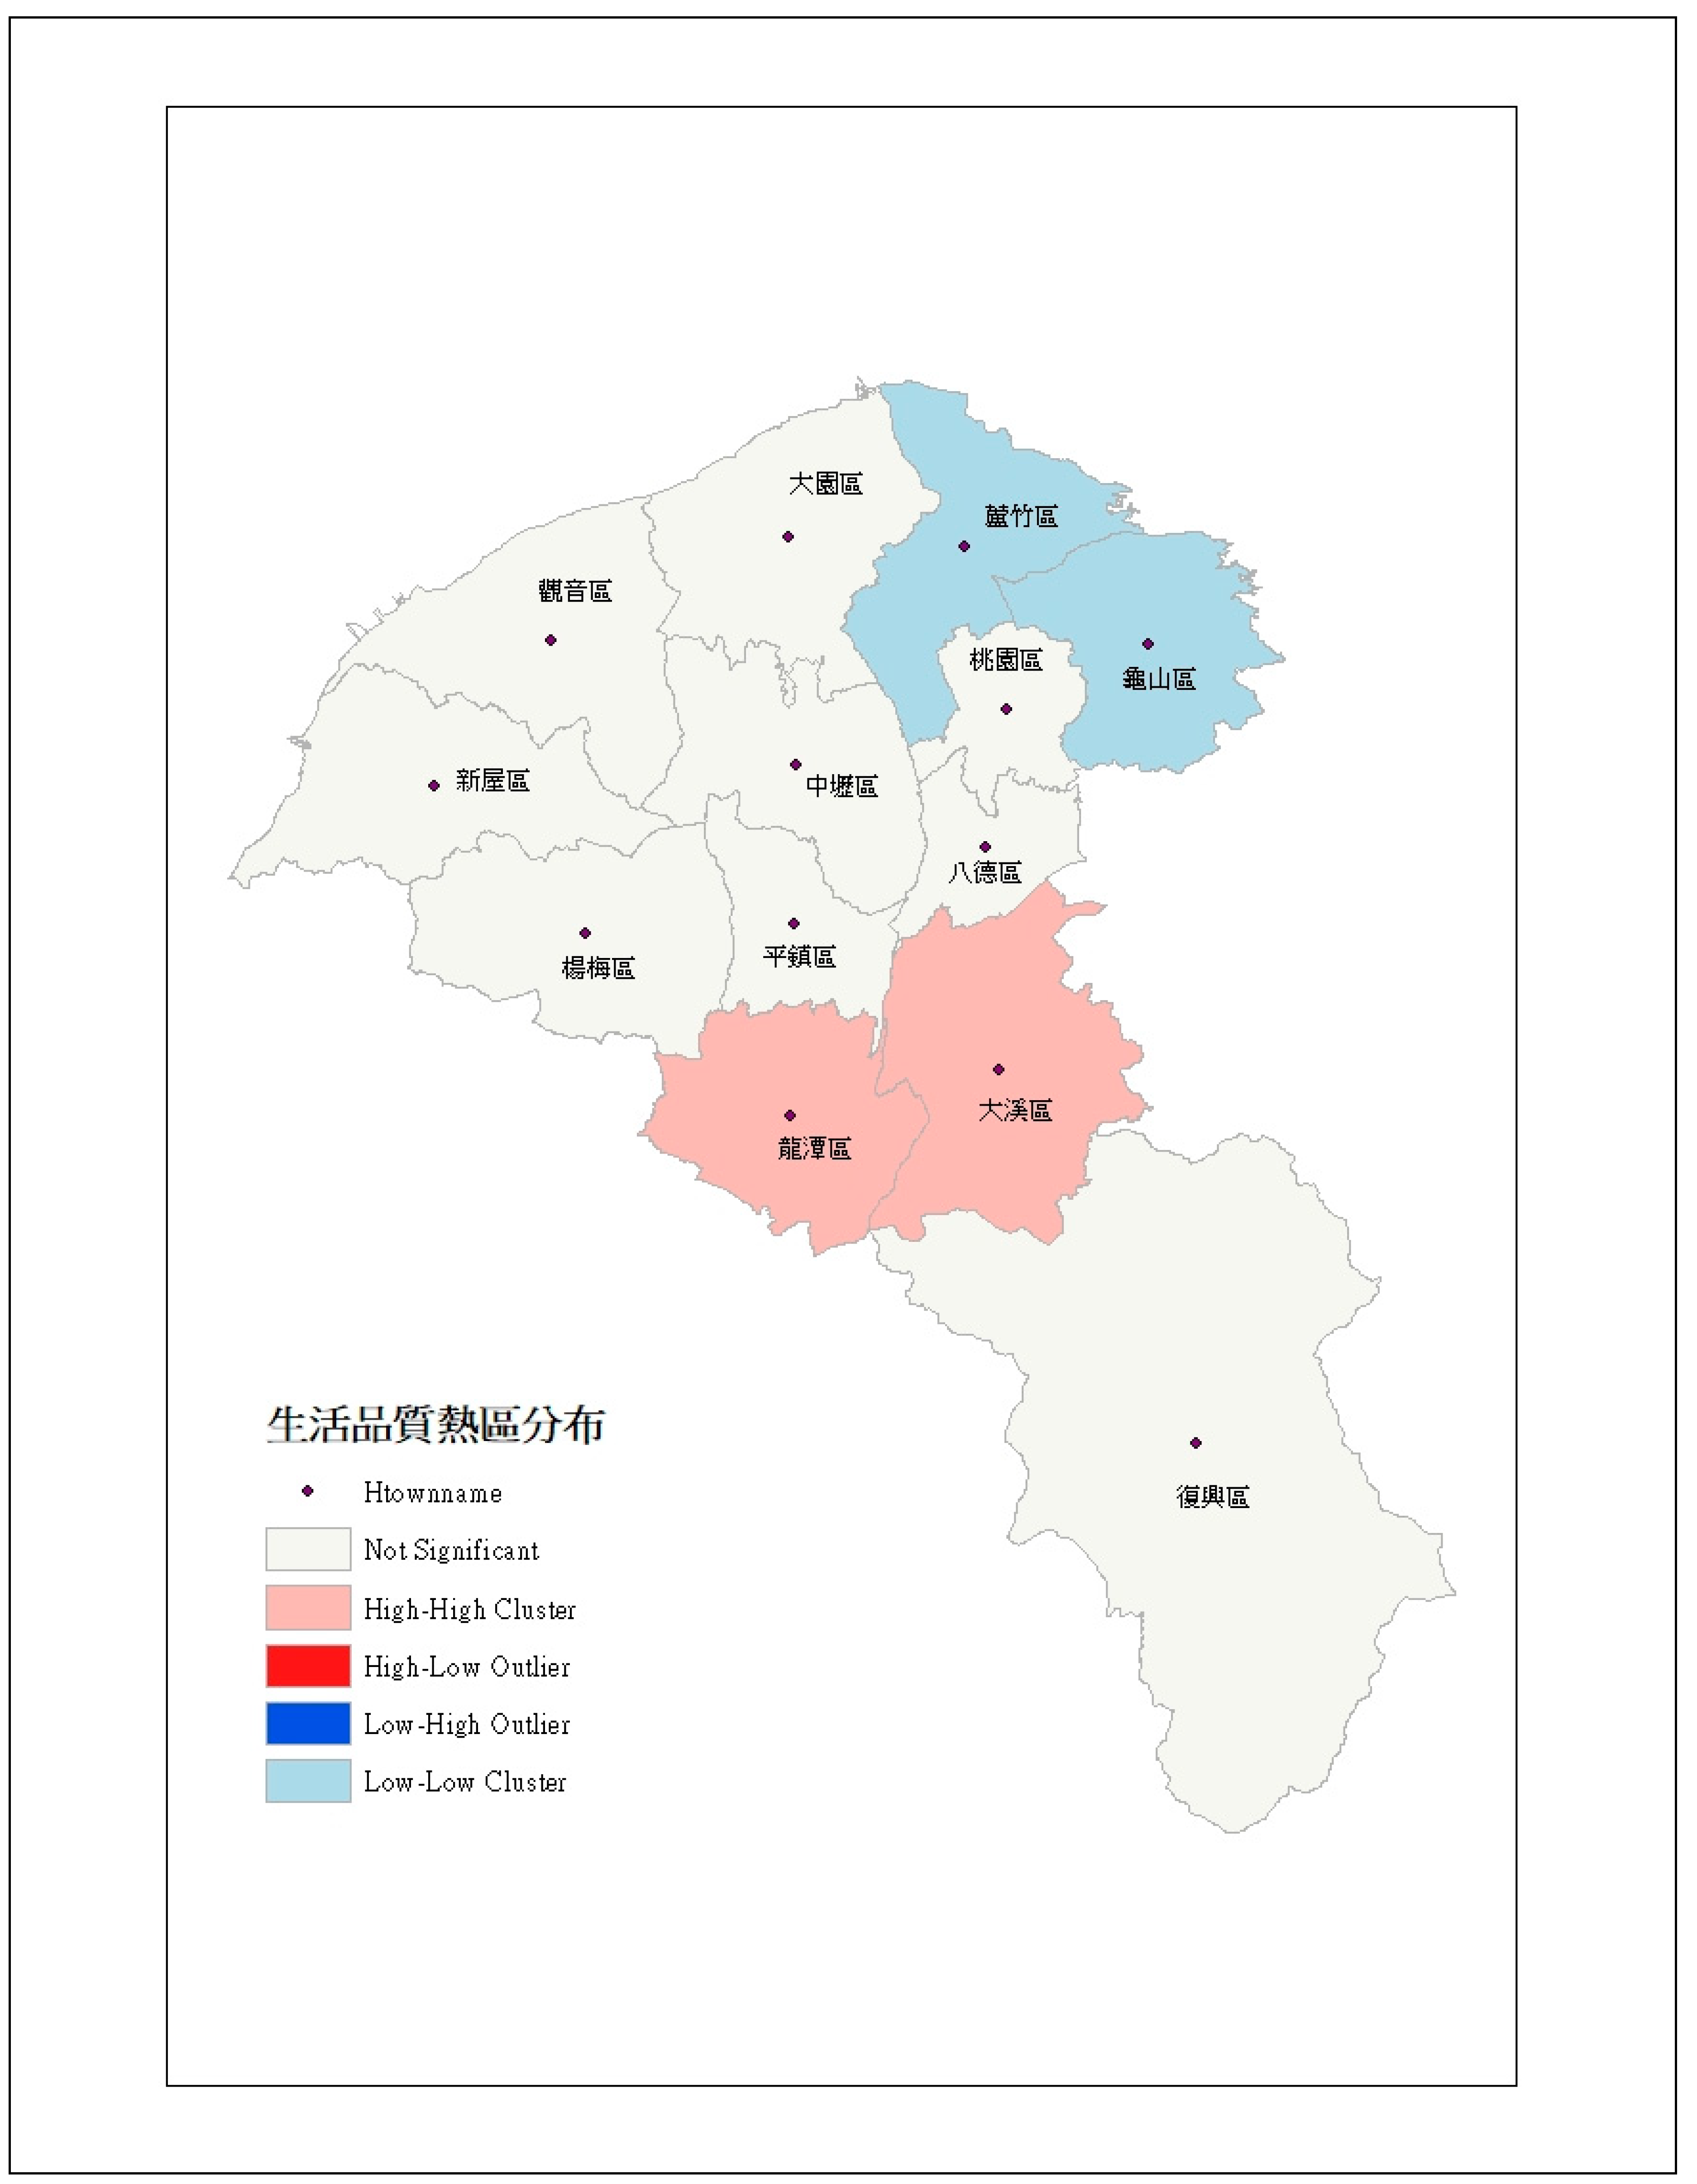

Table 1.
Sampling design of questionnaire survey on urban quality of life in Taoyuan City.
| District | Population | Sample | ||
| total population | % | total observations | % | |
| Taoyuan | 434243 | 20.22 | 271 | 22.30 |
| Jungli | 396453 | 18.46 | 248 | 20.41 |
| Daxi | 94102 | 4.38 | 60 | 4.94 |
| Yangmei | 163959 | 7.63 | 78 | 6.42 |
| Luzhu | 158802 | 7.39 | 72 | 5.93 |
| Dayuan | 87158 | 4.06 | 56 | 4.61 |
| Guishan | 152817 | 7.12 | 72 | 5.93 |
| Bade | 192922 | 8.98 | 120 | 9.88 |
| Longtan | 120201 | 5.60 | 60 | 4.94 |
| Pingzhen | 221587 | 10.32 | 118 | 9.71 |
| Xinwu | 48772 | 2.27 | 24 | 1.98 |
| Guanyin | 65555 | 3.05 | 30 | 2.47 |
| Fuxing | 11192 | 0.52 | 6 | 0.49 |
| total | 2147763 | 100.00 | 1215 | 100.00 |
| p=0.08 | ||||
Table 2.
Descriptive statistics of variables of MIMIC Model in Taoyuan City.
| Variable | Definition | Measurement Units | Mean | Standard Deviation | Minimum | Maximum |
| household | number of persons in a household | persons/household | 4.0099 | 1.5741 | 1 | 9 |
| roof age | house roof age | year | 20.6626 | 12.6267 | 0 | 66 |
| children | number of persons under 7 years of age in a household | person | 0.2214 | 0. 5793 | 0 | 4 |
| elderly | number of persons over 65 years of age in a household | person | 0.4527 | 0.7164 | 0 | 2 |
| community size | number of households in the community | household | 204.4543 | 81.2031 | 0 | 230 |
| waste disposal | satisfaction with completion of the waste disposal of the community (ranged from 1 to 10) | - | 7.5045 | 2.0484 | 1 | 10 |
| environment maintain | satisfaction with clean and well-maintained environment (ranged from 1 to 10) | - | 7.5794 | 1.7933 | 1 | 10 |
| traffic order | satisfaction with the traffic order of the community (ranged from 1 to 10) | - | 7.2551 | 1.8544 | 1 | 10 |
| community landscape | satisfaction with completion of the landscaping in the community (ranged from 1 to 10) | - | 7.1687 | 2.0303 | 1 | 10 |
| children care | satisfaction with completion of care for children in community (ranged from 1 to 10). | - | 5.8691 | 2.5507 | 1 | 10 |
| elderly care | satisfaction with completion of community care for the elderly (ranged from 1 to 10). | - | 5.1391 | 2.4254 | 1 | 10 |
| fire prevention | satisfaction with completion of community fire prevention (ranged from 1 to 10). | - | 5.8255 | 2.2163 | 1 | 10 |
| flooding distance | distance from nearby flooding place | meter | 6470.1 | 466324.7 | 1 | 10000 |
| bus stop distance | distance from the nearest bus stop | meter | 3423.687 | 8564.754 | 1 | 12000 |
| neighborhood park distance | distance from neighborhood park around the community | meter | 667.9735 | 1734.612 | 1.8 | 3000 |
| wholesale distance | distance from the nearest wholesale center | kilometer | 3.7717 | 3.1406 | 0.5 | 5 |
| hospital distance | distance from the nearest hospital | kilometer | 0.2017 | 2.3885 | 0.05 | 40 |
| railway distance | distance from railway station | kilometer | 7.8666 | 7.1159 | 1 | 50 |
| gathering and meals | number of monthly gatherings and meals with friends and relatives | times | 2.5457 | 2.1318 | 0 | 9 |
| earnings | monthly labor earnings | NT$ | 37291.07 | 38794.47 | 15000 | 85000 |
| bedrooms | number of bedrooms | room | 3.5177 | 1.2782 | 1 | 9 |
| floor area | floor area of the dwelling | ping | 56.0488 | 94.9527 | 2 | 900 |
| leisure hours | leisure hours per week | hour | 17.6576 | 21.2102 | 0 | 168 |
| freely hours | number of hours that are available for use freely per week | hour | 22.0959 | 24.3322 | 0 | 168 |
| air quality | satisfaction with completion of well-equipped for air quality (ranged from 1 to 10) | - | 6.5177 | 1.9054 | 1 | 10 |
| drinking water | satisfaction with completion of drinking water quality maintains (ranged from 1 to 10) | - | 6.7638 | 1.9066 | 2 | 10 |
| drainage facilities | satisfaction with completion of well-equipped drainage facilities (ranged from 1 to 10). | - | 6.9860 | 1.6933 | 2 | 10 |
| environmental noise | satisfaction with completion of environmental noises decreases (ranged from 1 to 10) | - | 6.3704 | 2.0972 | 1 | 10 |
| sex | 0 for male; 1 for female | - | 0.5465 | 0.4980 | 0 | 1 |
| age | individual’s age | year | 36.5103 | 14.4094 | 15 | 71 |
| education | maximum number of years of education | year | 15.9103 | 4.8298 | 1 | 21 |
Note: The data were collected from questionnaire survey and arranged by this study.
Table 3.
Estimation of Structural Model in MIMIC Model of quality of life for Taoyuan City.
| Structural model | Coefficient | Standard error |
| community size | 0.0118*** | 0.0012 |
| flooding distance | 0.0029* | 0.0015 |
| bus stop distance | -0.0089* | 0.0049 |
| neighborhood park distance | -0.0008** | 0.0004 |
| wholesale distance | -0.0081* | 0.0043 |
| hospital distance | -0.0185*** | 0.0070 |
| railway distance | 0.0185*** | 0.0056 |
| gathering and meals | 0.0388* | 0.0202 |
| earnings | 0.0243** | 0.0114 |
| bedrooms | 0.1004*** | 0.0335 |
| floor area | 0.0261*** | 0.0045 |
| leisure hours | 0.0108** | 0.0055 |
| freely hours | 0.0400* | 0.0205 |
| log likelihood | -83139.637 | |
| 249.36 | ||
| df | 218 | |
| 1.14 | ||
| SRMR | 0.044 | |
| RMSEA | 0.041 | |
| CD | 0.595 | |
| CFI | 0.952 | |
| TLI | 0.937 | |
a: It represents the latent variable of Quality of life. *** , ** *
Table 4.
Estimation of Measurement Model in MIMIC Model of quality of life for Taoyuan City.
| Measurement model | OIM | |
| coefficient | standard error | |
| waste disposal | ||
| QOL | 1 | |
| constant | 7.2313*** | 0.1948 |
| environment maintain | ||
| QOL | 0.9922*** | 0.0337 |
| constant | 7.3083*** | 0.1912 |
| traffic order | ||
| QOL | 0.9620*** | 0.0357 |
| constant | 6.9923*** | 0.1862 |
| community landscape | ||
| QOL | 1.0415*** | 0.0392 |
| constant | 6.8841*** | 0.2019 |
| children care | ||
| QOL | 0.8947*** | 0.0506 |
| constant | 5.6247*** | 0.1818 |
| elderly care | ||
| QOL | 0.8881*** | 0.0486 |
| constant | 4.8964*** | 0.1791 |
| fire prevention | ||
| QOL | 0.9380*** | 0.0439 |
| constant | 5.5692*** | 0.1855 |
| air quality | ||
| QOL | 0.8478*** | 0.0382 |
| constant | 6.2861*** | 0.1668 |
| drinking water | ||
| QOL | 0.9327*** | 0.0381 |
| constant | 6.5089*** | 0.1817 |
| drainage facilities | ||
| QOL | 0.8816*** | 0.0334 |
| constant | 6.7451*** | 0.1708 |
| environmental noise | ||
| QOL | 0.8518*** | 0.0416 |
| constant | 6.1376*** | 0.1694 |
| Var (e. QOL) | 1.9088 | |
| Var (e. waste disposal) | 1.9459 | |
| Var (e. environment maintain) | 1.0019 | |
| Var (e. traffic order) | 1.3573 | |
| Var (e. community landscape) | 1.6821 | |
| Var (e. children care) | 4.7022 | |
| Var (e. elderly care) | 4.1062 | |
| Var (e. fire prevention) | 2.9312 | |
| Var (e. air quality) | 2.0130 | |
| Var (e. drinking water) | 1.6779 | |
| Var (e. drainage facilities) | 1.1189 | |
| Var (e. environmental noise) | 2.7646 | |
| LR test of model vs. saturated: | ||
*** Indicate , ** Indicate * Indicate
Table 5.
Descriptive statistics of quality of life of MIMIC Model for Taoyuan City.
| Range | ||||
| District | Mean | Standard Deviation | Minimum | Maximum |
| Taoyuan | 0.2916 | 0.0335 | -0.5834 | 2.2817 |
| Daxi | 0.2640 | 0.0434 | -0.4334 | 0.9837 |
| Zhongli | 0.3212 | 0.0380 | -0.5193 | 2.1784 |
| Yangmei | 0.1881 | 0.0701 | -0.4925 | 2.7502 |
| Luzhu | 0.3145 | 0.0623 | -0.3760 | 1.8642 |
| Dayuan | 0.1681 | 0.0362 | -0.2752 | 0.5793 |
| Guishan | 0.2775 | 0.0838 | -0.4909 | 2.7476 |
| Bade | 0.1949 | 0.0491 | -0.7167 | 2.1784 |
| Longtan | 0.4474 | 0.0908 | -0.3399 | 2.0119 |
| Pingzhen | 0.2429 | 0.0636 | -0.4683 | 2.7476 |
| Xinwu | 0.5075 | 0.1496 | -0.0405 | 2.3023 |
| Guanyin | -0.0161 | 0.0598 | -0.3417 | 0.5362 |
| Fuxing | 0.0298 | 0.0292 | -0.0356 | 0.0952 |
Source: Arranged by this study.
Table 6.
Spatial Regression Model of quality of life for Taoyuan City.
| coefficient | Standard error | |
| constanta | 0.2071* | 0.0790 |
| W | ||
| QOL | 0.2070** | 0.0870 |
| e. QOLb | 0.7913*** | 0.2268 |
| Var (e. QOL)c | 0.0146 | 0.0062 |
| Log likelihood | 8.2356 | |
| Pseudo | 0.6716 |
Note: W stands for space weighted matrix, **** stands for , ** stands for , * stands for . a: The Stata16 software executor could draw constant terms to be added to the estimation formula, the difference between the two is whether it passes the origin or not. In this study, constant terms were selected for estimation. b: It is the error term of the spatial regression equation. c: The number of variants assigned to the error term of the spatial regression equation. d: Indicate the average of housing price of each district.
Disclaimer/Publisher’s Note: The statements, opinions and data contained in all publications are solely those of the individual author(s) and contributor(s) and not of MDPI and/or the editor(s). MDPI and/or the editor(s) disclaim responsibility for any injury to people or property resulting from any ideas, methods, instructions or products referred to in the content. |
© 2023 by the authors. Licensee MDPI, Basel, Switzerland. This article is an open access article distributed under the terms and conditions of the Creative Commons Attribution (CC BY) license (http://creativecommons.org/licenses/by/4.0/).
Copyright: This open access article is published under a Creative Commons CC BY 4.0 license, which permit the free download, distribution, and reuse, provided that the author and preprint are cited in any reuse.


