
Submitted:
09 September 2023
Posted:
15 September 2023
You are already at the latest version
Abstract
The flour milling industry, a vital component of global food production, is undergoing a transformative phase driven by the integration of smart devices and advanced technologies. This transition promises improved efficiency, quality, and sustainability in flour production. Accurate estimation of protein, moisture and ash content in wheat grains and flour is of paramount importance due to their direct impact on product quality and compliance with industry standards. This paper explores the application of Near-Infrared (NIR) spectroscopy as a non-destructive, efficient, and cost-effective method for measuring the aforementioned essential parameters in wheat and flour, by investigating the effectiveness of a low-cost handle NIR spectrometer. Furthermore, a novel approach using Fuzzy Cognitive Maps (FCMs) is proposed to estimate protein, moisture and ash content in grain seeds and flour, marking the first known application of FCMs in this context. Our study includes an experimental setup that assesses different types of wheat seeds and flour samples and evaluates three NIR pre-processing techniques to enhance parameter estimation accuracy. The results indicate that low-cost NIR equipment can contribute to the estimation of the under-study parameters.
Keywords:
Nondestructive Instrumentation
; Near-Infrared Spectrometry
; parameter estimation
; optimization algorithm
; Fuzzy-Cognitive-Maps
1. Introduction
The milling flour industry, a cornerstone of global food production, is currently navigating a transformative journey driven by the integration of smart devices and advanced technologies. While these innovations hold great promise for enhancing efficiency, quality and sustainability in flour production, they also bring forth a unique set of challenges. As mills increasingly adopt smart devices, ranging from Internet of Things (IoT) sensors and automated machinery to data analytics and Artificial Intelligence (AI)-driven systems, they must confront issues, such as cybersecurity threats, data management complexities, workforce upskilling and the need to strike a delicate balance between tradition and modernity. This convergence of age-old techniques and cutting-edge technology poses both exciting opportunities and formidable obstacles that require thoughtful consideration and strategic solutions.
In the flour milling industry, the accurate estimation of protein and moisture content in wheat grains and flour holds paramount importance [1]. Wheat is a fundamental staple crop that serves as the primary source of nutrition for a substantial portion of the global population. It is a versatile grain used in various food products ranging from bread and pasta to cereals and snacks. The quality of these end products is directly influenced by the protein and moisture content present in the wheat grains [2].
Protein content is a critical factor as it directly impacts the functional and nutritional properties of wheat-based products. Proteins, particularly gluten, play a pivotal role in determining the dough's elasticity and strength during baking processes. This directly affects the final product's texture, volume and overall quality. Furthermore, the protein content also influences the nutritional value of the products, as proteins are a primary source of amino acids, which are essential for human health. Moisture content, on the other hand, is a key indicator of wheat grain quality and storability. Proper moisture levels are crucial to prevent the growth of molds, bacteria and other microorganisms that can lead to spoilage and contamination. Additionally, moisture content affects the weight of the grains, which is a crucial factor in pricing and trading commodities. Incorrect moisture levels can lead to economic losses due to decreased product value, increased energy consumption during processing and potential storage issues [3].
Accurate estimation of protein and moisture content is not only important for maintaining product quality but also for complying with industry standards and regulations. Variability in these parameters can occur due to factors, such as different wheat varieties, growing conditions, harvesting methods and storage conditions. Therefore, modern wheat mill industries employ advanced techniques and technologies to precisely measure protein and moisture content. These may include Near-Infrared (NIR) spectroscopy, moisture meters and laboratory analyses.
NIR spectroscopy is a technology that uses the near-infrared region of the electromagnetic spectrum (780-2500 nm) to measure the chemical composition of materials [4]. It has been used for many years in the food industry, including the wheat milling industry, to estimate the protein and moisture content of wheat. NIR spectroscopy had become a reliable and accurate method for estimating the protein and moisture content of wheat and flour [5]. It is a non-destructive method. This makes it a valuable tool for the wheat milling industry, as it allows the protein and moisture content of wheat to be measured without affecting its quality, while at the same time, there is no need to destroy any sample. Furthermore, it is a fast and efficient method. A single sample can be measured in a matter of seconds, making it ideal for in-line measurements. This means that the protein and moisture content of wheat can be measured as it is being processed, which can help to improve the efficiency of the milling process.
However, the establishment of state-of-the-art NIR technologies in mill requires significant investment to be considered [6]. The initial cost of implementing NIR technologies is a concern for some mill operators; however, the market has responded with low-cost NIR solutions that make this advanced technology more accessible. Affordable and compact NIR devices, such as handheld and portable analyzers, have emerged as feasible solutions for smaller mills or those with budget constraints. These low-cost NIRs offer the advantage of quick measurements, reduced dependence on lab testing and ultimately contribute to optimize production processes and ensure consistent product quality [6,7].
In the context of utilizing NIR spectroscopy as a method for quantifying protein, moisture and ash levels in cereals, various computational models have been developed, with regression methods being the most prevalent choice in the literature. These regression models serve to calibrate systems capable of providing precise parameter estimates. Within this framework, diverse regression models have been explored to establish potential correlations between protein and moisture concentrations in cereals and flours and the percentage of electromagnetic radiation absorption at specific wavelengths. In essence, regression models facilitate the quantification of the relationship between two parameters [8]. Among the models applied are Single Linear Regression (SLR) [9], Least Squares Support Vector Machine Regression (LSSVR) [10], Partial Least Squares (PLS) [11] and Neural Networks (NN) [12]. Particularly noteworthy, the LSSVR model has demonstrated its effectiveness in calibrating and estimating protein levels in cereals and flours, exhibiting robustness and achieving a correlation coefficient exceeding 98% [13]. In the context of employing the LSSVR model to calibrate systems for protein concentration estimation in food products, it was observed that specific wavelengths in the near-infrared spectrum, namely 1178, 1382, 1498, 1670, 1768, 1888, 1970, 2064, 2146, 2278, 2302, 2444, and 2490 nm, were sensitive to this parameter [13].
In this study, we investigate the potential of a compact, portable NIR scanner for assessing protein, moisture and ash content in grain seeds and flour, by installing an experimental setup in a mill flour industry. To facilitate this examination, we propose a novel estimation model based on the application of FCMs. One of the key advantages of FCMs is their ability to capture and model complex, uncertain and interdependent relationships in various domains, making them valuable for decision support and systems analysis. To the best of our knowledge, this is the first effort of utilizing FCMs in such applications. We establish an experimental setup for evaluating various types of wheat seeds and flour. Three different NIR pre-processing techniques are examined in a set of wheat and flour samples, to investigate their effectiveness of the estimation of the required parameters. The findings suggest that the integration of a miniature NIR scanner, coupled with parameter estimation models, based on FCMS, employing computational intelligence techniques, offers a cost-effective and viable alternative to achieve accurate results.
The paper is structured as follows: The second section provides a concise overview of the NIR spectrometer employed in the experiments, delves into the theoretical underpinnings of equipment effectiveness investigation, and outlines the structure of the proposed estimation models, which are based on FCMs. In the third section, the experimental results are presented and discussed. Section 4 summarizes the key findings and contributions of this study. Finally, the Appendix A section contains additional investigation results, while Appendix B presents a set of NIR spectra, as measured from a set of indicative wheat samples.
2. Materials and Methods
2.1. Low-cost NIR Spectrometers
The NeoSpectra scanner, designed by Si-Ware, represents a significant advancement in the field of NIR spectroscopy technology. Its compact and portable design makes it a versatile tool for various industries, including agriculture, food processing, and pharmaceuticals. One of its standout features is its ability to provide rapid and accurate analysis of material composition in real-time, without the need for sample preparation or complex calibration processes. The scanner's user-friendly interface and wireless connectivity allow for easy integration into existing workflows, enhancing efficiency and quality control. While its affordability and accessibility have broadened the reach of NIR technology, its performance and reliability remain noteworthy, making the NeoSpectra scanner an asset for businesses aiming to streamline their analytical processes and ensure product consistency. NeoSpectra scanner enables Fourier-Transform Infrared (FT-IR) spectroscopy [14], which operates on the principle of molecular interaction with infrared (IR) light. In this technique, an IR light source emits a broad spectrum of IR radiation, which is directed through a sample. Molecules within the sample absorb specific frequencies of IR light, causing them to vibrate and undergo changes in their molecular energy states. The transmitted or reflected light is then collected and subjected to an interferometer, which modulates the IR beam. The resulting interferogram is transformed using the Fast Fourier Transform (FFT) algorithm, producing an IR spectrum that represents the intensity of absorbed IR light as a function of frequency. Therefore, in the present study, the specific equipment is investigated in a controllable environment. The experimental setup to capture the NIR spectrums of the under-study wheat and flour samples is presented in Figure 1.
2.2. Investigation on the Effectiveness of low-cost Spectrometer NeoSpectra Scanner
Estimation models play a pivotal role in data analysis and decision-making across various fields. These models are designed to predict or estimate unknown values based on available data and mathematical algorithms. They are invaluable tools in fields, such as in food industry, enabling us to make informed decisions and draw meaningful conclusions from data. Estimation models can range from simple linear regressions to complex machine learning algorithms, depending on the complexity of the problem at hand. Many estimation models in the literature are based on NIR spectrum analsyis. NIR spectroscopy involves measuring the interaction of NIR light with a sample, resulting in a spectrum that contains valuable information about the sample's chemical composition. Estimation models for NIR spectrums are tailored to extract specific parameters or properties from these spectra, such as moisture content, protein levels or chemical compositions. A typical NIR spectrum is a complex and rich source of information that arises from the interaction of NIR light with matter. Its complexity is a result of the multitude of molecular vibrations, rotations, and other interactions that occur within a sample when exposed to NIR radiation. However, only a part of the NIR spectrums includes usefull information about the parameters to be estimated. Therefore, the study initially conducts an investigation into the NIR wavelengths correlated with the parameters to be estimated. In this specific context, the research focuses on five parameters: (i) the protein content of wheat seeds, (ii) the moisture content of wheat seeds, (iii) the protein content of flour samples, (iv) the moisture content of flour samples, and (v) the ash content of flour samples. Figure 2 illustrates the assessment of the NIR spectral wavelengths' effectiveness in estimating these parameters. For each parameter an estimation model is desgined.
The process of Figure 2 is employed to identify specific wavelengths within the spectra obtained from the experimental procedure, including pre-processed spectra. This identification aims to pinpoint the wavelengths exhibiting the strongest correlations with the variables that the system under design seeks to estimate. Unlike many correlation models that rely on linear regression, our approach in this study assumes the existence of a polynomial relationship between the desired parameters and the pre-processed spectra. This assumed relationship is depicted in Figure 3.
where λ express the wavelength of the NIR spectrum, while a, b and c are coefficients of the second order polynomial and F(λ) defines the value of the parameter to be examined.
Regarding the investigation into the individual correlations of wavelengths, this research entails assessing their relationships both with the spectra obtained with the application of the aforementioned preprocessing techniques. The primary focus is on optimizing the correlation coefficient, which serves as the objective function. This optimization aims to align the model for estimating the desired parameter with data generated by the existing industrial equipment.
Hence, the optimization challenge at hand involves determining the coefficients (a, b, and c) depicted in Figure 2 to maximize the correlation coefficient (R). Following this rationale, it's anticipated that wavelengths devoid of any pertinent information about the desired parameter will yield a low maximum correlation coefficient, whereas wavelengths containing relevant information will exhibit a high degree of correlation. The correlation coefficient is formally defined by the following equation (Equation 1):
where x and y represent the two sets of the variables whose the degree of correlation between them is examined.
This study aims to identify the NIR wavelengths that are most significantly influenced by the values of the parameters under investigation. Utilizing the findings of this investigation, we will select the top five wavelengths with the highest correlation coefficients. These selected wavelengths will serve as the foundation for designing an estimation model based on the principles of FCMs theory.
2.3. NIR Spectrums pre-proccessing
One of the challenges of NIR spectroscopy is the sensitivity that presents to the environmental conditions. The existence of light noise affects the accuracy of the measurements significantly [15]. It arises from various sources, including electronic fluctuations, environmental factors and imperfections in the measurement setup. Noise can undermine the quality of NIR spectra, leading to inaccurate interpretations and reduced reliability of analytical results. Effective noise management is crucial for extracting meaningful information from the spectra. Different techniques have been employed in order to mitgate noise and enhance measurement clarity. In the present study three different pre-proccessing techniques are enabled: (i) the multiplicative scatter correction, (ii) the first derivatives and (iii) the Savitzky–Golay filters.
2.3.1. Multiplicative Scatter Correction
Drawing upon the established theoretical framework for the study of light behavior, when light undergoes diffusion after reflection, it induces scattering, which has a multiplicative effect on spectra. Consequently, these spectra become contingent on both scattering and the chemical composition of the reflective material. Given the substantial impact of scattering on spectral behavior, it becomes imperative to apply a method capable of disentangling its influence from the spectra [16]. As such, in line with the literature [17], the most prevalent technique for spectral correction is the Multiplicative Scatter Correction (MSC). In this method, each spectrum, within a dataset, is adjusted through rotation and shifting to align as closely as possible with the mean spectrum, a process facilitated by the least squares method. The MSC transformation is mathematically described by the following equation:
where represents the initial intensity value of NIR light reflection for sample i at wavelength k before the MSC transformation. After this transformation, represents the updated value. Here, signifies the estimated impact of specular reflection on the acquired spectrum, and (1/) denotes the estimated influence of scattering on the spectrum. It's important to note that these constants, and , are determined through the application of least squares regression. This statistical method correlates each spectrum with the mean spectrum derived from all the spectra considered in the transformation. Equation 2 stems from the spectrum model for sample i, which conforms to the Equation 3 for each wavelength k:
where , is the model error corresponding to the phenomena that distort the useful information of the spectrum and which cannot be modeled using any additional or multiplicative term. Figure 4 depicts the trnasformation of a NIR signal, by using the MSC.
2.3.2. First Derivatives
The first derivative indicates the slope of a curve at any given point of it. Its use in NIR signals is important, as it removes the baseline from the spectra. The use of first derivatives in a system for calculating chemometric parameters contributes decisively to the removal of unwanted effects in the background, as well as to the removal of noise, resulting in improved spectra under analysis [18,19]. A good approach for calculating derivatives in discrete signals is considered to be the calculation of the difference, between two consecutive points as to the distance they have. Therefore, the first derivatives, within the framework of their use in the system under design, are calculated from the following equation:
where x are the values of a given spectrum for the wavelengths n and n-1, and h is the distance between the two wavelengths. In Figure 5, an example of a spectrum is depicted, as well as the calculation of the first derivatives of it.
2.3.3. Smooth Filtering
Savitzky-Golay filters are a valuable tool in the realm of NIR spectroscopy preprocessing. These filters are used to smooth spectral data while preserving spectral features, making them especially useful for reducing noise and enhancing signal clarity. They work by fitting a polynomial to a small window of data points and then estimating the value at the center of the window. This process is applied iteratively across the entire spectral dataset. In NIR spectroscopy, where precise spectral information is crucial for accurate analysis, Savitzky-Golay filters can effectively reduce noise caused by random fluctuations and measurement artifacts. By employing these filters during preprocessing, researchers can enhance the quality of NIR spectra, leading to more accurate and reliable analytical results in applications, such as chemical analysis, material identification and quality control in various industries [20]. The basic equation of the Savitzky-Golay filter is presented in Equation 5:
where, is the m-th coefficient of the Savitzky-Golay filter, determined based on the degree of the polynomial and the size of the window, are the original data points within the window, with m varying between -s and s, and is the smoothed value at the wavelength k. Figure 6 illustrates an example of the application of the Savitzky-Golay filter to a typical NIR signal.
2.4. Fuzzy Cognitve Maps and Design of the Parameter Estimation Models
In the context of designing the model for estimating the desired parameters in grains and flours, the theory of FCMs has been enabled. This selection is underpinned by the intrinsic benefits offered by FCMs, including their abstract framework, inherent flexibility, and capacity to adapt to dynamic variations that might arise among interrelated parameters. FCMs, introduced by Kosko [21], present a structured approach to grappling with intricate management and control challenges within complex, nonlinear systems characterized by uncertainties [22]. The guiding principles of FCMs are rooted in symbolically depicting and elucidating the multifaceted phenomena governing such intricate systems, effectively representing logical interconnections between these phenomena [22]. Consequently, FCMs comprise nodes that encapsulate system characteristics and connections that delineate the magnitude and way one characteristic influence another, achieved through the utilization of weighted interactions. A representative configuration of a typical FCM is illustrated in Figure 7.
The weights in an FCM can be, (i) positive, if there is a positive correlation between two nodes (wij>0), (ii) negative, if there is a negative correlation between two nodes (wij<0), and (iii) zero, if there is no correlation between the nodes (wij=0). Therefore, the correlations between the different nodes, of a typical FCM can be described by the weight matrix, as presented in Equation 6:
Based on the weights that are defined between the nodes, the values of these can be calculated, according to the Equation 7:
where Ai is the value of node i, Aj is the value of the nodes that are correlated with node i, while the parameter k denotes the number of iterations that are performed, until the Ai converges to a value [23,24]. The activation function f defines the range of values in which the value of node i varies. According to the literature, the most common activation function is the sigmoid function, as defined in Equation 8:
Observing the structure and the operation of FCMs, it appears that they are suitable for the study of correlation between the desired parameters in grains and flours and the wavelengths, collected by the spectrometer, as they have been used in various complex problems with great success [25]. According to the structure of a typical FCM, the problem is reduced to find the appropriate weights, so that the proposed model can estimate the desired parameters with great accuracy. In this context, the research team uses the Particle Swarm Optimization (PSO) methodology. The structure of the FCM, which is applied for the estimation of the required parameters (protein, moisture and ash), is presented in Figure 8.
Based on the structure of the parameter estimation system, as presented in the above figure, the problem is reduced to find the weights of the FCM, so that it calculates the desired parameters, whether it is protein, moisture or ash, minimizing the mean square error. In this context, for a given set of spectra, for which the parameter values are known and based on the research that was done as to the contribution of the preprocessing methods to the accuracy of parameter estimation, the parameter estimation is reduced to a topic of optimization, in which the estimation system is called to calculate the desired parameters with the minimum error. Therefore, the Root Mean Square Error (RMSE) is defined as the objective function of the optimization problem (Equation 9).
3. Experimental setup and samples preparation
3.1. Samples preparation
The data used to investigate the effectiveness of the spectrometer, as well as to design the parameter estimation model, came from an experimental process that took place in the industry. Specifically, 17 samples of wheat and 25 samples of flour were examined. For each sample, 10 different NIR spectrums were collected. The exposure time of each measurement was set to 5 seconds. For these samples, an analysis was performed in the industry's chemistry laboratory in order to determine the protein, moisture and ash contents (ash was measured for flour). The histograms of the wheat samples collected are presented in Figure 9. Figure 10 provides the histograms of the parameters of the flour samples. The mean value and the variance of the gathered samples are presented in Table 1. Based on the histograms depicted in Figure 9 and Figure 10, along with the average and variance values, it is evident that the samples under examination do not exhibit a uniform distribution. This non-uniformity can be attributed to the fact that these samples were collected from various stages of the production line in the milling industry and the fact that a typical Mill flour industry process specifically kind of seeds. Consequently, they represent the diverse types of seeds and flours processed by the industry.
3.2. Results on the Investigation of Wavelengths Effectiveness on Wheats and Flour Chemical Parameters
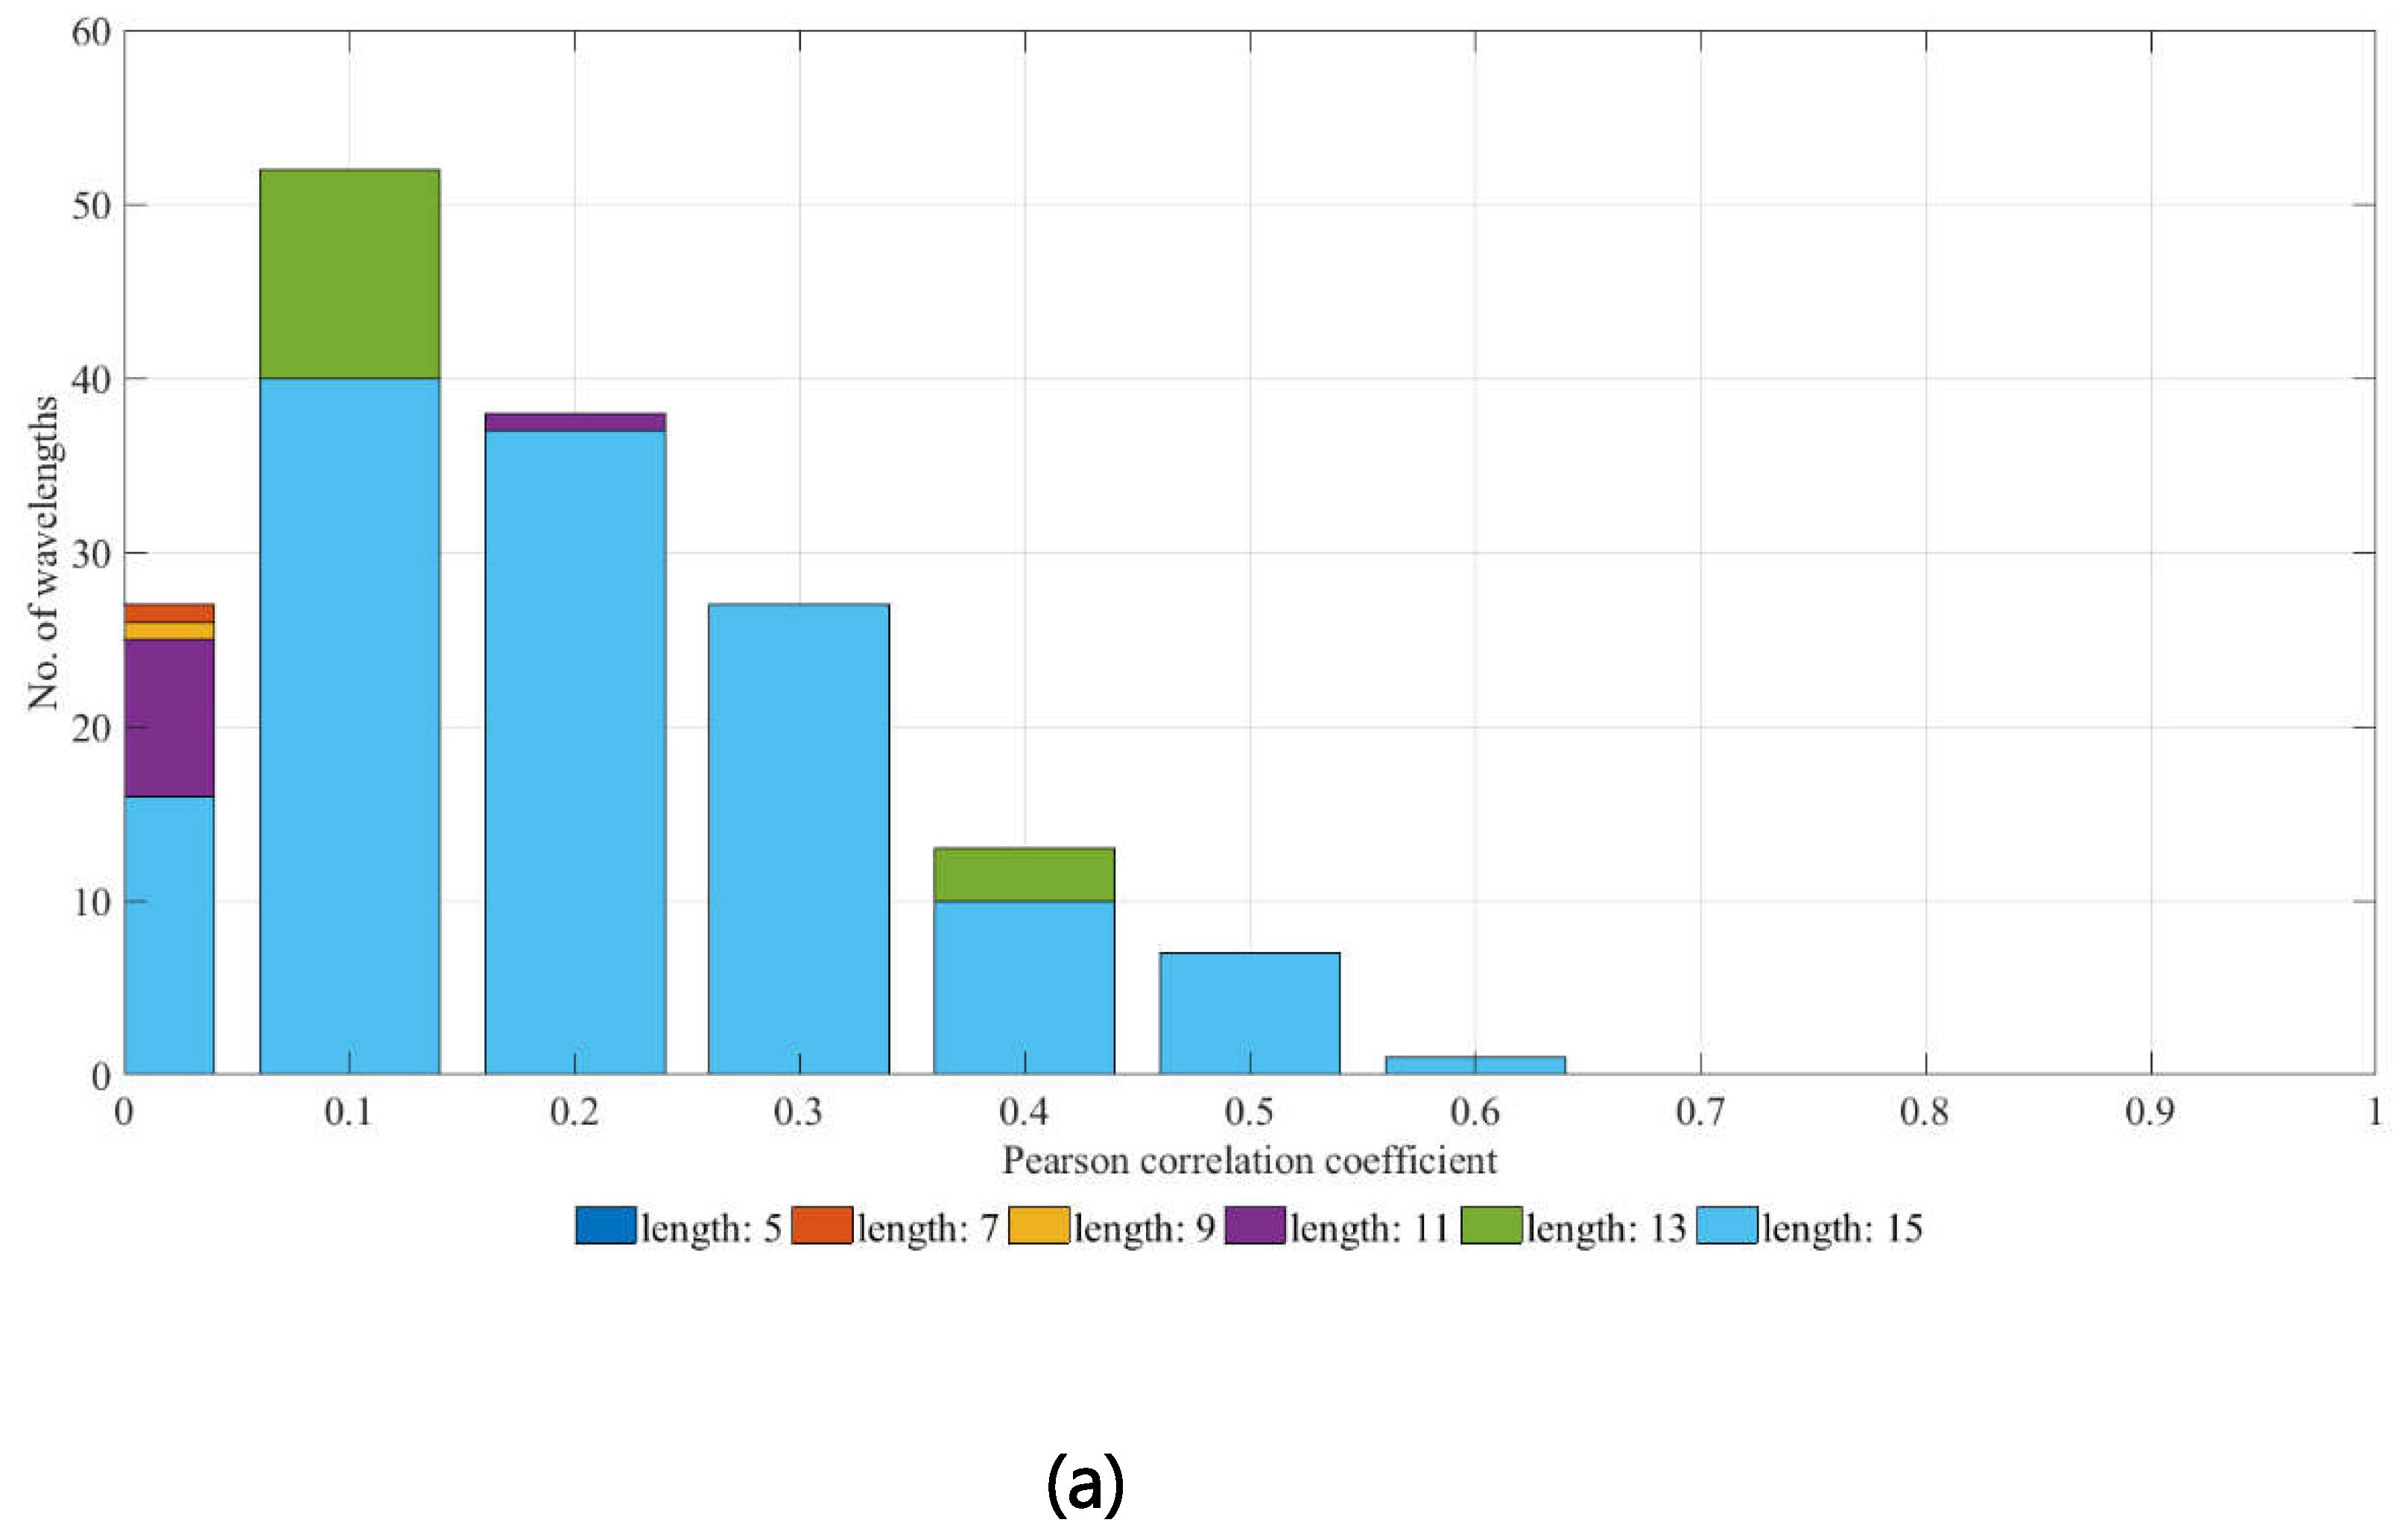
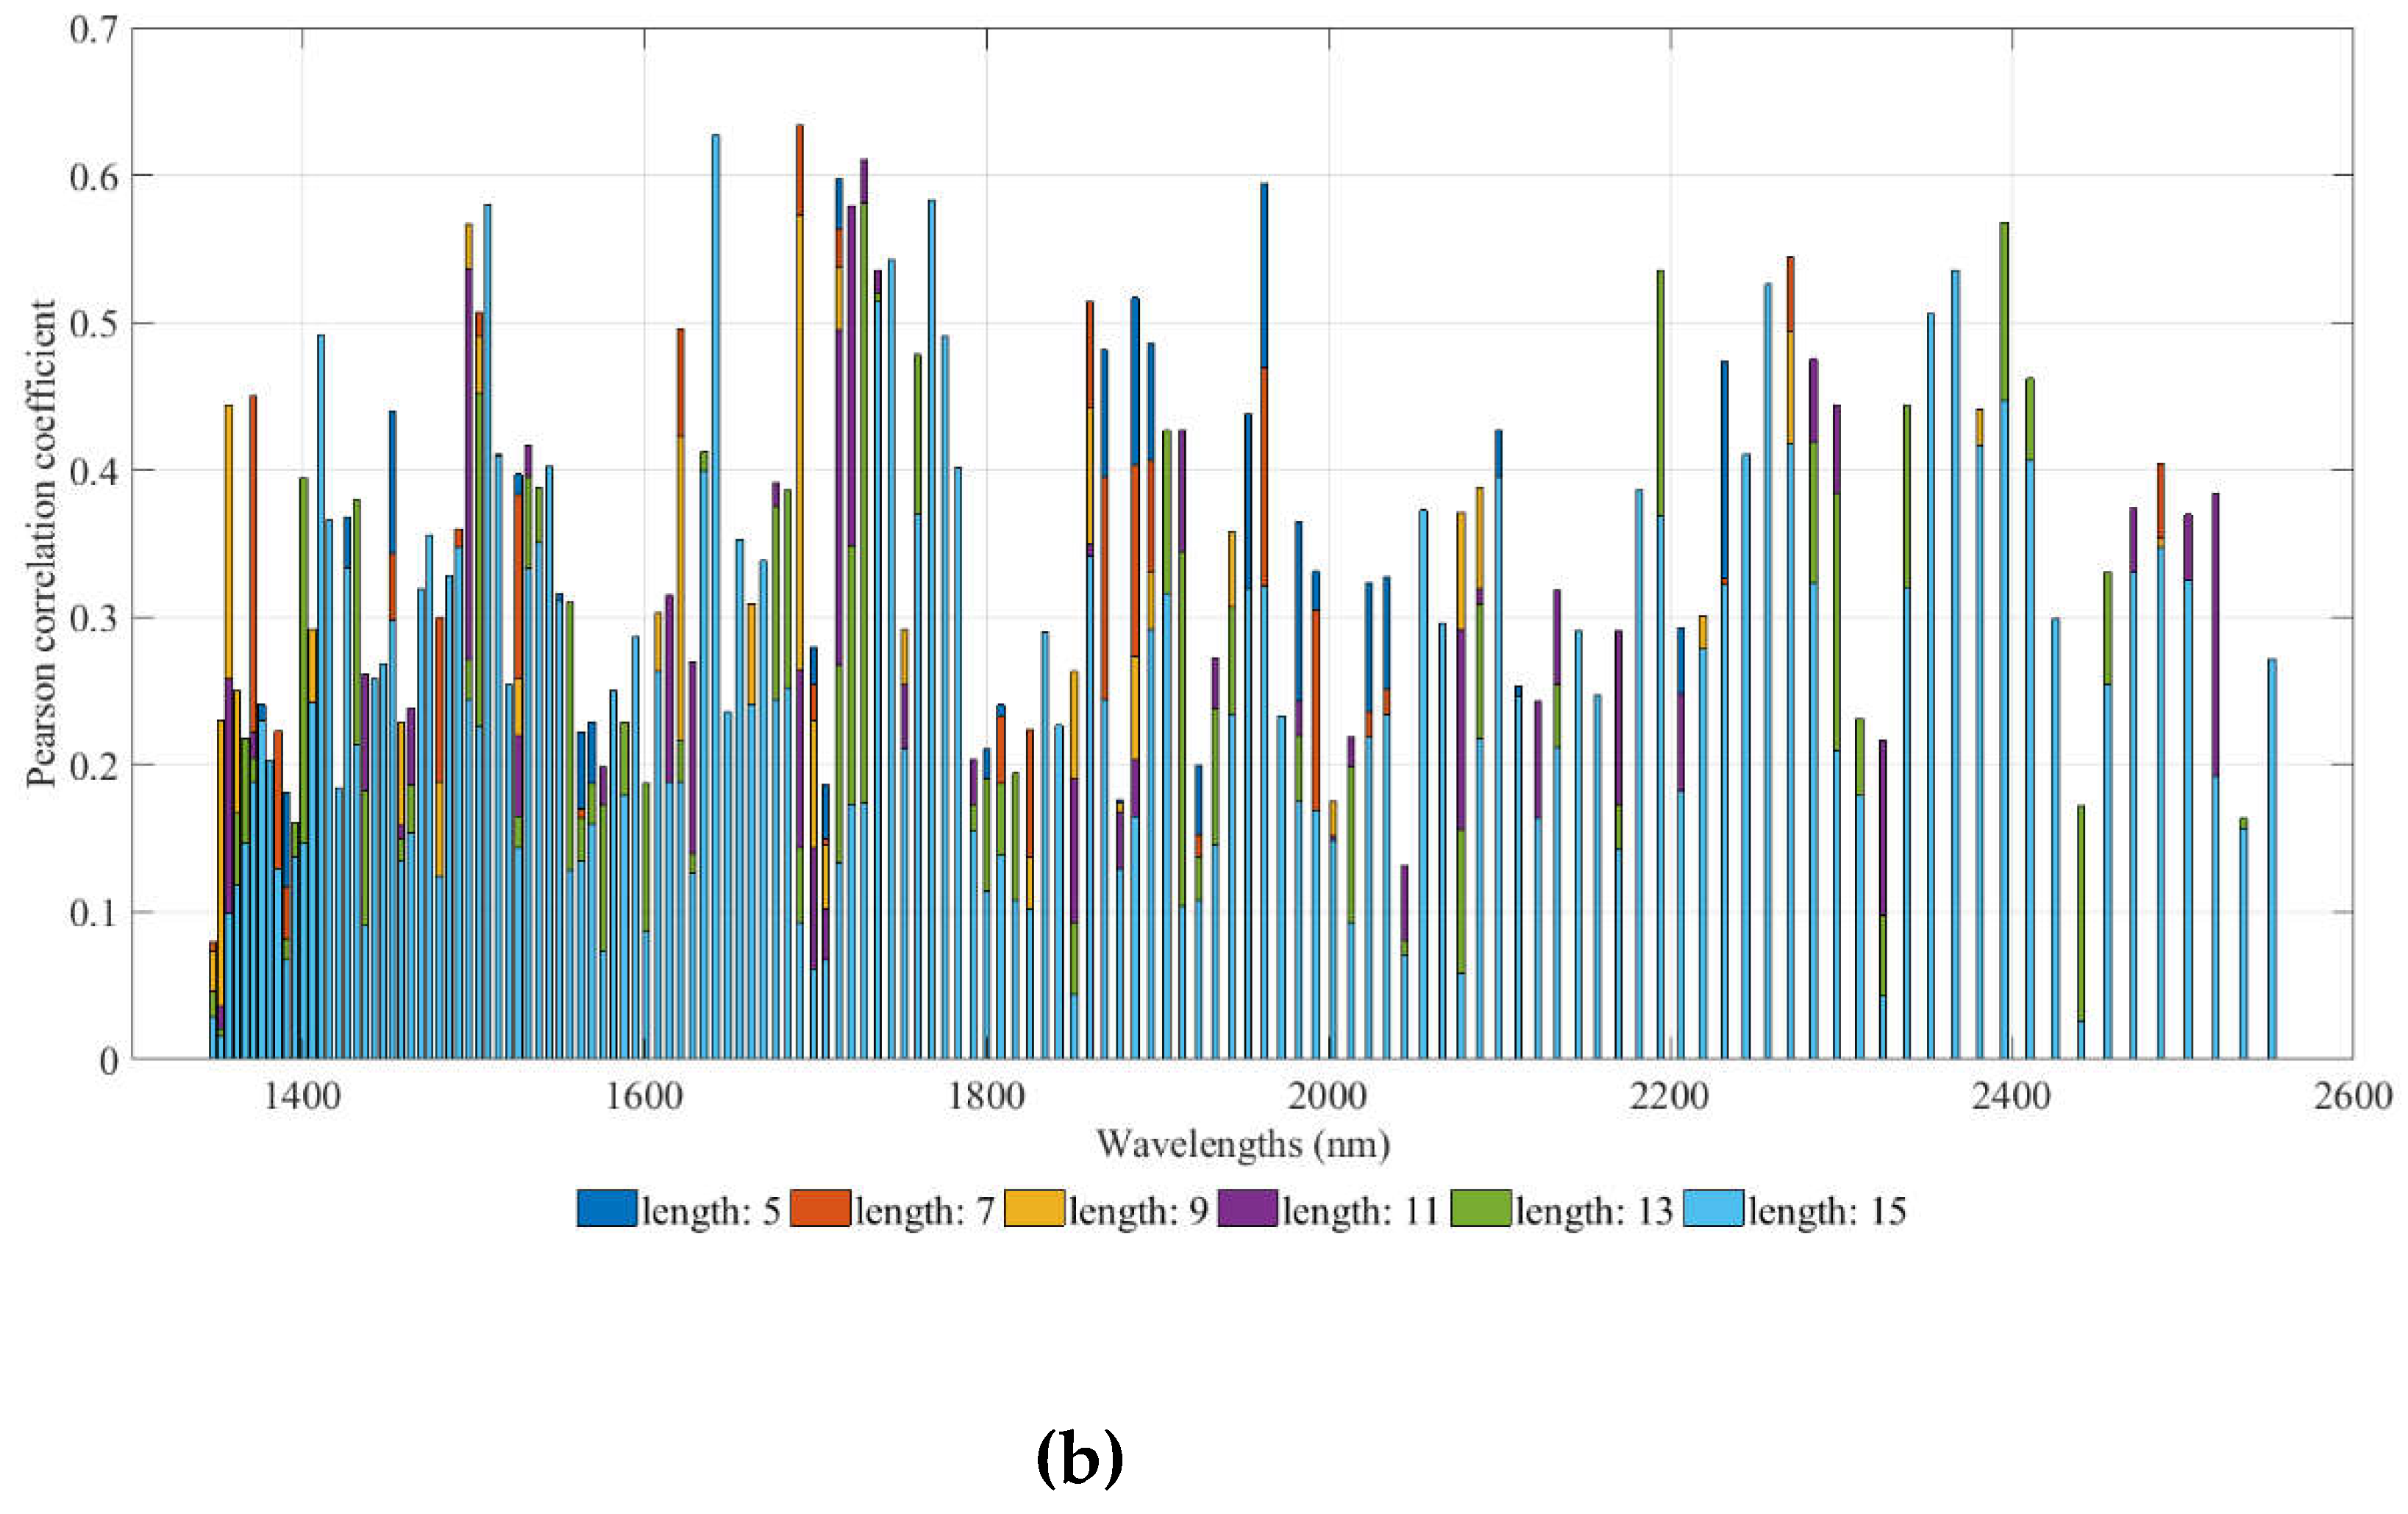
The analysis of the effect of each wavelength in the NIR spectrum on its correlation with the examined parameter was conducted through the investigation of various study cases. In each study case, a combination of the aforementioned preprocessing methods was applied, followed by an examination of the correlation exhibited by each wavelength of the preprocessed spectra with the desired parameters to be estimated. The aforementioned evaluation was applied to samples of cereals. The results of this assessment are presented in detail in Appendix A, illustrating both the correlation of each NIR wavelength with the corresponding parameter (wheat protein and moisture) and the histogram of correlation coefficients for each wavelength. It is observed that during the protein examination, where all three preprocessing methods were applied and subsequently, the correlation between each wavelength and the desired parameter was examined, most wavelengths in the NIR spectrum displayed a high percentage of correlations compared to the other combinations of the pre-processing techniques. Regarding the application of the smoothing filter, various windows were examined. The windows that appeared to contribute to the increased correlation coefficient between the wavelengths and the desired parameters were those with lengths of 9 and 13. Consequently, in the preprocessing methods applied to NIR spectra for the estimation models of protein in wheats, the study case containing all three preprocessing methods is selected. In this instance, wavelengths were found that exhibited correlation values of up to 0.7. Regarding the smoothing filter window, a window size of 9 was chosen, as according to the Figures in Appendix A, wavelengths with correlation coefficients up to 0.7 were observed. Concerning the selection of wavelengths to be used as inputs in the FCM, the wavelengths that exhibited the five highest correlations compared to the others were selected. These wavelengths demonstrated correlations ranging from 0.6 to 0.7. On the opposite site, regarding the moisture content, it is concluded that the application of the smooth filter degrades the correlation between the wavelengths and the moisture parameter. The results indicate that only the application of the MSC transformation can achieve the most wavelengths with a correlation coefficient above 0.7. Finally, from the present study, it is extracted that most of the wavelengths of the NIR spectrum do not present a correlation with the protein and the moisture of the samples, when they are examined separetaly. However, the present fact does not conclude that they cannot contribute to the estimation of the required parameters. The present fact needs another form of investigation, by investigating different features that are extracted by the whole spectra. In the design of our estimation models, we employ a specific strategy tailored to the nature of the variables we are targeting. For the protein estimation model, we utilize all three pre-processing techniques to extract the five values that demonstrate the highest correlations with wavelengths and protein content. Conversely, for the moisture estimation model, we exclusively apply the MSC transformation, enabling us to selectively identify the five wavelengths that exhibit the strongest correlations with moisture content.
3.3. Optimization Results of the FCMs Estimation Models
In Table 2 and Table 3, the weightings of the FCMs for the estimation of the wheat and the flour parameters, as depicted in Figure 8, are presented. This graph serves as the foundation for our estimation model for each parameter, for the wheat and flour samples. While the FCM’s structure remains consistent across all estimation models, the weights within the graph undergoes variations. Upon analyzing these weights, it becomes evident that the wavelengths with the most significant influence on estimating both protein and moisture content in cereals are those situated towards the higher end of the NIR spectrum (with values exceeding 2000 nm). However, it is worth noting that specific wavelengths scattered throughout the NIR spectrum exhibit sensitivity to the parameters of interest. As wavelengths approach the visible spectrum, their impact on parameter estimation diminishes. Remarkably, the wavelengths displaying the strongest correlation with moisture estimation fall within the range of 1728 to 2488 nm. In contrast, the protein estimation model highlights wavelengths in the range of 1375 to 2440 nm. A notable trend emerges as most wavelengths positively contribute to the estimation of both parameters, evident by their positive weights. Essentially, this implies that as the NIR light reflectance value from cereals increases, so does the estimated protein content. In both models, there is only one wavelength displaying a negative correlation. Figure 11a presents the protein values for the examined samples, as determined by the factory laboratory, alongside the estimates derived from the fuzzy connected graph. Additionally, Figure 11b illustrates a histogram of the mean square errors associated with the estimation model. Similarly, Figure 11c,d, offer a presentation of the moisture values for the examined samples, alongside the mean square error between the actual and estimated values. Both models, designed for estimating protein and moisture content in cereals, exhibit a commendable performance, boasting correlation coefficients exceeding 0.9. The largest observed discrepancy is merely 1%, found within the same sample for both protein and moisture content. Furthermore, it is noteworthy that the protein estimation model demonstrates a stronger correlation with the moisture model. This conclusion is drawn from the mean square errors observed in the examined samples. While the protein estimation model yields nearly zero errors for most samples, the moisture model displays mean square errors ranging from 0.025 to 0.05. Nevertheless, these errors remain relatively minor, supporting the overall reliability of our value estimations. In summary, our study employed a fuzzy connected graph to estimate protein and moisture content in cereals. The results affirm the effectiveness of our model, showcasing correlation coefficients exceeding 0.9 for both parameters. Maximum deviations between estimated and actual values were limited to a mere 1%. Additionally, we observed that certain wavelengths in the NIR spectrum are particularly sensitive to structural changes in cereals affecting protein and moisture content. While these findings are promising, further validation on a larger dataset is warranted to affirm their general applicability.
On the other hand, the parameter estimation models for flours exhibit different behavior (Figure 12). Initially, it is observed that, unlike the grain estimation models, in flours, at least 2 out of 5 wave lengths that significantly affect the desired variables have a negative correlation with the variables. Additionally, the range of values is smaller, as the wave lengths with the highest correlations range from 1490 nm to 2055 nm. This may be due to the value ranges of the grains processed by the factory and the flours produced as well as the different textures between the grains and flours, resulting in an influence on the spectra acquisition. The results of the application of the estimation models for the parameters of the flours are presented as well as the mean square errors for each of the three parameters. Observing the mean square error that appears in the case of protein, it seems that specific samples exhibit relatively large errors between the actual and estimated values. It is estimated that one of the reasons for this anomaly is due to the dust generated by the flour in the environment, where the NIR spectra are taken, resulting in additional noise and, therefore, some samples showing significant deviations. Furthermore, larger errors are observed in the case of flours compared to grain samples. The above can be considered as a stimulus for further studies on this specific issue to improve the ability to approximate the desired parameters for both flours and grains.
According to the initial analysis of the effectiveness of the proposed models, based on the usage of a low cost NIR spectrometer, the results indicate that by enabling computational intelligence algorithms, the usage of low cost NIRs can provide useful information, regarding the parameter estimation of protein, moisture and ash in mill industry applications. However, there is the need to examine the effectiveness of both models and the low-cost handle NIR in more samples, which the values of the samples’ parameters will be uniformly distributed. This is a challenge since mill flour industries work on specific kinds of wheat seeds and flours and it is difficult to create datasets that allocate the protein and moisture values along a uniform distribution.
4. Conclusions
In this study, a cost-effective NIR spectrum was employed to assess its suitability for application within a milling industry process. The objective was to utilize this equipment to estimate key parameters including protein and moisture content in wheat seeds as well as protein, moisture and ash levels in flour samples. Notably, the approach deviates from conventional state-of-the-art NIR spectrometry, typically relying on InGaAs sensors, as we harnessed a low-cost Fourier-Transform Infrared spectroscopy technology-based NIR sensor. To enhance the accuracy of our measurements, a novel calibration model is introduced, incorporating a training phase based on the PSO optimization algorithm. This process aimed to fine-tune a specialized FCM model specifically tailored for parameter estimation. The design of the FCM model was based on the wavelengths extracted from the captured NIR spectra, as these wavelengths displayed heightened correlations with the parameters under investigation. The evaluation of the low-cost spectrometer, along with the integration of CMOS technology into NIR spectrometry, demonstrates its capability to measure chemical parameters effectively. However, further enhancements in accuracy can be achieved by employing advanced calibration models leveraging AI techniques. Moreover, expanding the dataset used for model calibration, including the proposed FCM model in this paper, is recommended. Nonetheless, it is imperative to conduct long-term experiments to assess the equipment's performance over extended durations adequately. Considering the promising outcomes of this study, our future research will focus on integrating low-cost NIR sensors into mill flour industry, exploring alternative algorithms for calibration, such as reinforcement learning. Simultaneously, the examined NIR spectrometer will be evaluated and tested in-line measurements, based on larger dataset of wheat and flour samples.
Author Contributions
“Conceptualization, V.B., D.V., and A.K.; methodology, V.B., D.V., and A.K.; software, V.B., D.V., and A.K.; validation, V.B., D.V. and A.K.; formal analysis, V.B., D.V., and A.K; investigation, V.B., D.V., and A.K; data curation, V.B., D.V. and A.K..; writing—original draft preparation, V.B., D.V., and A.K; writing—review and editing, V.B., D.V. and A.K.; visualization, V.B., D.V., and A.K; supervision, A.K.; project administration, A.K.; All authors have read and agreed to the published version of the manuscript.”
Funding
This research was funded by the European Regional Development Fund (ERDF), grant number AΜΘΡ4 – 0042704.
Data Availability Statement
Data are available on request due to privacy restrictions.
Conflicts of Interest
The authors declare no conflict of interest.
Appendix A
Appendix A showcases the outcomes of a sensitivity analysis conducted using the employed spectrometer, demonstrating the correlation between individual wavelengths and fluctuations in protein and moisture levels within the wheat seeds samples (Figure A1, Figure A2, Figure A3, Figure A4, Figure A5, Figure A6, Figure A7 and Figure A8).
Figure A1.
Analysis of wavelength effectiveness in estimating protein content of the wheat samples without applying any preprocessing technique: (a) Histogram of the Correlation Coefficients between NIR Wavelengths and Protein Content, (b) Correlation Coefficients for Each NIR Wavelength.
Figure A1.
Analysis of wavelength effectiveness in estimating protein content of the wheat samples without applying any preprocessing technique: (a) Histogram of the Correlation Coefficients between NIR Wavelengths and Protein Content, (b) Correlation Coefficients for Each NIR Wavelength.
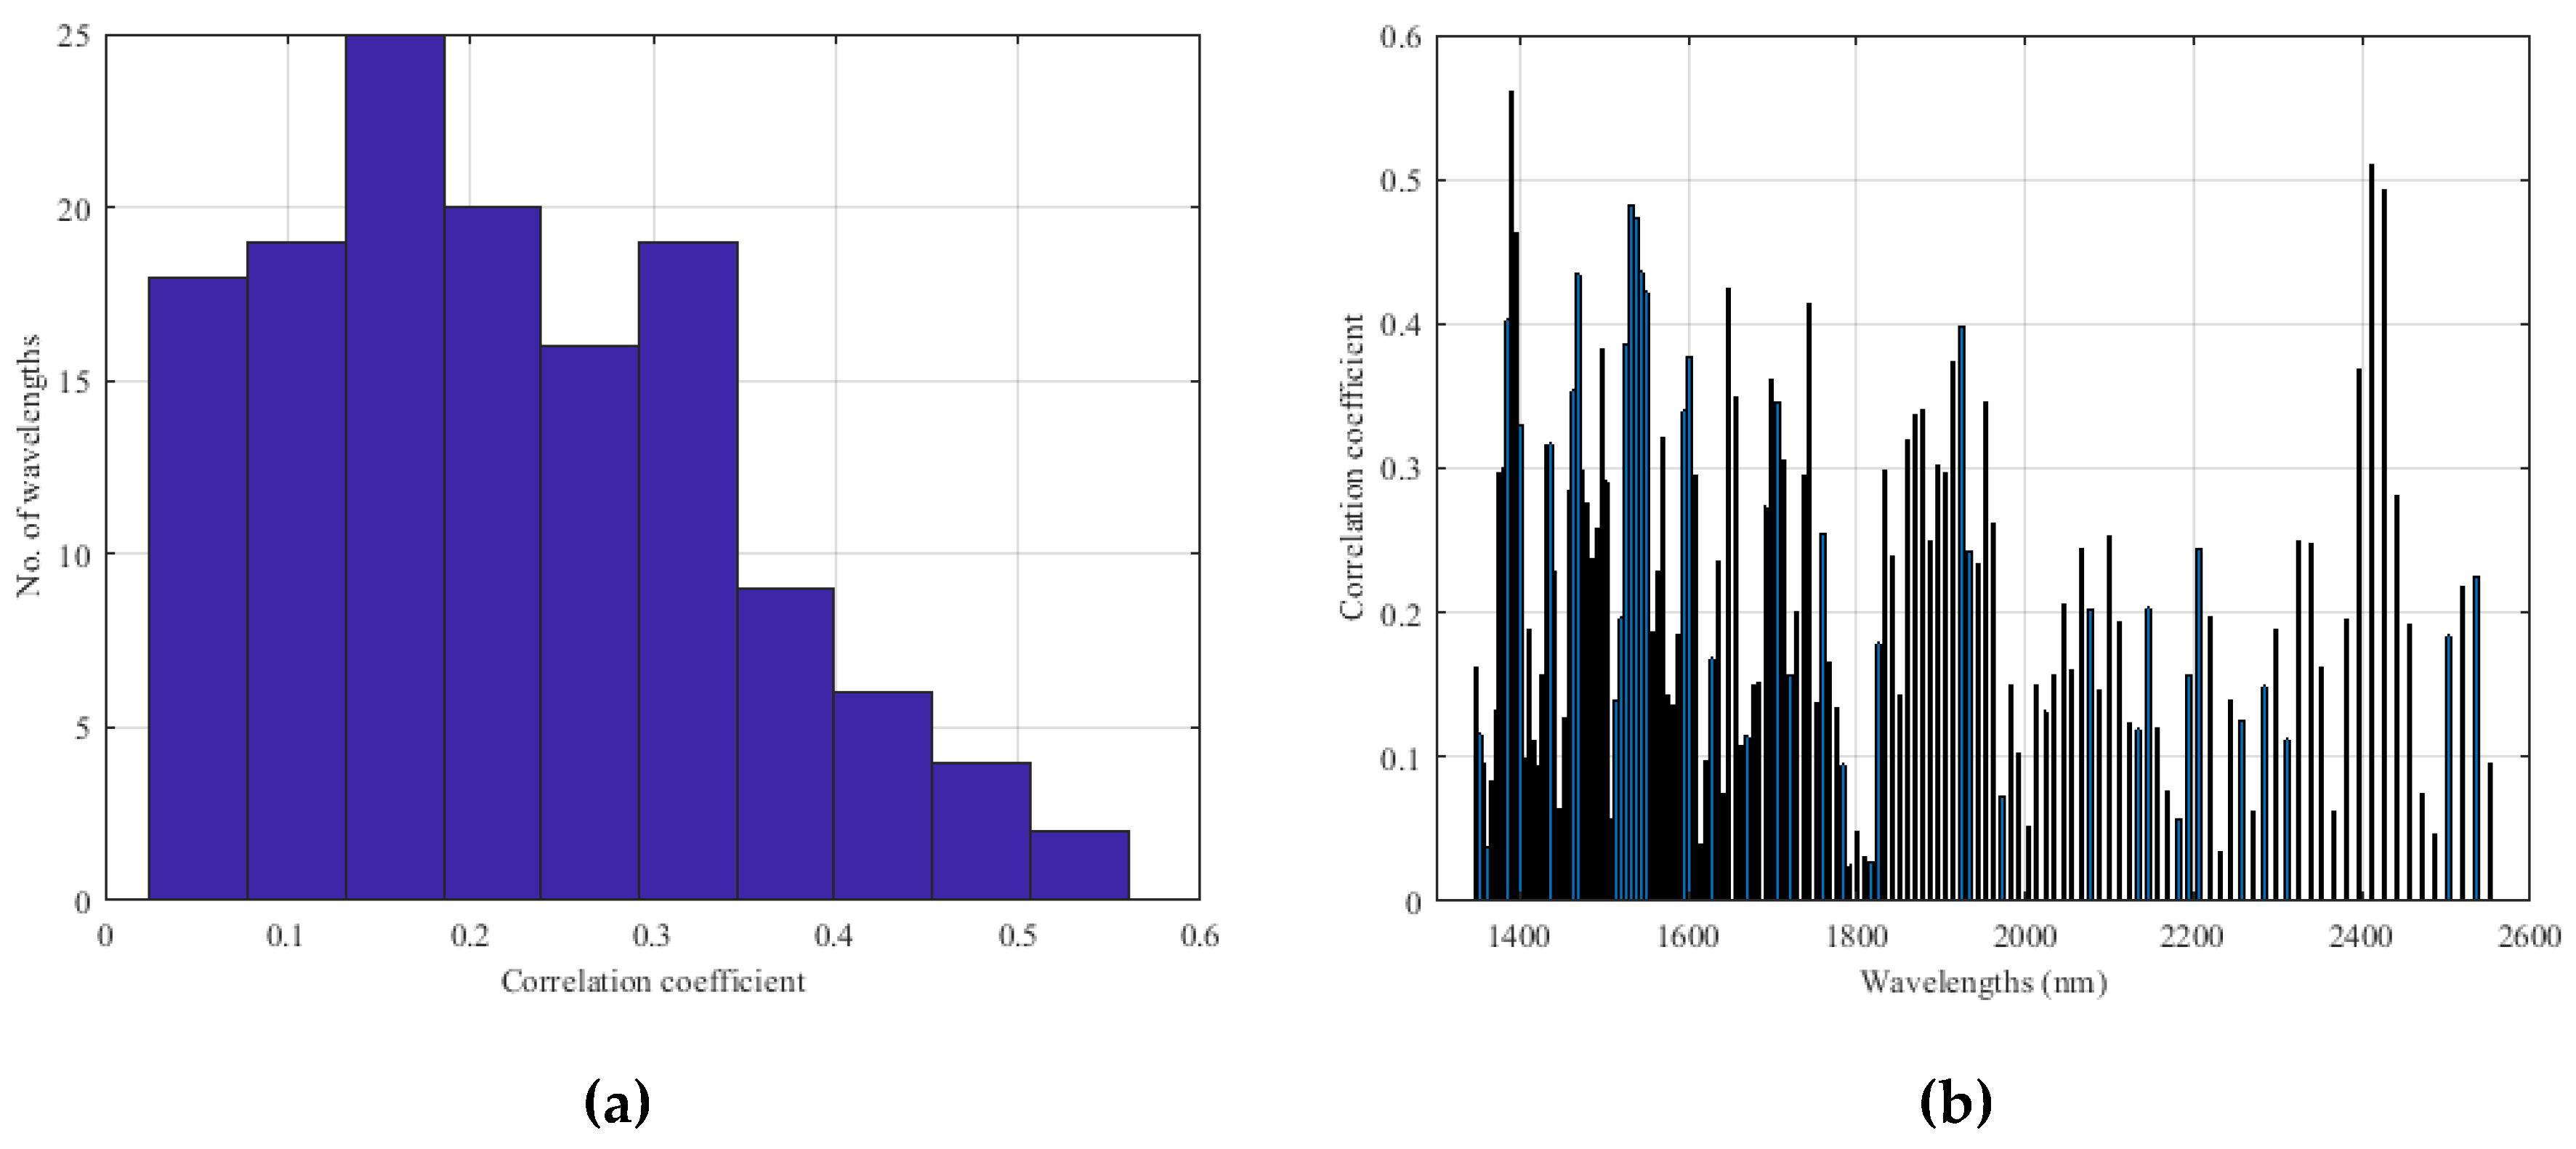
Figure A2.
Analysis of wavelength effectiveness in estimating protein content of the wheat samples, by applying the MSC transformation: (a) Histogram of the Correlation Coefficients between NIR Wavelengths and Protein Content, (b) Correlation Coefficients for Each NIR Wavelength.
Figure A2.
Analysis of wavelength effectiveness in estimating protein content of the wheat samples, by applying the MSC transformation: (a) Histogram of the Correlation Coefficients between NIR Wavelengths and Protein Content, (b) Correlation Coefficients for Each NIR Wavelength.
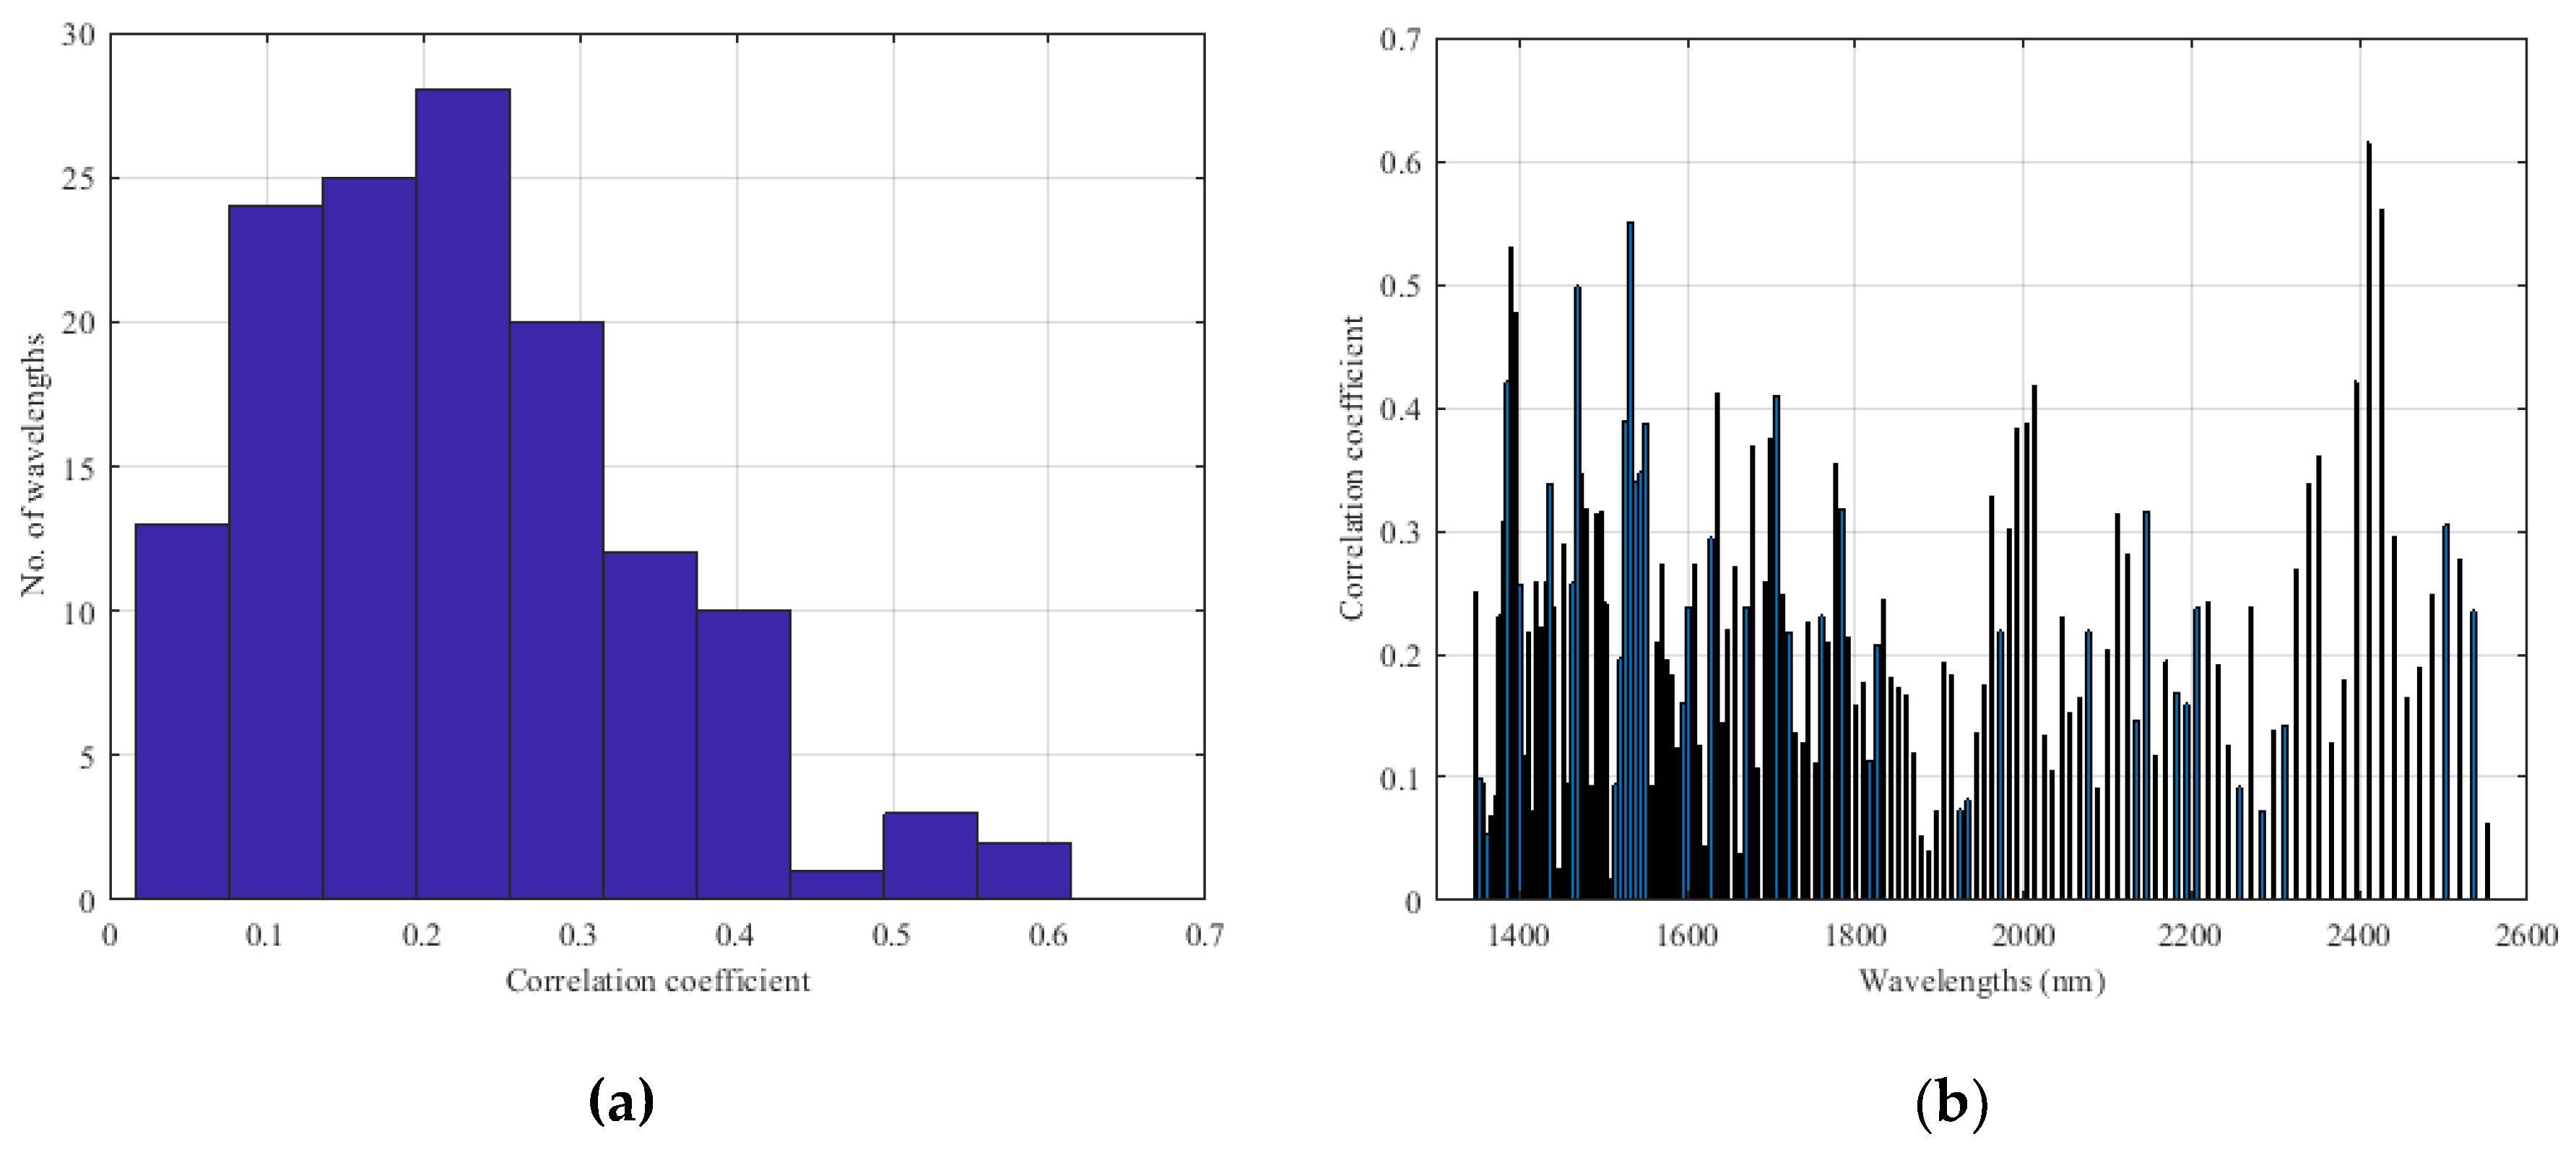
Figure A3.
Analysis of wavelength effectiveness in estimating protein content of the wheat samples, by applying the MSC transformation and first-derivatives: (a) Histogram of the Correlation Coefficients between NIR Wavelengths and Protein Content, (b) Correlation Coefficients for Each NIR Wavelength.
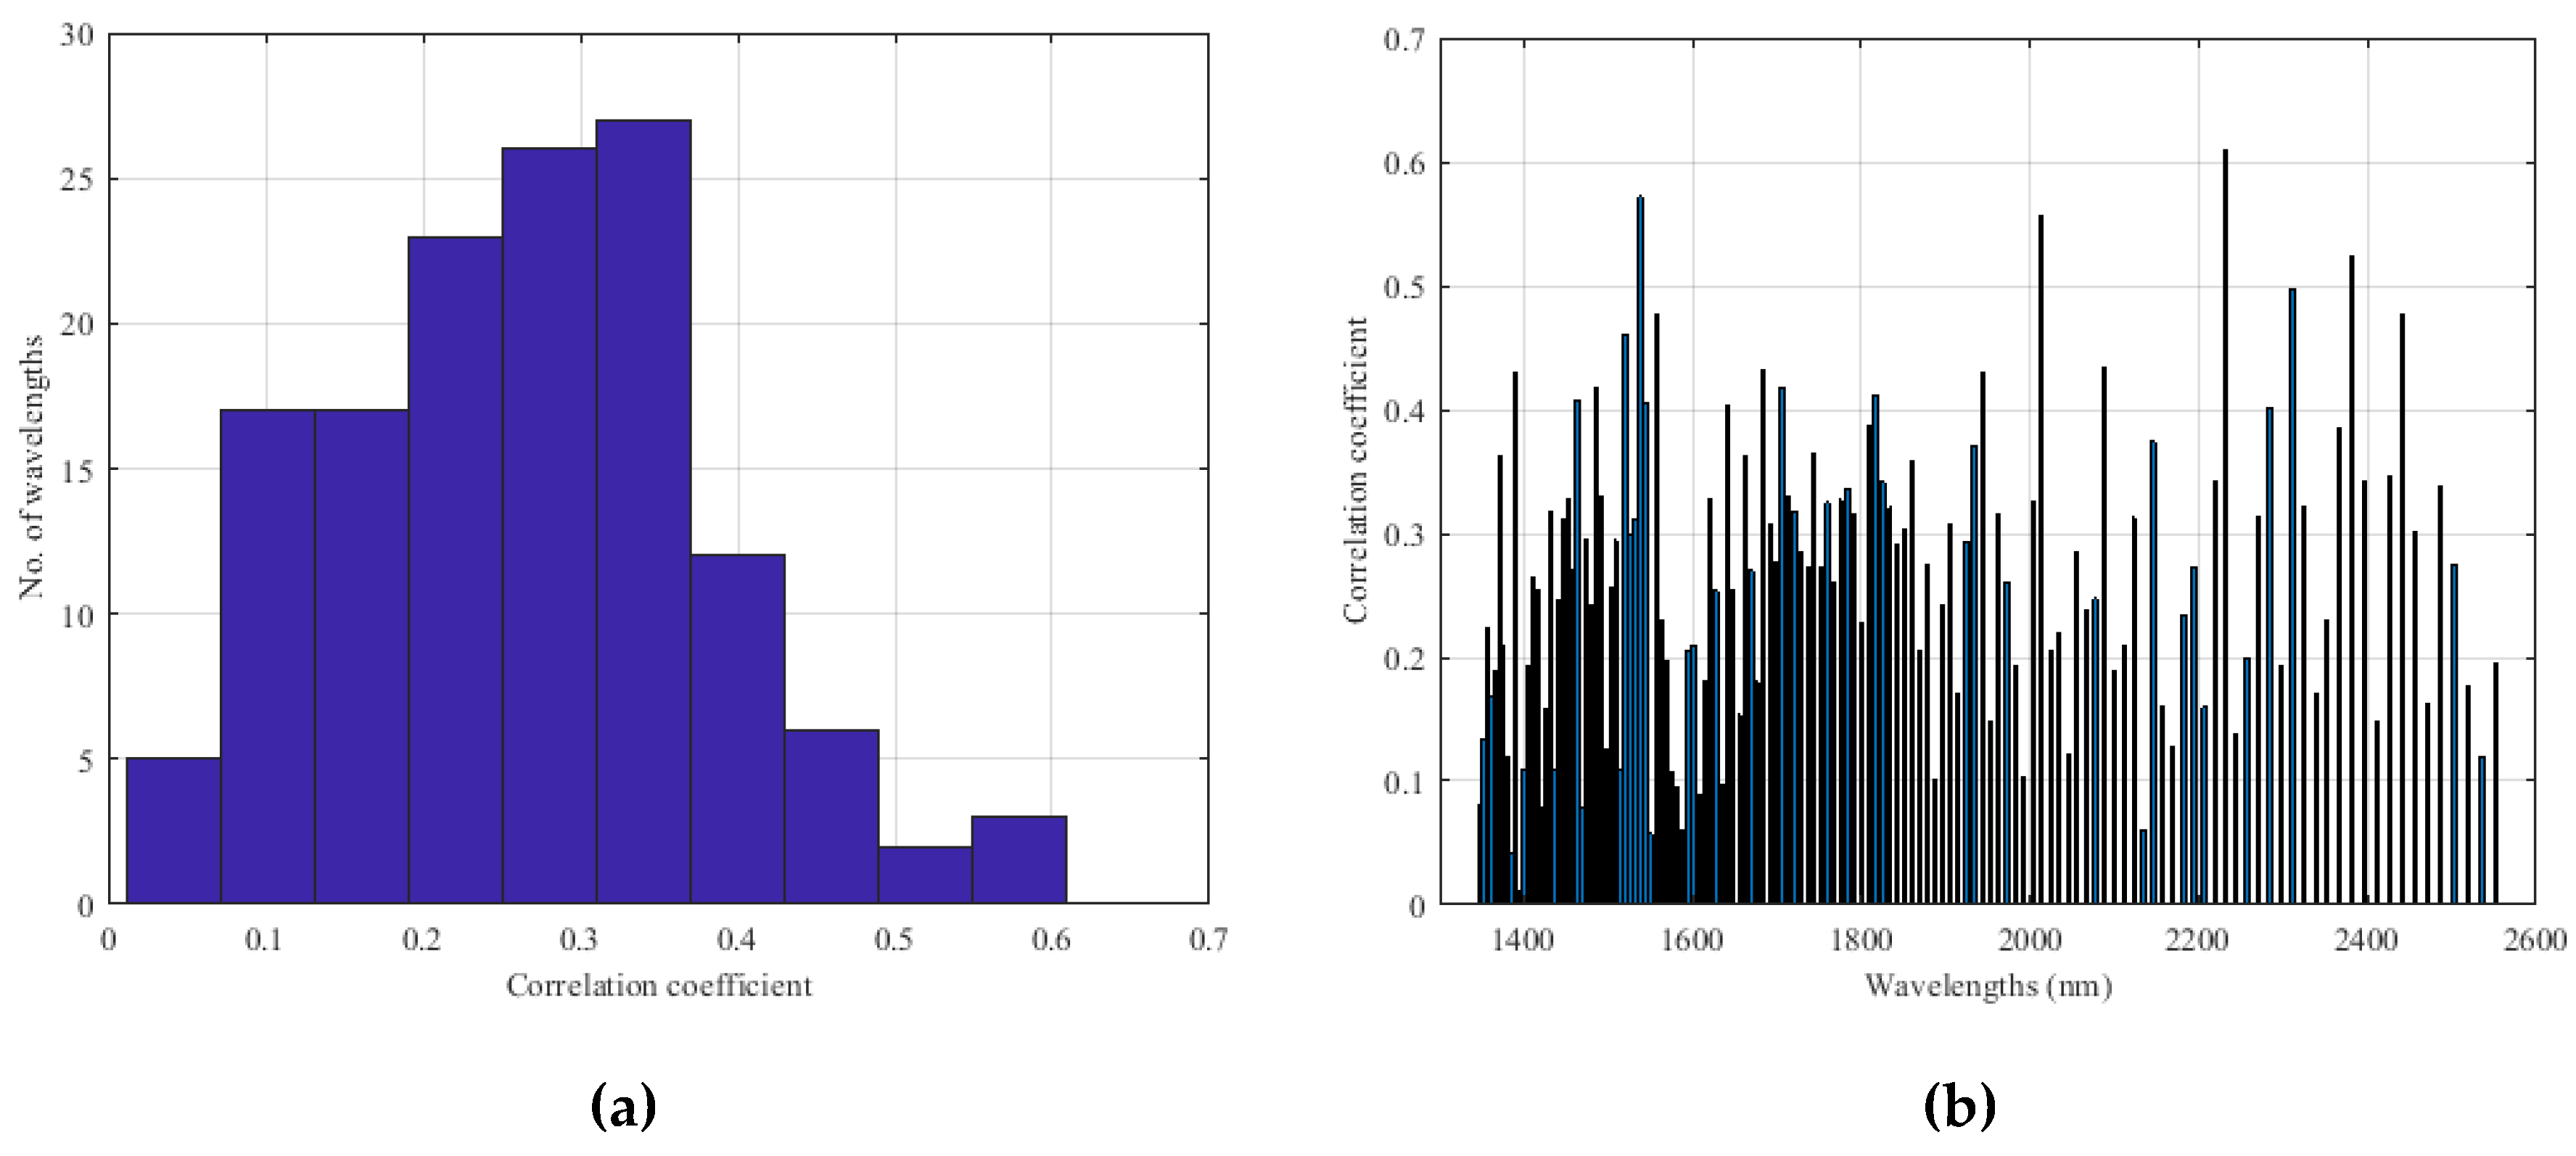
Figure A4.
Analysis of wavelength effectiveness in estimating protein content of the wheat samples, by applying the MSC transformation, first-derivatives and smooth filter: (a) Histogram of the Correlation Coefficients between NIR Wavelengths and Protein Content, (b) Correlation Coefficients for Each NIR Wavelength.
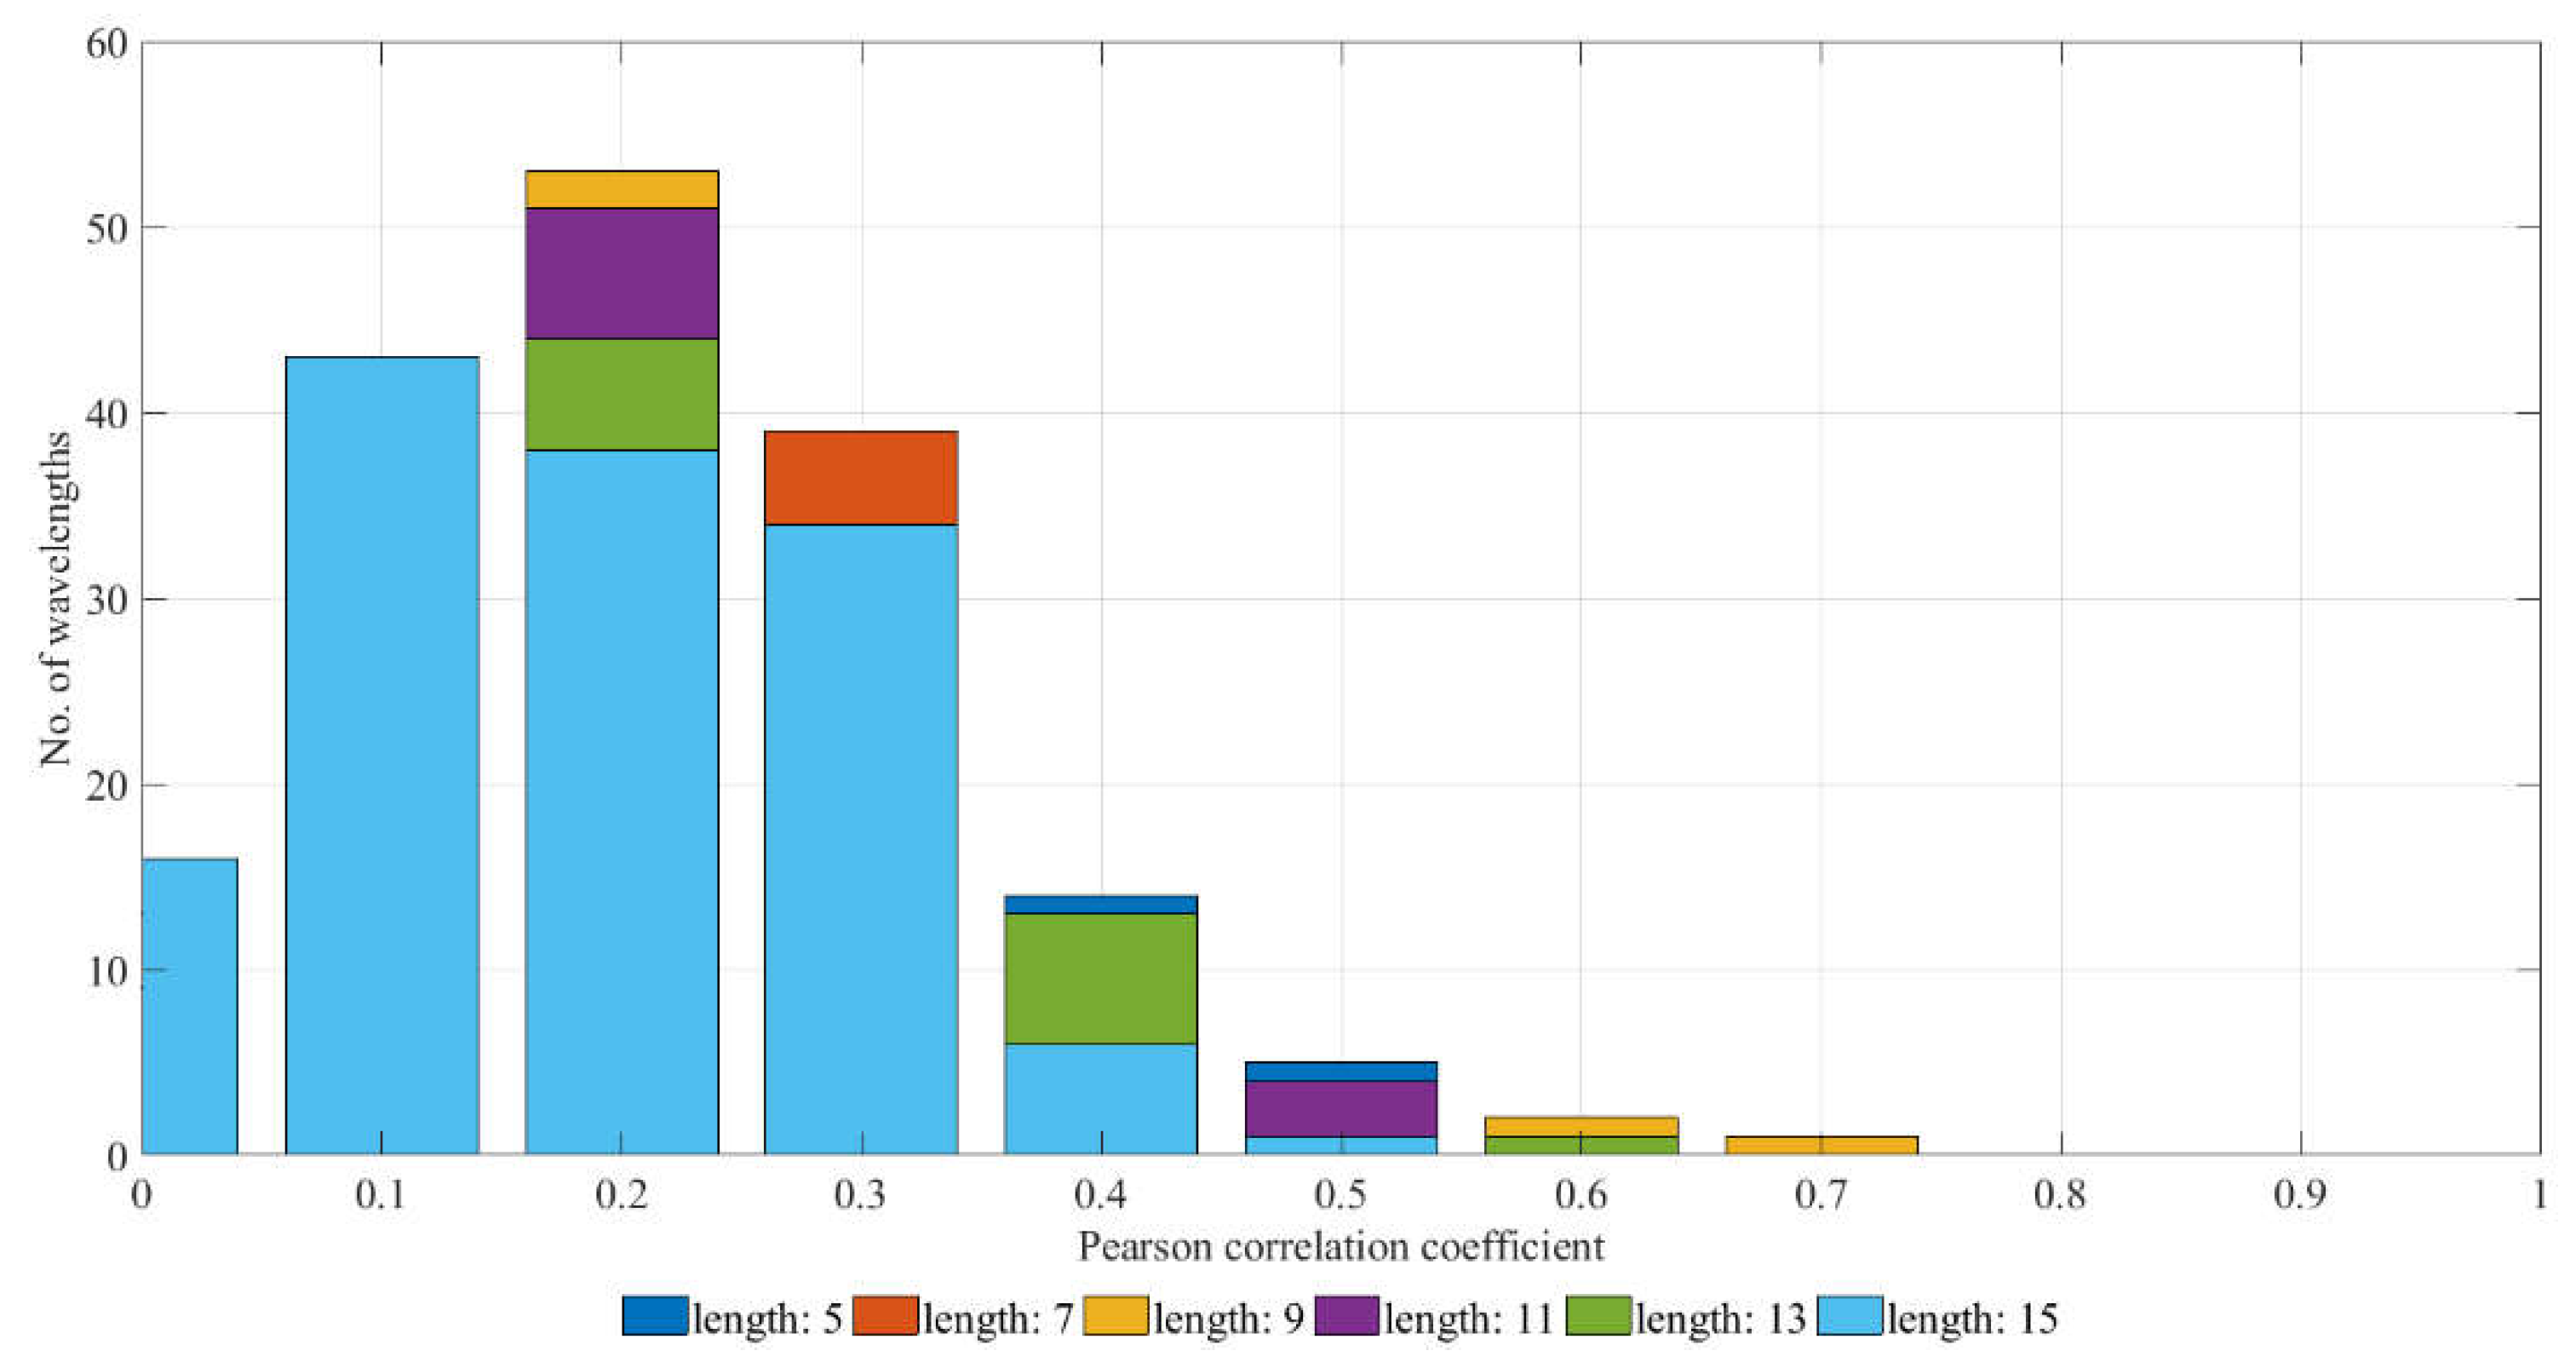
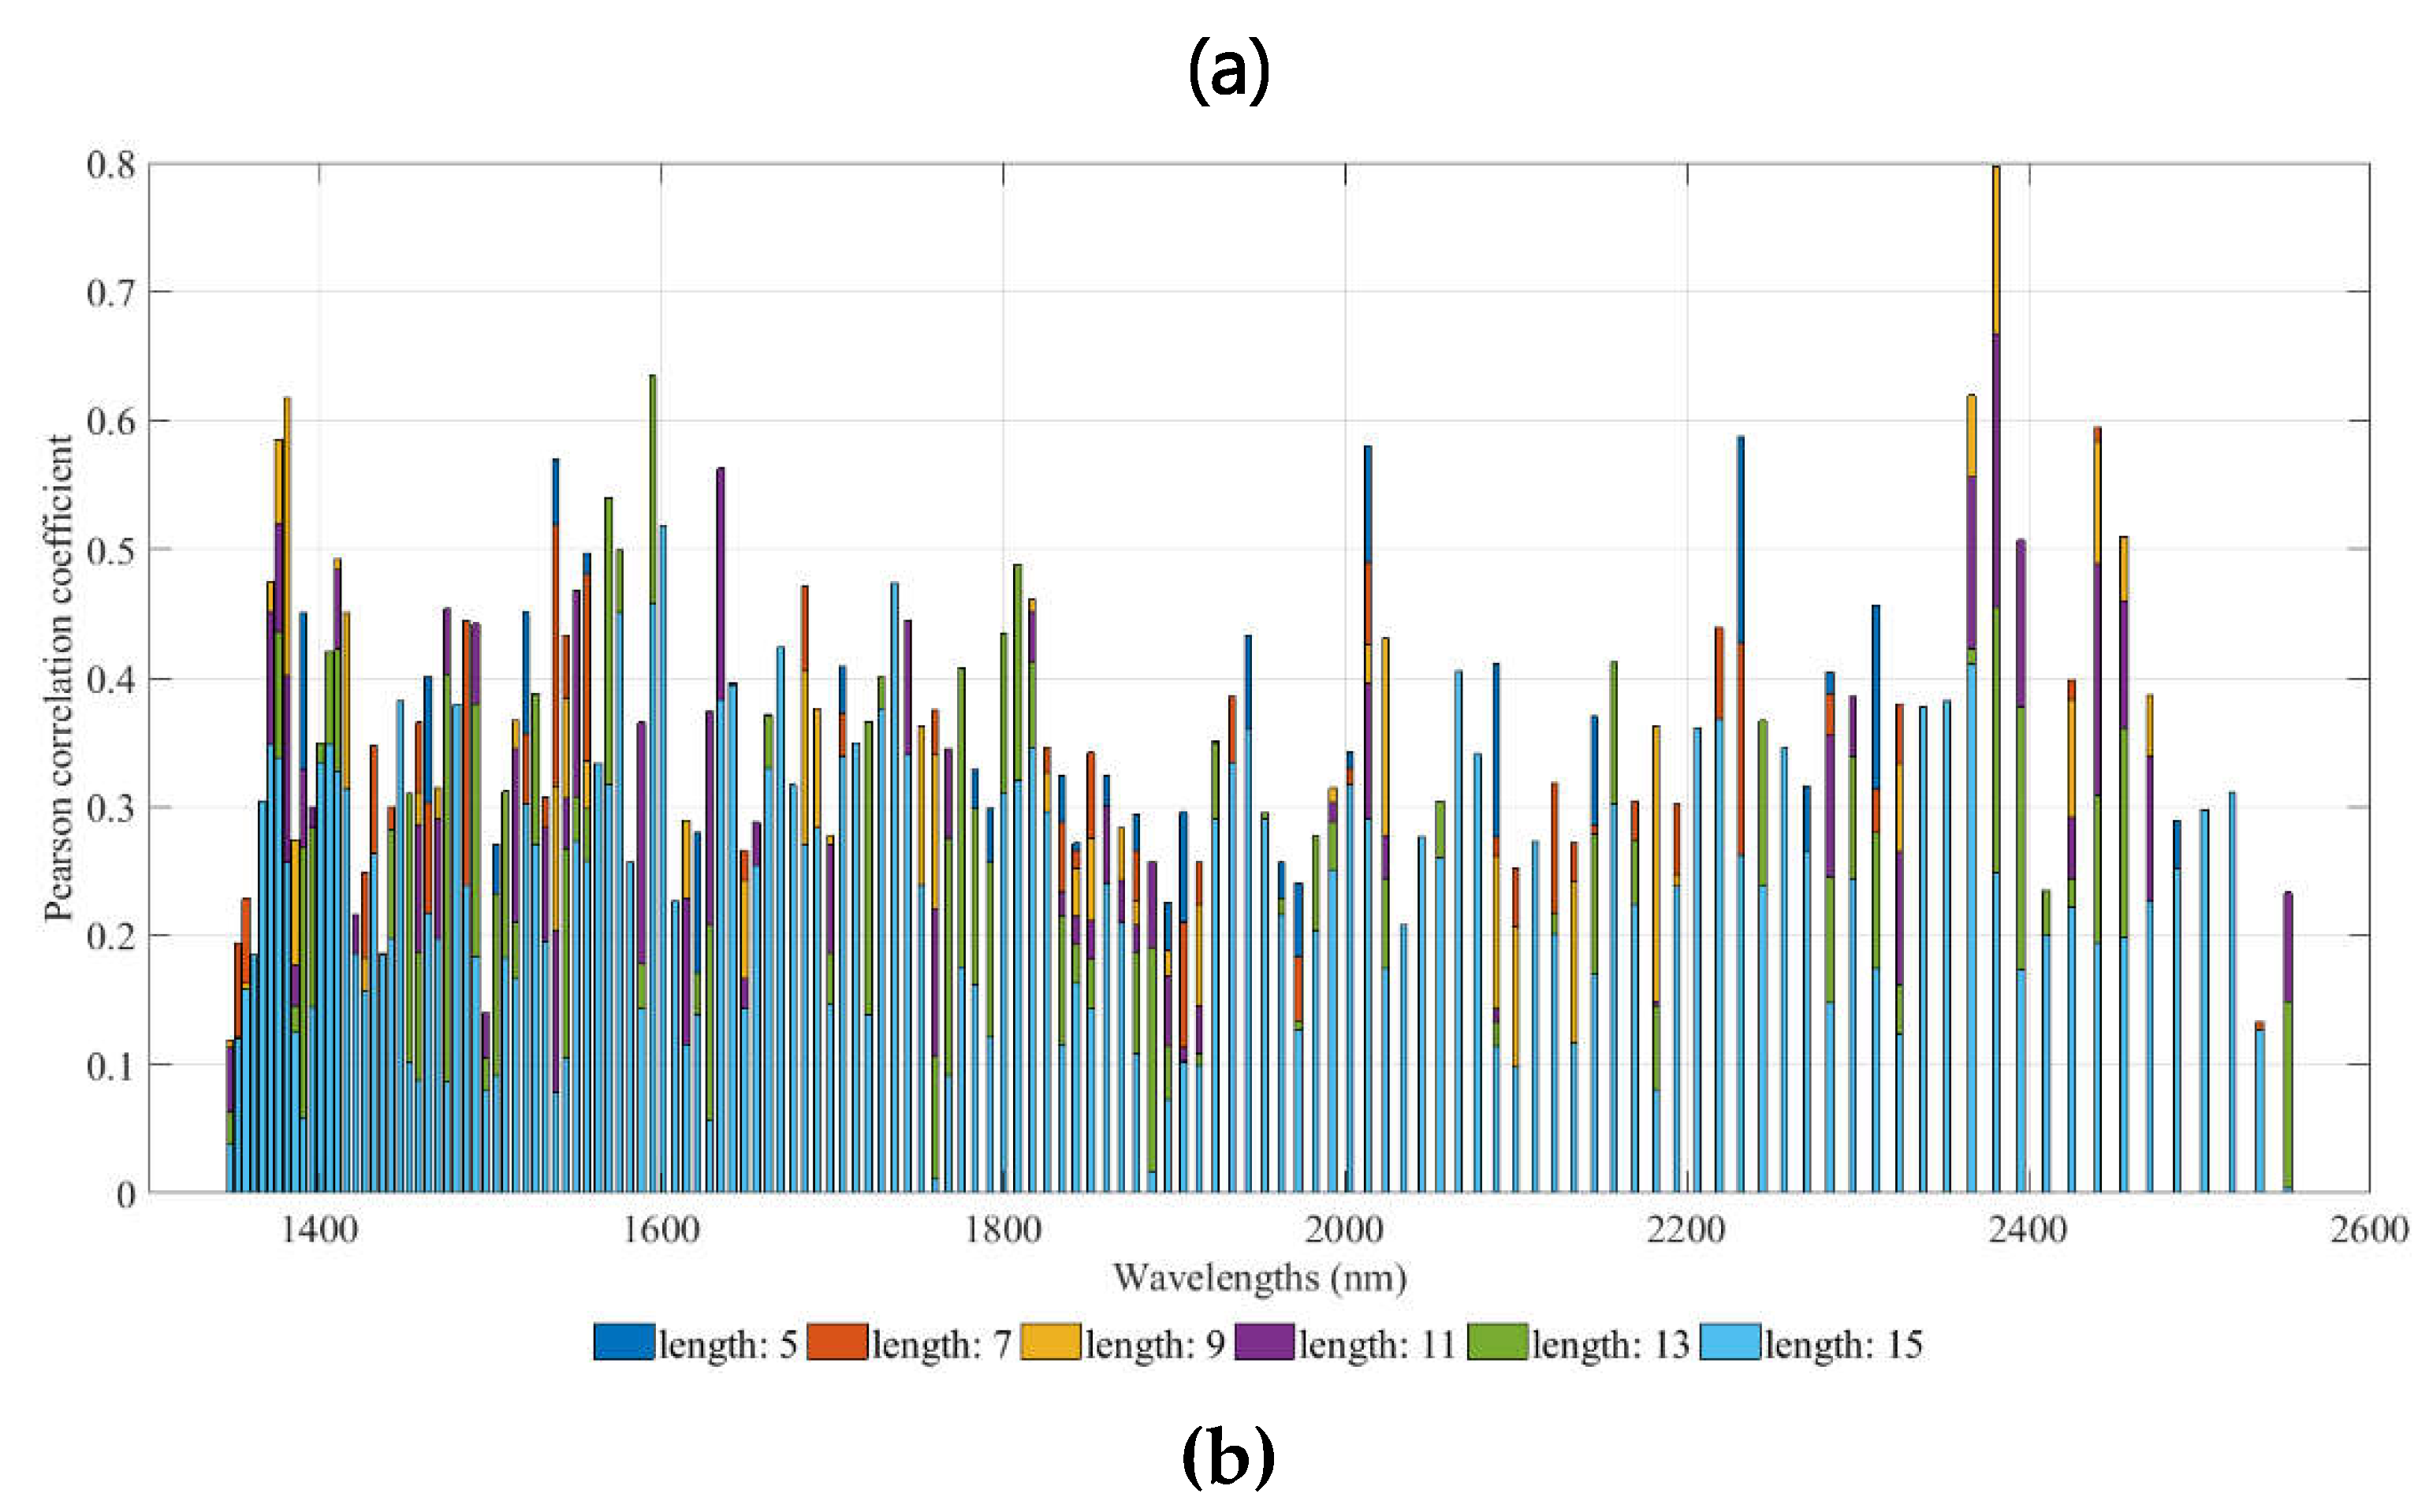
Figure A5.
Analysis of wavelength effectiveness in estimating moisture content of the wheat samples without applying any preprocessing technique: (a) Histogram of the Correlation Coefficients between NIR Wavelengths and Protein Content, (b) Correlation Coefficients for Each NIR Wavelength.
Figure A5.
Analysis of wavelength effectiveness in estimating moisture content of the wheat samples without applying any preprocessing technique: (a) Histogram of the Correlation Coefficients between NIR Wavelengths and Protein Content, (b) Correlation Coefficients for Each NIR Wavelength.
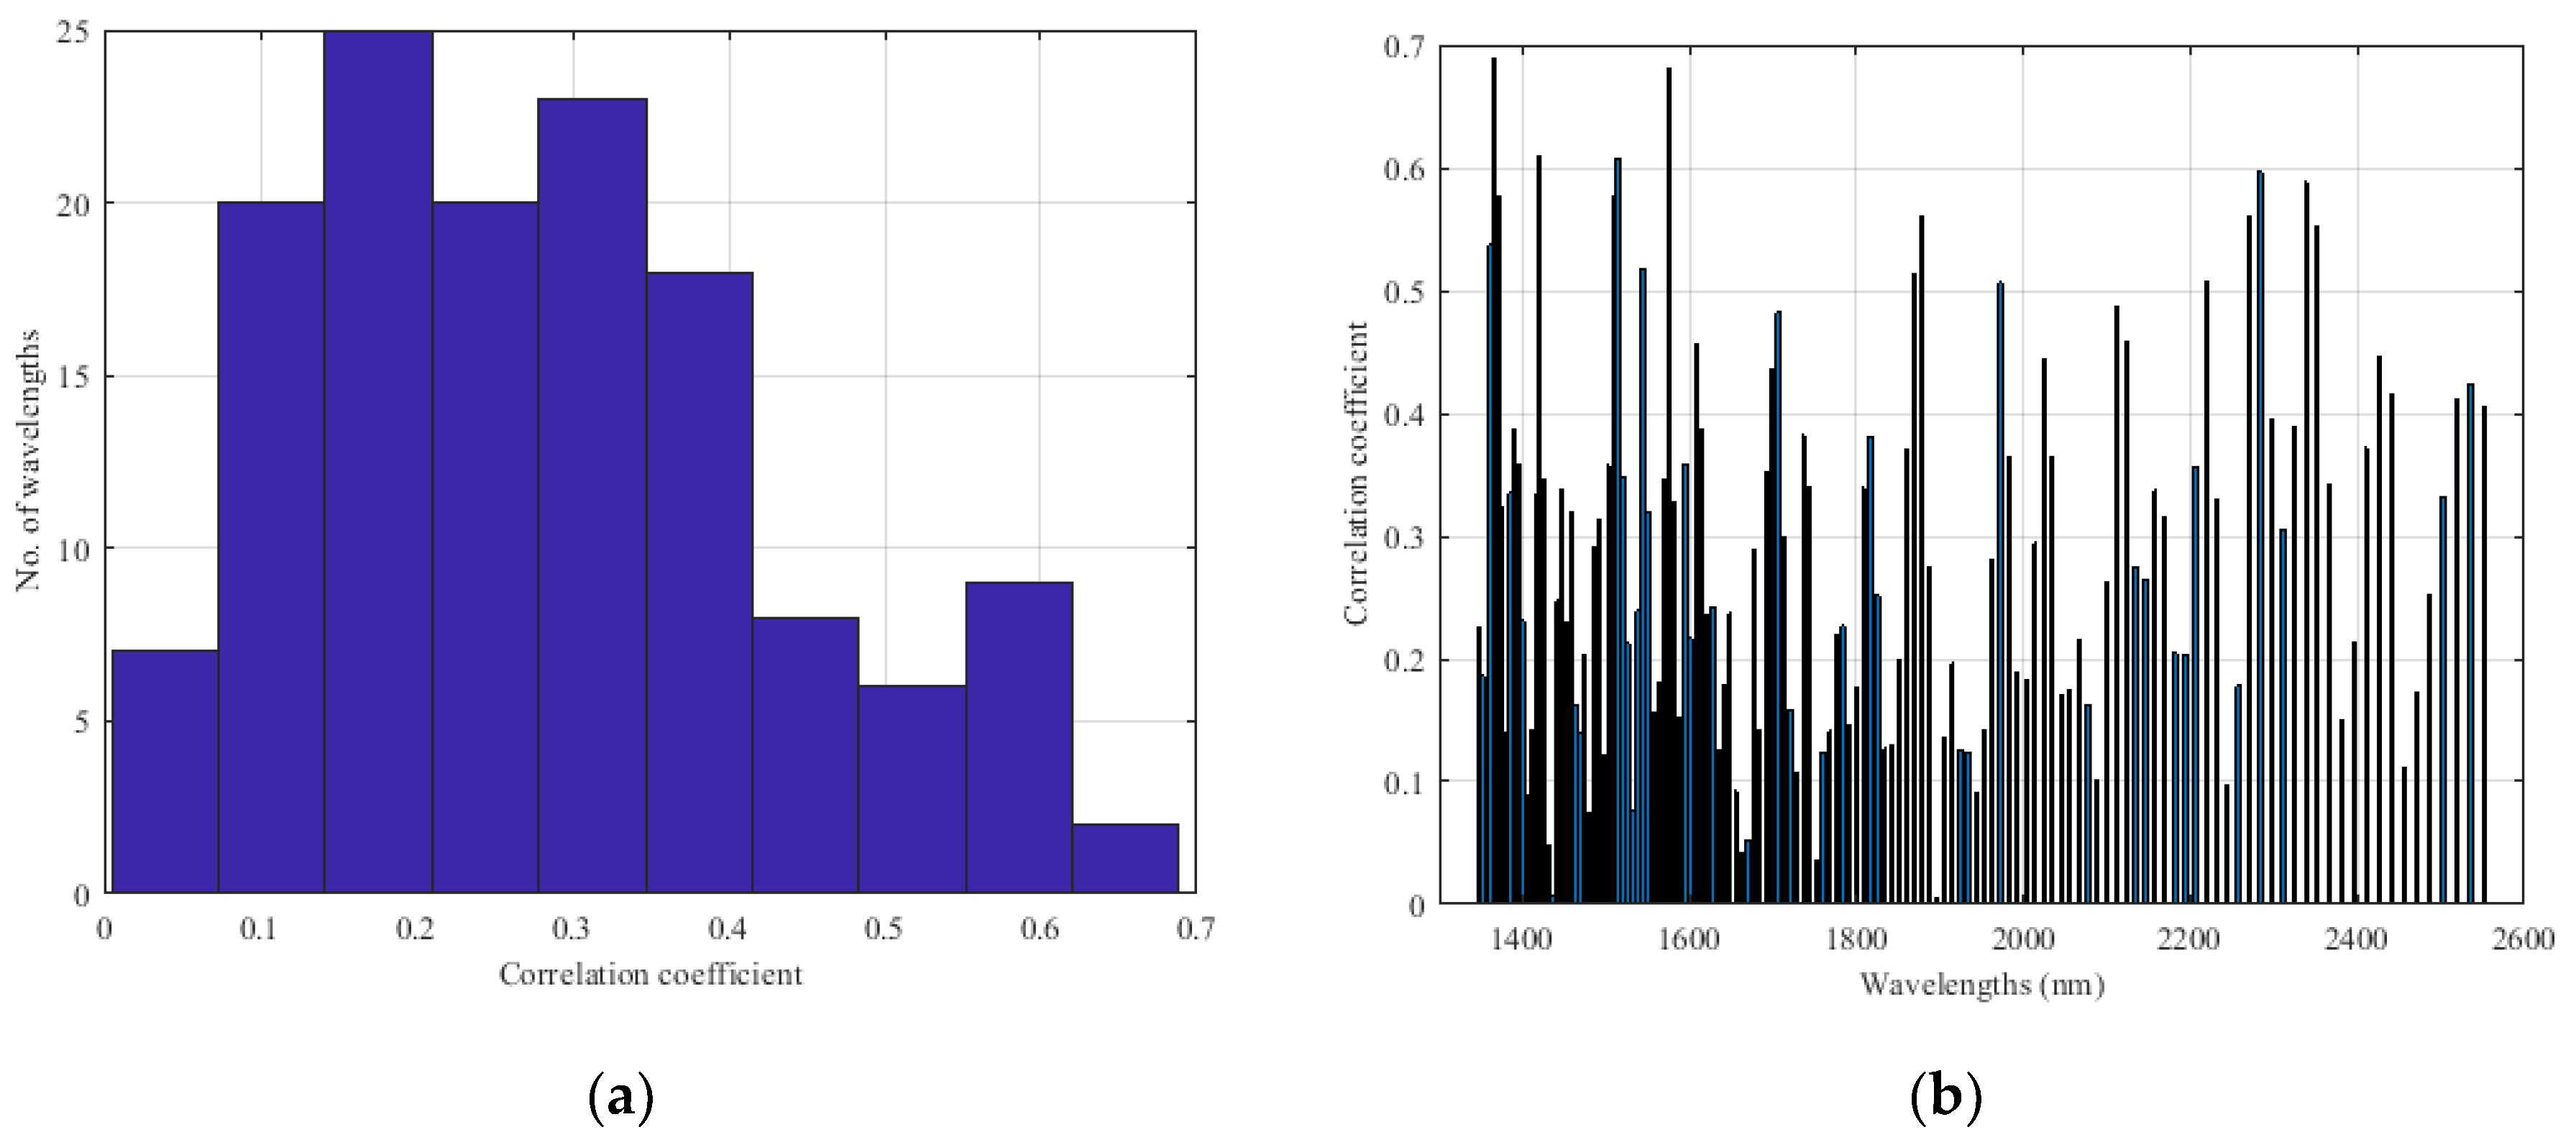
Figure A6.
Analysis of wavelength effectiveness in estimating moisture content of the wheat samples, by applying the MSC transformation: (a) Histogram of the Correlation Coefficients between NIR Wavelengths and Protein Content, (b) Correlation Coefficients for Each NIR Wavelength.
Figure A6.
Analysis of wavelength effectiveness in estimating moisture content of the wheat samples, by applying the MSC transformation: (a) Histogram of the Correlation Coefficients between NIR Wavelengths and Protein Content, (b) Correlation Coefficients for Each NIR Wavelength.
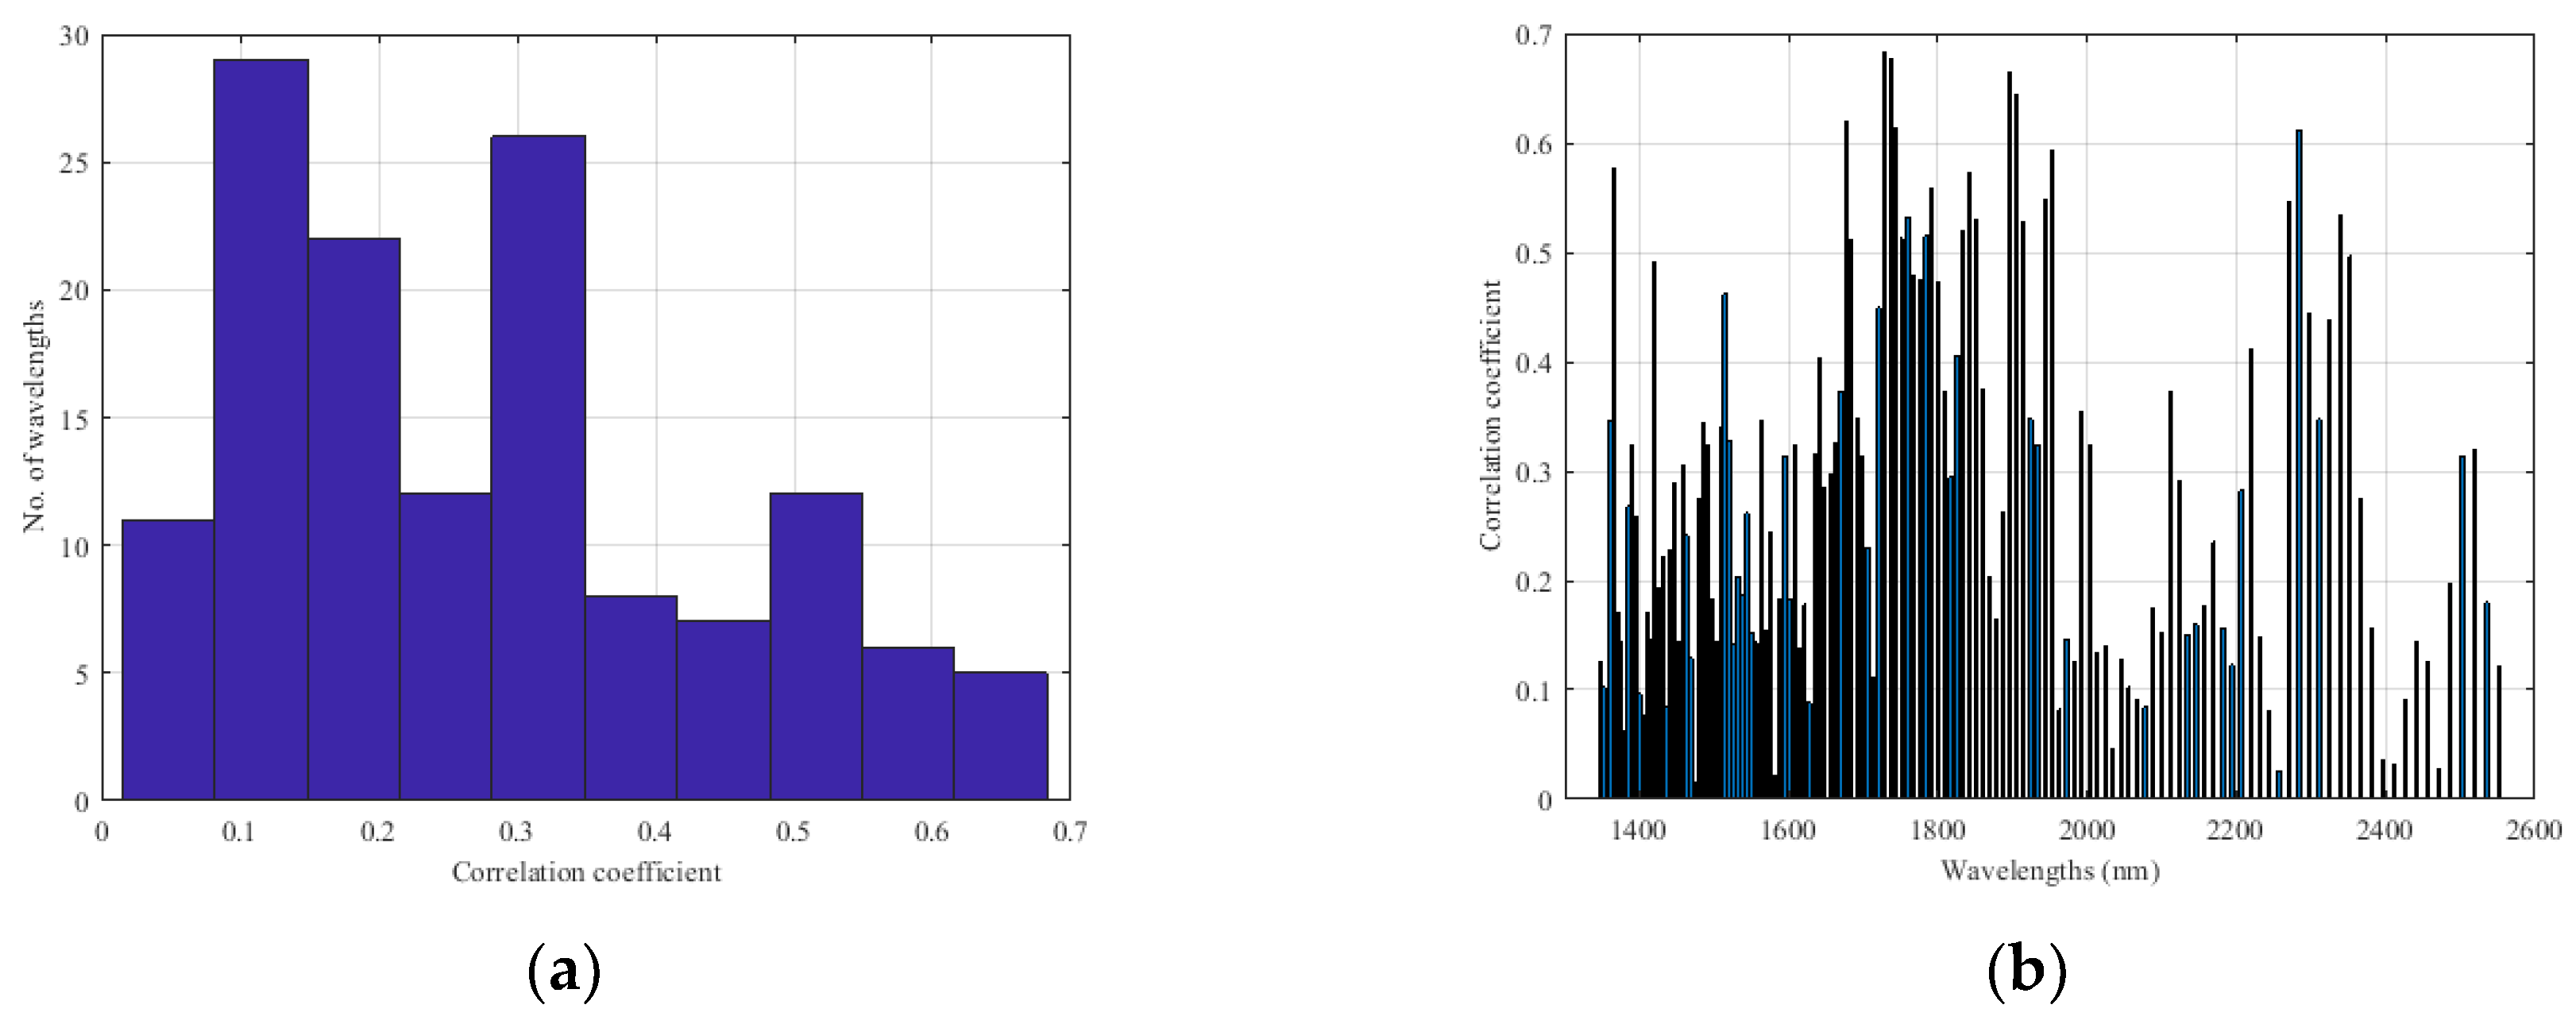
Figure A7.
Analysis of wavelength effectiveness in estimating moisture content of the wheat samples, by applying the MSC transformation and first-derivatives: (a) Histogram of the Correlation Coefficients between NIR Wavelengths and Protein Content, (b) Correlation Coefficients for Each NIR Wavelength.
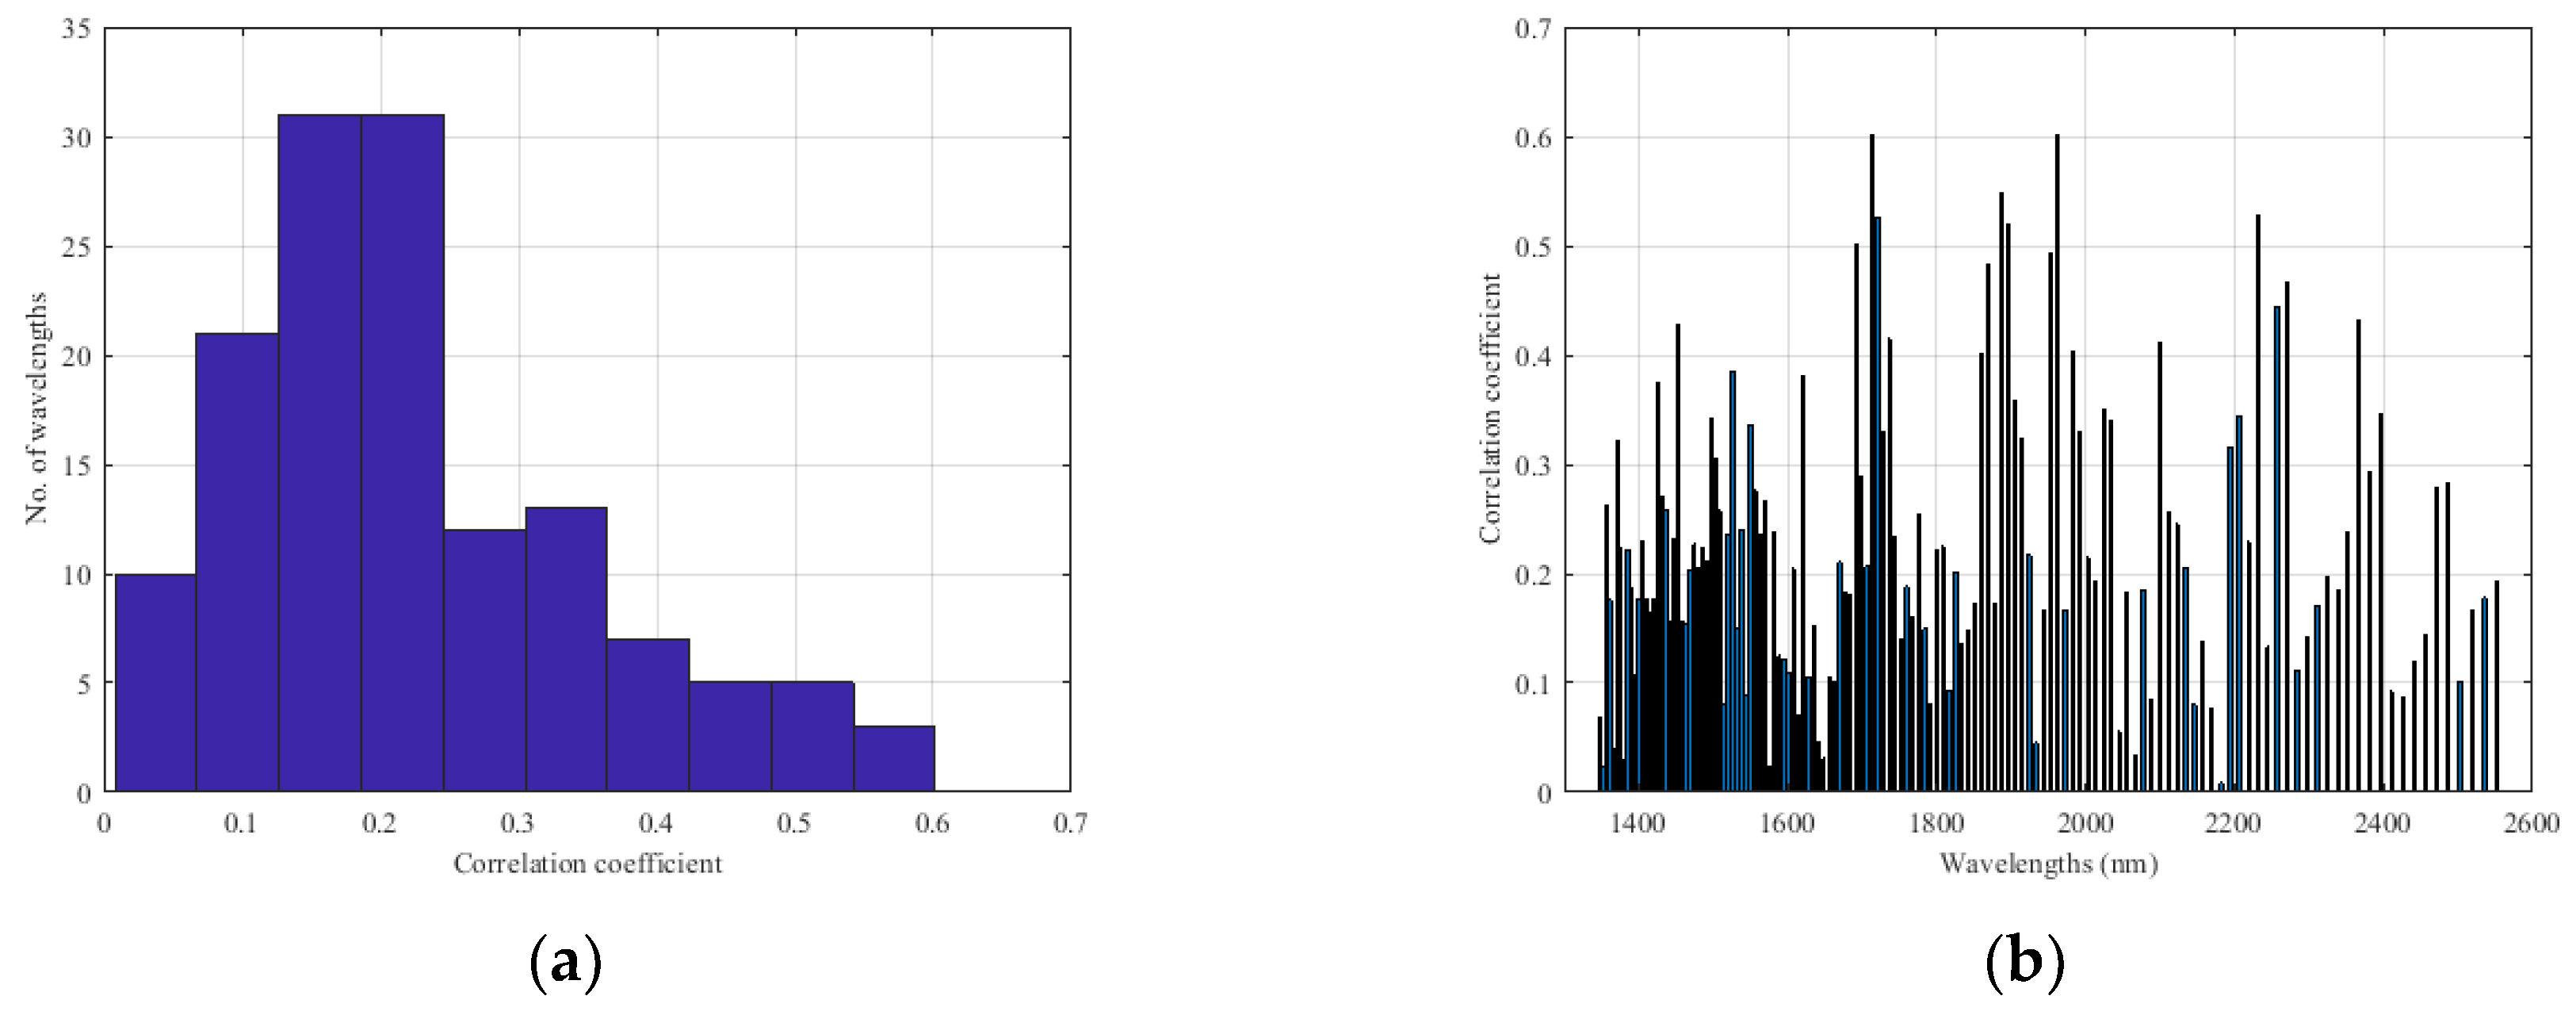
Figure A8.
Analysis of wavelength effectiveness in estimating moisture content of the wheat samples, by applying the MSC transformation, first-derivatives and smooth filter: (a) Histogram of the Correlation Coefficients between NIR Wavelengths and Protein Content, (b) Correlation Coefficients for Each NIR Wavelength.
Appendix B
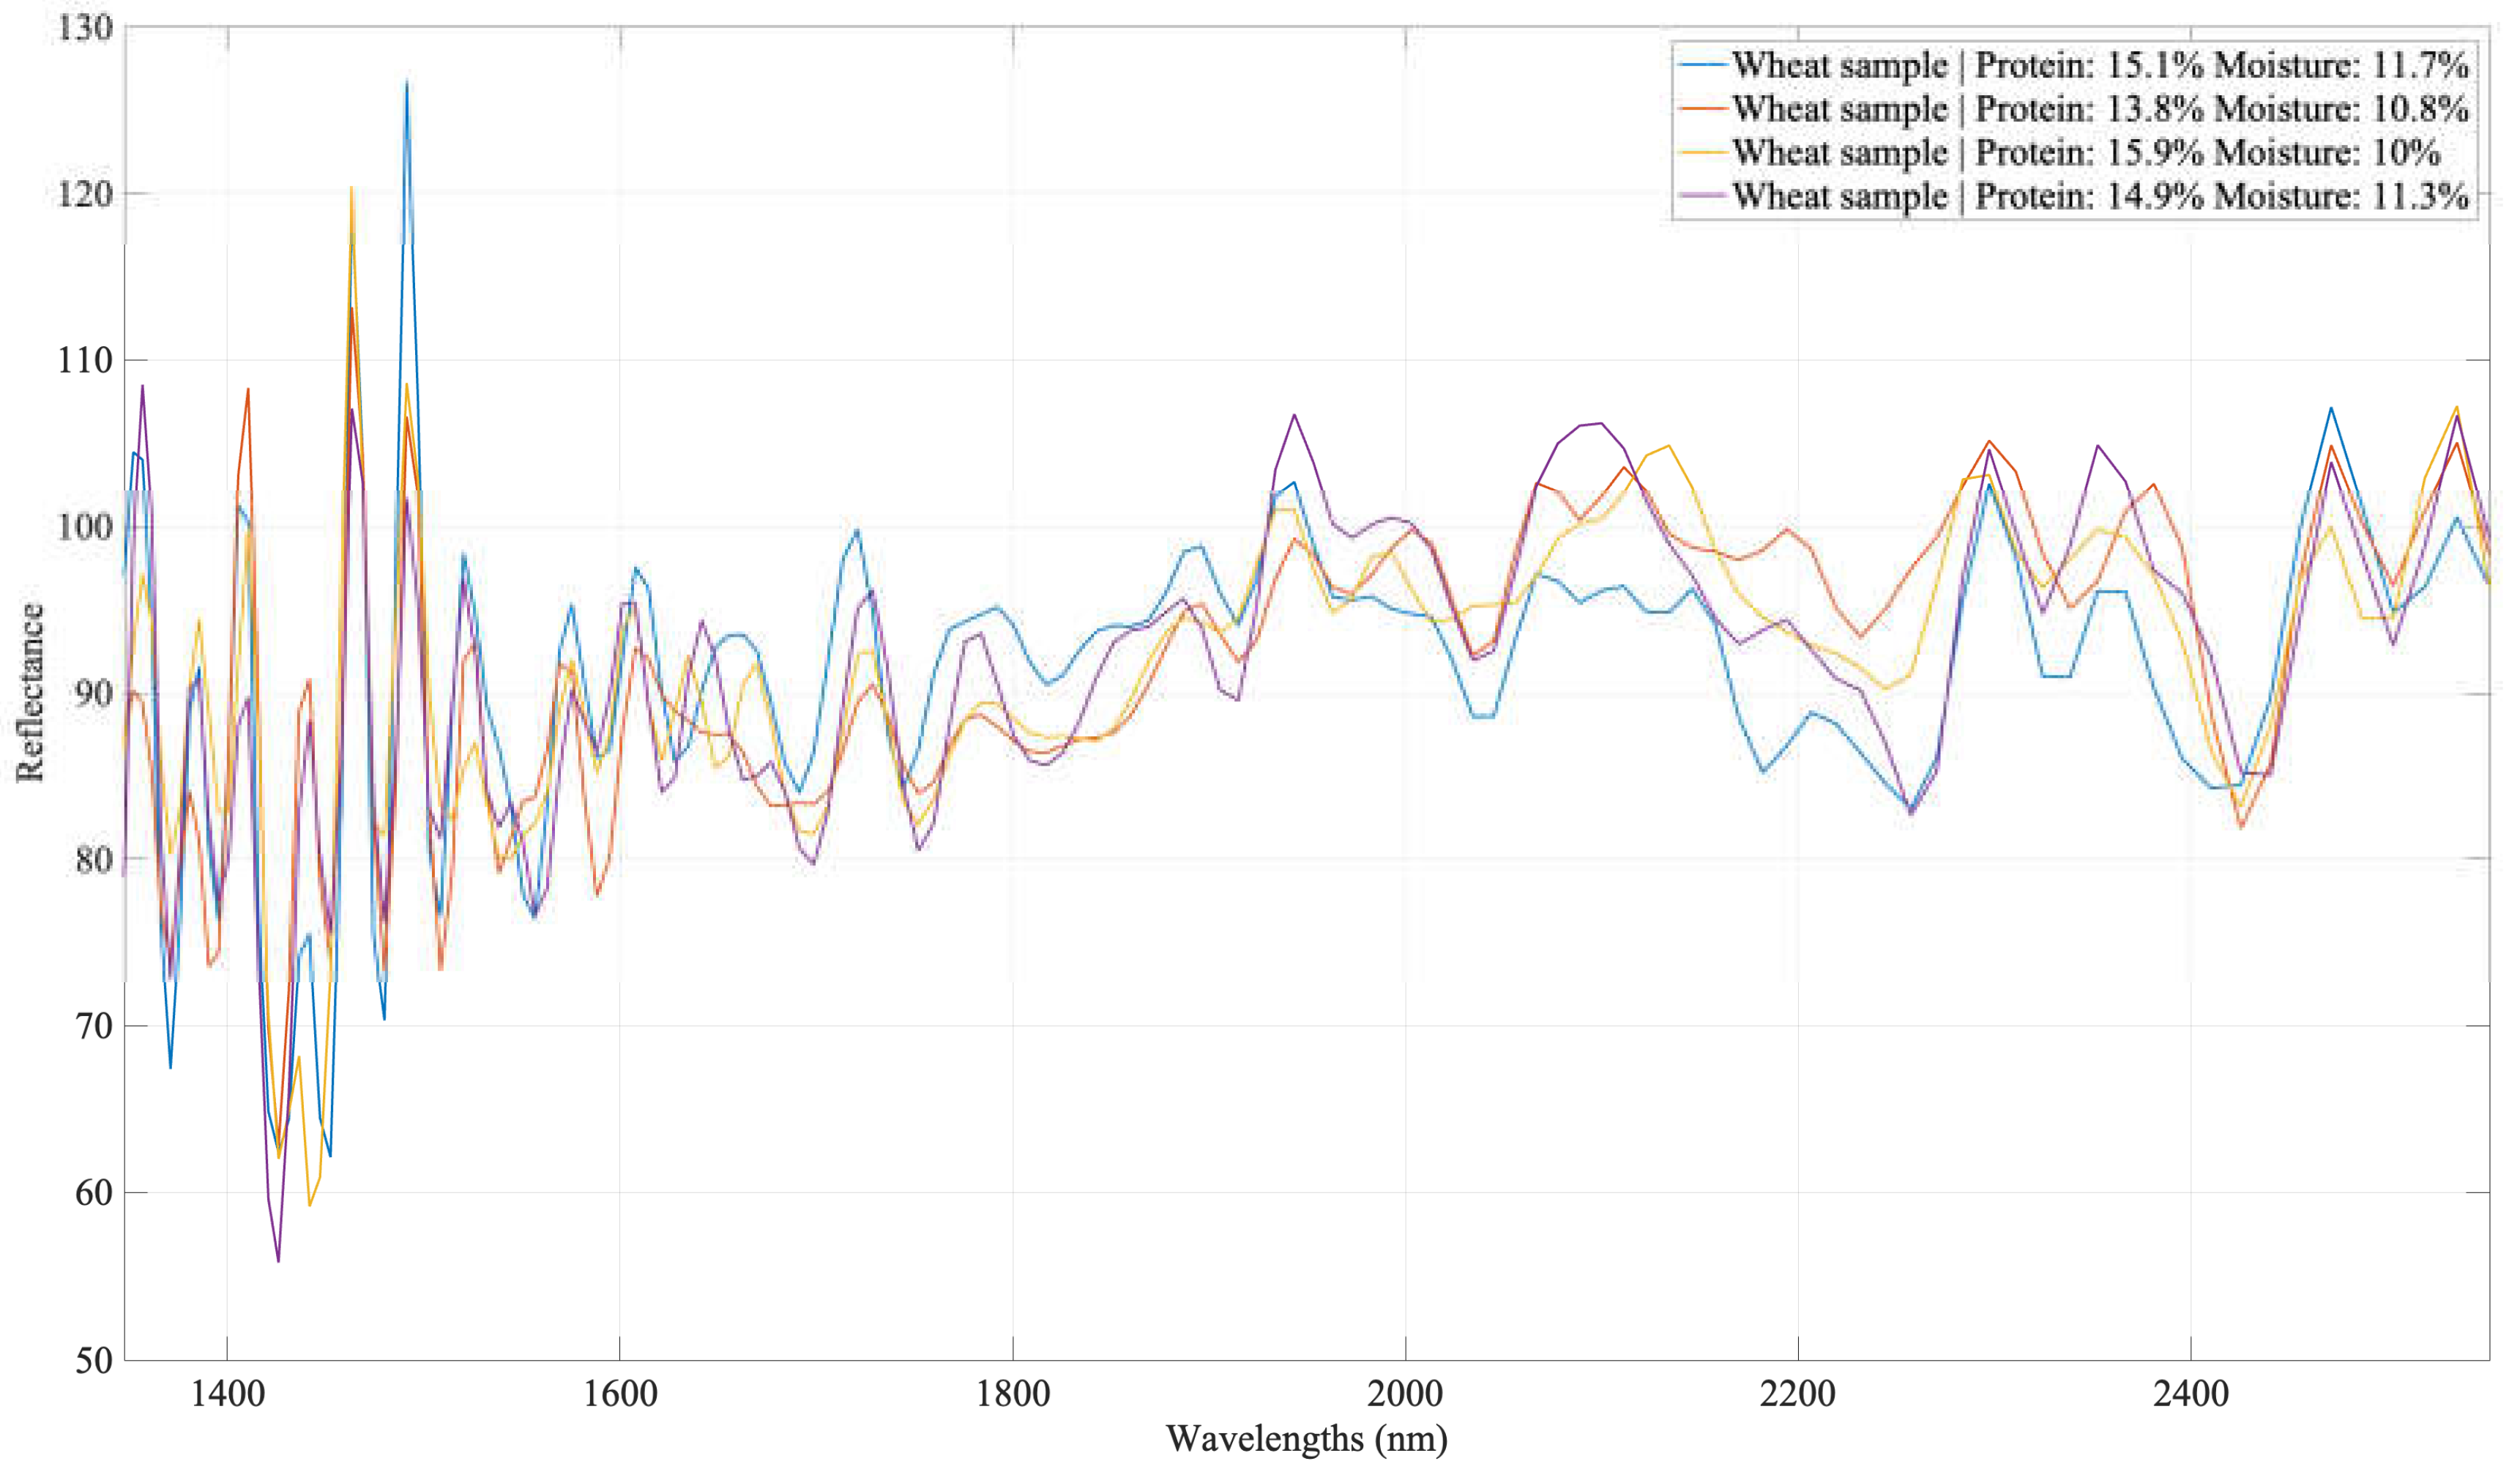
In Appendix B, Figure A9, NIR spectra are presented from four different cereal samples with varying protein and moisture parameters.
Figure A9.
Near-infrared spectra obtained from analysis of four different wheat samples.
References
- Miskelly, D.; Suter, D. Assessing and Managing Wheat-Flour Quality Before, During and After Milling. In Cereal Grains; Elsevier, 2017; pp. 607–634 ISBN 978-0-08-100719-8.
- Cappelli, A.; Oliva, N.; Cini, E. Stone Milling versus Roller Milling: A Systematic Review of the Effects on Wheat Flour Quality, Dough Rheology, and Bread Characteristics. Trends in Food Science & Technology 2020, 97, 147–155. [Google Scholar] [CrossRef]
- Doblado-Maldonado, A.F.; Flores, R.A.; Rose, D.J. Low Moisture Milling of Wheat for Quality Testing of Wholegrain Flour. Journal of Cereal Science 2013, 58, 420–423. [Google Scholar] [CrossRef]
- Cozzolino, D. The Ability of Near Infrared (NIR) Spectroscopy to Predict Functional Properties in Foods: Challenges and Opportunities. Molecules 2021, 26, 6981. [Google Scholar] [CrossRef] [PubMed]
- Zhang, S.; Liu, S.; Shen, L.; Chen, S.; He, L.; Liu, A. Application of Near-Infrared Spectroscopy for the Nondestructive Analysis of Wheat Flour: A Review. Current Research in Food Science 2022, 5, 1305–1312. [Google Scholar] [CrossRef] [PubMed]
- Beć, K.B.; Grabska, J.; Huck, C.W. Principles and Applications of Miniaturized Near-Infrared (NIR) Spectrometers. Chemistry A European J 2021, 27, 1514–1532. [Google Scholar] [CrossRef]
- Dos Santos, C.A.T.; Lopo, M.; Páscoa, R.N.M.J.; Lopes, J.A. A Review on the Applications of Portable Near-Infrared Spectrometers in the Agro-Food Industry. Appl Spectrosc 2013, 67, 1215–1233. [Google Scholar] [CrossRef] [PubMed]
- Salgó, A.; Gergely, S. Analysis of Wheat Grain Development Using NIR Spectroscopy. Journal of Cereal Science 2012, 56, 31–38. [Google Scholar] [CrossRef]
- Delwiche, S.R. Protein Content of Single Kernels of Wheat by Near-Infrared Reflectance Spectroscopy. Journal of Cereal Science 1998, 27, 241–254. [Google Scholar] [CrossRef]
- Zhu, Z.; Li, T.; Cui, J.; Shi, X.; Chen, J.; Wang, H. Non-Destructive Estimation of Winter Wheat Leaf Moisture Content Using near-Ground Hyperspectral Imaging Technology. Acta Agriculturae Scandinavica, Section B — Soil & Plant Science 2020, 70, 294–306. [Google Scholar] [CrossRef]
- Liu, R.; Liu, J.; Liu, C. Determination of Protein Content of Wheat Using Partial Least Squares Regression Based on Near-Infrared Spectroscopy Preprocessing. In Proceedings of the 2022 4th International Conference on Robotics and Computer Vision (ICRCV); IEEE: Wuhan, China, September 25, 2022; pp. 7–10. [Google Scholar]
- Chadalavada, K.; Anbazhagan, K.; Ndour, A.; Choudhary, S.; Palmer, W.; Flynn, J.R.; Mallayee, S.; Pothu, S.; Prasad, K.V.S.V.; Varijakshapanikar, P.; et al. NIR Instruments and Prediction Methods for Rapid Access to Grain Protein Content in Multiple Cereals. Sensors 2022, 22, 3710. [Google Scholar] [CrossRef]
- Lin, C.; Chen, X.; Jian, L.; Shi, C.; Jin, X.; Zhang, G. Determination of Grain Protein Content by Near-Infrared Spectrometry and Multivariate Calibration in Barley. Food Chemistry 2014, 162, 10–15. [Google Scholar] [CrossRef] [PubMed]
- Golea, C.M.; Codină, G.G.; Oroian, M. Prediction of Wheat Flours Composition Using Fourier Transform Infrared Spectrometry (FT-IR). Food Control 2023, 143, 109318. [Google Scholar] [CrossRef]
- Liu, C.; Yang, S.X.; Li, X.; Xu, L.; Deng, L. Noise Level Penalizing Robust Gaussian Process Regression for NIR Spectroscopy Quantitative Analysis. Chemometrics and Intelligent Laboratory Systems 2020, 201, 104014. [Google Scholar] [CrossRef]
- Liu, Y.; Liu, Y.; Chen, Y.; Zhang, Y.; Shi, T.; Wang, J.; Hong, Y.; Fei, T.; Zhang, Y. The Influence of Spectral Pretreatment on the Selection of Representative Calibration Samples for Soil Organic Matter Estimation Using Vis-NIR Reflectance Spectroscopy. Remote Sensing 2019, 11, 450. [Google Scholar] [CrossRef]
- Mishra, P.; Lohumi, S. Improved Prediction of Protein Content in Wheat Kernels with a Fusion of Scatter Correction Methods in NIR Data Modelling. Biosystems Engineering 2021, 203, 93–97. [Google Scholar] [CrossRef]
- Schuster, C.; Huen, J.; Scherf, K.A. Prediction of Wheat Gluten Composition via Near-Infrared Spectroscopy. Current Research in Food Science 2023, 6, 100471. [Google Scholar] [CrossRef]
- Basile, T.; Marsico, A.D.; Cardone, M.F.; Antonacci, D.; Perniola, R. FT-NIR Analysis of Intact Table Grape Berries to Understand Consumer Preference Driving Factors. Foods 2020, 9, 98. [Google Scholar] [CrossRef]
- Delwiche, S.R.; Reeves, J.B. A Graphical Method to Evaluate Spectral Preprocessing in Multivariate Regression Calibrations: Example with Savitzky—Golay Filters and Partial Least Squares Regression. Appl Spectrosc 2010, 64, 73–82. [Google Scholar] [CrossRef]
- Kosko, B. Fuzzy Cognitive Maps. International Journal of Man-Machine Studies 1986, 24, 65–75. [Google Scholar] [CrossRef]
- Papageorgiou, E.I.; Salmeron, J.L. A Review of Fuzzy Cognitive Maps Research During the Last Decade. IEEE Trans. Fuzzy Syst. 2013, 21, 66–79. [Google Scholar] [CrossRef]
- Boglou, V.; Karavas, C.; Karlis, A.; Arvanitis, K. An Intelligent Decentralized Energy Management Strategy for the Optimal Electric Vehicles’ Charging in Low-voltage Islanded Microgrids. Intl J of Energy Research 2022, 46, 2988–3016. [Google Scholar] [CrossRef]
- Karavas, C.-S.; Kyriakarakos, G.; Arvanitis, K.G.; Papadakis, G. A Multi-Agent Decentralized Energy Management System Based on Distributed Intelligence for the Design and Control of Autonomous Polygeneration Microgrids. Energy Conversion and Management 2015, 103, 166–179. [Google Scholar] [CrossRef]
- Karlis, A.D.; Kottas, T.L.; Boutalis, Y.S. A Novel Maximum Power Point Tracking Method for PV Systems Using Fuzzy Cognitive Networks (FCN). Electric Power Systems Research 2007, 77, 315–327. [Google Scholar] [CrossRef]
Figure 1.
Capturing the spectral profiles of wheat samples within the experimental setup.
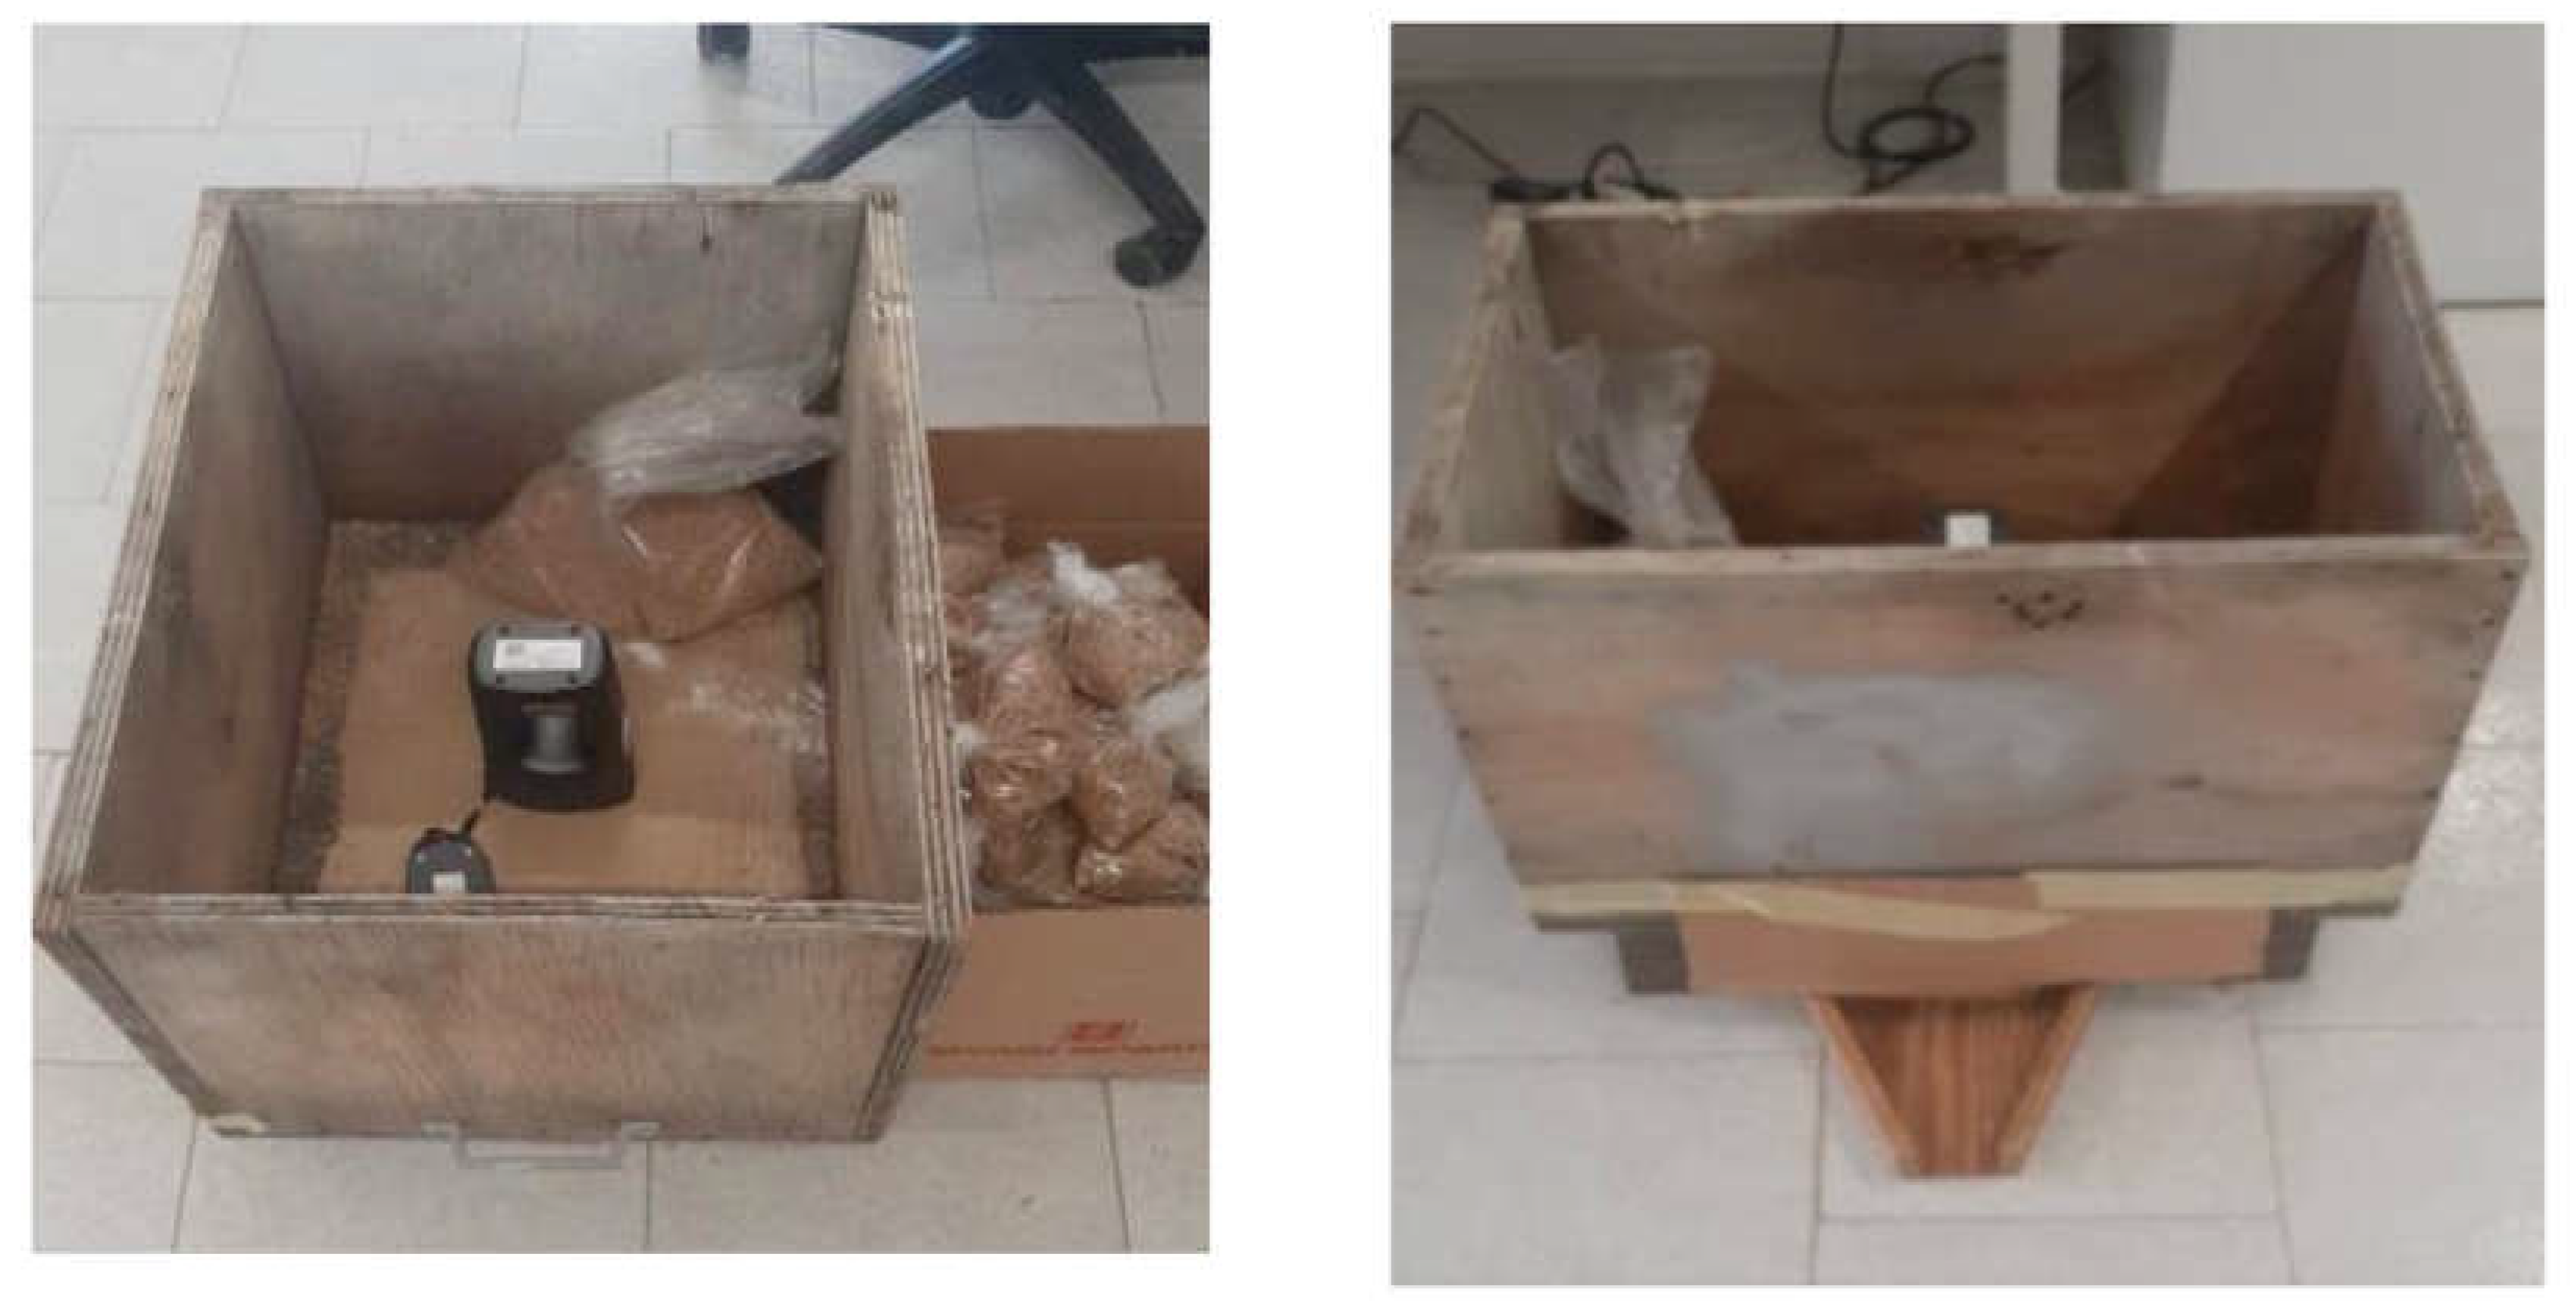
Figure 2.
Exploration process of the correlation between NIR Spectra and Estimation Parameters.
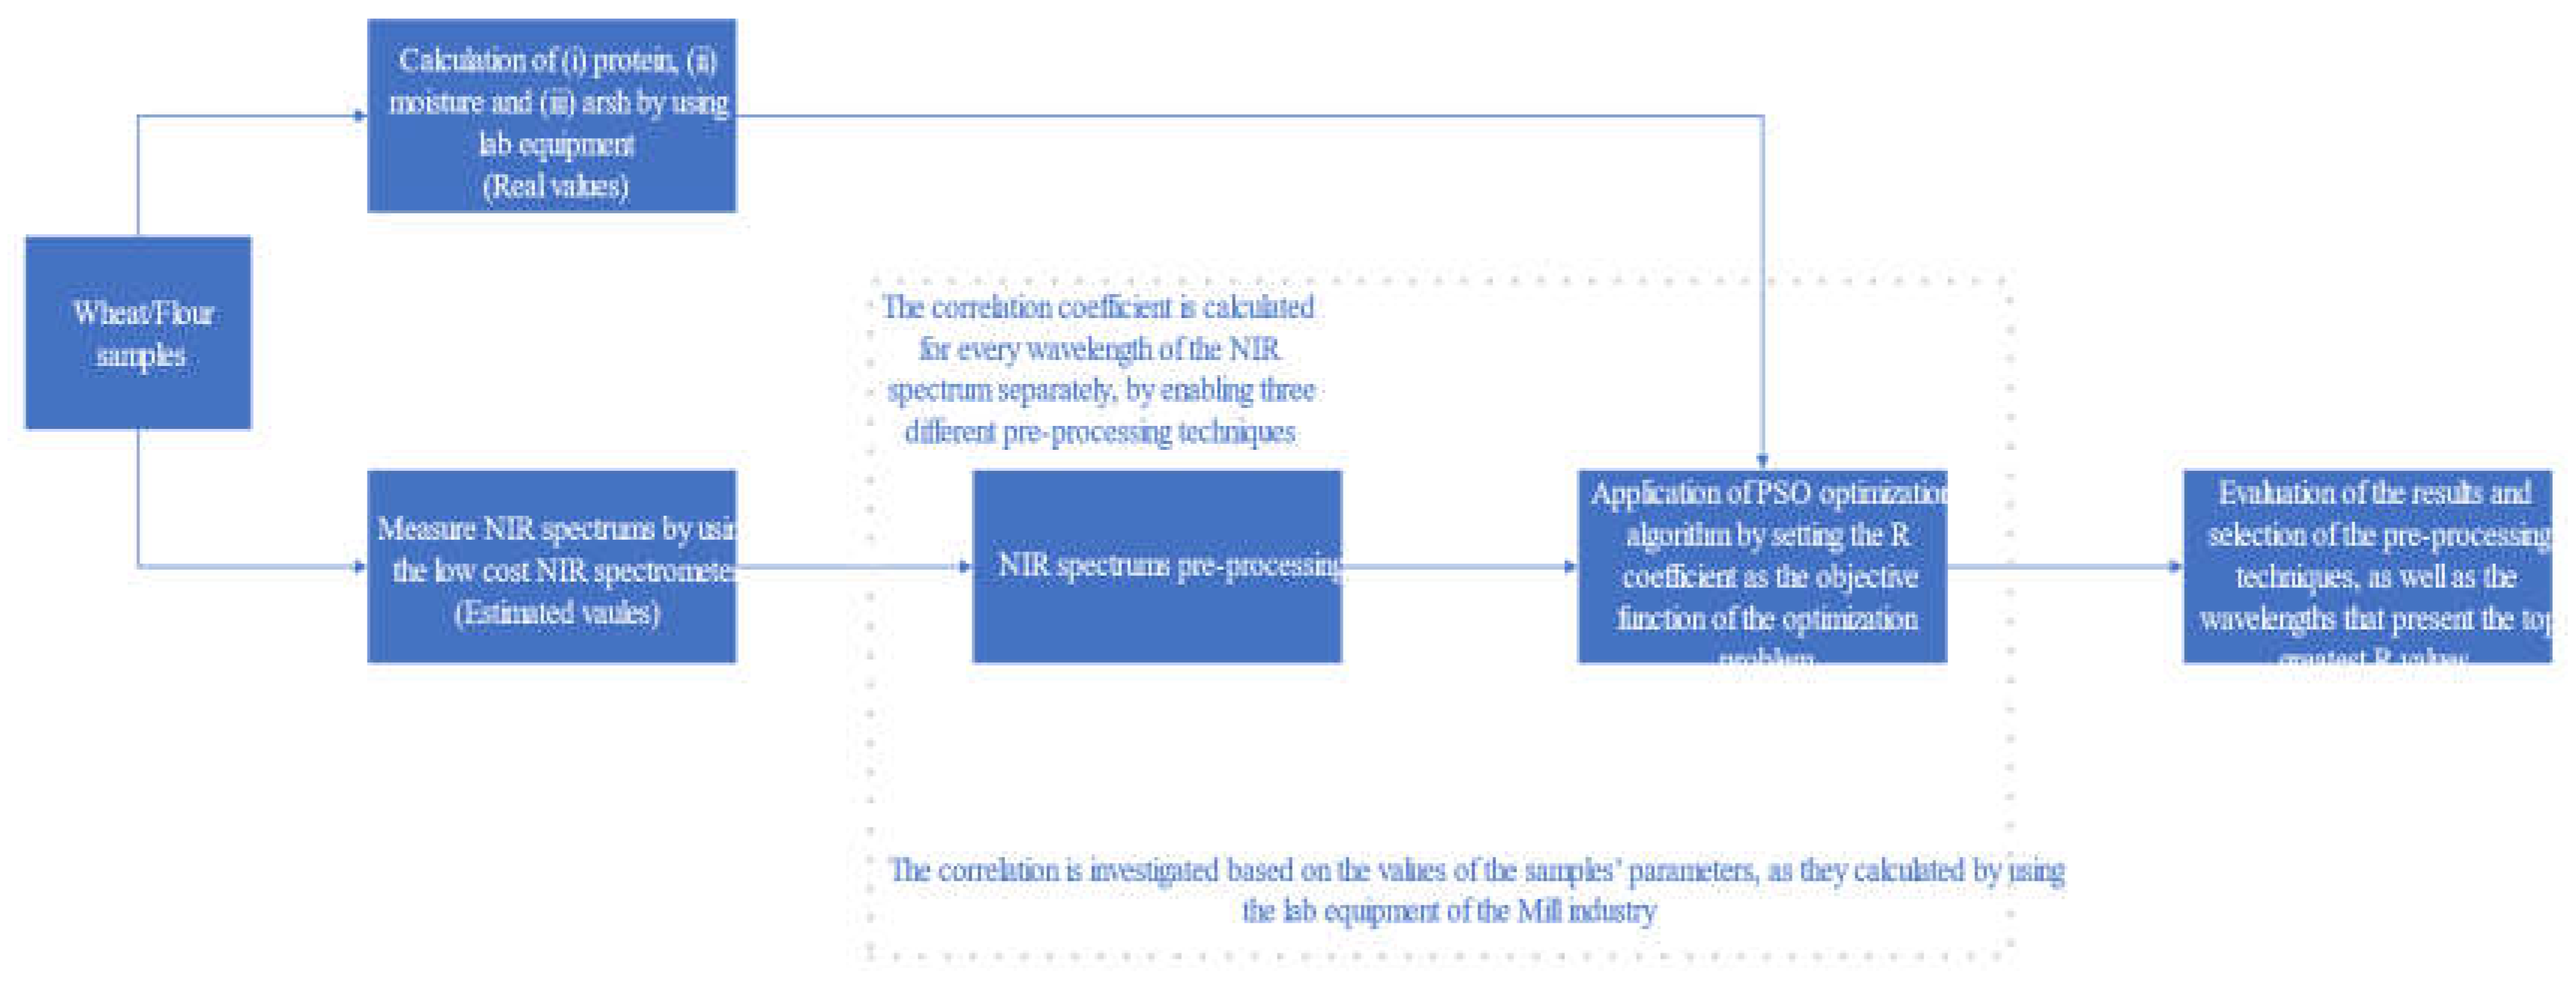
Figure 3.
Assumed relation between the wavelengths of the NIR spectra and the samples parameters to be estimated.
Figure 3.
Assumed relation between the wavelengths of the NIR spectra and the samples parameters to be estimated.
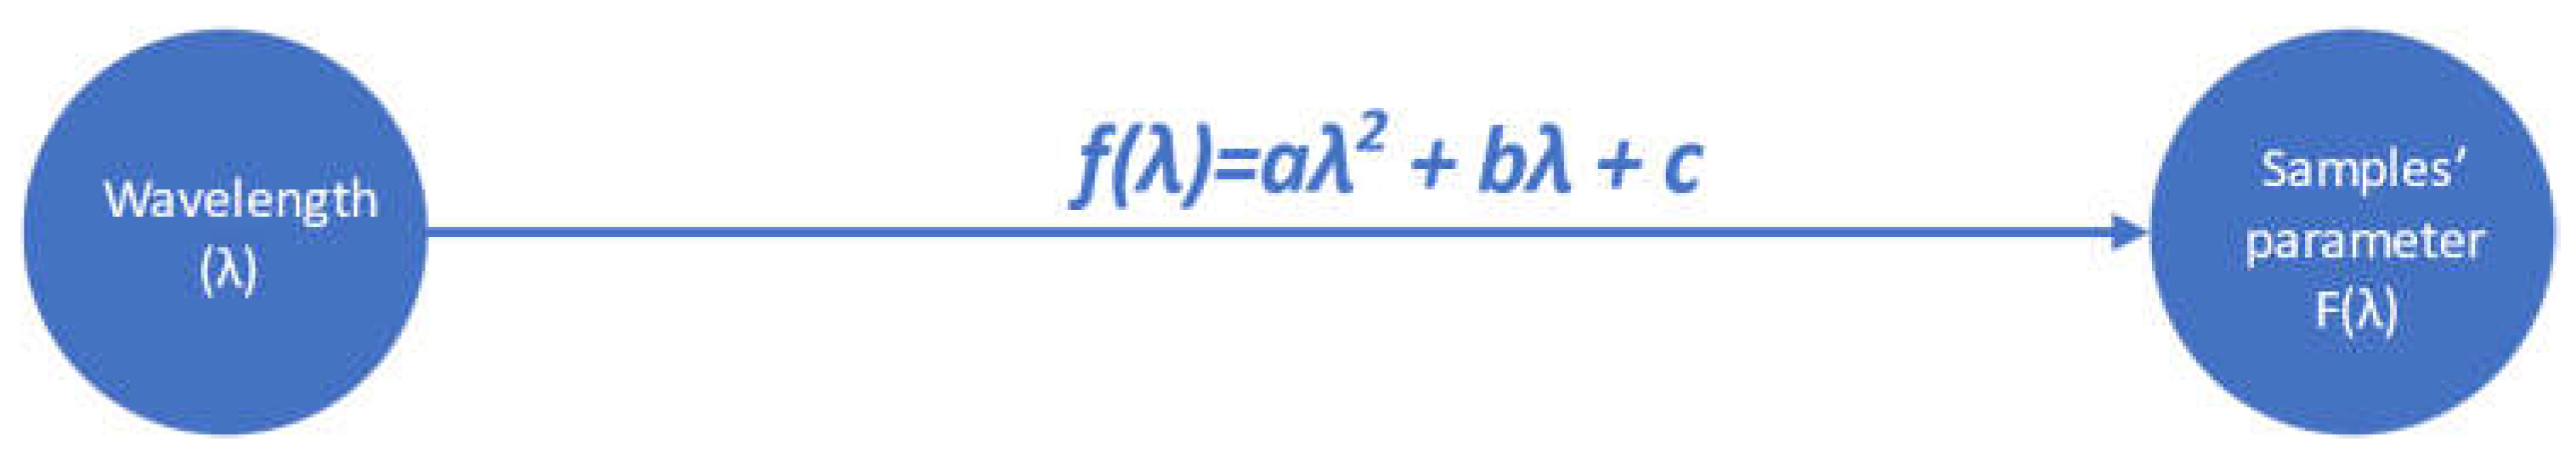
Figure 4.
A preprocessed NIR signal, after the application of MSC transformation.
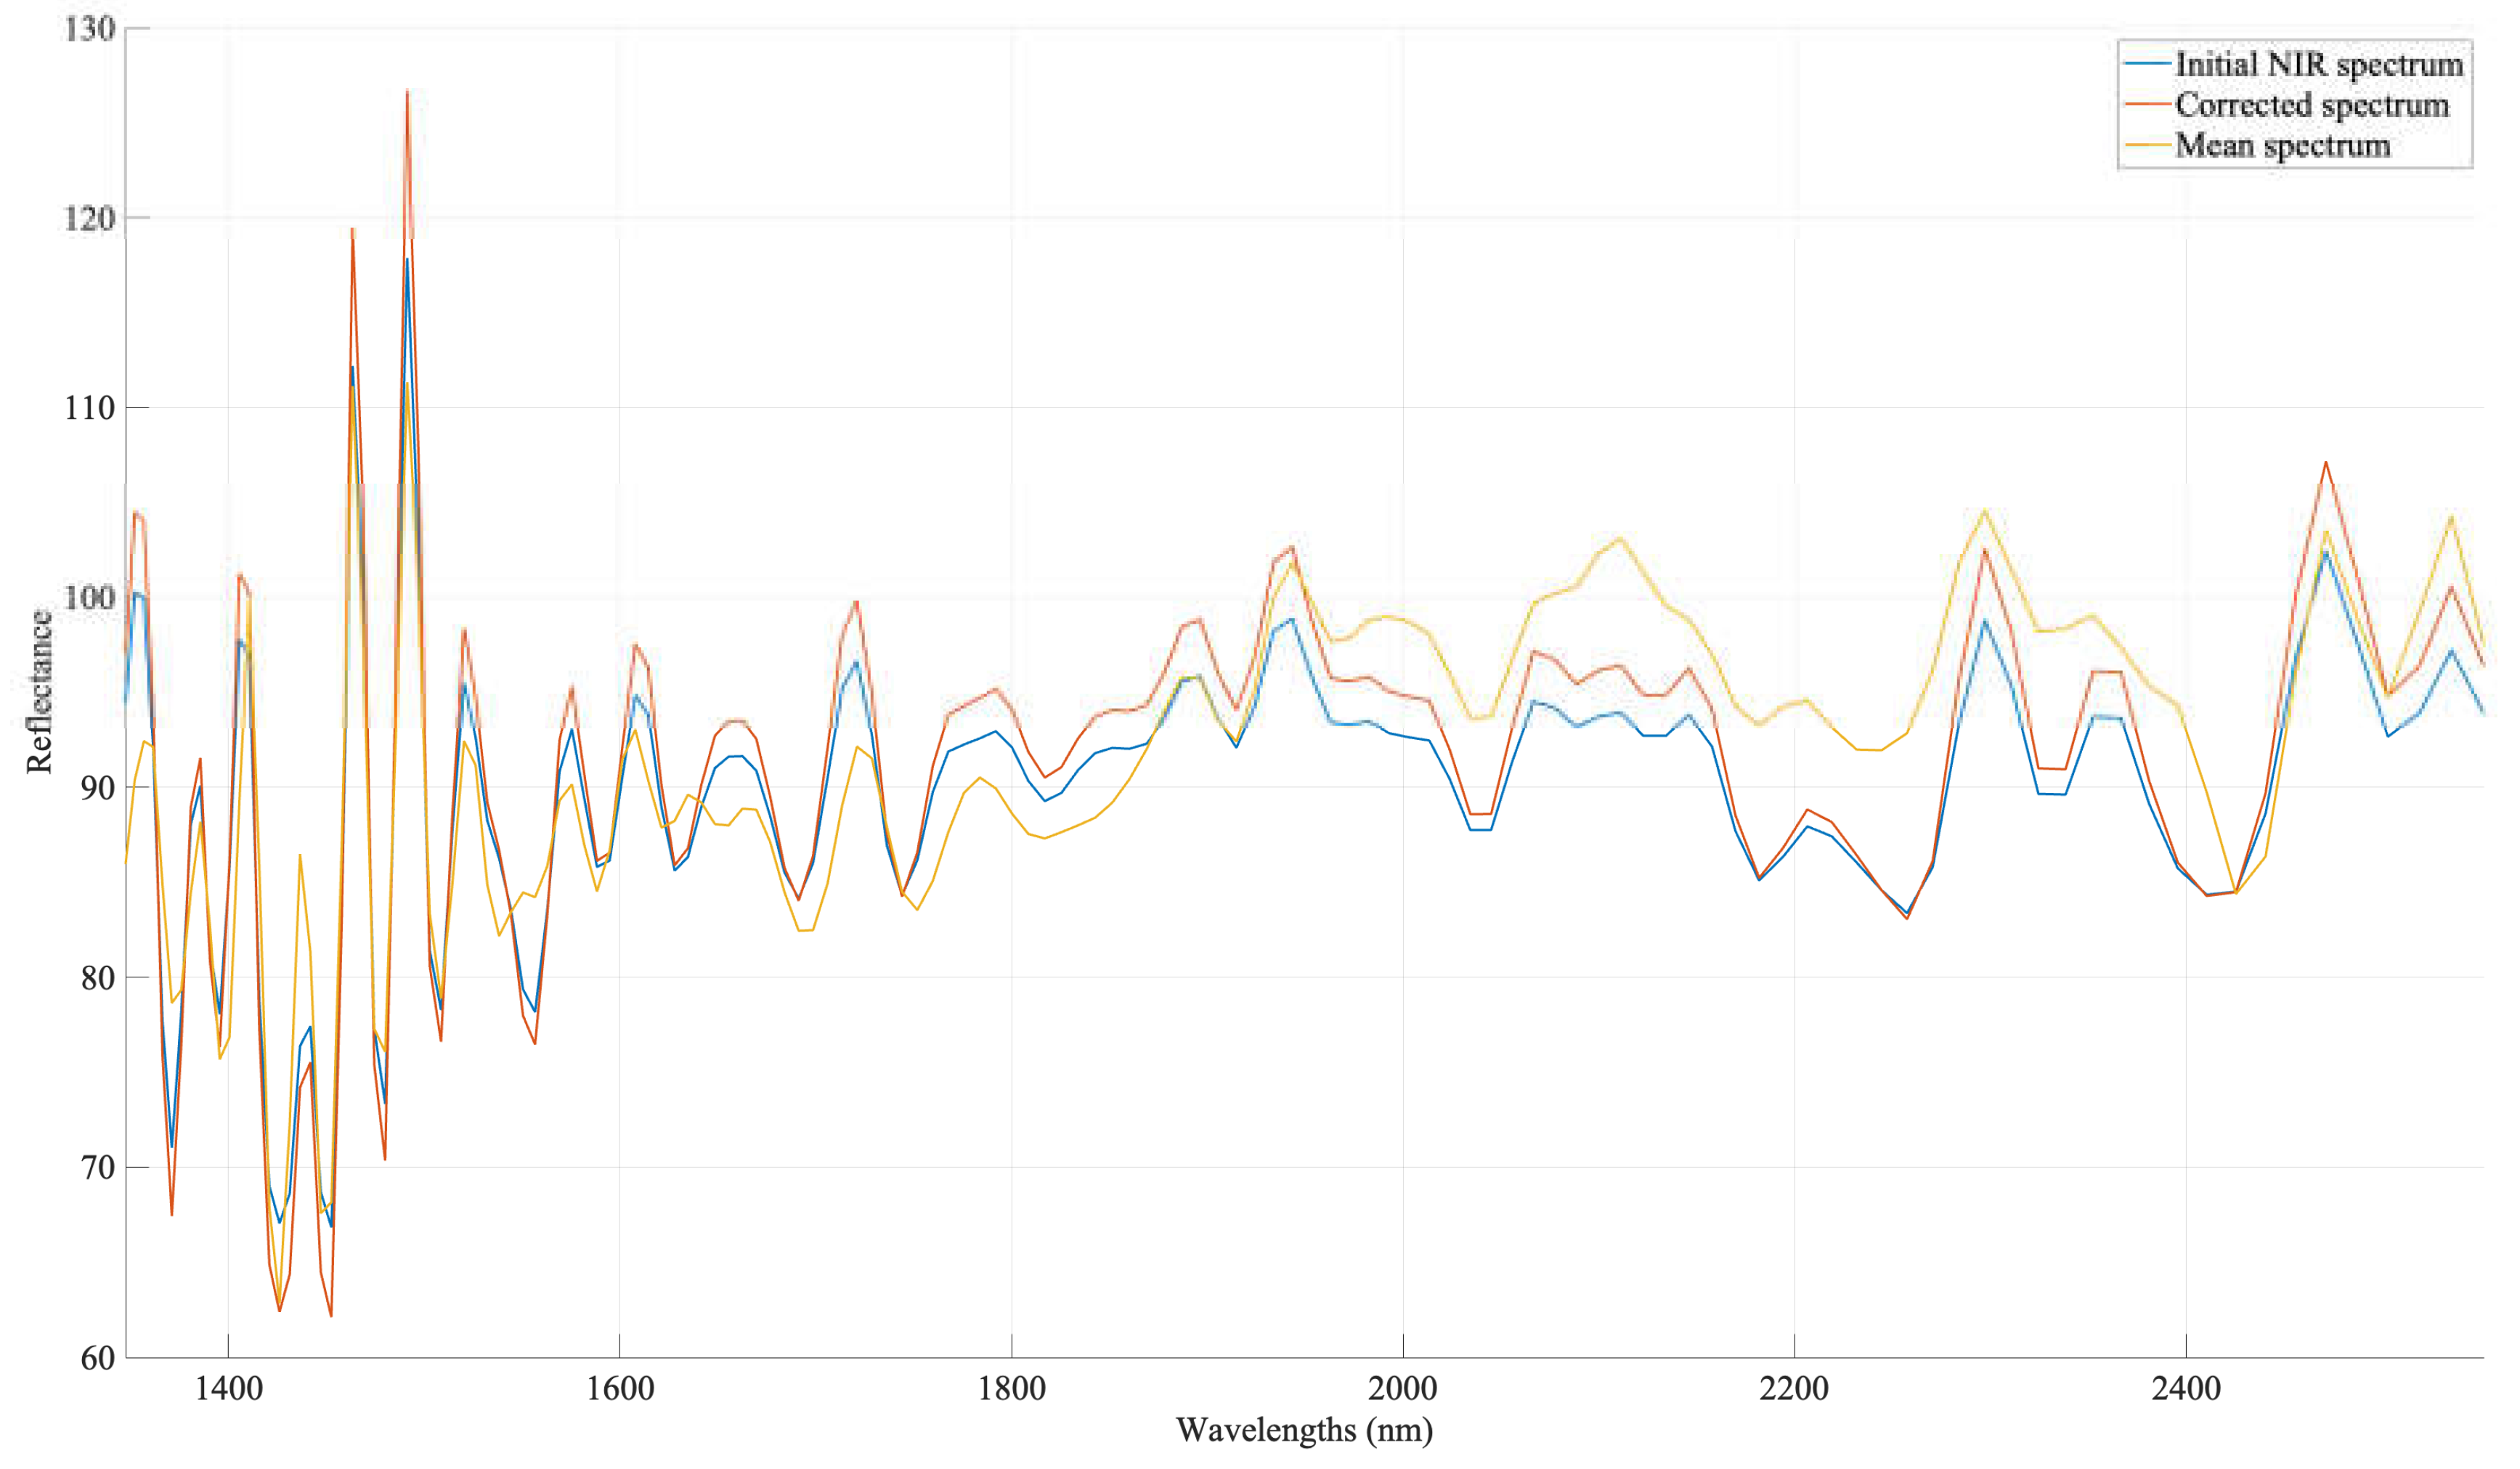
Figure 5.
NIR spectrum of a wheat sample, captured by the NeoSpectra scanner, and its first derivatives signal.
Figure 5.
NIR spectrum of a wheat sample, captured by the NeoSpectra scanner, and its first derivatives signal.
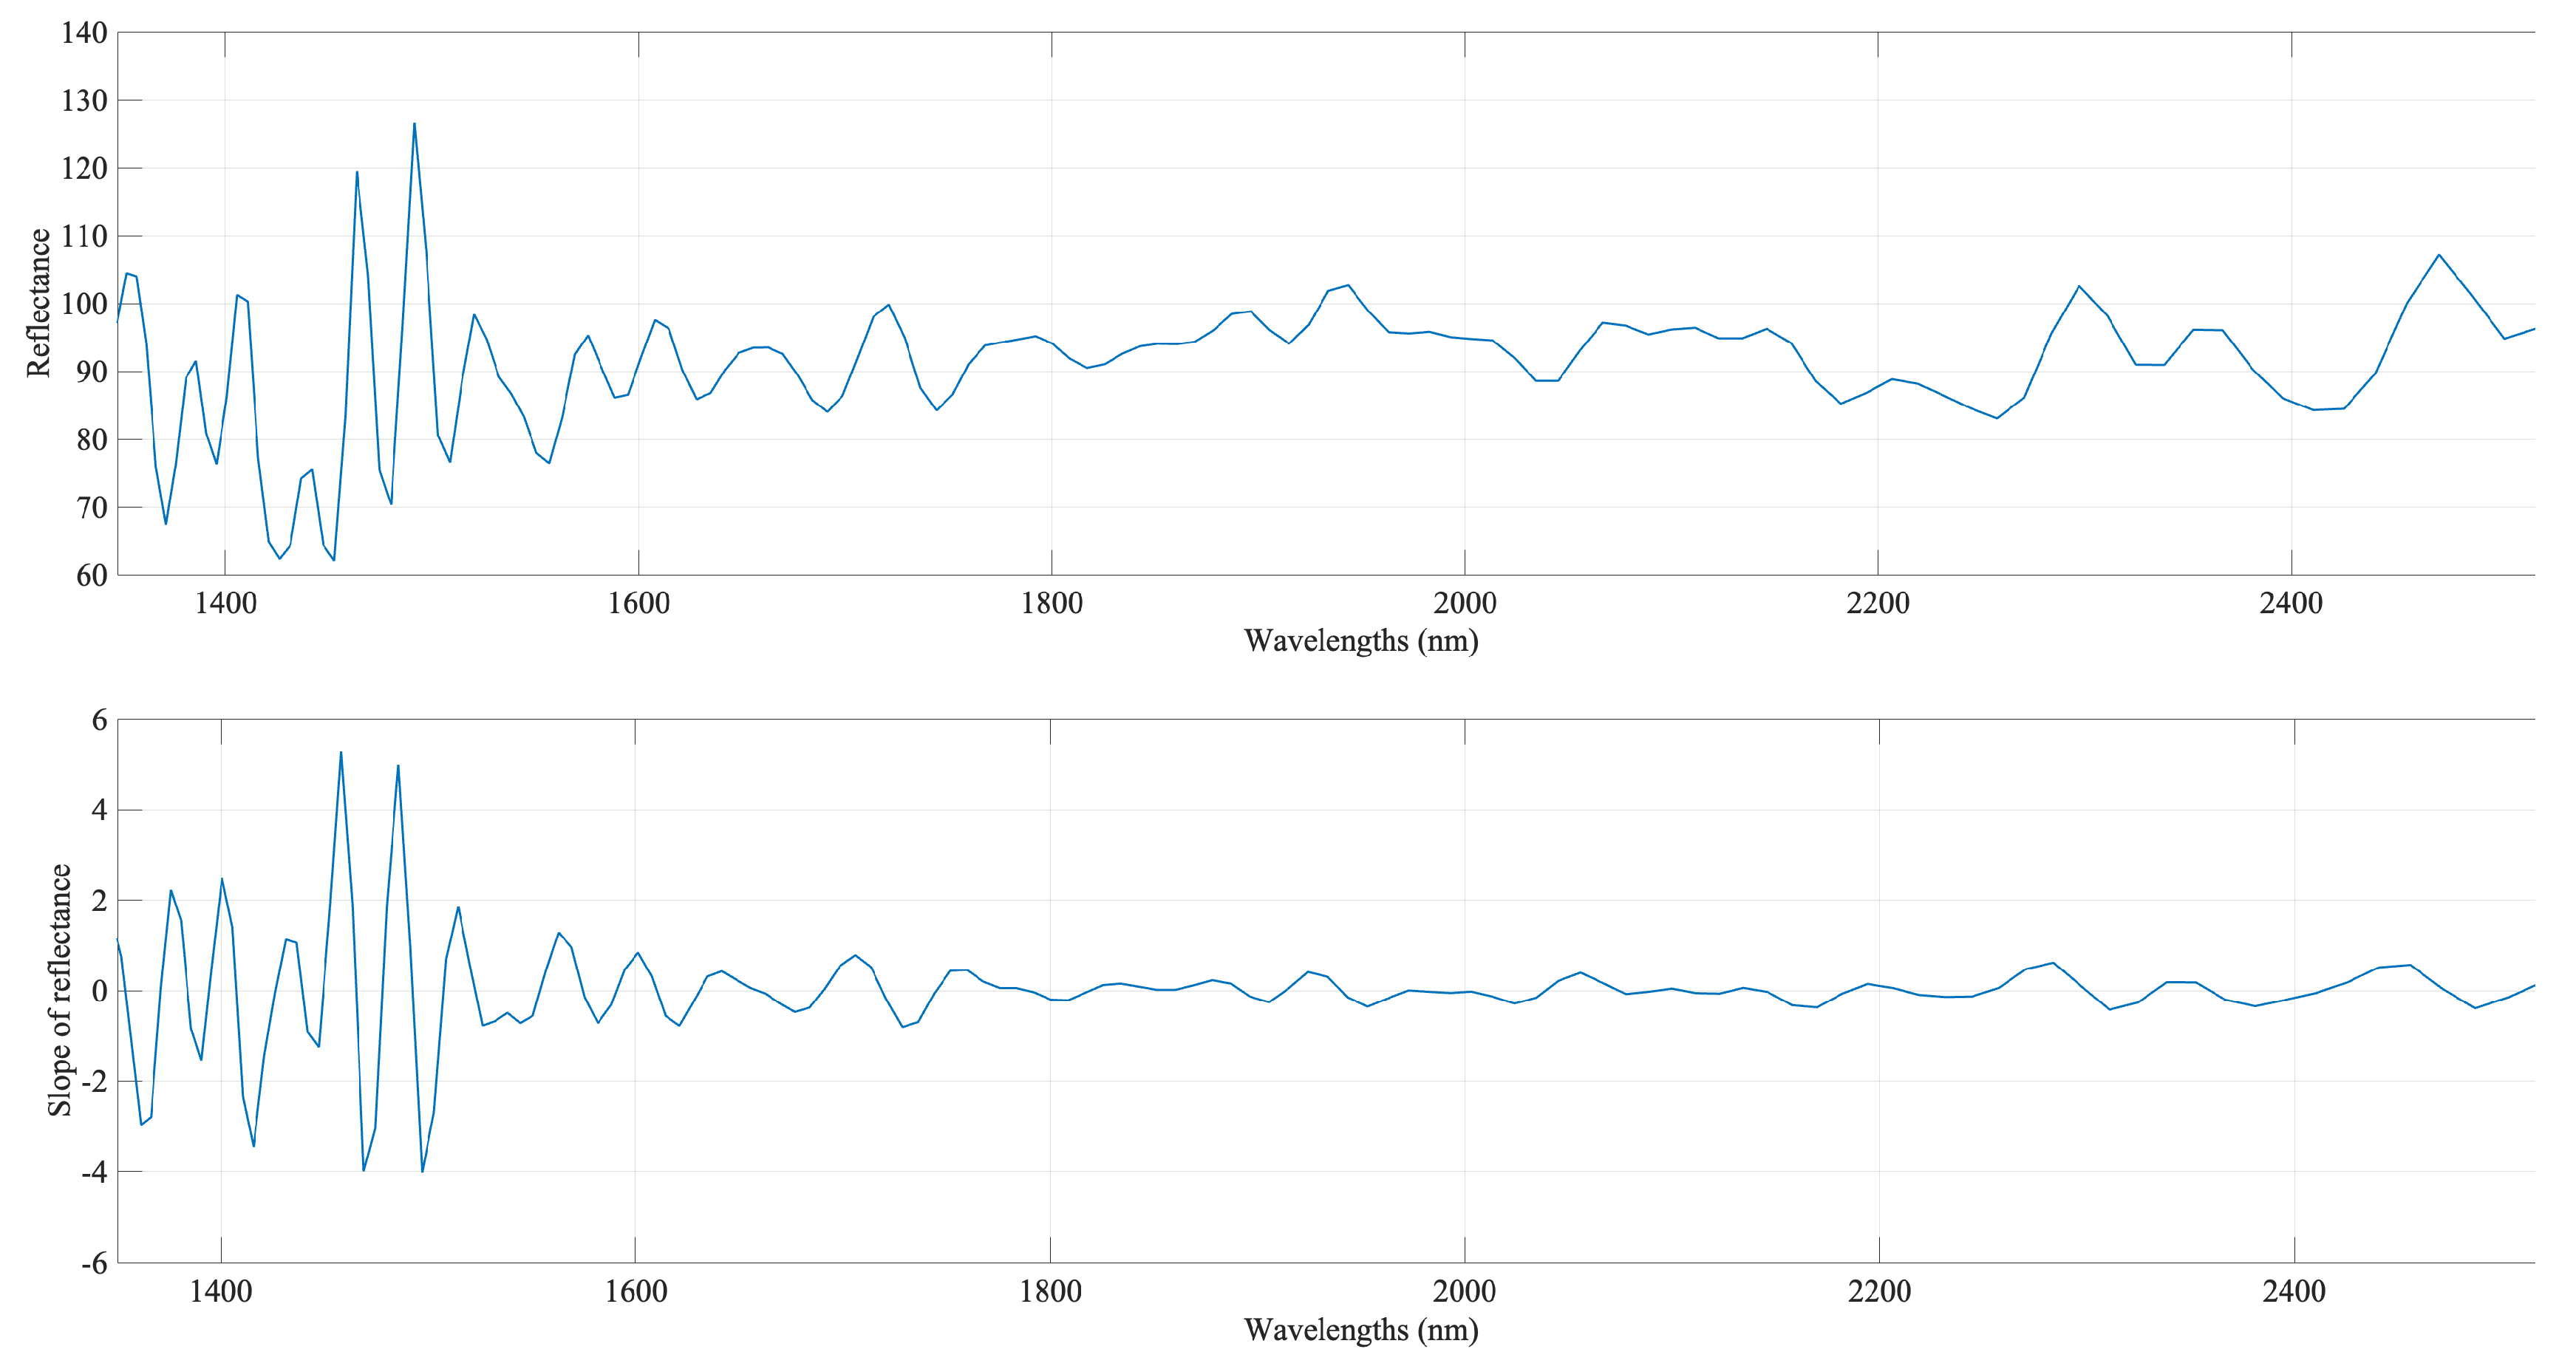
Figure 6.
Smoothing filter to a first derivatives signal of a NIR spectrum.
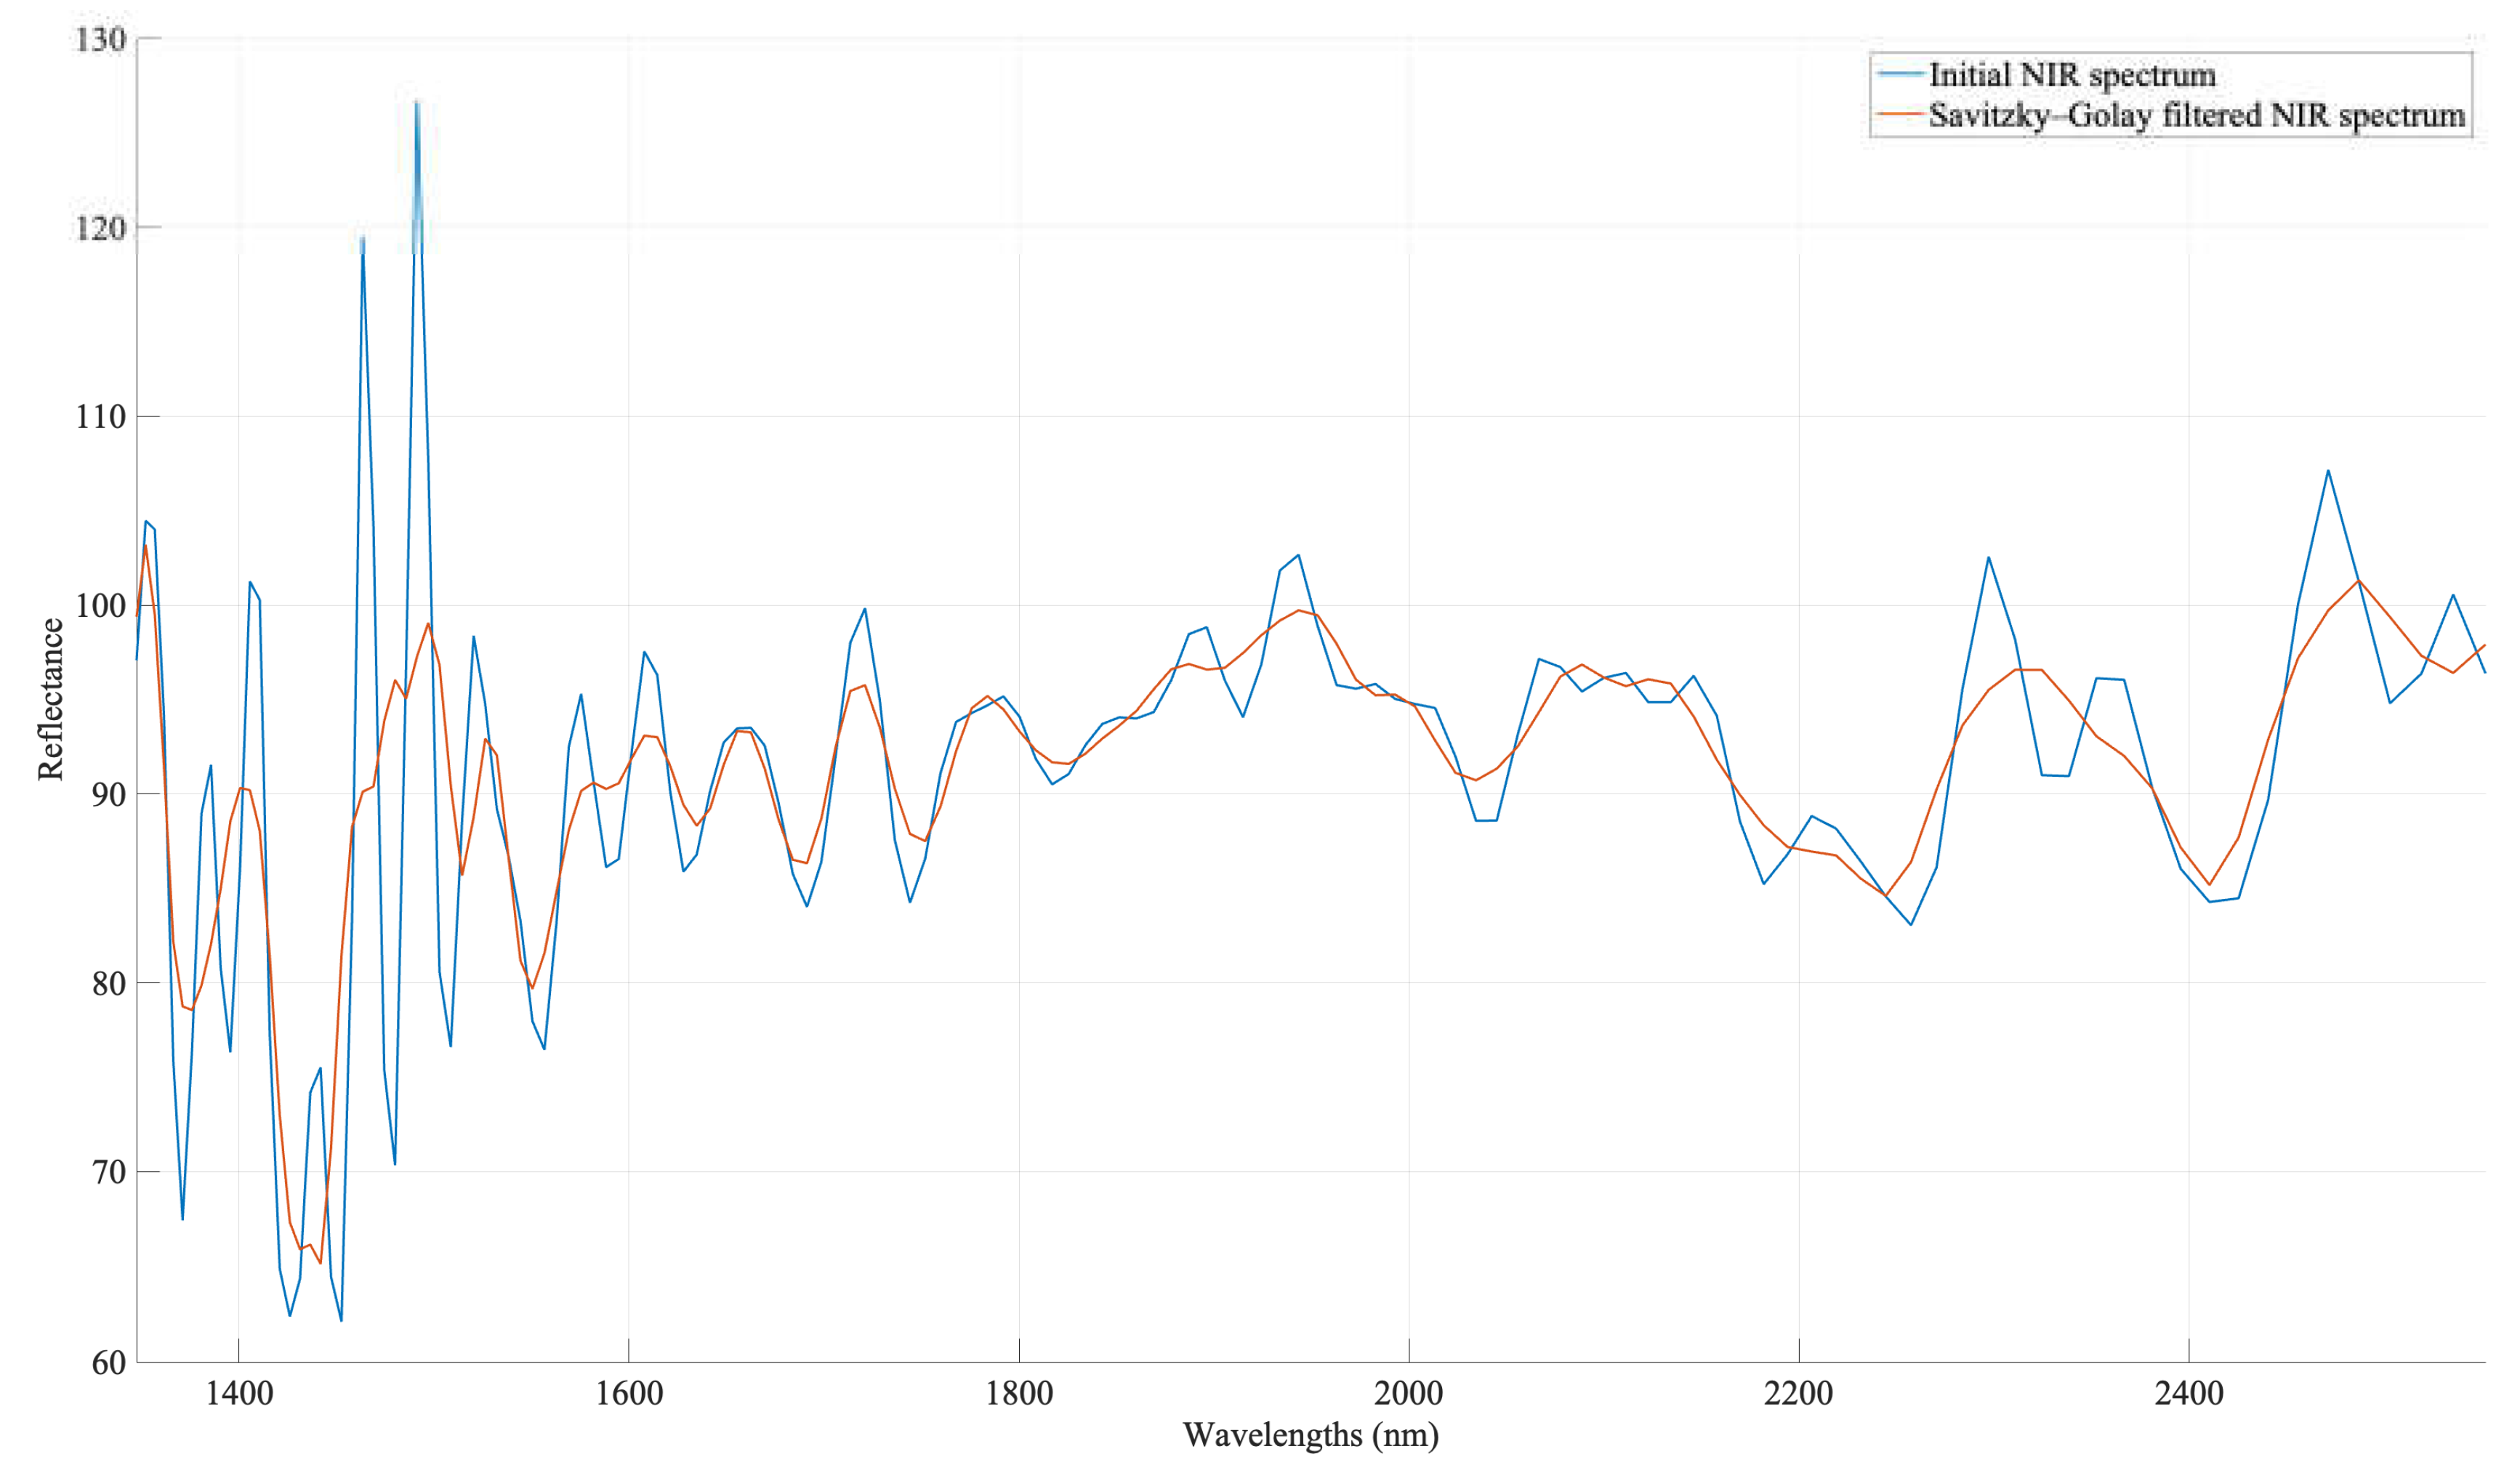
Figure 7.
Structure of a typical FCM.
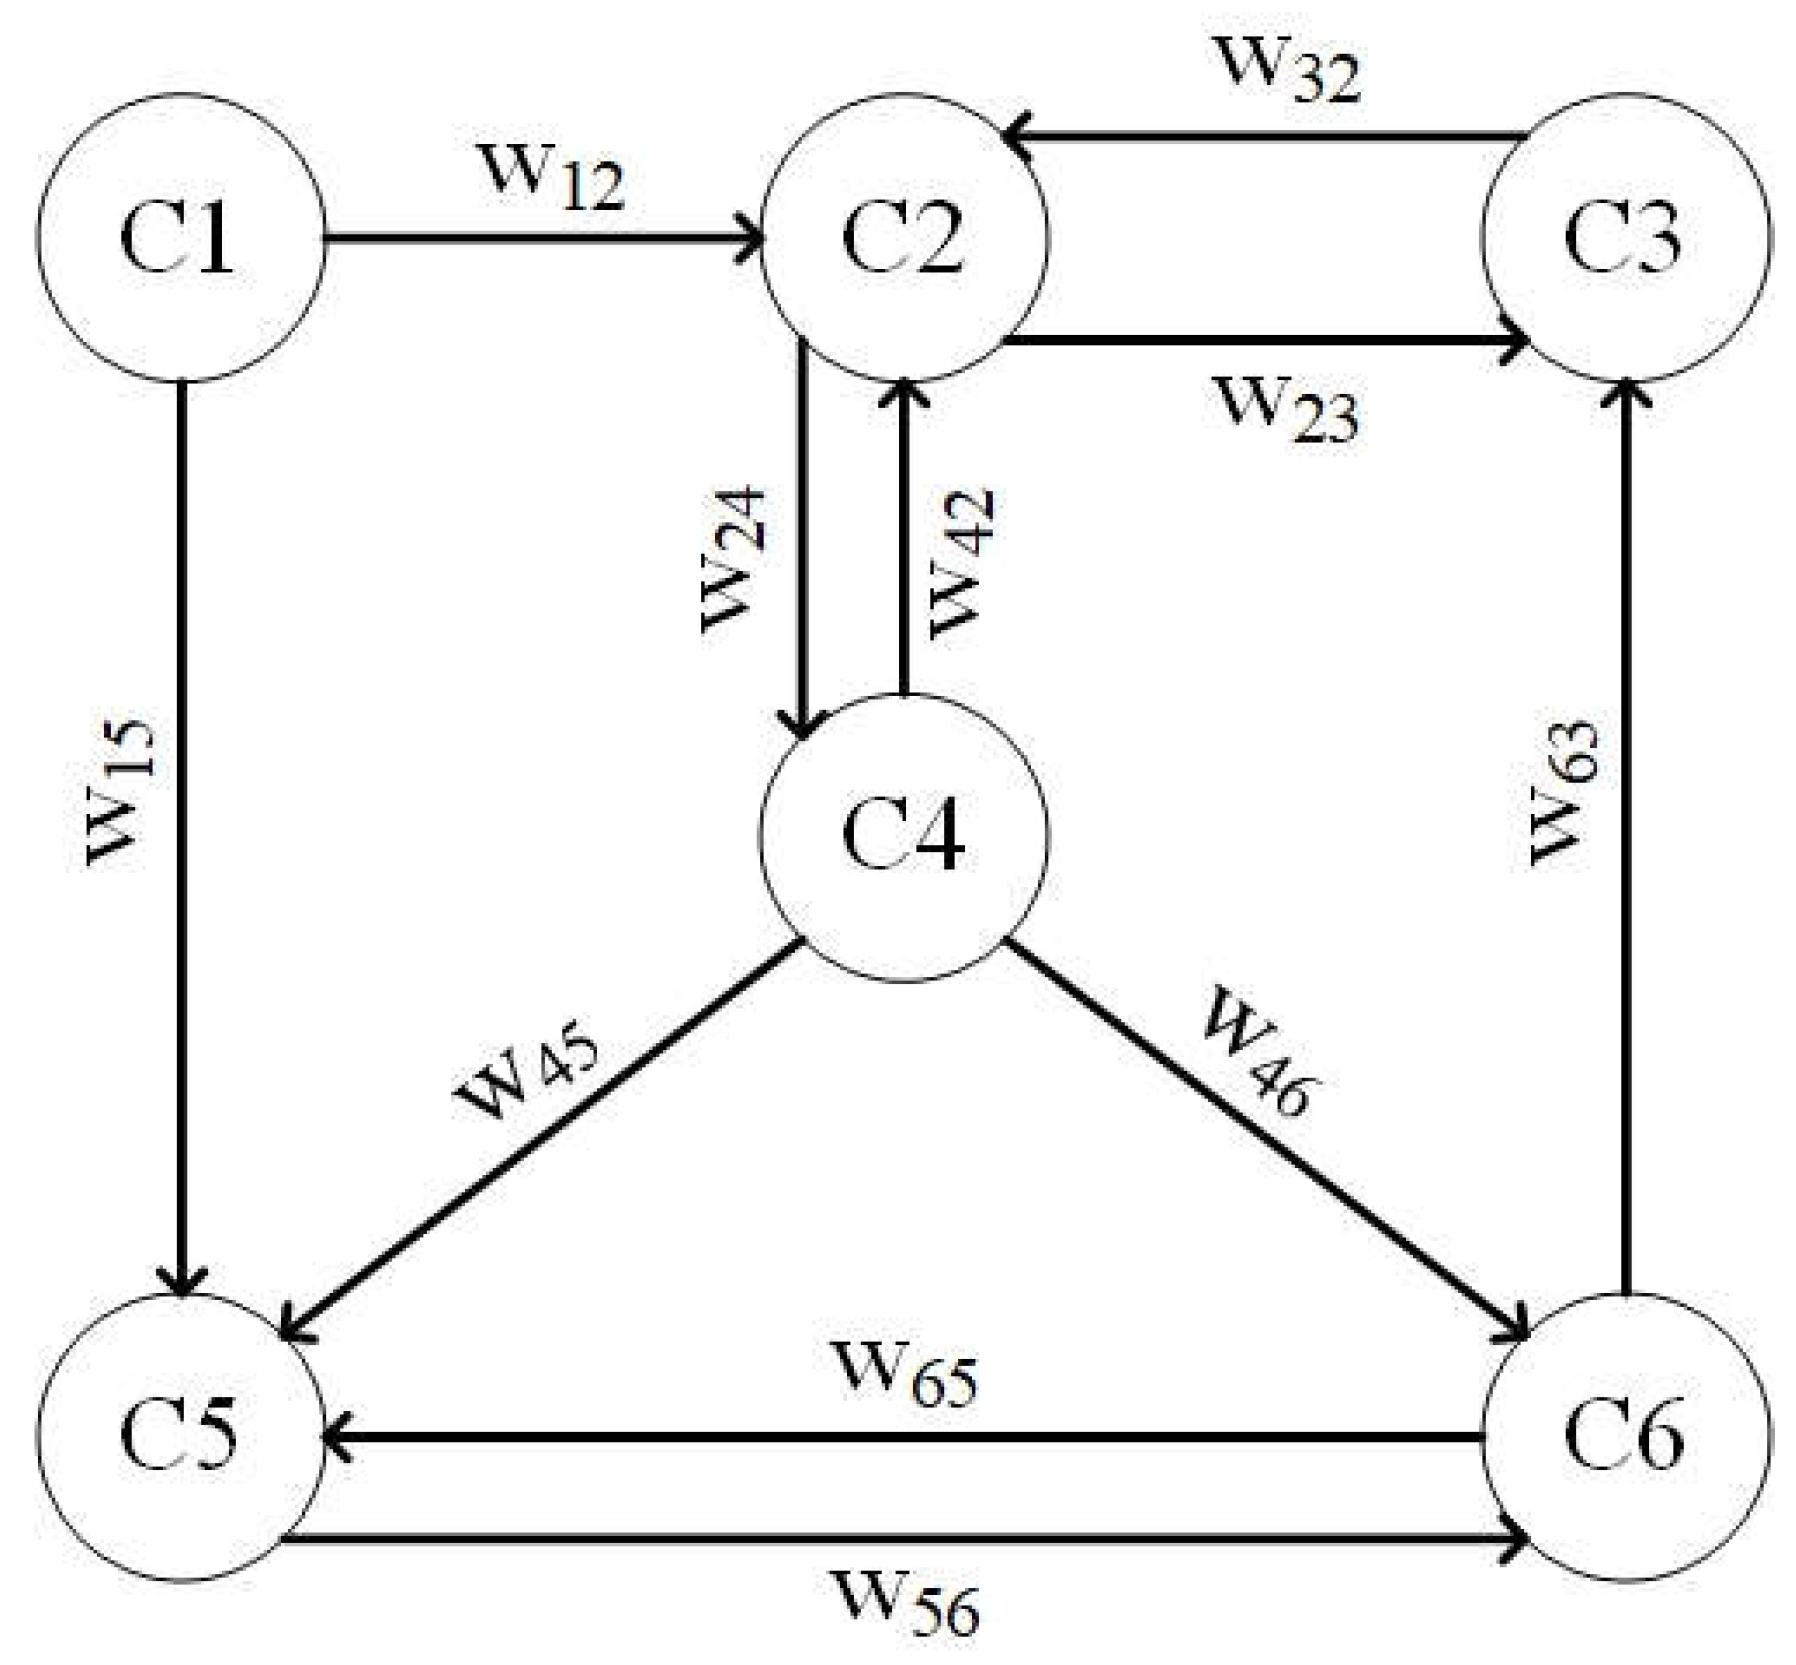
Figure 8.
FCM framework for estimating wheat and flour parameters.
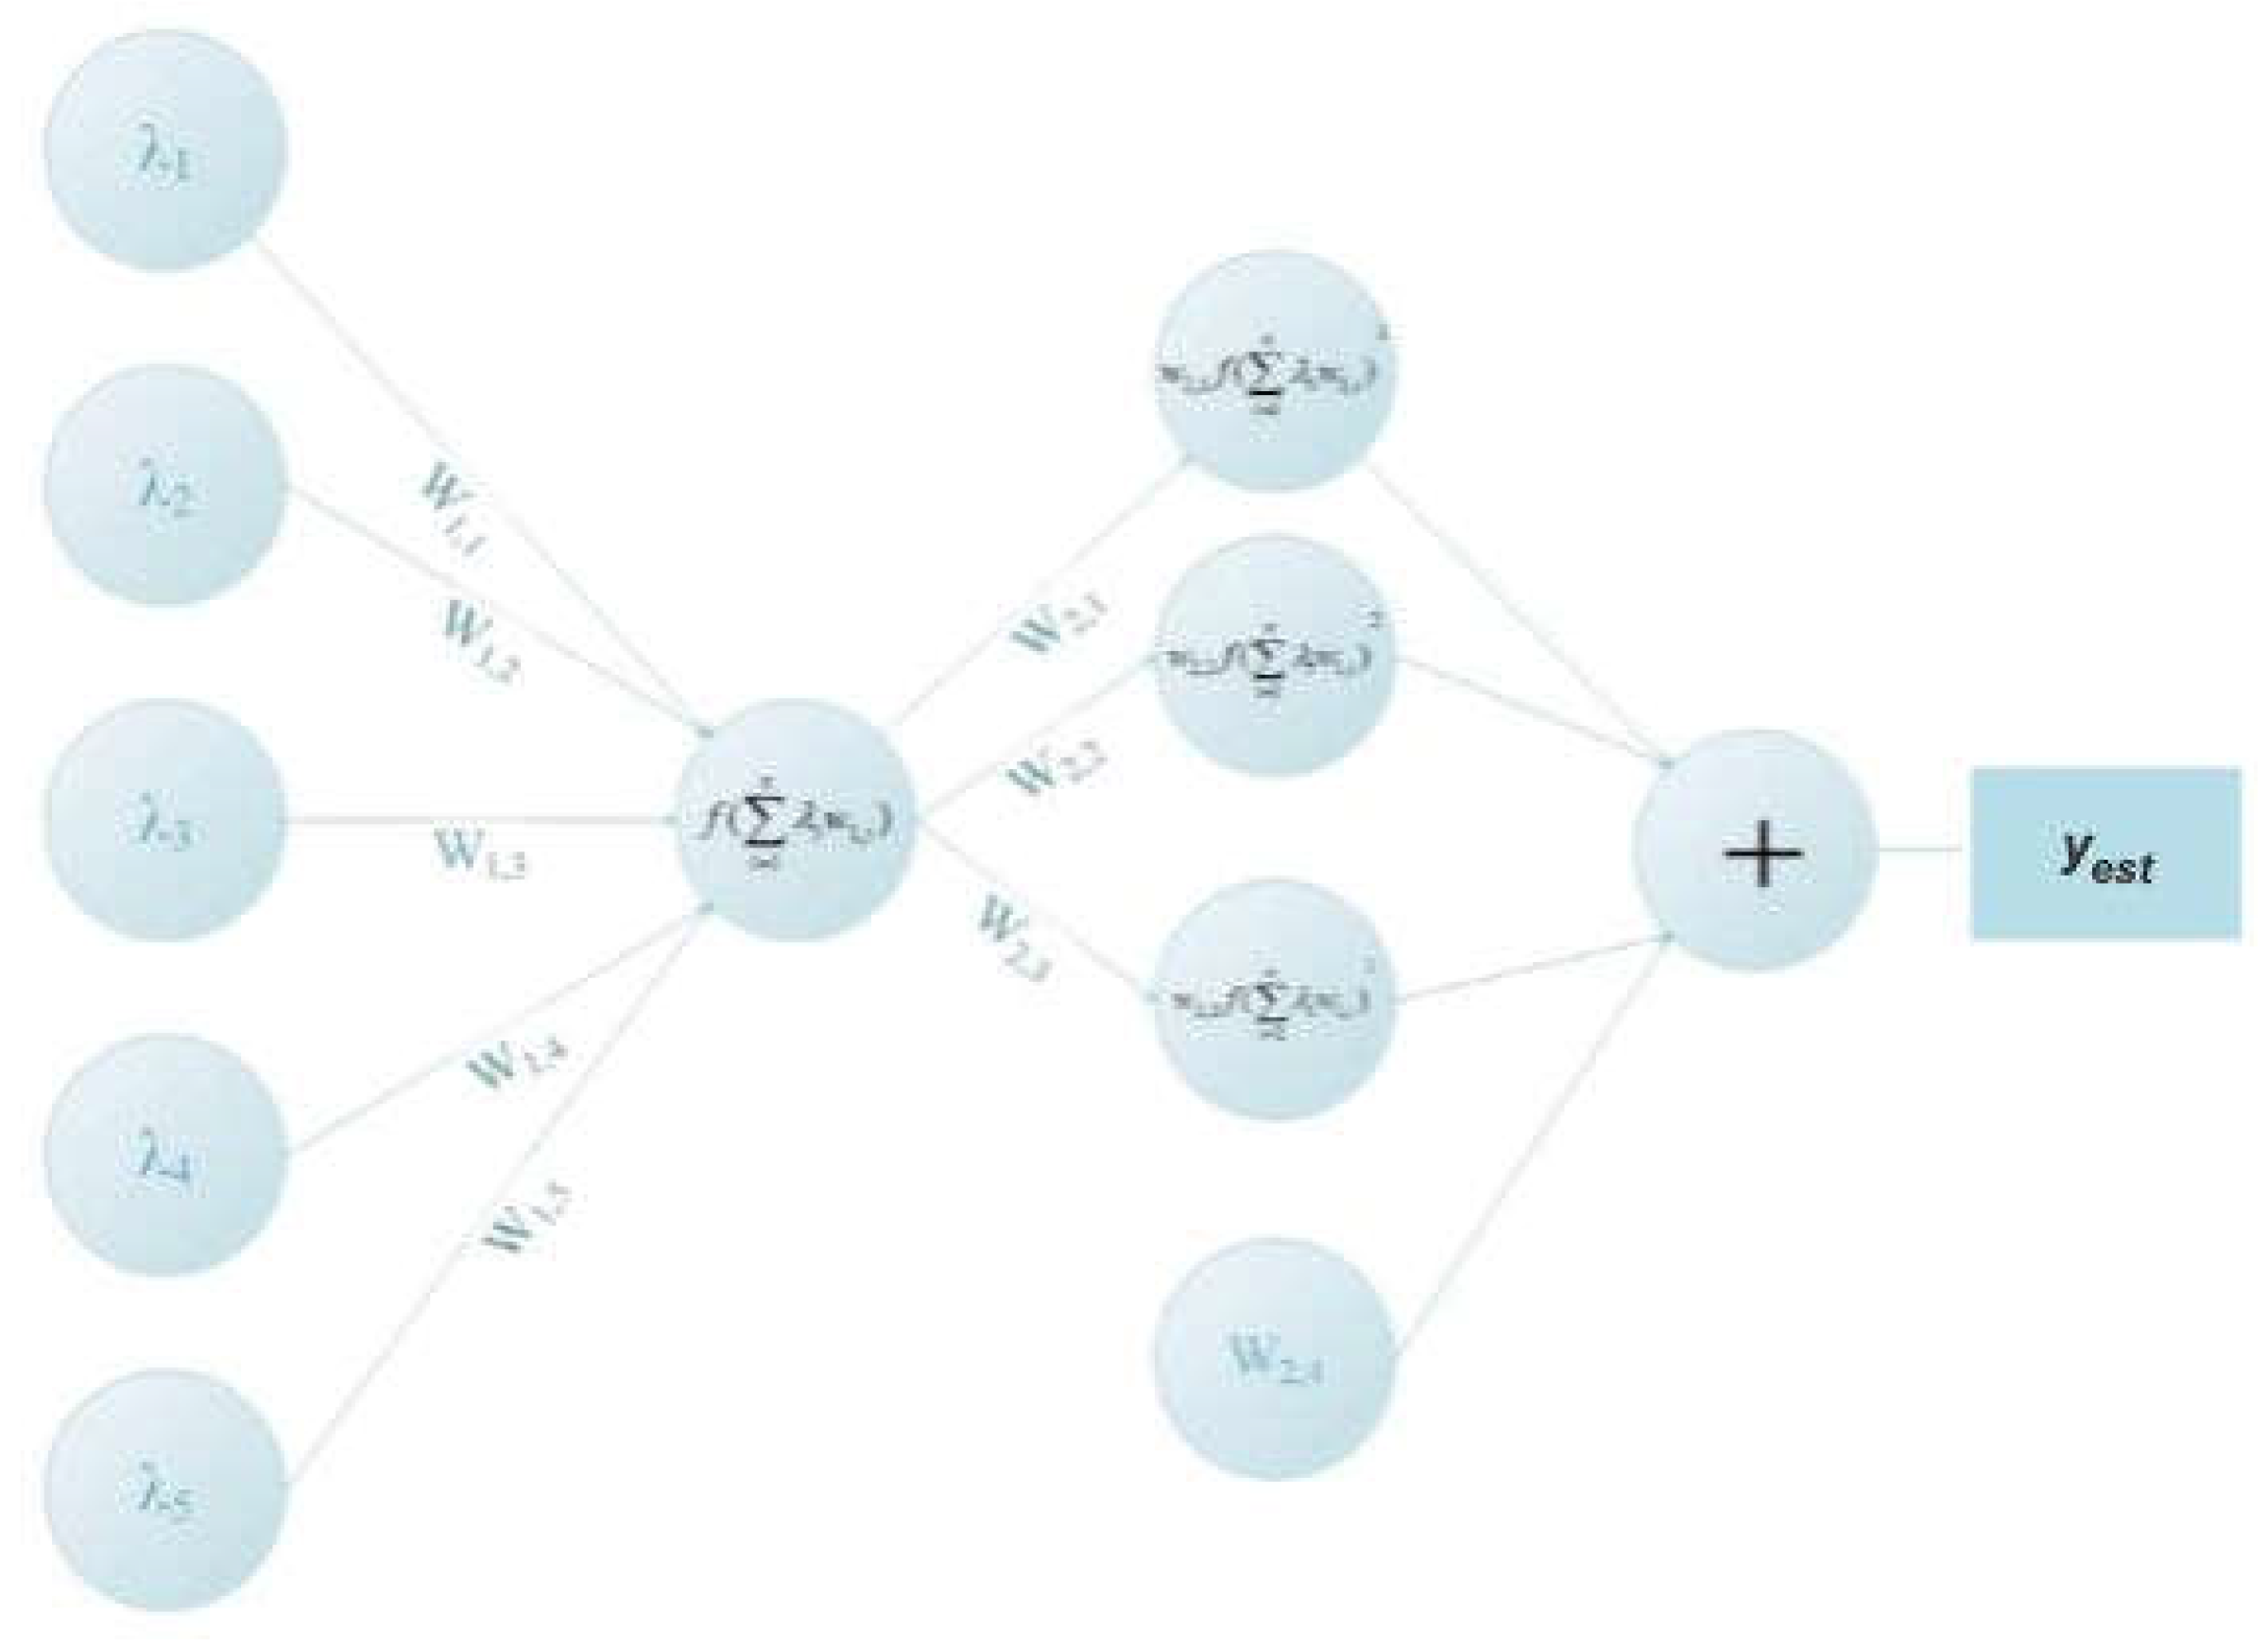
Figure 9.
Histograms of the wheat samples’ parameters: (a) protein content and (b) moisture content.
Figure 9.
Histograms of the wheat samples’ parameters: (a) protein content and (b) moisture content.
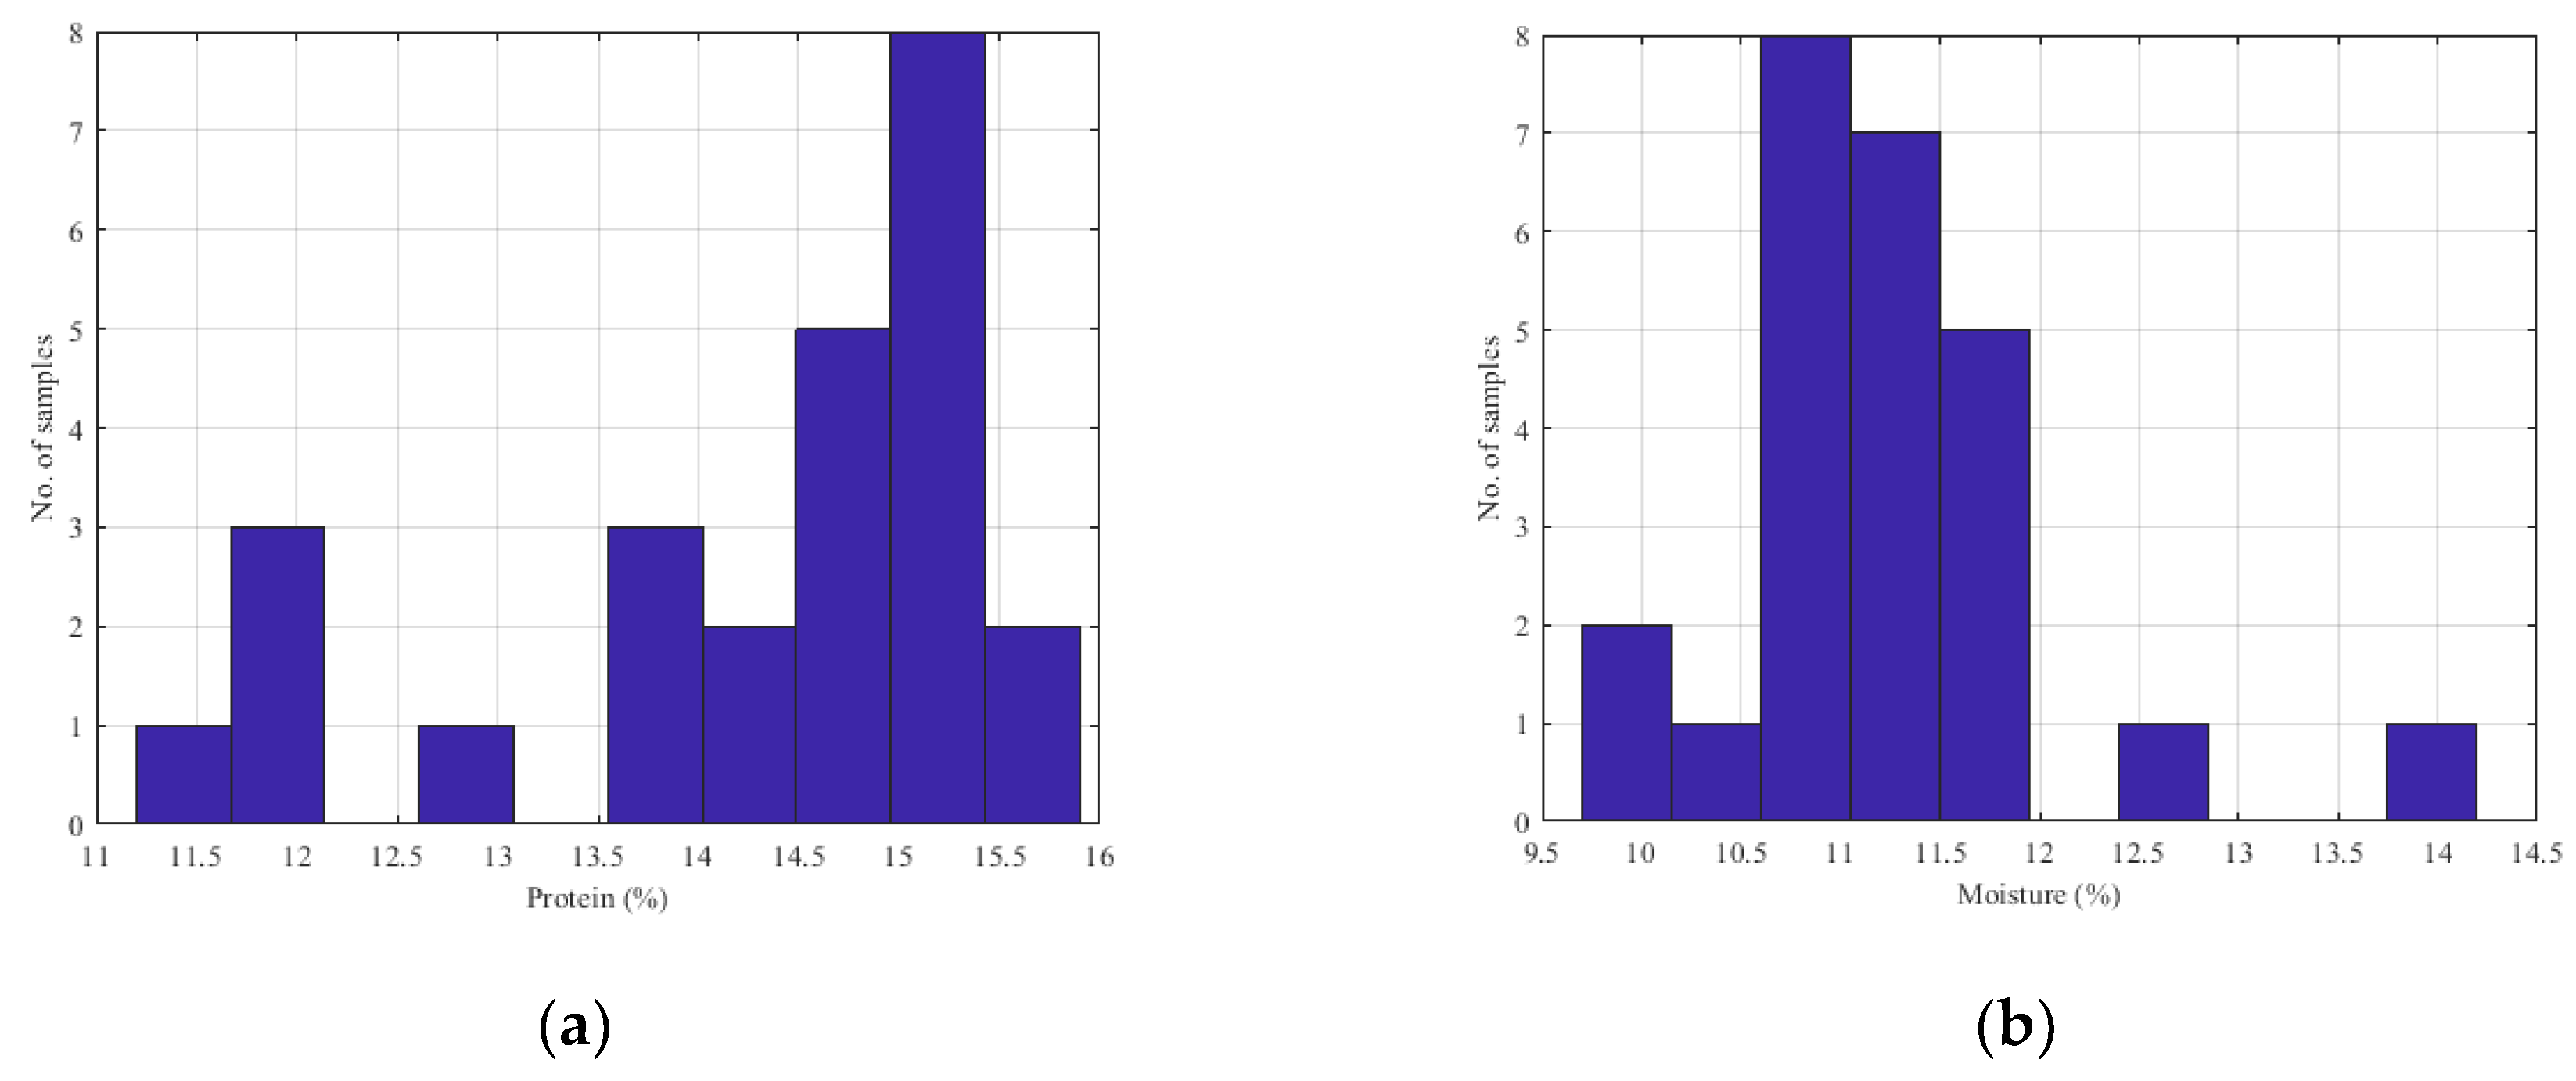
Figure 10.
Histograms of the flour samples’ parameters: (a) protein content, (b) moisture content and (c) ash content.
Figure 10.
Histograms of the flour samples’ parameters: (a) protein content, (b) moisture content and (c) ash content.
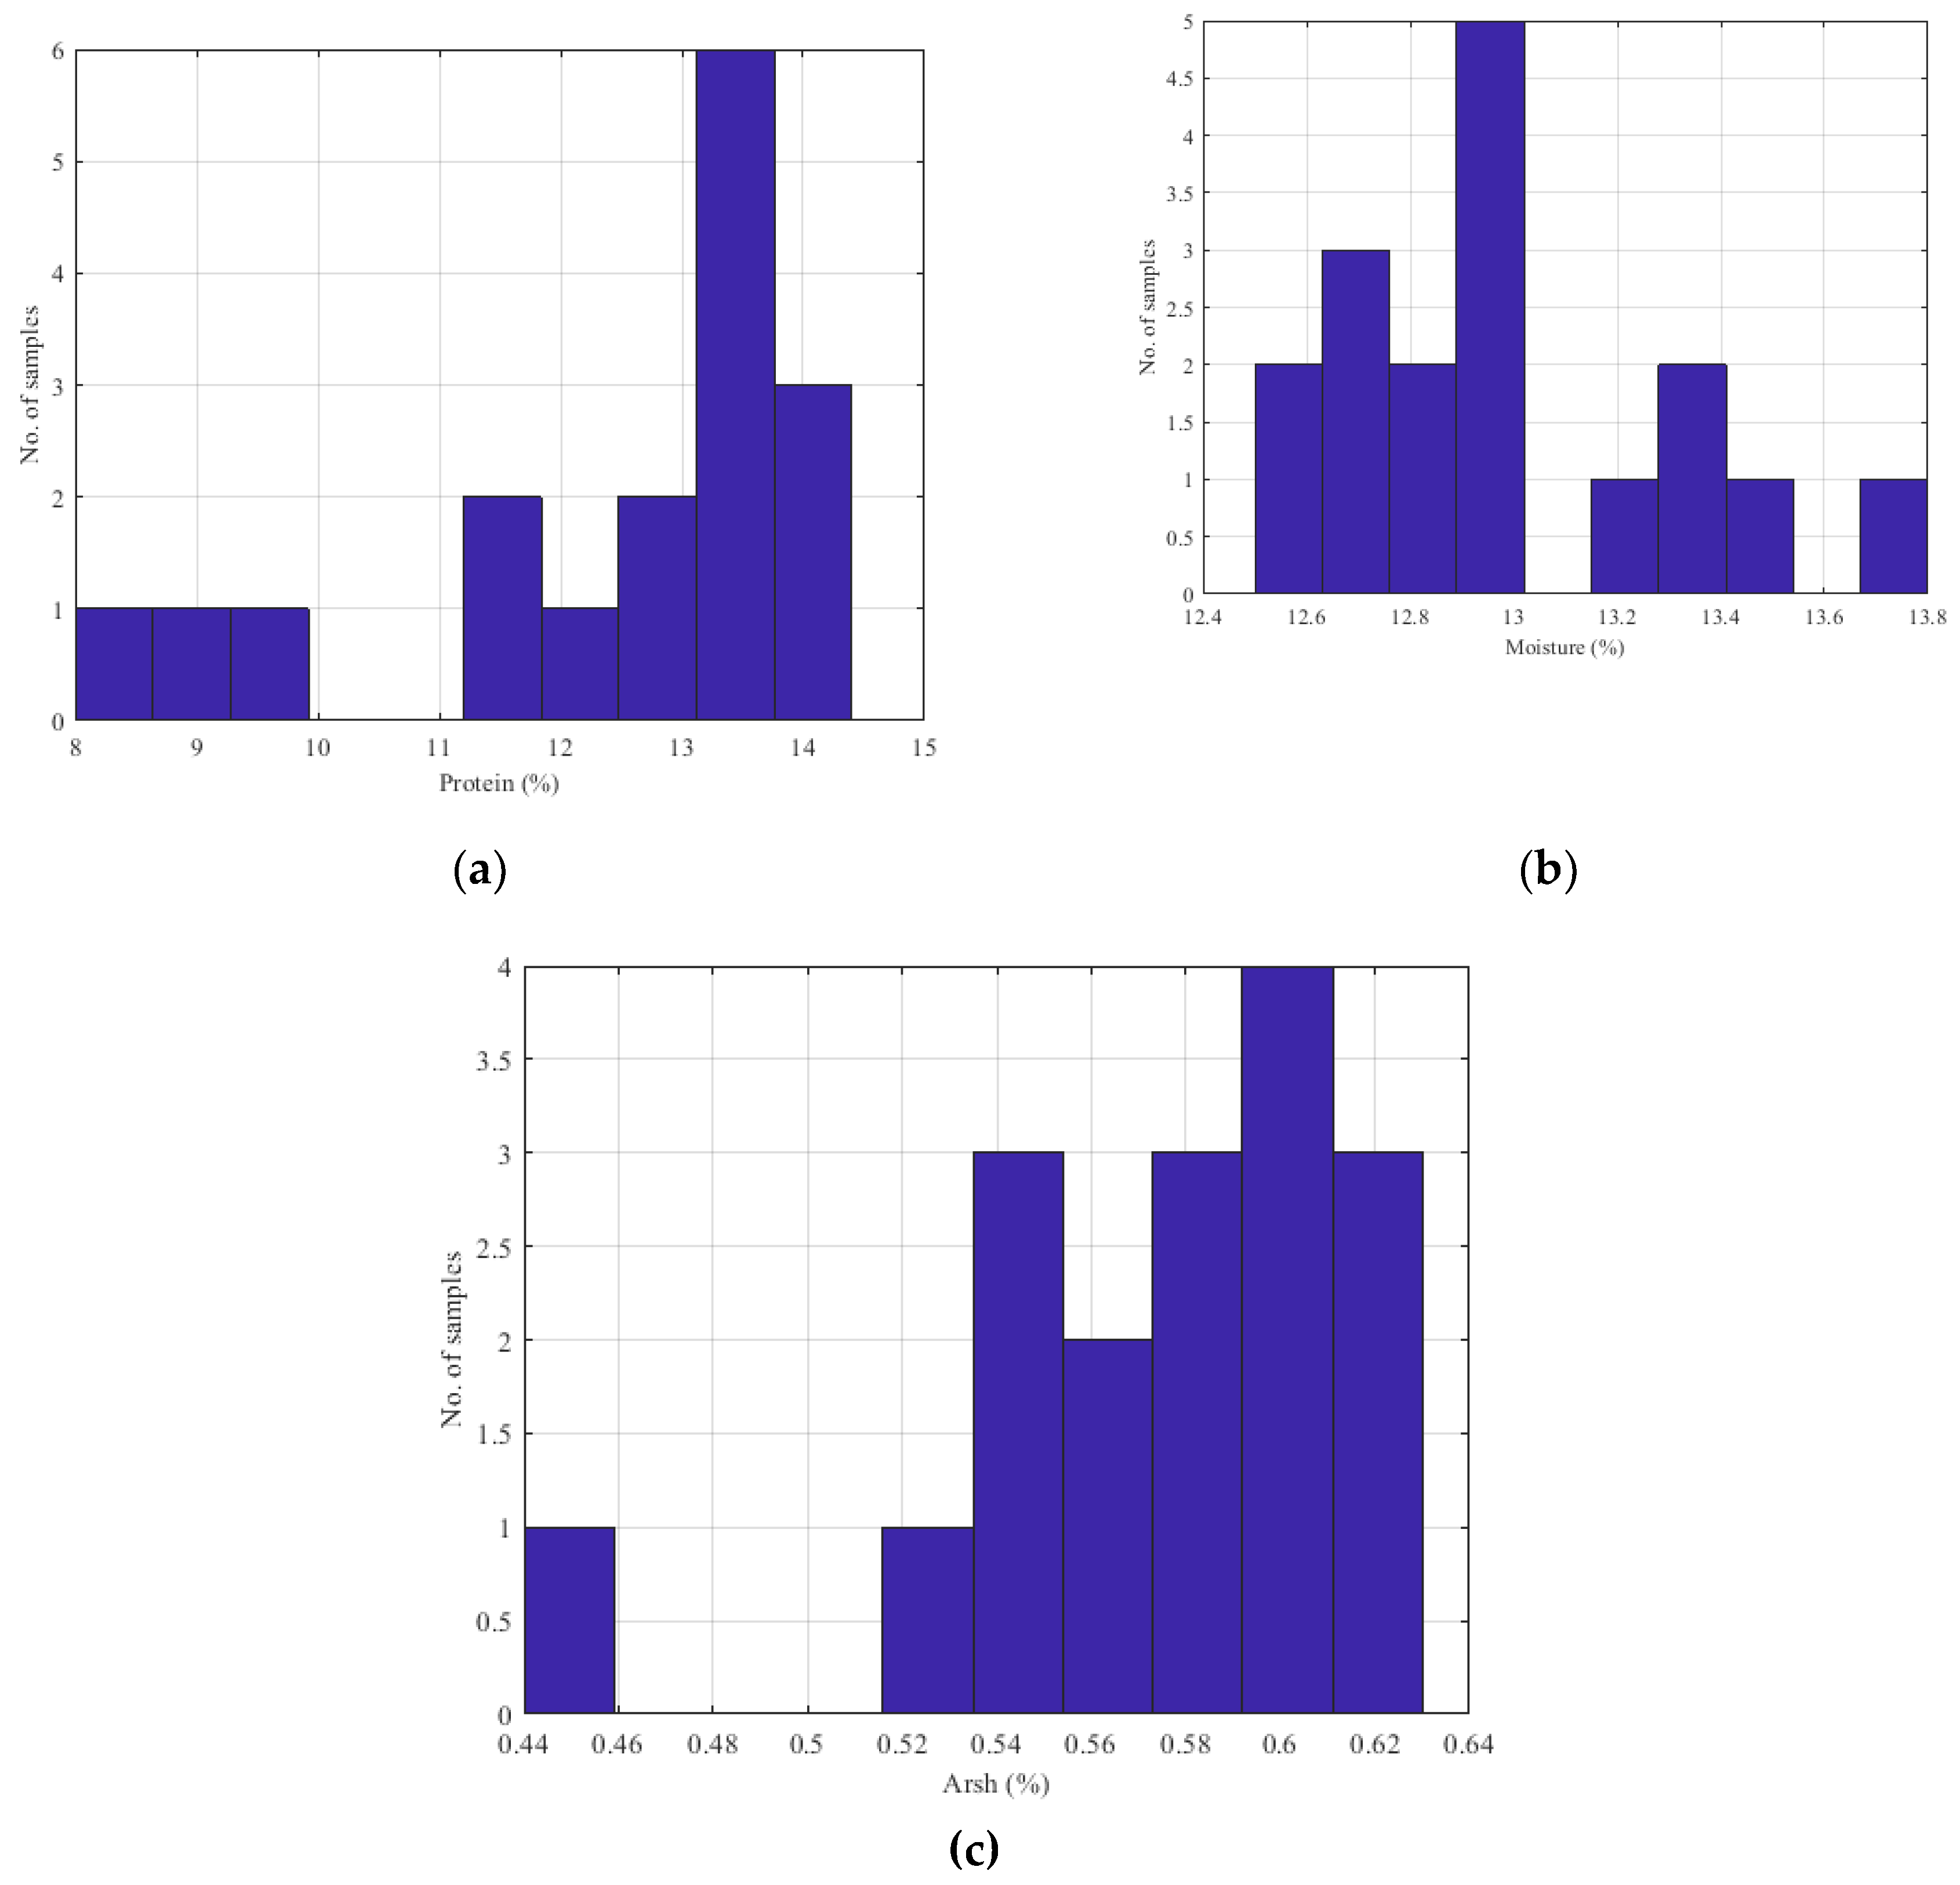
Figure 11.
Analysis of FCM estimation models applied to the wheat dataset: (a) comparison between real and estimated protein values, (b) histogram illustrating the RMSE distribution for the protein estimation model, (c) comparison of real and estimated moisture values, and (d) histogram illustrating the RMSE distribution for the moisture estimation model.
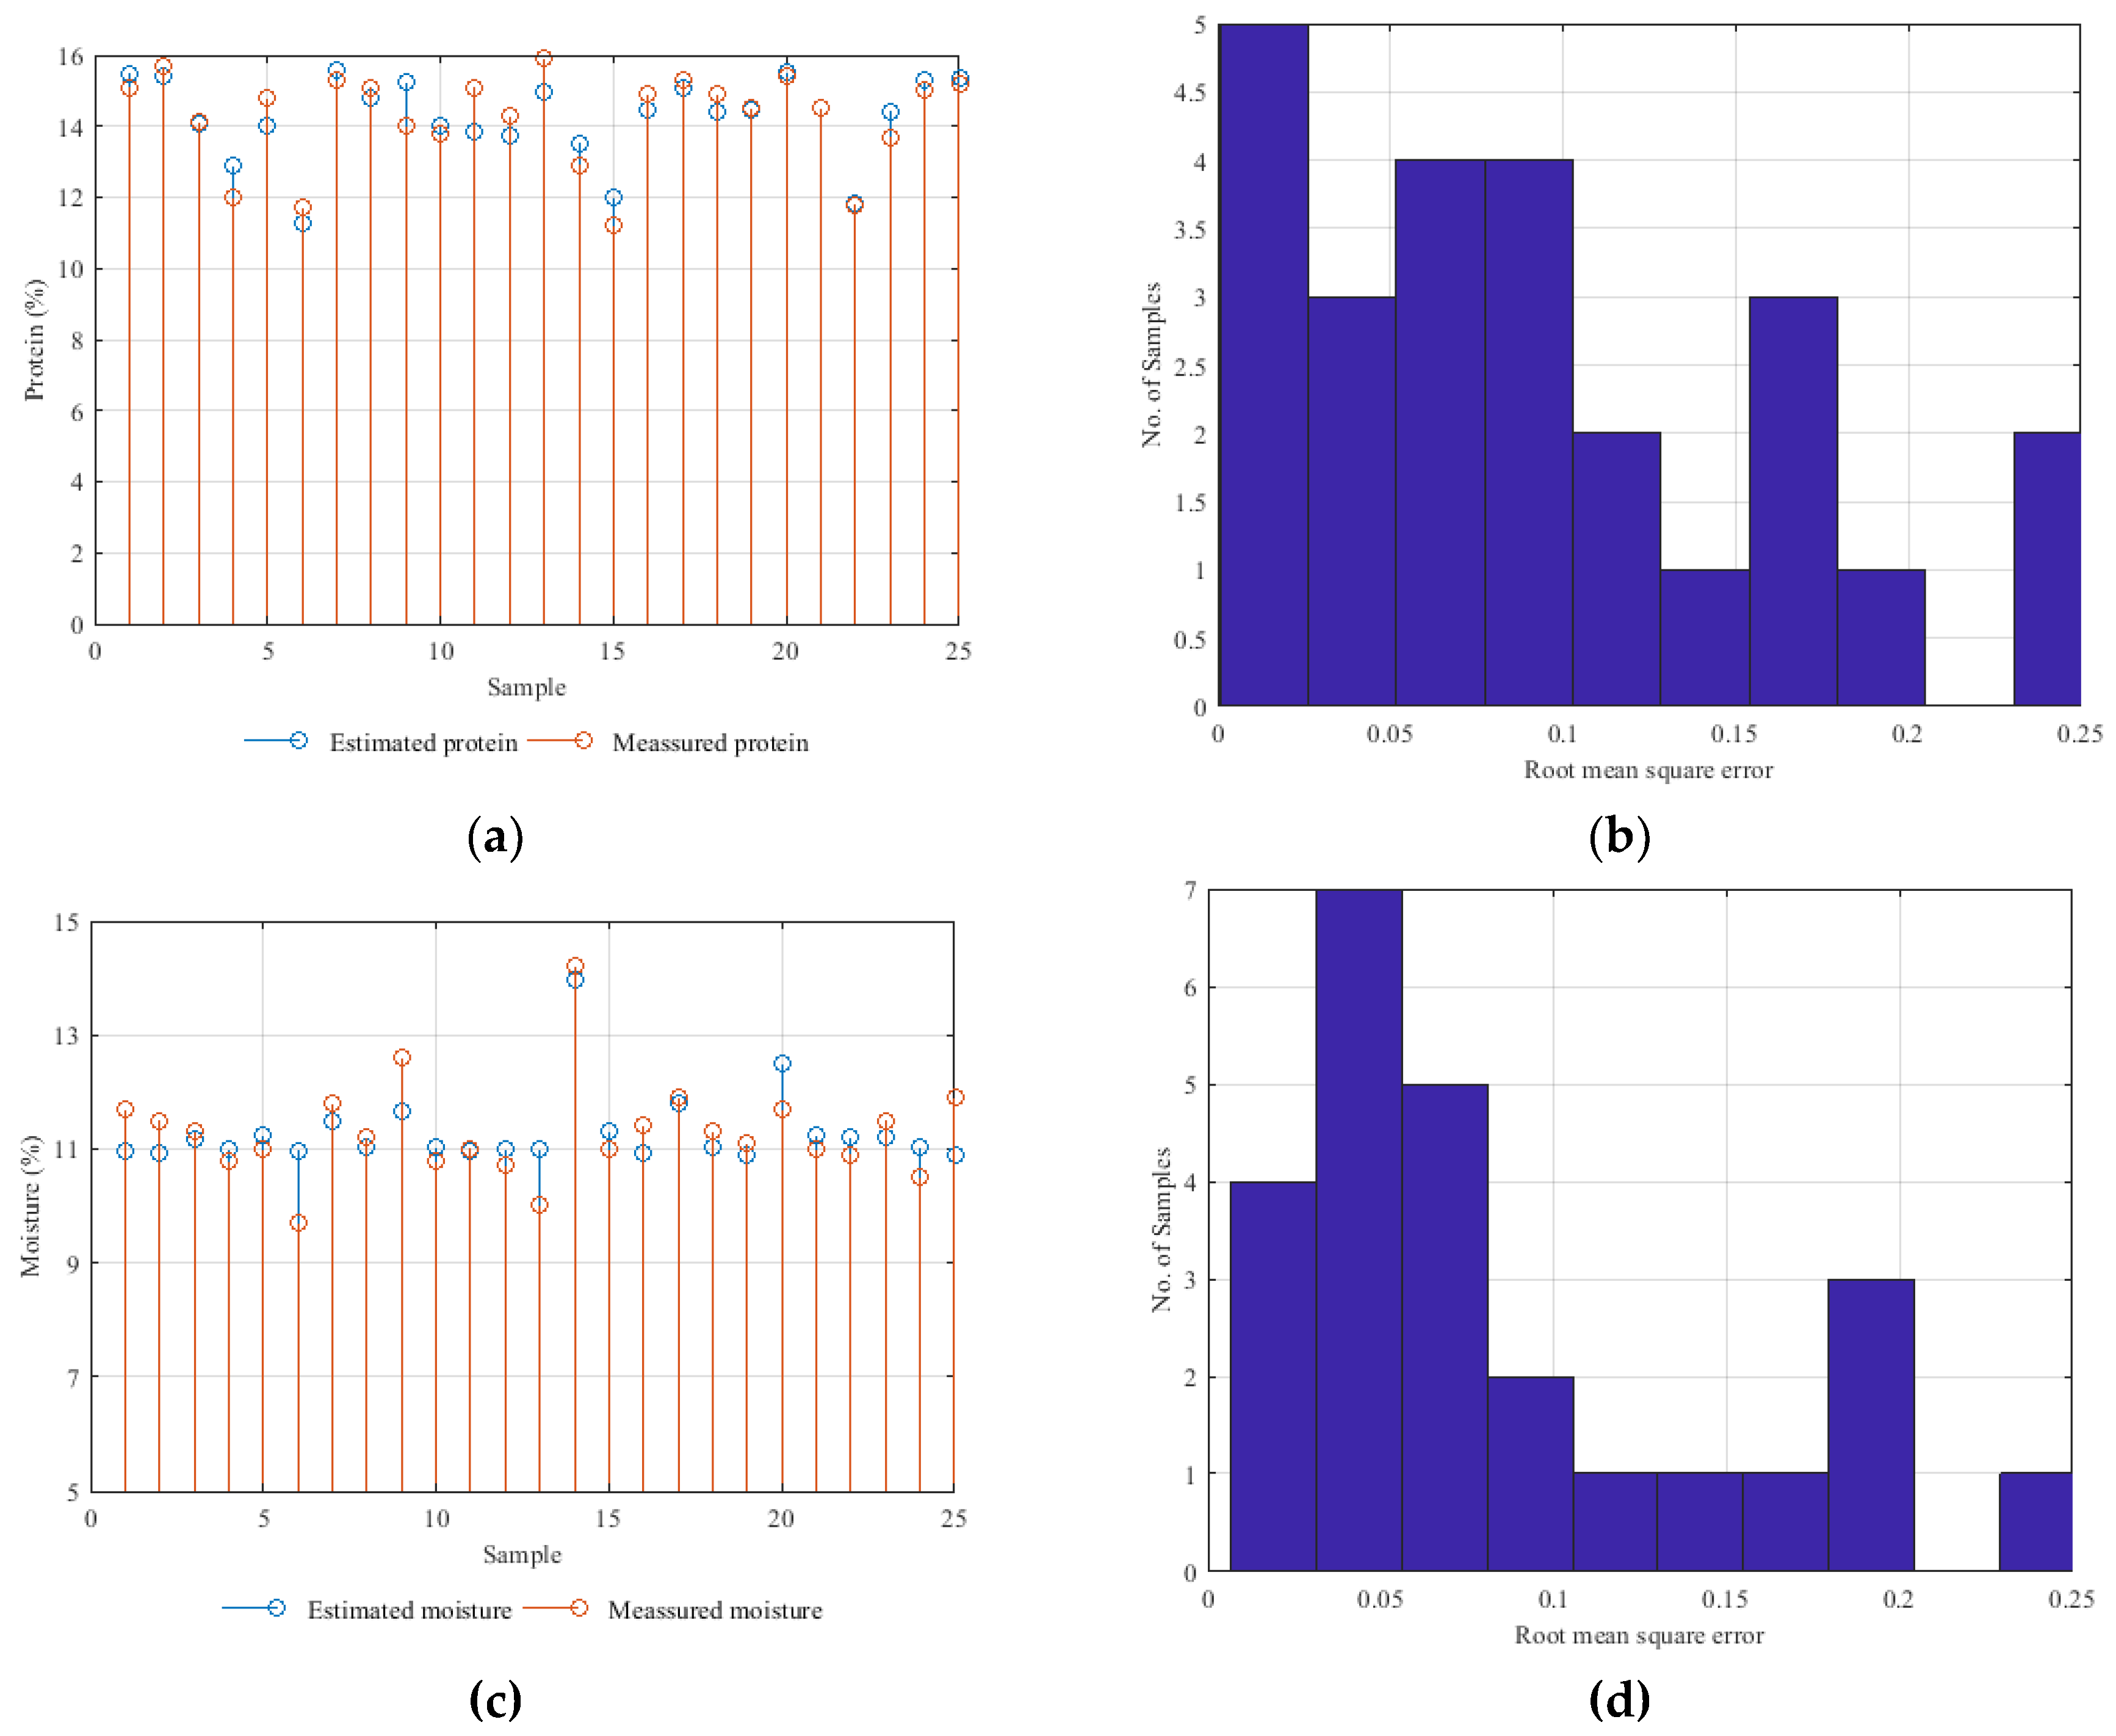
Figure 12.
Analysis of FCM estimation models applied to the flour dataset: (a) comparison between real and estimated protein values, (b) histogram illustrating the RMSE distribution for the protein estimation model, (c) comparison between real and estimated moisture values, (d) histogram illustrating the RMSE distribution for the moisture estimation model, (e) comparison between real and estimated ash values and (f) histogram illustrating the RMSE distribution for the ash estimation model.
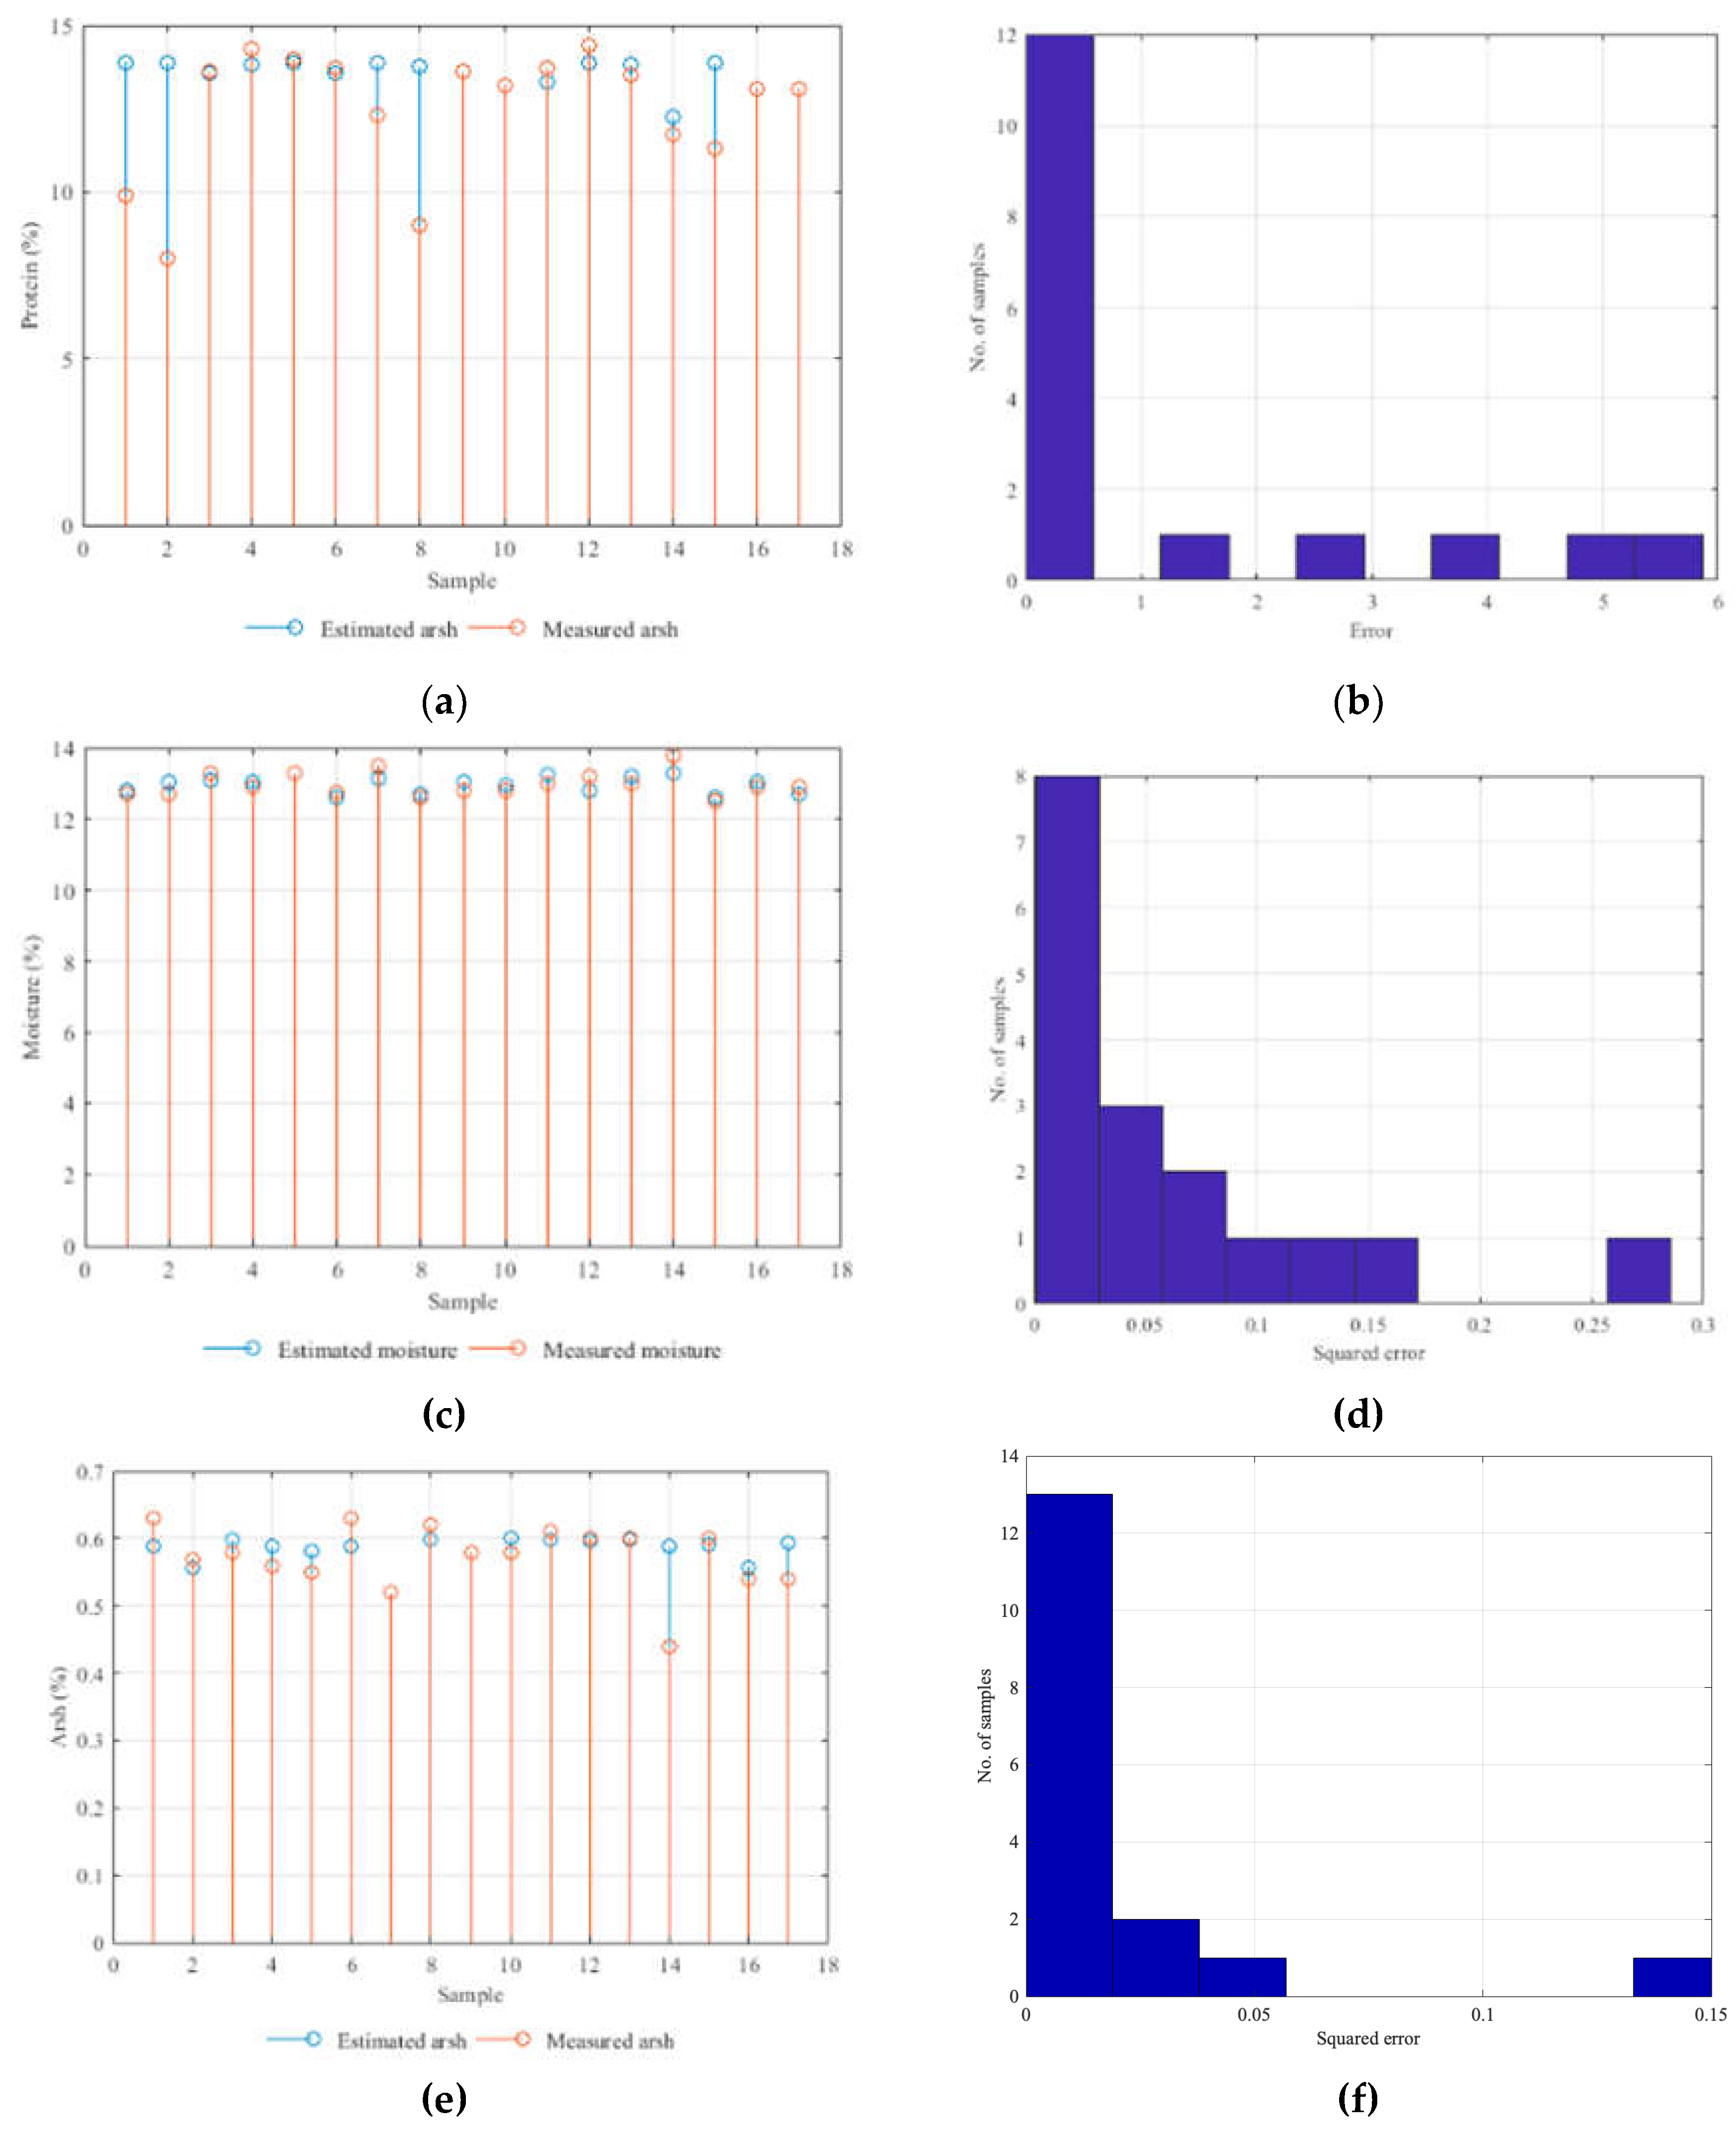

Table 1.
Statistical values of the wheat and flour examined parameters.
| Sample | Parameter (%) | Average | Variance |
|---|---|---|---|
| Wheat | Protein | 14.25 | 1.77 |
| Moisture | 11.30 | 0.74 | |
| Flour | Protein | 12.50 | 3.62 |
| Moisture | 13.00 | 0.12 | |
| Ash | 0.58 | 0.002 |
Table 2.
Values of the FCM estimation model for the wheat parameters.
| Weight | Protein estimator | Selected wavelength |
Moisture estimator | Selected wavelength |
|---|---|---|---|---|
| W1,1 | 3.11 | 2440.50 | 2.43 | 2487.05 |
| W1,2 | 3.58 | 2381.07 | 0.03 | 2194.07 |
| W1,3 | 0.17 | 2366.66 | 0.61 | 1759.74 |
| W1,4 | -0.11 | 1380.79 | 3.21 | 1736.30 |
| W1,5 | 0.18 | 1375.93 | -1.52 | 1728.63 |
| W2,1 | 18.00 | 22.48 | ||
| W2,2 | 10.23 | 5.24 | ||
| W2,3 | 12.95 | 11.17 | ||
| W2,4 | -6.69 | -15.38 |
Table 3.
Values of the FCM estimation model for the flour parameters.
| Weight | Protein estimator |
Selected wavelength |
Moisture estimator |
Selected Wavelength (nm) |
Ash estimator |
Selected Wavelength (nm) |
|---|---|---|---|---|---|---|
| W1,1 | 8.00 | 2055.69 | 15.46 | 1933.73 | -9.87 | 1775.71 |
| W1,2 | -4.83 | 2044.94 | -14.67 | 1924.22 | 0.01 | 1759.73 |
| W1,3 | -7.53 | 1683.97 | -0.16 | 1457.99 | 0.03 | 1751.85 |
| W1,4 | 4.05 | 1375.93 | 0.03 | 1405.59 | -0.41 | 1491.35 |
| W1,5 | -0.71 | 1371.10 | -0.54 | 1347.49 | 5.70 | 1480.06 |
| W2,1 | 0 | 0 | 0 | |||
| W2,2 | 0 | 0 | 0 | |||
| W2,3 | -0.08 | 0.05 | 0.01 | |||
| W2,4 | 9.01 | 12.75 | 1.97 |
Disclaimer/Publisher’s Note: The statements, opinions and data contained in all publications are solely those of the individual author(s) and contributor(s) and not of MDPI and/or the editor(s). MDPI and/or the editor(s) disclaim responsibility for any injury to people or property resulting from any ideas, methods, instructions or products referred to in the content. |
© 2023 by the authors. Licensee MDPI, Basel, Switzerland. This article is an open access article distributed under the terms and conditions of the Creative Commons Attribution (CC BY) license (http://creativecommons.org/licenses/by/4.0/).
Copyright: This open access article is published under a Creative Commons CC BY 4.0 license, which permit the free download, distribution, and reuse, provided that the author and preprint are cited in any reuse.


