Submitted:
10 September 2023
Posted:
12 September 2023
You are already at the latest version
Abstract
Several empirical studies indicate that the lack of financing is one of the main barriers that affects the economic growth of small and medium enterprises (SMEs). The main objective of this investigation was to determine to what extent the economic sector; enterprise size; the characteristics inherent to the enterprise; legal status; the variables linked to the performance of the enterprise; and the attributes of the owner influence the access to bank financing of SMEs in Mexico. Using a discrete response probit regression model, the impact of enterprises characteristics on the probability of obtaining a bank loan was determined. The data collected is from the Enterprise Surveys of Mexico, carried out by the World Bank. The sample of 1,480 enterprises is representative by enterprise size, by economic sector, and by region. The research has a quantitative approach with a correlational scope and a non-experimental and transectional design. One of the main results highlights that the determinants with the greatest influence on access to bank financing are: age, the small size, foreign participation, and the manufacturing sector. These results are consistent with other empirical studies, as well as with the pecking order theory and the financial life cycle theory.
Keywords:
Determinants
; access
; bank financing
; SMEs
; probit model
1. Introduction
SMEs are a key element for the economic development of Mexico, they represent 4.9% of all enterprises in the country, provide 30.7% of jobs and contribute 31% of added value (National Institute of Statistic and Geography, 2020). However, various empirical studies indicate that the lack of financing is one of the main barriers that affects the economic growth of SMEs and that the smallest enterprises are the most affected by this limitation. According to Kumar et al. (2020) studies on the capital structure of SMEs have generated great relevance in recent years due to the economic importance of these enterprises for the countries and because most of the research on capital structure has been carried out only in large enterprises.
According to the quarterly survey of conjunctural evaluation of the credit market, there is a large gap in access to bank financing between SMEs and large enterprises. SMEs with bank debt as of December 2021 represented 35.3%, while in large enterprises it was 56.1%. It is also highlighted that SMEs report having greater limitations than large enterprises to access new bank loans (Bank of Mexico, 2022a; 2022b).
Among the modern theories that address research on the behavior of enterprises in relation to the request for financing (credit demand) is the pecking order theory and the financial life cycle theory, both theories have been studied in the context of the SMEs. There are several factors that limit access to bank financing, which can be classified into three aspects: a) those related to the country’s economy; b) those related to the banking system; and c) those related to the characteristics inherent to the enterprises. In this sense, the various investigations on this object of study are focused from the perspective of supply or demand for bank credit. Therefore, this research focuses on the study of the determinants of bank financing from the scope of the characteristics of SMEs and the attributes of their entrepreneurs, that is, from the perspective of credit demand.
The general objective was to determine to what extent the economic sector; the enterprise size; the characteristics inherent to the enterprises; legal status; the variables linked to the performance of the enterprise; and the attributes of the owner influence the access to bank financing of SMEs in Mexico.
Based on the binary probit regression models and the profile analysis, it was identified that the variables with the greatest influence on the probability of obtaining a bank loan are the age of the enterprise, the small size, foreign participation, and the manufacturing sector. In other words, younger, small, foreign-owned, and non-manufacturing enterprises are the least probability to access bank financing. These results are consistent with other empirical studies analyzed in this research, as well as with pecking order theory and financial life cycle theory.
2. Literature review
2.1. Theoretical framework of business financing
2.1.1. Pecking order theory
In the pecking order theory, a hierarchical order of preferences for enterprises financing is established: first, they are financed through internal sources such as retained earnings and partner contributions; secondly, if they need additional resources, they will request bank loans; and ultimately, they issue new equity (Donaldson, 1961; Myers, 1984; Myers and Majluf, 1984). It is considered that this theory applies to small enterprises due to their restricted access to the capital market caused by the little information available, which makes it impossible to know the quality of the management of this type of enterprise, which is why lenders choose to protect your resources through short-term repayments as a measure to protect your investment. In this sense, small entrepreneurs are forced to obtain short-term business loans, but at a high cost (Chittenden et al., 1996).
López-Gracia and Sogorb-Mira (2008) point out that SMEs apply the pecking order theory in financing decisions. This order is directed by the financial sources that are subject to less information costs and less risk. Internal funds are the main source of financing, followed by lower-risk short-term debt and then higher-risk long-term debt. The last option is to resort to new capital, which is the source of financing with high information costs.
The assumptions that support the financial hierarchy theory offer a better explanation of the capital structure adopted by SMEs. The asymmetry of information, as well as the motivation of current shareholders to maintain control and corporate ownership are relevant factors that condition the choice of financing sources (Ferrer and Tresierra, 2009). In the same sense, Yazdanfar and Öhman (2016) indicate that the owners or managers of SMEs choose to be autonomous and maintain control of their enterprises, which is why they follow a hierarchical order in financing decisions, preferring first internal sources that the external ones.
In this sense, the limitation that SMEs have to access financing originates from the information asymmetry problems between borrowers and lenders, which implies information costs derived from these asymmetries. SMEs prefer internal sources of financing that imply less information costs and less risk (Briozzo, Vigier and Martinez, 2016). Due to the difficulty in accessing long-term sources of financing, there is a higher probability that young SMEs follow the pecking order theory than the compensation theory predicts (Serrasqueiro and Nunes, 2012).
2.1.2. Financial Life Cycle Theory
The Financial Life Cycle Theory establishes that the financial needs of enterprises change as their life stages progress. As the firm grows and ages, gains more experience, and the availability of information increases, its financial needs and financing options change (Berger and Udell, 1998). During the cycle of financial growth and derived from the reduction of information asymmetries, the enterprise has changing financial needs and can resort to other sources, in addition to the internal ones, such as venture capital, loans from financial institutions, starting with the short term and later in the long term (Briozzo, Vigier, Castillo et al., 2016).
Berger and Udell (1998) indicate that enterprises develop through a financial growth cycle paradigm in which different capital structures are optimal at different points in the cycle. In this way, when enterprises are young and small, they are less transparent in their financial information, so they are financed with their own resources, resources from family and friends. As it grows, access to commercial credit or through business angels increases. Over time, if the enterprise continues to grow, it may turn to venture capital institutions, the debt market, or public capital (Guercio et al., 2017).
Briozzo, Vigier, Castillo et al. (2016) point out that there is a relationship between the life cycle of enterprises and their owners. As enterprises and their owners grow, information asymmetries are reduced, making access to financing easier. On the other hand, the older the risk aversion and the personal costs of bankruptcy increase, factors that discourage the use of external financing.
2.2. Variables of bank financing of SMEs
2.2.1. Size of the enterprise
The size of the enterprise indicates that the more developed or expanded an enterprise is, the more likely it will be able to generate sufficient resources to repay the loan. Likewise, larger enterprises have a greater capacity to acquire more assets as collateral for the loans obtained, which is why it has been shown to have a positive relationship with the possibility of accessing a loan (Botello, 2015).
Beck and Demirgüc-Kunt (2006) indicate that in countries with fixed transaction costs and information asymmetries, small enterprises that demand smaller loans face higher transaction costs and higher risk premiums because they are generally more opaque and they have fewer guarantees to offer. This is reflected in financing patterns: small enterprises finance less of their investment and working capital with bank financing compared to large enterprises. By contrast, smaller enterprises finance a greater share of the investment with informal sources such as moneylenders, family, and friends.
Mac an Bhaird and Lucey (2010) found that the larger the enterprise, the greater the probability of accessing external financing. In addition, Petersen, and Rajan (1994) and Hutchinson (2004) identified that the size of the enterprise is positively related to the indebtedness of the enterprises. In the same sense, Rao et al. (2018) agree that the size of the enterprises is positively related to indebtedness because larger enterprises have more access to external financing sources and the cost of acquiring credit is lower for larger enterprises than for small enterprises. The debt of small enterprises is proportionally less than that issued by larger enterprises due to some factors such as: higher bankruptcy costs, higher agency costs and higher costs of monitoring information asymmetries, among others (Michaelas et al., 1999).
2.2.2. Age of the enterprise
The age of the enterprise is a controversial variable. On the one hand, Petersen and Rajan (1994) identified a negative relationship between the seniority of SMEs and access to bank financing. On the other hand, Gregory et al. (2005) and Bougheas et al. (2006) indicate that there is a positive relationship.
In the same vein, Yazdanfar and Öhman (2016) point out that the results on the relationship between the enterprise age and debt are contradictory. On the one hand, enterprises can improve their competitiveness and reputation over time, which increases the probability of access to credit for older enterprises. On the other hand, enterprises can increase retained earnings over time, making older enterprises more probability to use them as a source of internal financing and require less external financing.
Rao et al. (2018) indicate that the age of the enterprise is positively related to financing. Older enterprises are more probability to obtain credit, while newer enterprises depend mainly on their internal sources of financing because they do not request external financing due to their low credibility in the credit market.
Serrasqueiro and Nunes (2012) indicate that the age of the enterprise is an influential factor that affects access to external financing, young SMEs on average had a higher short-term debt than older SMEs. On the other hand, young SMEs on average had lower long-term debt than older enterprises.
Mac an Bhaird and Lucey (2010) point out that older SMEs are less dependent on external financing, because as they age tend to use retained earnings more and more as internal financing. In the same vein, Hall et al. (2004) indicate that the older an enterprise is, it will be able to accumulate more funds and will need less financing. In other words, a young enterprise will not have had time to accumulate funds and will be forced to apply for credit. Therefore, age is negatively related to financing in both the short and long term.
On the other hand, it has been shown that younger SMEs use more internal financing instead of bank loans; in contrast, as the age of the firm increases, the proportion of bank loans gradually increases and informal financing decreases (Nizaeva and Coskun, 2019). Now, it is likely that the financial cycles of enterprises and the life cycles of owners are connected, sometimes with opposite effects. For example, information asymmetries reduce with increasing age of enterprises, resulting in greater access to external financing, while risk aversion and the cost of personal bankruptcy increase with the age of the entrepreneur, which implies a lower desire for debt (Briozzo and Vigier, 2014).
Younger SMEs have less experience and a lower track record of success than older enterprises, which makes it difficult for them to obtain bank credit (Bougheas et al., 2006 and Andrieu et al., 2018). Consolidated enterprises in a market with solid productive structures offer banking institutions sufficient guarantees to cover bank loans in the future, so the older the enterprises, the greater the probability of access to bank financing (Botello, 2015).
Berger and Udell (1998) with a focus on the financial life cycle, infer that enterprises tend to depend more and more on bank credit during their early stages of life, but that they use less bank credit as they get older. La Rocca et al. (2011) infer that small enterprises in Italy have high levels of debt early in their life cycle, but this debt ratio declines in later life cycle stages as firms accumulate retained earnings that they will use as a source of financing.
2.2.3. Economic sector
The economic sector where SMEs develop also influences access to external financing; various empirical studies have shown that SMEs in the service sector have greater restrictions to access external financing (Guercio et al., 2017). In the same sense, Michaelas et al. (1999) indicate that the industry influences on the total level of debt in small enterprises, as well as on the maturity structure of the debt.
SMEs in the service sector face more financial constraints compared to manufacturing SMEs, this may be due to the difficulty for lenders to assess intangible assets compared to tangible assets (Cressy and Olofsson, 1997). Briozzo and Vigier (2014) indicate that enterprises in the manufacturing sector have more assets that can serve as collateral for a loan. This factor reduces information asymmetries between the enterprise and the lenders, so these enterprises have greater probability of access to credit. Baker et al. (2020) agrees that SMEs in the manufacturing sector with tangible assets are more likely to obtain external financing than enterprises in the service sector with fewer tangible assets. In addition, manufacturing SMEs use long-term financing and other sources of financing, while service SMEs use short-term financing.
2.2.4. Legal status
According to Guercio et al. (2020), an enterprise incorporated with a legal form that limits patrimonial responsibility, such as corporations or limited liability enterprises, influence on access to credit because they are more transparent, in relation to those enterprises that do not limit patrimonial responsibility.
Briozzo, Vigier, Castillo et al. (2016) identified that enterprises with limited liability use long-term credits more frequently than those enterprises that do not have this legal form; this result also presents significant differences and coincides with the compensation theory. In addition, they infer that banks consider limited liability as a positive factor that indicates credibility, formality of operations, and represents signs of potential growth. Therefore, they identify a positive relationship between limited liability and access to bank credit.
In the same vein, Baker et al. (2020) point out that limited liability enterprises have a greater preference for all kinds of financing sources than sole proprietorships. Briozzo and Vigier (2014) in their research indicate that enterprises that are constituted as limited liability enterprises are expected to have more attractive bank credit opportunities. On the other hand, Demirgüç-Kunt et al. (2006) in their research found that enterprises report fewer financial obstacles to their growth than unincorporated enterprises, and this advantage is greater in countries with more developed institutions and favorable business environments.
2.2.5. Foreign participation and export capacity
Foreign ownership is a variable that influences the search for financing because foreign parent enterprises, which are likely to be large enterprises, may be the main source of financing for subsidiaries, reducing the need for external financing (Xiang et al., 2015). Foreign-owned or multinational enterprises are expected to face fewer financial obstacles because they have easier access to international sources of external financing (Beck, Demirgüç-Kunt, Laeven et al., 2006).
On the other hand, Pasquini and De Giovanni (2010) showed that enterprises are more likely to access external financing if they export part or all their sales. Baker et al. (2020) mention that Indian SMEs that have export activity are influenced in the use of their financing sources.
2.2.6. Entrepreneur attributes
In general, enterprises with managers with little experience and a low level of education are more likely to have restrictions on accessing external financing (Cowling et al., 2016). Baker et al. (2020) mention that older managers or owners’ resort to more formal debt (short-term and long-term financing) than their younger counterparts. Also, owners with significant work experience use more short-term financing or other forms of financing than those with little experience.
Various studies emphasize that women-owned enterprises face more difficulties in accessing business credit (Chaudhuri et al., 2020). Also, enterprises managed women are less probability to access credit and have to pay higher interest rates (Muravyev et al., 2009; Presbitero et al., 2014).
According to Baker et al. (2020) male managers or owners choose to use internal financing sources, as well as credits, however, women use other forms of financing more, such as commercial credits, moneylender resources, loans from relatives and friends, as well as funds from other enterprises. However, in other studies carried out to analyze the effect of gender on access to formal financing, they did not identify evidence of gender discrimination in obtaining credit (Aterido et al., 2013; Bardasi et al., 2011).
2.3. Empirical studies on the determinants of bank financing
This section briefly presents, in chronological order, the most significant empirical studies on the determinants of bank financing of SMEs developed in recent decades internationally. Table A1 in the appendix presents a summary indicating the sample (country, size, and period) of the study, the variables of interest related to this research, the methodology, and the main results.
Despite the great diversity of empirical studies, the only one that was identified in the context of SMEs in Mexico was the study by Gómez et al., (2009), whose objective was to identify the restrictions in the approval of a bank loan, it focused on the ambit of credit supply. In addition, its sample was limited to 128 SMEs in the manufacturing sector of Puebla, Mexico between 2007 and 2008. In contrast, this research focuses on the field of credit demand with a sample of 1,480 representative enterprises by enterprise size, by region and by economic sector of Mexico.
3. Data and Methodology
3.1. Sample and Data
The data collection instrument used is the questionnaire of the main module of the Enterprise Surveys of Mexico 2010, carried out by the World Bank through face-to-face interviews with managers and owners of enterprises in Mexico between the 17th of August 2010 and June 30, 2011 (World Bank, 2011). At the time of carrying out this research, this survey was the last applied in Mexico and includes the necessary data to develop the objectives of this research.
The target population it was made up of enterprises with five or more employees in the manufacturing, commerce, and services sectors, located in the eight regions of Mexico with the greatest economic activity. The sample was selected through stratified random sampling. The final sample was 1,480 enterprises, enough large and representative by enterprise size (small, medium, and large), by economic sector (manufacturing, commerce, and services) and by geographic region (World Bank, 2011).
3.2. Variables
The variables were defined conceptually in accordance with the provisions of the items of the main module of the Enterprise Surveys of Mexico 2010 (World Bank, 2010). The operational definitions contribute to establishing the way in which the research variables will be measured, see details in Table 1.
3.3. Research hypothesis
The central hypothesis that guided the research was in the sense of affirming that the economic sector; the enterprise size; the characteristics inherent to the enterprise; legal status; the variables linked to the performance of the enterprise; and the attributes of the owner significantly influence the access to bank financing of SMEs in Mexico. In this sense, the operational hypotheses were:
- H1. Economic sector. Enterprises in the manufacturing sector are more likely to access bank loans than those in other sectors. In contrast, those in the services sector are less likely to have access to bank financing than those in other sectors.
- H2. Enterprise size. The larger the enterprise, the greater the access to bank financing. Small enterprises are less likely to access bank loans.
- H3. Enterprise age. The older the enterprises, the greater the access to bank financing. Older enterprises are more likely to access bank loans.
- H4. Foreign participation. Foreign-owned enterprises are less likely to use bank credit.
- H5. Legal status. Enterprises legally incorporated as society or associations are more likely to access bank loans than enterprises that have a sole owner.
- H6. Exporter. Exporting enterprises are more likely to use bank loans.
- H7. Checking/saving account. Enterprises that have a checking or savings account are more likely to access bank financing.
- H8. Annual sales. The higher the annual sales of the enterprises, the greater the access to bank credits.
- H9. Permanent employees. The more full-time permanent employees an enterprise has, the greater the probability of accessing bank financing.
- H10. Manager female. Enterprises in which the general manager is a woman are less likely to access bank loans.
- H11. Manager experience. Enterprises in which the general manager has more experience are more likely to use bank financing.
3.4. Research design
Using a discrete response probit regression model, the degree of impact that the independent or explanatory variables have on the probability of obtaining a bank loan was determined, so the study has a quantitative approach with a correlational scope. Likewise, the research design is non-experimental and cross-sectional (Hernández-Sampieri and Mendoza, 2018).
4. Empirical results
4.1. Characterization of the sample and descriptive statistics
Table 2 shows the integration of the sample of surveyed enterprises. Likewise, the description of the binary independent variables with respect to the dependent variable is presented. In general, only 48.3% of the enterprises surveyed indicated that they had a bank loan. From these data, some a priori significant differences can be observed.
Source: Own elaboration based on data analysis.
Table 3 shows the relationship of the quantitative independent variables with respect to having a credit or bank loan. For example, the average age of enterprises that have a bank loan is 25.9 years (higher than the average of the sample, which is 24), while those that do not have it is 22.2 years.
Table 4 presents the summary of the basic descriptive statistical analyzes of each one of the independent variables.
4.2. Correlations
Table A2 in the appendix presents the correlation matrix to determine the relationship or dependency that exists between the independent variables of the research. The results of these correlations are consistent with the context of the growth of Mexican enterprises, measured through their annual sales and permanent employees, as well as their legal status. A larger share of small enterprises is managed by a single owner, with low annual sales and few employees, compared to large enterprises. In fact, the last two criteria (annual sales and employees) are used in Mexico to classify enterprises by size.
4.3. Multivariate analysis: Probit regression model
To determine which enterprise characteristics explain whether or not it has a bank loan, we perform a multivariate analysis using a probit regression model. The proposed model is a binary probit, which is used when the dependent variable is dichotomous, which is why it is considered a binary or discrete response model and its main objective is to determine the response probability (Wooldridge, 2010). Therefore, the following equation of the probit model is proposed to determine the probability that an enterprise will access a bank loan:
where Y = Bank credit, is the explained or binary dependent variable, which takes the value of 1 (one) if the enterprise has a bank credit and 0 (zero) otherwise. The explanatory variables that can potentially be incorporated into the model represent various specific characteristics (defined in Table 1) of the enterprise that determine access to bank credit.
Y = α + β1 *Manufacturing + β2 *Commerce + β3 *Services + β4 *Small + β5 *Medium + β6 *Large + β7 *Age + β8 *Foreign + β9 *Single owner + β10 *Society or association + β11 *Exporter + β12 *Checking/saving account + β13 *Annual Sales + β14 *Permanent employees + β15 *Manager female + β16 * Manager experience + ℇⅈ
Tests were carried out with different variables alternatively, starting from the broadest model that included all the potentially explanatory variables until reaching other more restricted models that included only the significant variables according to estimated models or previous empirical studies. Based on various combinations, more than 60 models were determined. Table A3 in the appendix presents the summary of the main results of the 10 models that were considered most relevant. According to the regression models, the variables that are considered most significant determinants or predictors for obtaining a bank loan are: manufacturing sector, services sector, small size, age of the enterprise, foreign participation, checking-savings account, and annual sales.
Belonging to the manufacturing sector is a robust predictor, in most models it has a significance of 99% and the coefficients have a probability greater than 22% with a positive effect. On the other hand, the services variable has a significance of 99% in most of the models and its coefficients have a probability greater than 26% with a negative effect. For example, in the M1 model, an enterprise that operates in the manufacturing sector has a 23.42% higher probability of accessing a bank loan than an enterprise that does not belong to said sector; while in the M2 model, a service sector enterprise is 26.26% less likely to obtain a loan than its counterparts. The small size variable is one of the most robust predictors, a small enterprise has between 30.08% and 40.51% less probability of accessing a bank loan than its counterparts and in all models, it has a significance of 99%.
The age of the enterprise is one of the most solid predictors of bank credit, in most models it has a significance of 95% and all its coefficients resulted with the expected positive effect. Foreign participation is one of the most robust determinants, in all models it has a significance of 99% and with estimated probabilities greater than 49% with a negative effect. Holding a checking or savings account is considered another determinant, although not as robust because it only has a significance of 90% and with estimated probabilities greater than 13.97% with a positive effect. Annual sales is a variable with mixed results, in some models it has a significance of 99%, while in others it is 90% and in the models M1, M4 and M6 it is not significant. However, it is considered a determinant of bank financing because its estimated probabilities were greater than 44% and with the expected positive sign. Regarding the other variables, they are not considered determinants of access to bank loans because they were not significant in the regression models in which they were included.
Regarding the goodness-of-fit measures of the models, McFadden’s R2 is low; however, these models are considered to have acceptable predictive power because the percentage of correct predictions in relation to the total number of observations is greater than 61% in all models, so all are classified as if they were 1. Likewise, in models with discrete response, what is important is that the expected signs of the regression coefficients are in harmony with other studies and coincide in practice with the business context (Gujarati and Porter, 2010).
4.4. Profiles Analysis
Subsequently, the three most relevant models (M1, M2 and M3) were selected to determine the various profiles with their estimated probability that an enterprise has a bank loan based on the independent variables that were significant in each model. For reasons of space, only the profiles of the M1 model are shown in Table A4 of the appendix.
In determining the estimated probability of profile 1 of each model, the significant variables are considered with a reference value. In the binary variables, the value of 1 (one) was taken, which indicates that they do have said characteristic; in the age variable, the average in years of the sample was taken; and in annual sales, the upper value of quantile 1 was taken. In the probabilities of the other profiles (Profile 2 to Profile X) the values of the significant variables of profile 1 are maintained and only the value of the variable of interest is modified that you want to change in each profile; in the case of binary variables, it was changed with a value of 0 (zero) which indicates that they do not have said characteristic; in the age variable it was changed to other values progressively; and in annual sales, it was changed by the value of quantiles 2, 3, and 4. The estimated probabilities of each profile are compared by a difference with the probability of profile 1 to determine the importance of each variable.
According to profile 1 of the M1 model, a small enterprise that belongs to the manufacturing sector, with 24 years of life (average of the sample), with foreign participation and with a bank account has a probability of having a bank credit of 51.58%. Starting from profile 1 of each model, other alternate profiles were created to analyze the influence of each independent variable on access to bank financing.
In the profiles of the M1 model in Table A4 of the appendix, age is shown as the determinant with the greatest impact on access to bank financing. According to profile 1, the probability that an enterprise with 24-year-old has a bank loan is 51.58%, while when changing to one year (profile 4) it only has a probability of 3.21%, that is, 48.36% less of probability. As age increases, the probability of having a bank loan gradually increases. The second most relevant variable is foreign participation; the probability of having a bank loan in profile 1 is 51.58%, while an enterprise that does not have one (profile 9) is 71.35%, that is, 19.77% more probability. The third and fourth variables with the greatest influence are small size and manufacturing, respectively.
5. Discussion and conclusions
5.1. Contributions of the research
Based on the predictive power acceptable of the estimated binary probit regression models, the operational hypotheses were contrasted, for which the following conclusions are established:
- H1. Economic sector. It is confirmed that enterprises in the manufacturing sector are more probability to access bank loans than enterprises in other economic sectors; while those in the service sector are the least likely to have access to bank financing. In the same way, it is confirmed that the commerce variable does not have a significant relationship with the dependent variable, as had been proposed in the hypothesis.
- H2. Enterprise size. It was confirmed that small enterprises are less probability to access bank loans. Regarding the large variable, the hypothesis that the larger the companies, the greater the access to bank financing is rejected. On the other hand, it is confirmed that the medium enterprise variable does not have a significant relationship with the dependent variable.
- H3. Enterprise age. It is confirmed that older enterprises are more probability to access bank financing. The age of the enterprise is the most robust predictor of bank credit, according to the profile analysis, as the age of the enterprise increases, the probability of acquiring a bank loan increases progressively.
- H4. Foreign participation. It confirms that foreign - owned enterprises are less likely to obtain bank financing because foreign parent enterprises are the main source of financing for their subsidiaries.
- H5. Legal status. This hypothesis is partially confirmed. On the one hand, it is rejected that enterprises legally constituted as societies or associations are more likely to use bank financing than enterprises that have a sole owner because it did not result significantly in any of the regression models in which this variable was included. On the other hand, it is confirmed that the single owner variable does not have a significant influence on access to bank credit.
- H6. Exporter. The hypothesis that there is a positive relationship between exporting enterprises and the probability of using bank loans is rejected, it was only 90% significant in models M2 and M8, however, in all other models it was not significant.
- H7. Checking/saving account. It is confirmed that enterprises that have a checking or savings account are more likely to acquire bank loans than an enterprise that does not have such an account.
- H8. Annual sales. It is confirmed that enterprises with higher annual sales are more likely to use bank financing.
- Hypothesis H9, H10, and H11. The hypotheses H9, H10, and H11 are rejected, the regression models indicate that there is no significant relationship between the independent variables (permanent employees, manager female, and experience of the general manager) with the dependent variable, so they are not considered determinants of the access to bank financing.
In summary, based on the profile analysis, it was concluded that the enterprise age is the determinant with the greatest impact on the probability of having a bank loan, it is followed by other predictors such as foreign participation, small size, and the manufacturing sector. Annual sales also have an influence on the dependent variable. However, it is recommended to treat this result with reserve in future research because in the regression models it had mixed results, in some models it has a significance of 99%, while in others it was 90% and in others it was not significant, therefore which is not considered a robust determinant of bank financing.
Based on the conclusions of the previous results, Table 5 presents a summary of the comparison of the hypotheses (expected effect) with the empirical results (real effect) on the probability of accessing bank loans. Likewise, both the empirical studies that coincide with the results and those that do not coincide are shown.
Based on the probit regression models and the profiles analysis, it is concluded that age, small size, foreign participation, and manufacturing sector are the most influential determinants in bank financing; this means that younger, small, foreign-owned, and non-manufacturing firms are the least probability to obtain bank credit.
Additionally, it is concluded that the financial hierarchy theory applies to the financing decisions of SMEs because when they are young, they prefer internal sources of financing that imply lower information costs and less risk, as well as due to their restricted access to external sources. The financial life cycle theory also applies to SMEs because when they are young and small, they are less transparent in their information, so they are mainly financed with their own funds. However, as the enterprise grows and becomes older, it gains more experience and the opacity of information decreases, so its financial needs change.
It should be noted that this research is pioneering because through a discrete response probit regression model, as well as through profile analysis, the variables with the greatest influence on the probability of obtaining a bank loan were identified. As far as is known, there are no other studies that address this issue with this methodology in Mexico. Due to the above, this research is relevant because it provides findings on the determinants of access to bank financing in SMEs in Mexico that contribute to solving this complex problem.
5.2. Research recommendations and limitations
Business financing in Mexico is a challenge that must be addressed urgently. A fundamental challenge is to understand that SMEs have very different structures from large enterprises and that the sources of financing to capitalize this type of business must be more accessible and with special mechanisms, so it is recommended to implement innovative public policies that favor access financing under the best conditions for this business sector.
Likewise, it is recommended that the banking system, government, and enterprises implement permanent training campaigns on financial education aimed at owners and managers of SMEs and micro-enterprises to encourage their participation in the financial sector, as well as learn about other alternatives for financing that contributes to improve their competitiveness.
One of the limitations of this study is related to the database, which was collected between 2010 and 2011 through the World Bank survey of enterprises. However, data collection through a direct survey was not considered feasible due to the high costs involved. Likewise, an extensive search of secondary data was carried out and it was identified that the World Bank survey of enterprises was the last one carried out for Mexico, and it is also the most appropriate according to the available data and the objectives of this research. Once the World Bank updates the enterprises survey for Mexico, it is recommended to replicate this research to have more recent data and compare the findings with this study.
Author Contributions
Conceptualization, A.J.R. and J.Z.P.; methodology, A.J.R. and C.S.G.L.; software, A.J.R. and C.S.G.L.; validation, A.J.R. and C.S.G.L.; formal analysis and investigation, A.J.R. and C.S.G.L.; resources, A.J.R; data curation, A.J.R.; writing—review and editing, A.J.R., C.S.G.L. and J.Z.P.; supervision, C.S.G.L. and J.Z.P.; project administration, A.J.R. All authors have read and agreed to the published version of the manuscript.
Funding
This research received no external funding.
Data Availability Statement
The data that support the findings of this study are available from World Bank microdata. Data are however available from the authors upon request.
Conflicts of Interest
The authors declare no conflict of interest.
Appendix

Table A1.
Synthesis of empirical studies on determinants of bank financing.
| Author, year | Sample | Variables of interest related to the study | Methodology | Main results | ||
|---|---|---|---|---|---|---|
| Country | Size | Period | ||||
| Michaelas et al., 1999 | United Kingdom | 3,500 SMEs | 1986-1995 |
|
Panel data analysis |
|
| Beck et al., 2005 | 54 countries | 4,000 small, medium, and large enterprises | 1995-1999 |
|
Estimated regression |
|
| Gregory et al., 2005 | USA | 4,637 SMEs | 1994-1995 |
|
Multinomial LOGIT model |
|
| Beck, Demirgüç-Kunt, Laeven et al., 2006 | 80 countries | 10,000 small, medium, and large enterprises | 1995-1999 |
|
PROBIT model |
|
| López-Gracia and Sogorb-Mira, 2008 | Spain | 3,569 SMEs | 1995-2004 |
|
Panel data analysis |
|
| Gomez et al., 2009 | Mexico | 128 SMEs | 2007-2008 |
|
Logistic regression by the Wald method |
|
| Pasquini and De Giovanni, 2010 | Argentina | 5,536 SMEs | 2009 |
|
Heckmann’s correction |
|
| Cowling et al., 2012 | United Kingdom | 9,362 SMEs | 2007-2008 |
|
Multivariate regression |
|
| Botello, 2015 | Colombia | 85,000 SMEs | 2006-2010 |
|
Logit modelProbit model |
|
| Xiang et al., 2015 | Australia | 2,732 SMEs | 2005 - 2007 |
|
Panel data analysis |
|
| Briozzo, Vigier and Martinez, 2016 | Argentina | 222 SMEs | 2006 and 2010 |
|
Multinomial logit model |
|
| Cowling et al., 2016 | United Kingdom | More than 30,000 SMEs | 2011-2013 |
|
Probit model |
|
| Yazdanfar and Öhman, 2016 | Sweden | 15,952 SMEs | 2009-2012 |
|
ANOVAmultivariate regressions |
|
| Andrieu et al., 2018 | 12 European countries | 72,849 SMEs | 2009-2014 |
|
Binary probit model |
|
| Rao et al., 2018 | India | 174 SMEs | 2006-2013 |
|
Generalized method of moments |
|
| Nizaeva and Coskun, 2019 | 6 countries of Southeast Europe | 1,520 SMEs | 2012-2016 |
|
Ordered probit.Feasible Generalized Least Squares |
|
| Chaudhuri et al., 2020 | India | 1,155,877 MSMEs | 2006-2007 |
|
Bivariate probit model |
|
Source: Own elaboration based on the authors cited in the table.
Table A2.
Independent variables correlation matrix.
| 1 | 2 | 3 | 4 | 5 | 6 | 7 | 8 | 9 | 10 | 11 | 12 | 13 | 14 | 15 | 16 | |
|---|---|---|---|---|---|---|---|---|---|---|---|---|---|---|---|---|
| 1. Manufacturing | 1.000 | |||||||||||||||
| 2. Commerce | -.620 ** | 1.000 | ||||||||||||||
| 3. Services | -.702 ** | -.124 ** | 1.000 | |||||||||||||
| 4. Small | .008 | .012 | -.022 | 1.000 | ||||||||||||
| 5. Medium | .045 | -.041 | -.020 | -.317 ** | 1.000 | |||||||||||
| 6. Large | -.046 | .024 | .036 | -.590 ** | -.578 ** | 1.000 | ||||||||||
| 7. Single owner | .034 | -.027 | -.019 | .444 ** | .040 | -.415 ** | 1.000 | |||||||||
| 8. Society or association | -.034 | .027 | .019 | -.444 ** | -.040 | .415 ** | -1.00 ** | 1.000 | ||||||||
| 9. Foreign Participation | .017 | .021 | -.041 | -.151 ** | -.119 ** | .231 ** | -.158 ** | .158 ** | 1.000 | |||||||
| 10. Manager female | -.007 | .009 | .001 | .104 ** | .055 * | -.136 ** | .109 ** | -.109 ** | -.050 | 1.000 | ||||||
| 11. Exporter | .177 ** | -.121 ** | -.113 ** | -.229 ** | -.153 ** | .327 ** | -.206 ** | .206 ** | .291 ** | -.064 * | 1.000 | |||||
| 12. Checking/saving account | -.011 | .016 | -.001 | -.115 ** | -.051 | .143 ** | -.142 ** | .142 ** | .067 * | .015 | .091 ** | 1.000 | ||||
| 13. Enterprise age | .121 ** | -.038 | -.118 ** | -.198 ** | -.072 ** | .231 ** | -.146 ** | .146 ** | .048 | -.036 | .159 ** | .091 ** | 1.000 | |||
| 14. Manager experience | .109 ** | -.075 ** | -.069 ** | -.056 * | -.060 * | .099 ** | -.057 * | .057 * | -.043 | -.082 ** | .040 | .031 | .396 ** | 1.000 | ||
| 15. Annual sales | -.053 * | .084 ** | -.009 | -.616 ** | -.210 ** | .709 ** | -.498 ** | .498 ** | .300 ** | -.184 ** | .386 ** | .205 ** | .308 ** | .111 ** | 1.000 | |
| 16. Permanent employees | -.012 | .034 | -.016 | -.649 ** | -.226 ** | .750 ** | -.485 ** | .485 ** | .264 ** | -.174 ** | .387 ** | .180 ** | .323 ** | .125 ** | .877 ** | 1.000 |
Note: **. The correlation is significant at the 0.01 level (2 tails). *. The correlation is significant at the 0.05 level (2 tails). Source: Own elaboration based on the data analysis carried out in SPSS.
Table A3.
Summary of the most relevant probit models. Dependent variable: Bank credit.
| Variable | M1 | M2 | M3 | M4 | M5 | M6 | M7 | M8 | M9 | M10 |
|---|---|---|---|---|---|---|---|---|---|---|
| Constant | -1,484*** | -1,474*** | -1,758*** | -1,460*** | -1,330*** | -1,158** | -1,630*** | -1.333*** | -1,250*** | -1,648*** |
| (0.4757) | (0.3570) | (0.3809) | (0.5154) | (0.4491) | (0.5129) | (0.4653) | (0.3740) | (0.3923) | (0.3898) | |
| Economic sector | ||||||||||
| Manufacturing | 0.2342*** | 0.2595*** | 0.3019*** | 0.2254** | 0.2341*** | |||||
| (0.08990) | (0.08794) | (0.1109) | (0.08961) | (0.08971) | ||||||
| Commerce | 0.1574 | -0.1445 | -0.1563 | |||||||
| (0.1586) | (0.1302) | (0.1295) | ||||||||
| Services | -0.2626** | -0.2898*** | -0.3019*** | -0.2682** | -0.3001*** | |||||
| (0.1092) | (0.1087) | (0.1109) | (0.1093) | (0.1106) | ||||||
| Enterprise size | ||||||||||
| Small | -0.3008*** | -0.3988*** | -0.3332*** | -0.4051*** | -0.3334*** | -0.4051*** | -0.3537*** | -0.3670*** | -0.3167*** | -0.3381*** |
| (0.1097) | (0.1020) | (0.1070) | (0.1343) | (0.1061) | (0.1343) | (0.1048) | (0.1040) | (0.1090) | (0.1069) | |
| Medium | -0.08779 | -0.08779 | ||||||||
| (0.1059) | (0.1059) | |||||||||
| Large | 0.09026 | 0.1343 | 0.1186 | 0.1207 | ||||||
| (0.1056) | (0.09902) | (0.09962) | (0.09941) | |||||||
| Characteristics inherent to the enterprise | ||||||||||
| Age | 0.08218* | 0.09239** | 0.08904** | 0.06748 | 0.08906** | 0.06748 | 0.08293* | 0.09085** | 0.08532** | 0.08756** |
| (0.04336) | (0.04268) | (0.04255) | (0.04609) | (0.04311) | (0.04609) | (0.04297) | (0.04300) | (0.04301) | (0.04262) | |
| Foreign Participation | -0.5240*** | -0.5337*** | -0.5004*** | -0.5147*** | -0.4928*** | -0.5147*** | -0.5210*** | -0.5346*** | -0.5349*** | -0.5308*** |
| (0.1296) | (0.1302) | (0.1269) | (0.1308) | (0.1249) | (0.1308) | (0.1300) | (0.1297) | (0.1296) | (0.1303) | |
| Legal status of the enterprise | ||||||||||
| Single owner | -0.1108 | -0.09194 | -0.1231 | -0.09194 | -0.1244 | -0.1170 | ||||
| (0.09938) | (0.09991) | (0.09887) | (0.09991) | (0.09876) | (0.09918) | |||||
| Society or association | ||||||||||
| Linked to enterprise performance | ||||||||||
| Exporter | 0.1191 | 0.1681* | 0.1240 | 0.1240 | 0.1291 | 0.1646* | 0.1309 | 0.1301 | ||
| (0.09663) | (0.09452) | (0.09695) | (0.09695) | (0.09613) | (0.09454) | (0.09646) | (0.09641) | |||
| Checking/saving account | 0.1418* | 0.1471* | 0.1476* | 0.1397* | 0.1397* | 0.1468* | 0.1415* | 0.1424* | 0.1475* | |
| (0.07558) | (0.07531) | (0.07544) | (0.07597) | (0.07597) | (0.07542) | (0.07544) | (0.07557) | (0.07546) | ||
| Annual sales | 0.05445 | 0.07233*** | 0.07256*** | 0.04485 | 0.06348* | 0.04485 | 0.06184* | 0.06568*** | 0.05864** | 0.06647*** |
| (0.03511) | (0.02145) | (0.02357) | (0.03563) | (0.03360) | (0.03563) | (0.03473) | (0.02222) | (0.02468) | (0.02399) | |
| Permanent employees | 0.02387 | 0.03470 | 0.04105 | 0.03470 | 0.03869 | |||||
| (0.05339) | (0.05347) | (0.04890) | (0.05347) | (0.05014) | ||||||
| Entrepreneur attributes | ||||||||||
| Manager female | -0.06397 | -0.06397 | ||||||||
| (0.1130) | (0.1130) | |||||||||
| Manager experience | 0.05697 | 0.05697 | ||||||||
| (0.05922) | (0.05922) | |||||||||
| Observations | 1374 | 1376 | 1376 | 1365 | 1376 | 1365 | 1375 | 1375 | 1375 | 1376 |
| McFadden’s R2 | 0.0639 | 0.0620 | 0.0623 | 0.0650 | 0.0604 | 0.0650 | 0.0632 | 0.0624 | 0.0640 | 0.0632 |
| Log-likelihood | -890.9 | -894.0 | -893.7 | −884.2 | -895.5 | -884.2 | -892.2 | -892.9 | -891.4 | -892.8 |
| Akaike criterion | 1803.9 | 1803.9 | 1803.4 | 1796.3 | 1807.0 | 1796.3 | 1802.5 | 1803.9 | 1804.8 | 1803.6 |
| Schwarz criterion | 1861.3 | 1845.7 | 1845.2 | 1869.4 | 1848.8 | 1869.4 | 1849.5 | 1850.9 | 1862.3 | 1850.6 |
| Hannan–Quinn criterion | 1825.4 | 1819.6 | 1819.1 | 1823.7 | 1822.7 | 1823.7 | 1820.1 | 1821.5 | 1826.3 | 1821.2 |
| Correctly predicted cases | 63.3% | 62.6% | 63.8% | 63.2% | 63.7% | 63.2% | 63.3% | 61.7% | 63.1% | 63.2% |
Note: The coefficients of each variable are reported in the first row. QML standard deviations are reported in parentheses in the second row of each variable. To measure the degree of significance, the following is used: * for a confidence level of 90%; ** for 95% confidence; and *** for 99% confidence. For probit, the R2 is the McFadden pseudo-R2. An empty cell indicates that this variable was not included in the model. Source: Own elaboration based on the regression models estimated in Gretl.
Table A4. Profiles of the M1 probit model. Dependent variable: Bank credit. 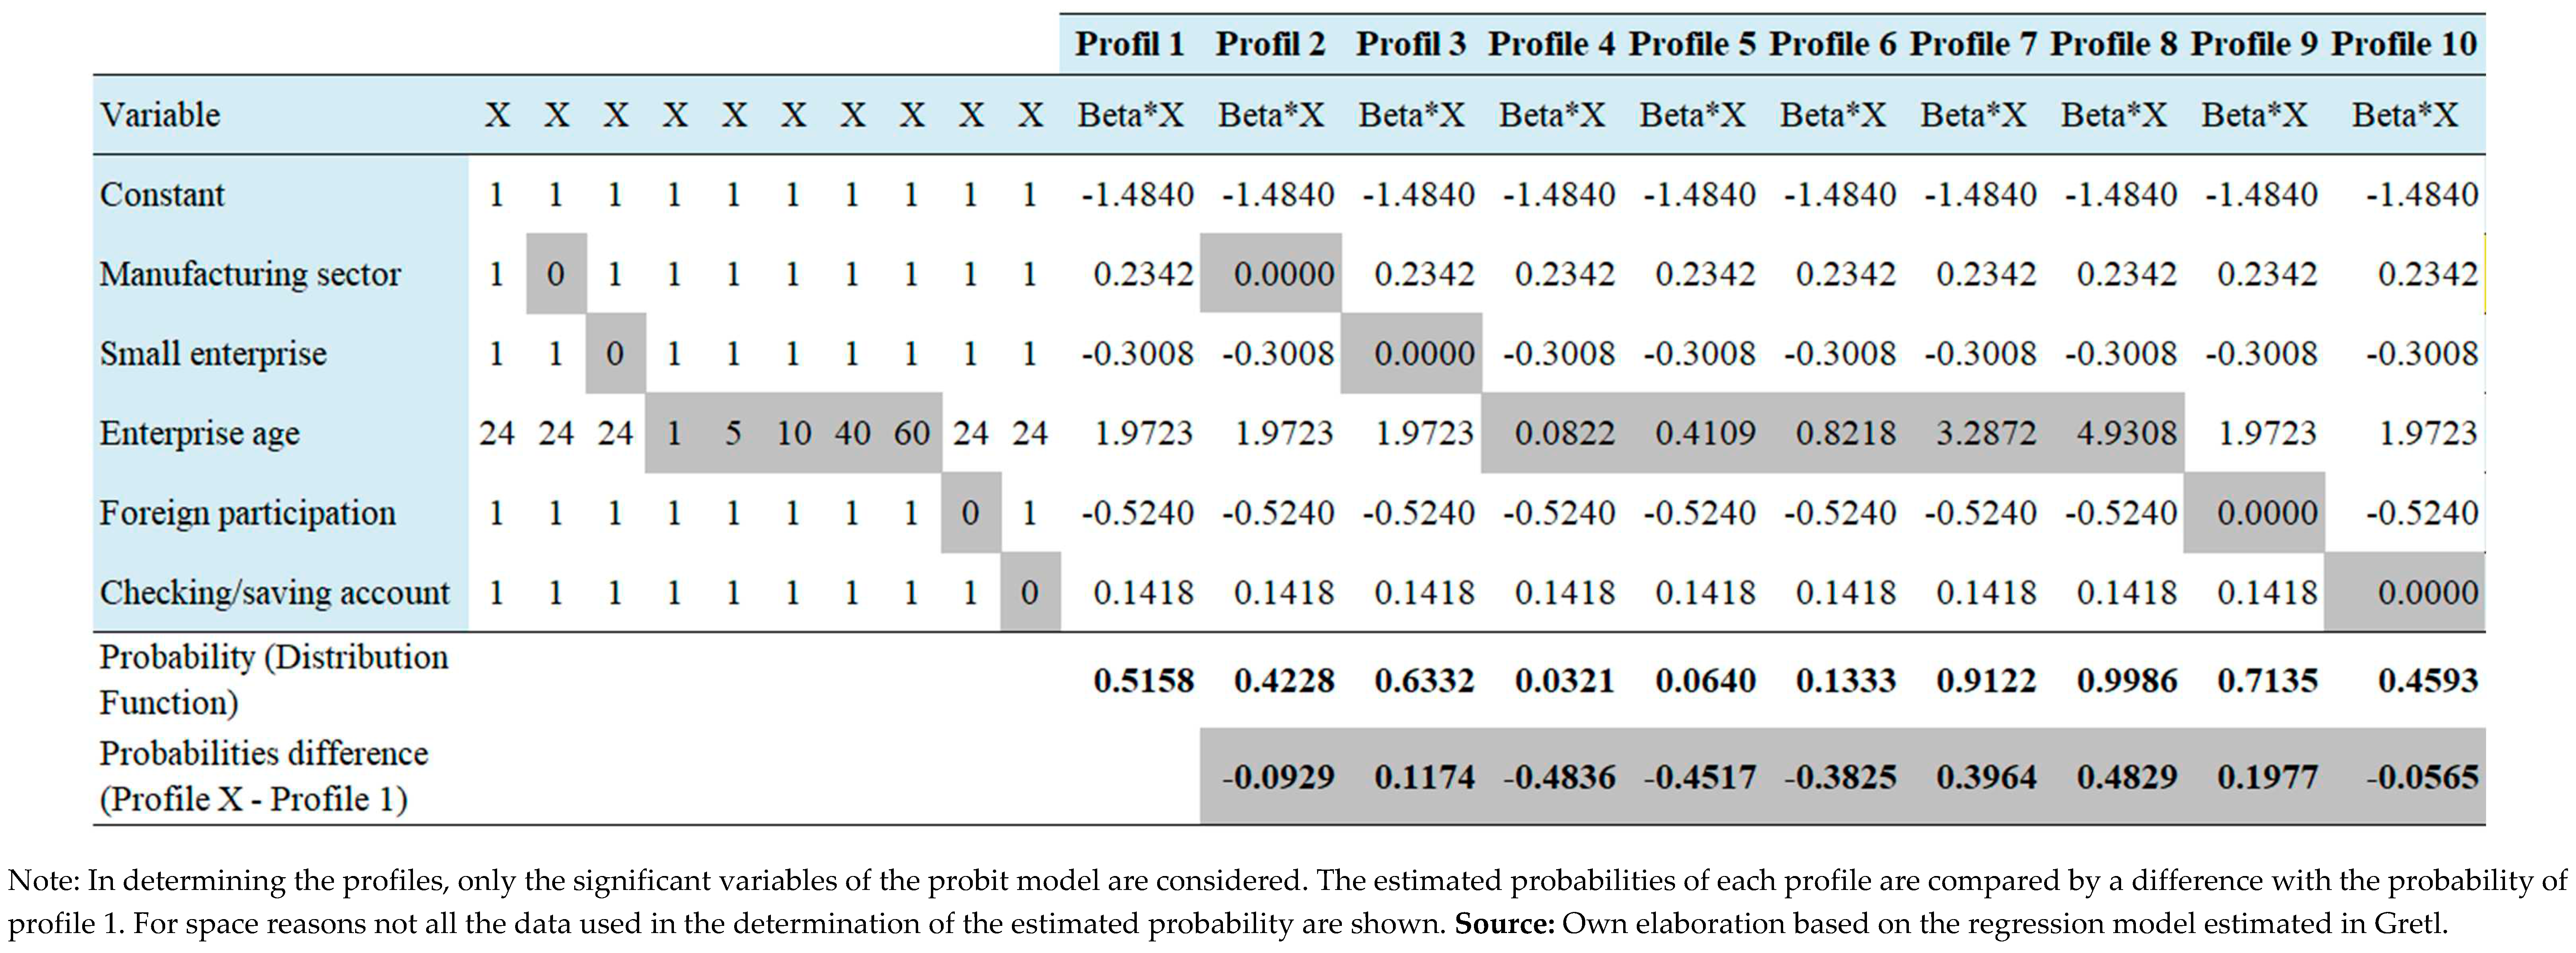
References
- Andrieu, G.; Staglianò, R.; van der Zwan, P. Bank debt and trade credit for SMEs in Europe: firm-, industry-, and country-level determinants. Small Bus. Econ. 2018, 51, 245–264. [Google Scholar] [CrossRef]
- Aterido, R.; Beck, T.; Iacovone, L. Access to Finance in Sub-Saharan Africa: Is There a Gender Gap? World Dev. 2013, 47, 102–120. [Google Scholar] [CrossRef]
- Baker, H.K.; Kumar, S.; Rao, P. Financing preferences and practices of Indian SMEs. Glob. Finance J. 2017, 43, 100388. [Google Scholar] [CrossRef]
- Bank of Mexico (Banco de México). (2022a). Evolución del Financiamiento a las Empresas durante el Trimestre octubre - diciembre de 2021. Available online: https://www.banxico.org.mx/publicaciones-y-prensa/evolucion-trimestral-del-financiamiento-a-las-empr/%7B7F3AFEC9-A775-BC0B-1640-5950FAAE46E3%7D.pdf.
- Bank of Mexico (Banco de México). (2022b). Resultados de la encuesta de evaluación coyuntural del mercado crediticio, octubre - diciembre 2021. Available online: https://www.banxico.org.mx/SieInternet/consultarDirectorioInternetAction.do?accion=consultarCuadro&idCuadro=CF471§or=19&locale=es.
- Bardasi, E.; Sabarwal, S.; Terrell, K. How do female entrepreneurs perform? Evidence from three developing regions. Small Bus. Econ. 2011, 37, 417–441. [Google Scholar] [CrossRef]
- Beck, T.; Demirguc-Kunt, A. Small and medium-size enterprises: Access to finance as a growth constraint. J. Bank. Finance 2006, 30, 2931–2943. [Google Scholar] [CrossRef]
- Beck, T.; Demirgüç-Kunt, A.; Laeven, L.; Maksimovic, V. The determinants of financing obstacles. J. Int. Money Finance 2006, 25, 932–952. [Google Scholar] [CrossRef]
- Beck, T.; Demirgüç-Kunt, A.; Maksimovic, V. Financial and Legal Constraints to Growth: Does Firm Size Matter? J. Finance 2005, 60, 137–177. [Google Scholar] [CrossRef]
- Berger, A.N.; Udell, G.F. The economics of small business finance: The roles of private equity and debt markets in the financial growth cycle. J. Bank. Financ. 1998, 22, 613–673. [Google Scholar] [CrossRef]
- Botello, H. (2015). Determinantes del acceso al crédito de las PYMES en Colombia. Ensayos de Economía, 25(46), 135-156. 5363. Available online: https://revistas.unal.edu.co/index.php/ede/article/view/53631/53078.
- Bougheas, S.; Mizen, P.; Yalcin, C. Access to external finance: Theory and evidence on the impact of monetary policy and firm-specific characteristics. J. Bank. Finance 2006, 30, 199–227. [Google Scholar] [CrossRef]
- Briozzo, A.; Vigier, H. The role of personal loans in the financing of SMEs. Academia Revista Latinoamericana de Administración 2014, 27, 209–225. [Google Scholar] [CrossRef]
- Briozzo, A.; Vigier, H.; Martinez, L.B. Firm-Level Determinants of the Financing Decisions of Small and Medium Enterprises: Evidence from Argentina. Lat. Am. Bus. Rev. 2016, 17, 245–268. [Google Scholar] [CrossRef]
- Briozzo, A.; Vigier, H.; Pesce, G.; Castillo, N.; Speroni, M.C. Decisiones de financiamiento en pymes: ¿existen diferencias en funcioÌn del tamaño y la forma legal? Estud. Gerenciales 2016, 71–81. [Google Scholar] [CrossRef]
- Chaudhuri, K.; Sasidharan, S.; Raj, R.S.N. Gender, small firm ownership, and credit access: some insights from India. Small Bus. Econ. 2018, 54, 1165–1181. [Google Scholar] [CrossRef]
- Chittenden, F.; Hall, G.; Hutchinson, P. Small firm growth, access to capital markets and financial structure: Review of issues and an empirical investigation. Small Bus. Econ. 1996, 8, 59–67. [Google Scholar] [CrossRef]
- Cowling, M.; Liu, W.; Ledger, A. Small business financing in the UK before and during the current financial crisis. Int. Small Bus. Journal: Res. Entrep. 2012, 30, 778–800. [Google Scholar] [CrossRef]
- Cowling, M.; Liu, W.; Zhang, N. Access to bank finance for UK SMEs in the wake of the recent financial crisis. Int. J. Entrep. Behav. Res. 2016, 22, 903–932. [Google Scholar] [CrossRef]
- Cressy, R.; Olofsson, C. The Financial Conditions for Swedish SMEs: Survey and Research Agenda. Small Bus. Econ. 1997, 9, 179–192. [Google Scholar] [CrossRef]
- Demirguc-Kunt, A.; Love, I.; Maksimovic, V. Business environment and the incorporation decision. J. Bank. Finance 2006, 30, 2967–2993. [Google Scholar] [CrossRef]
- Fisher, A.J.; Donaldson, G. Corporate Debt Capacity: A Study of Corporate Debt Policy and the Determination of Corporate Debt Capacity. J. Finance 1962, 17, 554. [Google Scholar] [CrossRef]
- Ferrer, M. A. and Tresierra, A. (2009). Las PYMEs y las teorías modernas sobre estructura de capital. Compendium: revista de investigación científica, (22), 65-84. Available online: https://www.researchgate.net/publication/44897242.
- Gómez, A. , García, D. and Marín, S. (2009). Restricciones a la financiación de las PYME en México: una aproximación empírica. Análisis Económico, 24(57), 217-238. http://www.redalyc.org/articulo.oa? Available online: http://www.redalyc.org/articulo.oa?id=41312227011.
- Gregory, B.T.; Rutherford, M.W.; Oswald, S.; Gardiner, L. An Empirical Investigation of the Growth Cycle Theory of Small Firm Financing. J. Small Bus. Manag. 2005, 43, 382–392. [Google Scholar] [CrossRef]
- Guercio, M.B.; Briozzo, A.E.; Vigier, H.P.; Martinez, L.B. The financial structure of Technology-Based Firms. Revista Contabilidade & Finanças 2020, 31, 444–457. [Google Scholar] [CrossRef]
- Guercio, M.B.; Martinez, L.M.B.; Vigier, H. Las limitaciones al financiamiento bancario de las Pymes de alta tecnologà a. Estud. Gerenciales 2017, 3–12. [Google Scholar] [CrossRef]
- Gujarati, D. N. and Porter, D. C. (2010). Econometría. Ciudad de México, México: McGraw-Hill Education.
- Hall, G.C.; Hutchinson, P.J.; Michaelas, N. Determinants of the Capital Structures of European SMEs. J. Bus. Finance Account. 2004, 31, 711–728. [Google Scholar] [CrossRef]
- Hernández-Sampieri, R. and Mendoza, C. P. (2018). Metodología de la investigación. Las rutas cuantitativa, cualitativa y mixta. Ciudad de México, México: McGraw-Hill Education.
- Hutchinson, P. How Much Does Growth Determine SMEs’ Capital Structure? Small Enterp. Res. 2004, 12, 81–92. [Google Scholar] [CrossRef]
- National Institute of Statistic and Geography (Instituto Nacional de Estadística y Geografía). (2020). Resultados definitivos. Censos Económicos 2019. Available online: https://www.inegi.org.mx/programas/ce/2019/default.html#Documentacion.
- Kumar, S.; Sureka, R.; Colombage, S. Capital structure of SMEs: a systematic literature review and bibliometric analysis. Manag. Rev. Q. 2019, 1–31. [Google Scholar] [CrossRef]
- La Rocca, M.; La Rocca, T.; Cariola, A. Capital Structure Decisions During a Firm’s Life Cycle. Small Bus. Econ. 2009, 37, 107–130. [Google Scholar] [CrossRef]
- López-Gracia, J.; Sogorb-Mira, F. Testing trade-off and pecking order theories financing SMEs. Small Bus. Econ. 2008, 31, 117–136. [Google Scholar] [CrossRef]
- Bhaird, C.m.A.; Lucey, B. Determinants of capital structure in Irish SMEs. Small Bus. Econ. 2009, 35, 357–375. [Google Scholar] [CrossRef]
- Michaelas, N.; Chittenden, F.; Poutziouris, P. Financial Policy and Capital Structure Choice in U.K. SMEs: Empirical Evidence from Company Panel Data. Small Bus. Econ. 1999, 12, 113–130. [Google Scholar] [CrossRef]
- Muravyev, A.; Talavera, O.; Schäfer, D. Entrepreneurs’ gender and financial constraints: Evidence from international data. J. Comp. Econ. 2009, 37, 270–286. [Google Scholar] [CrossRef]
- Myers, S.C. The Capital Structure Puzzle. J. Finance 1984, 39, 574–592. [Google Scholar] [CrossRef]
- Myers, S.C.; Majluf, N.S. Corporate financing and investment decisions when firms have information that investors do not have. J. Financial Econ. 1984, 13, 187–221. [Google Scholar] [CrossRef]
- Nizaeva, M.; Coskun, A. Investigating the Relationship Between Financial Constraint and Growth of SMEs in South Eastern Europe. SAGE Open 2019, 9. [Google Scholar] [CrossRef]
- Pasquini, R. and De Giovanni, M. (2010). Access to financing of SMEs in Argentina. Working Papers No. 2010/08, CAF Development Bank Of Latinamerica, 1-51.
- Petersen, M.A.; Rajan, R.G. The Benefits of Lending Relationships: Evidence from Small Business Data. J. Finance 1994, 49, 3–37. [Google Scholar] [CrossRef]
- Presbitero, A.F.; Rabellotti, R.; Piras, C. Barking up the Wrong Tree? Measuring Gender Gaps in Firm’s Access to Finance. J. Dev. Stud. 2014, 50, 1430–1444. [Google Scholar] [CrossRef]
- Rao, P.; Kumar, S. Reflection of owner’s attributes in financing decisions of SMEs. Small Enterp. Res. 2018, 25, 52–68. [Google Scholar] [CrossRef]
- Serrasqueiro, Z.; Nunes, P.M. Is Age a Determinant of SMEs’ Financing Decisions? Empirical Evidence Using Panel Data Models. Entrep. Theory Pr. 2012, 36, 627–654. [Google Scholar] [CrossRef]
- Wooldridge, J. M. (2010). Econometric Analysis of Cross Section and Panel Data. Cambridge, Massachusetts, London, England: The MIT Press.
- World Bank. (2010). Enterprise Surveys 2010, Documentation, Core Questionnaire, Mexico. Available online: https://microdata.worldbank.org/index.php/catalog/870/download/19386.
- World Bank. (2011). Enterprise Surveys 2010, Documentation, Description of Mexico ES 2010 Implementation. Available online: https://microdata.worldbank.org/index.php/catalog/870/download/19390.
- Xiang, D.; Worthington, A.C.; Higgs, H. Discouraged finance seekers: An analysis of Australian small and medium-sized enterprises. Int. Small Bus. Journal: Res. Entrep. 2014, 33, 689–707. [Google Scholar] [CrossRef]
- Yazdanfar, D.; Öhman, P. Capital structure dynamics among SMEs: Swedish empirical evidence. J. Risk Finance 2016, 17, 245–260. [Google Scholar] [CrossRef]
Table 1.
Conceptual and operational definitions of the variables.
| Item | Variables | Concept definition | Operational definition |
|---|---|---|---|
| Dependent variable | |||
| k8 | Bank credit | Indicates whether the enterprise has a bank loan from any financial institution. | Binary variable, where 1 indicates whether the enterprise has a bank loan and 0 otherwise. |
| Economicsector | |||
| a4a | Manufacturing | Includes enterprises that carry out their main activity in the manufacturing sector according to the classification of item a4a. | It was recoded to a dummy variable, where 1 indicates that the enterprise DOES belong to this economic sector and 0 that it does NOT belong to this sector. |
| a4a | Commerce | Includes enterprises that carry out their main activity in the commerce sector according to the classification of item a4a. | It was recoded to a dummy variable, where 1 indicates that the enterprise DOES belong to this economic sector and 0 that it does NOT belong to this sector. |
| a4a | Services | Includes enterprises that carry out their main activity in the services sector according to the classification of item a4a. | It was recoded to a dummy variable, where 1 indicates that the enterprise DOES belong to this economic sector and 0 that it does NOT belong to this sector. |
| Enterprise size | |||
| a6a | Small | A small enterprise is considered if it has between 5 and 19 employees. | It was recoded to a dummy variable, where 1 indicates that the enterprise DOES correspond to this size and 0 that it does NOT correspond. |
| a6a | Medium | A medium enterprise is considered if it has between 20 and 99 employees. | It was recoded to a dummy variable, where 1 indicates that the enterprise DOES correspond to this size and 0 that it does NOT correspond. |
| a6a | Large | A large enterprise is considered if it has 100 or more employees. | It was recoded to a dummy variable, where 1 indicates that the enterprise DOES correspond to this size and 0 that it does NOT correspond. |
| Characteristics inherent to the enterprise | |||
| b5 | Age | It represents the number of years between the start of operations of the enterprise and the year in which the survey was applied. | Quantitative variable. Logarithm of the enterprise age in number of years. |
| b2b | Foreign Participation | It means that private foreign persons, enterprises, or organizations have an ownership interest in the enterprise. | It was recoded to a dummy variable, where 1 indicates that the enterprise has a % of foreign ownership and 0 otherwise. |
| Legal status of the enterprise | |||
| b1 | Single owner | Represents the legal status of the enterprise when it has a sole owner | It was recoded to a dummy variable, where 1 indicates that the enterprise has a sole owner and 0 otherwise |
| b1 | Society or association | It represents the legal status of the enterprise when it is legally constituted as a society or association of any type. | It was recoded to a dummy variable, where 1 indicates that the enterprise is legally constituted as a society or association of any type and 0 otherwise. |
| Linked to enterprise performance | |||
| d3c | Exporter | It means that the enterprise makes direct exports of a percentage or the total of its sales. | It was recoded to a dummy variable, where 1 indicates that the enterprise directly exports part or all its sales and 0 otherwise. |
| k6 | Checking/saving account | Indicates whether the enterprise has a checking or savings bank account at the time of the survey. | Binary variable, where 1 indicates whether the enterprise has a checking or savings bank account and 0 otherwise. |
| d2 | Annual sales | Total annual sales in pesos of the last fiscal year of the enterprise. | Quantitative variable. Logarithm of the total annual sales in pesos of the last fiscal year of the enterprise. |
| l1 | Permanent employees | Full-time permanent employees of the enterprise at the end last fiscal year. | Quantitative variable. Logarithm of the total number of permanent full-time employees in the last fiscal year of the enterprise. |
| Entrepreneur attributes | |||
| b7a | Manager female | Indicates when the general manager of the enterprise is a woman. | Binary variable, where 1 indicates if the general manager of the enterprise is a woman and 0 otherwise. |
| b7 | Manager experience | It represents the number of years of experience of the general manager working in the sector. | Quantitative variable. Logarithm of the number of years of experience of the general manager working in the sector. |
Source: Own elaboration based on research.
Table 2.
Binary variables by group of enterprises (with and without bank credit).
| Sample | Bank credit | |||||
|---|---|---|---|---|---|---|
| Independent variable | Total | % | No | % | Yes | % |
| Manufacturing | 1145 | 77.8% | 569 | 49.7% | 576 | 50.3% |
| Commerce | 144 | 9.8% | 83 | 57.6% | 61 | 42.4% |
| Services | 182 | 12.4% | 109 | 59.9% | 73 | 40.1% |
| 1471 | 100% | 761 | 51.7% | 710 | 48.3% | |
| Small | 358 | 24.3% | 251 | 70.1% | 107 | 29.9% |
| Medium | 349 | 23.7% | 182 | 52.1% | 167 | 47.9% |
| Large | 764 | 51.9% | 328 | 42.9% | 436 | 57.1% |
| 1471 | 100% | 761 | 51.7% | 710 | 48.3% | |
| Single owner | 319 | 21.7% | 209 | 65.5% | 110 | 34.5% |
| Society or Association | 1151 | 78.3% | 551 | 47.9% | 600 | 52.1% |
| 1470 | 100% | 760 | 51.7% | 710 | 48.3% | |
| No foreign participation | 1324 | 90.1% | 676 | 51.1% | 648 | 48.9% |
| With foreign participation | 145 | 9.9% | 84 | 57.9% | 61 | 42.1% |
| 1469 | 100% | 760 | 51.7% | 709 | 48.3% | |
| General manager is not a woman | 1310 | 89.1% | 665 | 50.8% | 645 | 49.2% |
| General manager is Female | 160 | 10.9% | 96 | 60.0% | 64 | 40.0% |
| 1470 | 100% | 761 | 51.8% | 709 | 48.2% | |
| Non-exporter | 1160 | 78.9% | 636 | 54.8% | 524 | 45.2% |
| Exporter | 311 | 21.1% | 125 | 40.2% | 186 | 59.8% |
| 1471 | 100% | 761 | 51.7% | 710 | 48.3% | |
| No checking/savings account | 506 | 34.5% | 299 | 59.1% | 207 | 40.9% |
| With checking/savings account | 961 | 65.5% | 460 | 47.9% | 501 | 52.1% |
| 1467 | 100% | 759 | 51.7% | 708 | 48.3% | |
Table 3.
Quantitative variables by group of enterprises (with and without bank credit).
| Bank credit | |||
|---|---|---|---|
| Independent variable | Sample average | No | Yes |
| Enterprise age (average years) | 24.0 | 22.2 | 25.9 |
| Manager experience (average years) | 23.0 | 22.3 | 23.8 |
| Permanent employees (average number) | 216.2 | 170.0 | 267.8 |
| Annual sales Quantile 1 (%) | 72.4% | 27.6% | |
| Quantile 2 (%) | 49.4% | 50.6% | |
| Quantile 3 (%) | 43.2% | 56.8% | |
| Quantile 4 (%) | 41.3% | 58.7% | |
Source: Own elaboration based on data analysis.
Table 4.
Summary of basic descriptive statistics of the variables.
| Variable | Obs. | Minimum | Maximum | Mean | Standard deviation |
|---|---|---|---|---|---|
| Manufacturing | 1480 | 0 | 1 | 0.7784 | 0.4155 |
| Commerce | 1480 | 0 | 1 | 0.0986 | 0.2983 |
| Services | 1480 | 0 | 1 | 0.1230 | 0.3285 |
| Small | 1480 | 0 | 1 | 0.2446 | 0.4300 |
| Medium | 1480 | 0 | 1 | 0.2372 | 0.4255 |
| Larger | 1480 | 0 | 1 | 0.5182 | 0.4998 |
| Single owner | 1478 | 0 | 1 | 0.2185 | 0.4134 |
| Society or association | 1478 | 0 | 1 | 0.7815 | 0.4134 |
| Foreign Participation | 1478 | 0 | 1 | 0.0981 | 0.2976 |
| Manager female | 1479 | 0 | 1 | 0.1089 | 0.3116 |
| Exporter | 1480 | 0 | 1 | 0.2115 | 0.4085 |
| Checking/saving account | 1475 | 0 | 1 | 0.6549 | 0.4756 |
| Enterprise age (Log)* | 1470 | 0.0000 | 5.3083 | 2.8686 | 0.8593 |
| Manager experience (Log)* | 1467 | 0.0000 | 4.1744 | 2.9697 | 0.6430 |
| Annual Sales (Log)* | 1396 | 10.5970 | 27.6310 | 16.7550 | 2.3187 |
| Permanent employees (Log)* | 1479 | 0.6932 | 9.9968 | 3.8116 | 1.5840 |
Note *: The four quantitative independent variables are presented in their logarithm of the real value as mentioned in the operational definition of the variables. Source: Own elaboration based on the data analysis carried out in SPSS.
Table 5.
Summary of hypotheses and empirical results on access to bank credit.
| Variables | Hypothesis | Expected effect | Real effect | Empirical studies coincident with results | Empirical studies do not coincide with results |
|---|---|---|---|---|---|
| Economicsector | |||||
| Manufacturing | H1 | Positive | Positive | Beck, Demirgüç-Kunt, Laeven et al., 2006 Botello, 2015 Briozzo, Vigier and Martinez, 2016 Andrieu et al., 2018 |
|
| Commerce | H1 | NS | NS | Xiang et al., 2015 Cowling et al., 2016 |
Positive effect: Nizaeva and Coskun, 2019 |
| Services | H1 | Negative | Negative | Botello, 2015 | |
| Enterprise size | |||||
| Small | H2 | Negative | Negative | Michaelas et al., 1999 Beck et al., 2005 Beck, Demirgüç-Kunt, Laeven et al., 2006 López-Gracia and Sogorb-Mira, 2008 Gómez et al., 2009 Pasquini and De Giovanni, 2010 Botello, 2015 Xiang et al., 2015 Briozzo, Vigier and Martinez, 2016 Cowling et al., 2016 Yazdanfar and Öhman, 2016 Andrieu et al., 2018 Rao et al., 2018 |
|
| Medium | H2 | NS | NS | Nizaeva and Coskun, 2019 | Positive effect: Gomez et al., 2009 |
| Large | H2 | Positive | NS | Nizaeva and Coskun, 2019 | Positive effect: Beck et al., 2005 Beck, Demirgüç-Kunt, Laeven et al., 2006 |
| Characteristics inherent to the enterprise | |||||
| Age | H3 | Positive | Positive | Beck, Demirgüç-Kunt, Laeven et al., 2006 Botello, 2015 Briozzo, Vigier and Martinez, 2016 Cowling et al., 2016Yazdanfar and Öhman, 2016 Andrieu et al., 2018 Rao et al., 2018 |
Negative effect: Michaelas et al., 1999 López-Gracia and Sogorb-Mira, 2008 Nizaeva and Coskun, 2019 |
| Foreign Participation | H4 | Negative | Negative | Beck, Demirgüç-Kunt, Laeven et al., 2006 Xiang et al., 2015 |
|
| Legal status of the enterprise | |||||
| Single owner | H5 | NS | NS | Andrieu et al., 2018 | |
| Society or association | H5 | Positive | NS | No matching study | Positive effect: Briozzo, Vigier and Martinez, 2016 |
| Linked to enterprise performance | |||||
| Exporter | H6 | Positive | NS | Cowling et al., 2012 Cowling et al., 2016 |
Positive effect: Pasquini and De Giovanni, 2010 |
| Checking/saving account | H7 | Positive | Positive | Botello, 2015 Chaudhuri et al., 2020 |
|
| Annual sales | H8 | Positive | Positive | Pasquini and De Giovanni, 2010 Xiang et al., 2015 Rao et al., 2018 |
|
| Permanent employees | H9 | Positive | NS | No matching study | |
| Entrepreneur attributes | |||||
| Manager female | H10 | Negative | NS | No matching study | Negative effect: Cowling et al., 2012 Chaudhuri et al., 2020 |
| Manager experience | H11 | Positive | NS | Cowling et al., 2012 Cowling et al., 2016 |
|
Note: NS = Not significant. In the hypothesis, a significant relationship was not expected and, in the result, a significant relationship between the variables was not obtained. Source: Own elaboration based on research.
Disclaimer/Publisher’s Note: The statements, opinions and data contained in all publications are solely those of the individual author(s) and contributor(s) and not of MDPI and/or the editor(s). MDPI and/or the editor(s) disclaim responsibility for any injury to people or property resulting from any ideas, methods, instructions or products referred to in the content. |
© 2023 by the authors. Licensee MDPI, Basel, Switzerland. This article is an open access article distributed under the terms and conditions of the Creative Commons Attribution (CC BY) license (https://creativecommons.org/licenses/by/4.0/).
Copyright: This open access article is published under a Creative Commons CC BY 4.0 license, which permit the free download, distribution, and reuse, provided that the author and preprint are cited in any reuse.


