Submitted:
07 September 2023
Posted:
11 September 2023
You are already at the latest version
Abstract
It is well known that the size of initial loans approved by private lending agencies (banks, credit unions etc.) corresponds with the median income of the location of the individual, it also corresponds with gender. We wanted to show if it was the case with the PPP. We use standard machine learning techniques such as Lasso and found statistically significant association between gender of business owner and size of initial loan approvals for the State of Arkansas, and Least Squares Regression and Decision Tree regression to find a somewhat tenuous relationship between median income and initial loan approval amount and finally a strong association with the size of business. This has important applications for the equity of access to credit for marginalized peoples.
Keywords:
PPP Loans
; Economic Disparity
; Gender Disparity
- CCS CONCEPTS • GIS • Society and Computing • Economic Disparity
- Economic and business size disparity in accessing the paycheck protection plan.
- ACM Reference Format:
- First Author’s Name, Initials, and Last Name, Second Author’s Name, Initials, and Last Name, and Third Author’s Name, Initials, and Last Name. 2018. The Title of the Paper: ACM Conference Proceedings Manuscript Submission Template: This is the subtitle of the paper, this document both explains and embodies the submission format for authors using Word. In Woodstock ’18: ACM Symposium on Neural Gaze Detection, June 03–05, 2018, Woodstock, NY. ACM, New York, NY, USA, 10 pages. NOTE: This block will be automatically generated when manuscripts are processed after acceptance.
1. Introduction
During the COVID-19 pandemic, the US Government undertook a series of loans to help small businesses stay afloat called the Paycheck Protection Plan, PPP [1] To qualify, businesses had to be among other things, sole proprietors, independent contractors, self-employed persons, nonprofits, veteran’s organizations, or tribal businesses. This resulted in over half a trillion dollars in loans disbursed by mid 2020 [2]. It is estimated however that 75% of the funds went to the top 25% of households [3,4]. Indeed, the disparity in the distribution follows well known trends that one’s race, gender, and income adversely affect one’s ability to access credit [5,6,7].
We wanted to find out if the story was repeated for the State of Arkansas, i.e., all else being equal does gender, race and economic position affect the size of the initial approval amount of PPP loans. Our method differs from that employed by Demko & Sant’Anna [2021] in that we fix for rural and urban businesses by first discretizing the data at the zip code level, the running assumption being that income disparities within a zip code are mostly negligible. We also differ from the analysis of Autor, Cho, Crane et. al. [2022] in that our analysis is focused primarily on the State of Arkansas and we are more focused on race, gender, and median income of recipient zip codes. We will perform four separate analyses. We will perform a linear and decision tree regression to show that in zip codes with higher median incomes the initial approval amounts of loans is higher. We see a weak correlation, but we emphasize that it is expected, because businesses in richer neighborhoods are expected to have higher payroll costs and overhead, and in this regard, we also deviate from Demko and Sant’Anna [2021].
We notice that larger initial approval amounts are strongly correlated with the size of business, again this seems fair, and weakly with median income of zip code. Unfortunately, with a lasso regression method, adjusting for zip codes, and adjusting for business size (in number of employees) we see a stark difference in the initial size of loans approved for women, and minority owned businesses.
2. Exploratory Data Analysis in Arkansas
Our data, collected from the Small Business Administration consists of loans spanning March 2020 to approx. December 2021. Data for the relevant State of Arkansas consisted of eleven million such loans, which when plotted shows a large density of loans in Pulaski County, of which Little Rock is the county seat, and near Memphis, and far less density of loans in the regions that are the Ozark National Forest.
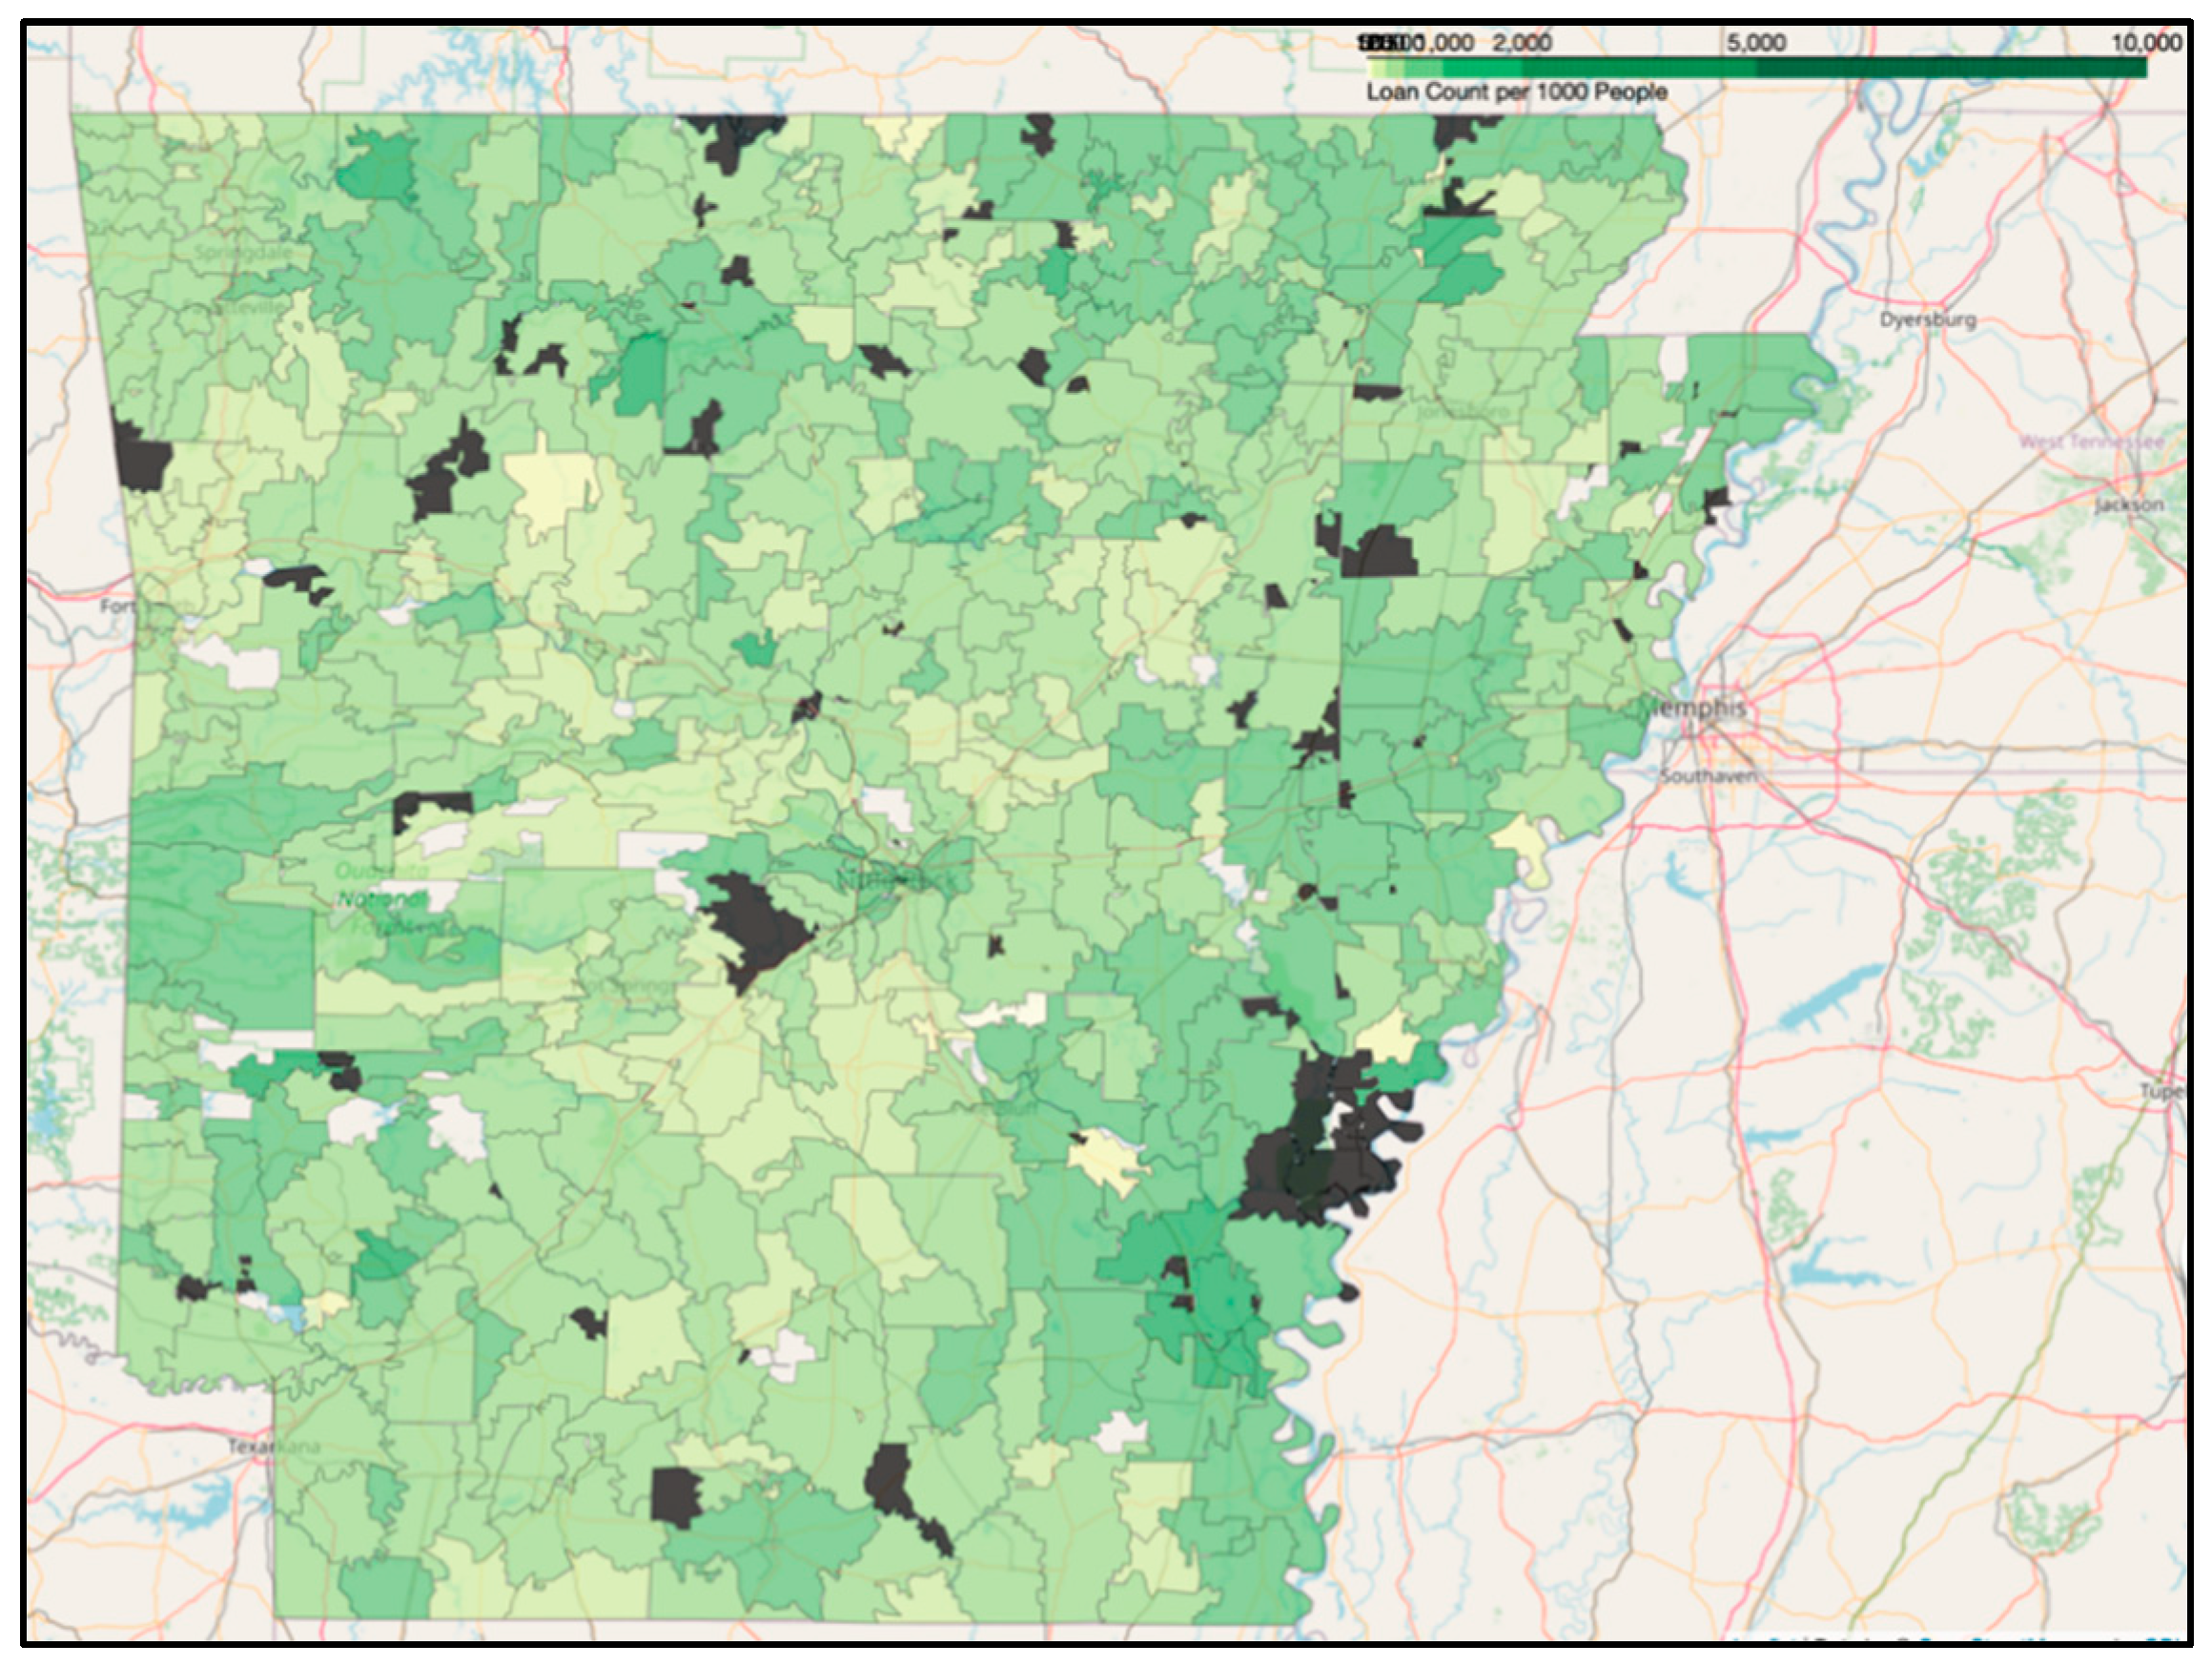
Figure 1.
Number of PPP Loans per one thousand people by Zip Code. Darker shades are higher amounts.
Figure 1.
Number of PPP Loans per one thousand people by Zip Code. Darker shades are higher amounts.
3. Gender Trend in Arkansas
Our median income data came from census.gov website. After wrangling we end up with a dataset of about eleven million rows. This is interesting and the authors’ best guess is that it includes multiple loans given to individuals, loans given to businesses and individuals and such. Data were combined to zip codes (we have 555 zip codes for Arkansas), and business size (number of employees). Our predictors are Gender, Business Size, Median Income of Zip Code, with data being predicted as Initial Loan Approval Amount. We use Lasso Regression for less computational overhead, which looks to minimize:
We choose this as we expect some degree of multicollinearity, we also chose a beta. We note that all else being equal, which in this case means within the same zip code and within business of the same size (number of employees), businesses owned by women tended to receive smaller Initial Loan Approval Amounts. In fact, we received an R2- value of 0.711 showing that a large predictor of the loans were gender and business size. Our F-statistic also show the same. In the next section we will see that business size is THE indicator for loan size.
4. Trends at the National Level
We perform two separate analyses of median income versus size of loans at the national level, one a simple linear regression and the other a decision tree regression, as we expect a not so straightforward linear relationship, and potential noise especially at the level of the entire country.
We do the same two analyses with business size versus initial loan approval amount. A first exploratory data analysis shows surprisingly refreshing trends. The largest proportion of loans went to Accommodation and Food Services, Construction, Health and Social Assistance, and Professional, Scientific and Technical Services, with NAICS codes, 72, 23, 62, and 54 respectively, and the least number going to Public Administration, Management of Companies and Enterprise, and Utilities with NAICS codes 55, 92, and 22 respectively.
We also notice that the least amount of dollar loans per capita happen in typically poorer states (in terms of GPD per capita), for instance Mississippi, Alabama, Arkansas, Oklahoma, and New Mexico. This is expected again, because of easier overhead in meeting payroll (lower minimum wage) and overall smaller costs of running a business [10].
One anomalous state here happens to be North Dakota. Per Capita North Dakotans received more money in loans that even states with more economic activity such as Texas, California, and New York. The authors are unsure why this is the case but hypothesize that this could be a product of the high number of gas extraction businesses in the region. A similar argument could be made for the District of Columbia where in 2013 it was estimated that the population of D.C. swelled by 79% due to commuters commuting from outside the district. [11]
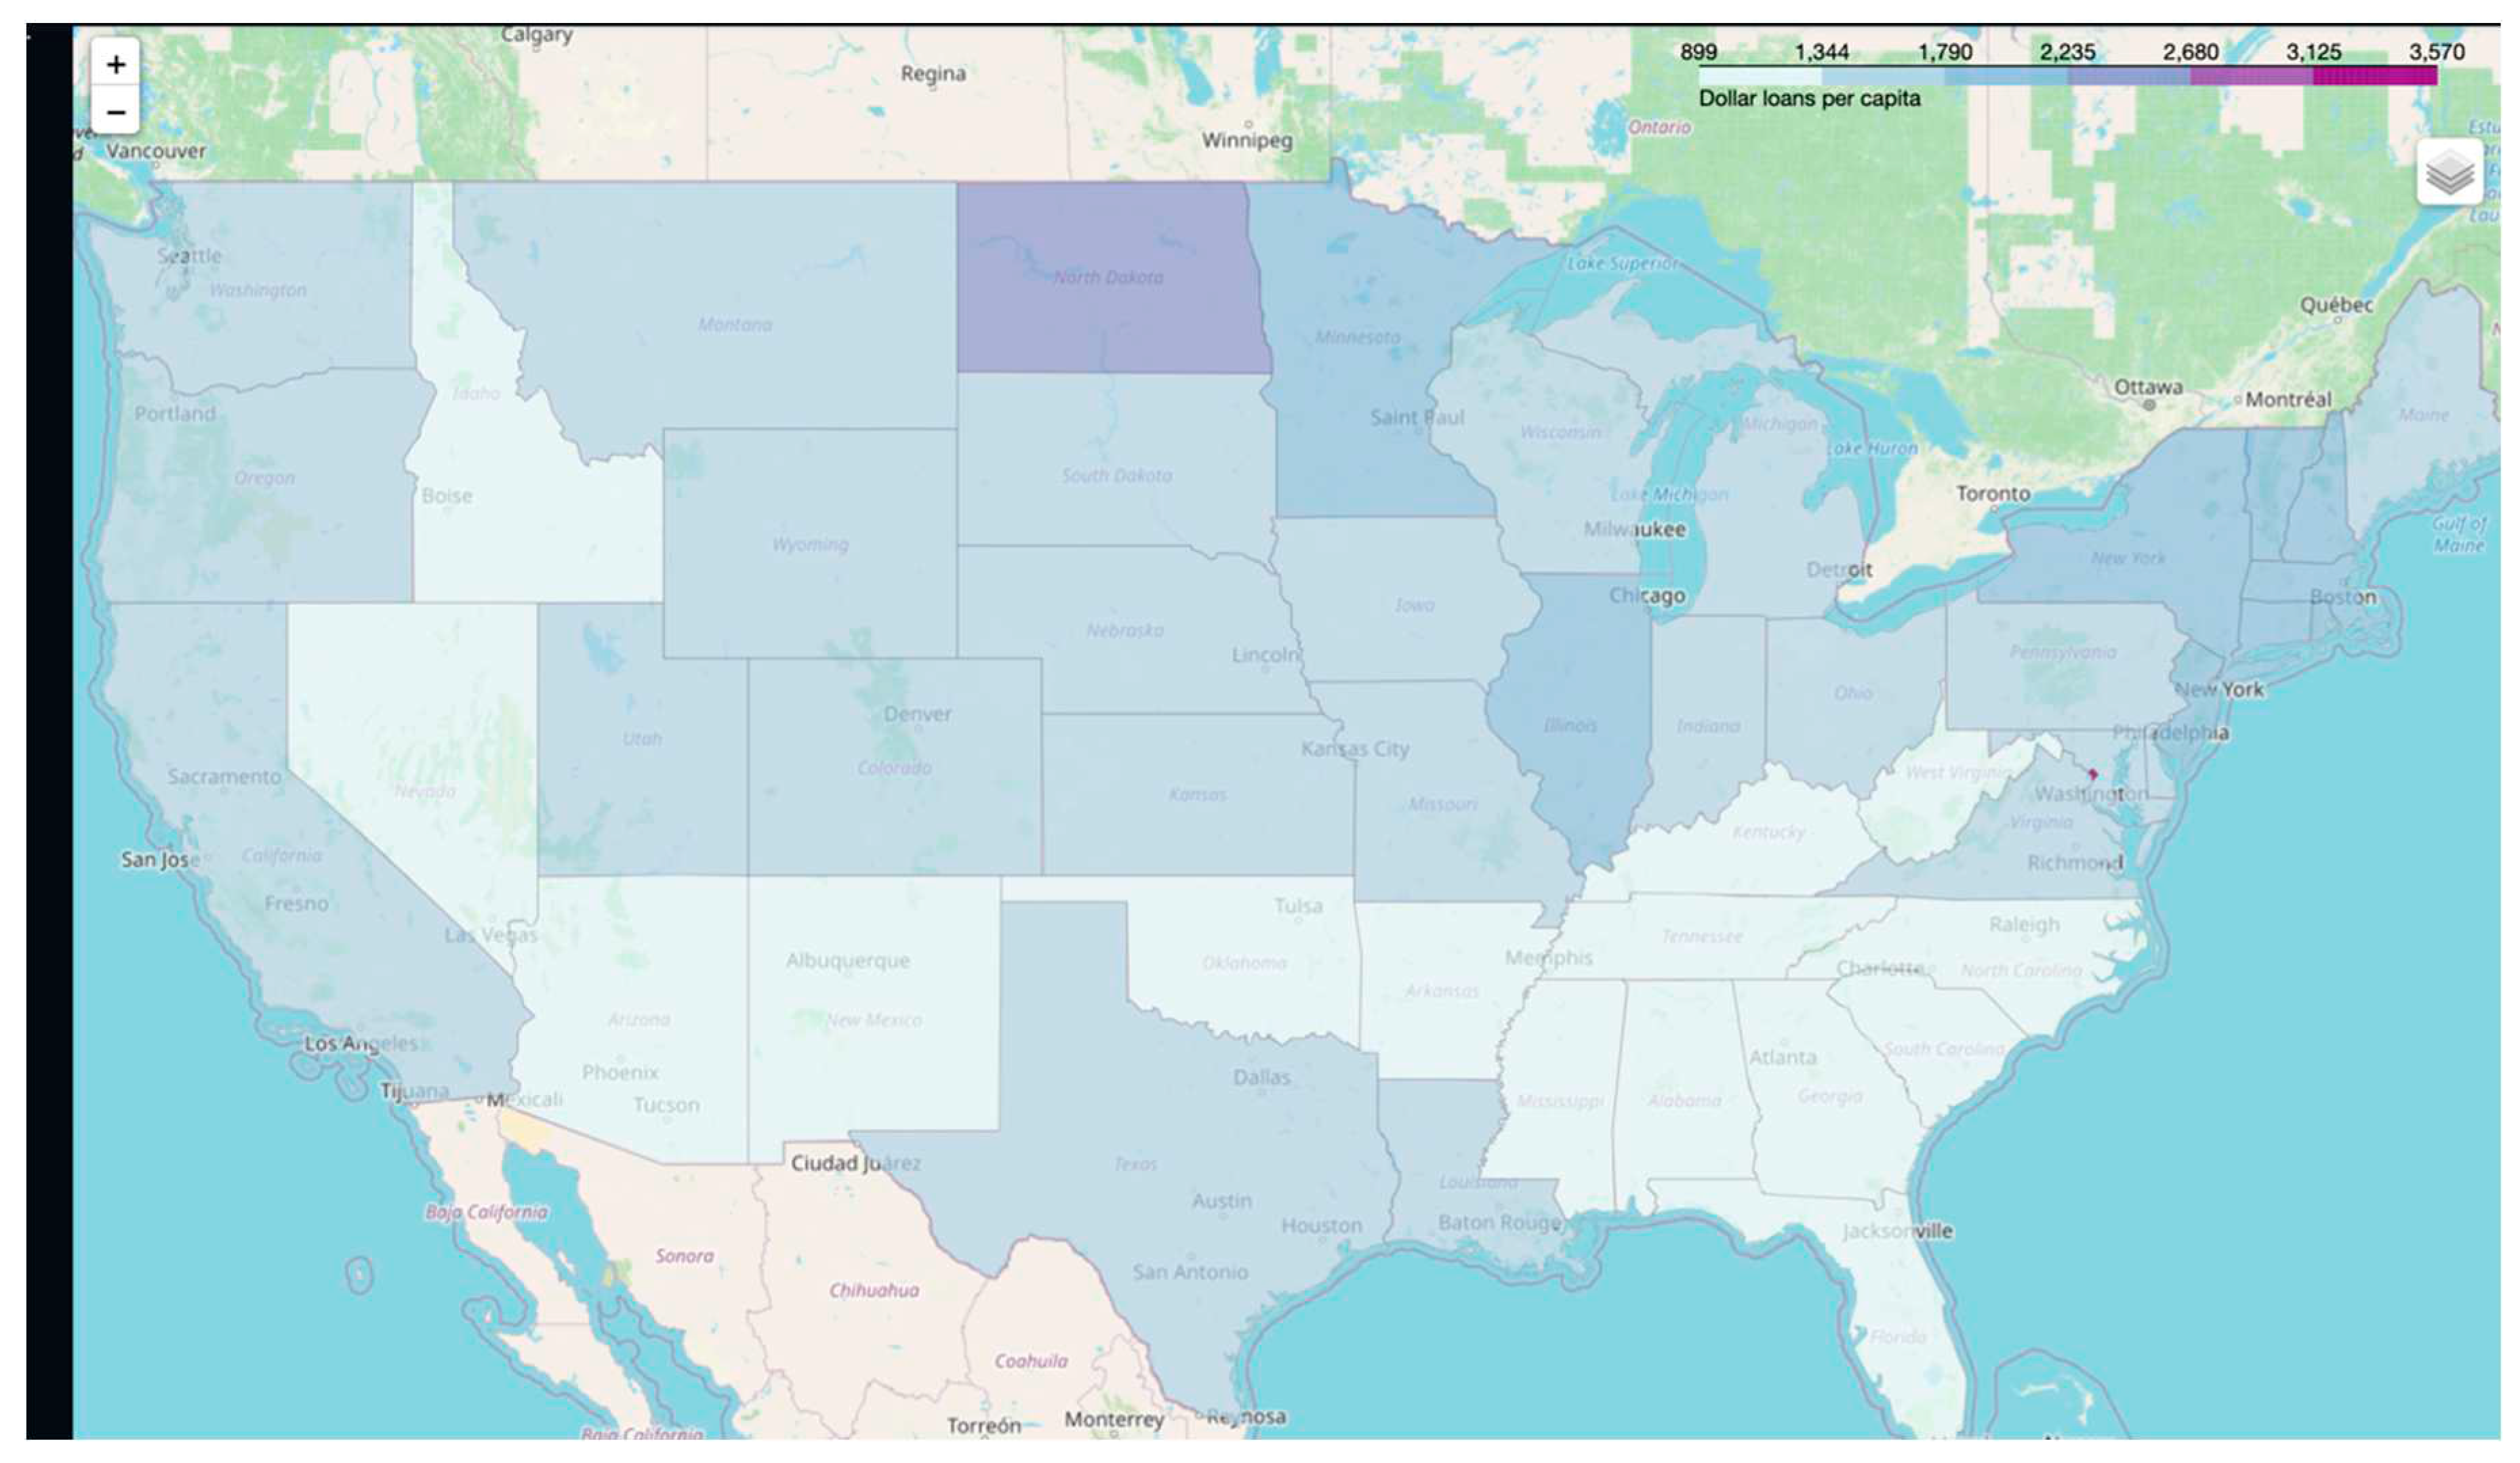
Figure 2.
Loan Dollar Amount Per Capita.
5. Median Income Vs Loan Approval Amount
We notice that in talking about business sizes there are “whales”, that is, extremely large businesses that took in loans more than $250,000. We filtered our data to include businesses that took in between two standard deviations of the mean, 96% of the data. This allows the explanation for the largest amount of data without compromising the model with excessively large loans.
We notice a weak correlation with a correlation coefficient of R= 0.19, showing a rather weak correlation, even by the standards of such messy data. In fact, the idea of a linear correlation between zip code and median income data has poor explanatory power with an R2 = 0.04. However there really is a statistically significant relation with a p-value < 0.001.
To evaluate the hypothesis that relation might be non-linear and to reinforce what we have, we also try a decision tree regression model with similar results as indicated in the table.
| Correlation coefficient | R2-score | p-value | Error estimates | |
| Simple Linear Regression | 0.19 | 0.04 | <0.0001 | Mean Absolute Error = 23225, after 10-fold cross-validation |
| Decision tree regression. | 0.19 | 0.05 | <0.0001 | Mean Absolute Percentage Error = 0.55, after one run. |
While this is not a direct contradiction of Hopkins, Johnson, and Rebala [2020] for the Center for Public Integrity, or in fact the analysis Sweikhart and Borawski [2021] for the Federal Reserve Bank of Cleveland, it seems to indicate that the relationship between poorer neighborhoods and the amount of loans they received is much more complicated than a simple “poorer places get smaller loans”. A complex interplay between economic position and access to credit is to be expected from the literature.
In future analysis the authors seek to tease out the exact relation between median income and size of loans. A significant hurdle exists in that the PPP loans are at a resolution of the zip code level, while demographic and economic data, mainly from the US Census are at the level of census tracts. Conversion between the two is non-trivial but possible.
6. Business Size Versus the Size of Loan Approval Amount
We expected the same dynamics to play out on a national level as it did for the State of Arkansas. Namely that the overwhelming explanatory power of the size of the loan approval amount comes from the business size. This is indeed desirable as it suggest a fairer distribution of funds, that businesses that needed larger loans the most (larger businesses) tended to receive said larger loans. Larger firms, not only have larger payrolls but also have much more sophisticated cost structure and complexity [13]
We see a strong correlation between firm size and size of loan approvals with a correlation coefficient of . Backed up with an -score of 0.63. A statistically significant correlation exists with a -value of less than 0.0001. We repeated the analysis with a decision tree regressor, and comparable results were reached.
This also tracks with the idea that larger firms are better able to justify their PPP loans, and in fact possibly have fiscal staff who can be put to work in getting said loan. This is a confounding factor, as the presence of fiscal staffs gives firms a better edge over smaller firms in getting loans than simply by their size alone. More research needs to be done in this area.
| Correlation coefficient | R2-score | p-value | Error estimates | |
| Simple Linear Regression | 0.79 | 0.63 | <0.0001 | Mean Absolute Error = 36000, after 10-fold cross-validation |
| Decision tree regression. | 0.79 | 0.64 | <0.0001 | Mean Absolute Error = 38000, after one run. |
This also adds to a list of advantages that larger firms have over small firms, namely economies of scale, access to better capital, and now more favorable loans from the PPP. However, despite this smaller firms in US have shown surprising resilience. This is mainly in the adaptation of businesses to be less touch-focused, shifting to mainly or exclusively delivery, and in some cases pivoting the entire business [14]. Smaller size adds a nimbleness and flexibility that larger firms may not be able to match.
7. Conclusion and Future Work
The coronavirus was a once in a generation event. Its impact is to be expected for decades to come. While the medical aspects of the virus, vaccine politics, the need for basic skepticism of online content, have been emphasized in popular media, not as much has been emphasized about the economic, and demographic, the so called “second order” effects of the pandemic.
More research is needed to quantitatively tease out the relation between one’s economic circumstances and the access to PPP Loans. The authors are working on a more sophisticated model for this relation and this report is still a work in progress. The authors also seek to see the interplay between different predictors such as race and urban/rural indicators and the size of the loans received. There is ample research on the relationship between, for instance one’s race and access to credit, and it is worthwhile to investigate this relation vis-à-vis the PPP loans.
Finally, future work is to be expected on the economic impact of the CARES Act, with the counter-factual that had the CARES loans not been given, how much would the economy suffer, was the $2.2 trillion spent on the act “worth it”. However, data for this not as straight-forward to obtain as is the case with PPP Loans.
A large and emerging consensus is arising in the literature of marrying the tools of data science to societal and broad-based issues. Our current ability for processing truly large-scale data enables us to reach quantitatively new conclusions than was possible within earlier eras. This access to data, and the computing resources to parse the data for the average researchers means that the future of social and human sciences is squarely the domain of data science.
Acknowledgments
This work is the result of the first author’s time spent at the Arkansas Summer Research Institute 2022, ASRI22. Special thanks go to Dr. Karl Schubert for obtaining the dataset, and helpful suggestions and work done towards this project. Special thanks also Ms. Jennifer Fowler, Dr. Whitney Holden, and Dr. Patrycja Krakowiak. ASRI is a project of the Arkansas Academy of Arts and Sciences. ASRI is partially funded by NSF EPSCOR and the DART Project. Funding also comes from the Arkansas Economic Development Commission. The authors maintain no conflicts of interest.
References
- The White House. Proclamation on Declaring a National Emergency Concerning the Novel Coronavirus Disease (COVID-19) Outbreak. Retreived from https://trumpwhitehouse.archives.gov/presidential-actions/proclamation-declaring-national-emergency-concerning-novel-coronavirus-disease-covid-19-outbreak/.
- Small Business Administration. Joint Statement by Administrator Jovita Carranza and Secretary Steven T. Mnuchin on the Success of the Paycheck Protection Program. Retreived from: https://www.sba.gov/sites/default/files/2020-04/PPP--IFRN%20FINAL_0.pdf. [Accessed 2023].
- Autor, D.; Cho, D.; Crane, L.D.; Goldar, M.; Lutz, B.; Montes, J.; Peterman, W.B.; Ratner, D.; Daniel; Yildirmaz, A. The $800 Billion Paycheck Protection Program: Where Did the Money Go and Why Did It Go There? Journal of Economic Perspectives 2022, 36, 55–80. [Google Scholar] [CrossRef]
- Borawski, G.; Schweikhart, M.E. How Well Did PPP Loans Reach Low- and Moderate-Income Communities; Federal Reserve Bank of Cleveland: Cleveland, 2021. [Google Scholar]
- Atkins, R.; Cook, L.; Seamans, R. Discrimination in lending? Evidence from the Paycheck Protection Program. Small Bus Econ 2022, 58, 843–865. [Google Scholar] [CrossRef]
- Asiedu, E.; Freeman, J.A.; Nti-Addae, A. Access to Credit by Small Businesses: How Relevant Are Race, Ethnicity, and Gender? American Economic Review 2012, 102, 532–537. [Google Scholar] [CrossRef]
- Iryna Demko and Anna Claudia Sant'Anna. 2021. Impact of Race and Gender on the SBA Paycheck Protection Program (PPP) Loan Amounts. Retrieved 23 from https://papers.ssrn.com/sol3/papers.cfm?abstract_id=3864218.
- Sharon, G. Hadary. Why Are Women-Owned Firms Smaller Than Men-Owned Ones?. 2010. The Wall Street Journal, New York. Retrieved on 23 from https://www.wsj.com/articles/SB10001424052748704688604575125543191609632.
- Office on the Economic Status of Women, The State of Minnesota. Why are women-owned businesses overall smaller than men-owned businesses?(2012). Retrieved on March 2023 from https://www.oesw.mn.gov/PDFdocs/Why%20do%20women%20start%20disproportionately%20fewer%20businesses%20than%20menv2.pdf.
- Tom Huddleston Jr. 2021 These are the cheapest and most expensive states for running a business in 2021. CNBC Inc. Retreived March 2023 from https://www.cnbc.com/2021/10/10/new-study-cheapest-most-expensive-states-to-run-a-business-in-2021.html.
- Martin Austermuhle. 2013. D.C.’s Population Grows 79 Percent Every Workday, Outpacing Other Cities. WAMU 88.5. Retrieved on March 2023 from https://wamu.org/story/13/05/31/dcs_population_grows_79_percent_every_workday_outpacing_other_cities/.
- Jamie Smith Hopkins, Taylor Johnston and Pratheek Rebala. 2020. PPP loans were supposed to prioritize low-income areas during the pandemic. They didn’t. The Center for Public Integrity. Retrieved on 23 from: https://publicintegrity.org/inequality-poverty-opportunity/covid-divide/ppp-loans-did-not-prioritize-low-income-areas-small-businesses-pandemic/.
- Hadid, W.; Hamdan, M. Firm size and cost system sophistication: The role of firm age. The British Accounting Review 2023, 54. [Google Scholar] [CrossRef]
- Tera Allas, Michael Brishan, Anthony Impey, Charlie Mayfield, Jan Mischke and Johnathan Woetzel. 2021. Lessons on Resilience for Small and Midsize Businesses. Harvard Business Review. Retreived on 23 from https://hbr.org/2021/06/lessons-on-resilience-for-small-and-midsize-businesses. [Accessed Mar 2023].
Disclaimer/Publisher’s Note: The statements, opinions and data contained in all publications are solely those of the individual author(s) and contributor(s) and not of MDPI and/or the editor(s). MDPI and/or the editor(s) disclaim responsibility for any injury to people or property resulting from any ideas, methods, instructions or products referred to in the content. |
© 2023 by the authors. Licensee MDPI, Basel, Switzerland. This article is an open access article distributed under the terms and conditions of the Creative Commons Attribution (CC BY) license (http://creativecommons.org/licenses/by/4.0/).
Copyright: This open access article is published under a Creative Commons CC BY 4.0 license, which permit the free download, distribution, and reuse, provided that the author and preprint are cited in any reuse.


