1. Introduction
Concerns over climate change and energy security are pushing the demand for sustainable and reliable alternatives to fossil fuels. In this context, Bio-Electrochemical systems (BES) represent a family of promising technologies for a wide range of applications, which include energy conversion into hydrogen by the so-called Microbial Electrolysis Cells [
1,
2,
3], Microbial Fuel Cells for electrical power generation [
4,
5,
6] and Microbial Electrosynthesis Cells for the valorization of CO2 into new added value products [
7,
8,
9]. As added benefit, BES operation can
valorize the chemical energy entrapped in organic molecules present in wastewaters, facilitating its remediation [
5,
10]. Among BES, Microbial Fuel Cells (MFCs) have drawn particular attention for their ability to convert organic matter into electrical energy, leveraging the catalytic activity of the electroactive biofilm present at the anode electrode [
4,
6,
11,
12].
Notably, numerous studies are trying to address the issues currently associated to MFCs, among which are conversion efficiency, scalability and cost-effectiveness [
4,
13,
14,
15]. The minimal design of such devices is represented by single chamber MFCs (SCMFCs), which have shown significant potential in reducing the internal resistance of devices, simplifying fabrication and reducing costs [
16,
17]. As discussed in the literature [
18], the absence of an ion exchange membrane between the anodic and cathodic chambers ensures several advantages: it reduces mass transport limitation for species that are crucial for the metabolic activity of the anodic biofilm and entails a lower fabrication and maintenance complexity with respect to cells featuring membranes. At the same time, this may also represent a drawback as oxygen can more easily diffuse from the open-air cathode towards the bio-anode, negatively affecting its operation due to the proliferation of competing, non-electroactive microbes [
4,
18,
19].
The overall SCMFCs' performances are affected by several parameters, among which the fluid dynamics play a pivotal role, directly influencing the interaction between the electrolyte and the biofilm, as demonstrated in several works of the literature [
20,
21]. Massaglia et al. showed that asymmetric Single Chamber Microbial Fuel Cells (a-SCMFCs), characterized by misaligned inlet and outlet, ensure a higher drift-area, with an electrolyte flow characterized by a drop-like shape. The microfluidic-based design of a-SMFCs demonstrates an increase in the electrode surface area reached by the new electrolyte with each replacement. In line with these findings, in the present work, we propose an alternative design of MFC devices which aims at optimizing energy conversion from the electrolyte medium [
20,
21]. With the main purpose of optimize the electrolyte distribution in asymmetric SCMFCs, achieving an optimal drop-like shape, in the present work we modified the SCMFC configuration by incorporating an intermediate microfluidic septum (IMS), which occupies a significant portion of the internal cell’s volume and features a pass-through opening. The primary intention behind the design of IMS is to shape the reactor to exactly mimic the electrolyte flow patterns naturally occurring within the MFC during refills, so to guarantee optimal electrolyte replenishment [
20,
21]. Moreover, compared to the usual square SCMFC design, the addition of the IMS in the cell's chamber reduces the amount of electrolyte required for this filling but leaving unchanged the surface area of the electrodes. In addition, thanks to its shape, the IMS limits oxygen diffusion from the open
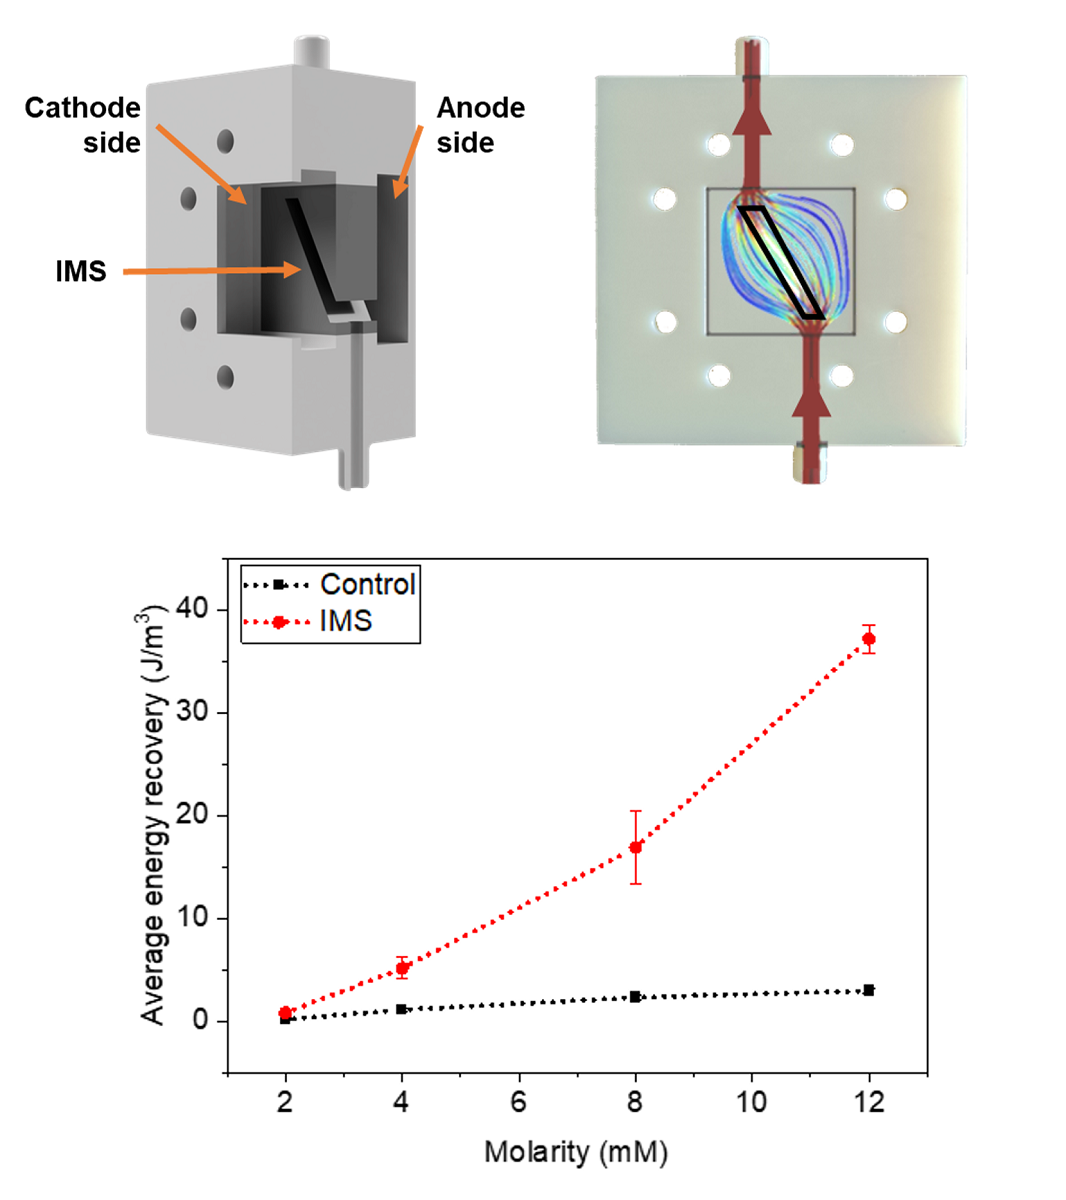
-air cathode towards the bio-anode, setting up the condition for an optimal anaerobic microbial proliferation. Implementing the IMS configuration, this work demonstrates the tremendous impact of controlled fluid dynamics on the overall performance of SCMFCs. To give evidence of the crucial role of IMS configuration to improve the overall devices’ performance, the Energy Recovery (E
rec) factor, defined as the ratio between the output energy yield and the available electrolyte volume [
6,
22,
23], has been analyzed. In particular, we compared standard a-SCMFC to a-SCMFCs with IMS (named IMS cells), both running using sodium acetate as the carbon source. As a matter of fact, E
rec can be improved by both increasing energy output and by decreasing the electrolyte volume required for the MFC operation. The IMS design simultaneously addresses both aspects, improving energy output by optimizing biofilm electrical activity while also reducing the volume of the electrolyte single-chamber. In standard conditions, using 12 mM of sodium acetate, IMS cells featured an average E
rec of (37±1) J/m
3, which is one order of magnitude higher with respect to the value of (3.0±0.3) J/m
3 obtained for control cells. This study contributes to the advancement in MFC technology, providing an alternative solution that partly overcomes the disadvantages related to the absence of an ionic exchange membrane.
2. Materials and Methods
2.1. Design and fabrication of a-SCMFCs
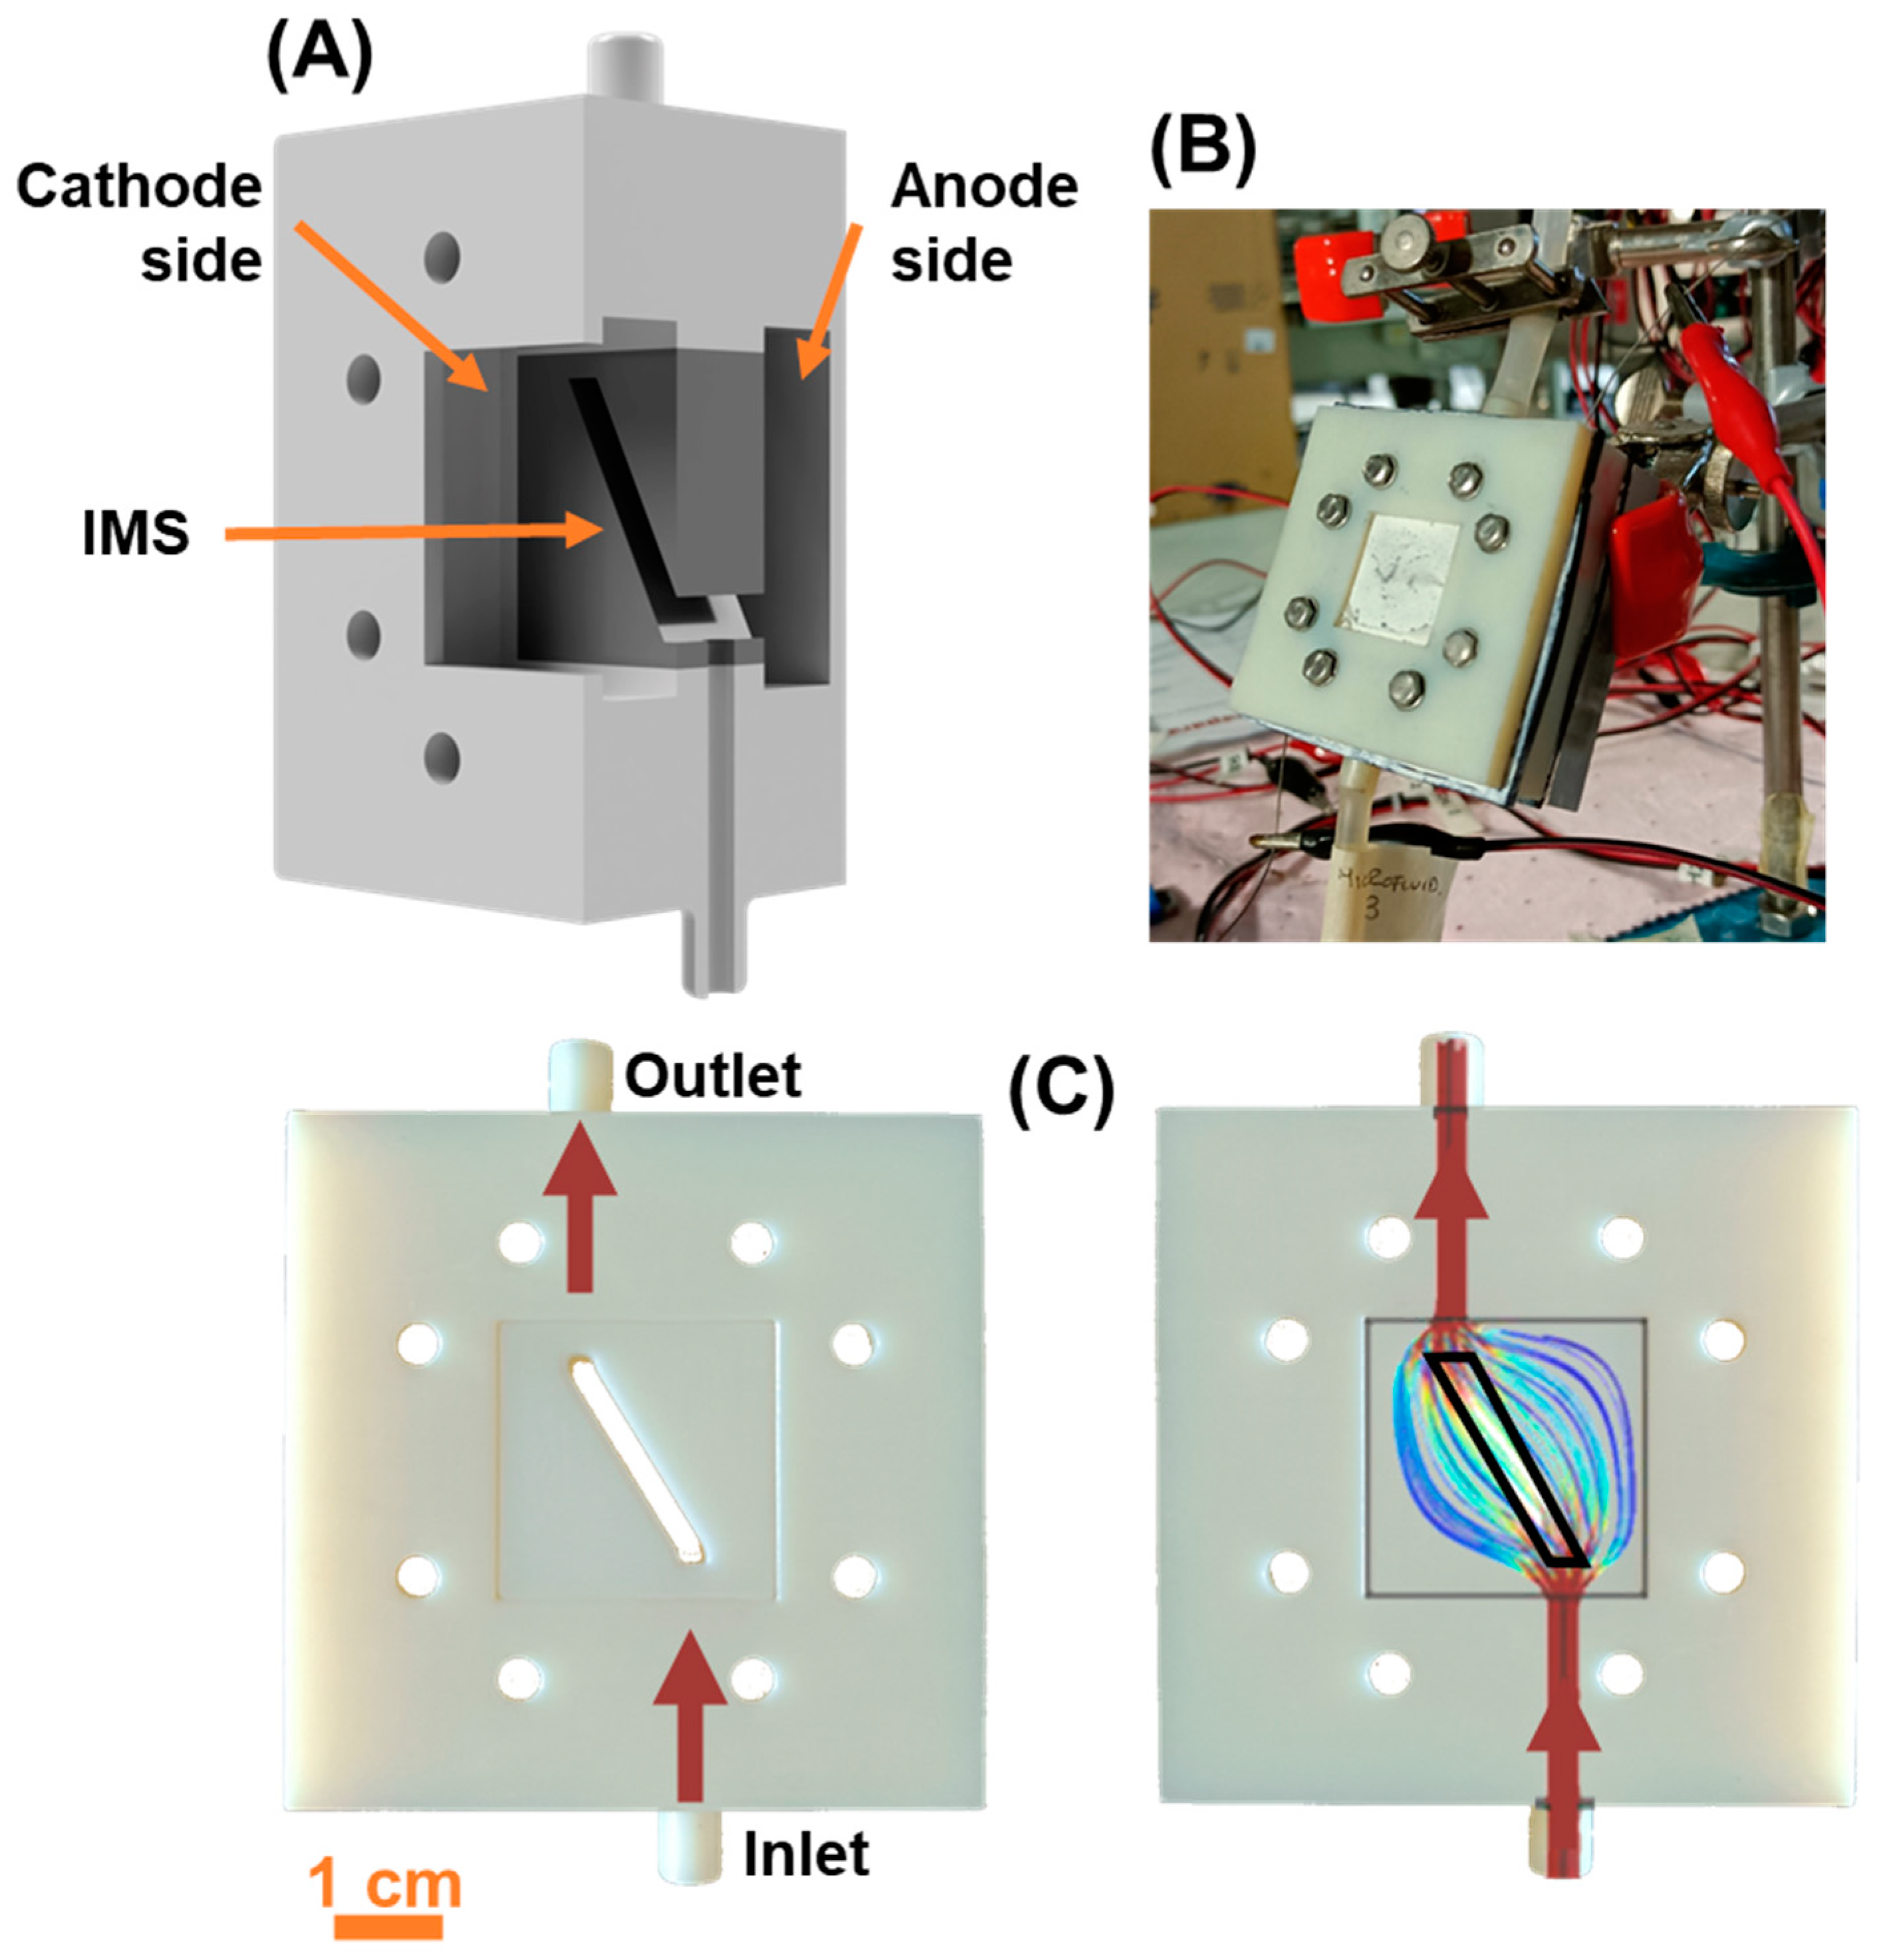
We realized asymmetric squared single chamber MFCs in open-air cathode configuration, whose components were fabricated by 3D printing technology (Stratasys OBJET 30 with VeroWhite material). To ensure complete solvent removal, 3D printed components were kept overnight in an oven at 110°C. The SCMFCs were constituted by three separate compartments kept together by screws and rubber sealing: an anodic compartment (air-tight), an intermediate spacing (with a window and inlet/outlet holes) and a (open air) cathode compartment (
Figure 1A,B). The available geometric area occupied by the electrodes in both the anode and cathode compartments was equal to 5.76 cm
2, and the inner volume occupied by the electrolyte was 12.5 mL.
The intermediate spacing component allowed to perform cells refill through its top and bottom apertures. Moreover, the window present in such spacing component permitted the insertion the Intermediate Microfluidic Septum (
Figure 1A,C). We based the design of the IMS on previous studies [
20,
21], which modeled and studied the microfluidic flow field arising inside the cells under normal operative conditions (
Figure 1C). For the MFCs in this study, the IMS occupied the entire window present in the intermediate spacing, except for a narrow pass-through opening of geometric area 0.36 cm
2. With the IMS, the inner volume available for the electrolyte was reduced to 6.6 mL. The opening was oriented so to connect with a straight line both the inlet and outlet, following the trajectory around which the flow field normally develops during electrolyte replenishment [
20,
21], as highlighted in
Figure 1C. To assess the contribution provided by the IMS, our experiment consisted of a triplet of cells featuring the IMS (here named IMS 1, IMS 2, and IMS 3) and a triplet of standard a-SCMFCs without IMS as control (referred to as Control 1, Control 2, and Control 3). During the experiment, we simultaneously refilled IMS and Control cells and used the same electrolyte solution for both.
2.2. Materials for electrodes and electrolyte solutions
As anode, as-received carbon felt (purchased from FuelCell Store) was used and cut in 30x30 mm
2 squares. The anodes were held in place and electrically contacted by a 3D printed frame threaded with titanium wire (Goodfellow Cambridge Limited). As cathode electrode, we employed commercial AvCarb Gas Diffusion Systems (purchased from FuelCell Store), composed of carbon paper, a poly-tetra-fluoro-ethylene (PTFE) treatment on the air-facing side, and micro-porous layer surface coating facing the electrolyte side. In accordance with several previous works of the literature [
24,
25,
26], to promote oxygen reduction reaction, we spread on the micro-porous layer a catalyst paste based on Platinum (10 wt% Pt on Carbon, from Sigma Aldrich, final Pt loading 0.5 mg/cm
2) and Nafion (5 wt% Nafion, from Sigma Aldrich, final concentration 3 mg/cm
2) acting as a binder.
The electrolyte solution contained sodium acetate (C2H3NaO2, 82.03 g/mol molecular weight) serving as the carbon source. During the experiment, the standard sodium acetate concentration was 12 mM (1 g/L), whereas we also employed 8 mM (0.67 g/L), 4mM (0.33 g/L) and 2 mM (0.17 g/L) solutions. To ensure the optimal operation conditions for a-SCMFCs, ammonium chloride (NH4Cl, 0.31 g each 1 g of sodium acetate) provided a nitrogen source to aid microbial growth, potassium chloride (KCl, 0.13 g/L) as minerals source and sodium dihydrogen phosphate (NaH2PO4, 2.450 g/L) to maintain a stable neutral pH. All reagents were purchased from Sigma Aldrich, and the obtained electrolyte solutions were autoclaved prior to use.
During the starting inoculation phase, we monitored the biofilm formation onto the anode surface, by implementing an external load of 470 Ω, which results to be suitable to induce the formation of biofilm [
20,
24,
27,
28]. After this period time, we connected an external load of 1 kΩ to directly evaluate the overall devices performances [
23]. The presence of IMS leads to achieve the best performance with respect to the one achieved without the IMS. To demonstrate and confirm this consideration, we introduced a parameter called energy recovery defined by the following Equation (1):
where E
rec (J/m
3) is the Energy Recovery, V
int (m
3) is the internal volume of the MFCs and
(J) is the integral of the recovered energy between the initial (t
1) and final (t
2) moments associated to each refill [
6,
22,
23].
The a-SCMFCs were operated in fed-batch mode, with the electrolyte replaced every 48 h to 72 h, in correspondence to which a voltage drop was observed. The fresh electrolyte was replaced when the voltage drop achieved a value close to 0 V.
The experimental activity was subdivided into three phases.
The
first phase consisted of an inoculation period, that allowed the initial formation of the biofilm at the anode electrode. We inoculated the a-SCMFCs with a mixed microbial consortium, obtained from marine sediment collected in La Spezia (Italy) [
29,
30,
31,
32]. We prepared the initial inoculum adding marine sediment to the previously described electrolytic solution with a standard 12 mM sodium acetate concentration. We kept the inoculum at uncontrolled ambient temperature and prepared the succeeding refills by mixing the last used inoculum with standard electrolyte solution (1:10 volume ratio).
The second phase corresponded with a standard working period spanning over several months. This phase began with a start-up period during which we transitioned to a standard 12 mM sodium acetate electrolyte medium. Throughout this working phase, we observed the stabilization of the electrical output performance and assessed how the performances of the a-SCMFCs varied over time.
The third phase consisted in a perturbation phase during which we systematically reduced the concentration of sodium acetate dissolved in the electrolyte medium. To this purpose, we compared the electrical output performances of IMS and Control cells while performing multiple refills at decreasing fixed concentrations of sodium acetate (12 mM, 8 mM, 4 mM, 2 mM), and then provided once again the standard concentration (12 mM) to verify consistency of results.
2.3. Electrical and electrochemical characterizations
During all the experiment we monitored the output potential of the a-SCMFCs, connecting each anode-cathode pair to a multichannel data acquisition unit (Keysight 34972A) controlled by a computer. We conducted all the experiments in triplicate, with cells kept at uncontrolled ambient temperature ranging (20±5) °C.
Throughout the experiment lifetime, we also performed Linear Sweep Voltammetry (LSV) and Electrochemical Impedance Spectroscopy (EIS) characterizations to assess electrical output performances and investigate the interfaces arising inside the cells.at the anode electrode. We conducted all electrochemical characterizations using a PalmSens 4 (PalmSens BV, Netherlands) potentiostat. For both LSV and EIS, we employed a two-electrodes configuration, where the anode acted as working electrode and the cathode as counter and reference electrode. We conducted EIS characterizations in open circuit condition by imposing an AC sinusoidal signal with 10 mV amplitude and frequency ranging from 200 mHz to 150 kHz. Afterwards we performed LSV measurements by sweeping, at 0.1 V/s scan rate, the applied potential from its open circuit value to short circuit (0 V).
3. Results
The following subsections describe the experimental results obtained testing the devices, both standard a-SCMFC and the new one containing the IMS separator, during the three phases of the experiment.
3.1. Inoculation phase and start-up
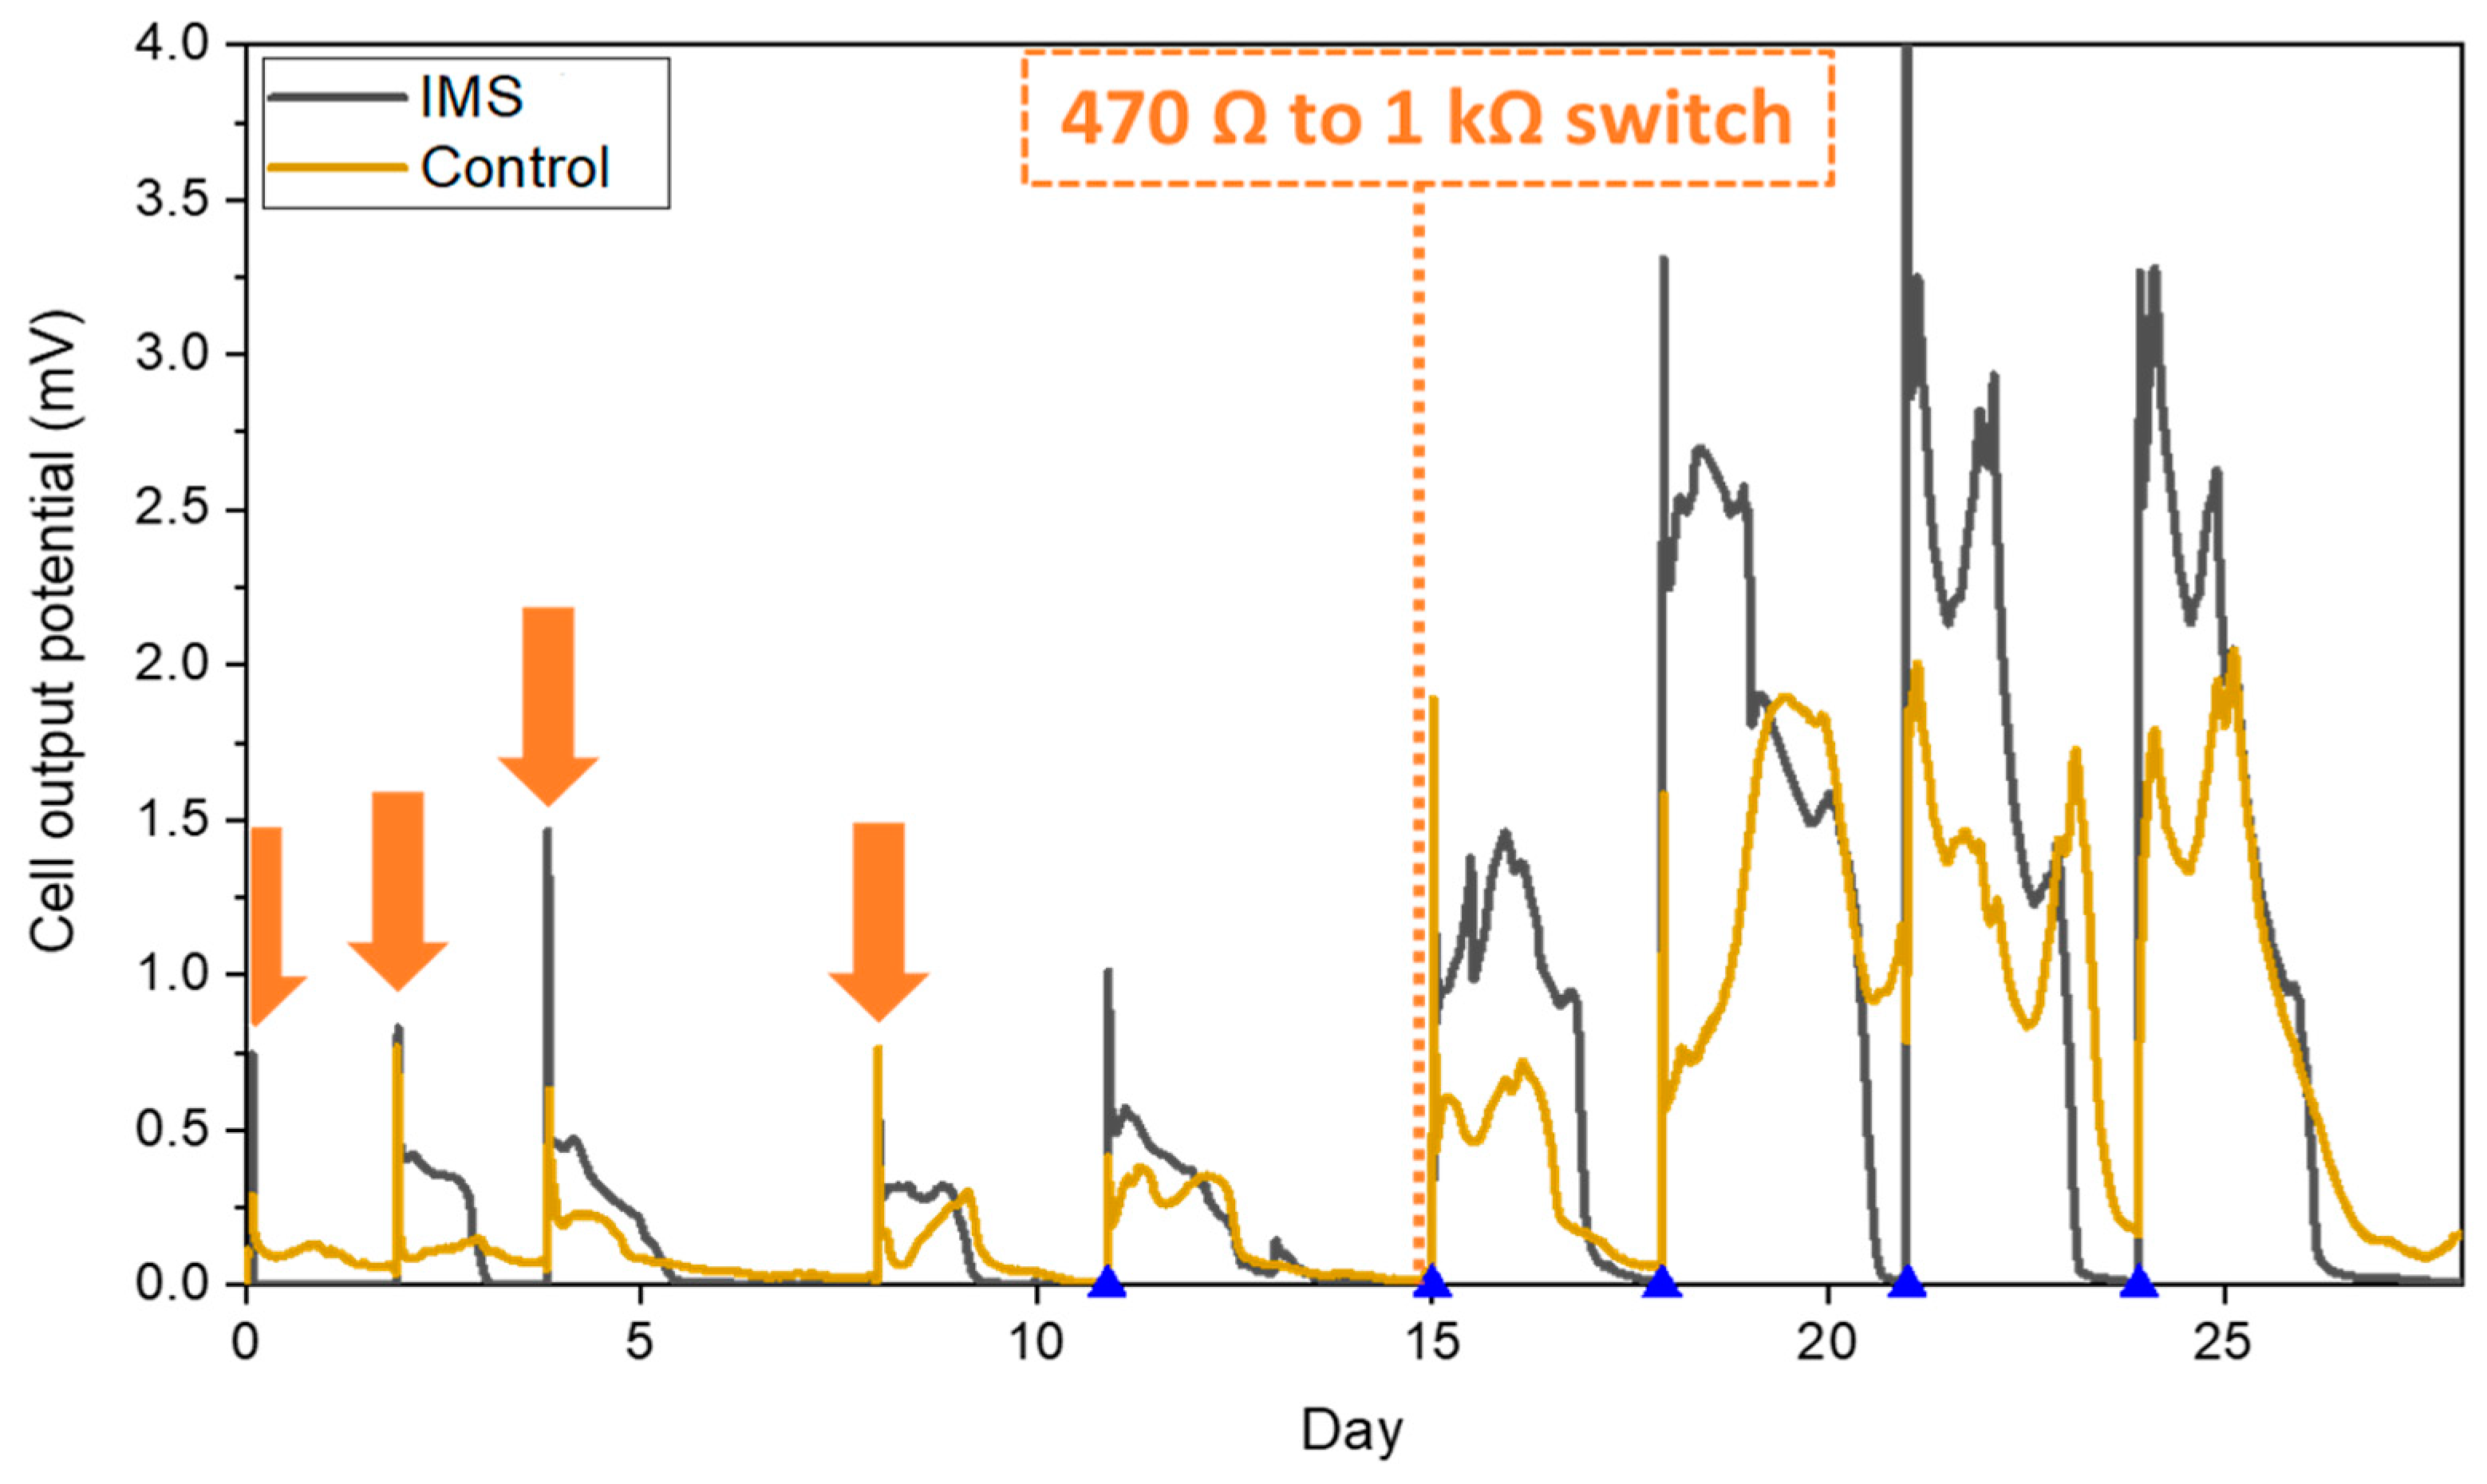
During the inoculation period, the presence of the physical barrier constituted by the IMS did not adversely impact the biofilm formation and even proved to shorten the start-up time compared to control cells. The average behavior of each triplet is reported in
Figure 2. Indeed, while the output of the IMS cells is comparable across all the inoculation refills, the Control cells experienced higher variability before reaching their maximum output potential during the last part of the inoculation period. The results obtained suggested how the presence of the IMS favored biofilm proliferation, thus showing that hindering the diffusion of oxygen towards the anode electrode plays a positive role during inoculation. Moreover, these results are in line with the hypothesis that optimizing the drop-shape electrolyte flow distribution by the IMS promote the biofilm formation by maximizing the interaction between the biofilm and the electrolyte [
20,
21]. Later, after we raised the external load from 470 Ω to 1 kΩ, both IMS and Control cells reached a reproducible stable output within 3 refills (
Figure 2). In conclusion, the presence of the IMS speeds-up the formation of a stable biofilm on the anode electrode, while also speeding up the acclimation process.
3.2. Working phase on standard sodium acetate electrolyte
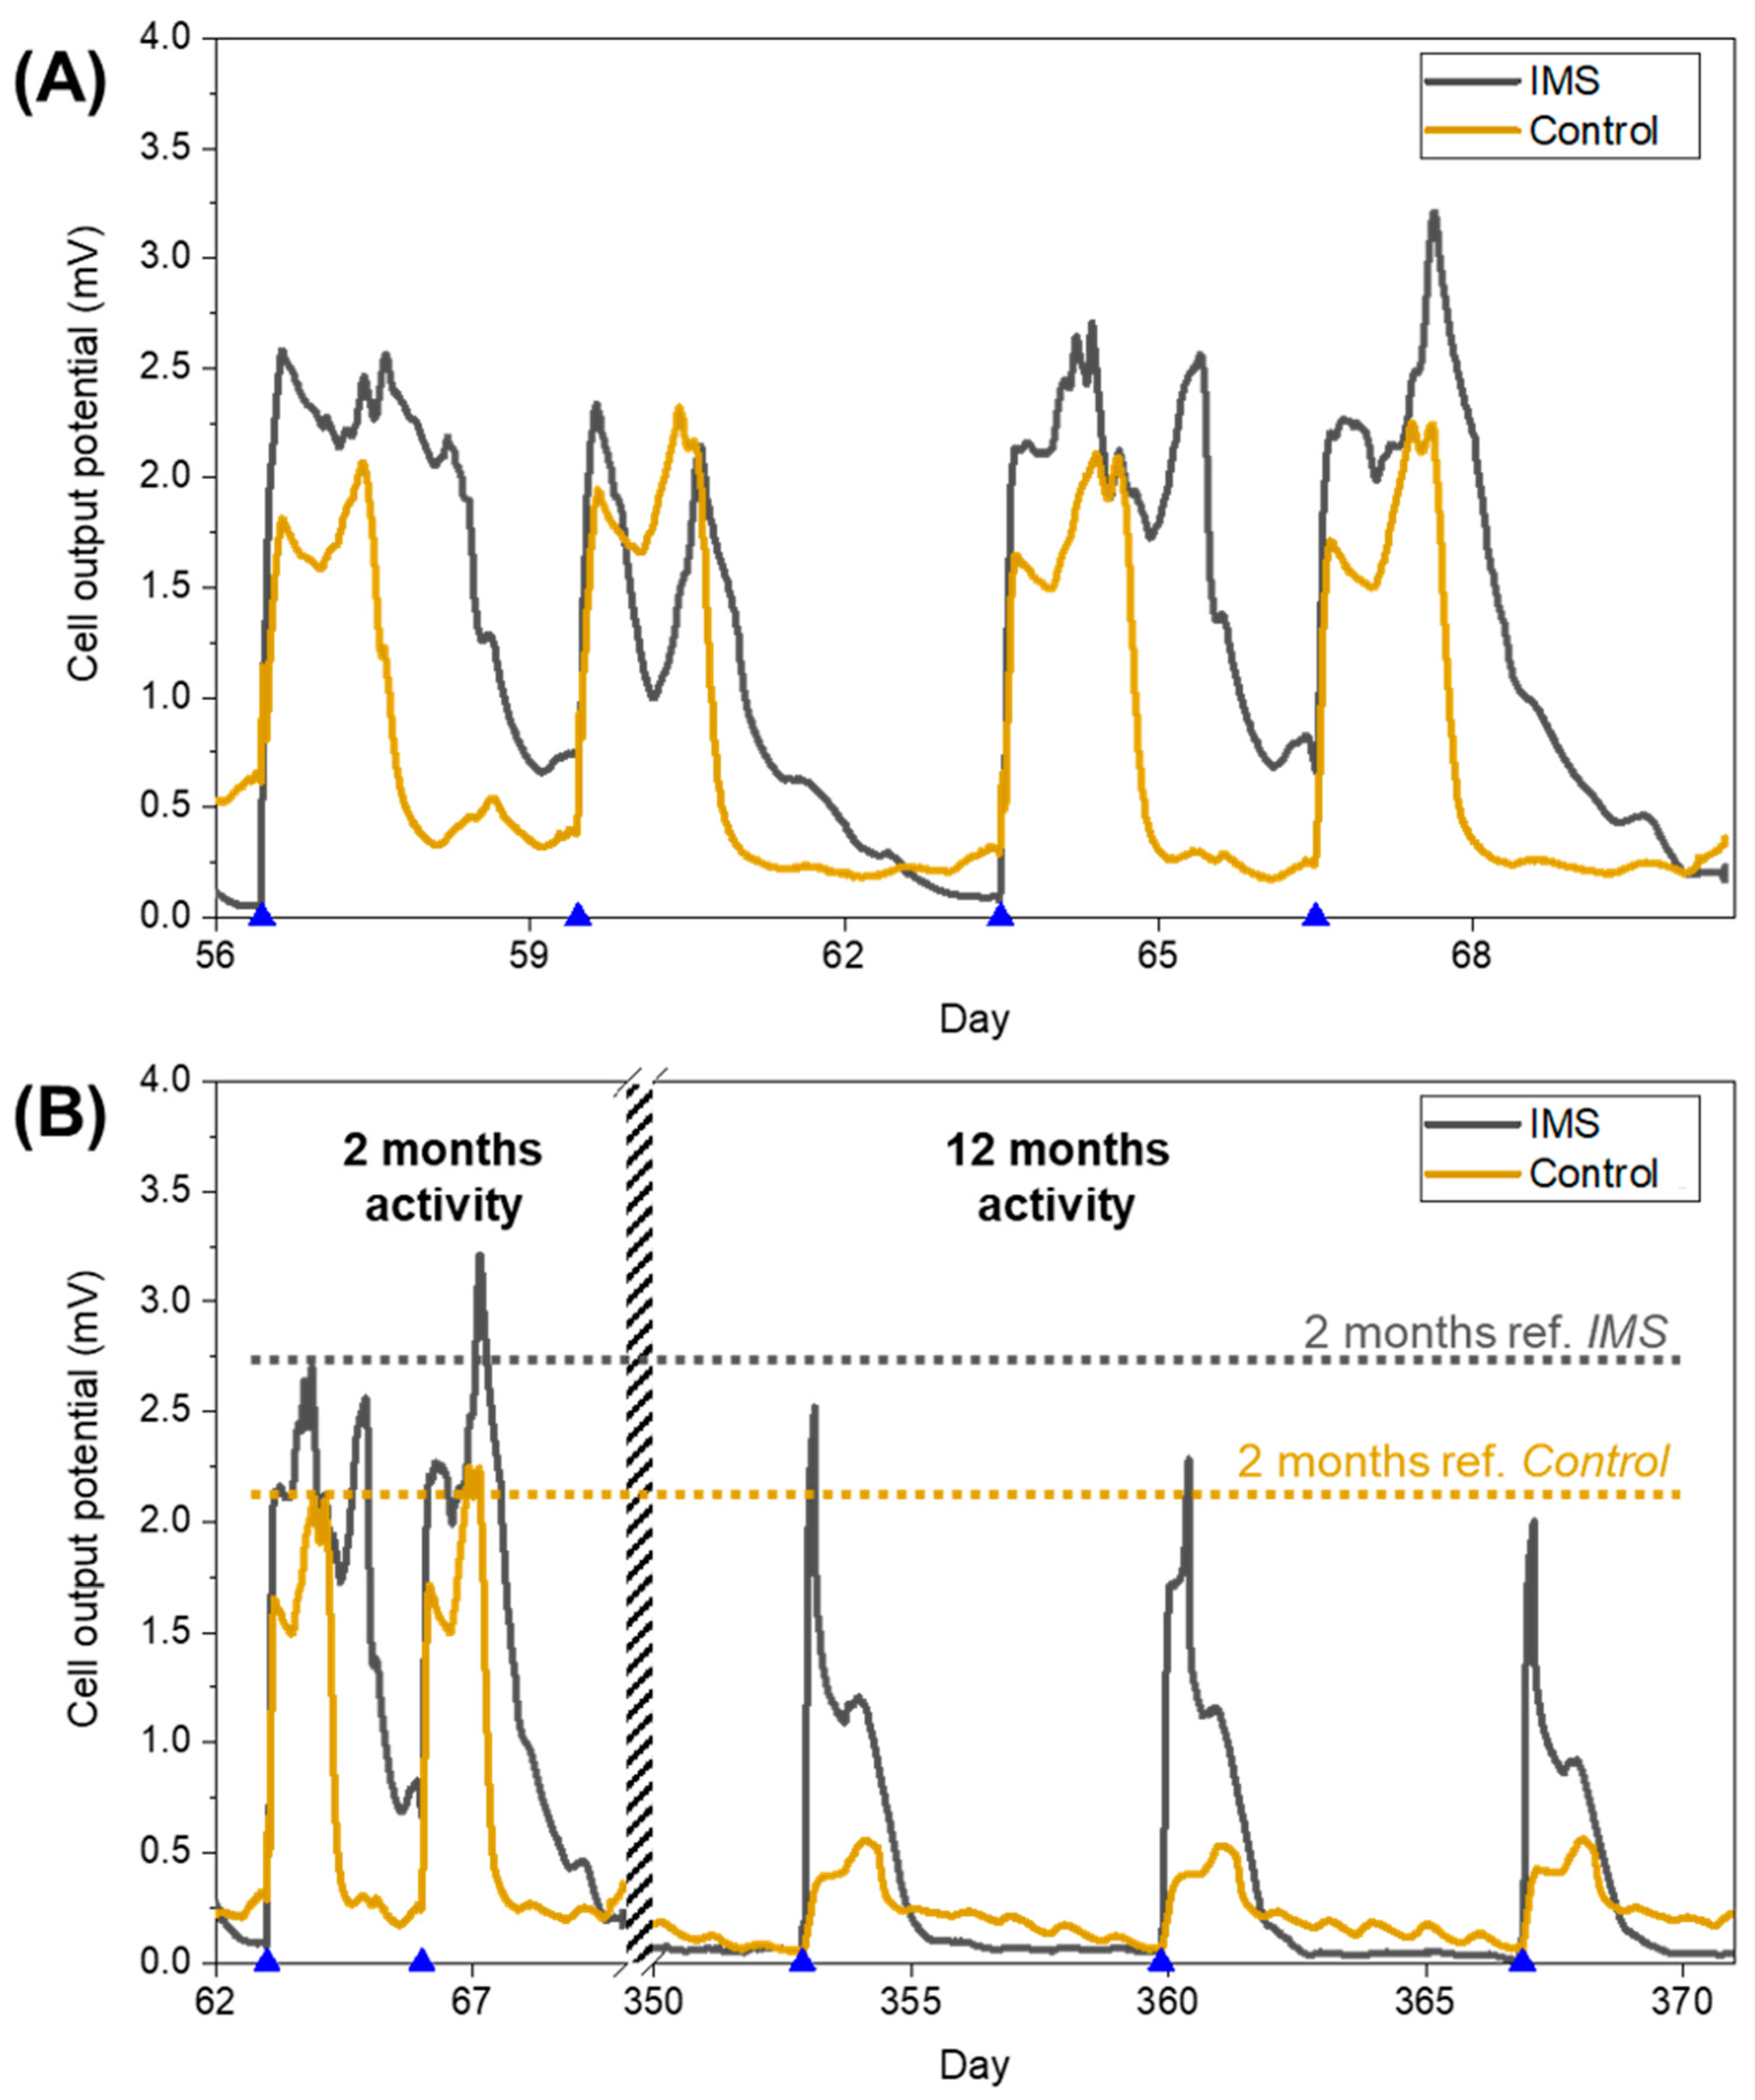
Following the initial inoculation phase and the start-up period, the cells operated for a period lasting over one year running on standard electrolyte with 12 mM sodium acetate concentration. During this working period, the IMS cells presented peaks broadened in time with respect to Control cells (
Figure 3A). As a way to quantify this difference, for each refill event we calculated how much time such output potential remained above the threshold set by the baseline potential (observed during starvation periods). From this analysis, we quantified the duration of peaks as (52±5) hours for the IMS cells, and (36±3) hours for Control cells. As we will later discuss in more detail, this prolonged electrical activity of IMS cells corresponded with a higher energy output compared to the control cells. The evidence of a prolonged electrical activity further suggests that the addition of the IMS is likely to favour an optimal biofilm formation, by influencing the diffusion of species inside the electrolytic chamber. Indeed, the presence of the IMS may reduce oxygen diffusion towards the anode, promoting the acclimation of desirable electroactive microbial species, favoured by anoxic conditions.
As we monitored the output potential of SCMFCs for a prolonged period of time, we could assess the long-term stability of their electrical output performances.
Figure 3B compares the performance of IMS and Control cells after two months and after one year of activity, highlighting how Control cells experienced a higher decrease in electrical output performance compared to IMS cells. Thus, over time, the presence of the IMS provided higher reproducibility of cell’s electrical activity.
3.3. Perturbation phase with variable sodium acetate concentration
As devices working in real scenarios rarely receive a controlled amount of carbon energy source, we wanted to assess how cells featuring an IMS performed during periods of reduced nutrients availability. Since the overall devices’ performance is strictly correlated with the metabolic activity of electroactive bacteria constituting the biofilm on the anode surface, it was possible to demonstrate the correlation between the maximum output potential generated by MFCs and the concentration of carbon energy source dissolved in the electrolyte [
20,
33]. To this end, over sets of consecutive refills, we continued monitoring output potential of the cells while reduced the molarity of sodium acetate in the electrolyte medium from 12 mM down to 2 mM. During this process, the composition of the electrolyte medium remained unchanged, except for ammonium chloride concentration which was reduced accordingly to preserve the same mass ratio with sodium acetate.
From measured output potentials, we extracted the maximum values reached by the cells after each refill. To reduce fluctuations associated to each cell, we then averaged the maxima measured over each a-SCMFC triplet.
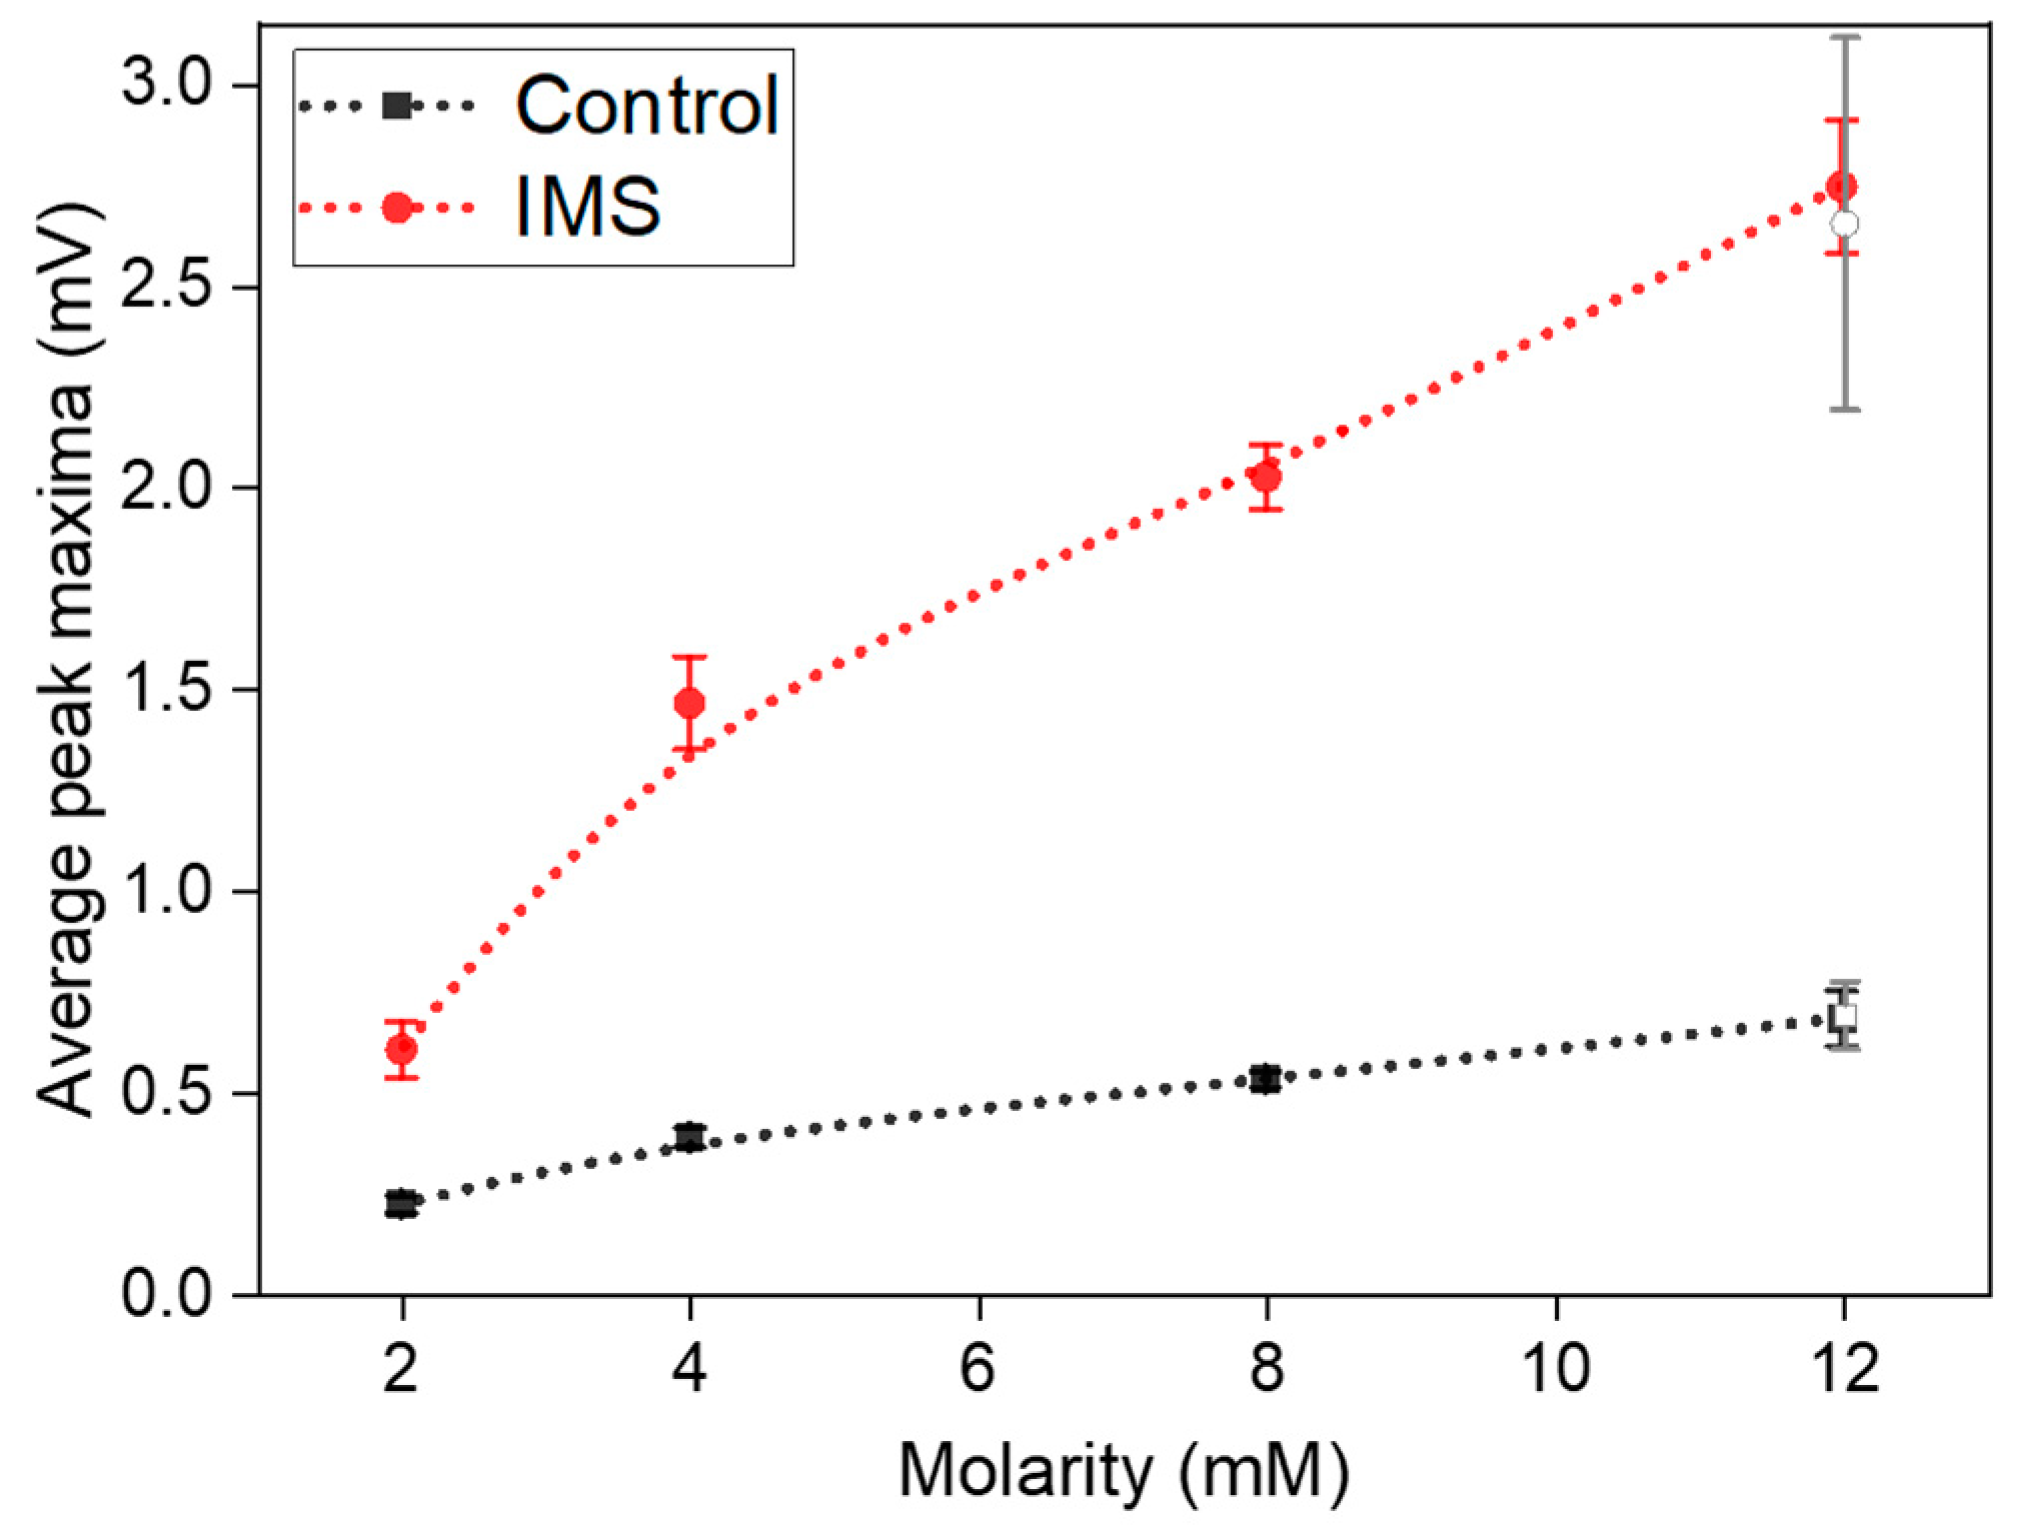
Figure 4 represents these average peak maxima observed at different concentrations of sodium acetate in the electrolyte refill. It is possible to observe how the IMS cells systematically provided a higher output potential compared to Control cells. Indeed, at standard 12 mM sodium acetate concentration, IMS cells featured on average a maximum peak potential of (2.8±0.2) mV, compared to control cells at (0.68±0.07) mV.
Finally, it is possible to observe cell’s behavior when the sodium acetate concentration returns to 12 mM (empty-area symbols in
Figure 4). Both cells confirmed the observed trend, by being able to return to output potentials compatible with the initial values of (2.7±0.4) mV and (0.69±0.08) mV for IMS and Control cells, respectively.
To fully assess the a-SCMFCs’ performance, we also considered the Energy Recovery parameter [
6,
22,
23] as previously defined in Equation 1. Thus, instead of only considering the maximum output potential by the MFC, the E
rec parameter considers the power output from the a-SCMFCs.
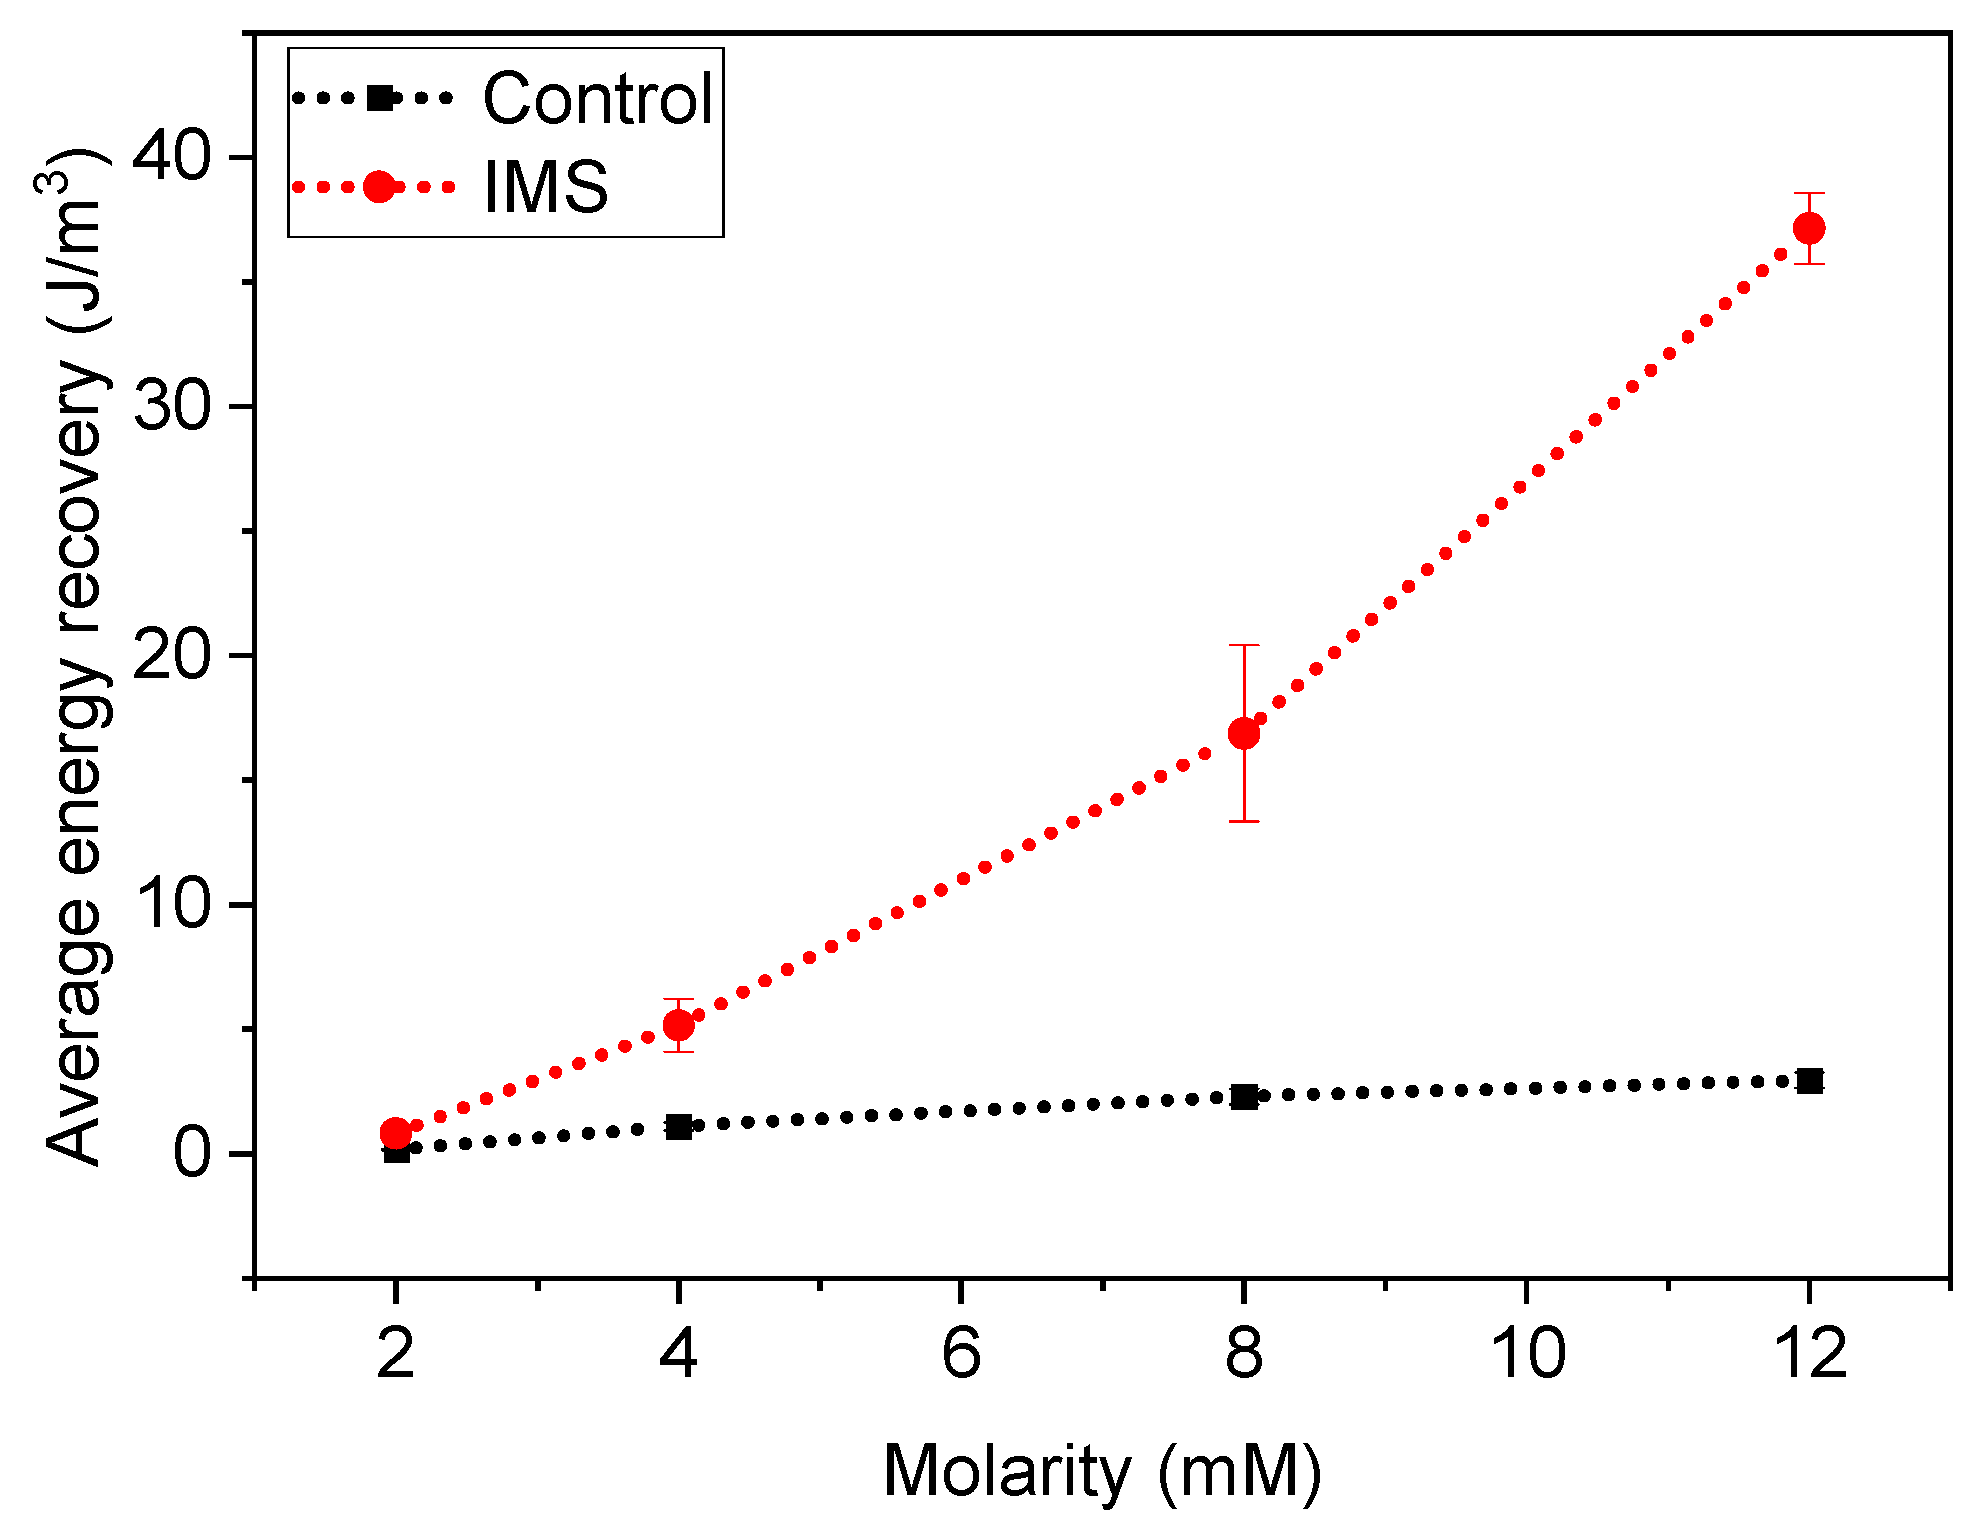
Figure 5 represents the average Energy Recovery calculated at different concentrations of sodium acetate in the electrolyte refill. We obtained these average values by aggregating measurements from a-SCMFCs as previously carried out for peak maxima. Considering the standard 12 mM sodium acetate concentration, IMS cells featured an average energy recovery of (37±1) J/m
3, respect to (3.0±0.3) J/m
3 of Control cells. It is then possible to verify how IMS cells provided higher E
rec compared to Control cells, thus providing an optimization of the a-SCFMC design.
3.4. Electrochemical characterizations
To assess in more detail the electrical performance of the a-SCMFCs, Linear Sweep Voltammetry (LSV) characterizations were performed.
Figure 6 compares the polarization curves of one representative a-SCMFC from each triplet obtained after 8, 10 and 12 months of activity. We calculated all current densities by normalizing the measured current by 5.76 cm
2, corresponding to the geometric area of the anode electrodes. It is interesting to observe that IMS cells reached a higher open circuit potential but lower short circuit currents. Moreover, the linear region of the polarization curve allows to estimate an internal resistance of approximately 1 kΩ for IMS cells and 500 Ω for Control cells. In addition, considering how electrical performances evolved over time, it can be noticed that IMS cells provided a more stable response compared to Control cells. This result agrees with what previously observed from output voltage monitoring (
Figure 3B).
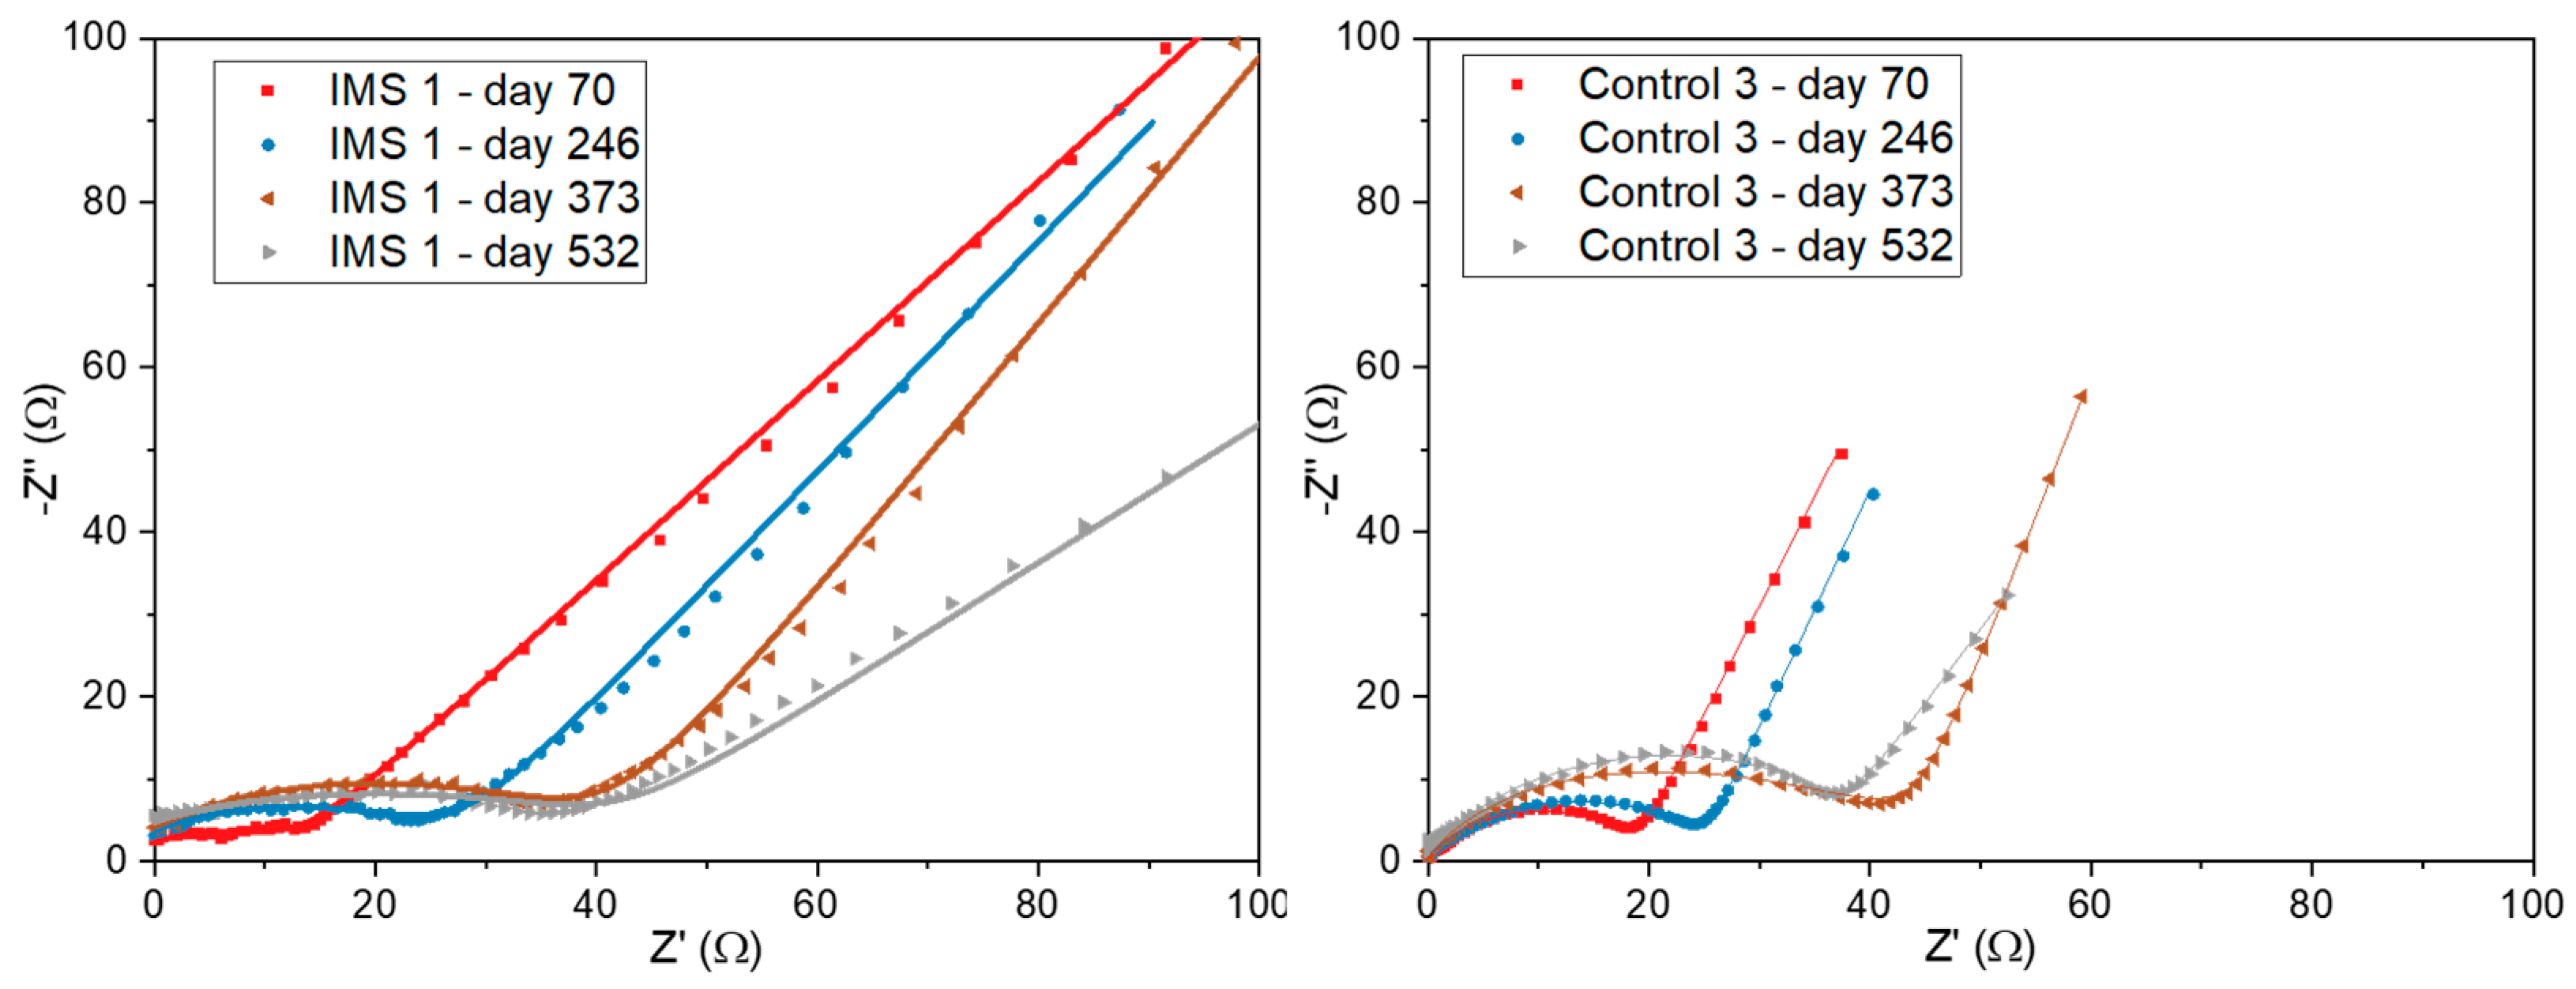
We also performed Electrochemical Impedance Spectroscopy (EIS) to gain a better understanding of the impedances associated with interfaces arising inside the SCMFCs. Based on the observed Nyquist plots, we modelled the impedance spectra considering models previously described in the literature [
34,
35].
Figure 7 compares the Nyquist plots related to one representative SCMFC from each triplet. In particular, at the highest frequencies we observed an ohmic (real) resistance representing impedances arising from electrodes, electrical contacts, and the electrolyte bulk. To focus on the features related to the electrochemical interfaces, we offset the plots so to hide the contribution of this ohmic resistance. As frequency decreased, the appearance of a distorted arc could be attributed to interfacial interactions at the electrode/microbial biofilm/electrolyte interface. Namely, such impedance can be modelled as a parallel between its charge transfer resistance (R
ct) and a double-layer capacitance induced by the accumulation of charges. The distortion in the arc indicates a non-ideal capacitance behavior, corresponding to that of a constant-phase element, likely due to the complex morphology and the porosity of electrodes [
36,
37]. Focusing on this region of the Nyquist plot, both cells demonstrated an increase in charge transfer resistance over time.
Finally, at lower frequencies, diffusion limitations become the dominant impedance contribution and the presence of the IMS is more evident. Indeed, by acting as a barrier for diffusion, the IMS introduces concentration losses that increase the overall measured impedance.
4. Discussion
With the main purpose of enhancing the overall performance of asymmetric SCMFCs, this work proposes to optimize the electrolyte distribution by redesigning the inner volume of the reactors to give them a shape able to follow at the best the spontaneous fluid flow field. As studied in our past works [
20,
21] the flow field has a drop-like envelop, as shown in
Figure 1C, and devices with that shape demonstrated to optimize the electrolyte management during refills. Based on those results, we decided to modify the standard a-SCMFC configuration by incorporating the Intermediate Microfluidic Septum. The introduction of the IMS optimizes the fluid flow inside the reactor during the refill operation by connecting the inlet and outlet following the trajectory around which the flow field spontaneously develops. This behavior is combined with a significant reduction of the inner volume available for the electrolyte, that is reduced from 12.5 mL to 6.6 mL. The improved management of the electrolyte ensured by the microfluidic septum allows to optimize the energy conversion as demonstrated during all the phases, as it can be observed by
Figure 2 and
Figure 3. Not only the output voltage is higher for
IMS cells, but the peaks are more stable and reproducible than
Control cells. The improvement is further confirmed by the last phase of the experiment, during which the carbon source concentration was changed over time. This result is particularly important since it shows that the IMS is able to optimize the inner environment of the cells in such a way to optimize the activity of the anodic biofilm. Indeed, the metabolic activity of electroactive bacteria is strictly correlated to the maximum output potential generated by MFCs and the concentration of carbon energy source dissolved in the electrolyte [
20,
33].
These results show that, acting as a physical barrier interposed between the anode and the cathode, IMS plays a crucial role in allowing to optimize the flow and then the diffusion of chemical species inside the reactor. Indeed, due to its aspect ratio shown in
Figure 1A, the separator introduces mass transport limitations, as well highlighted by
Figure 7. One fundamental limitation is expected to involve oxygen: the IMS actually limits oxygen diffusion towards the anode chamber, thus promoting the anoxic environment ideal for microbial proliferation. At the same time, nutrients and ions diffusion rate is also reduced, potentially leading to a delayed interaction of such species with respect to a condition without IMS present. Nevertheless, the specific IMS design guarantees an appropriate electrolyte flow during cells refills, and optimal replenishment with minimum perturbation of the internal environment. The experiments carried out in this study have clearly demonstrated that the beneficial effect of the biofilm protection against oxygen contamination is further the leading phenomena, overcoming the potential limitations to the diffusion process of the other species, and ensuring a better behavior than Control cells especially for long term applications, as shown in
Figure 5 and
Figure 6.
5. Conclusions
In this study we presented a new design of asymmetric single-chamber MFC with the goal of optimizing energy recovery. This goal is achieved by the insertion of an intermediate microfluidic septum in the a-SCMFC, the IMS, to optimize fluid flow inside the reactors. In the present work, cells featuring an IMS demonstrated to enhance energy recovery from an electrolyte solution containing sodium acetate as carbon energy source. By reducing the concentration of sodium acetate in the electrolyte medium, we also verified that such overperformance persisted even when we less carbon energy source was available.
In this experiment we were able to monitor the output potential of SCMFCs for a period of time lasting over one year. During the early stages of the experiment, we observed how the presence of the IMS positively impacted biofilm formation, likely due to a reduction in oxygen diffusion towards the anode electrode. In addition, over the long-term, cells containing the IMS provided a more stable potential output compared to control cells, suggesting that the development of the anodic biofilm might have been more efficient.
Electrochemical characterizations confirmed that the presence of the IMS had an impact on the diffusion of ionic species inside the electrolytic chamber, supporting the hypothesis of an effect on oxygen diffusion as well.
In conclusion, the results of this study might prove beneficial for the design and optimization of future SCMFCs, partly overcoming the disadvantages related to the absence of an ionic exchange membrane.
Author Contributions
Conceptualization and methodology, Marzia Quaglio, Stefano Bianco, Nicolo Vasile, Giulia Massaglia; design and fabrication, Valentina Bertana, Giacomo Spisni, Nicolo Vasile; experimental activity and data processing, Giacomo Spisni; writing—original draft preparation, review and editing, Giacomo Spisni, Giulia Massaglia, Marzia Quaglio, Stefano Bianco; supervision and funding acquisition, Fabrizio C. Pirri. All authors have read and agreed to the published version of the manuscript.
Funding
This research received no external funding.
Conflicts of Interest
The authors declare no conflict of interest
References
- Yang, E.; Omar Mohamed, H.; Park, S.-G.; Obaid, M.; Al-Qaradawi, S.Y.; Castaño, P.; Chon, K.; Chae, K.-J. A Review on Self-Sustainable Microbial Electrolysis Cells for Electro-Biohydrogen Production via Coupling with Carbon-Neutral Renewable Energy Technologies. Bioresour. Technol. 2021, 320, 124363. [Google Scholar] [CrossRef]
- Escapa, A.; Mateos, R.; Martínez, E.J.; Blanes, J. Microbial Electrolysis Cells: An Emerging Technology for Wastewater Treatment and Energy Recovery. From Laboratory to Pilot Plant and Beyond. Renew. Sustain. Energy Rev. 2016, 55, 942–956. [Google Scholar] [CrossRef]
- Lu, L.; Ren, Z.J. Microbial Electrolysis Cells for Waste Biorefinery: A State of the Art Review. Bioresour. Technol. 2016, 215, 254–264. [Google Scholar] [CrossRef] [PubMed]
- Santoro, C.; Arbizzani, C.; Erable, B.; Ieropoulos, I. Microbial Fuel Cells: From Fundamentals to Applications. A Review. J. Power Sources 2017, 356, 225–244. [Google Scholar] [CrossRef]
- Gude, V.G. Wastewater Treatment in Microbial Fuel Cells – an Overview. J. Clean. Prod. 2016, 122, 287–307. [Google Scholar] [CrossRef]
- Logan, B.E. Microbial Fuel Cells; John Wiley & Sons, 2008. ISBN 9780470258590. [CrossRef]
- Dessì, P.; Rovira-Alsina, L.; Sánchez, C.; Dinesh, G.K.; Tong, W.; Chatterjee, P.; Tedesco, M.; Farràs, P.; Hamelers, H.M.V.; Puig, S. Microbial electrosynthesis: Towards sustainable biorefineries for the production of green chemicals from CO2 emissions. Biotechnol. Adv. 2021, 46, 107675. [Google Scholar] [CrossRef] [PubMed]
- Quraishi, M.; Wani, K.; Pandit, S.; Gupta, P.K.; Rai, A.K.; Lahiri, D.; Jadhav, D.A.; Ray, R.R.; Jung, S.P.; Thakur, V.K.; Prasad, R. Valorisation of CO2 into Value-Added Products via Microbial Electrosynthesis (MES) and Electro-Fermentation Technology. Fermentation 2021, 7, 291. [Google Scholar] [CrossRef]
- Rabaey, K.; Rozendal, R. Microbial electrosynthesis — revisiting the electrical route for microbial production. Nat Rev Microbiol 2010, 8, 706–716. [Google Scholar] [CrossRef]
- Kelly, P.T.; He, Z. Nutrients Removal and Recovery in Bioelectrochemical Systems: A Review. Bioresour. Technol. 2014, 153, 351–360. [Google Scholar] [CrossRef]
- Aiyer, K.S. How Does Electron Transfer Occur in Microbial Fuel Cells? World J. Microbiol. Biotechnol. 2020, 36, 19. [Google Scholar] [CrossRef]
- Armato, C.; Ahmed, D.; Agostino, V.; Traversi, D.; Degan, R. , Tommasi, T.; Margaria, V.; Sacco, A.; Gilli, G.; Quaglio, M.; Saracco, G.; Schilirò, T. Anodic microbial community analysis of microbial fuel cells based on enriched inoculum from freshwater sediment. Bioprocess and Biosystems Engineering 2019, 42, 697–709. [Google Scholar] [CrossRef]
- Priya, A.K.; Subha, C.; Kumar, P.S.; Suresh, R.; Rajendran, S.; Vasseghian, Y.; Soto-Moscoso, M. Advancements on Sustainable Microbial Fuel Cells and Their Future Prospects: A Review. Environ. Res. 2022, 210, 112930. [Google Scholar] [CrossRef] [PubMed]
- Boas, J.V.; Oliveira, V.B.; Simões, M.; Pinto, A.M.F.R. Review on Microbial Fuel Cells Applications, Developments and Costs. J. Environ. Manage. 2022, 307, 114525. [Google Scholar] [CrossRef] [PubMed]
- Palanisamy, G.; Jung, H.-Y.; Sadhasivam, T.; Kurkuri, M.D.; Kim, S.C.; Roh, S.-H. A Comprehensive Review on Microbial Fuel Cell Technologies: Processes, Utilization, and Advanced Developments in Electrodes and Membranes. J. Clean. Prod. 2019, 221, 598–621. [Google Scholar] [CrossRef]
- Tamboli, E.; Eswari, J.S. Chapter 3.2 - Microbial Fuel Cell Configurations: An Overview, Editors: S. Venkata Mohan, Sunita Varjani, Ashok Pandey, In Biomass, Biofuels and Biochemicals, Microbial Electrochemical Technology; Elsevier, 2019; 407–435. ISBN 9780444640529. [CrossRef]
- Rossi, R.; Logan, B.E. Impact of Reactor Configuration on Pilot-Scale Microbial Fuel Cell Performance. Water Res. 2022, 225, 119179. [Google Scholar] [CrossRef]
- Leong, J.X.; Daud, W.R.W.; Ghasemi, M.; Liew, K.B.; Ismail, M. Ion Exchange Membranes as Separators in Microbial Fuel Cells for Bioenergy Conversion: A Comprehensive Review. Renew. Sustain. Energy Rev. 2013, 28, 575–587. [Google Scholar] [CrossRef]
- Chae, K.-J.; Choi, M.-J.; Kim, K.-Y.; Ajayi, F.F.; Chang, I.-S.; Kim, I.S. Selective Inhibition of Methanogens for the Improvement of Biohydrogen Production in Microbial Electrolysis Cells. Int. J. Hydrog. Energy 2010, 35, 13379–13386. [Google Scholar] [CrossRef]
- Quaglio, M.; Massaglia, G.; Vasile, N.; Margaria, V.; Chiodoni, A.; Salvador, G.P.; Marasso, S.L.; Cocuzza, M.; Saracco, G.; Pirri, F.C. A Fluid Dynamics Perspective on Material Selection in Microbial Fuel Cell-Based Biosensors. Int. J. Hydrog. Energy 2019, 44, 4533–4542. [Google Scholar] [CrossRef]
- Massaglia, G.; Gerosa, M.; Agostino, V.; Cingolani, A.; Sacco, A.; Saracco, G.; Margaria, V.; Quaglio, M. Fluid Dynamic Modeling for Microbial Fuel Cell Based Biosensor Optimization. Fuel Cells 2017, 17, 627–634. [Google Scholar] [CrossRef]
- Massaglia, G.; Frascella, F.; Chiadò, A.; Sacco, A.; Marasso, S.L.; Cocuzza, M.; Pirri, C.F.; Quaglio, M. Electrospun Nanofibers: From Food to Energy by Engineered Electrodes in Microbial Fuel Cells. Nanomaterials 2020, 10, 523. [Google Scholar] [CrossRef]
- Bird, H.; Heidrich, E.S.; Leicester, D.D.; Theodosiou, P. Pilot-Scale Microbial Fuel Cells (MFCs): A Meta-Analysis Study to Inform Full-Scale Design Principles for Optimum Wastewater Treatment. J. Clean. Prod. 2022, 346, 131227. [Google Scholar] [CrossRef]
- Cheng, S.; Liu, H.; Logan, B.E. Power Densities Using Different Cathode Catalysts (Pt and CoTMPP) and Polymer Binders (Nafion and PTFE) in Single Chamber Microbial Fuel Cells. Environ. Sci. Technol. 2006, 40, 364–369. [Google Scholar] [CrossRef] [PubMed]
- Massaglia, G.; Fiorello, I.; Sacco, A.; Margaria, V.; Pirri, C.; Quaglio, M. Biohybrid Cathode in Single Chamber Microbial Fuel Cell. Nanomaterials 2018, 9, 36. [Google Scholar] [CrossRef] [PubMed]
- Massaglia, G.; Margaria, V.; Fiorentin, M.R.; Pasha, K.; Sacco, A.; Castellino, M.; Chiodoni, A.; Bianco, S.; Pirri, F.C.; Quaglio, M. Nonwoven Mats of N-Doped Carbon Nanofibers as High-Performing Anodes in Microbial Fuel Cells. Mater. Today Energy 2020, 16, 100385. [Google Scholar] [CrossRef]
- Rossi, R.; Logan, B.E. Impact of External Resistance Acclimation on Charge Transfer and Diffusion Resistance in Bench-Scale Microbial Fuel Cells. Bioresour. Technol. 2020, 318, 123921. [Google Scholar] [CrossRef]
- Massaglia, G.; Sacco, A.; Chiodoni, A.; Pirri, C.F.; Quaglio, M. Living Bacteria Directly Embedded into Electrospun Nanofibers: Design of New Anode for Bio-Electrochemical Systems. Nanomaterials 2021, 11, 3088. [Google Scholar] [CrossRef]
- Massaglia, G.; Sacco, A.; Favetto, A.; Scaltrito, L.; Ferrero, S.; Mo, R.; Pirri, C.F.; Quaglio, M. Integration of portable sedimentary microbial fuel cells in autonomous underwater vehicles. Energies 2022, 14, 4551. [Google Scholar] [CrossRef]
- Massaglia, G.; Margaria, V.; Sacco, A.; Tommasi, T.; Pentassuglia, S.; Ahmed, D.; Mo, R.; Pirri, C.F.; Quaglio, M. In situ continuous current production from marine floating microbial fuel cells. Applied Energy 2018, 230, 78–85. [Google Scholar] [CrossRef]
- Margaria, V.; Tommasi, T.; Pentassuglia, S.; Agostino, V.; Sacco, A.; Armato, C.; Chiodoni, A.; Schilirò, T.; Quaglio, M. Effects of pH variations on anodic marine consortia in a dual chamber microbial fuel cell. Int. J. Hydrog. Energy 2017, 42, 1820–1829. [Google Scholar] [CrossRef]
- Tommasi, T.; Salvador, G.P.; Quaglio, M. New insights in Microbial Fuel Cells: Novel solid phase anolyte. Scientific Reports 2016, 6, 29091. [Google Scholar] [CrossRef]
- Spurr, M.W.A.; Yu, E.H.; Scott, K.; Head, I.M. Extending the Dynamic Range of Biochemical Oxygen Demand Sensing with Multi-Stage Microbial Fuel Cells. Environ. Sci. Water Res. Technol. 2018, 4, 2029–2040. [Google Scholar] [CrossRef]
- Wang, H.; Long, X.; Sun, Y.; Wang, D.; Wang, Z.; Meng, H.; Jiang, C.; Dong, W.; Lu, N. Electrochemical Impedance Spectroscopy Applied to Microbial Fuel Cells: A Review. Front. Microbiol. 2022, 13, 973501. [Google Scholar] [CrossRef] [PubMed]
- Agostino, V.; Ahmed, D.; Sacco, A.; Margaria, V.; Armato, C.; Quaglio, M. Electrochemical Analysis of Microbial Fuel Cells Based on Enriched Biofilm Communities from Freshwater Sediment. Electrochimica Acta 2017, 237, 133–143. [Google Scholar] [CrossRef]
- Park, S.-G.; Rhee, C.; Jadhav, D.A.; Eisa, T.; Al-Mayyahi, R.B.; Shin, S.G.; Abdelkareem, M.A.; Chae, K.-J. Tailoring a Highly Conductive and Super-Hydrophilic Electrode for Biocatalytic Performance of Microbial Electrolysis Cells. Sci. Total Environ. 2023, 856, 159105. [Google Scholar] [CrossRef] [PubMed]
- Hidalgo, D.; Sacco, A.; Hernández, S.; Tommasi, T. Electrochemical and Impedance Characterization of Microbial Fuel Cells Based on 2D and 3D Anodic Electrodes Working with Seawater Microorganisms under Continuous Operation. Bioresour. Technol. 2015, 195, 139–146. [Google Scholar] [CrossRef] [PubMed]
|
Disclaimer/Publisher’s Note: The statements, opinions and data contained in all publications are solely those of the individual author(s) and contributor(s) and not of MDPI and/or the editor(s). MDPI and/or the editor(s) disclaim responsibility for any injury to people or property resulting from any ideas, methods, instructions or products referred to in the content. |
© 2023 by the authors. Licensee MDPI, Basel, Switzerland. This article is an open access article distributed under the terms and conditions of the Creative Commons Attribution (CC BY) license (https://creativecommons.org/licenses/by/4.0/).
