1. Introduction
With the advent of smart manufacturing, real-time from machines in different locations can be accessed through cloud networks, allowing for integration and efficient management. Visual inspection systems, which replace traditional manual inspections, have been widely adopted to reduce reliance on human operators for monitoring machine operations. These systems enable rapid inspection of the external appearance of each product, including the geometric features of nuts and the wear of tap. As metal products are predominantly processed using cutting tools, it is crucial to determine the lifespan of tooth taps and detect variations in their external features. This paper focuses on tooth tap inspection, aiming to producing Grade A nuts steadily and at a large scale. Grade A nuts are utilized in precision machinery sectors such as aerospace, naval vessels, power facilities, and buildings.
By employing computer vision instead of traditional measurement methods, the tap geometry can be obtained quickly and accurately. To tap Grade A nuts at a large scale, it is necessary to calculate the cutting amount and wear of the tap during the tapping process. This involves predicting the location of the maximum tapping load, calculating tapers and taper lengths (with 5, 6, 7, and 8 peaks), nut thickness, and punched hole dimensions to determine whether they are too big or too small among other parameters. The geometric design of the tap is measured before tapping, and the tapping process is recorded for hundreds of nuts. These recordings are then compared with the original information to establish standards for determining the amount of removed material and torque.
Currently, tap specifications include pitch, taper length, overall length, thread length, and shank diameter. However, these specifications do not account for wear-related parameters. Therefore, we propose the incorporation of clearance angle, cutting angle, tooth peak height, taper variation, taper angle, tooth area variation, and nut thread removal in the tap specifications.
Taps are crucial tools in industrial machining, as most metal processing relies on their cutting capabilities. It is essential to quickly predict when the tap will produce non-compliant products. Due to the inability to inspect products on the production line individually, sampling is typically performed within a batch, which results in the possibility of mixing non-compliant products with conforming ones. By efficiently predicting or measuring the geometric condition of taps, manufacturers can reduce waste in producing products and save valuable time, ensuring the production of compliant products.
In the field of edge detection, a detailed introduction to prevailing edge detection methods has been provided [
1]. The operational workflow of edge detection algorithms has been assessed [
2]. A comparison was made between the edge detection methods of Prewitt and Canny [
3]. Finally, a comparison was conducted among methods such as Roberts, Sobel, Prewitt, Laplacian, and Canny [
4]. Under noisy conditions, the edge detection outcomes of Canny, Gaussian Laplacian, Roberts, Prewitt, and Sobel have been scrutinized[
5]. Subsequently, the image edges were enhanced using a filtering technique, followed by the application of an enhanced ant colony optimization method for edge detection [
6]. A unique approach has been employed for edge extraction, addressing the influence of random noise [
7]. An adaptive median filter was used for Canny edge detection [
8]. The Sobel edge detection results have been refined by applying the WNNM algorithm for denoising in noisy environments [
9]. The regions of blurred edges have been eliminated [
10]. P The application of Canny for the detection of water ripples has been demonstrated [
11]. For aerial coastline detection, a local adaptive Canny approach has been employed [
12]. A three threshold methodology has been adopted for Canny edge detection [
13]. A novel variational model has been developed, which automatically and adaptively detects one or more predefined shapes from a given dictionary to guide the edge detection process [
14]. The utilization of Mamdani (Type-2) fuzzy rules based on image gradient values for edge detection has been explored [
15]. A enhanced Otsu method that incorporates edge detection and a decision tree classifier for crack identification has been proposed[
16]. The Bi-Directional Cascade Network (BDCN) structure has been introduced [
17], with individual layer supervised by specific labeled edges. The use of a spiking neural network for infrared edge detection has been presented[
18]. A Deep Learning-based edge detector inspired by both HED (Holistically-Nested Edge Detection) and Xception networks was suggested[
19]. For the paper that presented a new methodology for circle detection based upon randomized isosceles triangles sampling[
20], the authors introduced Curvature-Aided Hough Transform for Circle Detection (CACD) algorithm, which estimates the radius of circles based on curvature[
21]. A novel multi-directional structural tensor has been constructed for corner detection, and a multi-scale corner measurement function is proposed to eliminate false candidate corners [
22]. A purely event-based corner detector and a novel corner tracker have been introduced [
23]. A new type of filter has been proposed, which is capable of simultaneously enhancing corners while suppressing edges and noise [
24]. In addition, a multi-metric linear least squares iterative closest point algorithm for line detection in radar point clouds has been proposed[
25]. Mu and Li (2018) proposed the Progressive Probabilistic Hough Transform (PPHT), which combined the Shi-Tomasi corner detection algorithm to enhance corner detection accuracy [
26], thereby eliminating or reducing the problem of overfitting in the least squares method [
27]. Different least squares methods has been introduced [
28]. For each class of points-to-points (planes and lines), an optimization of linear least square iterative closest point algorithm is proposed [
29]. Deep learning has been utilized to predict road segments, and optimal curve fitting gas been achieved through using the least squares method [
30].
The study concludes the following: (1) Tapping tools change, especially in the cutting tooth peaks, as indicated by the cone angle variations during tapping operations. (2) Tapping tools have a clearance angle. (3) Measurement of cutting angles is only applicable to the detection of brand-new tapping tools. (4) Peak 5 and peak 6 experience the most significant wear. (5) Tooth peaks exhibit wear from peak 3 to peak 8. (6) Tooth peak areas decrease over time due to wear. (7) The amount to remove the thread increases as the tool becomes dull.
2. System setup
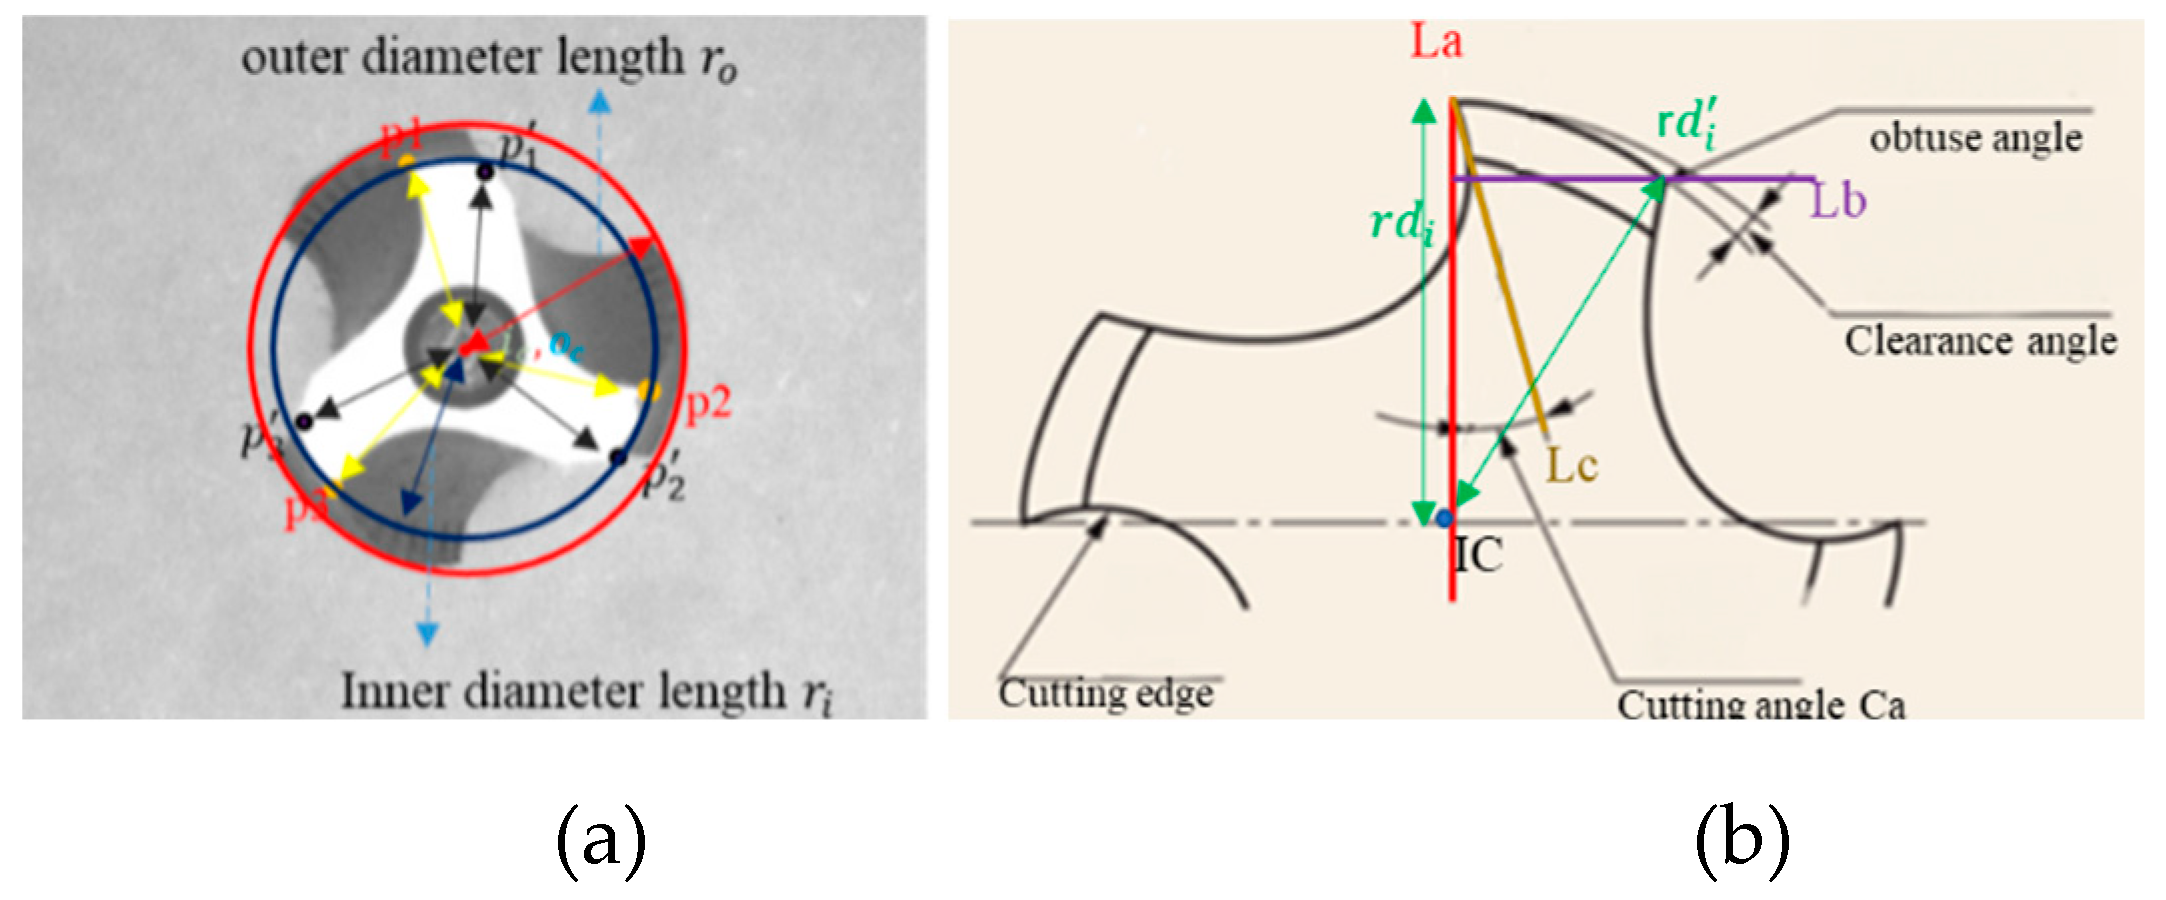
This paper proposes a three-part inspection system. Tap placement inspection、tap frontal inspection and tap side inspection. Subsystem 1, as shown in
Figure 1.a, determination of outer
, inner
. Subsystem 2, as shown in
Figure 1.b, involves the identification of cutting angles
, and clearance angles
, and calculation of cone angle coa. Subsystem 3, depicted in
Figure 2, focuses on measuring the guiding section angle
, cutting section angle
, polishing the threaded angle
, peak height
, cone length c1, tooth length t1, peak area
, and nut removal amount
. As illustrated in
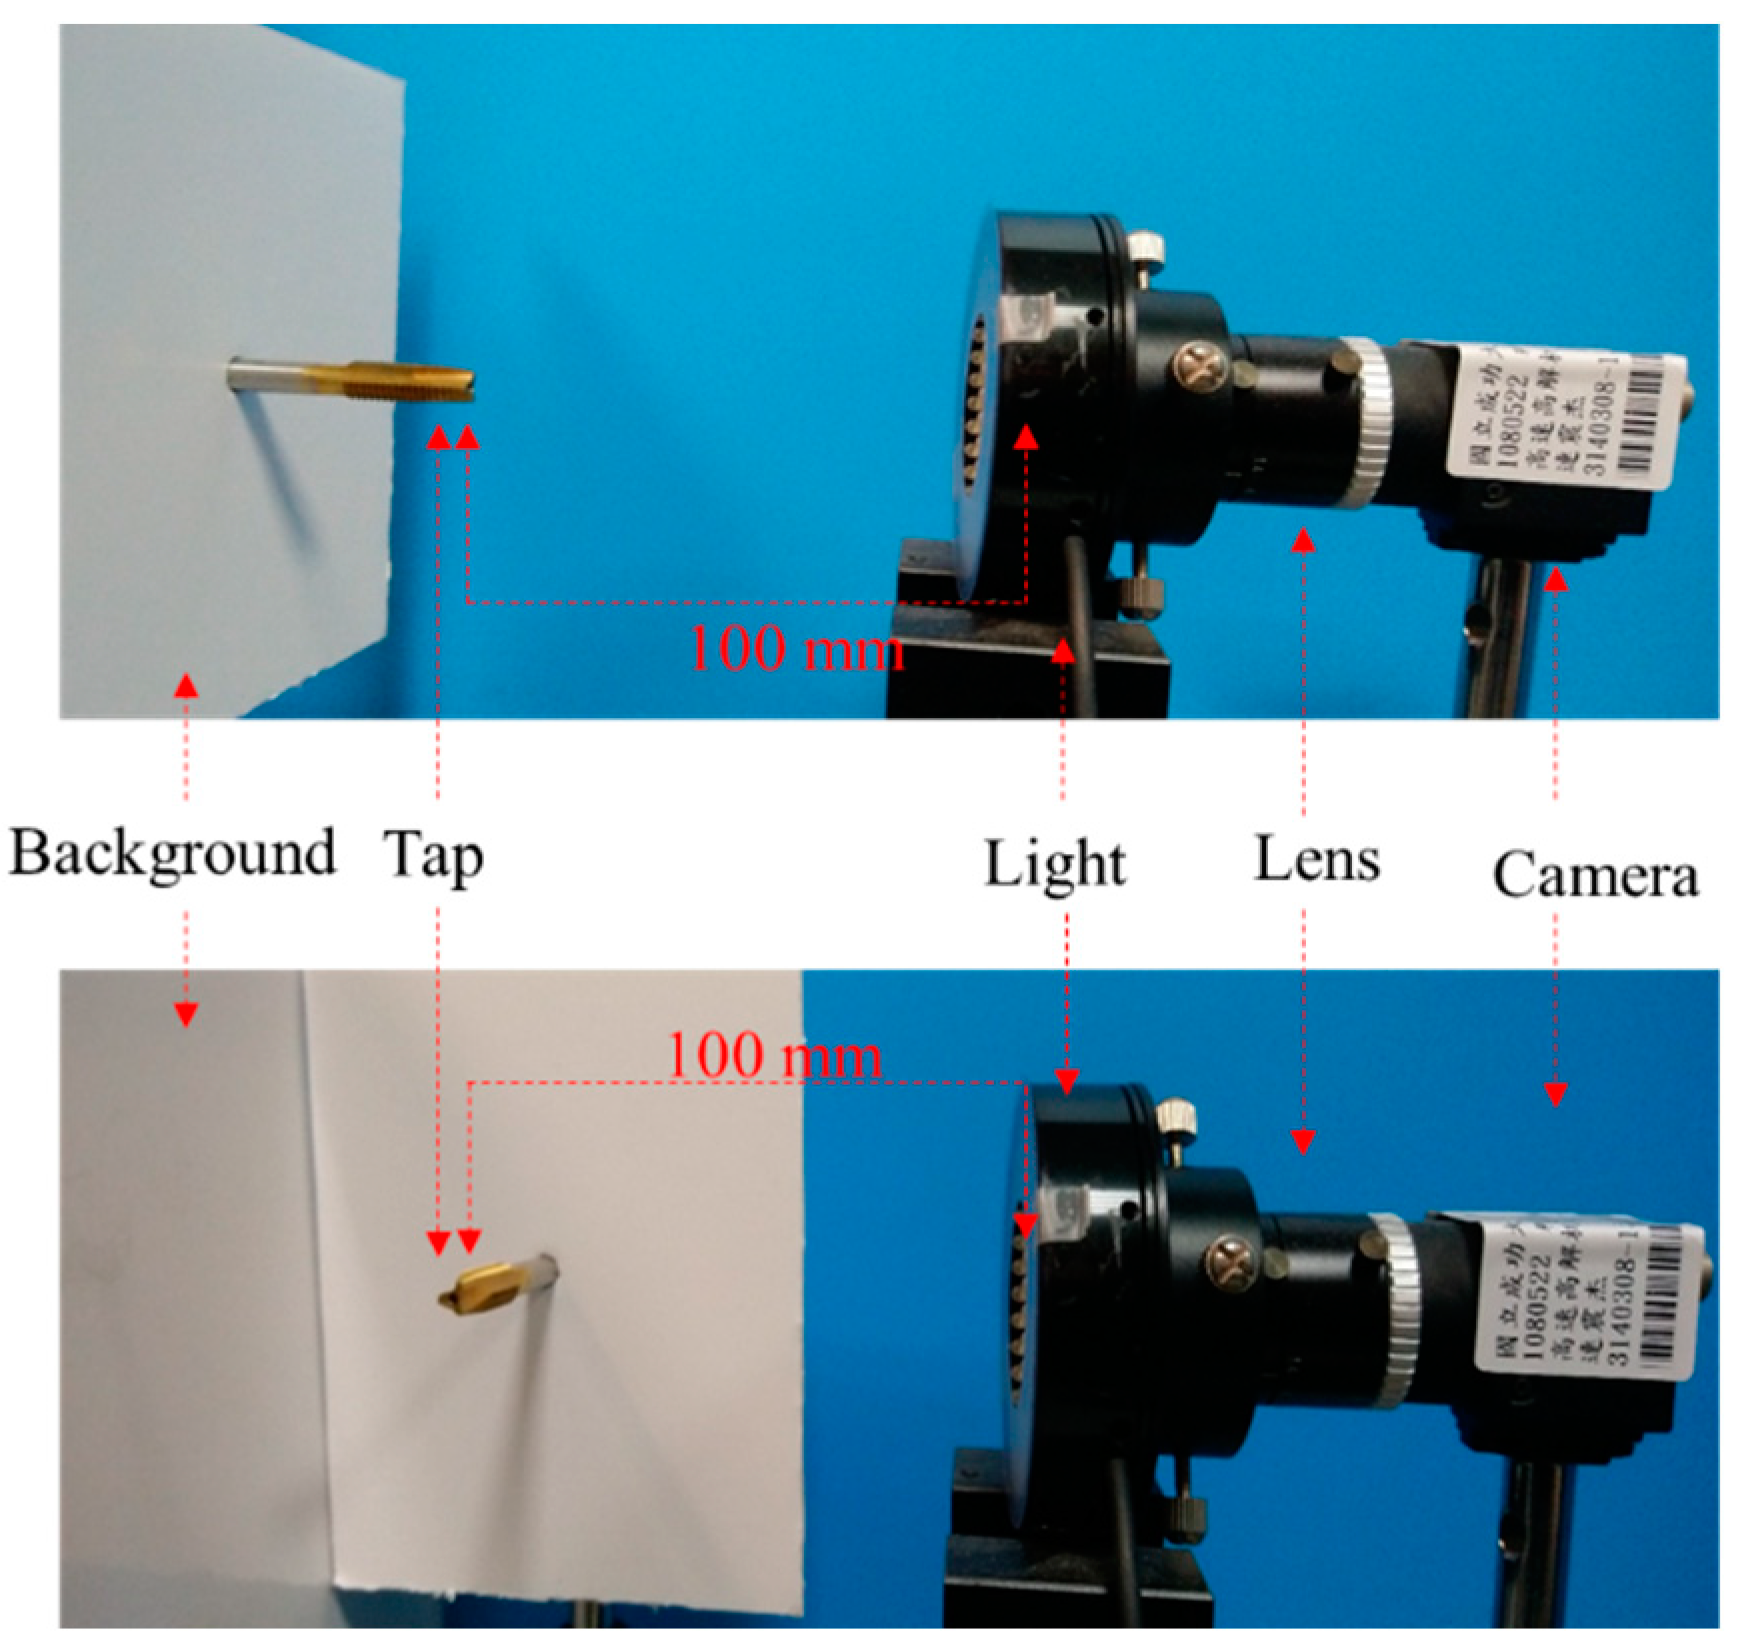
Figure 3, we captured the front and side images of the tap, simulating a floating working environment for the tap.
System setup as shown in
Figure 3, an industrial camera is used, and the tap is placed on a bracket to simulate the setup on the machine. The camera is positioned 100mm away from the tap. The official tap inspection standards, as listed in
Table 1, specify a pitch of 1.25mm, guide section 5mm, an overall length of 70mm, and a shank diameter of 6.2mm. However, these official standards only focus on specific parameters such as pitch, overall length and thread length without considering wear detection. Therefore, the official standards cannot be directly applied to tap inspection. A tap inspection concept based on brand-new taps is therefore proposed. When a tap fails to produce Grade A nuts, it would be replaced.
Table 2 presents the proposed tap measurement criteria. As a result, we could not directly measure the geometric inspection results of the tap. Instead, we simulated wear through manual means and use precise A Grade nut standards with a tolerance of ±2% to eliminate taps.
Three operating conditions were hypothesized: using a ring light with a background plate, using a backlight plate, and using a ring light combined with a background plate
Figure 4. We first captured the surface of the nut to verify the alignment of the tap. Then, we proceeded with the tap face inspection.
3. System Framework
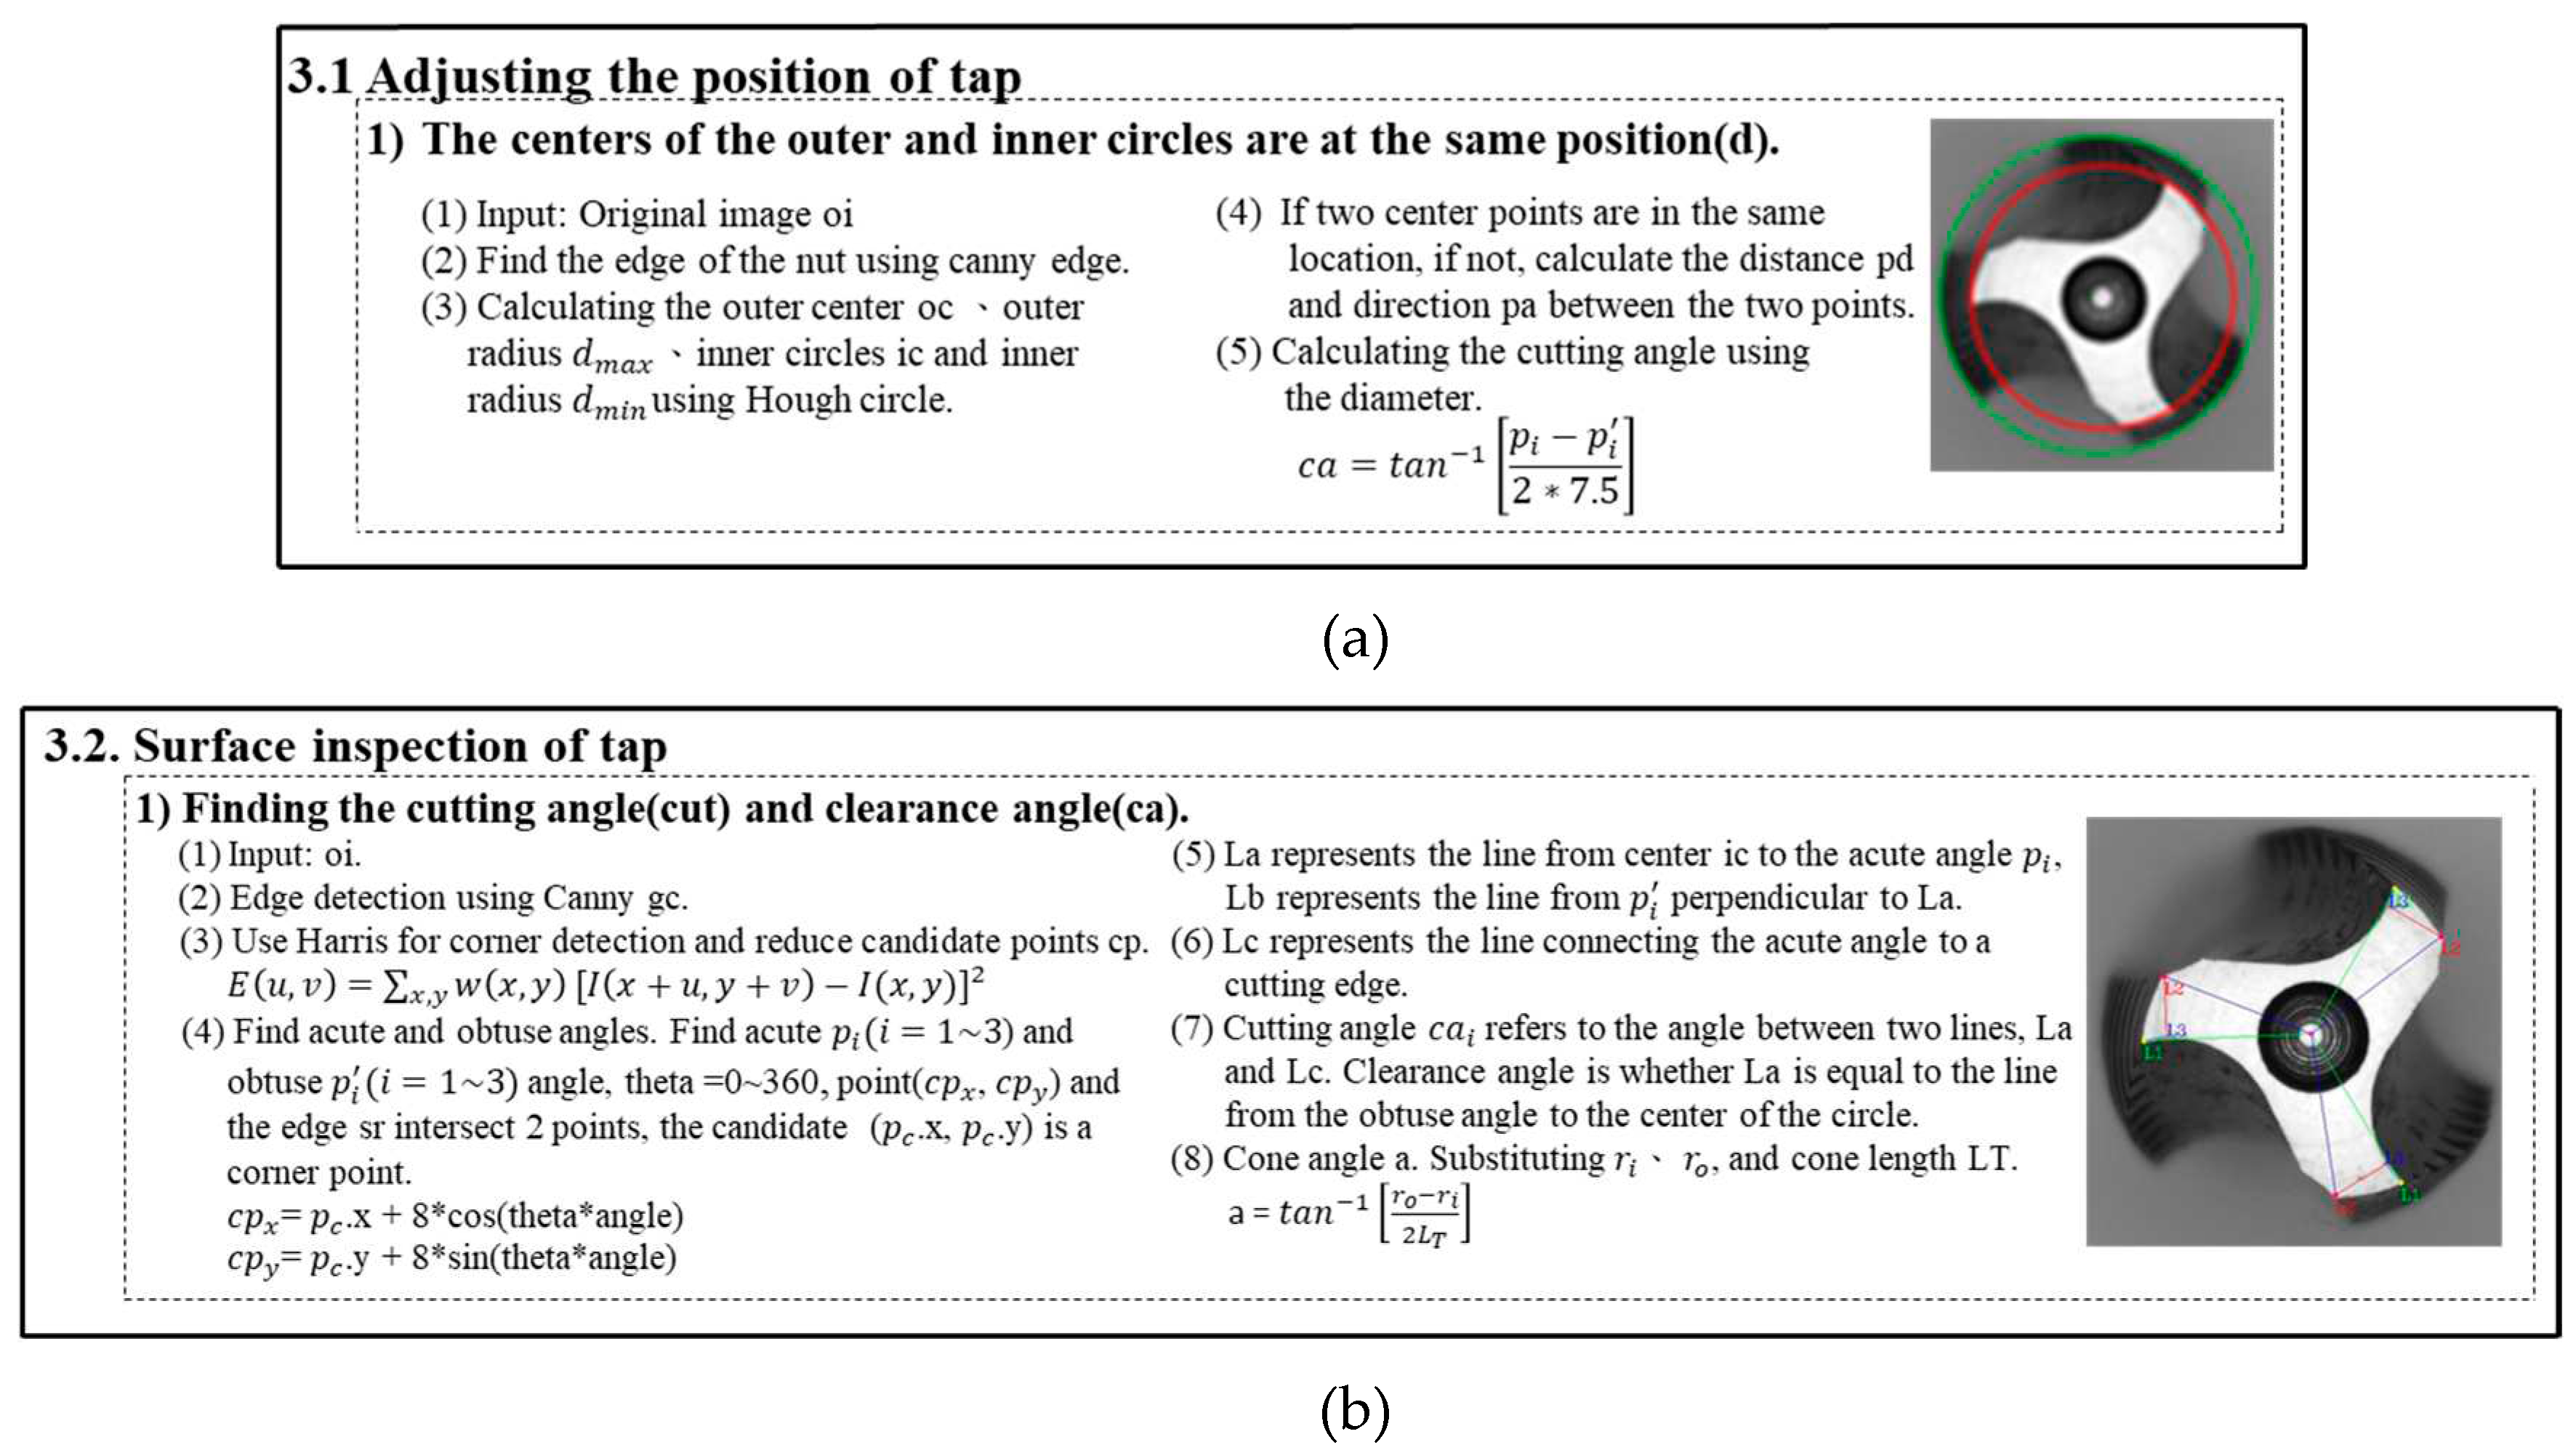
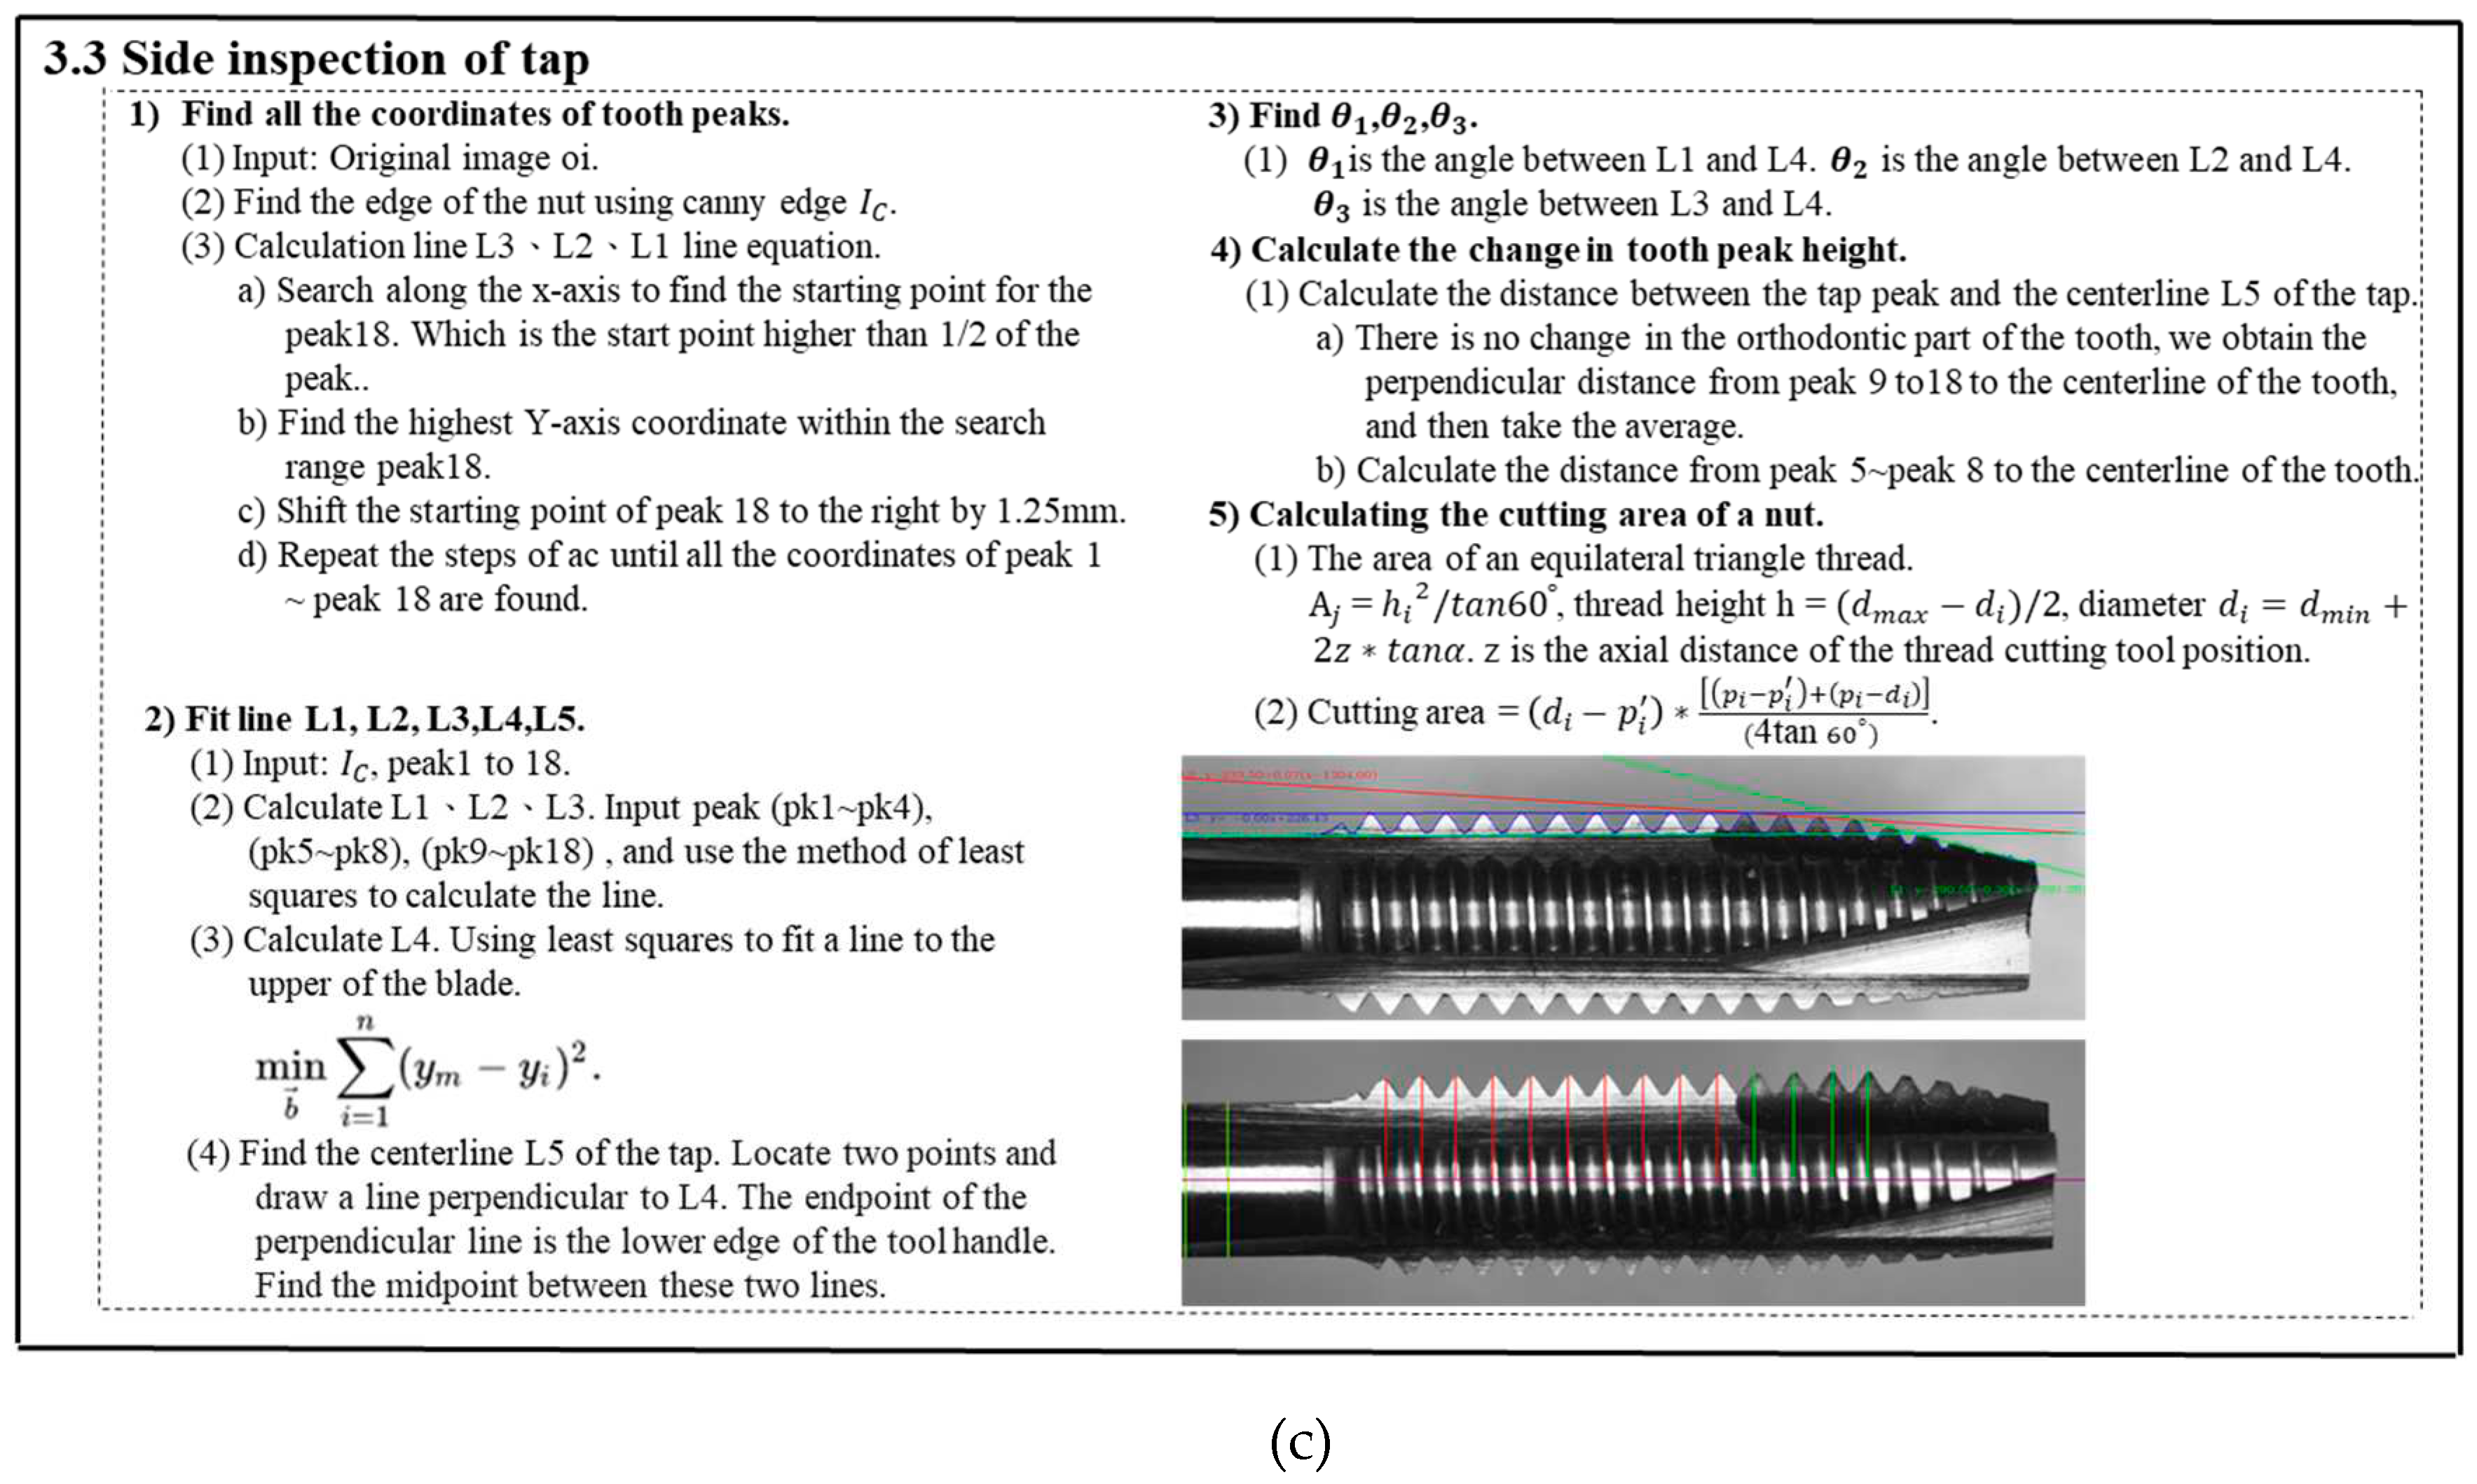
This research divides the tap inspection system into three parts in
Figure 5: tap placement, tap front-side inspection, and tap-side inspection. Tap placement is focused on determining whether the tap is properly positioned. Tap front-side inspection involves the detection of the cutting angle、clearance angle, and cone angle. Tap side inspection includes the measurement of guiding section angle、cutting section angle、polishing the threaded angle, cone length, blade length, tooth peak height variation, tooth peak area, and nut removal amount.
3.1. Tap alignment inspection
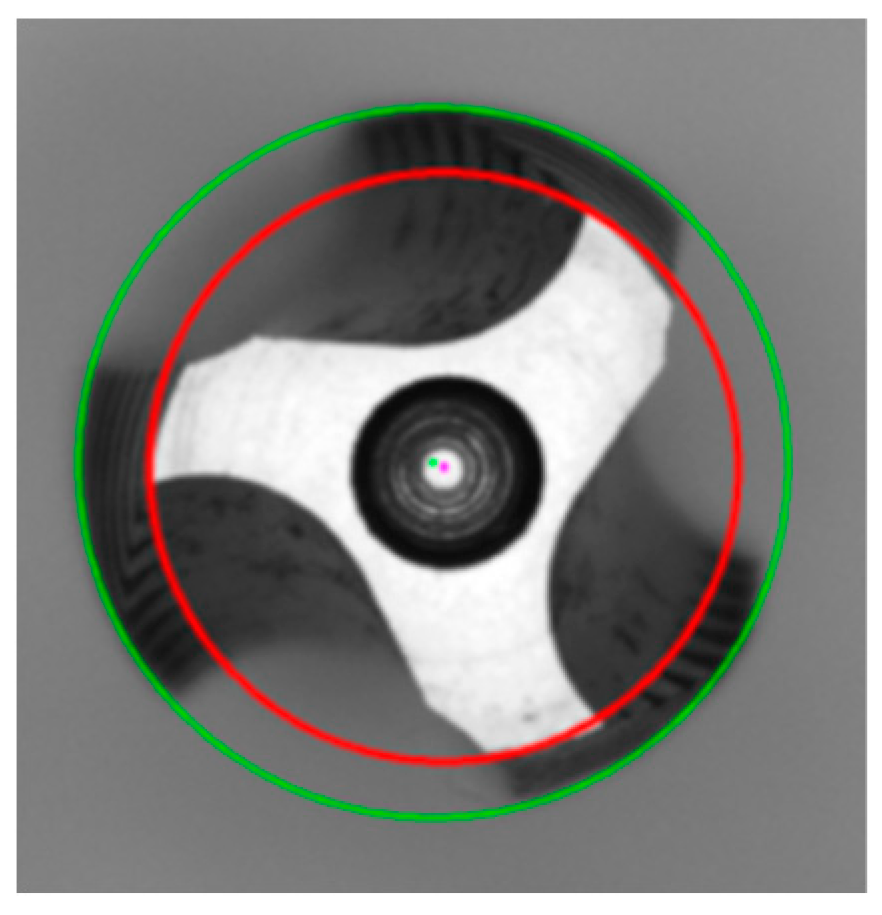
In order to detect whether the tap is correctly placed and to reduce errors in the inspection process, the tap placement detection was performed prior to capturing the front side and side images of the tap. To facilitate subsequent concentricity inspection, the tap contour was extracted using the Canny edge detection algorithm. Then, the Hough circle transform was applied to detect the inner and outer circles of the tap. This method helps to determine the concentricity of the tap. If the distance between the circles exceeds a predefined threshold, it indicates an eccentricity issue with the tap, which requires adjustment. In this article, a standard radius of ±5 pixels was utilized to calculate the center and radius of the inner and outer circles on the front side of the tap in
Figure 6. Once the tap placement is confirmed, images of the tap's front side and side can be captured for further analysis.
During the tap detection process, we encountered two types of noise. The first type of noise is the iron chips and dust generated during the tapping operation; the second type is camera noise. To address the first types of noise, lubricating oil was used during tapping to flush and cool down the area, effectively removing iron chips and dust. As for the camera noise. The cone angle of the tap was then calculated based on the outer diameter and inner diameter.
refers to the outer diameter radius, refers to the inner diameter radius, and represents the length of the tap's guiding portion.
Finally, the distance between the center of the inner circle and the center of the outer circle is used to determine whether the tooth position needs adjustment.
3.2. Surface inspect of tap
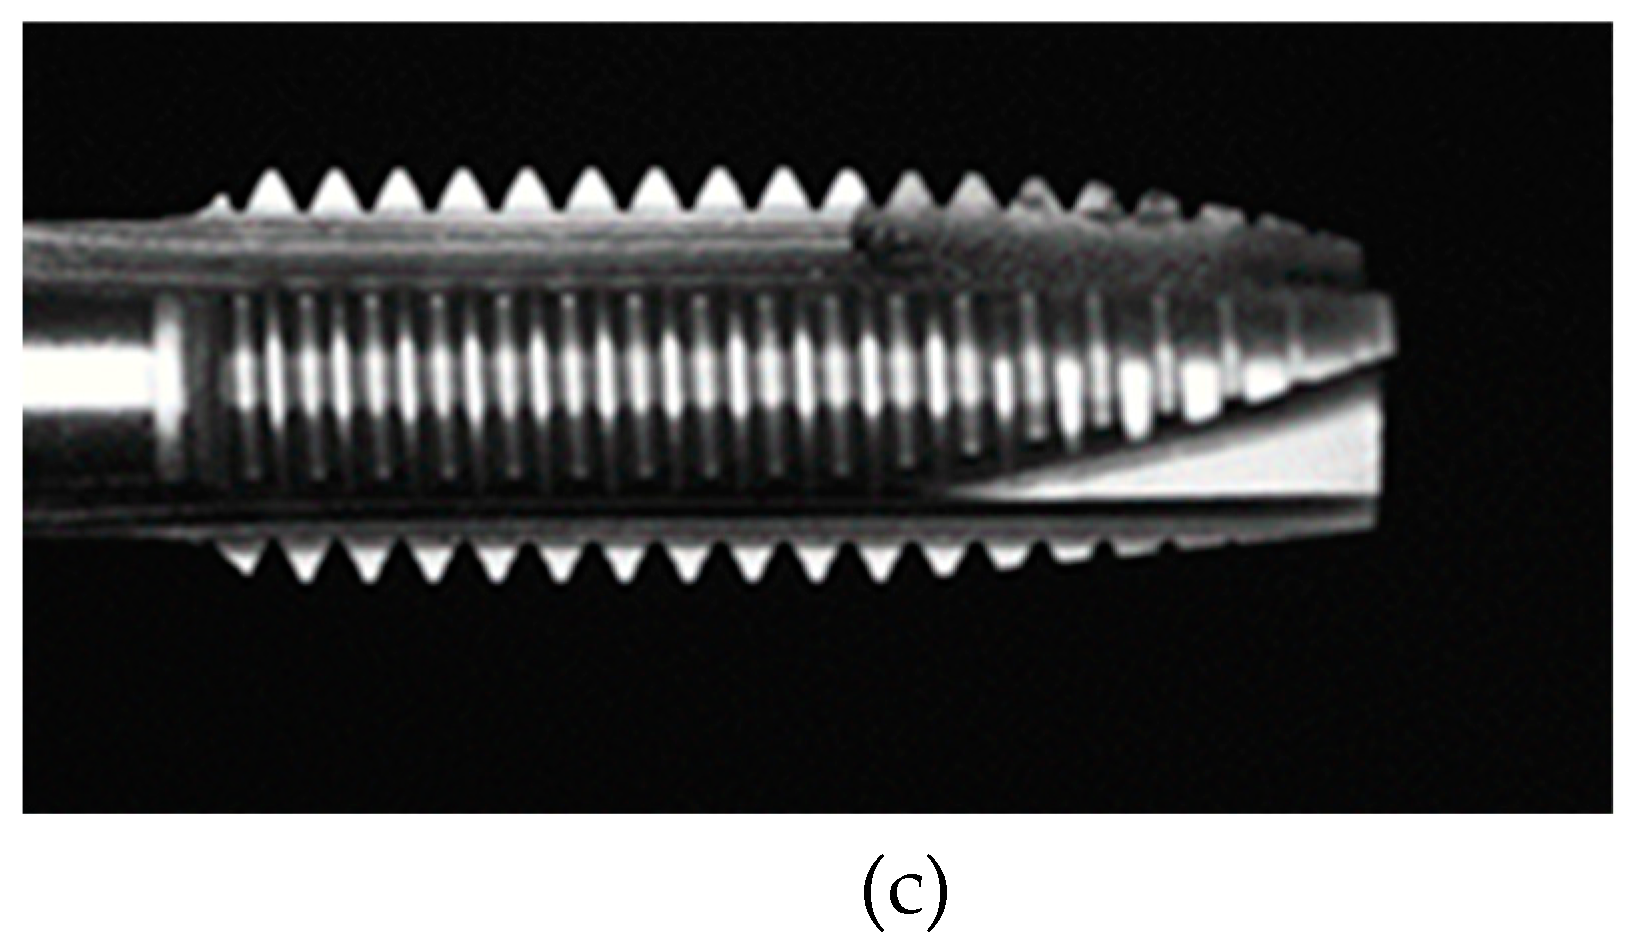
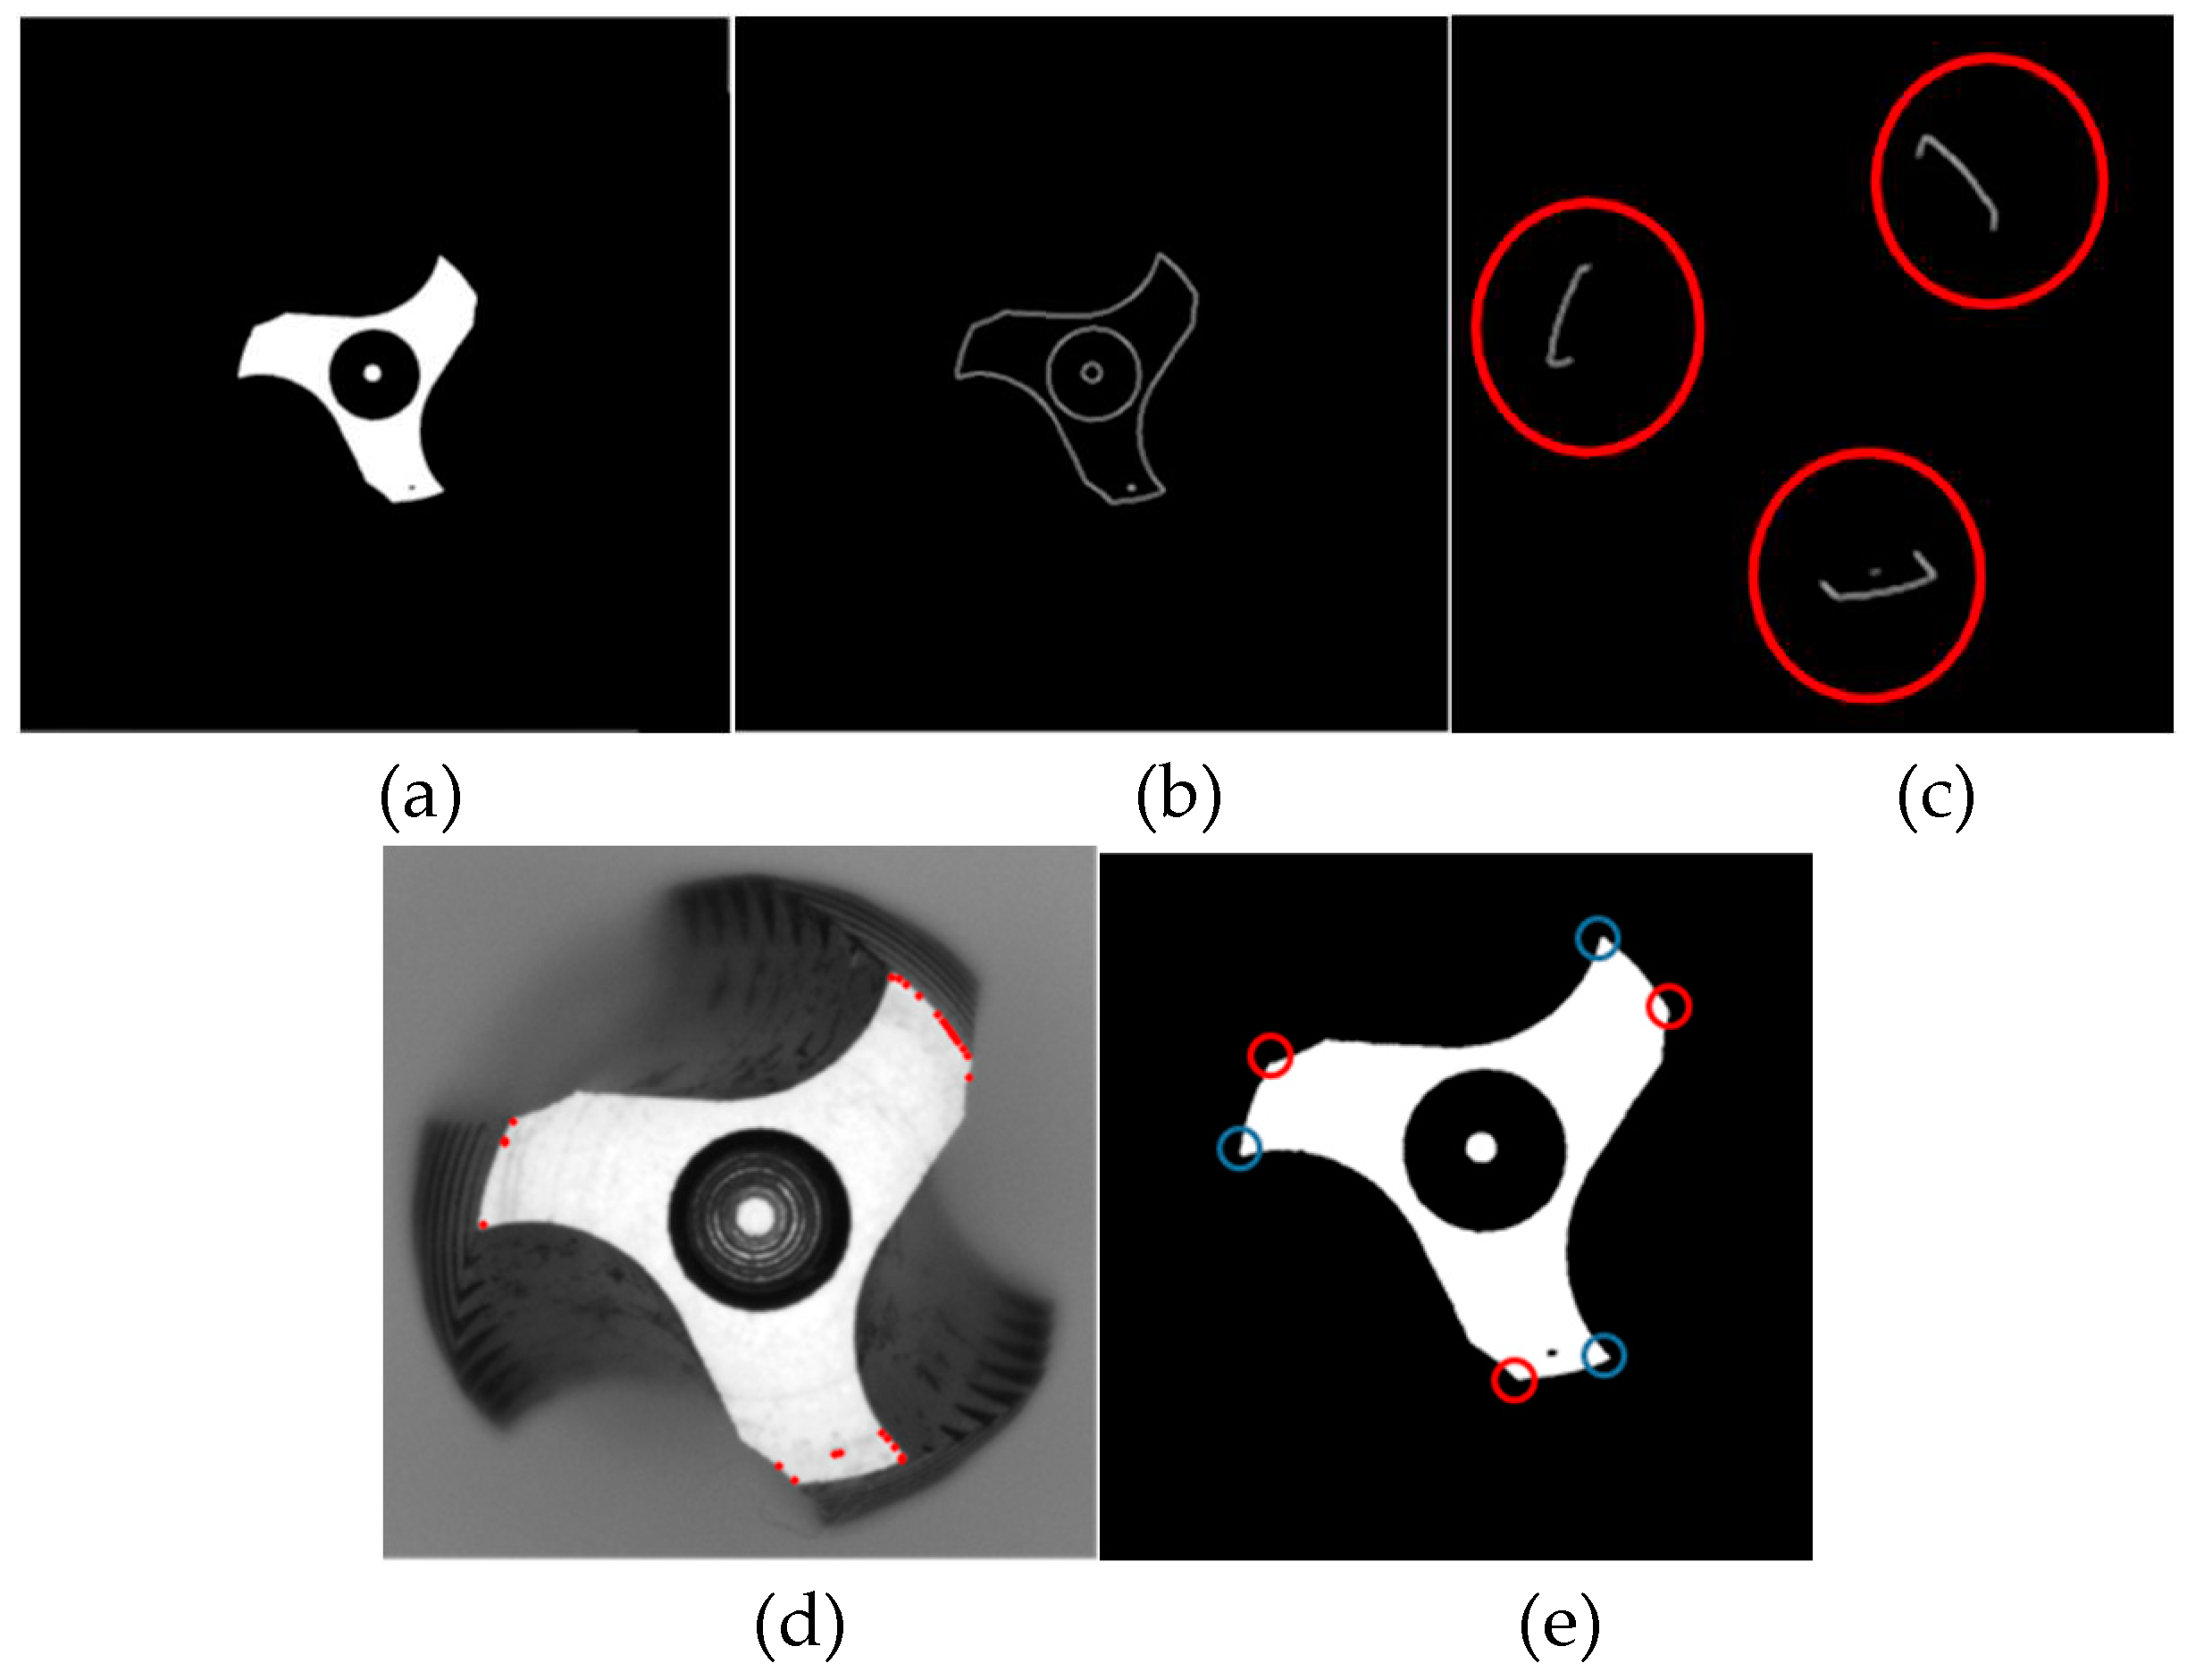
To determine the wear generated during tapping and whether the tap can produce Class A nuts, we propose to detect the cutting angle and clearance angle in the frontal tap inspection. By observing the wear on the front surface of the tap, we can assess if the tap can still be a Class A nut. Once the tap placement inspection is completed, the target contour needs to be extracted. Based on image observation, the region of interest appears close to grayscale 255
Figure 7.c, so we applied thresholding to extract the region of interest image. After extracting the tap contour, we used the Canny edge detection method to obtain the tap contour image. However, directly using the contour to identify the desired acute angles
, where I ranges from 1 to 3, and obtuse angles
, where I ranges from 1 to 3, is challenging. Directly applying corner detection would yield numerous corner points, making it difficult to select the required ones. Therefore, further refinement of the detection range is necessary. Since the tap specifications are fixed, we utilize the tap specifications to retain the edge information at the cutting edge. By taking the tap center as the reference point, we preserved the edge information within a radius of 180~200 pixels, obtaining an edge information image figure. Subsequently, the Harris algorithm is applied to the region of interest for corner detection.
In the equation, w(x, y) represents the window at position (x, y), I(x, y) indicates the intensity at that position, and I(x+u, y+v) is the intensity at the moved window (x+u, y+v). The coordinates of the detected corner points are subsequently stored for further identification of acute and obtuse angles using a diagram
Figure 7.d.
Next, we proceeded to identify three acute angles and three obtuse angles from the cutting edge. For each candidate point, which is represented as point[i] (
,
), we performed the following evaluations: Taking the candidate point as the center, we drew a circle with a radius of 8 pixels. Condition one specified that the circle should intersect the tooth profile twice. Condition two stated that if the circle intersects the tooth profile twice, we could determine whether the angle formed is a straight line, an obtuse angle, or an acute angle using a diagram.
Furthermore, we calculated the distance between the acute angles , and the obtuse angles, , to determine if they lie on the same cutting edge. From the image, it can be observed that if the acute and obtuse angles are on the same cutting edge, they were with the shortest distance. This makes it easy to classify into three groups of acute angles and obtuse angles.
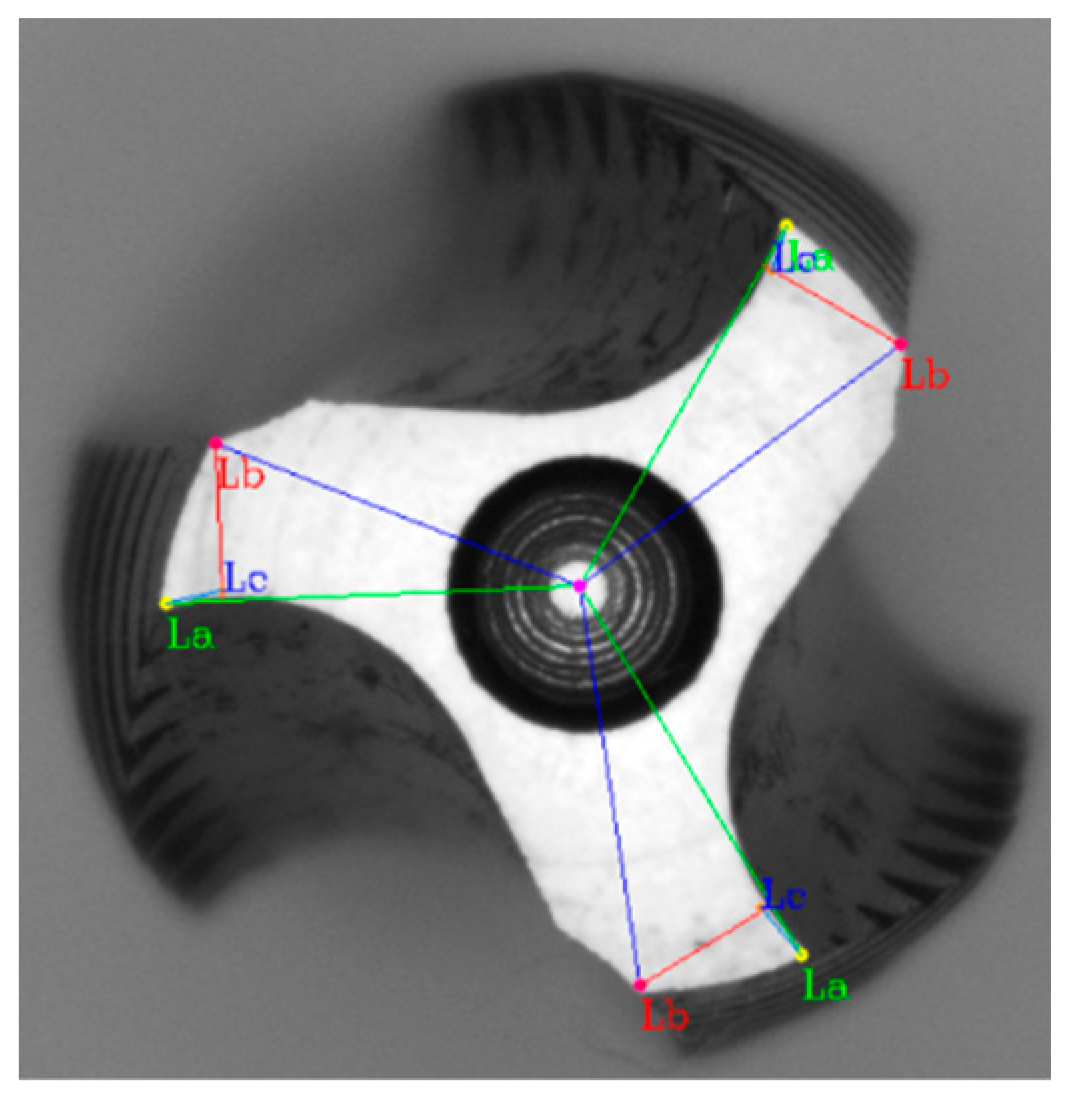
To determine the cutting angle ca, geometric relationships were applied. We connected the center of the inner circle ic, to the acute angle, forming line segment La. We drew line segment Lb perpendicular to La from the obtuse angle. Using the acute angle as the center, we further drew a circle with a radius of 5 pixels to find the coordinates that intersect the tooth profile. However, there would be two points of intersection. Line segment Lb was used to determine which point was closer to the intersection of La and Lb. The point closest to the intersection on the arc pta, is the desired point. We drew line segment Lc from the acute angle through pta, reaching Lb. The angle between La and Lc is the cutting angle ca in
Figure 8.
Next, we wanted to prove the existence of the clearance angle in the cutting edge. We calculated the distance , between the acute angle , and the center of the inner circle ic, as well as the distance , between the obtuse angle , and ic. By comparing and . If the results of the distance are not equal, it might indicate an issue of clearance angle.
3.3. Tap side detection
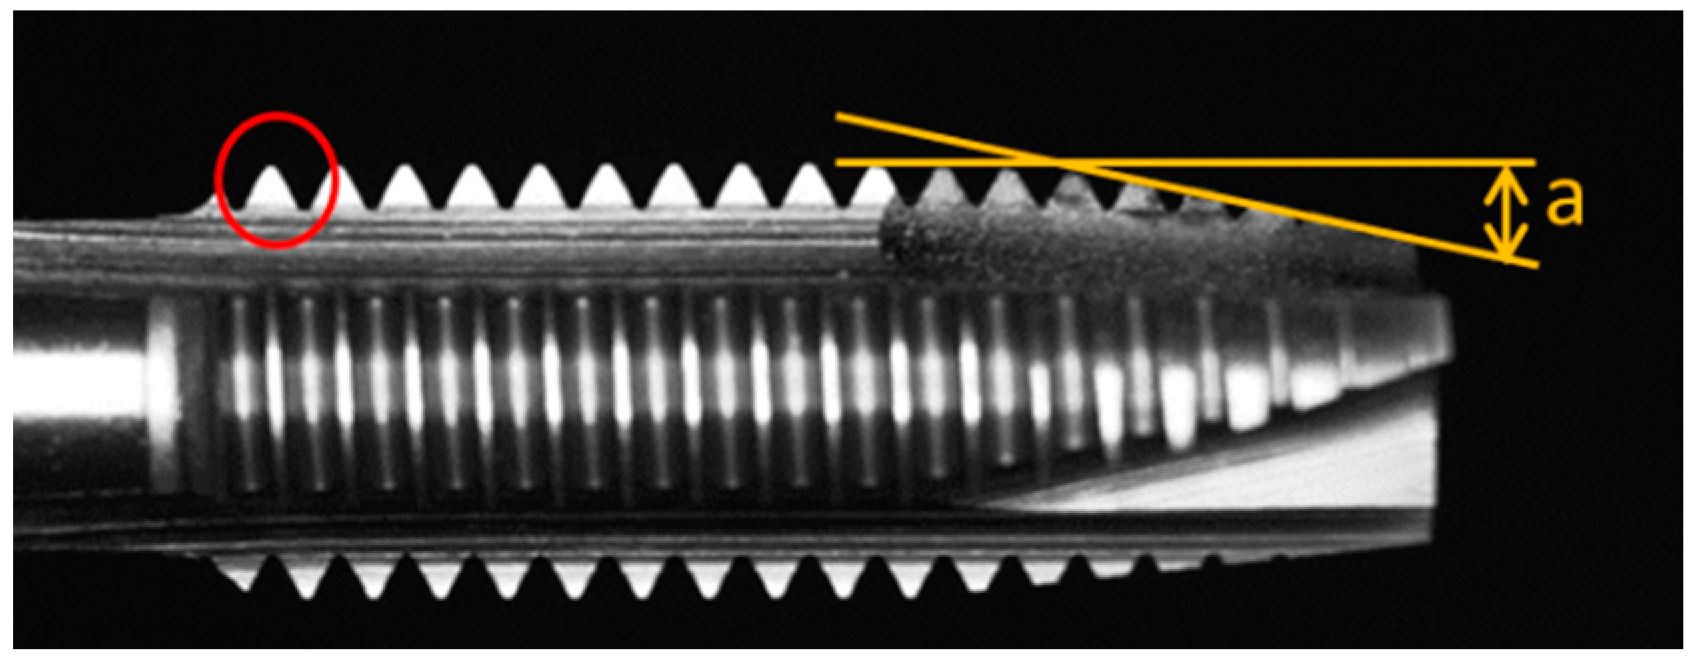
The objective of the side face inspection is to determine the amount of material removed from the nut threads during tapping. To accomplish this, it is necessary to measure the tooth peak height on the side face of the tap. Furthermore, the tap cone angles of the guiding section , cutting section , and organize the threaded section were utilized to assess whether the tap is capable of producing A-grade threads or not.
Once the tap placement inspection is completed in
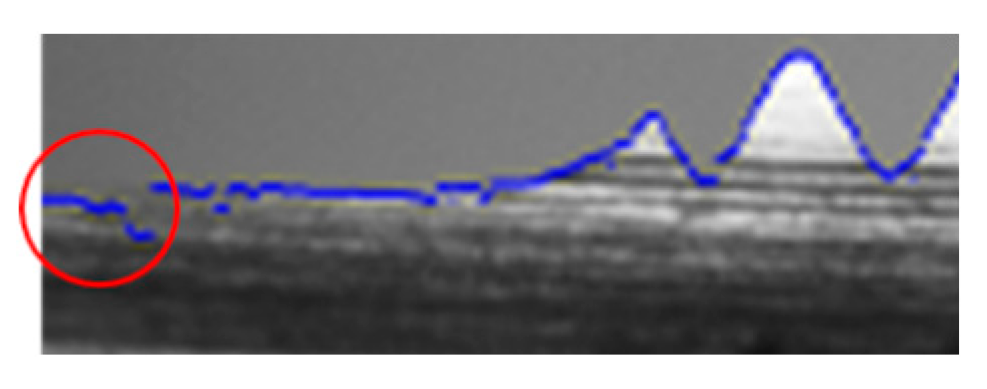
Section 3.1, side-face images of the tap are simultaneously captured. First, the tap contour needed to be extracted. In this paper, the Canny edge detection algorithm was used for edge detection. However, the edge detection process might be challenging because the tap shank might blend with the background in the image and the tap contour may not be accurately extracted in
Figure 9. The straight characteristic of the tap shank can be utilized to weight the input coordinates.
To obtain accurate shank fitting results. We assigned the y-coordinate of the x-axis 0 to the x-coordinates from 0 to 9, the y-coordinate of the x-axis 10 to the x-coordinates from 10 to 19, and so on until the x-axis reaches 99.
3.3.1. Calculate L1、L2、L3、L4 and L5
The objective is to identify the lines L1, L2, L3, L4, and L5
Figure 10. First, we located the tooth valley of peak 18. For this purpose, we used half of the tooth peak height as the initial point when searching for the tooth valley. The reason for choosing half as the initiating point is that there was a small tooth peak to the left of peak 18 in the image
Figure 9, and its height did not exceed half of peak 18 height. We found the starting point peaks18 of tooth peak 18 from the tap contour. we proceeded to locate the tooth valley peakv18 of peak 18. Using peaks18 as the reference point, we could then search for the highest y-value within the range of peaks18.x-40 to peaks18.x.
Next, we conducted a search for peak 18 by identifying the coordinate with the smallest y-value within the search range of peakv18.x to peakv18.x+80. We chose a range of 80 pixels because the tooth peak width is 80 pixels(≈1.25 mm). Next, search for peak17. The first search result is peak17 valley peakv17, here offset 1.25 mm to the right from peakv18, obtaining the starting point for peak17 valley search, denoted as peak17s. Using the maximum y-value in the region, we located the coordinate peak17v within the search range of peaks 17.x-15 to peaks 17.x+15. We repeated the above process to determine all the peaks from peak 18 to peak 1.
Next, store the contour coordinates of the handle required for calculating line segment L4. We will store the first 100 coordinates here.
We calculated the cone angles
,
, and
for the guiding section, cutting section, and polishing the threaded section, respectively. We input coordinates and then employ the least squares method to fit a line segment L1 to L4 into the form y = k × x + b:
To obtain the slope k and solve the equation for obtaining b. L1 represents input from peak 1 to peak 4, L2 represents input from peak 5 to peak 8, and L3 represents input from peak 9 to peak 18. Next, the upper contour of the handle is fitted to generate the line segment L4 using the tool handle coordinates. To minimize the impact of shadows and reflections figure 10, the coordinates are input using subpixels. For the x-coordinates from 0 to 9, the y-coordinate of x-axis 0 is uniformly assigned. Similarly, for the x-coordinates from 10 to 19, the y-coordinate of x-axis 10 is uniformly assigned. The same logic is applied to the remaining 80 handle coordinates. The line segment L4 is then fitted using the method of least squares. This approach minimizes the influence of reflections and shadows.
To locate the centerline L5 of the tap, we used the 10th and 100th coordinates stored in the tap contour, denoted as L5p1 and L5p2, respectively. We drew two perpendicular lines, m1, and m2, to line L4 using these coordinates. We recorded the coordinates where m1 and m2 intersect with the lower-end contour of the tap, denoted as L5p and L5p. We calculated the midpoint coordinate m10 between L5p1 and L5p. Similarly, we calculated the midpoint coordinate L5mp2 between L5p2 and L5p. Finally, we could identify the centerline L5 of the tap by drawing a line through points L5mp1 and L5mp2.
3.3.2. Calculate 、、
Calculate the angle between L1 and L4 as the guiding angle , the angle between L2 and L4 as the cutting angle , and the angle between L3 and L4 as the polishing the threaded angle .
3.3.3. Calculate the tooth peak height.
The variation in height was calculated after wear on the tooth peaks, the length of the tooth cone section was measured to evaluate if it is affected by the wear, and the amount of material removed from the nut was calculated. The distances , can be calculated from each peak (peak18 to peak5) to the line L5. The average value, ad1, of to shall be calculated as well. Finally, individual tooth peak heights shall be recorded for peak5 to peak8.
To calculate the length of the tap and the length of the cone section, first locate the mapping position of the tooth valley peakv18, at the trailing edge of the blade on the tap centerline L5, denoted as bf. Identify the mapping position of the tooth valley peakv8, at the end of the tap cone section on the tap centerline L5, denoted as cf. Find the position of the tap crest face
sf, by starting from the peak1.x position and searching for the contour's vertical fracture position. Determine if the consecutive coordinates have a difference greater than a threshold value. The point sf maps to the position sp on the tap centerline, L5. Calculate the positions bf, cf, and sp on the line L5 using the following formula:
H represents the mapping of point P(p.x, p.y) on the line ax + by + c = z. H = (p.x + at, p.y + bt), where H is a point that satisfies the equation ax + by + c = z. The length of the tap is the distance between bf and sp. The length of the cone section is the distance between cf and sp.
To calculate the amount of material removed from the nut thread during tapping
Figure 11, we can use the previously obtained tooth peak height
, shank width
, and tooth valley positions
. First, we had to calculate the area of the tooth peak's equilateral triangle in its original state:
is the cone angle, and the tooth height is given by h=, where is the distance from the tooth peak to the furthest point on the tooth from the center. Using this formula, we can calculate the equilateral triangle area for a brand-new tooth peak (shown in red circle). Next, we calculate the triangle area for the tooth peak with wear.
represents the cone angle, where the tooth height is given by h=
. The corresponding diameter is
, where z is the axial distance from the tooth peak.
is the distance from the highest tooth peak to the center of the tooth, and
is the distance from the lowest tooth valley to the center of the tooth. Finally, we calculate the amount of material removed from the nut (cutting area).
represents the amount of material removed from the nut, is the area of the intact triangular tooth peak, and is the area of the specified worn tooth peak. The height h is given by , where is the specified tooth peak height. is the distance from the highest tooth peak to the center of the tooth, and is the distance from the lowest tooth valley to the center of the tooth. By comparing the changes in tooth peak area and the amount of material removed from the nut, we can determine if the nut meets the requirements for an A-grade thread after tooth tapping.
4. Experimental results.
This research is a subproject of smart manufacturing for intelligent tapping machines, responsible for simulating and developing geometric inspection techniques for nuts and tapping tools. Practical inspection techniques are developed based on the inspection requirements proposed by the tapping machine manufacturing team. Two types of tapping tools were utilized, both with the same external design but different materials: one made of titanium and the other made of stainless steel.
Figure 12.a shows the stainless-steel tap of model 6912, and
Figure 12.b shows the titanium tap of model 7912p. We conducted experiments on three sets of tapping tools, including brand-new tapping tools, tapping tools used on 60 nuts, and artificially polished tapping tools. For the artificially polished tapping tools, we captured images starting from the brand-new state, recorded the duration of electric grinding after fixing and captured images after each grinding to simulate the gradual wear of tooth edges. In this study, we measured the geometric characteristics of the tapping tools with two different materials and our proposed inspection method. Based on the inspection results, the changes in the tooth edge area and the amount of thread removal from the nuts were calculated.
Industrial cameras were used to capture images of the frontal and side views of the tapping tools. The original size of the camera was 4000×3000 pixels, but we selected a cropped image size of 2048×1024 pixels based on the distance, focal length, and size of the tapping tool in the frame. According to calculations, each pixel corresponds to a size of 16 micrometers.
Since the tapping tools in the tapping machine manufacturing team might be floating, it is necessary to ensure their proper placement before conducting geometric inspections and operations. Once the tools were properly placed, the geometric inspection of the frontal and side views of the tapping tools would be carried out. Two cameras would be installed on the production line specifically for capturing the frontal and side views of the tapping tools.
We can extract the cutting angle, clearance angle, and cone angle calculations from the frontal view of the tapping. From the side view of the tapping tool, the angles of the guiding section, cutting section, and thread polishing section were inspected, and the wear of each tooth peak was measured. Inspections were also conducted on the blade length and taper length. Finally, we calculated the tooth peak area and the variation in thread-cutting volume for the nut.
Table 3.
Detecting the number of tapping tools.
Table 3.
Detecting the number of tapping tools.
| |
New |
Tapping 60 time |
Artificial gradual wear |
| 6912 |
1 |
0 |
6 |
| 7912p |
2 |
2 |
6 |
We compared the geometric inspection results of brand-new tapping tools with those used for tapping 60 nuts. However, the tapping machine manufacturing team manually loaded the nuts onto the tapping machine, and we were unable to obtain nuts with a higher number of tapping. Therefore, to simulate the wear of the tapping tools, we utilized an electric grinder fixed at a constant speed. Each tooth peak was ground for 2 seconds before stopping and capturing images for geometric measurements.
From
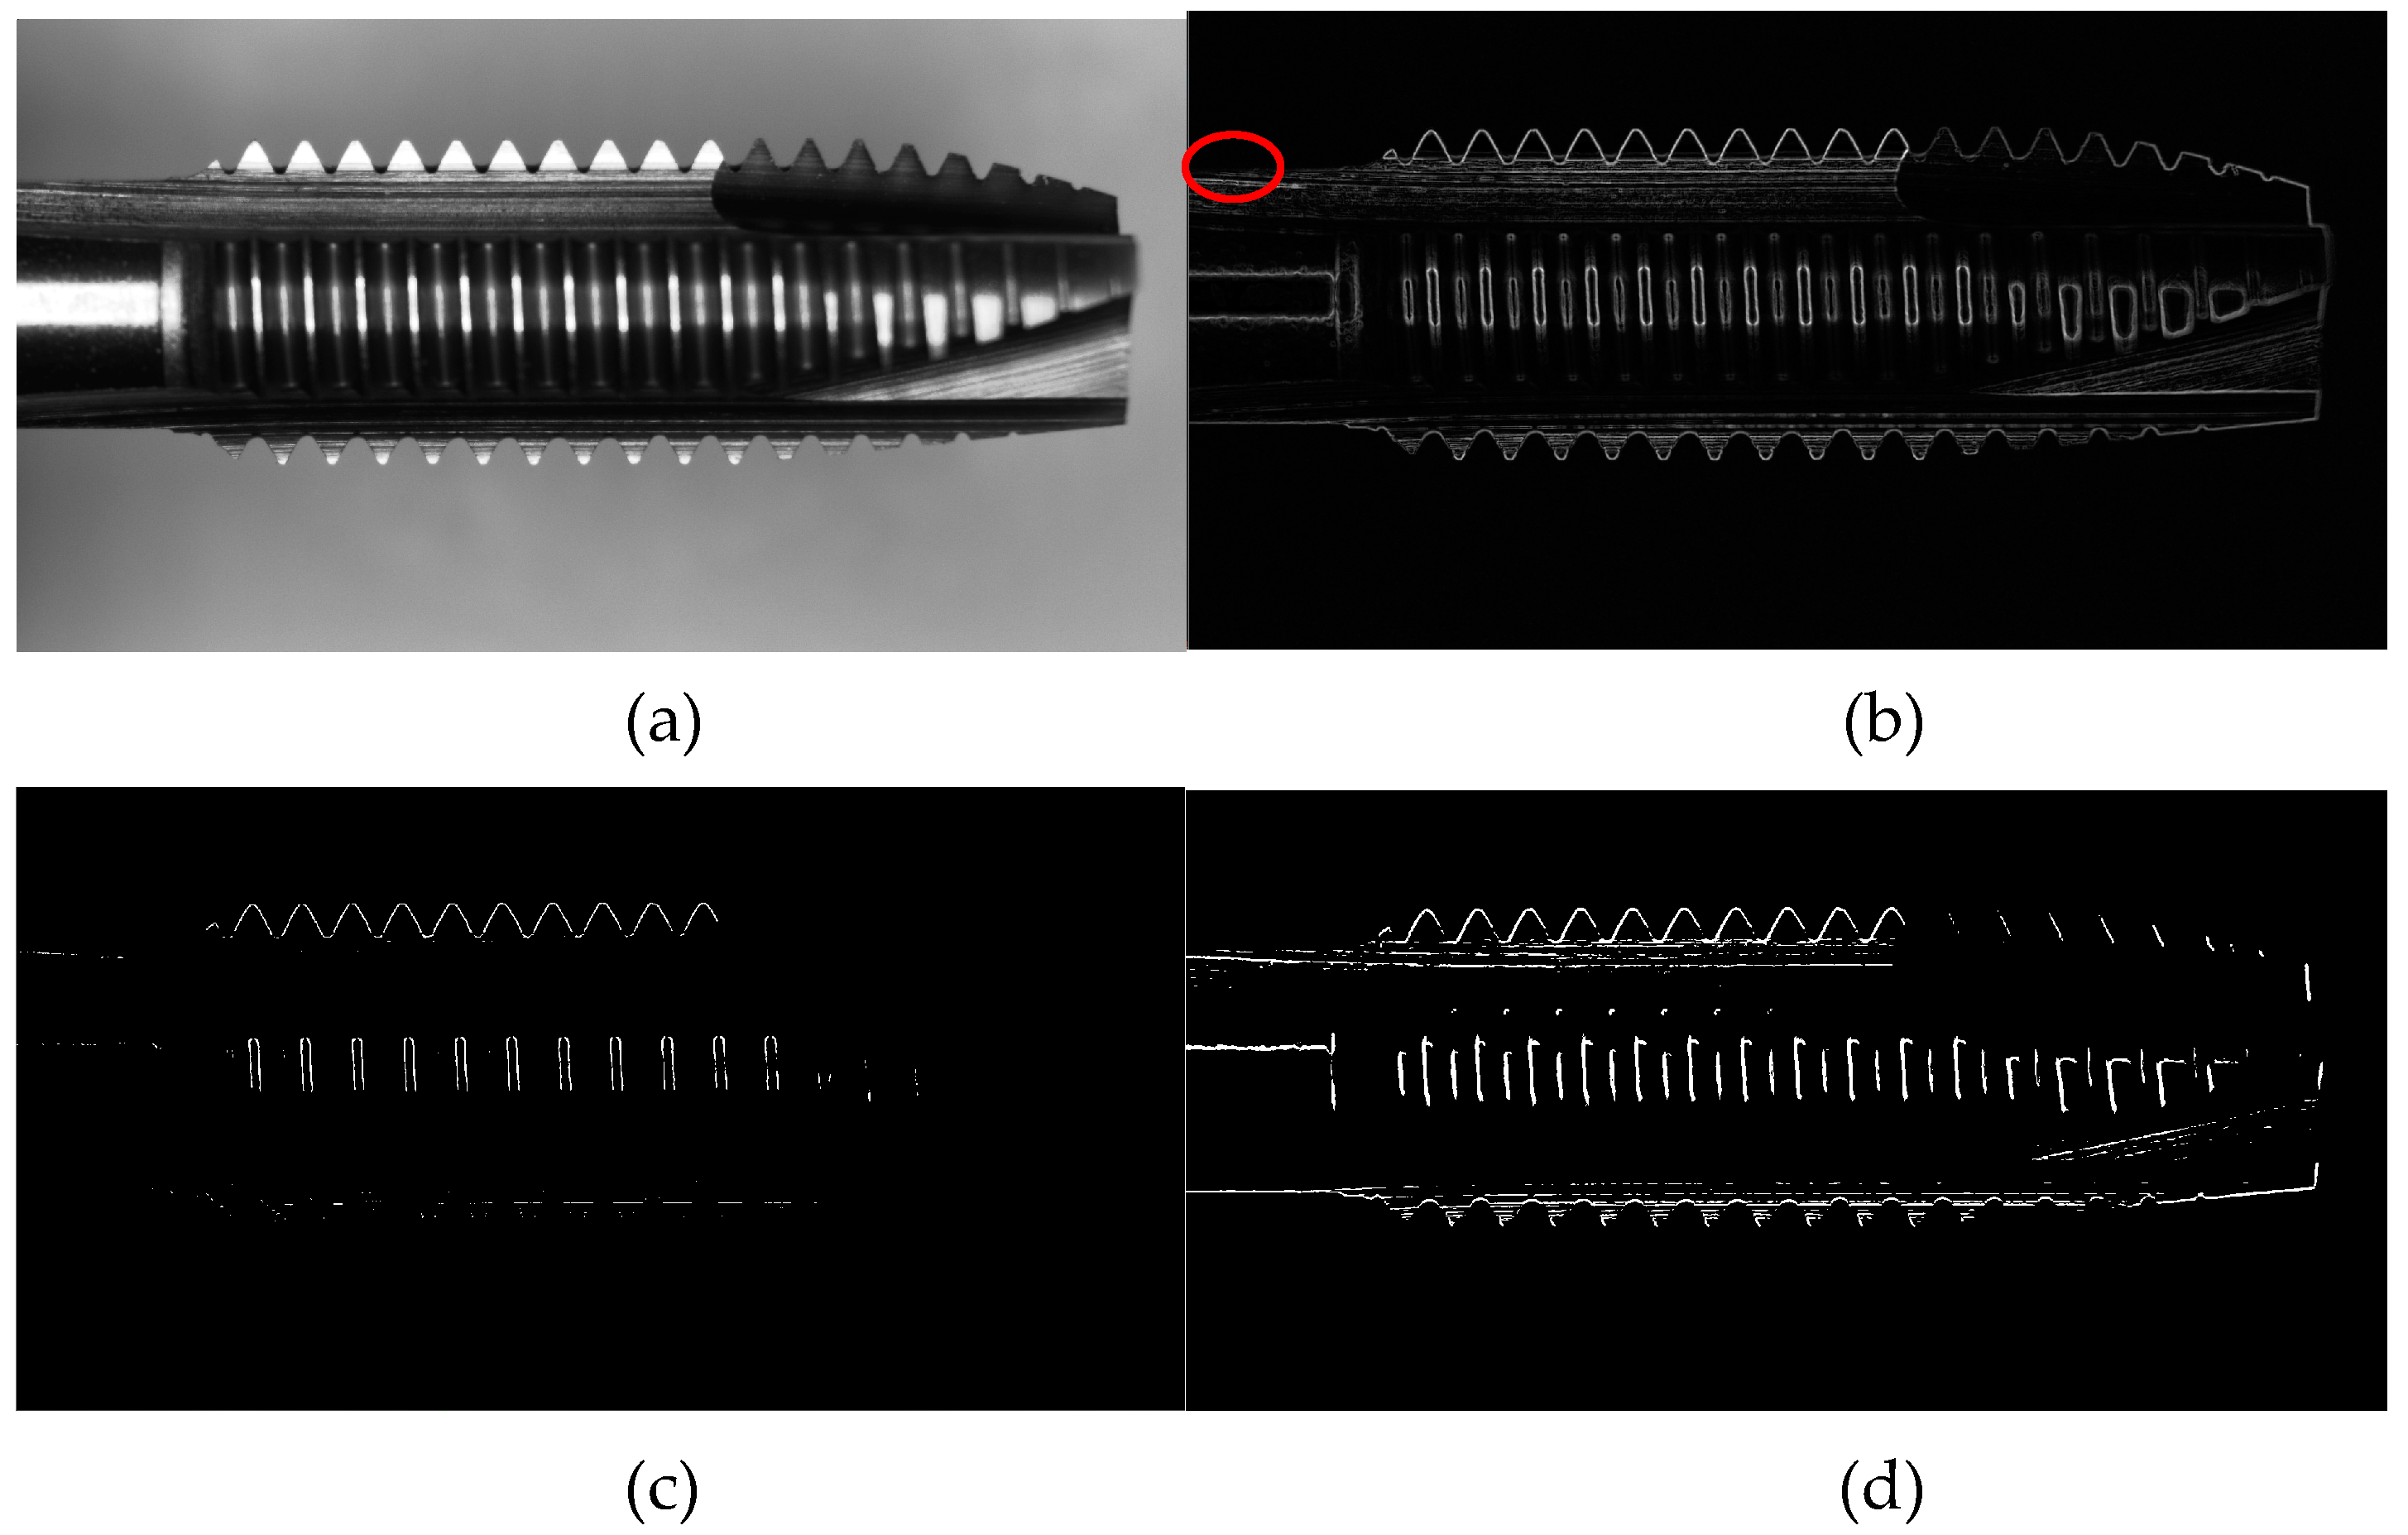
Figure 13, we can observe the results of different edge detection methods. In
Figure 13.b, the Sobel operator failed to distinguish the handle from the background due to their similar intensities. In
Figure 13.c, the Roberts operator is not suitable for toothpick detection as it could not accurately detect the edges in the handle region and some peaks. In
Figure 13.d, the Prewitt operator performs better than Roberts, but there were still areas in the handle and toothpick regions that cannot be detected. In
Figure 13.e, the Dual Parity Morphological Gradients method still had missing regions in the handle area.
Figure 13.f shows that the Canny operator, with its modified settings, could accurately detect the straight handle line L4.
In
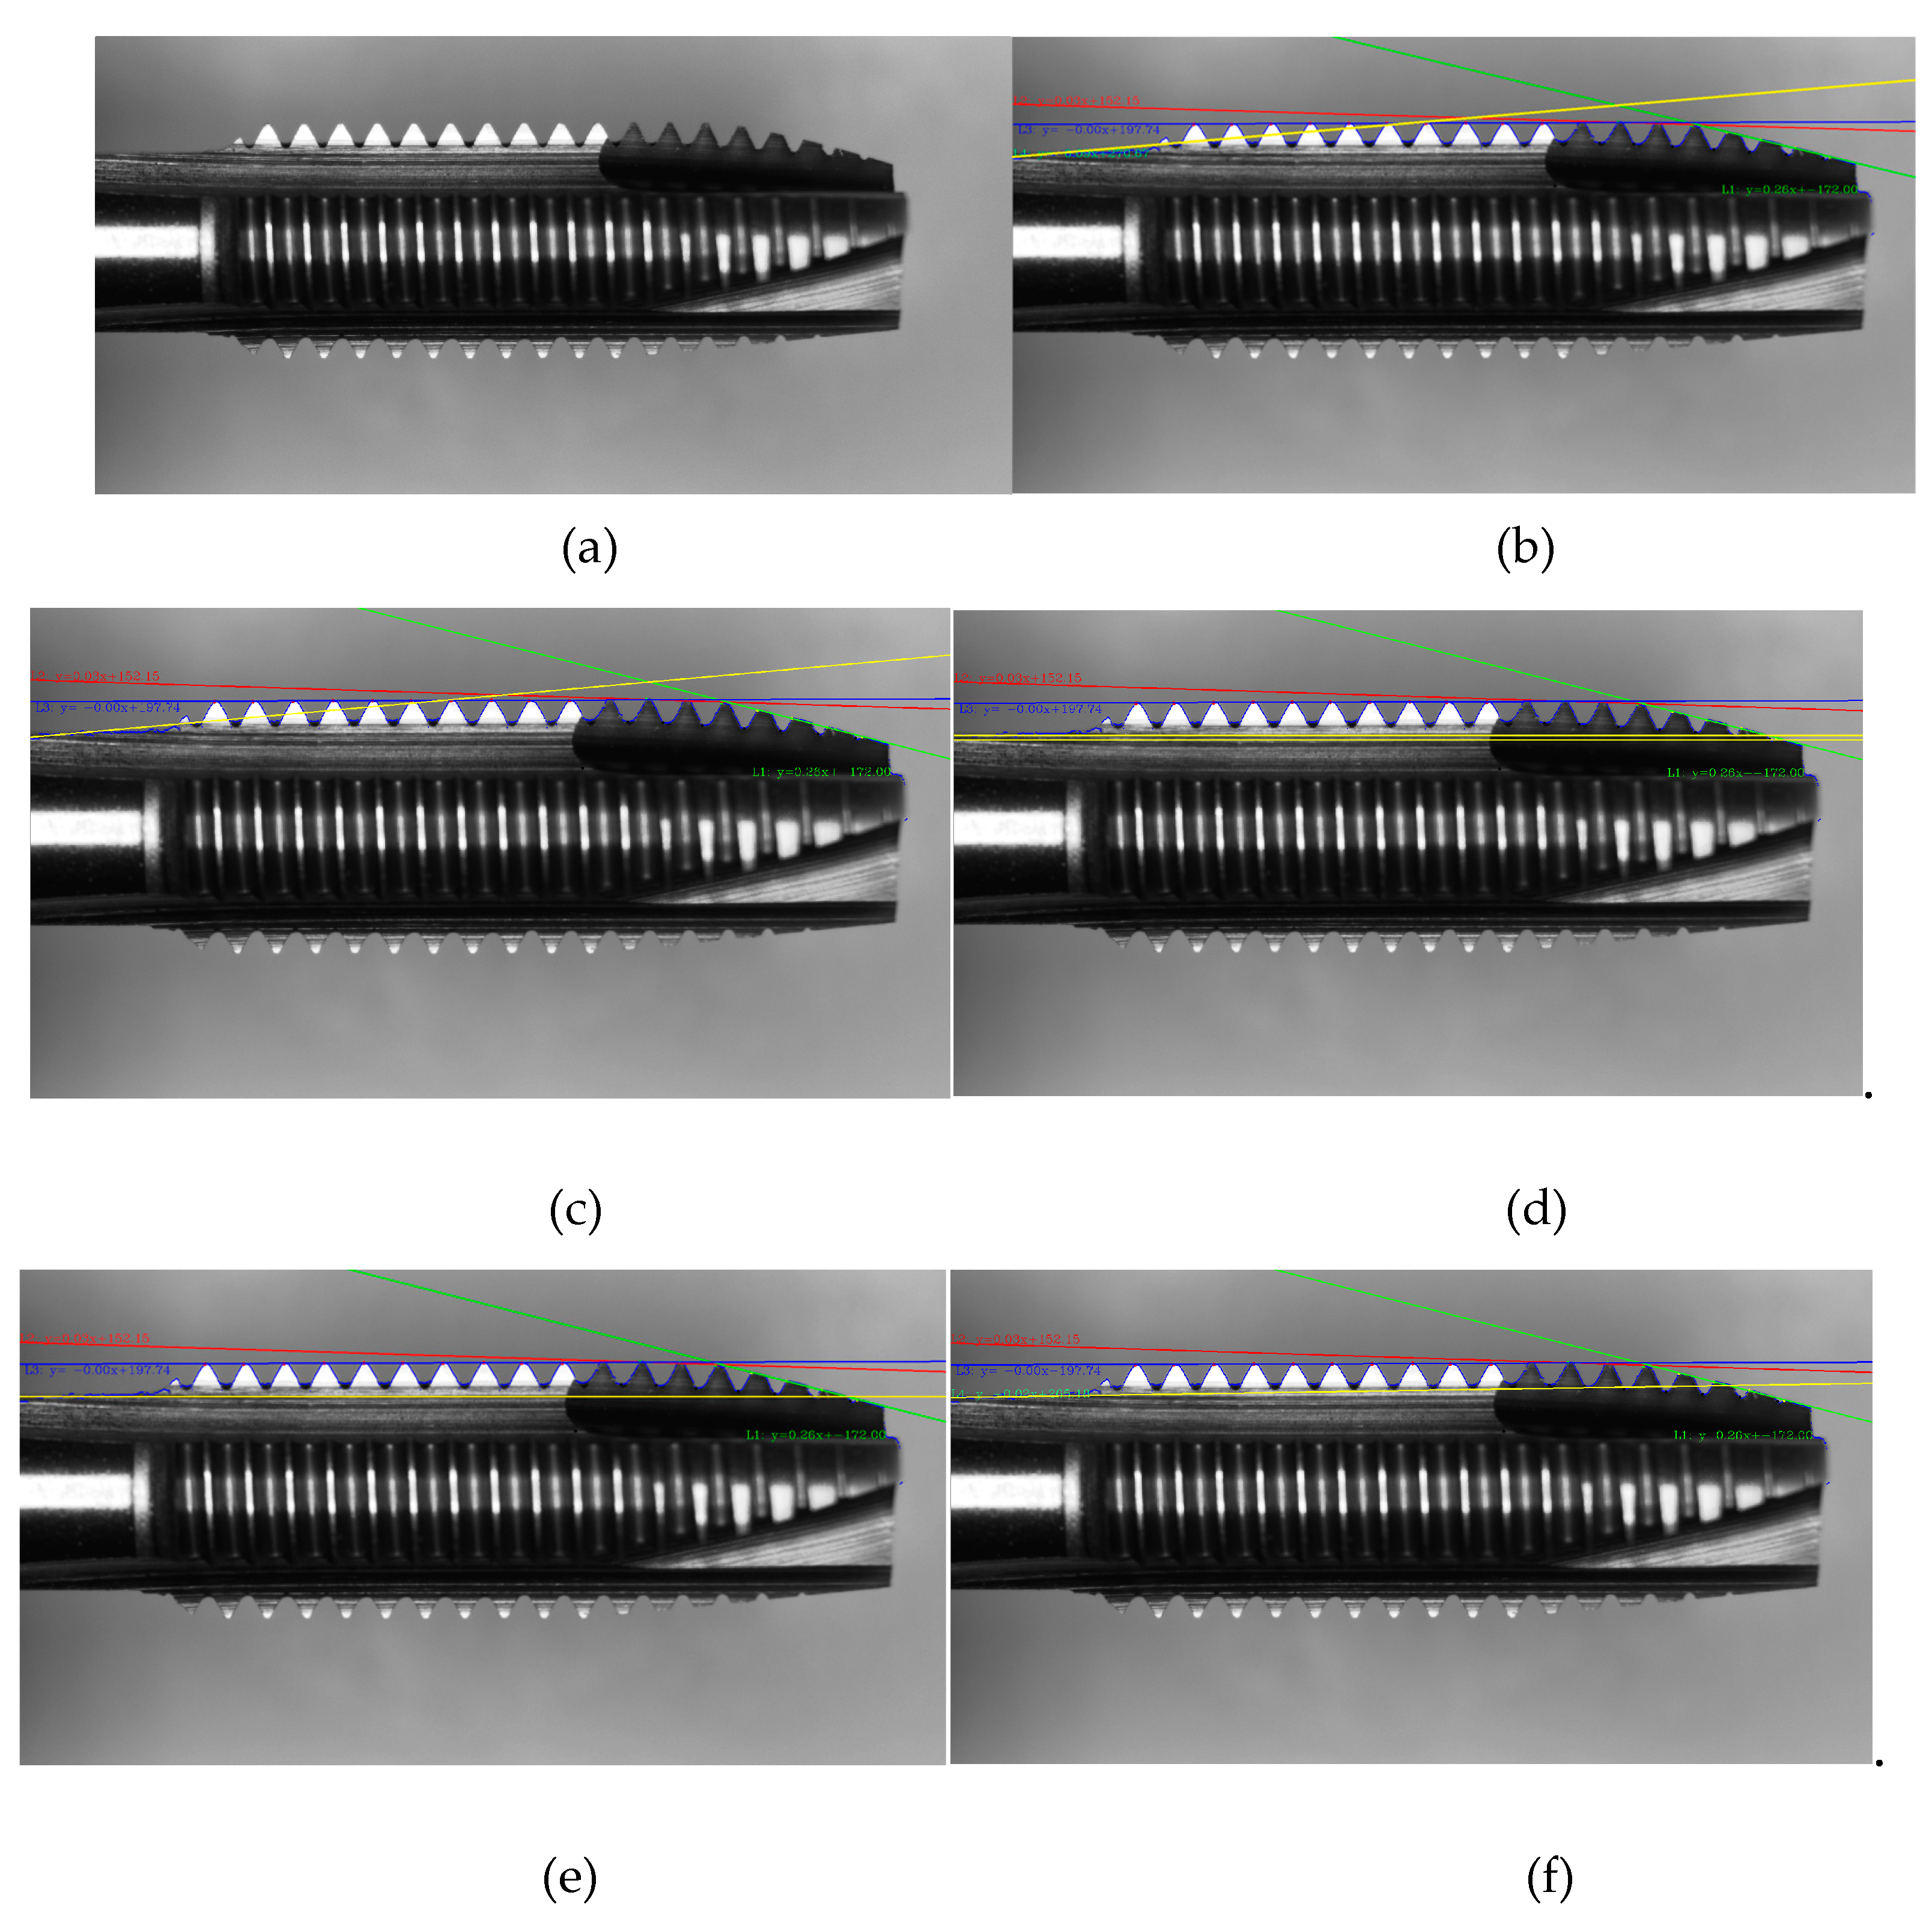
Figure 14, different methods were used to fit a straight line to the blurry image of a knife handle.
Figure 14.a shows the original image.
Figure 14.b represents the Least Squares method, but it can be observed that the original Least Squares method does not handle the edges with colors close to the background well.
Figure 14.c shows the Total Least Squares method, which also fails to address the issue. In
Figure 14.d, the Hough line method is used, but failed to both recognize a single straight line and identify additional erroneous lines. Changing the parameters only results in either the inability to recognize the line or detecting two lines instead of one.
Figure 14.e depicts the Ransac method, which can handle cases where the knife handle's color is close to the background. Lastly,
Figure 14.f presents the improved Least Squares method with a modified input, resulting in a fitted straight line that closely aligns with the knife handle's edge.
Table 4,
Table 5 and
Table 6 presents the geometric inspection results for the tapping tools after 60 tapping compared to the brand-new tools. The table is divided into measurements for the helix angle, tooth peak height, and tooth peak area. The tooth peak height was found to decrease compared to the brand-new tapping tools, indicating wear. The tooth peak area also decreased due to wear, and the amount of material that needed to be removed increased as the tool became dull.
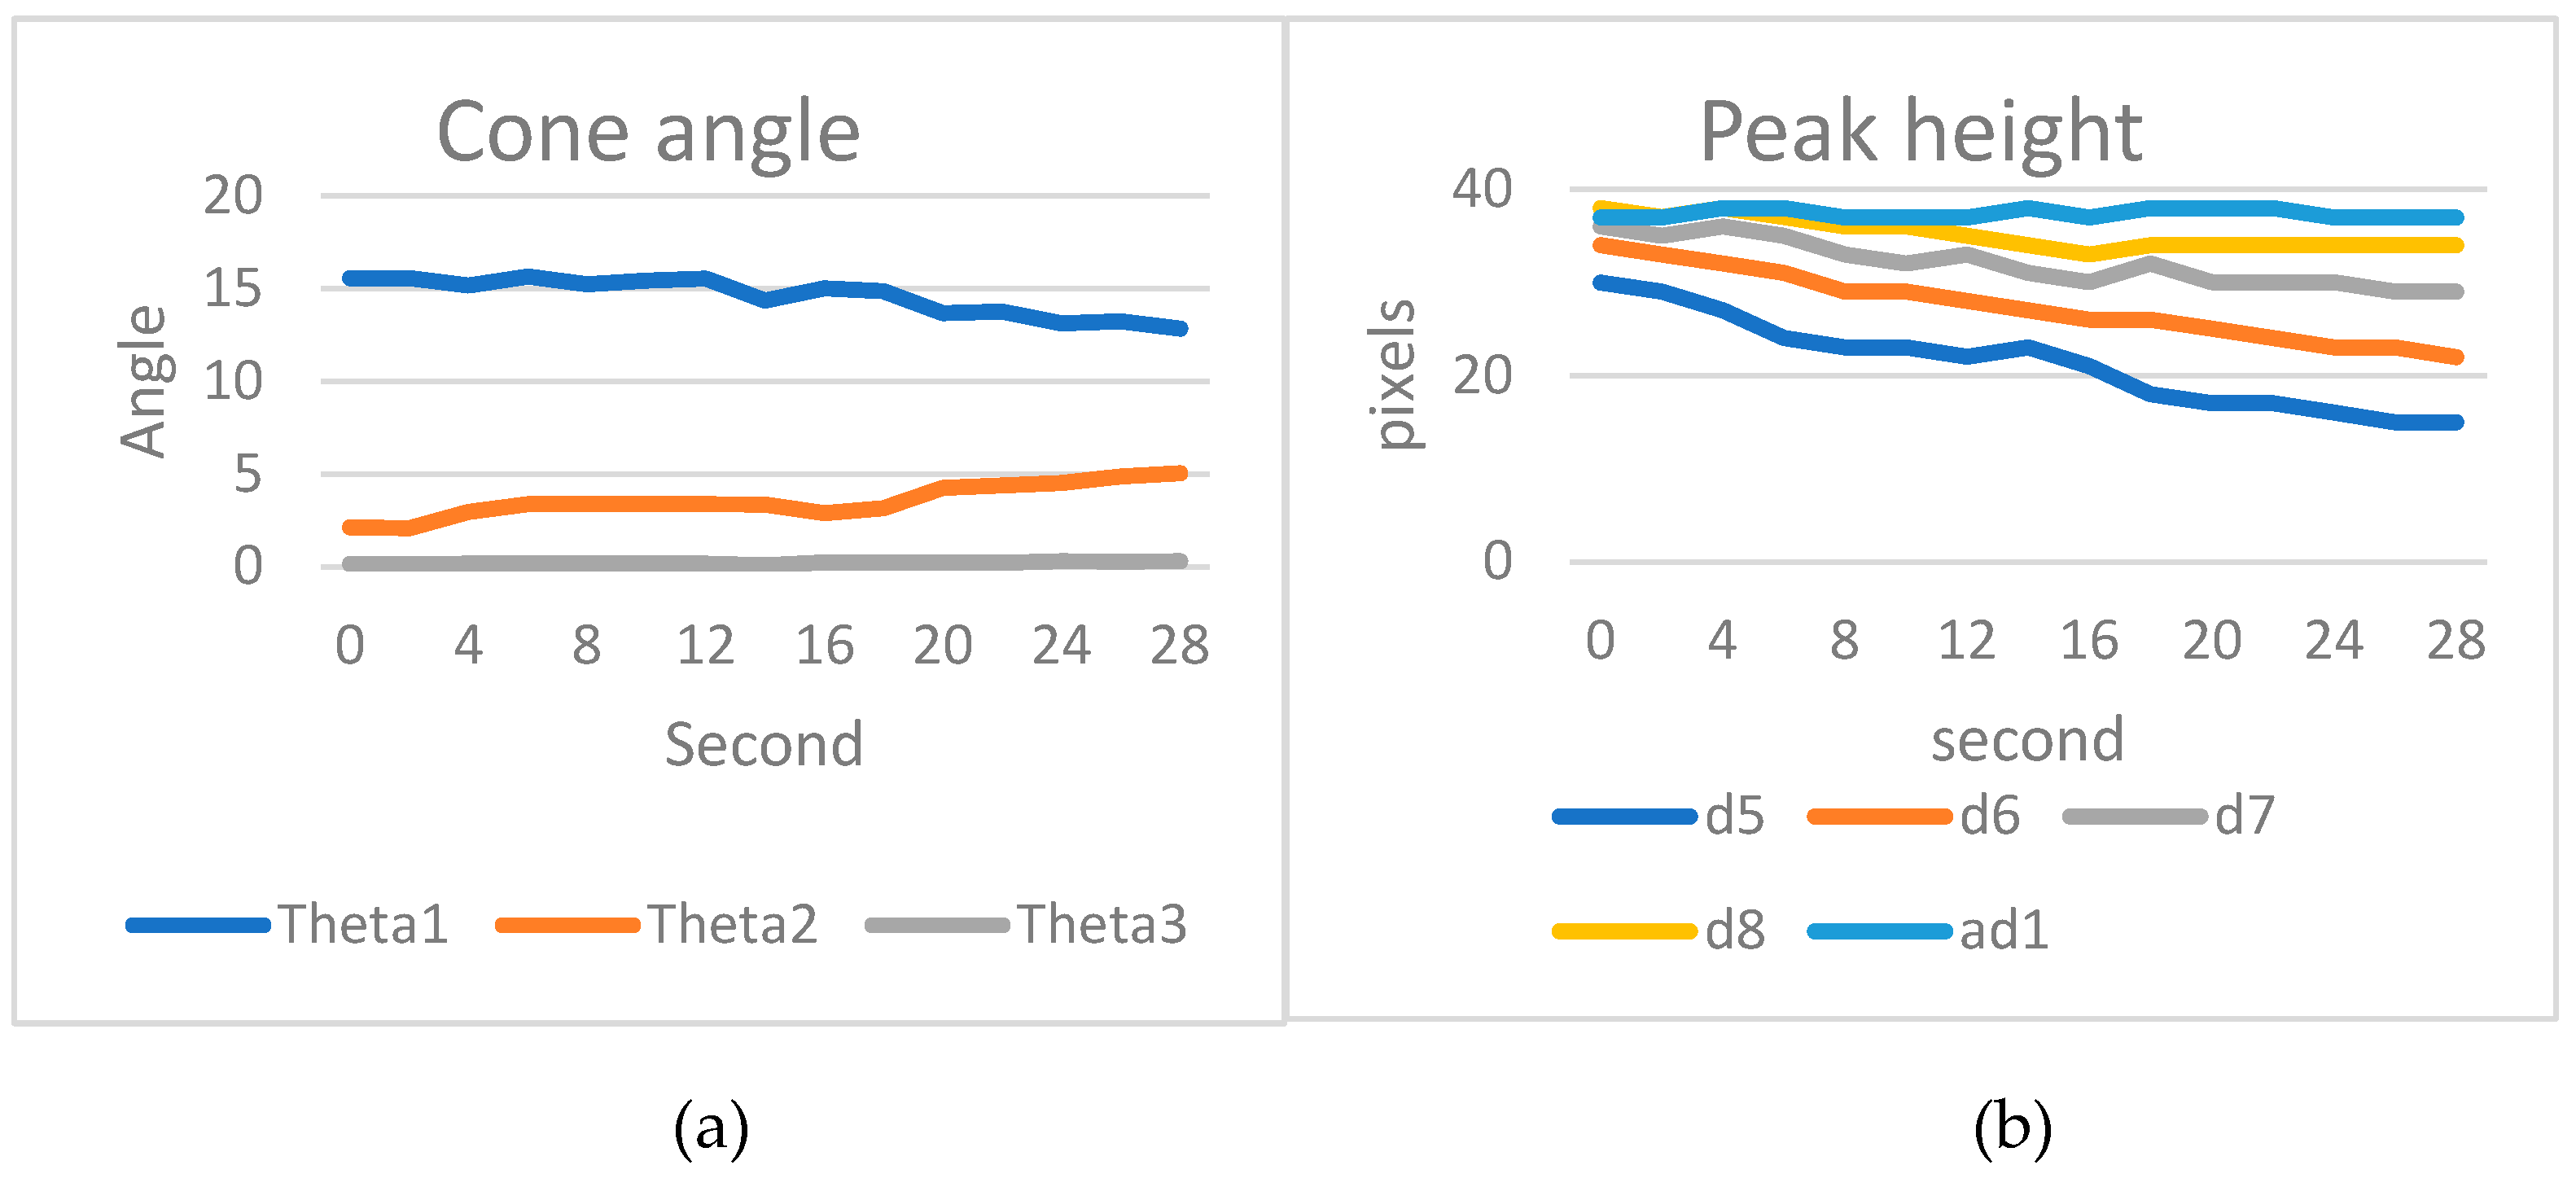
Based on the simulated wear detection results for stainless steel 6912, according to actual measurements, peak 3 and peak 4 exhibit wear, while the first two teeth did not come into contact with the inner wall of the nut. The cone angle
decreased due to the wear of peak 3 and peak 4. The distances d5 to d7 gradually became shorter over time, while d8 slightly decreased and then stabilized in condition. The average distance ad1 in the overall tooth section remained unchanged, with an average value ranging from 37 to 38 pixels
Figure 15.
The tooth peak areas from peak 5 to peak 8 decreased gradually due to wear, leading to an increase in the thread removal amount. However, the removal amount for rq8, tabilized after an initial increase.
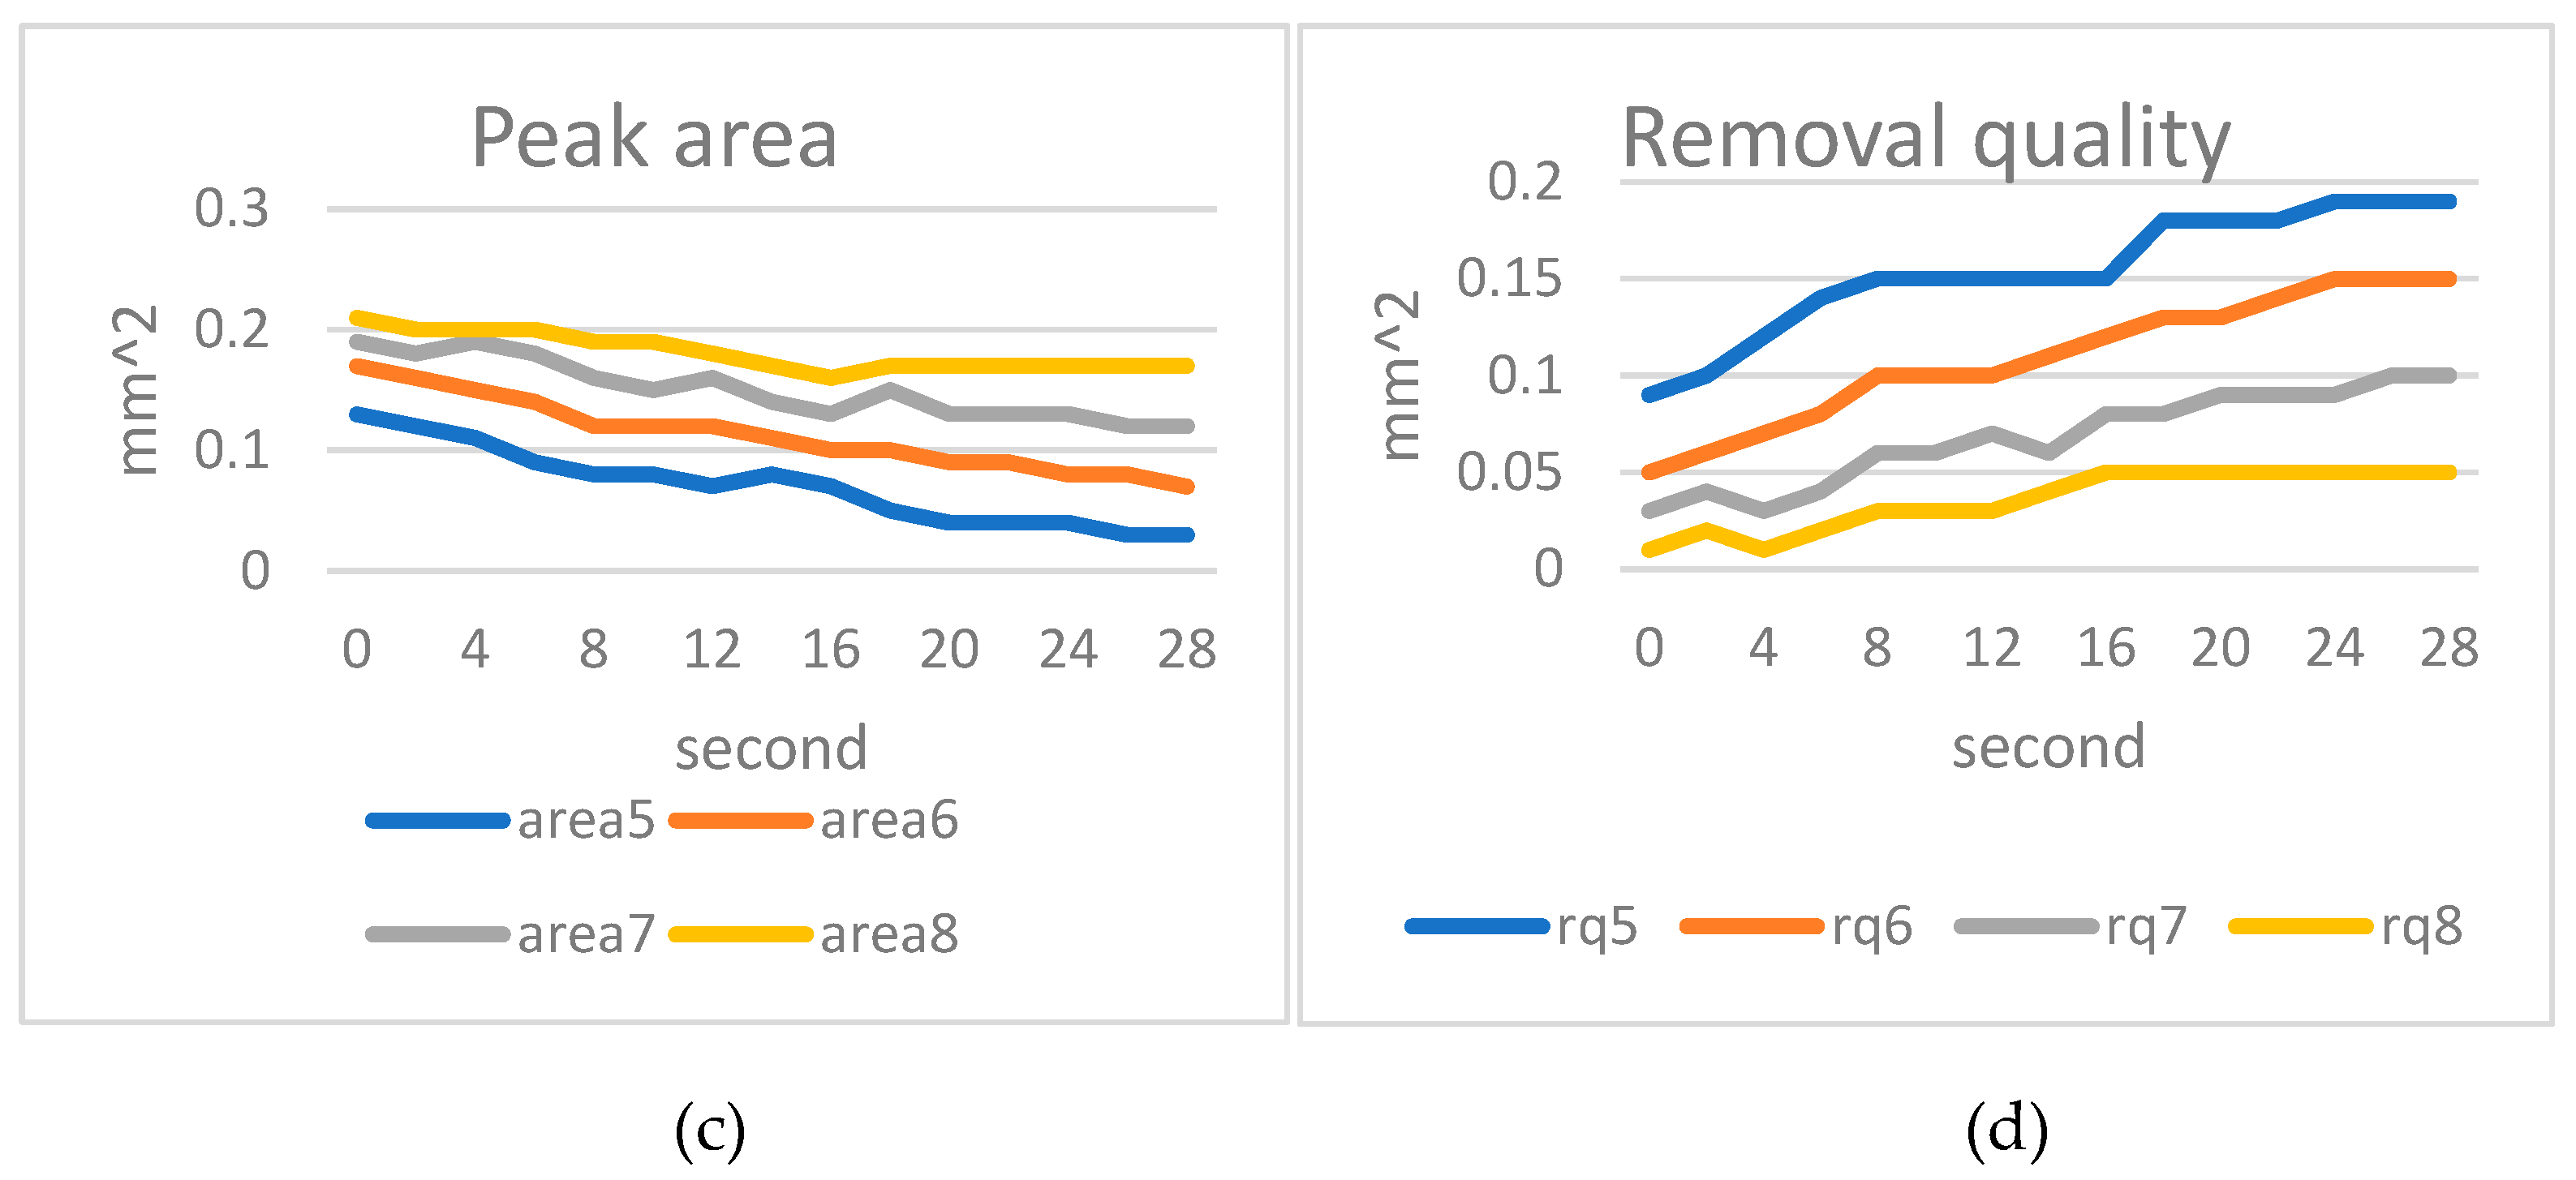
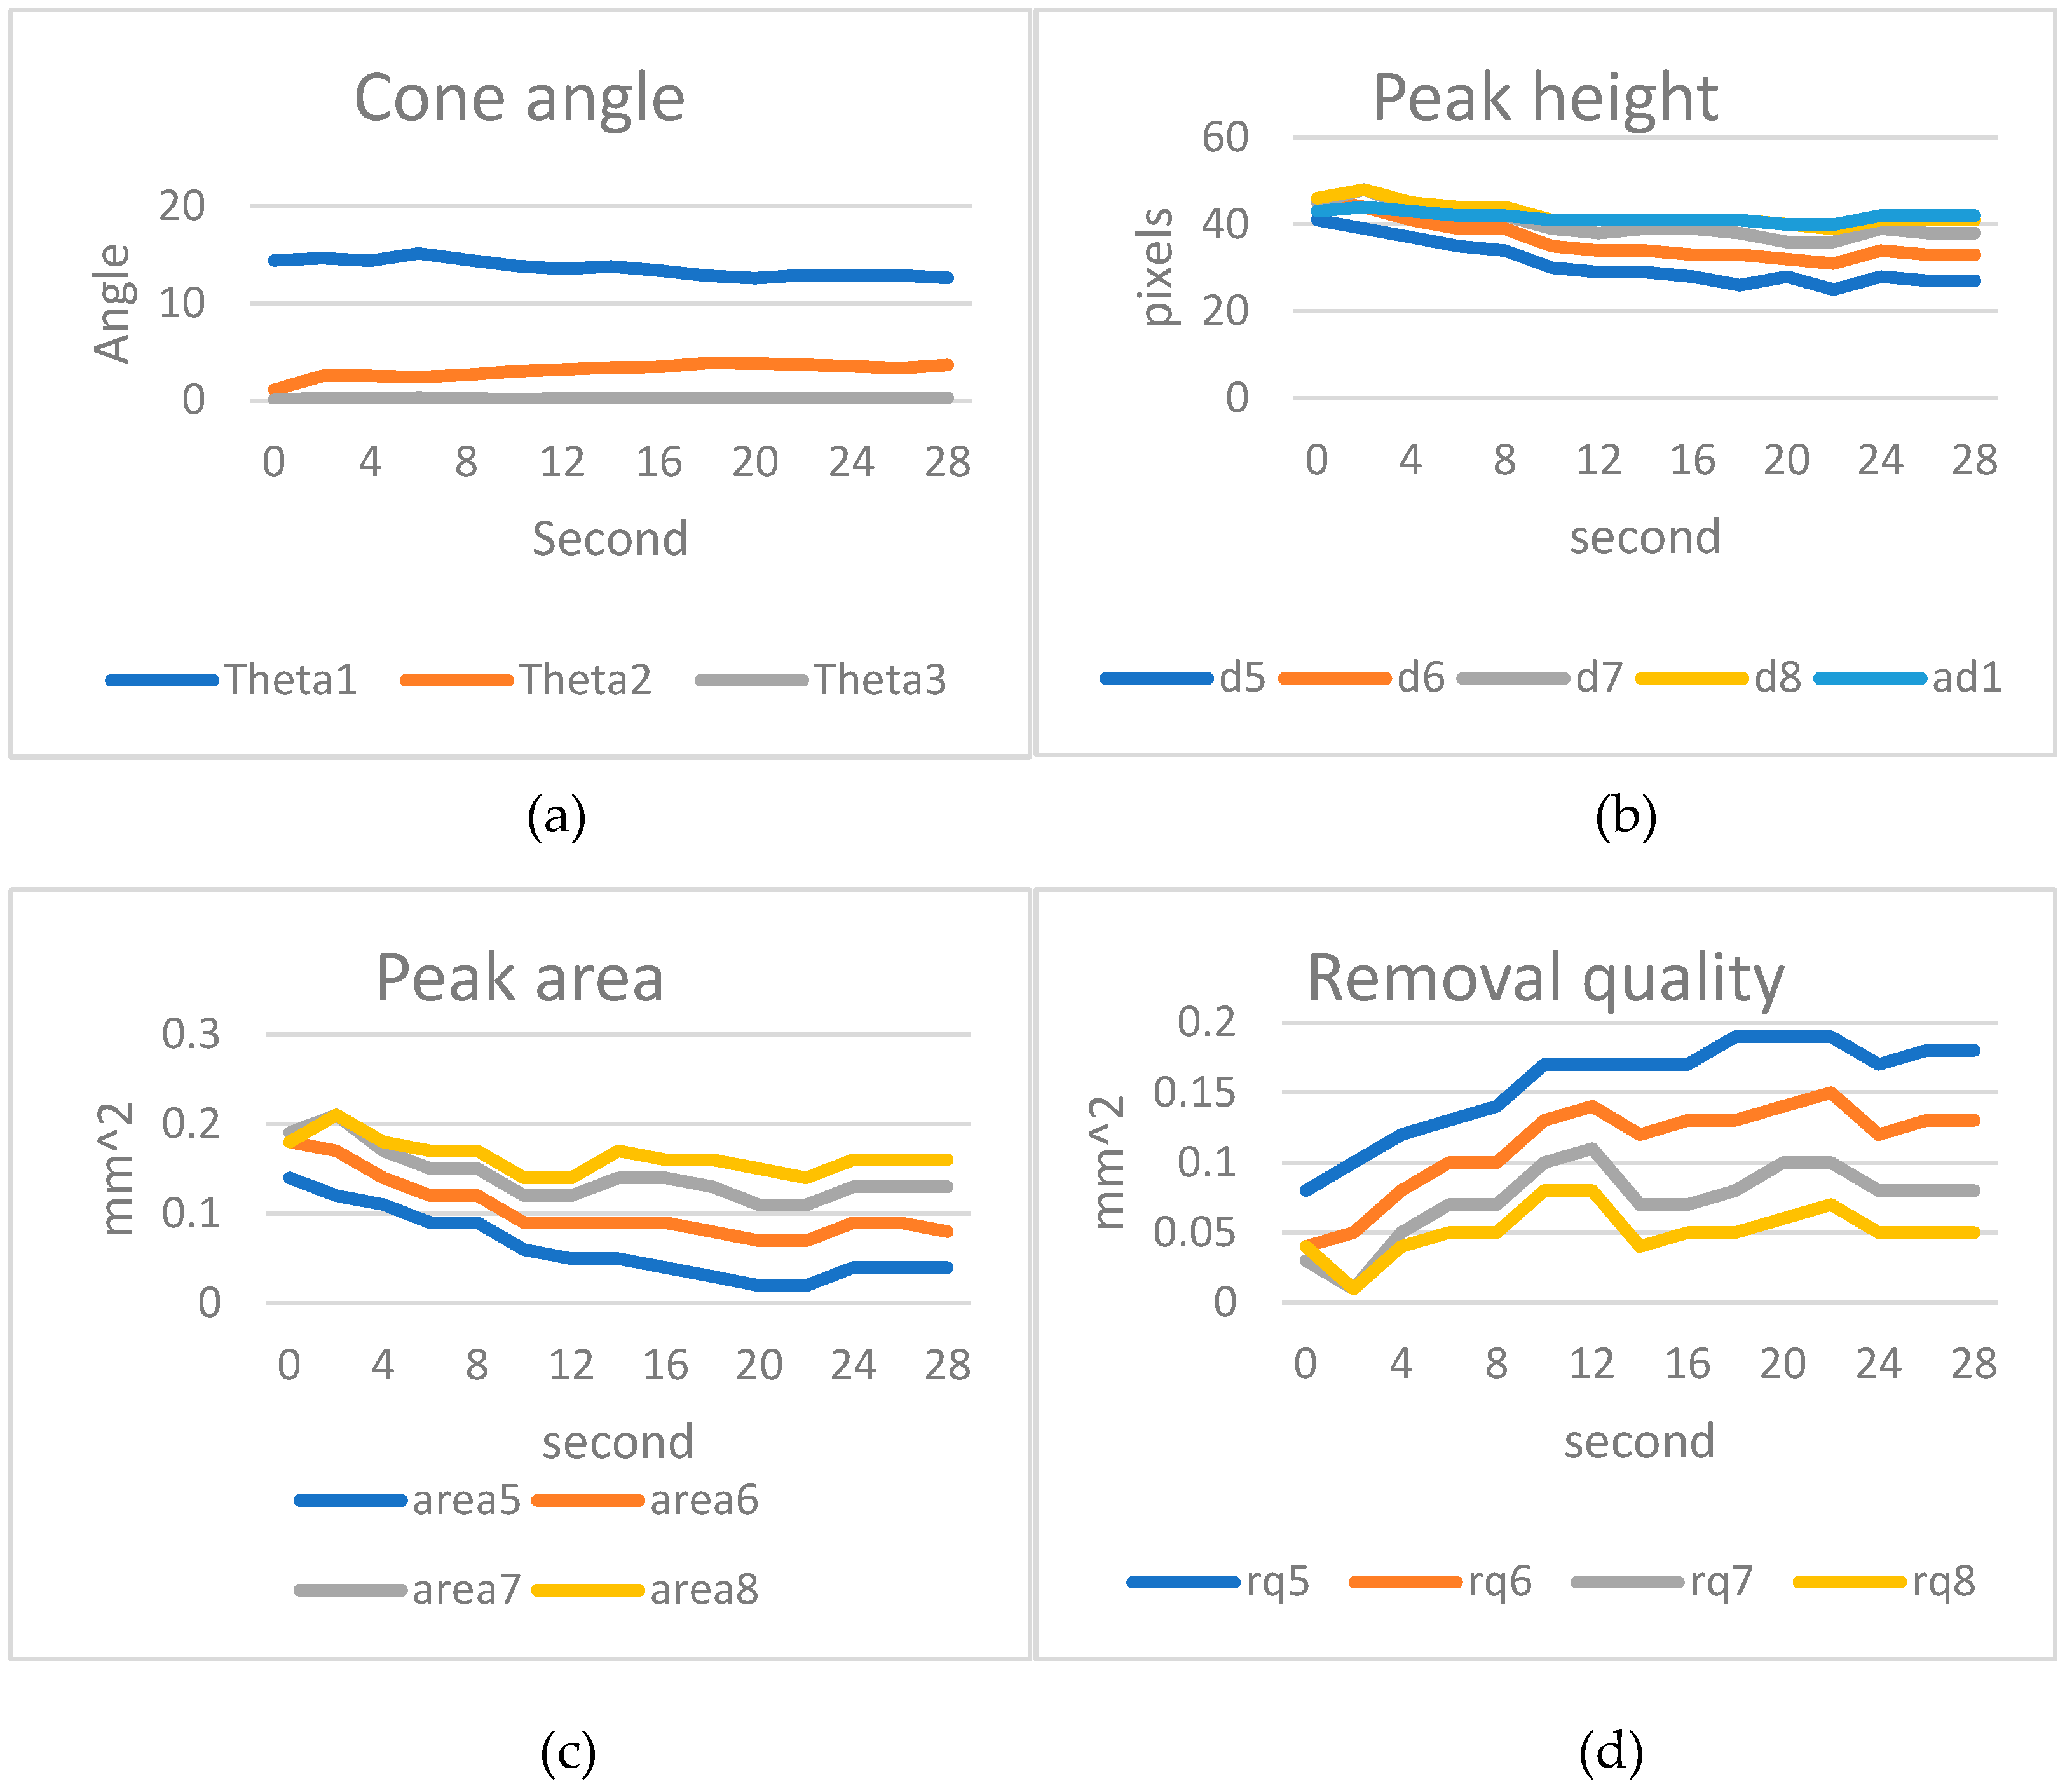
The trend of helix angle change in titanium alloy 7912p is similar to 6912. The lead angle
gradually decreased due to the wear of peak 4. The cutting angle
, like in 6912, increased with wear because the front tooth peaks (peak 5 to peak 8) experience more wear compared to the rear tooth peaks. This is because the front tooth peaks made initial contact with the nut's inner wall, resulting in more significant wear. The overall tooth angle
remains stable without variation. The average tooth peak height in the entire tooth section (ad1) also remained unchanged. However, the tooth peak heights d5 to d8 experienced wear over time. The tooth peak area also underwent wear and deformation over time. The thread removal amount from the nut was influenced by both wear and deformation and after an initial increase, the amount stabilized
Figure 16.
5. Conclusions
This study aims to produce Grade A precision nuts with tapping tools. To achieve this, it is important to determine the time when several nut-tapping operations started to produce a significant number of non-precision Grade A nuts. The proposed inspection system aims to be installed on the machine, ensuring fast and accurate detection. The system has several advantages: firstly, it eliminates the need for additional inspection equipment. Secondly, it directly integrates the camera into the production line. Thirdly, it offers three predefined inspection environments to accommodate different installation conditions: using a ring light with a background plate, using a ring light without a background plate, or using only a backlight panel. Lastly, the system provides an early indication to replace worn tapping tools when they can no longer produce Grade A nuts.
The proposed method focuses on the detection of worn tapping tools. The inspection is categorized into front-face and side-face measurements. The front-face inspection involves implementing Hough circle detection to verify the placement of the tapping tool, measuring the cutting angle based on geometric variations, and assessing the presence of backlash angle to extend tool life. The side-face inspection identifies tooth peaks and employs the least squares method to measure the lead angle of the guide section, cutting section, and overall tooth section. To address the issue of the handle having a similar color to the background, we introduce weighted input coordinates to obtain a more accurate fitting of the handle's straight line. The tooth peak heights and tapping tool length are measured based on the centerline. The changes in tooth peak area and thread removal should be also calculated.
In the future, the utilization of deep learning in conjunction with camera replacement has potential to significantly enhance detection accuracy. Deep learning can be employed to incorporate edge detection, circle detection and line detection. Research into these methods can provide insights into their performance improvement relative to conventional approaches.
Acknowledgments
This research is funded by the Ministry of Science and (MOST), Taiwan, R.O.C., grant NSTC 112-2425-H-006-001.
References
- Junfeng Jing.; Shenjuan Liu.; Gang Wang.; Weichuan Zhang.; Changming Sun. Recent advances on image edge detection: A comprehensive review. Neurocomputing. 2022, 53, 259–271. [CrossRef]
- Nazish Tariq.; Rostam Affendi Hamzah.; Theam Foo Ng.; Shir Li Wang.; Haidi Ibrahum. Quality Assessment Methods to Evaluate the Performance of Edge Detection Algorithms for Digital Image: A Systematic Literature Review. IEEE Access. 2021, 9, 87763–87776. [CrossRef]
- Sri Rahmawati.; Retno Devita.; Ruri Hartika Zain.; Eva Rianti.; Najla Lubis.; Anjar Wanto. Prewitt and Canny Methods on Inversion Image Edge Detection: An Evaluation. VICEST. 2020, 1933, 012039. [CrossRef]
- G.T. Shrivakshan.; C. Chandrasekar. A Comparison of various Edge Detection Techniques used in Image Processing. IJCSI. 2012, 9, 5, 1.
- Raman Maini.; Himanshu Aggarwal. Study and Comparison of Various Image Edge Detection Techniques. IJABE. 2011, 4, 2, 83.
- Akshi Kumar.; Sahil Raheja. Edge Detection using Guided Image Filtering and Enhanced Ant Colony Optimization. ICITETM. 2020, 173, 8–17. [CrossRef]
- Deepak Dhillon.; Rajlaxmi Chouhan. Enhanced Edge Detection Using SR-Guided Threshold Maneuvering and Window Mapping: Handling Broken Edges and Noisy Structures in Canny Edges. IEEE Access. 2021, 10, 11191–11205. [CrossRef]
- Xiao Zhang.; Fuen Chen. Lane Line Edge Detection Based on Improved Adaptive Canny Algorithm. ESAET. 2020, 1549, 022131. [CrossRef]
- Run Tian.; Guiling Sun.; Xiaochao Liu.; Bowen Zheng. Sobel Edge Detection Based on Weighted Nuclear Norm Minimization Image Denoising. Electronics. 2021, 10, 6, 655. [CrossRef]
- Jungang Yin.; Yipeng Lu.; Zhengxiong Gong.; Yuechun Jiang.; Jiangang Yao. Edge Detection of High-Voltage Porcelain Insulators in Infrared Image Using Dual Parity Morphological Gradients. IEEE Access. 2019, 7, 32728–32734. [CrossRef]
- Takeshi R.Fujimoto.; TaroKawasaki.; KeiichiKitamura. Canny-Edge-Detection/Rankine-Hugoniot-conditions unified shock sensor for inviscid and viscous flows. JCP. 2019, 369, 264–279. [CrossRef]
- Vasilis Paravolidakis.; Lemonia Ragia.; Konstantia Moirogiorgou.; Michalis E. Zervakis. Automatic Coastline Extraction Using Edge Detection and Optimization Procedures. Geosciences. 2018, 8, 11, 407. [CrossRef]
- Mamta Mittal.; Amit Verma.; Iqbaldeep Kaur.; Bhavneet Kaur.; Meenakshi Sharma.; Lalit Mohan Goyal.; Sudipta Roy.; Tai-Hoon Kim. An Efficient Edge Detection Approach to Provide Better Edge Connectivity for Image Analysis. IEEE Access. 2019, 7, 33240–33255. [CrossRef]
- Yuying Shi.; Zhimei Huo.; Jing Qin.; Yilin Li. Automatic prior shape selection for image edge detection with Modified Mumford–Shah model. CMA. 2020, 79, 1644–1660. [CrossRef]
- F. Orujov.; R. Maskelinas.; R. Damaševičius.; W. Wei. Fuzzy based image edge detection algorithm for blood vessel detection in retinal images. ASCJ. 2020, 94, 106452. [CrossRef]
- Haihang Han.; Hanyu Deng.; Qiao Dong.; Xingyu Gu.; Tianjie Zhang.; Yangyang Wang. An Advanced Otsu Method Integrated with Edge Detection and Decision Tree for Crack Detection in Highway Transportation Infrastructure. Progress in Road Materials and Structures. 2021, 9205509. [CrossRef]
- Jianzhong He.; Shiliang Zhang.; Ming Yang.; Yanhu Shan.; Tiejun Huang. Bi-Directional Cascade Network for Perceptual Edge Detection. CVPR. 2019, 3828–3837. [CrossRef]
- B. Wang.; L.L. Chen.; Z.Y. Zhang. A novel method on the edge detection of infrared image. Optik. 2019, 180, pp. 610–614. [CrossRef]
- Xavier Soria.; Edgar Riba.; Angel Sappa. Dense Extreme Inception Network: Towards a Robust CNN Model for Edge Detection. WACV. 2020, 1923–1932. [CrossRef]
- Zhang, H.; Wiklund, K.; Andersson, M. A Fast and Robust Circle Detection Method Using Isosceles Triangles Sampling. Pattern Recognition. 2016, 54, 218–228. [CrossRef]
- Yao, Z.; Yi, W. Curvature Aided Hough Transform for Circle Detection. Expert Syst. Appl. 2016, 51, 26–33. [CrossRef]
- Mingzhe Wang.; Weichuan Zhang.; Changming Sun.; Arcot Sowmya. Corner detection based on shearlet transform and multi-directional structure tensor. Pattern Recognition. 2020, 103, 107299. [CrossRef]
- Ignacio Alzugaray.; Margarita Chli. Asynchronous Corner Detection and Tracking for Event Cameras in Real Time. IRAL. 2018, 3, 4, 3177–3184. [CrossRef]
- Mingzhe Wang.; Changming Sun.; Arcot Sowmya. Efficient corner detection based on corner enhancement filters. Digital Signal Processing. 2022, 122, 103364. [CrossRef]
- Yue Pan.; Pengchuan Xiao.; Yujie He.; Zhenlei Shao.; Zesong Li. MULLS: Versatile LiDAR SLAM via Multi-metric Linear Least Square. ICRA. 2021, 9561364, 11633–11640. [CrossRef]
- Mu, Z.; Li, Z. A Novel Shi-Tomasi Corner Detection Algorithm Based on Progressive Probabilistic Hough Transform. Chin. Autom. Congr. 2018, 2918-2922. [CrossRef]
- Andrew Gelman.; Ben Goodrich.; Jonah Gabry.; Aki Vehtari. R-squared for Bayesian Regression Models. The American Statistician. 2019, 73, 3, 307–309. [CrossRef]
- Ivan Markovsky.; Sabine Van Huffel. Overview of total least-squares methods. Signal Processing. 2007, 87, 10, 2283–2302. [CrossRef]
- Yue Pan.; Pengchuan Xiao.; Yujie He.; Zhenlei Shao.; Zesong Li. MULLS: Versatile LiDAR SLAM via Multi-metric Linear Least Square. ICRA. Xi'an, China, 31 May - 4 June 2021; 11633–11640. [CrossRef]
- Wouter Van Gansbeke.; Bert De Brabandere.; Davy Neven.; Marc Proesmans.; Luc Van Gool. End-to-end Lane Detection through Differentiable Least-Squares Fitting. ICCVW, 2019, 905–913. [CrossRef]
Figure 1.
Tap sureface detection target; a) Tap placement inspection; b) Tap cutting angle and clearance angle requirements.
Figure 1.
Tap sureface detection target; a) Tap placement inspection; b) Tap cutting angle and clearance angle requirements.
Figure 2.
Tap side detection target; a) Illustrations of the guide cone angle、cutting cone angle and flute cone angle; b) Illustrations of tooth peak height and tooth length.
Figure 2.
Tap side detection target; a) Illustrations of the guide cone angle、cutting cone angle and flute cone angle; b) Illustrations of tooth peak height and tooth length.
Figure 3.
Experimental environment for tap inspection; a) Frontal view; b) Side view.
Figure 3.
Experimental environment for tap inspection; a) Frontal view; b) Side view.
Figure 4.
Three types of shooting environments for tapping machine inspection are as follows: a) Using ring light with a background panel; b) Using only a backlight panel; c) Using only a ring light.
Figure 4.
Three types of shooting environments for tapping machine inspection are as follows: a) Using ring light with a background panel; b) Using only a backlight panel; c) Using only a ring light.
Figure 5.
Flowchart of Tap Inspection; a) Tap placement inspection; b) Frontal inspection; c) Side inspection.
Figure 5.
Flowchart of Tap Inspection; a) Tap placement inspection; b) Frontal inspection; c) Side inspection.
Figure 6.
Inspection of tapping machine placement.
Figure 6.
Inspection of tapping machine placement.
Figure 7.
Identifying obtuse angles and acute angles; a) Binary image; b) Edge detection; c) Preserve areas of interest; d) Candidate points of acute and obtuse angles; e) Identify the target points of acute and obtuse angles.
Figure 7.
Identifying obtuse angles and acute angles; a) Binary image; b) Edge detection; c) Preserve areas of interest; d) Candidate points of acute and obtuse angles; e) Identify the target points of acute and obtuse angles.
Figure 8.
Tap cutting angle measurement results on the surface.
Figure 8.
Tap cutting angle measurement results on the surface.
Figure 9.
Blurriness issue with the tool handle.
Figure 9.
Blurriness issue with the tool handle.
Figure 10.
Side inspection results of the tap; a) Detection of the guiding section angle、 cutting section angle and form section angle; b) Tooth peak height inspection.
Figure 10.
Side inspection results of the tap; a) Detection of the guiding section angle、 cutting section angle and form section angle; b) Tooth peak height inspection.
Figure 11.
Area measurement of the tooth edge.
Figure 11.
Area measurement of the tooth edge.
Figure 12.
Two different materials of tapping tools: a) Stainless steel; b) Titanium alloy.
Figure 12.
Two different materials of tapping tools: a) Stainless steel; b) Titanium alloy.
Figure 13.
Results of different edge detection methods for tap detection: a) Original image; b) Sobel; c) Roberts; d) Prewitt; e) Dual parity morphological gradients; f) Canny.
Figure 13.
Results of different edge detection methods for tap detection: a) Original image; b) Sobel; c) Roberts; d) Prewitt; e) Dual parity morphological gradients; f) Canny.
Figure 14.
Fitting straight lines to blurry images of a knife handle using different methods. a) Original; b) Least squares; c) Total least squares; d) Hough line; e) Ransac; f) The modified input least squares.
Figure 14.
Fitting straight lines to blurry images of a knife handle using different methods. a) Original; b) Least squares; c) Total least squares; d) Hough line; e) Ransac; f) The modified input least squares.
Figure 15.
Results of artificial wear on stainless steel 6912: a) Cone angle; b) Tooth peak height; c) Tooth peak area; d) Amount of thread removal from the nut.
Figure 15.
Results of artificial wear on stainless steel 6912: a) Cone angle; b) Tooth peak height; c) Tooth peak area; d) Amount of thread removal from the nut.
Figure 16.
Results of artificial wear on titanium 7912p: a) Cone angle; b) Tooth peak height; c) Tooth peak area; d) Amount of thread removal from the nut.
Figure 16.
Results of artificial wear on titanium 7912p: a) Cone angle; b) Tooth peak height; c) Tooth peak area; d) Amount of thread removal from the nut.
Table 1.
Official tap standards.
Table 1.
Official tap standards.
| Official tap standards |
|---|
| Pitch P |
1.25 mm |
| Guide section |
5 mm |
| Overall length |
70 mm |
| Length of thread engagement T1 |
2 mm
|
| Shank diameter |
6.2 mm |
Table 2.
Our tap standards.
Table 2.
Our tap standards.
| Our tap standards |
|---|
| Inside radius |
Edge image |
6.58 mm |
| Outside radius |
Edge image |
7.70mm |
| Cutting angle |
Lc&Cutting edge |
|
| Guide cone angle |
L1&L4 |
|
| Cutting cone angle |
L2&L4 |
|
| Flute cone angle |
L3&L4 |
|
| Peak height |
L5 |
0.63mm |
| Total length |
Peakv18&L5 |
24 mm |
| Cone length |
Peakv8&L5 |
11 mm |
| Peak area |
|
0.19 |
| Thread Removal Amount |
&
|
0.08 |
Table 4.
The Cone angle between brand-new tapping tools and those used for tapping 60 times.
Table 4.
The Cone angle between brand-new tapping tools and those used for tapping 60 times.
| |
|
|
|
| New |
14.40° |
1.11° |
0.04° |
| 60 times |
13.79° |
1.52° |
0.16° |
Table 5.
Tooth peak height comparison between brand new tapping tools and those used for tapping 60 times.
Table 5.
Tooth peak height comparison between brand new tapping tools and those used for tapping 60 times.
| |
d5 |
d6 |
d7 |
d8 |
ad1 |
| New |
41pixel |
46pixel |
45pixel |
46pixel |
43pixel |
| 60 times |
34pixel |
40pixel |
41pixel |
40pixel |
40pixel |
Table 6.
Tooth peak area and amount of thread removal comparison between brand new tapping tools and those used for tapping 60 times.
Table 6.
Tooth peak area and amount of thread removal comparison between brand new tapping tools and those used for tapping 60 times.
| |
area5 |
area6 |
area7 |
area8 |
rq5 |
rq6 |
rq7 |
rq8 |
| New |
0.14 |
0.18 |
0.19 |
0.18 |
0.04 |
0.03 |
0.04 |
0.08 |
| 60 times |
0.09 |
0.13 |
0.14 |
0.13 |
0.09 |
0.08 |
0.09 |
0.14 |
|
Disclaimer/Publisher’s Note: The statements, opinions and data contained in all publications are solely those of the individual author(s) and contributor(s) and not of MDPI and/or the editor(s). MDPI and/or the editor(s) disclaim responsibility for any injury to people or property resulting from any ideas, methods, instructions or products referred to in the content. |
© 2023 by the authors. Licensee MDPI, Basel, Switzerland. This article is an open access article distributed under the terms and conditions of the Creative Commons Attribution (CC BY) license (http://creativecommons.org/licenses/by/4.0/).
