Preprint
Article

Modeling of Spatial Data on Accuracy Values of Slum Area Distribution in Palembang City, Indonesia

Altmetrics

Downloads

161

Views

69

Comments

0

Submitted:

20 November 2023

Posted:

23 November 2023

You are already at the latest version

Alerts
Abstract
Urbanization triggers the emergence of slums in urban areas. Palembang is one of the Indonesian cities with slum settlements. This research aimed to analyze the interpolation of slum positions in Palembang and their distribution pattern using kernel density analysis and by modeling spatial data on accuracy values. It employed a quantitative method with a survey approach. Samples were selected using proportional random sampling from families in 64 slum areas across the 13 districts in the city, and their positions were recorded with a GPS device and then processed and mapped in ArcGIS. The data were analyzed with inverse distance weighted, kernel density, and spatial data modeling. Results showed that slum areas near the riverbanks had high population density, while those located further were lower. The values obtained from the kernel density analysis varied from 0 to 58.1123, while the inverse distance weighted showed a value range of 2.26745–380.991. The spatial data modelling analysis demonstrated that the distribution of slum areas was widely spread along the Musi River, with an accuracy value of 96.8%, which falls within the range of >0.9-1.
Keywords: 
Subject: Social Sciences  -   Urban Studies and Planning

1. Introduction

In developing countries, the presence of slum areas is a major challenge (Sukmaniar, Pitoyo et al., 2021) because it leads to a slower growth rate with poorly organized settlements [2]. Consequently, developing countries need to promptly address slum settlements as a means to expedite economic growth. According to [3], approximately one billion people worldwide are inhabitants of slum areas, and this poses a challenge to urbanization. The total population in slum settlements is projected to keep rising and expected to double by 2030 [4]. This situation calls for significant concern, as the realization of these projections would entail a burgeoning population within slum settlements, coupled with a rise in the number of individuals experiencing impoverished economic conditions. High population density, poor services, and housing are features of slum areas. However, improved conditions [5][5][5](Bird et al., 2017) with basic urban services and sanitation can be seen in some urban areas (Bird et al., 2017; Gulyani & Talukdar, 2008). This situation is emblematic of the settlements found in developing countries, where there are several slum areas. Some parts of these areas has been successfully improved in respect to their social, physical, and economic sectors. Dense settlements in slum areas often result in limited space for waterways and drainage channels [7]. As a result, the occurrence of floods tend to jeopardize the dwellings of those residing in such settlements. Assuming the situation deteriorates further, there is a heightened risk of these homes collapsing. This is prevalent in virtually all urban area in developing countries. Effective sanitation interventions can lead to longer life expectancy, reduced health costs, and the prevention of various diseases [8]. Good sanitation management also has a positive impact on the health of infants and children [9]. However, implementing sanitation and hygiene interventions is time-consuming, as they often require behavioral changes in addition to infrastructure improvements [10]. The process of achieving behavioral change takes time, specifically when it pertains to residents of slum settlements who have grown accustomed to neglecting cleanliness and health. Guiding them towards prioritizing these aspects demands a significant transformation. Building sanitation infrastructure also requires significant funding, which can be a limiting factor [11]. This highlights the need for the government to implement policies for enhancing sanitation. The emergence of conflicts and poor cooperation results in inadequate services, uneven infrastructure development [12], as well as a decline in order and law [13]. Conflicts tend to arise when there is lack of collaboration between the government and residents. Therefore, establishing strong collaboration becomes essential to maintain orderliness in infrastructural development. Urbanization continues due to the high migration of people to urban areas with increased economic activity (Sukmaniar, Kurniawan et al., 2020). This phenomenon is a result of the strong attraction that urban areas hold for migrants who aspire to enhance their social and economic conditions. These migrants hope their selected destination offers greater opportunities for them to achieve success. The high level of urbanization leads to a continuous rise in the development of urban areas [15]. This rise is in line with the increasing number of migrating populations, resulting in a heightened level of transactions involving both trade and services. Consequently, this trend is anticipated to impact the advancement of the economic sector.
In slum areas, households have a low socioeconomic mobility level between generations [16]. This situation arises from the limited capabilities, often linked to lower education levels, which in turn hinders the residents ability to compete with those who are highly educated. As a result, their intergenerational socio-economic mobility remains significantly constrained. These areas are characterized by a lack of public services and home ownership security, a dense population [17], vulnerability to eviction and poor population status [18]. Furthermore, unauthorized use of electricity and water is found in almost every location [19], inadequate basic services and several rented houses [20], as well as high vulnerability to diseases [21], are also prevalent. Shafie et al. (2013) stated that urban poor areas in developing countries have a high infant mortality rate, indicating lower infant life expectancy compared to rural areas [23] where infant mortality is also higher. These diverse characteristics portrays the conditions of slum settlements across various regions in developing countries. This situation is deeply troubling, as failure to address these issues promptly could result in an increased number of infant deaths in urban slum settlements.
The Palembang city has a river called the Musi River, which divides it into two parts, namely the Ulu and Ilir areas. This division led to several settlements at the riverbanks [24], forming slum areas. Slum settlements are present in nearly every sub-district of Palembang City, but the most concentrated areas are found among residents living along the banks of the Musi River. The residents residing along the riverbanks hail from the surrounding areas of Palembang City as well as from South Sumatra Province. Some originate from other provinces outside South Sumatra, including within Sumatra and Java Islands. Approximately one million people live in Palembang City, the province's capital and economic center. The riverbanks provide an alternative housing option for residents seeking low rental costs. Like other urban areas, this city always experiences an increase in population yearly (Sukmaniar, Pitoyo et al., 2020). This phenomenon stems from the bustling economic activities in Palembang City service and trade sectors. These factors attract migrants from both within and outside South Sumatra Province. Skilled migrants tend to settle in non-slum areas, while those without skills often reside in the low-cost settlements spread across Palembang. The combination of migrant influx and the pre-existing local population in these areas gives rise to various challenges, including poverty and crime. These problems need to be addressed promptly to prevent further deterioration of conditions in every slum settlement in Palembang City. The importance of this research lies in the fact that understanding the distribution of slum settlements in Palembang will lead to policy recommendations regarding the necessary actions needed to overcome this problem. Studies on the distribution of slum areas in Palembang City using spatial data modelling on accuracy values are unavailable. Therefore, this novelty study aims to analyze the distribution of slum areas in Palembang City using spatial data modelling on accuracy value.

2. Literature Review

Population increase is a major source of slum areas [14], and the obstacles experienced by the inhabitants of these areas are in the socioeconomic and environmental aspects [26]. The surge in population could be ascribed to both the uptick in native births and the arrival of migrants, primarily marked by a lower level of education. This educational deficiency hampers other aspects such as the economy and the environment. According to Duncker (2000), population density in slum areas affects the availability and quality of water infrastructure, cleanliness, and sanitation, with infrastructure investments often struggling to keep pace with rapid population growth. This situation emerges because of the government limitations in providing essential infrastructure for residents. Residents lack the means to independently establish the required infrastructure for their livelihoods. Furthermore, the growth rate of the total population in slum areas is typically faster than that of urban areas [28]. A contributing factor is the role of family dynamics, wherein individuals living in urban areas promote their rural relatives to move to the city, aiming to enhance economic conditions. Several people in slum areas do not own a house [20], which makes rented houses predominant [29], and infrastructure shortages are often observed [30], thereby obstructing infrastructure development [26]. The rented houses are indeed affordable, but unhabitable because they are constructed from materials such as wooden boards.
A high number of urban poor and informal markets are features of slum areas [31], and these areas are also characterized by evictions [32]. Residents of slum settlements are primarily involved in menial occupations, which span across both trade and service industries. According to De Soto and Diaz (2002), other factors that contribute to lower eviction risks include inadequate facilities and poor health conditions [26]. Evictions take place due to lack of land rights for the houses they have inhabited for years, along with poor health conditions caused by the excessive waste in the settlements. One of the prevalent diseases in these areas is tuberculosis. Unfortunately, slum areas often have high rates of disease [34] leading to negative impacts on the mental health of the population (Asibey et al., 2021; Gruebner et al., 2011). The occurrence of stress among residents stemming from low incomes and inadequate facilities tend to impact their psychological well-being. Slum settlements tend to emerge in areas with numerous economic activities [36]. Economic activities in slum settlements primarily comprises of informal economic endeavors. Other attributes include uninhabitable houses, poor environment [37], and difficulty accessing electricity and water [38]. Residential buildings are not durable and common property rights are insecure [39]. Basic services and home ownership are needed by people in slum areas [40], and this includes settlement formalization [41], which enables land ownership, thereby stopping house renting [42].
Land ownership is a key effort made by inhabitants of slum areas in order to improve their quality of life [43]. Land ownership is also an effective way to reduce poverty levels in slum areas [44]. It enables people to increase their business and investment [45], making it a crucial component for generating investment in slum areas [46]. By investing in the areas, residents can improve their environment and secure better housing [47], while also creating economic opportunities that lead to sustainable growth [48]. However, current land ownership certification processes mainly support the land market scope, which may not provide adequate security to those living below the poverty line against market forces [49]. Most land in slum areas is owned by non-residents [50] who often sell land rights to urban residents, further fueling the growth and development this type of settlement [51]. To address these challenges, many studies recommend a coordinated approach to transform slum settlements into non-slum areas (Lobo et al., 2020; Lilford et al., 2017). It is also critical to note that the goal should not be to evict residents from slum settlements, but to transform them into better living conditions [53].

3. Study Area

This study was carried out in Palembang City, the capital of South Sumatra Province, Indonesia. As the provincial capital, Palembang City is the center of economic activities in the province, leading to a high migration of people into the city. This city was chosen as the study area due to the presence of slum areas. The existence of the Musi River in the city attracted numerous settlements at the river banks, which led to the formation of slum areas. The location of this study is shown in figure 1.

4. Methods

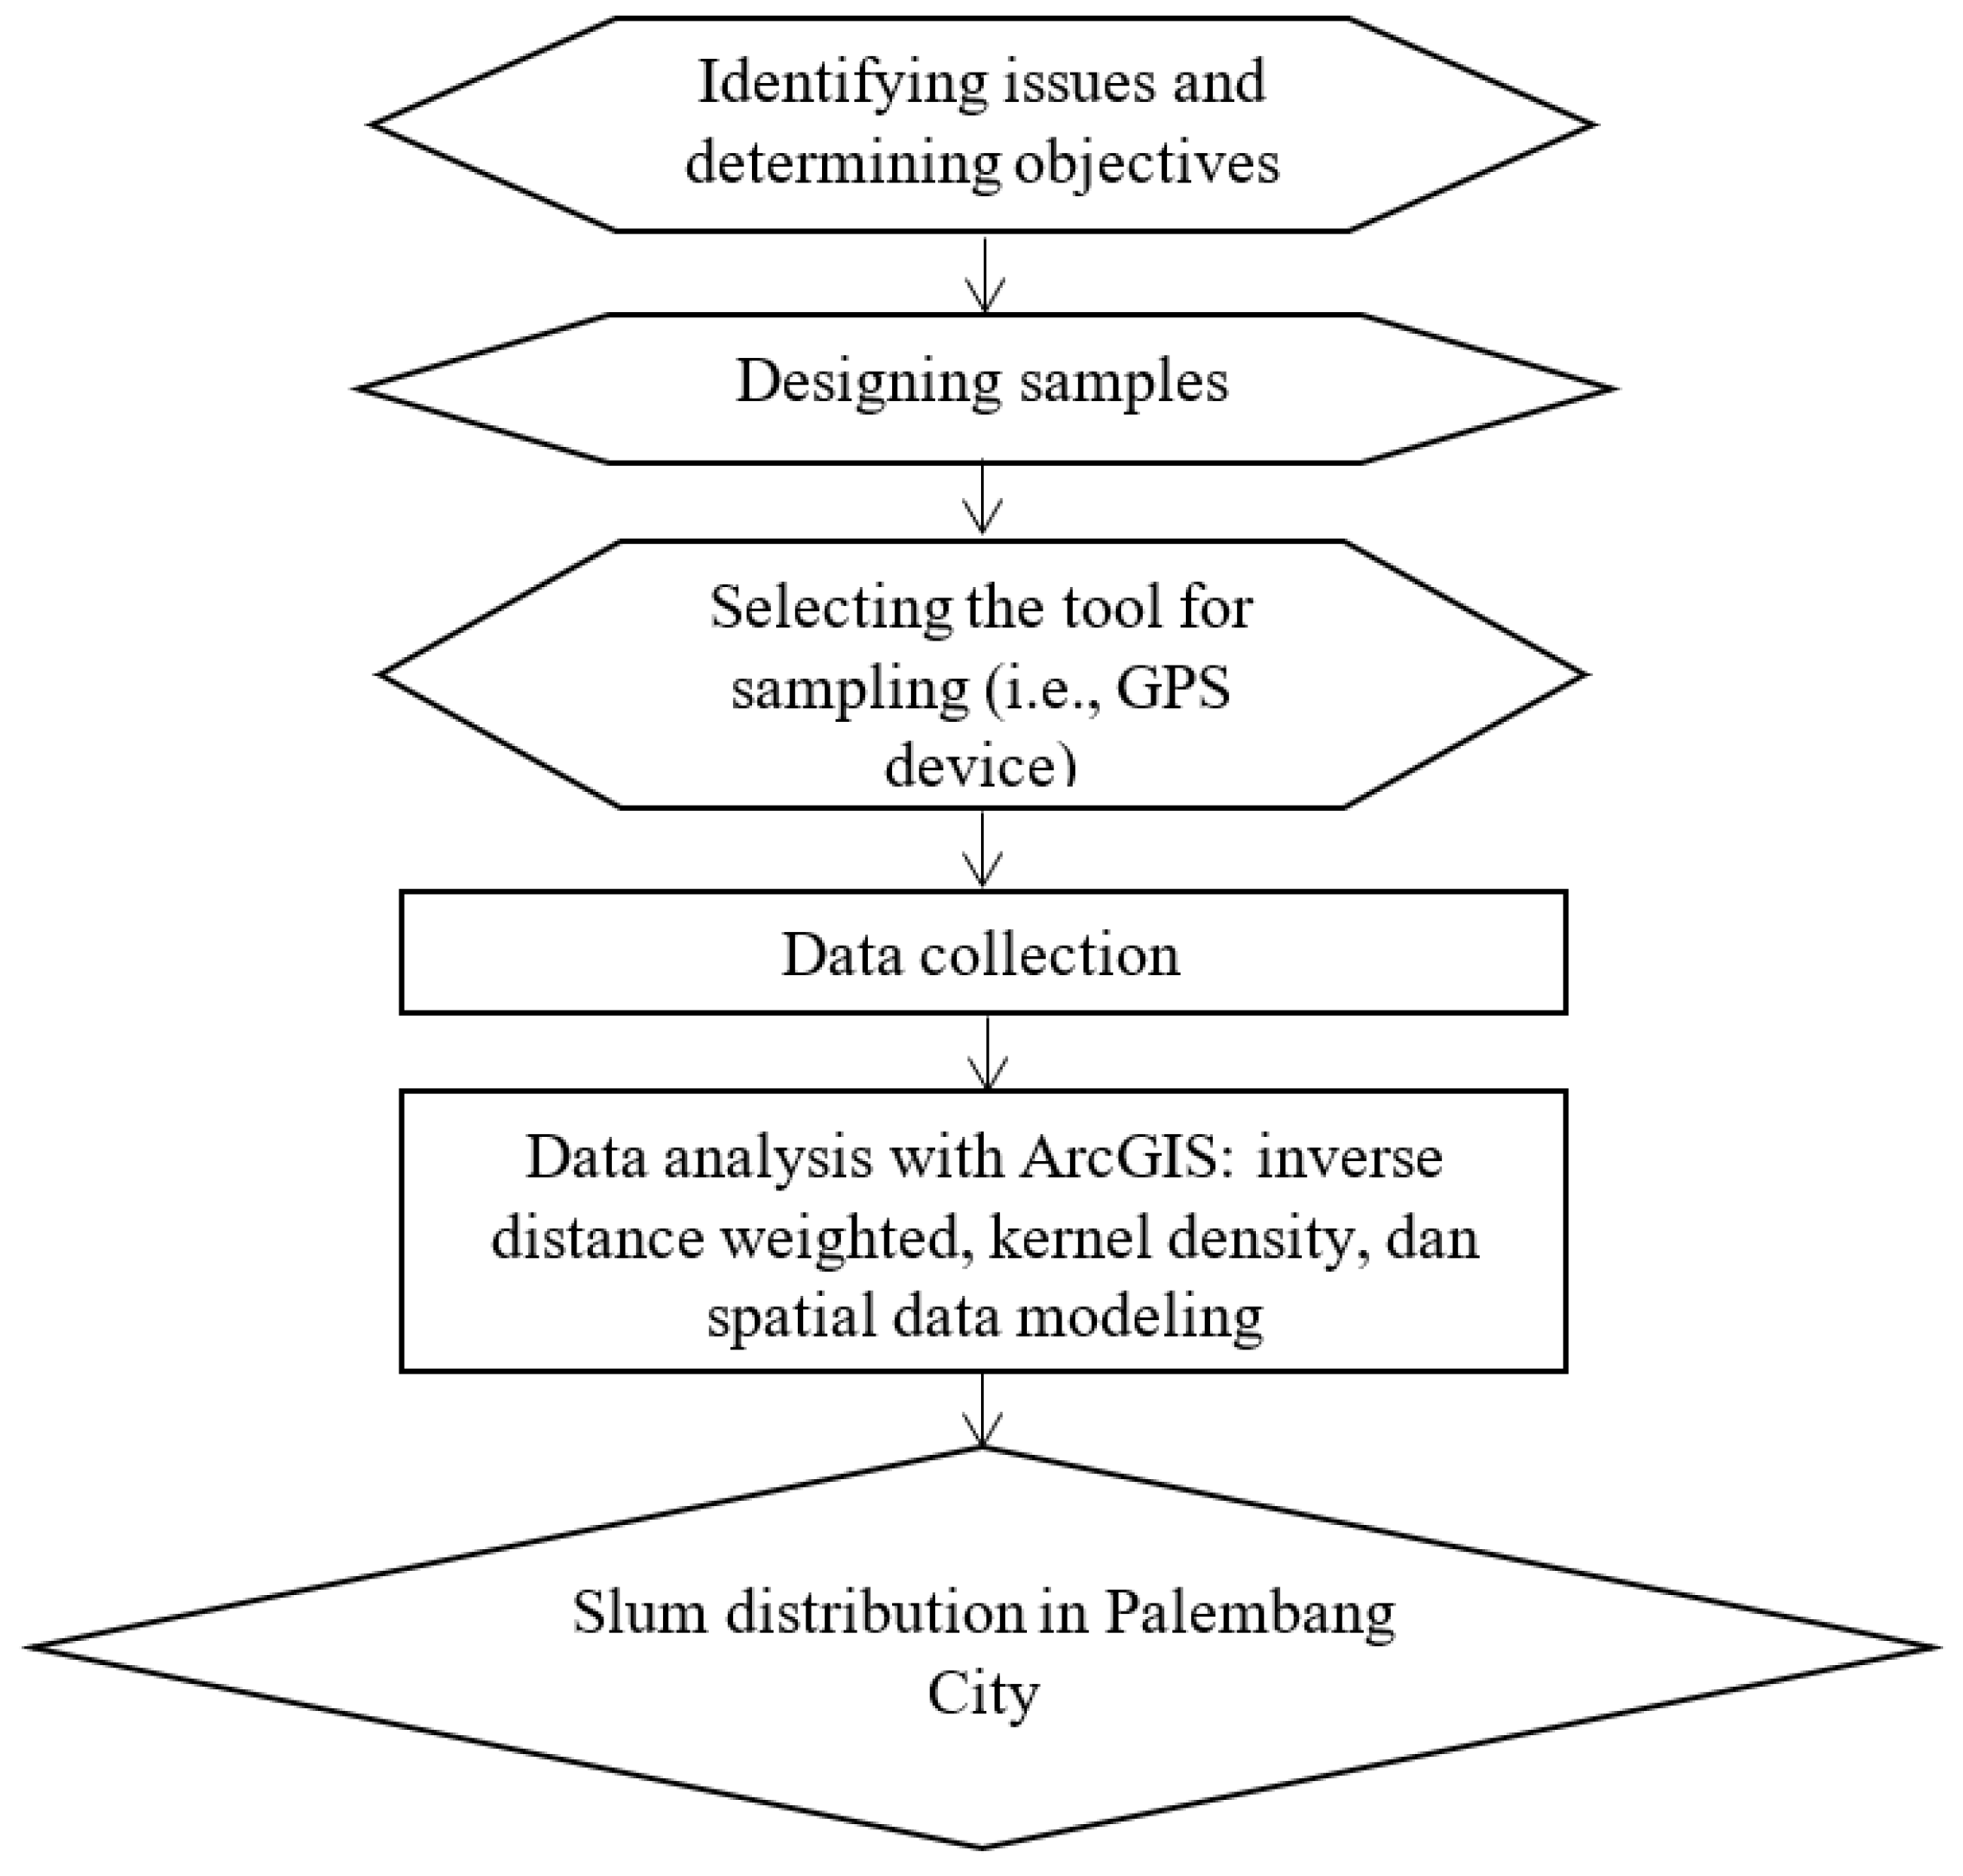
In this study, a quantitative method with a survey approach was used. As illustrated in figure 2, the research was conducted in several steps: 1) Identifying the issue, which revolves around slum settlements in Palembang City. 2) Defining the study objective, by meticulously analyzing the distribution of the settlements in Palembang using spatial data modeling. 3) Using area proportional random sampling to select samples, ensuring a comparative representation across different settlements. 4) Selecting the tool for sample collection, namely GPS, to be used among families residing in the settlements. 5) Directly collecting data within the slum settlements. The data collection process started by identifying the population and samples from the 64 slum areas and 13 sub-districts in Palembang City Furthermore, in each area, samples were selected proportionally based on the criterion of households residing in slum settlements using the GPS technology. The GPS available on mobile phones was used to capture sample points within the households located in these slum settlement. 6) The collected data were processed through GIS software, specifically ArcGIS, for the purpose of mapping. 7) The analyzed data were presented in the form of maps.
This study employed various analysis techniques, including inverse distance weighted, kernel density, and spatial data modeling. The formula for inverse distance weighted is stated as follows [54]:
Z * = i 1 n w i Z i
Z i ( i = 1,2,3,…, N) is N data height points, while
w i = h i p j = 0 n h i p
p is a power parameter whose positive value can be changed, and h i   is the distance from the point distribution to the interpolation point. In other words, p is a positive power value that can be changed, and h i is calculated as follows:
h i = x x i 2 + y y i 2
The data were further analyzed using kernel density, an analysis of regional distribution patterns [55] within a certain radius [56]. The formula is shown as follows:
SD = x i X 2 N + y i Y 2 N
The following formula was used to calculate the radius:
Radius = 0,9 ∗ 𝑆𝐷 ∗ Number of data−0.2
The density of a point on the kernel density was determined using the following formula:
Density = N u m b e r   o f   d a t a R a d i u s 1609 , 344 2 p i R a d i u s 2
In conclusion, spatial data modelling with ROC analysis and AUC analysis were used for the accuracy of the slum distribution and summary of the accuracy of the slum distribution, respectively. The eighth step involved evaluating the results regarding the distribution of slum settlements and relating these findings to prior studies.

5. Findings

5.1. Characteristics of Slum Residents Based on Family Income, Migration Status, and Skills

Table 1 shows the composition of slum residents in Palembang City based on family income, migration status, and skills. It shows that migrants and non-migrants in all the income groups (from IDR500,000 to more than IDR2,000,000) predominantly worked in menial jobs (71.56%). Those with driving skills accounted for 1.83 and 1.57% of the migrants and non-migrants with incomes higher than IDR2,000,000. Driving skills made up the highest share of all the income groups (7.06%), whereas the lowest percentage (0.26%) comprised other skills, such as contract workers, Quran teachers, caretakers, and hairdressers.

5.2. Interpolation of Slum Distribution in Palembang City

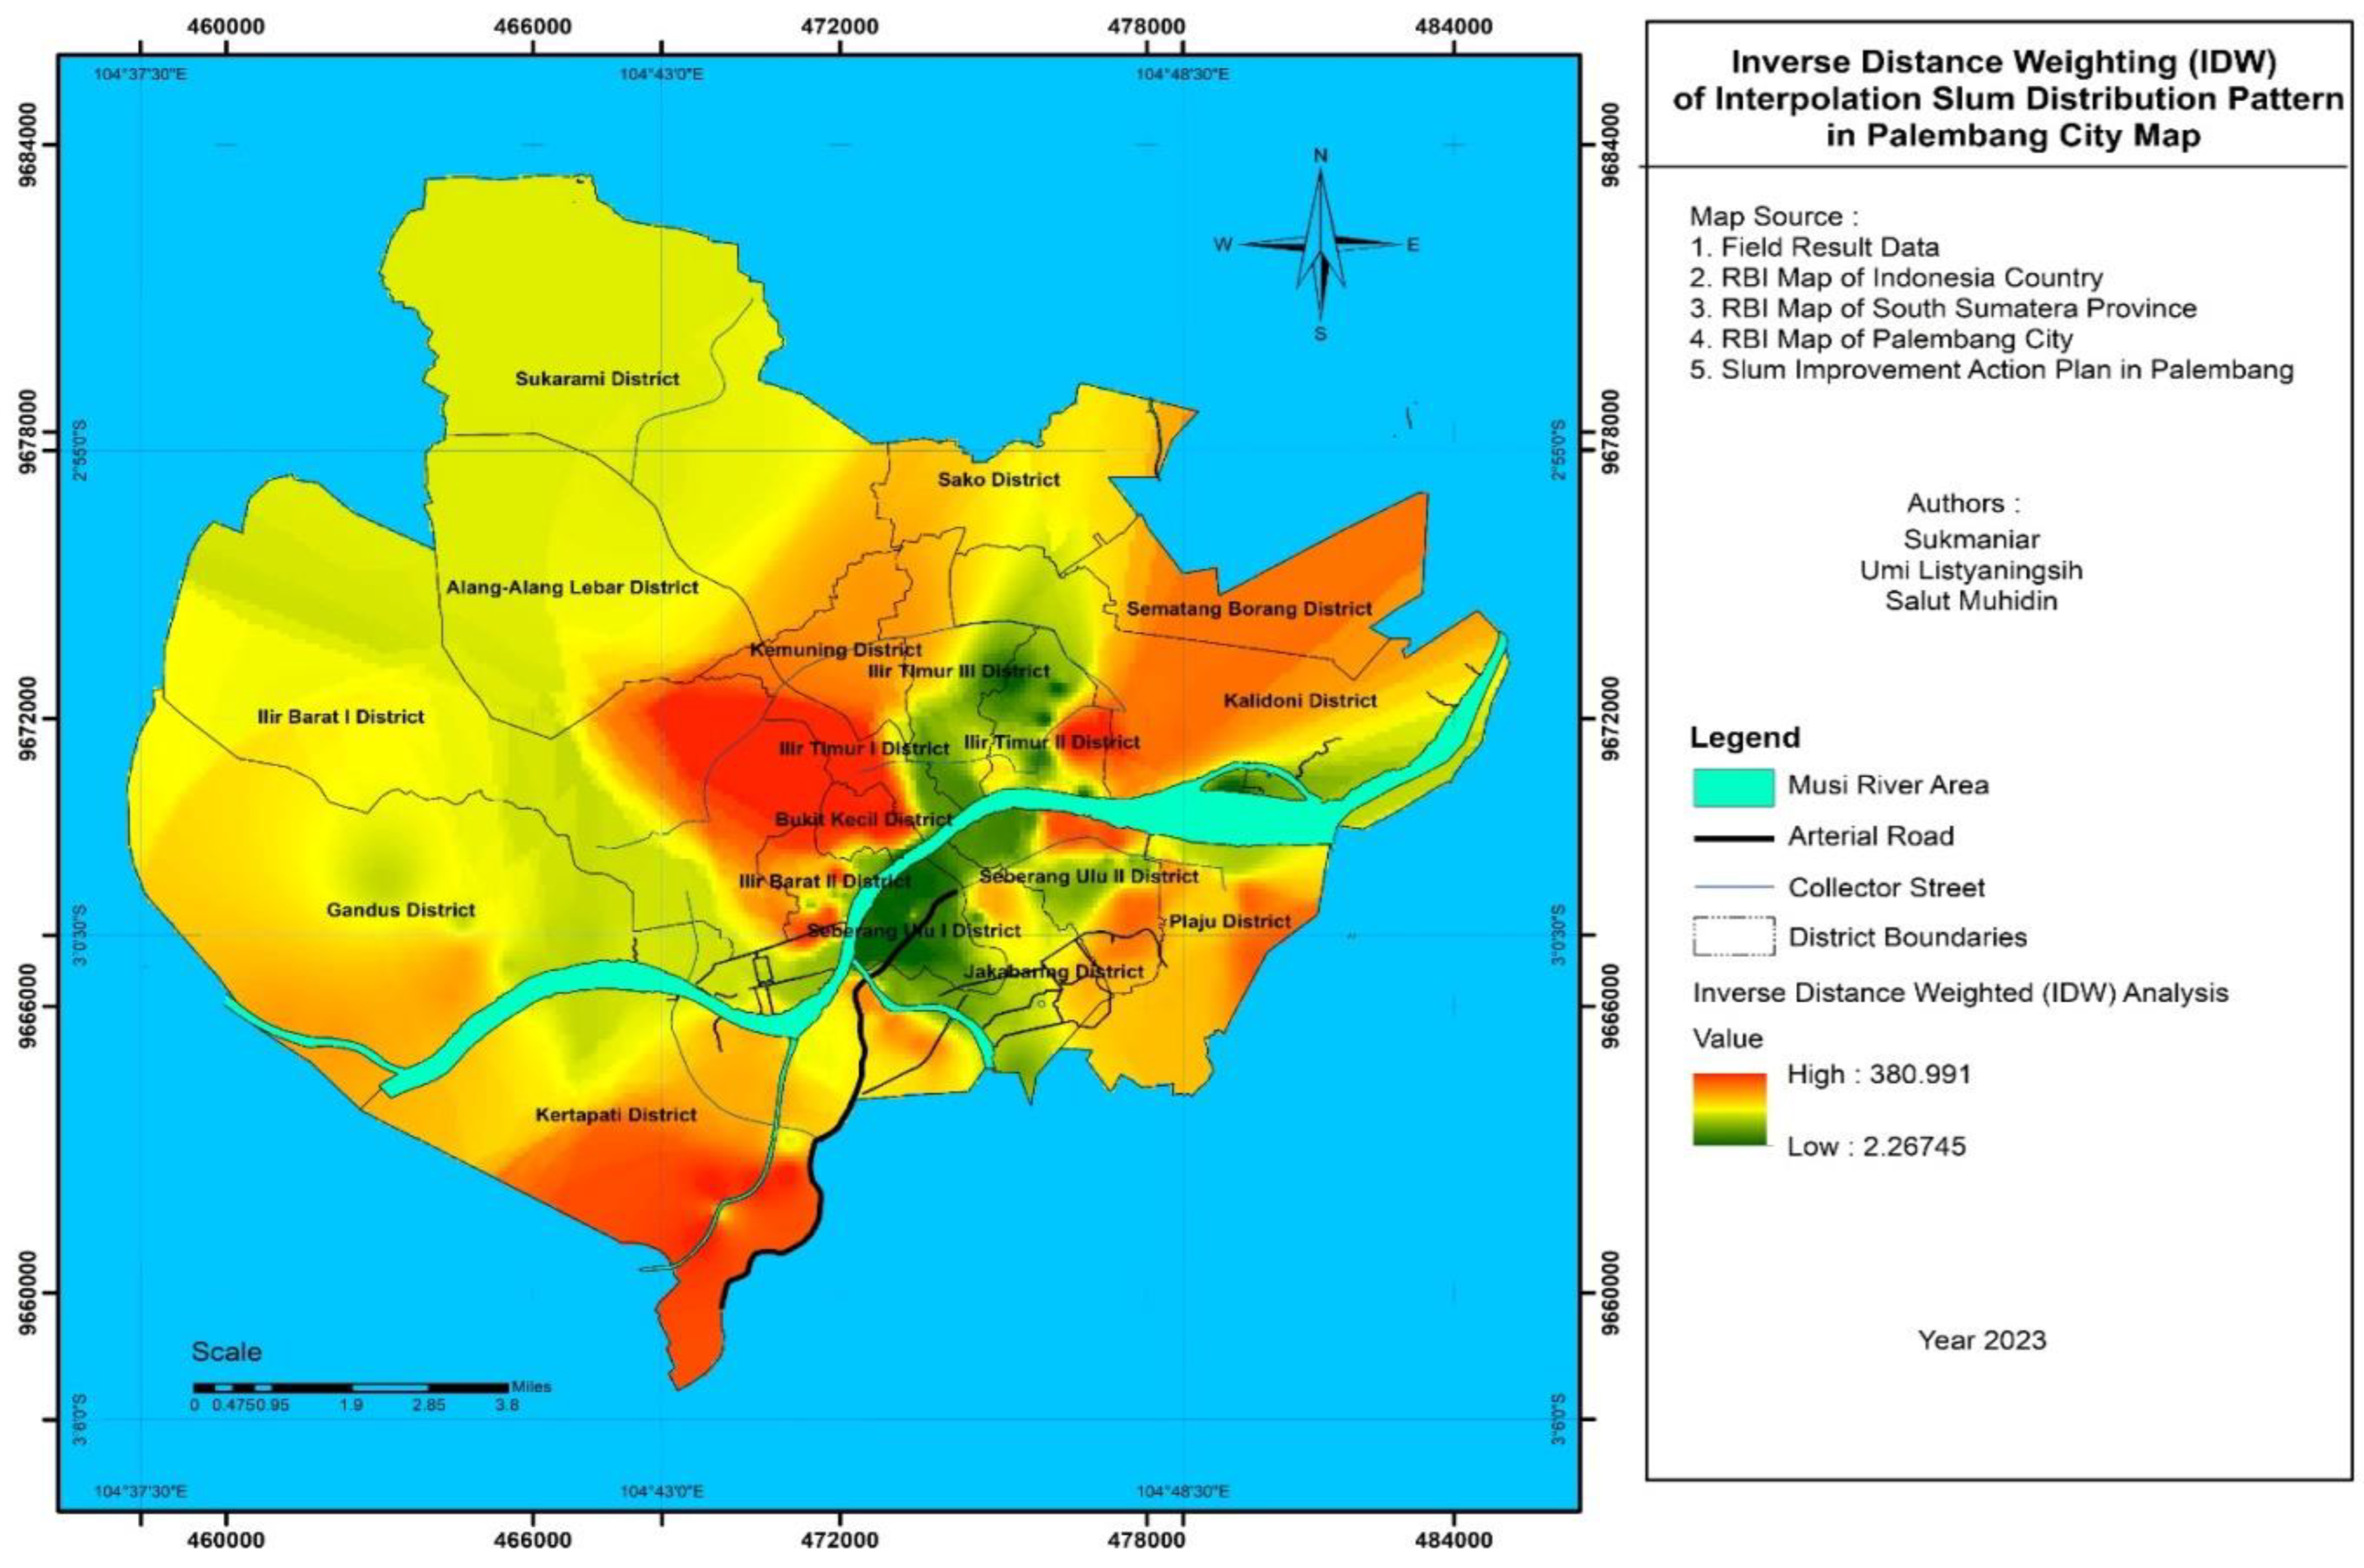
Interpolation of the slum distribution in Palembang City is seen in the population density of people living at the riverbanks. Additionally, it can be interpreted that the more populated the riverbank is, the denser the slum areas are and vice versa. The interpolation analysis of the distribution of slum areas in Palembang City through Inverse Distance Weighted (IDW) is shown in figure 3.
The map shows values ranging from 2.26745 to 380,991. The greener the area, the more densely populated and the closer it is to riverbanks. From these results, it can be inferred that densely populated slums grew in proximity to riverbanks because they provide access to water for daily use (despite the bad quality) and means of water transportation. Slums developed far from the riverbanks did not have a high population density because these areas lacked access to water and transportation options. These results are used to study slum areas with poor water conditions, informal markets, and many poor urban people [31]. The water conditions are said to be poor because the river, the main source of water supply, is usually polluted by industrial and household waste. Furthermore, the presence of informal markets is due to the inability of the inhabitants to rent traditional markets, and those living in these areas are predominantly laborers and unemployed people. Slum areas are also synonymous with evictions [32], which occur due to the illegal acquisition of lands. Low quality of life, poor buildings and environmental conditions are all characteristics of slum areas [37]. The low quality of life is due to a weak economy, making it difficult for inhabitants to build decent houses and improve their environmental conditions. The government does not authorize people living in slum areas to settle in those areas because the lands are illegally occupied [57]. However, the government finds it difficult to sanction and develop a relocation plan due to their long history of settlement in those areas.

5.3. Distribution Pattern of Slum Areas through Kernel Density Analysis

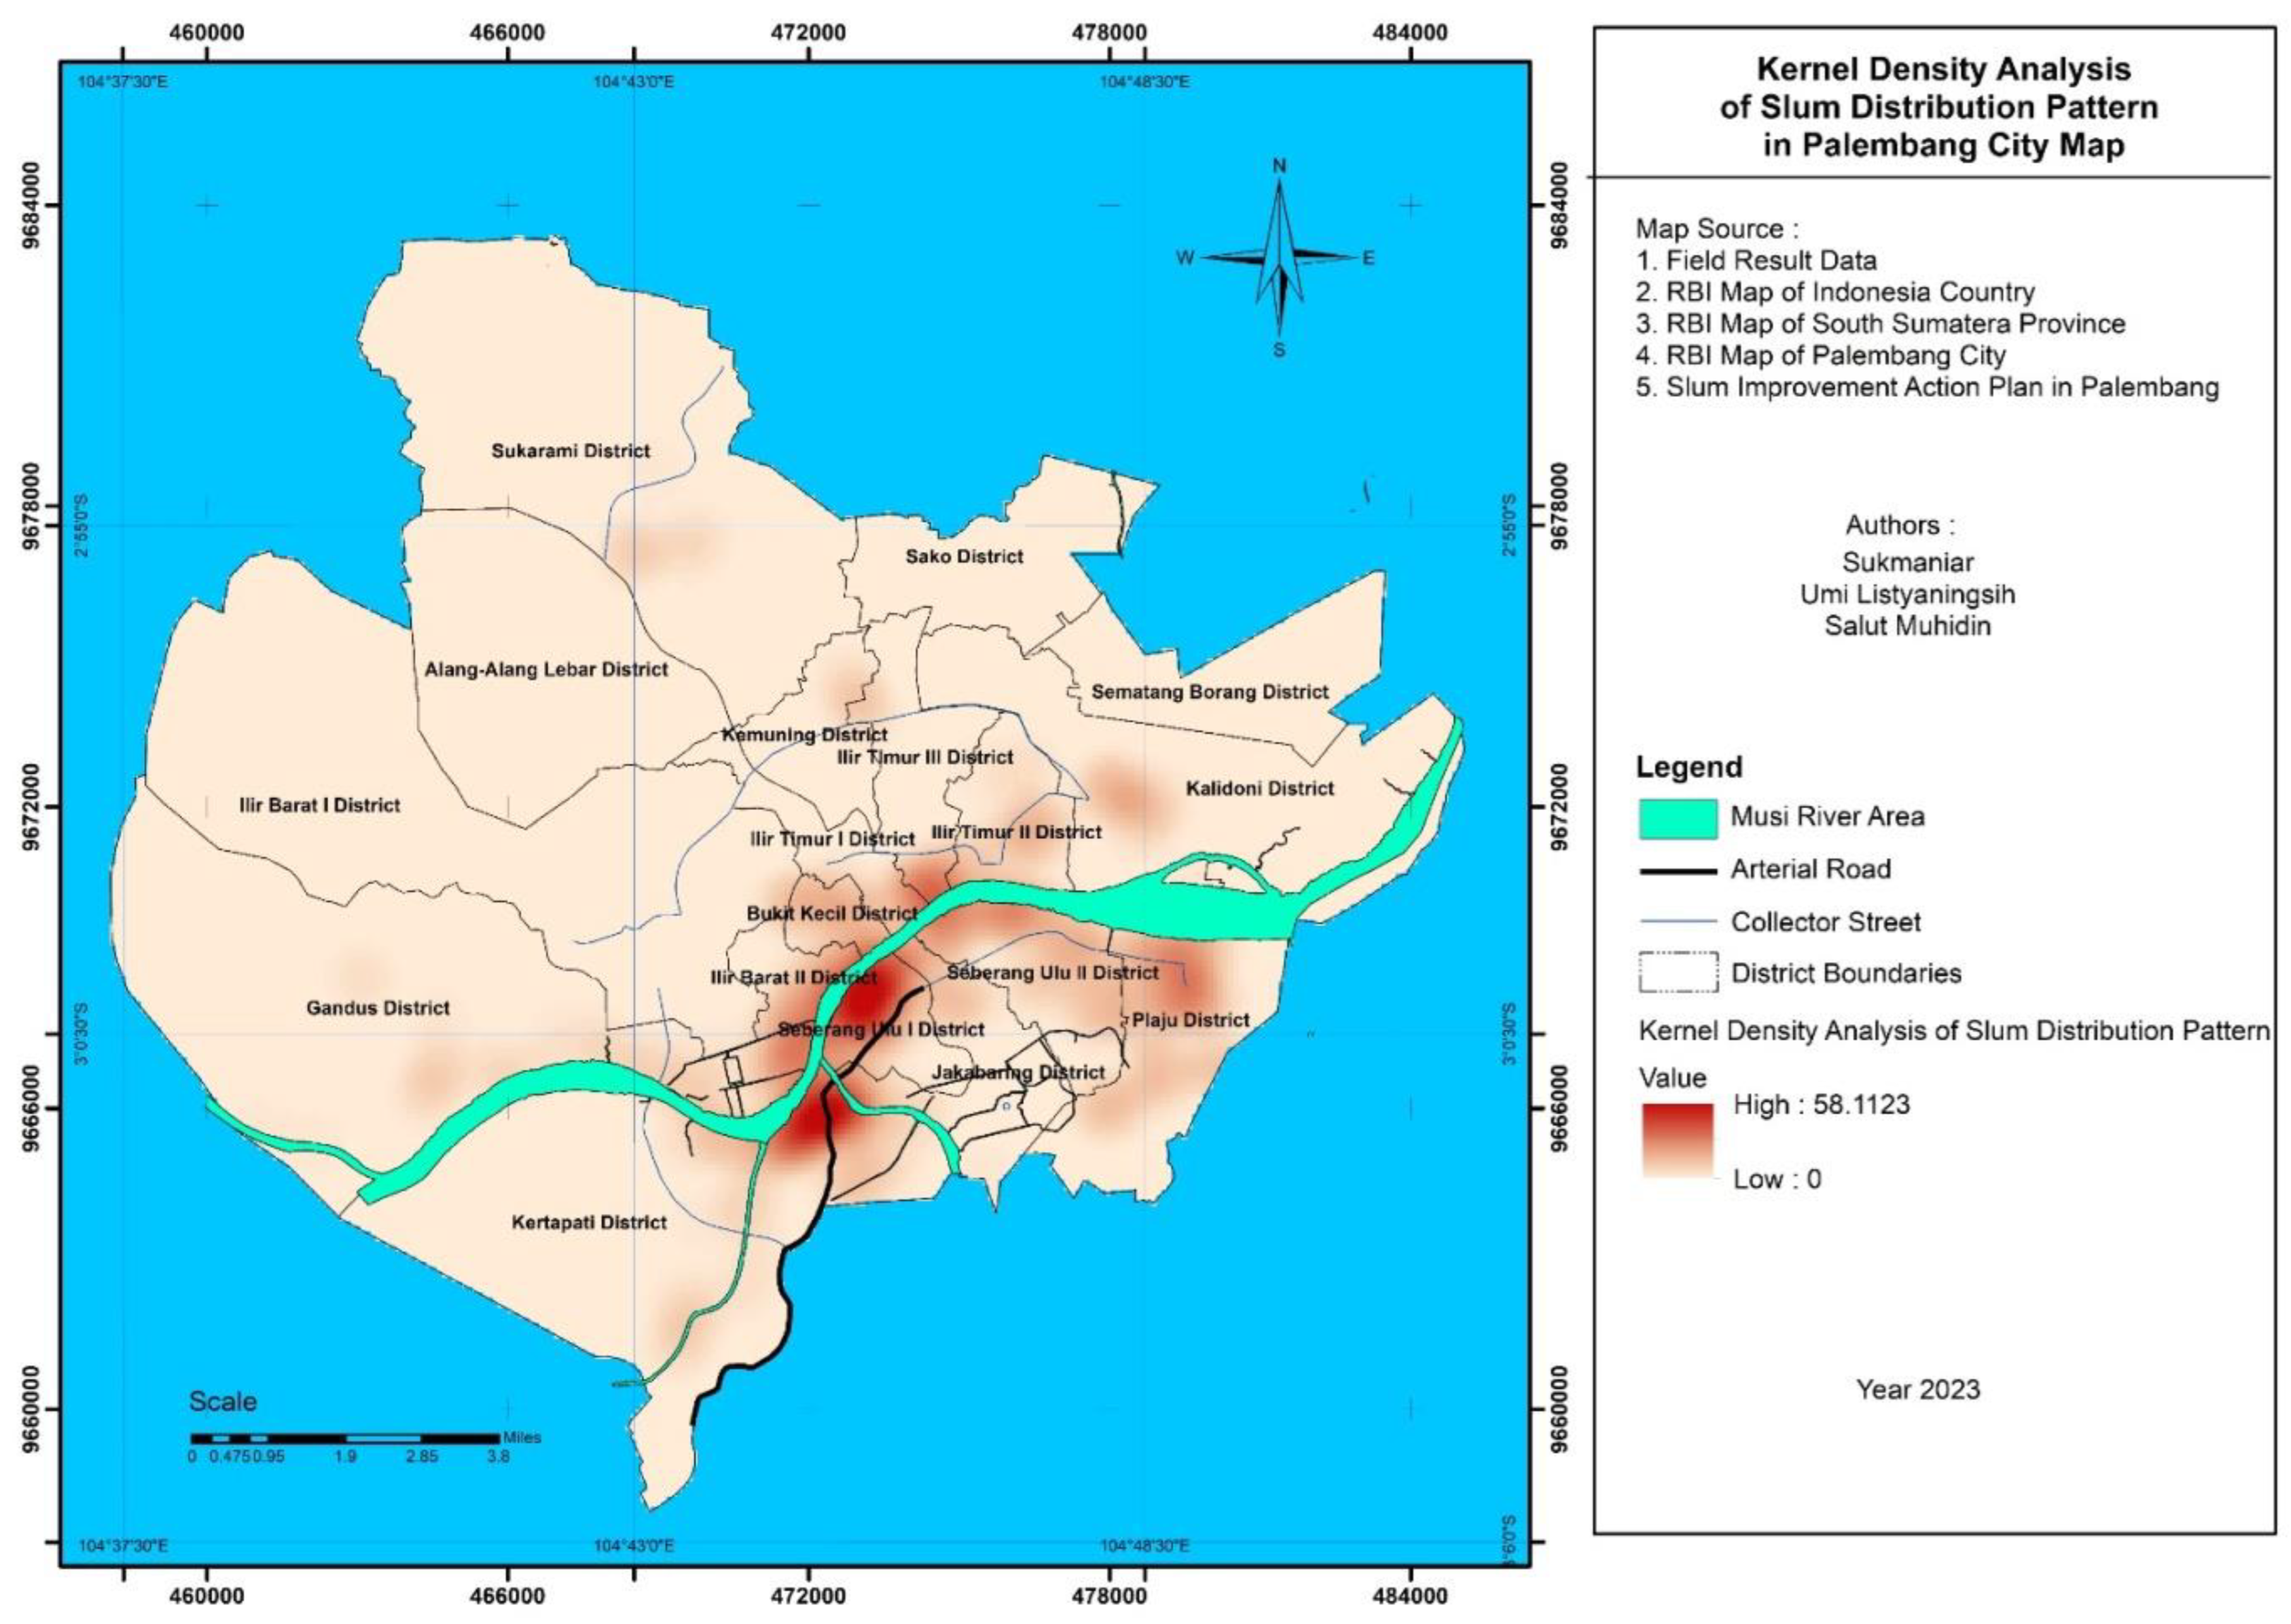
The distribution pattern of slum areas in Palembang City, through kernel density analysis as illustrated in figure 4, shows that the density of slum areas is spread along the Musi River, and the shape of the distribution is elongated along the river. Figure 4 shows that the brighter the color, the lower the density, while the more intense the color, the higher the density.
The map below indicates that the population was spatially distributed along the banks of the Musi River. The kernel density analysis produced values from 0 to 58.1123, which means areas with darker red color have a denser population. This distribution pattern was due to the large number of migrants who preferred to live on the riverbanks, where the cost of living was cheaper than further from the banks. Based on the findings of this study, the formation of slum areas can be attributed to the increase in population [14]. The migration of people into Palembang City is caused by the need to experience a better economy. However, due to poor financial status, these people can only live in locations with affordable rent. They resort to settling in slum areas leading to a proliferation of these areas. High urban populations can be reduced by making poor services and slum conditions available in cities. This can deter people from migrating to cities [58] but does not stop migrants completely from moving to urban areas for a better life.
Socioeconomic and environmental barriers are experienced by people in slum areas [26]. The socioeconomic barriers are due to low financial ability or poor education, leading to the inability of the people to compete with those with higher skills or education. Meanwhile, environmental barriers occur because the people`s lifestyle is accustomed to a lack of care for the environment, such as littering, which worsens the slum area. Only a small proportion of people in slum areas can own a house [20], due to the low economic capacity of people in these areas. The inhabitants of slum areas do not have access to city infrastructure, such as good water, electricity, and sanitation [38]. The relationship between water use and rent is a feature of these areas [29].

5.4. Spatial Data Modeling Analysis on the Slum Areas Distribution in Palembang City

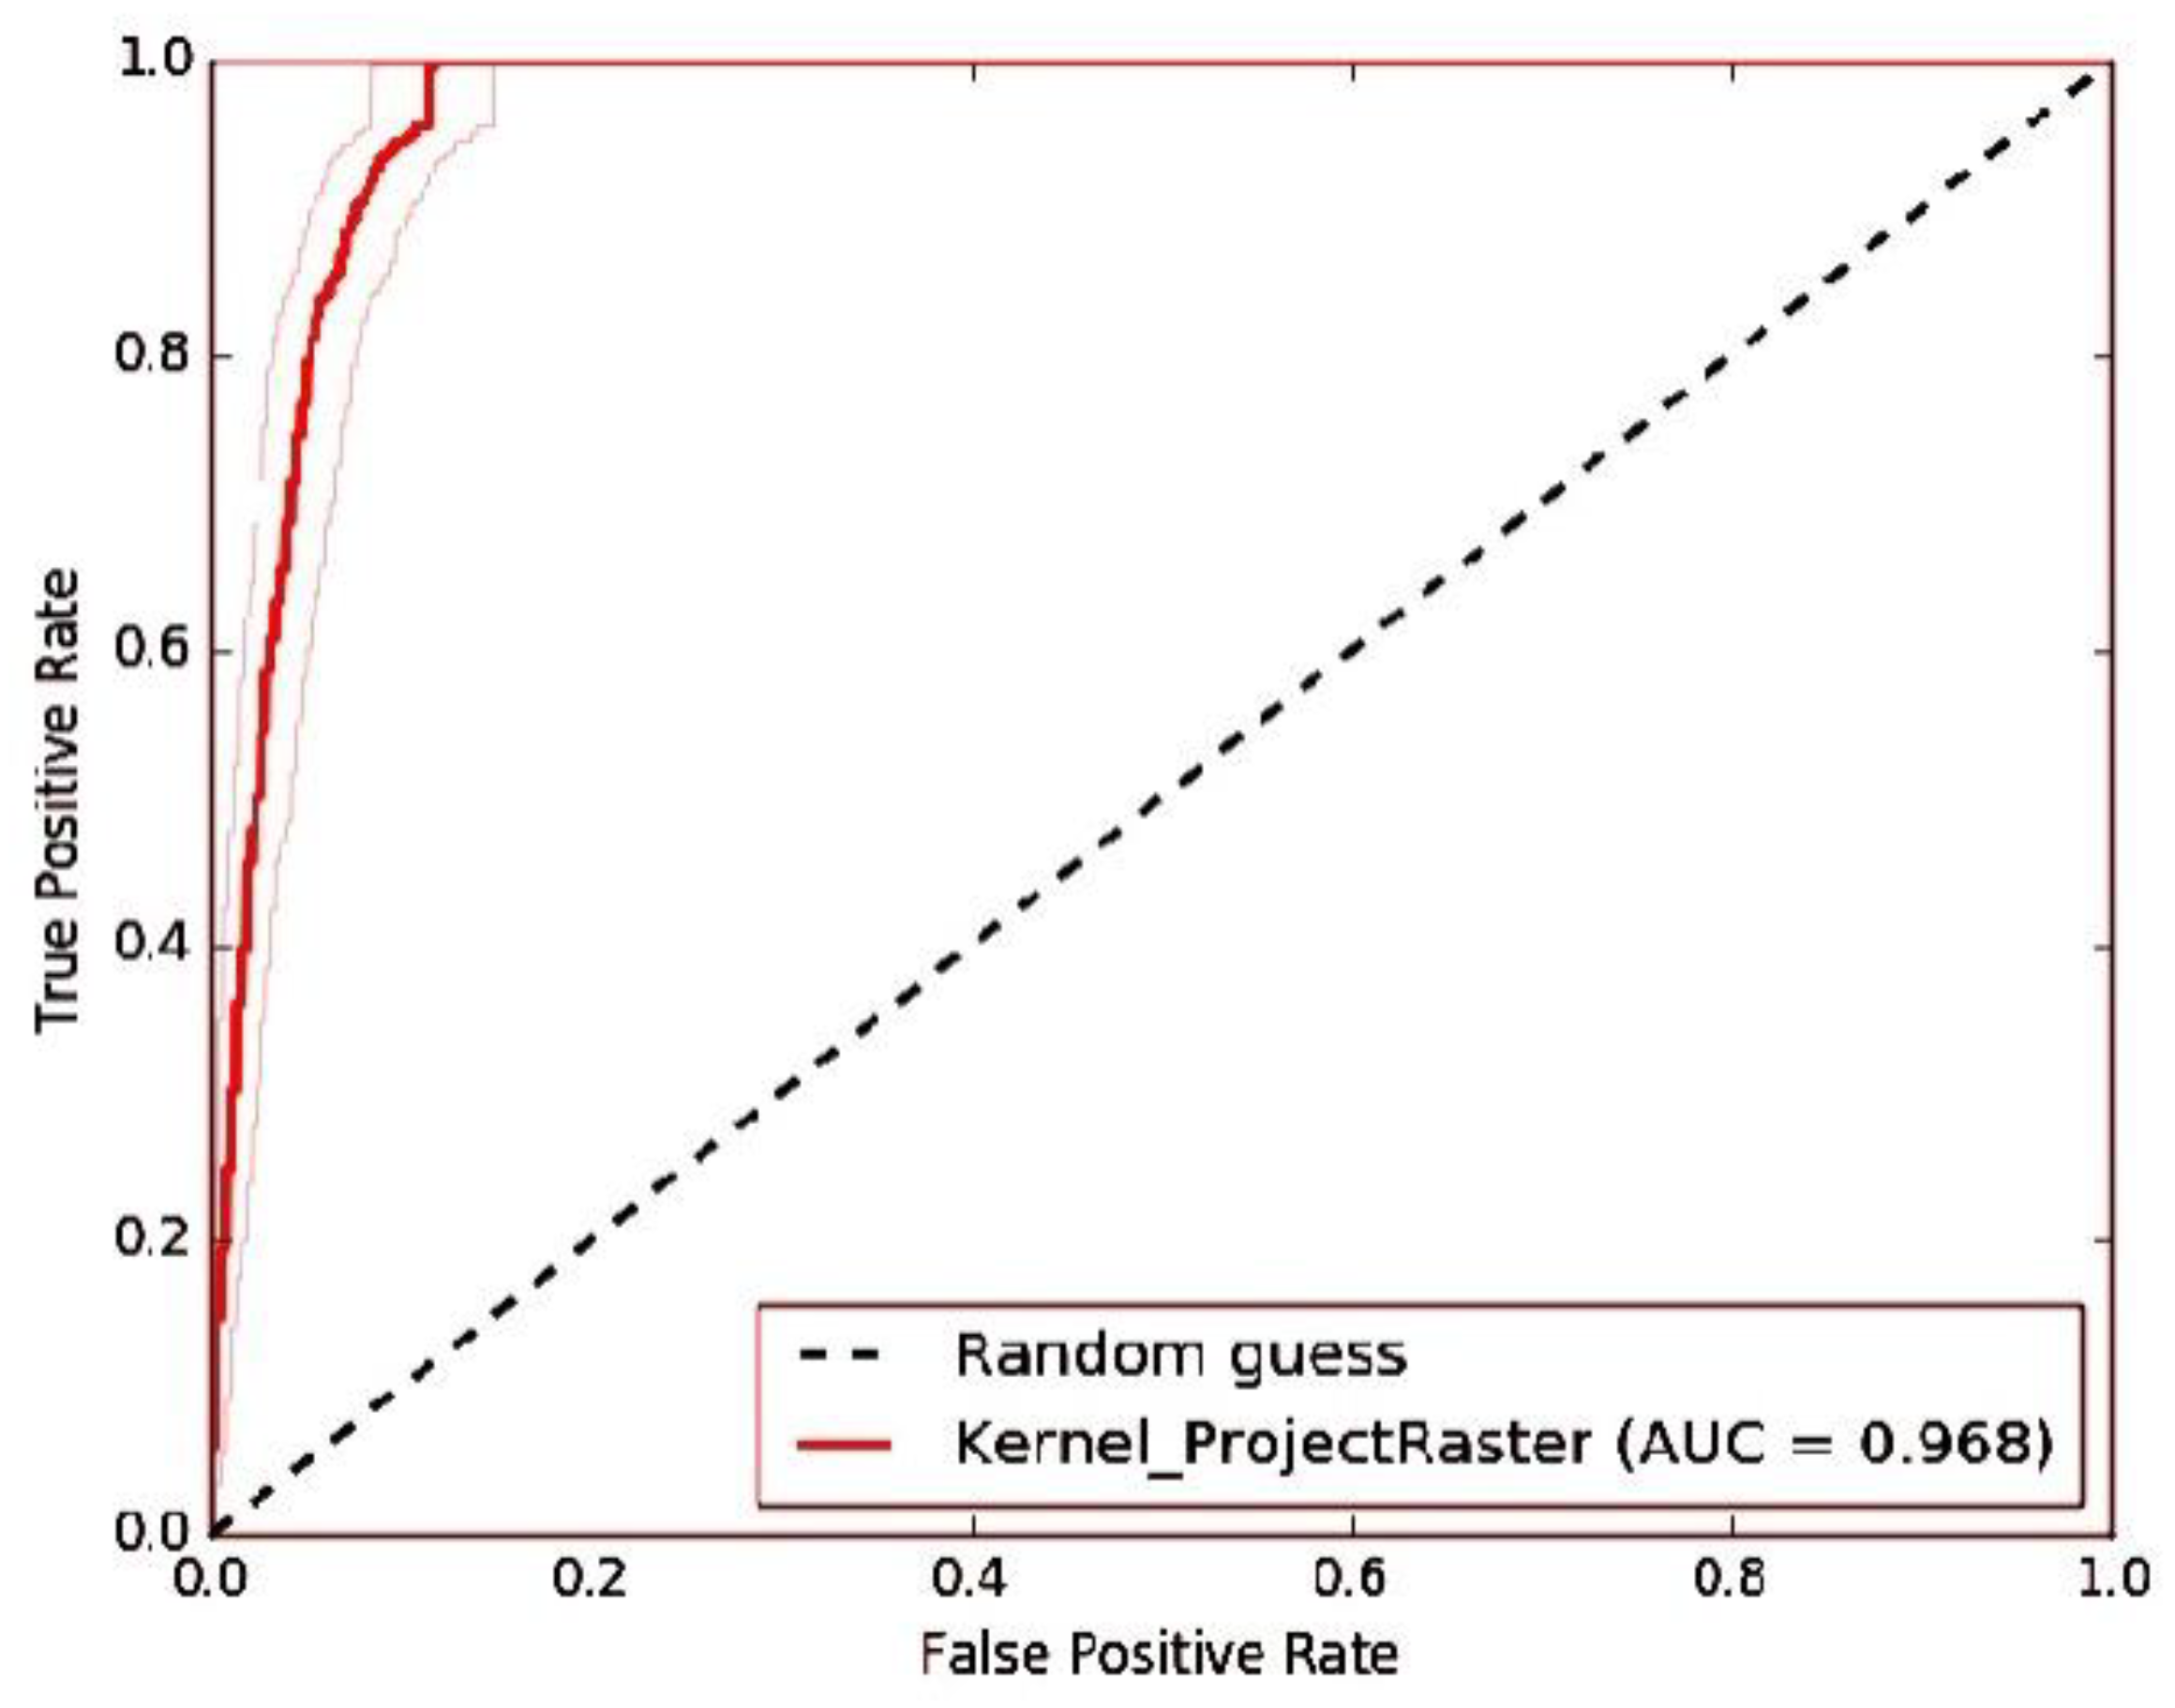
After kernel density analysis was carried out, spatial data modelling analysis was conducted for accuracy. Figure 5 shows that the Receiver Operating Characteristic (ROC) is at a true positive rate, indicating that the Area Under the Curve (AUC) is 96.8%. This is an excellent accuracy because the 96.8% value is in the range of >0.9-1 (AUC value, table 1). Furthermore, this means that the level of accuracy is high, and the test results prove that the density of slum distribution in Palembang City is spread along the Musi River. The results of Spatial Data Modeling through Receiver Operating Characteristic (ROC) and Area Under the Curve (AUC) is shown in figure 5.
Based on Figure 5, it can be interpreted that population density and distribution are concentrated in the Musi Riverbanks area. Therefore, this situation needs to be addressed promptly to avoid the continuous disposal of waste in the river, which is harmful to the environment. They also need to have their land, and improve economic conditions to avoid relying on renting or using illegal land. Based on the results of this study, guaranteed land ownership need to be allocated to people living in slum areas in order to ensure improved living conditions [43]. Furthermore, guaranteed land ownership eliminates the fear of future eviction. In improving slum areas, two considerations must be made, namely, providing basic services and formal or legal ownership [40]. Basic services such as health and education are important for people in slum areas to ensure that their lives are improved socially and economically. Formal ownership is essential in order to avoid evictions leading to relocation.
Table 2. Classification of AUC Values.
AUC Value Test Quality
>0.9 – 1 Excellent
>0.8 – 0.9 Very Good
>0.7 – 0.8 Good
>0.6 – 0.7 Satisfactory
0.5 – 0.6 Unsatisfactory
The absence of land ownership rights in slum areas affects the improvement of infrastructure services in these areas [26]. Slum upgrading can be performed by formalizing settlements and expanding land use [41]. Settlement formalization is intended to improve people's lives in slum areas, thereby changing informal settlements into formal settlements. Land ownership in slum areas is of immense benefit because house renting is eliminated [42]. Therefore, the income earned by the people is channeled towards improved education, which leads to better job opportunities. This study was limited to a quantitative approach and failed to delve deeply into qualitative analysis of the population distribution and density in slum settlements in Palembang City. Therefore, future research need to employ a qualitative method to obtain a more profound understanding of the reasons behind the population distribution and density in these settlements. A mixed-methods approach, combining both quantitative and qualitative methods, need to be employed to obtain comprehensive insights into the population distribution and density.

6. Discussion

This study confirms the findings of previous studies, which considered population growth as one of the factors triggering the emergence of slums in urban areas [14]. In many cases, facilities and infrastructure development cannot accommodate the rapidly increasing population, forcing many people to independently search for access to water, electricity, and other basic needs [26]. Population number increases faster in urban slums than rural areas [27]. There are various aspects contributing to environmental, social, and economic problems in slums [28]. Most people in the slums do not own the house where they reside [20]. Instead, paying rent money is the only way for them to be able to live in these areas [29]. These further demonstrate the lack of facilities and infrastructure and their suboptimal improvement efforts [28,30]. Other characteristics are the presence of informal markets, many economically disadvantaged urban people [31], and residential evictions [32]. Evictions can be prevented if slum residents have the right to own and build structures on the land [33].
In addition, the lack of health facilities can lead to poor health conditions, various disease outbreaks, and even death [28,34]. Living in a poorly maintained and unsanitary environment also negatively affects the mental health or disturbs the psychological state of its residents [35,36]. Many informal economic activities in slums [37] also contribute to waste production; without proper management, waste piles are scattered around the houses. Other than physically uninhabitable houses [38], little to no access to water and electricity [39], legally insecure rights to public ownership, and less durable housing [40] are also the characteristics of slums. Slum residents are in need of basic services and access to proper housing for their survival [41], as well as having their settlements formalized [42] to guarantee land ownership certificates so that they will no longer need to rent a house [43]. Besides, land ownership has been linked to improved quality of life [44] and can thus be an effective strategy to reduce poverty [45]. In the long term, this can lead to more investment and business opportunities for the slum residents [46].
Furthermore, with land ownership, the slum residents can invest in or with their land to earn more income and create better housing conditions than before the investment [47,48] and can open more long-term economic opportunities [49], thus improving their socioeconomic security [50]. [50]. In reality, people who own the occupied land do not live in the slum areas [51], which can worsen slum development if they sell the land rights to urban residents [52]. Concerted efforts between several sectors and stakeholders can help deal with slums [53] and turn them into less slum areas [40] without evictions by improving all aspects of the slums [54].

7. Conclusions

In conclusion, the interpolation of the slum areas distribution in Palembang City is seen in the population density of people living on the river banks. The more populated the riverbanks are, the denser the slum areas and vice versa. The distribution pattern of slum areas in Palembang city through kernel density analysis showed that the form of the distribution is elongated along the river, and based on Spatial Data Modeling Analysis, the density of the slum distribution is spread along the Musi River. Therefore, to address these issues, several policies need to be implemented. Firstly, measures to anticipate population density are necessary to prevent social disasters such as land grabbing and natural disasters like floods. Secondly, the government should identify appropriate locations for immigrant settlement and collect data on immigrants at the neighborhood and village levels. Thirdly, training programs need to be provided to improve the skills of slum dwellers, enabling them to secure better jobs and higher incomes, and eventually transition to non-slum settlements. Fourthly, awareness campaigns should be conducted to promote environmental preservation, such as discouraging littering, to enhance the quality of life in slum settlements. It is recommended that future research include a mixed method (qualitative and quantitative) to obtain comprehensive results and employ other spatial analyses to find new characteristics that can assist in analyzing slums. Besides, future research can examine more than one location for comparison.

References

  1. Sukmaniar, A. J. Pitoyo, and A. Kurniawan, “Deviant behaviour in the slum community of Palembang city,” in IOP Conference Series: Earth and Environmental Science, 2021, vol. 683, no. 1, pp. 1–9. [CrossRef]
  2. K. Sik Lee and A. Anas, “Costs of Deficient Infrastructure: The Case of Nigerian Manufacturing,” Urban Stud., vol. 29, no. 7, pp. 1071–1092, 1992. [CrossRef]
  3. N. Joshi, A. K. Gerlak, C. Hannah, S. Lopus, N. Krell, and T. Evans, “Water insecurity, housing tenure, and the role of informal water services in Nairobi’s slum settlements,” World Dev., vol. 164, p. 106165, 2023. [CrossRef]
  4. L. W. Riley, A. I. Ko, A. Unger, and M. G. Reis, “Slum health: Diseases of neglected populations,” BMC Int. Health Hum. Rights, vol. 7, no. 2, pp. 1–6, 2007. [CrossRef]
  5. J. Bird, P. Montebruno, and T. Regan, “Life in a slum: Understanding living conditions in Nairobi’s slums across time and space,” Oxford Rev. Econ. Policy, vol. 33, no. 3, pp. 496–520, 2017. [CrossRef]
  6. S. Gulyani and D. Talukdar, “Slum Real Estate: The Low-Quality High-Price Puzzle in Nairobi’s Slum Rental Market and its Implications for Theory and Practice,” World Dev., vol. 36, no. 10, pp. 1916–1937, 2008. [CrossRef]
  7. W. Hogrewe, S. Joyce, and E. Perez, “The unique challenges of improving peri-urban sanitation,” 1993.
  8. J. Jalan and M. Ravallion, “Does piped water reduce diarrhea for children in rural India?,” Jan. 2001. [CrossRef]
  9. L. Haller, G. Hutton, and J. Bartram, “Estimating the costs and health benefits of water and sanitation improvements at global level,” J. Water Health, vol. 5, no. 4, pp. 467–480, Dec. 2007. [CrossRef]
  10. K. Kar and R. Chambers, Handbook on Community-Led Total Sanitation, vol. 44, no. 0. 2008.
  11. M. Piesse, “Water Security in Urban India: Water Supply and Human Health,” 2015. [Online]. Available: http://futuredirections.org.au/wp-content/uploads/2015/09/Water_Security_in_Urban_India_Water_Supply_and_Human_Health.pdf.
  12. R. P. Sindt, “Housing Economics: The Condominium Market in Transition,” Reg. Bus. Rev., vol. 26, pp. 59–71, 2007.
  13. N. Islam, “Urban Governance In Bangladesh: The Post Independence Scenario,” J. Asiat. Soc. Bangladesh, vol. 58, no. 2, pp. 289–301, 2013.
  14. Sukmaniar, A. Kurniawan, and A. J. Pitoyo, “Population characteristics and distribution patterns of slum areas in Palembang City: Getis ord gi∗ analysis,” in E3S Web of Conferences, 2020, vol. 200, pp. 1–6. [CrossRef]
  15. F. Kraas, “Megacities and Global Change in East , Southeast and South Asia,” ASIEN, vol. 103, no. April, pp. 9–22, 2007.
  16. R. M. Buckley and J. Kalarickal, “Housing policy in developing countries: Conjectures and refutations,” World Bank Res. Obs., vol. 20, no. 2, pp. 233–257, 2005. [CrossRef]
  17. O. Golubchikov and A. Badyina, Sustainable Housing for Sustainable Cities. 2012.
  18. H. S. Kim, Y. Yoon, and M. Mutinda, “Secure land tenure for urban slum-dwellers: A conjoint experiment in Kenya,” Habitat Int., vol. 93, no. November 2018, p. 102048, 2019. [CrossRef]
  19. S. Gulyani, D. Talukdar, and D. Jack, “Poverty, living conditions, and infrastructure access: a comparison of slums in Dakar, Johannesburg, and Nairobi,” World Bank Policy Res., no. July, p. 59, 2010, [Online]. Available: http://papers.ssrn.com/sol3/papers.cfm?abstract_id=1650479.
  20. S. Gulyani, D. Talukdar, and E. M. Bassett, “A sharing economy? Unpacking demand and living conditions in the urban housing market in Kenya,” World Dev., vol. 109, pp. 57–72, 2018. [CrossRef]
  21. J. Kangmennaang, E. Bisung, and S. J. Elliott, “‘We Are Drinking Diseases’: Perception of Water Insecurity and Emotional Distress in Urban Slums in Accra, Ghana,” Int. J. Environ. Res. Public Health, vol. 17, no. 3, pp. 1–17, 2020. [CrossRef]
  22. F. A. Shafie, D. Omar, and S. Karuppannan, “Environmental Health Impact Assessment and Urban Planning,” in Procedia - Social and Behavioral Sciences, 2013, vol. 85, pp. 82–91. [CrossRef]
  23. D. Bradley, C. Stephens, T. Harpham, and S. Cairncross, “A Review of Environmental Health Impacts in Developing Country Cities,” 1992.
  24. M. K. Putri, N. Nuranisa, E. T. W. Mei, S. R. Giyarsih, S. Sukmaniar, and W. Saputra, “The characteristics of ethnics people at the banks of musi river in palembang,” IOP Conf. Ser. Earth Environ. Sci., vol. 683, no. 1, 2021. [CrossRef]
  25. Sukmaniar, A. J. Pitoyo, and A. Kurniawan, “Vulnerability of economic resilience of slum settlements in the City of Palembang,” IOP Conf. Ser. Earth Environ. Sci., vol. 451, no. 1, 2020. [CrossRef]
  26. B. Marx, T. Stoker, and T. Suri, “The economics of slums in the developing world,” J. Econ. Perspect., vol. 27, no. 4, pp. 187–210, 2013. [CrossRef]
  27. L. C. Duncker, “Hygiene awareness for rural water supply and sanitation projects,” 2000. [Online]. Available: http://www.fwr.org/wrcsa/819100.htm.
  28. G. Payne, “Getting ahead of the game: A twin-track approach to improving existing slums and reducing the need for future slums,” Environ. Urban., vol. 17, no. 1, pp. 135–146, Apr. 2005. [CrossRef]
  29. S. Gulyani and E. M. Bassett, “Retrieving the baby from the bathwater: Slum upgrading in Sub-Saharan Africa,” Environ. Plan. C Gov. Policy, vol. 25, no. 4, pp. 486–515, 2007. [CrossRef]
  30. S. Hossain, “The production of space in the negotiation of water and electricity supply in a bosti of Dhaka,” Habitat Int., vol. 36, no. 1, pp. 68–77, Jan. 2012. [CrossRef]
  31. S. Gulyani, D. Talukdar, and R. M. Kariuki, “Universal (non)service? Water markets, household demand and the poor in urban Kenya,” Urban Stud., vol. 42, no. 8, pp. 1247–1274, 2005. [CrossRef]
  32. S. L. Murthy, “Land security and the challenges of realizing the human right to water and sanitation in the slums of Mumbai, India,” Health Hum. Rights, vol. 14, no. 2, pp. 61–73, 2012, [Online]. Available: https://www.jstor.org/stable/40277691.
  33. H. De Soto and H. P. Diaz, “The mystery of capital. Why capitalism triumphs in the West and fails everywhere else,” Canadian Journal of Latin American & Caribbean Studies, vol. 27, no. 53. 2002.
  34. E. Duflo, S. Galiani, and M. Mobarak, “Improving Access to Urban Services for the Poor,” Abdul Latif Jamelle Poverty Action Lab Rep., no. October, pp. 1–44, 2012, [Online]. Available: https://www.povertyactionlab.org/sites/default/files/publications/USI Review Paper.pdf.
  35. M. O. Asibey, M. Poku-Boansi, and I. O. Adutwum, “Residential segregation of ethnic minorities and sustainable city development. Case of Kumasi, Ghana,” Cities, vol. 116, no. May 2020, p. 103297, Sep. 2021. [CrossRef]
  36. Ezeh et al., “The history, geography, and sociology of slums and the health problems of people who live in slums,” Lancet, vol. 389, no. 10068, pp. 547–558, Feb. 2017. [CrossRef]
  37. Sukmaniar, A. Kurniawan, and A. J. Pitoyo, “Hazard Level of Slum Areas in Palembang City,” in IOP Conference Series: Earth and Environmental Science, 2021, vol. 884, no. 1, pp. 1–10. [CrossRef]
  38. S. Fox, “The Political Economy of Slums: Theory and Evidence from Sub-Saharan Africa,” World Dev., vol. 54, pp. 191–203, 2014. [CrossRef]
  39. R. J. Lilford, O. Oyebode, D. Satterthwaite, G. J. Melendez-Torres, Y. F. Chen, and B. Mberu, “Improving the Health and Welfare of People who Live in Slums,” Lancet, vol. 389, no. 10068, pp. 559–570, 2017. [CrossRef]
  40. S. Croese, L. R. Cirolia, and N. Graham, “Towards Habitat III: Confronting the disjuncture between global policy and local practice on Africa’s ‘challenge of slums,’” Habitat Int., vol. 53, pp. 237–242, 2016. [CrossRef]
  41. S. Nakamura, “Does slum formalisation without title provision stimulate housing improvement? A case of slum declaration in Pune, India,” Urban Stud., vol. 54, no. 7, pp. 1715–1735, 2017. [CrossRef]
  42. M. Huchzermeyer, “Slum upgrading in Nairobi within the housing and basic services market: A housing rights concern,” J. Asian Afr. Stud., vol. 43, no. 1, pp. 19–39, 2008. [CrossRef]
  43. E. M. Bah, I. Faye, and Z. F. Geh, Housing market dynamics in Africa. Springer Nature, 2018. [CrossRef]
  44. P. Garau and E. D. Sclar, “Interim Report of the Task Force 8 on Improving the Lives of Slum Dwellers,” 2004.
  45. J. Quan, “Reflections on the Development Policy Environment For Land and Property Rights, 1997–2003,” 2003.
  46. K. Deinlnger and H. Binswanger, “The Evolution of the World Bank’s Land Policy: Principles, Experience, and Future Challenges,” World Bank Res. Obs., vol. 14, no. 2, pp. 247–276, Aug. 1999. [CrossRef]
  47. A. Kagawa, “Policy Effects and Tenure Security Perceptions of Peruvian Urban Land Tenure Regularisation Policy in the 1990s,” ESF/N-AERUS Int. Work., vol. 23, pp. 1–12, 2001.
  48. K. Deininger, Land policies for growth and poverty reduction, vol. 41, no. 09. 2004.
  49. K. Haldrup, “From Elitist Standards to Basic Needs – Diversified Strategies to Land Registration Serving Poverty Alleviation Objectives,” 2nd FIG Reg. Conf., pp. 1–16, 2003.
  50. A. Durand-Lasserve, E. Fernandes, G. Payne, and C. Rakodi, “Social and economic impacts of land titling programs in urban and periurban areas: A short review of the literature,” Urban L. Mark. Improv. L. Manag. Success. Urban., no. March, pp. 133–161, 2009. [CrossRef]
  51. E. M. Bassett, “The Persistence of the Commons: Economic Theory and Community Decision-Making on Land Tenure in Voi, Kenya,” African Stud. Q., vol. 9, no. 3, pp. 1–29, 2007.
  52. J. Lobo, M. Alberti, and M. Allen-Dumas, “Urban Science: Integrated Theory from the First Cities to Sustainable Metropolises,” SSRN Electron. J., no. January, 2020. [CrossRef]
  53. A. Azhar, H. Buttrey, and P. M. Ward, “‘Slumification’ of Consolidated Informal Settlements: A Largely Unseen Challenge,” Curr. Urban Stud., vol. 09, pp. 315–342, 2021. [CrossRef]
  54. M. Azpurua and K. dos Ramos, “A comparison of spatial interpolation methods for estimation of average electromagnetic field magnitude,” Prog. Electromagn. Res. M, vol. 14, no. January, pp. 135–145, 2010. [CrossRef]
  55. C. A. Nanda, A. L. Nugraha, and H. S. Firdaus, “Analisis Tingkat Daerah Rawan Kriminalitas Menggunakan Metode Kernel Density Di Wilayah Hukum Polrestabes Kota Semarang,” J. Geod. Undip, vol. 8, no. 4, pp. 50–58, 2019, [Online]. Available: https://ejournal3.undip.ac.id/index.php/geodesi/article/viewFile/25144/22354.
  56. B. W. Silverman, “Density Estimation for Statistics and Data Analysis,” Technometrics, vol. 29, no. 4, pp. 1–13, 2018. [CrossRef]
  57. D. A. Ghertner, “Analysis of new legal discourse behind Delhi’s slum demolitions,” Econ. Polit. Wkly., vol. 43, no. 20, pp. 57–66, 2008, [Online]. Available: https://www.jstor.org/stable/40277691.
  58. L. Feler and J. V. Henderson, “Exclusionary policies in urban development: Under-servicing migrant households in Brazilian cities,” J. Urban Econ., vol. 69, no. 3, pp. 253–272, 2011. [CrossRef]
  59. O. Gruebner et al., “A spatial epidemiological analysis of self-rated mental health in the slums of Dhaka,” Int. J. Health Geogr., vol. 10, no. 36, pp. 1–15, 2011. [CrossRef]
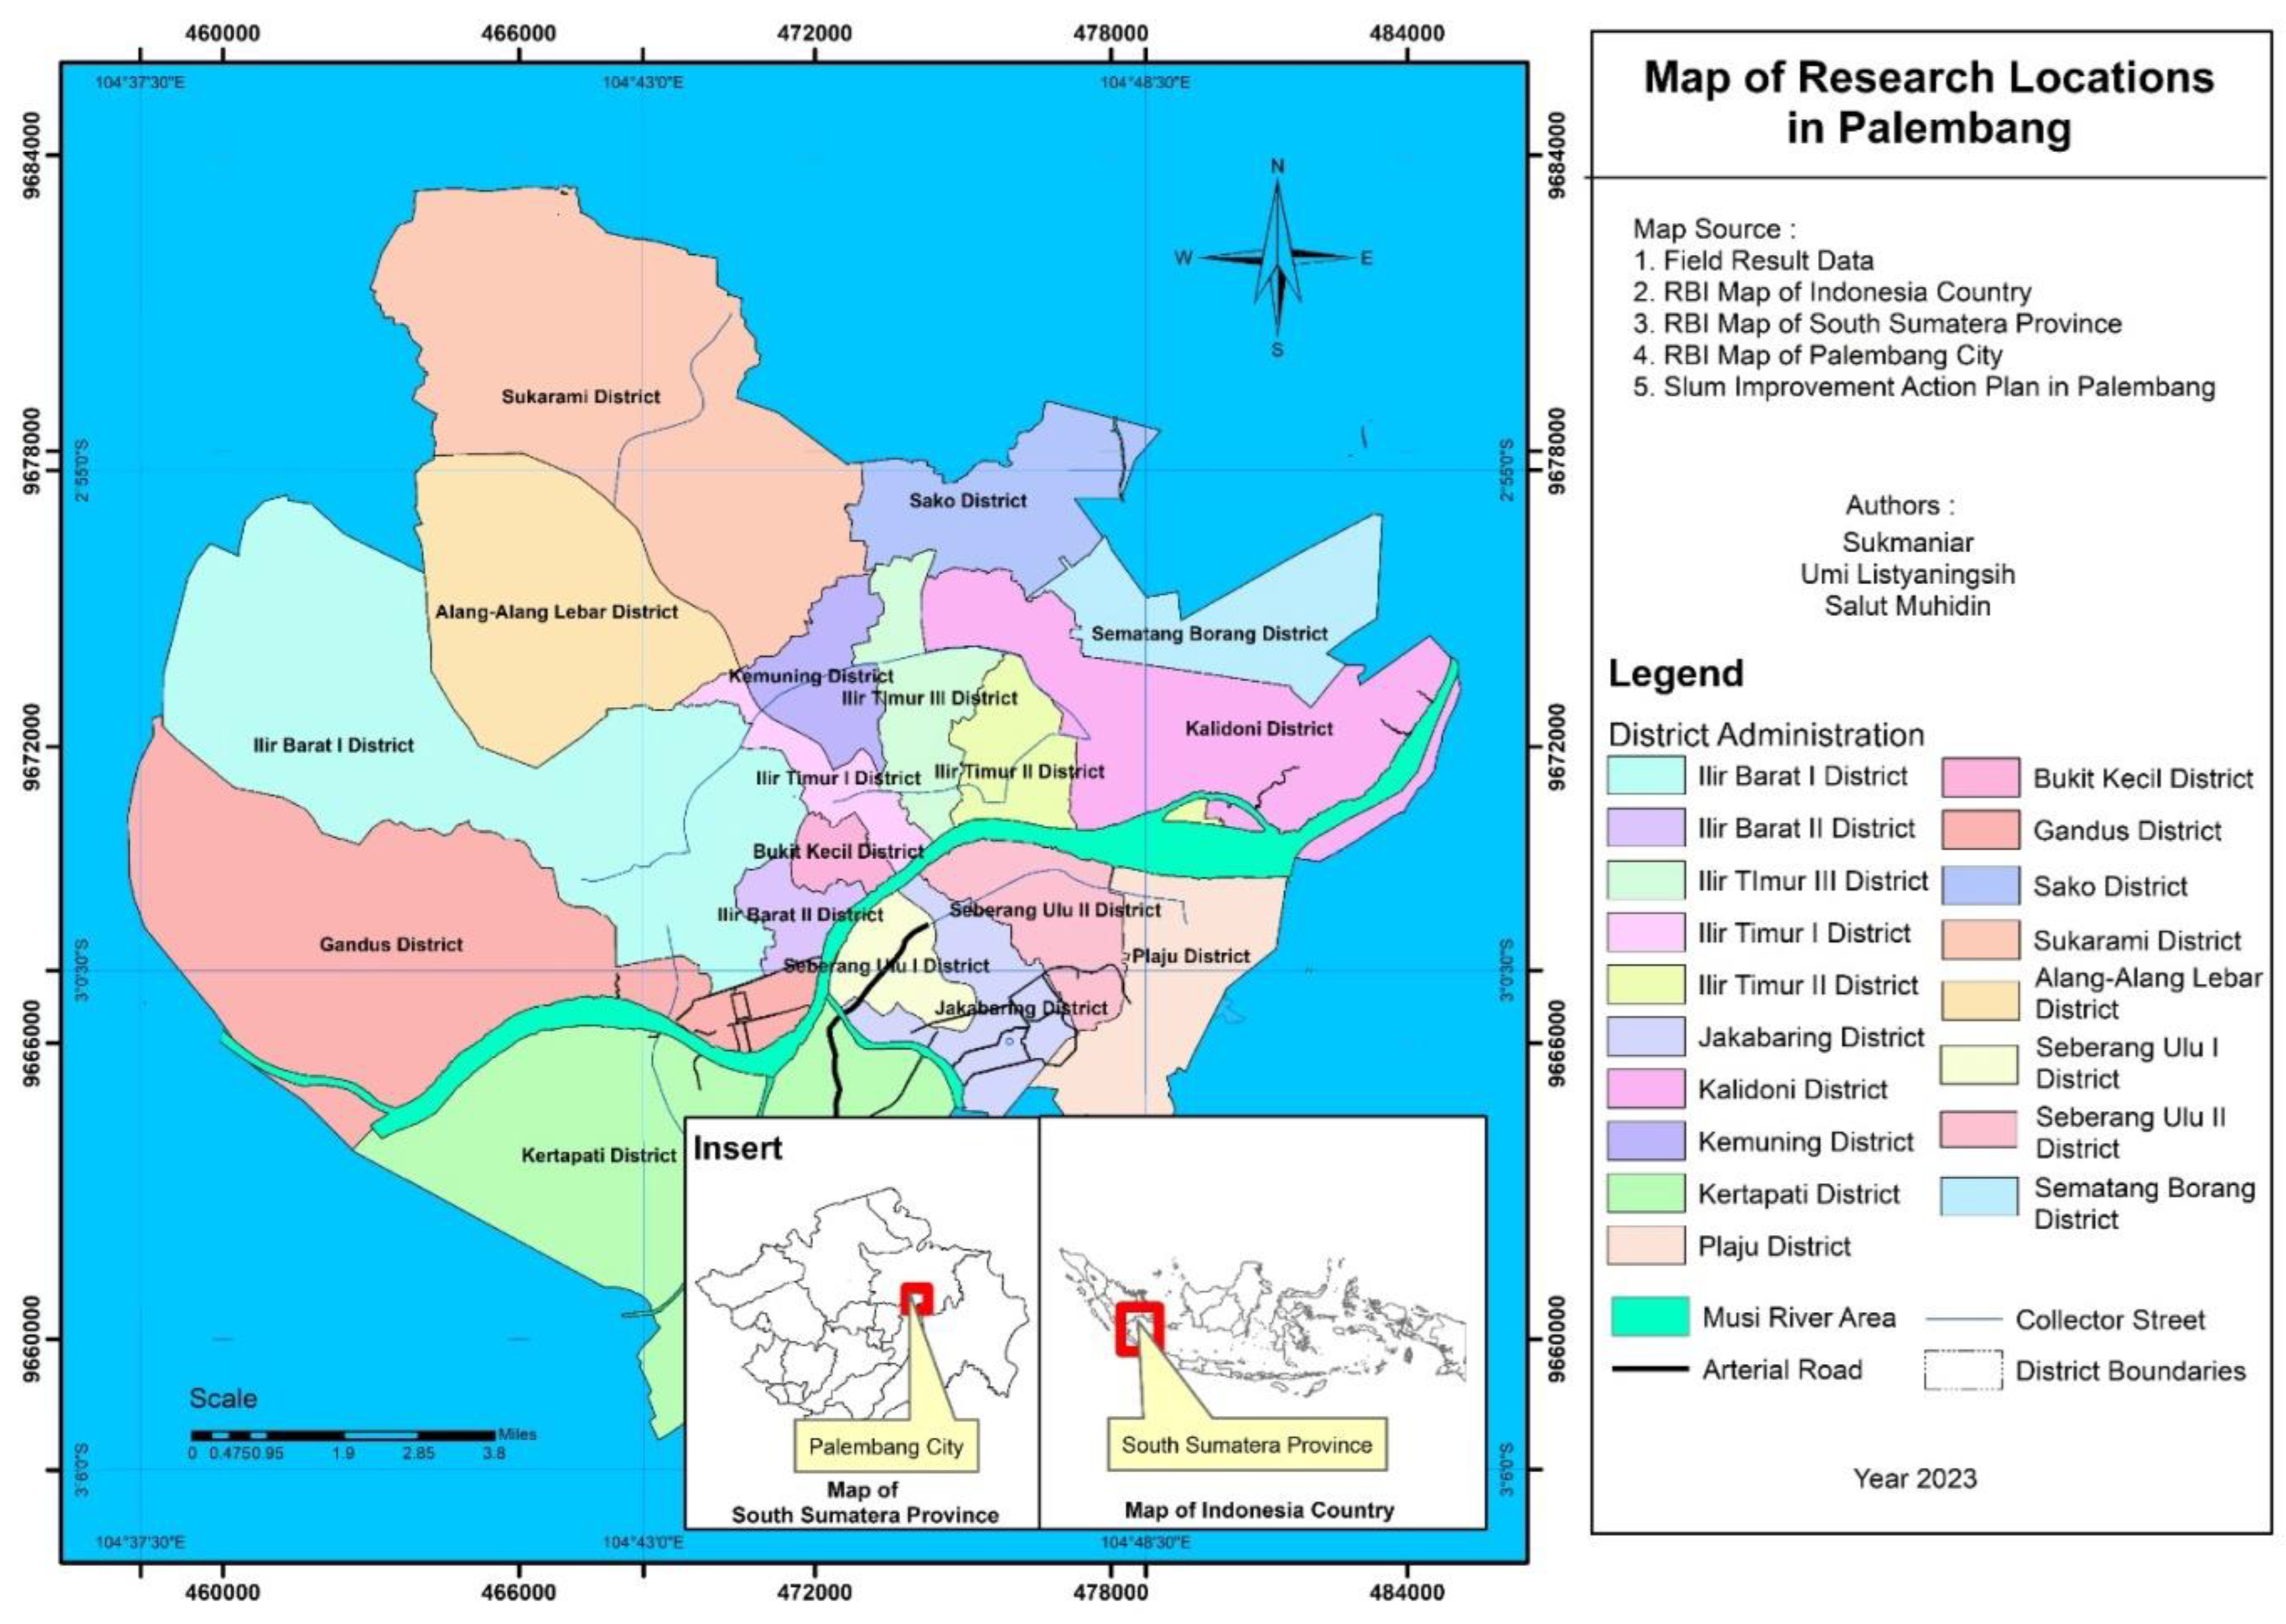
Figure 1. Study area.
Preprints 91010 g001
Figure 2. Research steps.
Preprints 91010 g002
Figure 3. Interpolation of the distribution of slum areas in Palembang City through Inverse Distance Weighted (IDW).
Preprints 91010 g003
Figure 4. The distribution pattern of slum areas in Palembang City through kernel density analysis.
Preprints 91010 g004
Figure 5. Spatial Data Modeling Analysis on the slum areas distribution in Palembang City.
Preprints 91010 g005
Table 1. Composition of slum respondents based on family income, migration status, and skills owned.
Family Income
(IDR)
Migra-tion Status Number of respondents (head of families) based on skills
(percentage)
Total
Construc-tion Martial arts Trade Farming Tailor Contract worker Iron welding Car welding Cooking Fishing Teaching Quran teaching Driving Car repair Care-taker Hair-dresser No
1. 500,000–1,000,000 Migrant 1
(0.26%)
- - - 1 (0.26%) - - - 2
(0.52%)
- - 1
(0.26%)
- - - - 11
(2.88%)
16
(4.18%)
Non-migrant - - - - - - - - 3
(0.78%)
- - - - - - - 11
(2.88%)
14
(3.66%)
>1,000,000–1,500,000 Migrant - - - - - - - - 2
(0.52%)
- - - 3
(0.78%)
- - - 6
(1.57%)
11
(2.87%)
Non-migrant - - 3
(0.78%)
2
(0.52%)
2
(0.52%)
- - - - - - - 4
(1.05%)
- - - 17
(4.55%)
28
(7.42%)
>1,500,000–2,000,000 Migrant - - - - - - 1
(0.26%)
- 1
(0.26%)
1
(0.26%)
1
(0.26%)
- 3
(0.78%)
- - - 25
(6.54%)
32
(8.36%)
Non-migrant 2
(0.52%)
- 3
(0.78%)
6
(1.57%)
- - - 1
(0.26%)
3
(0.78%)
1
(0.26%)
- - 4
(1.05%)
- - - 47
(12.30%)
67
(17.52%)
>2,000,000 Migrant - 1
(0.26%)
4
(1.05%)
- - - 1
(0.26%)
- 5
(1.31%)
4
(1.05%)
2
(0.52%)
- 7
(1.83%)
1
(0.26%)
1
(0.26%)
- 62
(16.23%)
88
(23.03%)
Non-migrant - 3
(0.78%)
5
(1.31%)
3
(0.78%)
- 1
(0.26%)
- 3
(0.78%)
3
(0.78%)
2
(0.52%)
1
(0.26%)
- 6
(1.57%)
4
(1.05%)
- 1
(0.26%)
94
(24.61%)
126
(32.96%)
Total 3
(0.78%)
4
(1.04%)
15
(3.92%)
11
(2.87%)
3
(0.78%)
1
(0.26%)
2
(0.52%)
4
(1.04%)
19
(4.95%)
8
(2.09%)
4
(1.04%)
1
(0.26%)
27
(7.06%)
5
(1.31%)
1
(0.26%)
1
(0.26%)
273
(71.56%)
382
(100.00%)
Disclaimer/Publisher’s Note: The statements, opinions and data contained in all publications are solely those of the individual author(s) and contributor(s) and not of MDPI and/or the editor(s). MDPI and/or the editor(s) disclaim responsibility for any injury to people or property resulting from any ideas, methods, instructions or products referred to in the content.
Copyright: This open access article is published under a Creative Commons CC BY 4.0 license, which permit the free download, distribution, and reuse, provided that the author and preprint are cited in any reuse.
Prerpints.org logo

Preprints.org is a free preprint server supported by MDPI in Basel, Switzerland.

Subscribe

© 2024 MDPI (Basel, Switzerland) unless otherwise stated