Submitted:
29 August 2023
Posted:
30 August 2023
You are already at the latest version
Abstract
Keywords:
1. Introduction
2. Materials and Methods
3. Results
4. Discussion
5. Conclusions
Author Contributions
Funding
Institutional Review Board Statement
Informed Consent Statement
Data Availability Statement
Acknowledgments
Conflicts of Interest
References
- Hess, P. Bonding, structure, and mechanical stability of 2D materials: the predictive power of the periodic table. Nanoscale Horiz. 2021, 6, 856–892. [Google Scholar] [CrossRef] [PubMed]
- Li, X.; Tao, L.; Chen, Z.; Fang, H.; Li, X.; Wang, X.; Xu, J.-B.; Zhu, H. Graphene and related two-dimensional materials: Structure-property relationships for electronics and optoelectronics. Applied Physics Reviews 2017, 4, 021306. [Google Scholar] [CrossRef]
- Geim, A.; Grigorieva, I. Van der Waals heterostructures. Nature 2013, 499, 419–425. [Google Scholar] [CrossRef] [PubMed]
- Butler, S. Z.; Hollen, S. M.; Cao, L.; Cui, Y.; Gupta, J. A.; Gutiérrez, H. R.; Heinz, T. F.; Hong, S. S.; Huang, J.; Ismach, A. F.; Johnston-Halperin, E.; Kuno, M.; Plashnitsa, V. V.; Robinson, R. D.; Ruoff, R. S.; Salahuddin, S.; Shan, J.; Shi, L.; Spencer, M. G.; Terrones, M.; Windl, W.; Goldberger, J. E. Progress, Challenges, and Opportunities in Two-Dimensional Materials Beyond Graphene. ACS Nano 2013, 7, 2898–2926. [Google Scholar] [CrossRef] [PubMed]
- Blundo, E.; Cappelluti, E.; Felici, M.; Pettinari, G.; Polimeni, A. Strain-tuning of the electronic, optical, and vibrational properties of two-dimensional crystals. Applied Physics Reviews 2021, 8, 021318. [Google Scholar] [CrossRef]
- Yang, S.; Chen, Y.; Jiang, C. Strain engineering of two-dimensional materials: Methods, properties, and applications. InfoMat 2021, 3, 397–420. [Google Scholar] [CrossRef]
- Dai, Z.; Liu, L.; Zhang, Z. Strain Engineering of 2D Materials: Issues and Opportunities at the Interface. Advanced Materials 2019, 31, 1805417. [Google Scholar] [CrossRef]
- Roldán, R.; Castellanos-Gomez, A.; Cappelluti, E.; Guinea, F. Strain engineering in semiconducting two-dimensional crystals. Journal of Physics: Condensed Matter 2015, 27, 313201. [Google Scholar] [CrossRef]
- Di Giorgio, C.; Blundo, E.; Pettinari, G.; Felici, M.; Bobba, F.; Polimeni, A. Mechanical, Elastic, and Adhesive Properties of Two-Dimensional Materials: From Straining Techniques to State-of-the-Art Local Probe Measurements. Advanced Materials Interfaces 2022, 9, 2102220. [Google Scholar] [CrossRef]
- Guinea, F.; Katsnelson, M.; Geim, A. Energy gaps ; a zero-field quantum Hall effect in graphene by strain engineering. Nature Physics 2010, 6, 30–33. [Google Scholar] [CrossRef]
- Blundo, E.; Felici, M.; Yildirim, T.; Pettinari, G.; Tedeschi, D.; Miriametro, A.; Liu, B.; Ma, W.; Lu, Y.; Polimeni, A. Evidence of the direct-to-indirect band gap transition in strained two-dimensional WS2, MoS2 and WSe2. Physical Review Research 2020, 2, 012024. [Google Scholar] [CrossRef]
- Frisenda, R.; Drüppel, M.; Schmidt, R.; Michaelis de Vasconcellos, S.; Perez de Lara, D.; Bratschitsch, R.; Rohlfing, M.; Castellanos-Gomez, A. Biaxial strain tuning of the optical properties of single-layer transition metal dichalcogenides. npj 2D Materials and Applications 2017, 1, 10. [Google Scholar] [CrossRef]
- Blundo, E.; Faria Junior, P. E.; Surrente, A.; Pettinari, G.; Prosnikov, M. A.; Olkowska-Pucko, K.; Zollner, K.; Woźniak, T.; Chaves, A.; Kazimierczuk, T.; Felici, M.; Babiński, A.; Molas, M. R.; Christianen, P. C. M.; Fabian, J.; Polimeni, A. Strain-Induced Exciton Hybridization in WS2 Monolayers Unveiled by Zeeman-Splitting Measurements. Physical Review Letters 2022, 129, 067402. [Google Scholar] [CrossRef]
- Li, F.; Shen, T.; Xu, L.; Hu, C.; Qi, J. Strain Improving the Performance of a Flexible Monolayer MoS2 Photodetector. Advanced Electronic Materials 2019, 5, 1900803. [Google Scholar] [CrossRef]
- Datye, I. M.; Daus, A.; Grady, R. W.; Brenner, K.; Vaziri, S.; Pop, E. Strain-Enhanced Mobility of Monolayer MoS2. Nano Letters 2022, 22, 8052–8059. [Google Scholar] [CrossRef]
- He, K.; Poole, C.; Mak, K. F.; Shan, J. Experimental Demonstration of Continuous Electronic Structure Tuning via Strain in Atomically Thin MoS2. Nano Letters 2013, 13, 2931–2936. [Google Scholar] [CrossRef]
- Scalise, E.; Houssa, M.; Pourtois, G.; Afanas’ev, V.; Stesmans, A. Strain-induced semiconductor to metal transition in the two-dimensional honeycomb structure of MoS2. Nano Research 2012, 5, 43–48. [Google Scholar] [CrossRef]
- Johari, P.; Shenoy, V. B. Tuning the Electronic Properties of Semiconducting Transition Metal Dichalcogenides by Applying Mechanical Strains. ACS Nano 2012, 6, 5449–5456. [Google Scholar] [CrossRef]
- Guzman, D. M.; Strachan, A. Role of strain on electronic and mechanical response of semiconducting transition-metal dichalcogenide monolayers: An ab-initio study. Journal of Applied Physics 2014, 115, 243701. [Google Scholar] [CrossRef]
- Scalise, E.; Houssa, M.; Pourtois, G.; Afanasev, V.V.; Stesmans, A. First-principles study of strained 2D MoS2. Physica E: Low-dimensional Systems and Nanostructures 2014, 56, 416–421. [Google Scholar] [CrossRef]
- Nguyen, C. V.; Hieu, N. N. Effect of biaxial strain and external electric field on electronic properties of MoS2 monolayer: A first-principle study. Chemical Physics 2016, 468, 9–14. [Google Scholar] [CrossRef]
- Zollner, K.; Junior, P. E. F.; Fabian, J. Strain-tunable orbital, spin-orbit, and optical properties of monolayer transition-metal dichalcogenides. Physical Review B 2019, 100, 195126. [Google Scholar] [CrossRef]
- Lee, C.; Wei, X.; Kysar, J. W.; Hone, J. Measurement of the Elastic Properties and Intrinsic Strength of Monolayer Graphene. Science 2008, 321, 385–388. [Google Scholar] [CrossRef] [PubMed]
- Bertolazzi, S.; Brivio, J.; Kis, A. Stretching and Breaking of Ultrathin MoS2. ACS Nano 2011, 5, 9703–9709. [Google Scholar] [CrossRef]
- Deng, S.; Sumant, A. V.; Berry, V. Strain engineering in two-dimensional nanomaterials beyond graphene. Nano Today 2018, 22, 14–35. [Google Scholar] [CrossRef]
- Xiao, D.; Liu, G.-B.; Feng, W.; Xu, X.; Yao, W. Coupled Spin and Valley Physics in Monolayers of MoS2 and Other Group-VI Dichalcogenides. Physical Review Letters 2012, 108, 196802. [Google Scholar] [CrossRef]
- Amorim, B.; Cortijo, A.; de Juan, F.; Grushin, A. G.; Guinea, F.; Gutiérrez-Rubio, A.; Ochoa, H.; Parente, V.; Roldán, R.; San-Jose, P.; Schiefele, J.; Sturla, M.; Vozmediano, M. A. H. Novel effects of strains in graphene and other two dimensional materials. Physics Reports 2016, 617, 1–54. [Google Scholar] [CrossRef]
- Lloyd, D.; Liu, X.; Christopher, J. W.; Cantley, L.; Wadehra, A.; Kim, B. L.; Goldberg, B. B.; Swan, A. K.; Bunch, J. S. Band Gap Engineering with Ultralarge Biaxial Strains in Suspended Monolayer MoS2. Nano Letters 2016, 16, 5836–5841. [Google Scholar] [CrossRef]
- - Lloyd, D.; Liu, X.; Christopher, J. W.; Cantley, L.; Wadehra, A.; Kim, B. L.; Goldberg, B. B.; Swan, A. K.; Bunch, J. S. Correction to Band Gap Engineering with Ultralarge Biaxial Strains in Suspended Monolayer MoS2. Nano Letters 2019, 19, 7548–7548. [CrossRef]
- Li, H.; Tsai, C.; Koh, A. L.; Cai, L.; Contryman, A. W.; Fragapane, A. H.; Zhao, J.; Han, H. S.; Manoharan, H. C.; Abild-Pedersen, F.; Nørskov, J. K.; Zheng, X. Activating and optimizing MoS2 basal planes for hydrogen evolution through the formation of strained sulphur vacancies. Nature Materials 2016, 15, 48–53. [Google Scholar] [CrossRef]
- Chaste, J.; Missaoui, A.; Huang, S.; Henck, H.; Ben Aziza, Z.; Ferlazzo, L.; Naylor, C.; Balan, A.; Johnson, A. T. C. Jr.; Braive, R.; Ouerghi, A. Intrinsic Properties of Suspended MoS2 on SiO2/Si Pillar Arrays for Nanomechanics and Optics. ACS Nano 2018, 12, 3235–3242. [Google Scholar] [CrossRef]
- Xie, S.; Tu, L.; Han, Y.; Huang, L.; Kang, K.; Lao, K. U.; Poddar, P.; Park, C.; Muller, D. A.; Distasio, R. A.; Park, J. Coherent, atomically thin transition-metal dichalcogenide superlattices with engineered strain. Science 2018, 359, 1131–1136. [Google Scholar] [CrossRef] [PubMed]
- Blundo, E.; Di Giorgio, C.; Pettinari, G.; Yildirim, T.; Felici, M.; Lu, Y.; Bobba, F.; Polimeni, A. Engineered Creation of Periodic Giant, Nonuniform Strains in MoS2 Monolayers. Advanced Materials Interfaces 2020, 7, 2000621. [Google Scholar] [CrossRef]
- Conley, H. J.; Wang, B.; Ziegler, J. I.; Haglund, R. F. Jr.; Pantelides, S. T.; Bolotin, K. I. Bandgap Engineering of Strained Monolayer and Bilayer MoS2. Nano Letters 2013, 13, 3626–3630. [Google Scholar] [CrossRef] [PubMed]
- Tedeschi, D.; Blundo, E.; Felici, M.; Pettinari, G.; Liu, B.; Yildrim, T.; Petroni, E.; Zhang, C.; Zhu, Y.; Sennato, S.; Lu, Y.; Polimeni, A. Controlled Micro/Nanodome Formation in Proton-Irradiated Bulk Transition-Metal Dichalcogenides. Advanced Materials 2019, 31, 1903795. [Google Scholar] [CrossRef] [PubMed]
- Pimenta, M. A.; del Corro, E.; Carvalho, B. R.; Fantini, C.; Malard, L. M. Comparative Study of Raman Spectroscopy in Graphene and MoS2-type Transition Metal Dichalcogenides. Accounts of Chemical Research 2015, 48, 41–47. [Google Scholar] [CrossRef] [PubMed]
- Zhang, X.; Qiao, X.-F.; Shi, W.; Wu, J.-B.; Jiang, D.-S.; Tan, P.-H. Phonon and Raman scattering of two-dimensional transition metal dichalcogenides from monolayer, multilayer to bulk material. Chemical Society Reviews 2015, 44, 2757–2785. [Google Scholar] [CrossRef]
- Li, H.; Zhang, Q.; Yap, C.C.R.; Tay, B.K.; Edwin, T.H.T.; Olivier, A.; Baillargeat, D. From Bulk to Monolayer MoS2: Evolution of Raman Scattering. Advanced Functional Materials 2012, 22, 1385–1390. [Google Scholar] [CrossRef]
- R Saito, R.; Tatsumi, Y.; Huang, S.; Ling, X.; Dresselhaus, M.S. Raman spectroscopy of transition metal dichalcogenides. Journal of Physics: Condensed Matter 2016, 28, 353002. [Google Scholar] [CrossRef]
- Carvalho, B. R.; Wang, Y.; Mignuzzi, S.; Roy, D.; Terrones, M.; Fantini, C.; Crespi, V. H.; Malard, L. M.; Pimenta, M. A. Intervalley scattering by acoustic phonons in two-dimensional MoS2 revealed by double-resonance Raman spectroscopy. Nature Communications 2017, 8, 14670. [Google Scholar] [CrossRef]
- Carvalho, B. R.; Malard, L. M.; Alves, J. M.; Fantini, C.; Pimenta, M. A. Symmetry-Dependent Exciton-Phonon Coupling in 2D and Bulk MoS2 Observed by Resonance Raman Scattering. Physical Review Letters 2015, 114, 136403. [Google Scholar] [CrossRef]
- Carvalho, B. R.; Malard, L. M.; Alves, J. M.; Fantini, C.; Pimenta, M. A. Erratum: Symmetry-Dependent Exciton-Phonon Coupling in 2D and Bulk MoS2 Observed by Resonance Raman Scattering [Phys. Rev. Lett. 114, 136403 (2015)]. Physical Review Letters 2016, 116, 089904. [Google Scholar] [CrossRef]


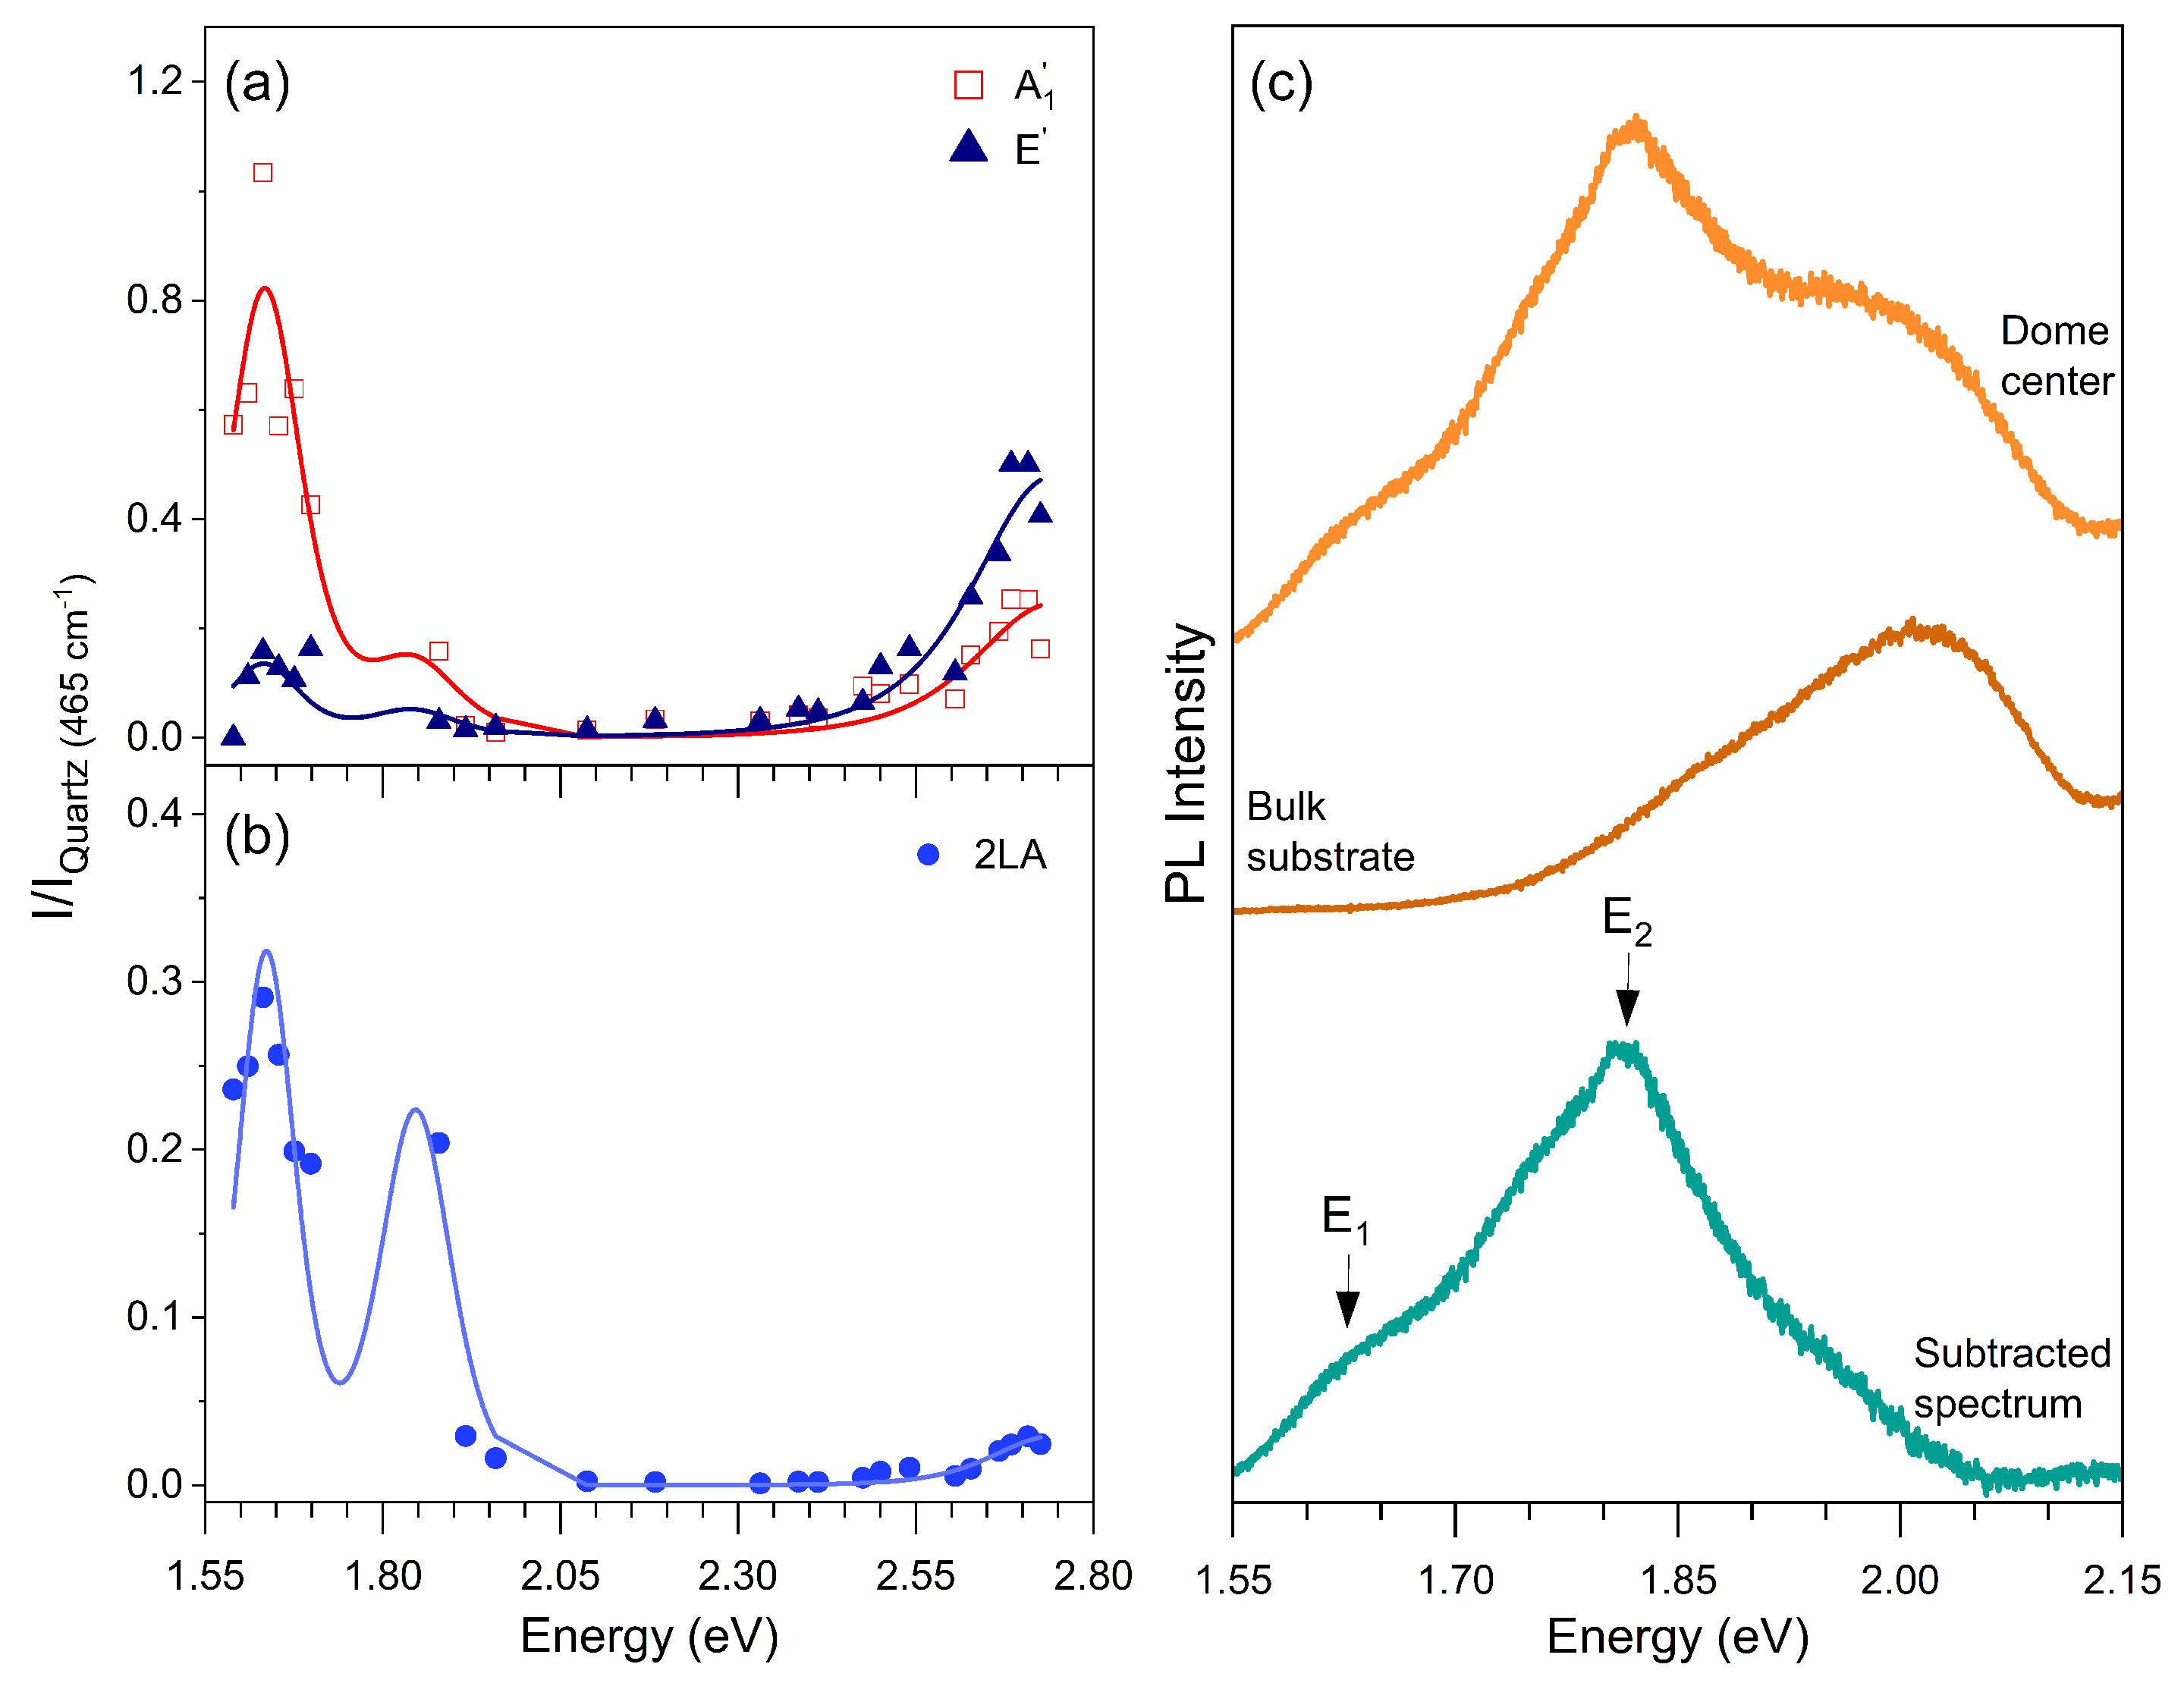
| Resonance | Energy (eV) | Damping (eV) |
|---|---|---|
| E1 | 1.61 ± 0.01 | 0.09 |
| E2 | 1.82 ± 0.05 | 0.11 |
| E3 | 2.72 ± 0.05 | 0.19 |
Disclaimer/Publisher’s Note: The statements, opinions and data contained in all publications are solely those of the individual author(s) and contributor(s) and not of MDPI and/or the editor(s). MDPI and/or the editor(s) disclaim responsibility for any injury to people or property resulting from any ideas, methods, instructions or products referred to in the content. |
© 2023 by the authors. Licensee MDPI, Basel, Switzerland. This article is an open access article distributed under the terms and conditions of the Creative Commons Attribution (CC BY) license (http://creativecommons.org/licenses/by/4.0/).


