Submitted:
29 August 2023
Posted:
30 August 2023
You are already at the latest version
Abstract
Current stock market forecasting methods encompass fundamental, technical, emotional, and bargaining factors. Predominantly, price prediction hinges on order volume and price, although correlating these two within existing models proves challenging. This study employs Cycle Generative Adversarial Network (Cycle GAN) to unravel the intricate price-volume relationship, combining it with Bollinger Bands for trading signal analysis, overcoming hurdles in short-term forecasting prevalent in numerical analysis and AI. Focusing on TSMC (2330.TW) stock price, the research leverages Cycle GAN in deep learning to master the price-volume nexus, juxtaposed with LSTM and RNN. Historical TSMC closing prices and transaction counts are model inputs, scrutinizing their interconnectedness for predictions. This innovative approach aligns stock price, volume, market value, taxes, and prior changes via system engineering. By intertwining Bollinger Bands with stock price forecasts, trading signals are distilled, factoring in extended index %b for a comprehensive market picture.
Keywords:
deep learning
; system engineering
; stock price forecasting
; aggregate dynamic behavior
; generative adversarial network
1. Introduction
Th TSMC’s stock accounts for nearly one-third of the value of the Taiwan stock market. Its annual capital expenditure accounts for 13% of private investment and with annual output value accounts for about 5% of Taiwan GDP. TSMC supports the semiconductor industry chain to enable downstream manufacturers and other small and medium-sized enterprises. As TSMC grows, it will increase the domestic output value of NT$1.999 billion and create 364,000 job opportunities, which indirectly has a positive impact on important economic indicators such as CPI. It can be said to be the pillar of Taiwan’s economy and the main target of Taiwan’s investment community. The predominance of TSMC’s equity structure is retained by investment institutions, and individual holdings only account for less than 10%. Due to the lack of a systematic and easy to use investment index to declare, retail investors often experience obstacle such as capital and information asymmetry when investing, they may miss a great investment opportunity.
The development of deep learning has improved quickly in recent years, and its analysis results are more objective than human subjective judgments. Neural networks currently used in stock price forecasting mostly are Long Short-Term Memory (LSTM) architectures, generally examine the volume and price of individual stocks independently. Previous studies have indicated that the connection between quantity and price is a particular relationship that has a joint effect. However, mathematical models based on statistics can only be achieve by Correlation Coefficient, and variables with high covariance are considered independent variables if researchers just recognized a result that ultimately leads to failure or incompleteness (Ying 1966; Karpoff 1987). This investigation takes TSMC stock as an example using deep learning to study the relationship between stock price and volume by apply it to the technical analysis of stock prices, and consolidate the forecast results with technical analysis tools to contribute a complete set of investment reference tools to make investment more confidence in high unit price stocks.
The main research questions of this study are as follows:
1. Generate the results by using Cycle Generative Adversarial Network, proving that this deep learning model can learn the stock price aggregation relationship.
2. Using the above results, compare the accuracy of Long Short Term Memory and residual neural network models for stock price prediction results.
3. Predict short-term stock prices by establishing a system engineering integrated with Bollinger Bands.
2. Reference review and discussion
1. The relationship between volume and price
The link between volume and price in the stock market identify the relationship between the trading volume per unit time of a stock and the closing price of the stock. The same direction of volume and price means that the transaction volume is certainly correlated with the magnitude of price changes (Ying 1966; Karpoff 1987)-the stock price rises and the transaction volume increases, which means that the follow-up market is optimistic; the stock price declines and the volume shrinks, indicating that sellers are reluctant to sell and are optimistic about the future market. The deviation of volume and price means that the stock price and the trading volume show the opposite trend (Sheu et al. 1998)-the stock price rises but the trading volume decreases or stays the same, illustrates that individual stocks are not recommended by investors and the upward trend is difficult to preserve; the stock price declines and the transaction is locked. An boost in volume can be seen as an indicator of a downturn in the market outlook. Stockholder are not encouraged about the market perspective and sell off. Regardless of whether the volume and price are in the same direction or the volume and price deviate, they have a aggregate effect. Ying (1966) concludes that a model that only attentions at stock prices and trading volume will ultimately produce wrong or incomplete results.
2. Cycle Generative Adversarial Network (Cycle GAN)
The Generative Adversarial Network (GAN) is a two-classifier (Ian et al. 2014) that adoption an adversarial process to develop a model framework, consisting of a Generative model and a Discriminator model. The generative model obtain random input values and can be transformed into an image through a deconvolutional neural network; the discriminant model is a discriminator used to discriminate whether the input image is a real image provided by the training data set or is the image created by the generative model. The ultimate goal of GAN is to provoke a loss (Loss), which makes it arduous to distinguish between the generated image of the model and the real image; also because all computer graphics (Graph) are optimized for the target, GAN is exceptionally sufficient for image generation tasks.
However, the transformation between image and image is a kind of visual and graphic dispute. GAN needs to apply a training set with paired images to learn the mapping between the input image and the target image. However, in some effort, there is no training data that can be used for pairing. In order to solve this difficulty, a recurrent generation adversarial network (Zhu et al., 2017) came into being. The image is converted from domain X to domain Y. Two prerequisites must be met to use the Cycle Generative Adversarial Network: (1) the unpair of the domain X and the domain Y (unpair) is not provided; (2) it is assumed that there is a potential relationship between the domains of X and Y.
For independent confrontation targets that are difficult to optimize, it will cause a crash during training-that is, all images are mapped to the same output image, resulting in the failure of optimization. It is assumed that there are two converters G(X) → Y and F(Y) → X in the structure of the Cycle Generative Adversarial Network, and G and F are inverted to each other, and bijections are achieved; by simultaneously training the mapping G and F, and add cycle consistency loss to encourage F(G(x)) ≈ x and G(F(y)) ≈ y. Combining this loss and the confrontation loss on the fields X and Y can achieve the conversion between unpaired images and images.
3. Residual Neural Network (Residual Neural Network, ResNet)
Deep neural networks have two main issues. One is Gradient Vanishing-when the gradient is too small, it will cause Back Propagation to make the model unable to converge to the optimal value. The second is the gradient degradation- the gradient cannot be backpropagated and the error accumulates, so that the deeper the network, the higher the error value. The Residual Block (He et al., 2016) (Figure 1) is proposed in the Residual Neural Network. In addition to having the same architecture as the original neural network, there is also a shortcut connection. Assuming that the originally expected output is H(x), the original neural network output of this layer is F(x). If H(x) = F(x)+x, it can be verified that the output of this residual module H(x) can make the overall optimization of the neural network better.
4. Long Short-Term Memory (LSTM)
When training with back propagation while Recurrent Neural Networks (Recurrent Neural Networks, RNN) deal with hidden states that change over time, it encounters gradient vanishing and gradient explosion, which makes it impossible to process time series data, the Long-term Dependency problem. To solve this problem, the Long Short-Term Memory model (Hochreiter & Schmidhuber 1997) added a gate mechanism to the block of the recurrent neural network, which can memorize the input value of a variable length of time and adjust the model input and output values for processing Long-term dependency data.
5. System engineering and Dynamic Behavior
Seely (1972) segregates system engineering modules into three basic types: Physical, Analytical and Descriptive. The most traditional and distinquished module is the physical system. The advantage of physical system is, it can be verified by experiment, but its cost is relatively high; the descriptive model is to build a model with text and pictures for decision-making; while the analytical model applys mathematics to present the peculiarity of the system, it is usually presented in the form of simultaneous equations. This research uses several components of the analytical module:
1. Mass: When considering Newton’s second law of motion, the mass M is defined by the formula.
Formula: , is the speed, is the differential, is the time, is the acceleration.
2. Damper (friction force): There are three different important mechanisms of friction: static, coulomb and viscous. This study uses static friction. Static friction is directly related to motion, and is the state of motion initiated by the contact between two surfaces.
Formula: , is the friction constant, and is the speed.
3. Spring (spring force) A spring is an element that stores mechanical potential energy through elastic deformation.
Formula: , is the spring constant, is the speed, is the differential, and is the time.
6. Bollinger Bands
Bollinger Bands (BBands), also known as Bollinger Bands, Bollinger Bands, Bollinger Channels or Brigger Channels, are technical analysis tools originated by John Bollinger. The application incorporates the concepts of moving average and standard deviation, and its basic form is a strip channel composed of three bands (one for the middle band and one for the upper band and one for the lower band). The middle band is the average cost of the stock price, and the upper band and the lower band can be regarded as the resistance and support of the stock price, respectively.
1. Bollinger band definition
[1] Middle band
The formula of the simple moving average for N time period is:
[2] Upper band
Standard deviation of the middle band + K × N time period
[3] Lower band
Middle track-standard deviation of K × N time period
1. Extended index──%b index
The position of the closing price in the Bollinger Bands is presented in digital form as a key indicator for trading decisions. The formula is:
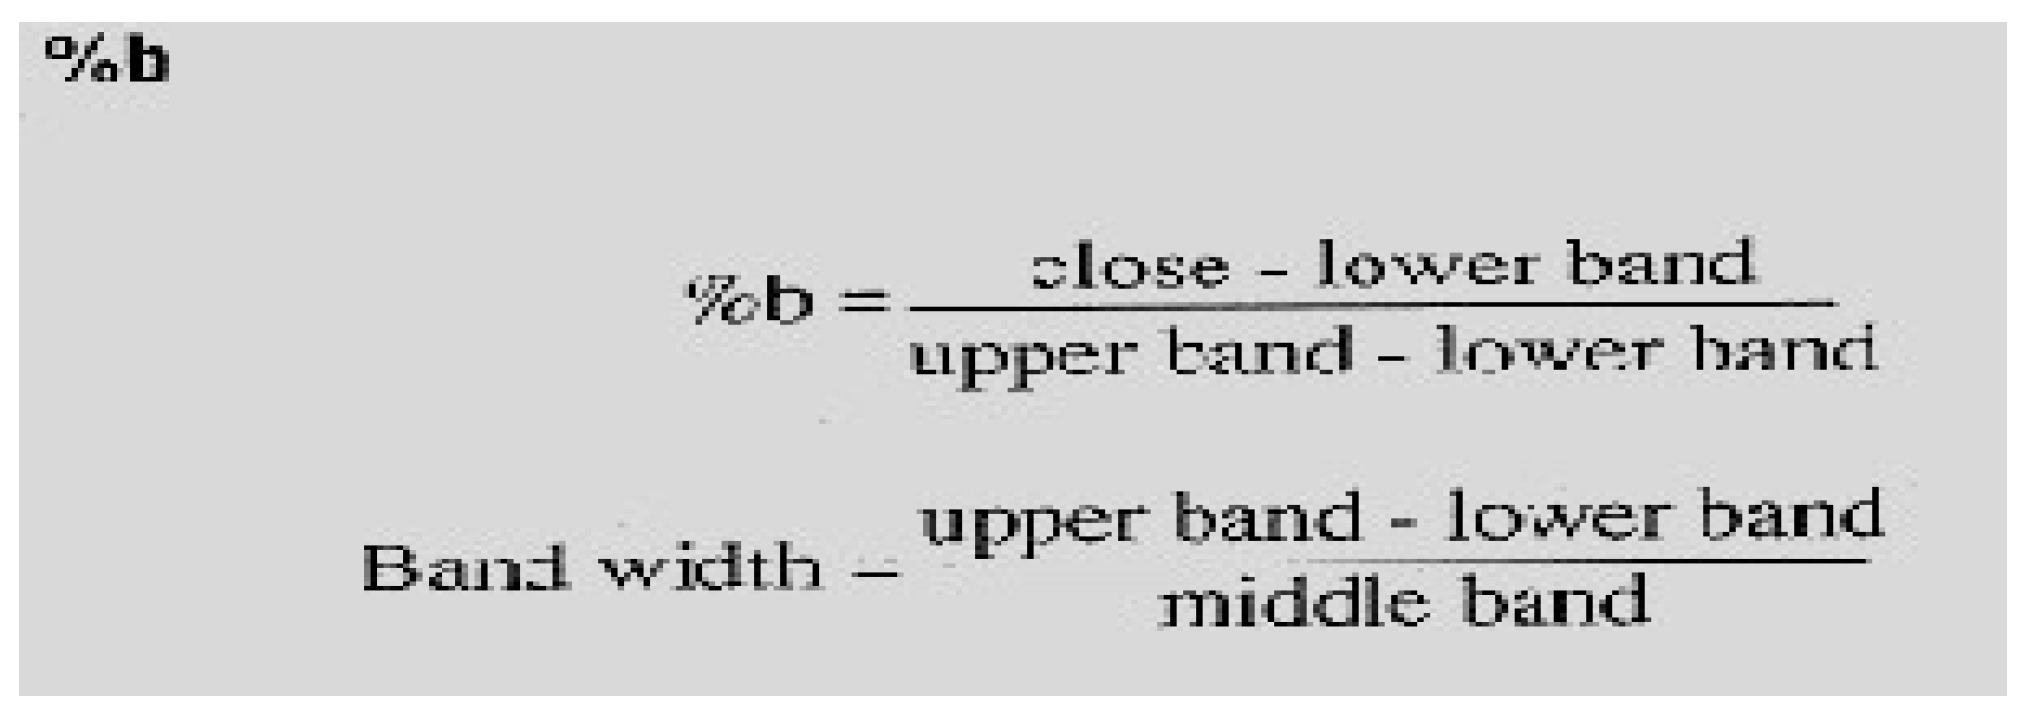
Since the closing price will oscillate on the upper and lower band, the amplitude is even greater than the band range (0~1), so the %b value has no upper and lower limits. When the trend breaks upward and the closing price falls above the upper band, the %b value is> 1. When the trend breaks downward and the closing price falls below the lower band, the %b value <0.
Observation and analysis of the “%b indicator” can provide investment references, and make trading decisions based on the strength and weakness of the indicator.
7. F1 score is a way to evaluate the accuracy of the test. It takes into account the accuracy and recall in the test to calculate this score.

Table 1.
Confusion Matrix.
| The model predicts a rise | The model predicts a fall | |
|---|---|---|
| The actual stock price is up | True Postive | False Negative |
| The actual stock price is down | False Postive | True Negative |
Recall = TP / (TP+FN), the recognition ability of this model for positive samples, the higher the score, the stronger the recognition ability.
Precision = TP / (TP+FP) , the proportion of positive samples in the correct classification of this model. If it is higher than 0.5, it means that it has a strong ability to distinguish rising, and if it is lower than 0.5, it means that it has a strong ability to distinguish falling.
F1 Score = 2 * Precision * Recall / (Precision + Recall), F1 is the combination between the two, the closer to 1, the better the classification effect of this model.
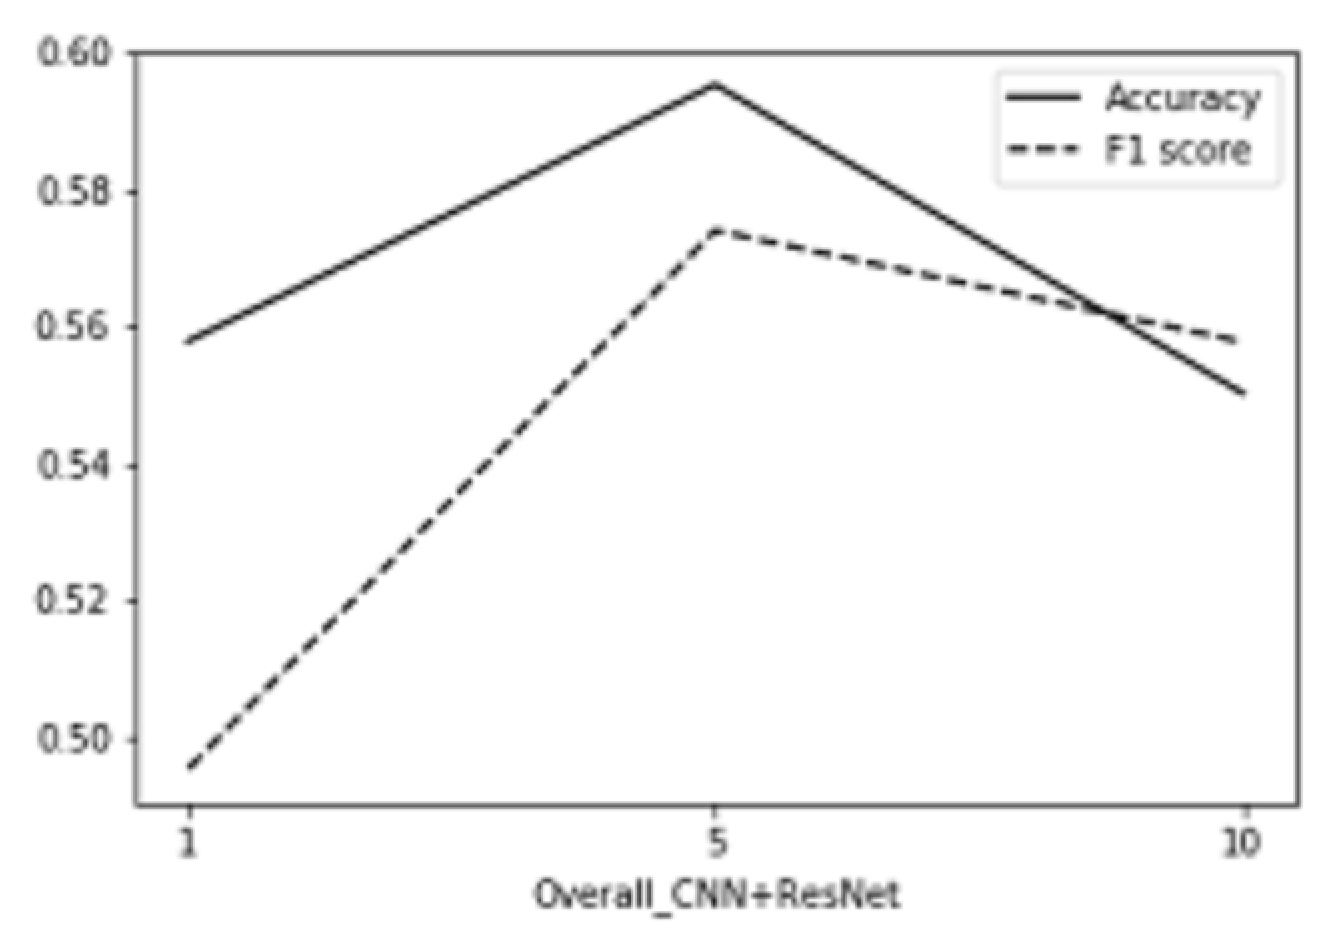
Figure Overall CNN+RESNET training results
8. Imaging time series by GADF
In linear algebra, the Gramian matrix, or Gram matrix, of a set of vectors x1, _ _ _ , xN in an
inner product space is the Hermitian matrix of inner products, whose entries are given by
Gij = (xi, xj) (i, j 2 N),
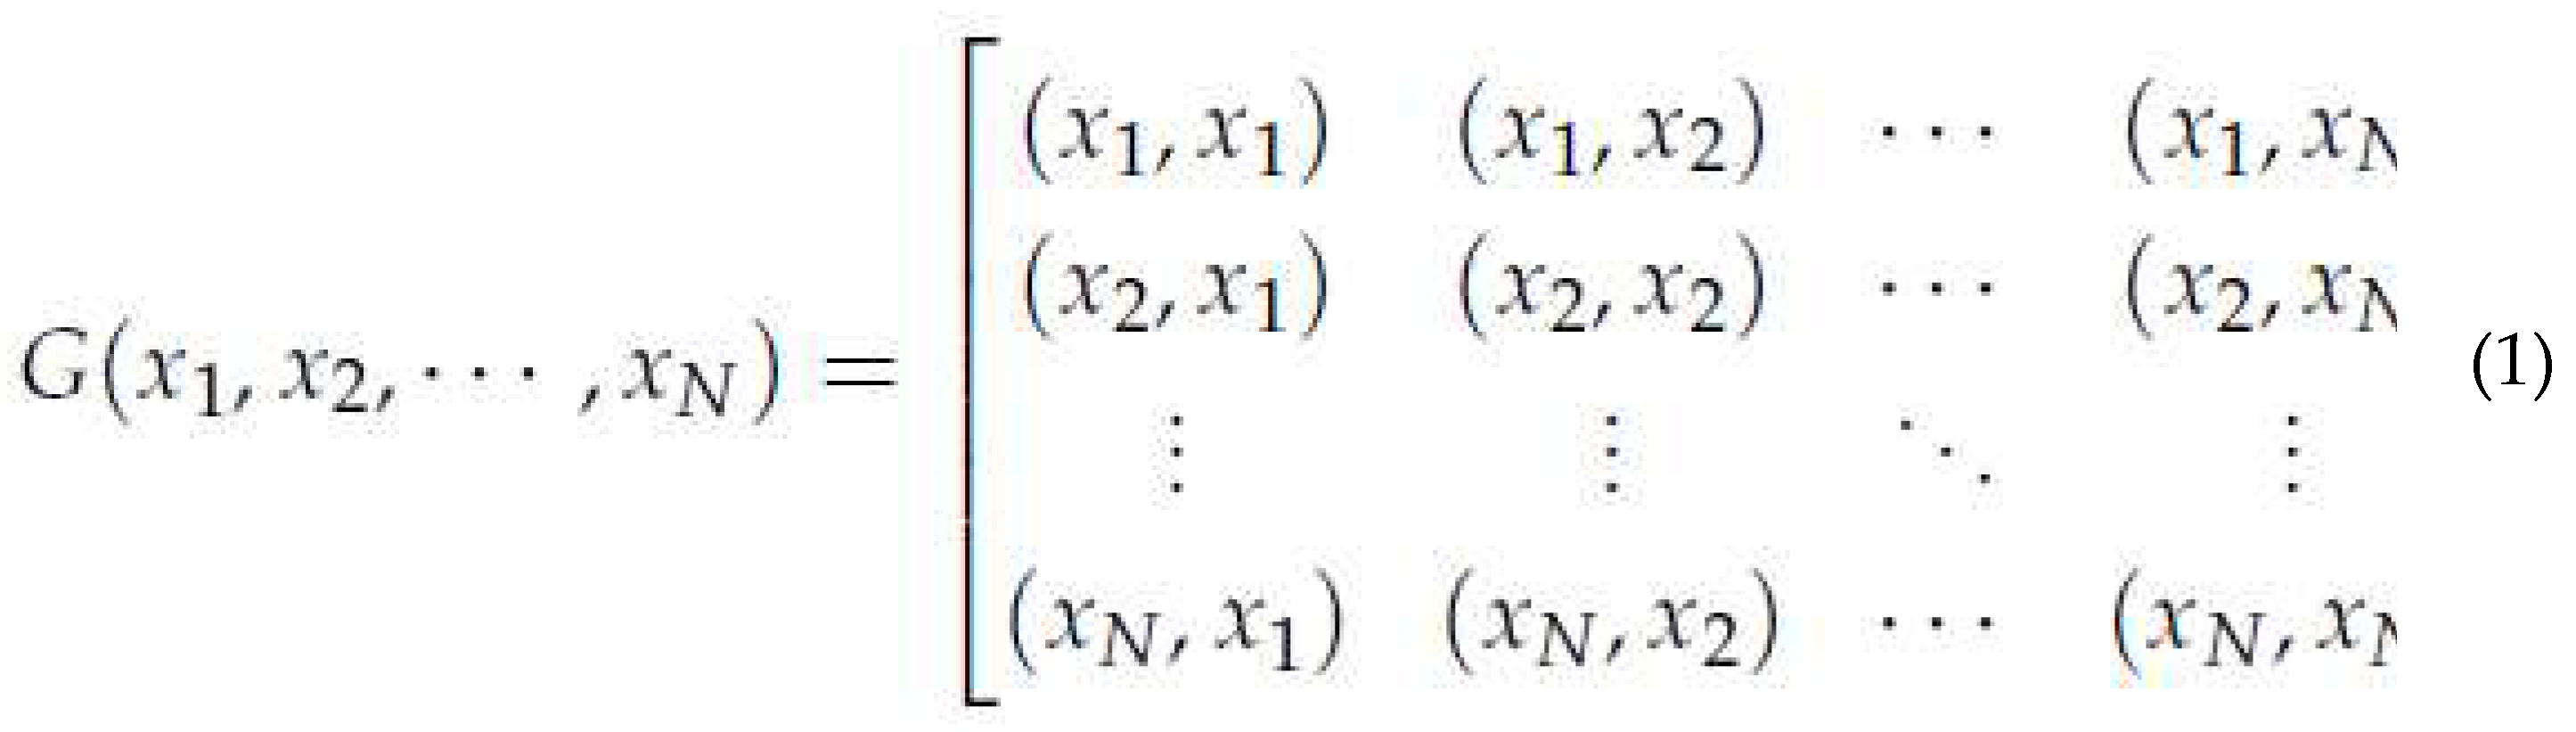
where (xi, xj) is the inner product of xi and xj.
1
Given a time series data X, we rescale the time series data X so that all the values in X will
fall in the interval [1, 1],
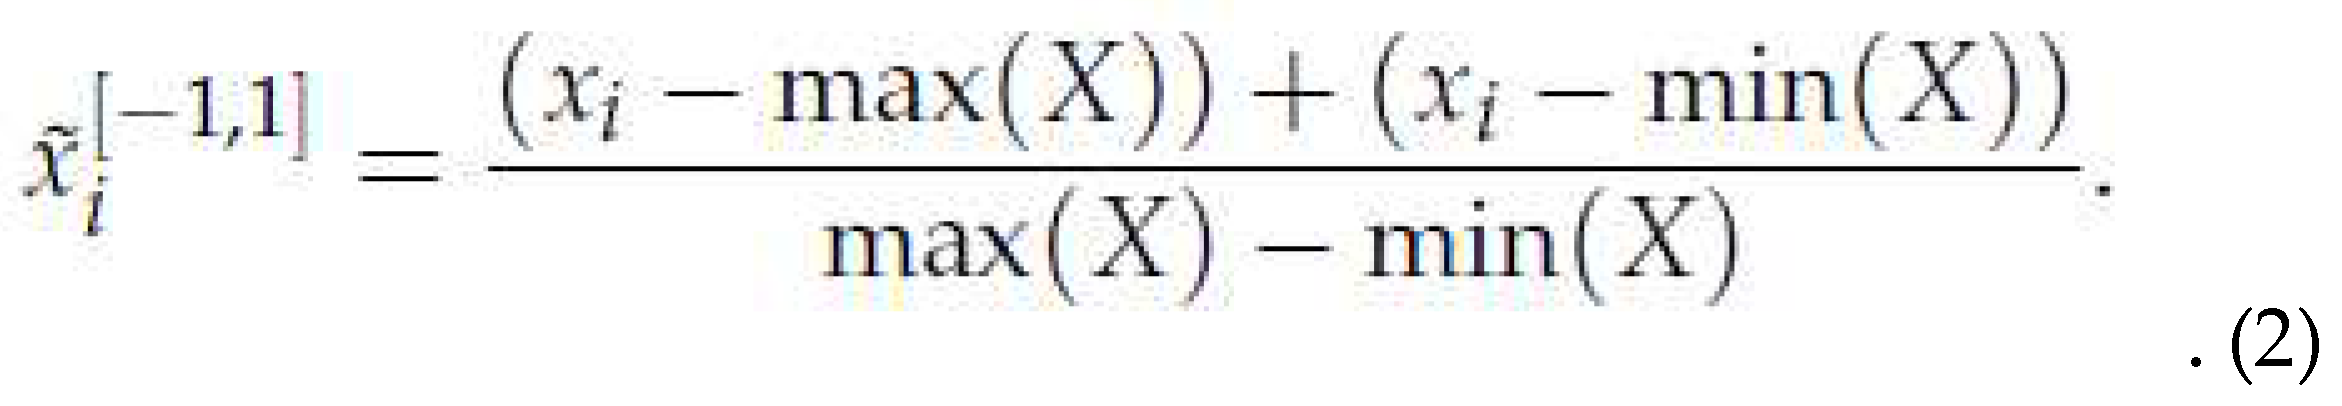
After the time series being rescaled, we get a rescaled time series data ˜X. Then we do
the coordinate transformation. Change the time series data from Cartesian coordinate to
polar coordinate. In the Cartesian coordinate, the time series data Xi is represented by
time stamp and data value, that is (ti, ˜ xi). But in the polar coordinate, the time series data
is represented by radius and angle, that is (ri, ϕi). We use the equations below to do the
transformation,
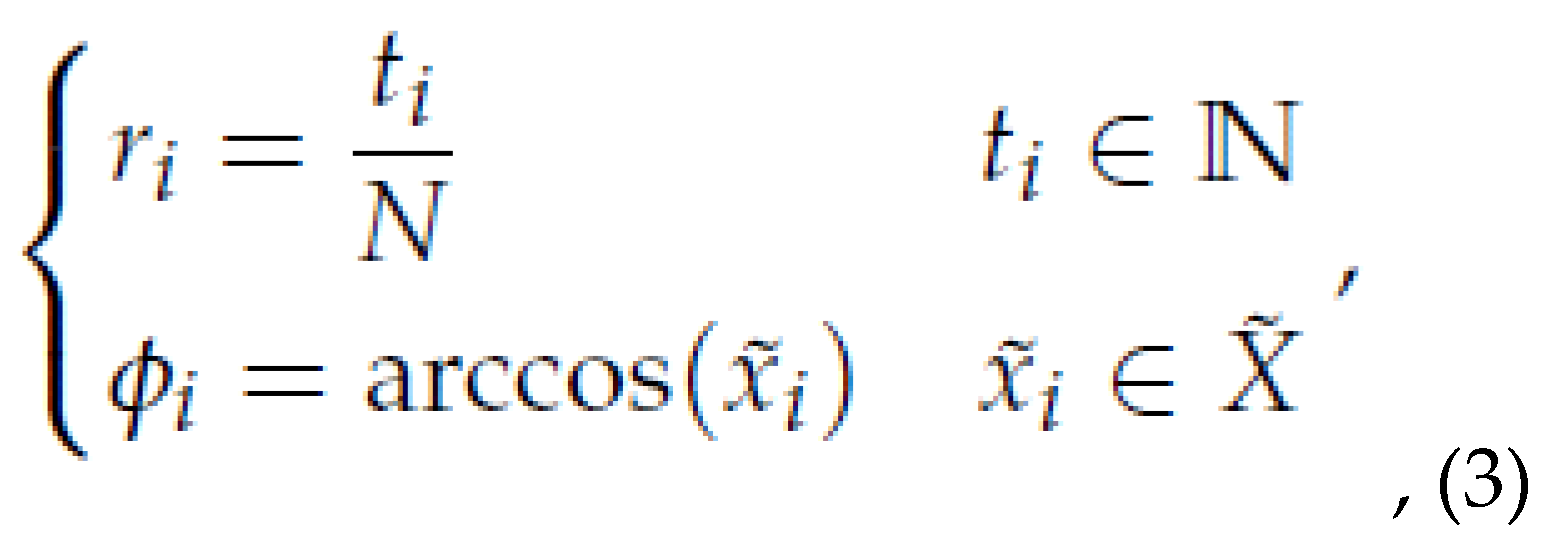
where ti is the time stamp and N is a constant factor to regularize the span of the polar
coordinate system. In this research, we let N = 64, which will be the height and width of
the time series image.
The map of equation (3) has two important proterties. First, it is bijective. A time series
has one and only one transformation result by this method because cos ϕ is monotonic when
ϕ 2 [0, p]. Second, the image preserves the absolute temporal relations. By doing coordinate
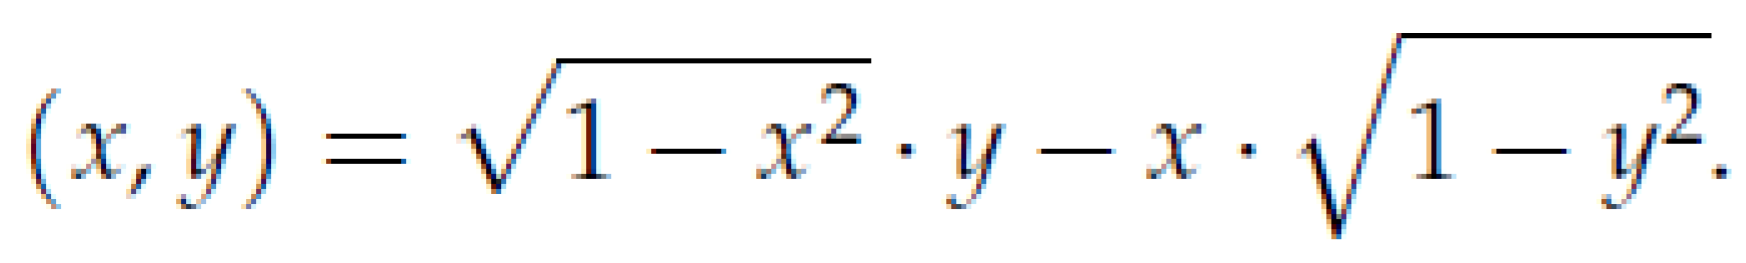
transformation for the rescaled time series data, we can get the Gramian angular difference
field (GADF) as follows,

After getting the GADF, we define a new definition of the inner product as follows,
At last, the GADF are can be regarded as the Gramian metrix because every entry in
the Gramian angular fields is the inner product. The Gramian metrix is different from
the traditional Gramian metrix in linear algebra for their definitions of inner product are
different.
Finally, with the different colors standing for different values of the entries in the Gramian angular fields, we can obtain the time series images.
Time series image
The time series images have the size 64×64×3. We want to use the time series image, that
is, the SSE Composite Index daily close of the past 64 days to predict the trend of the daily
close of the few days in the future. We label the image of 1 if the average daily closed up of
5 days in the future against the past 5 days, and 0 otherwise. At last, we have 3314 images
with label 0 and 3718 images with label 1 in train and validation data set, and 44 images
with label 0 and 51 images with label 1 in test data set.
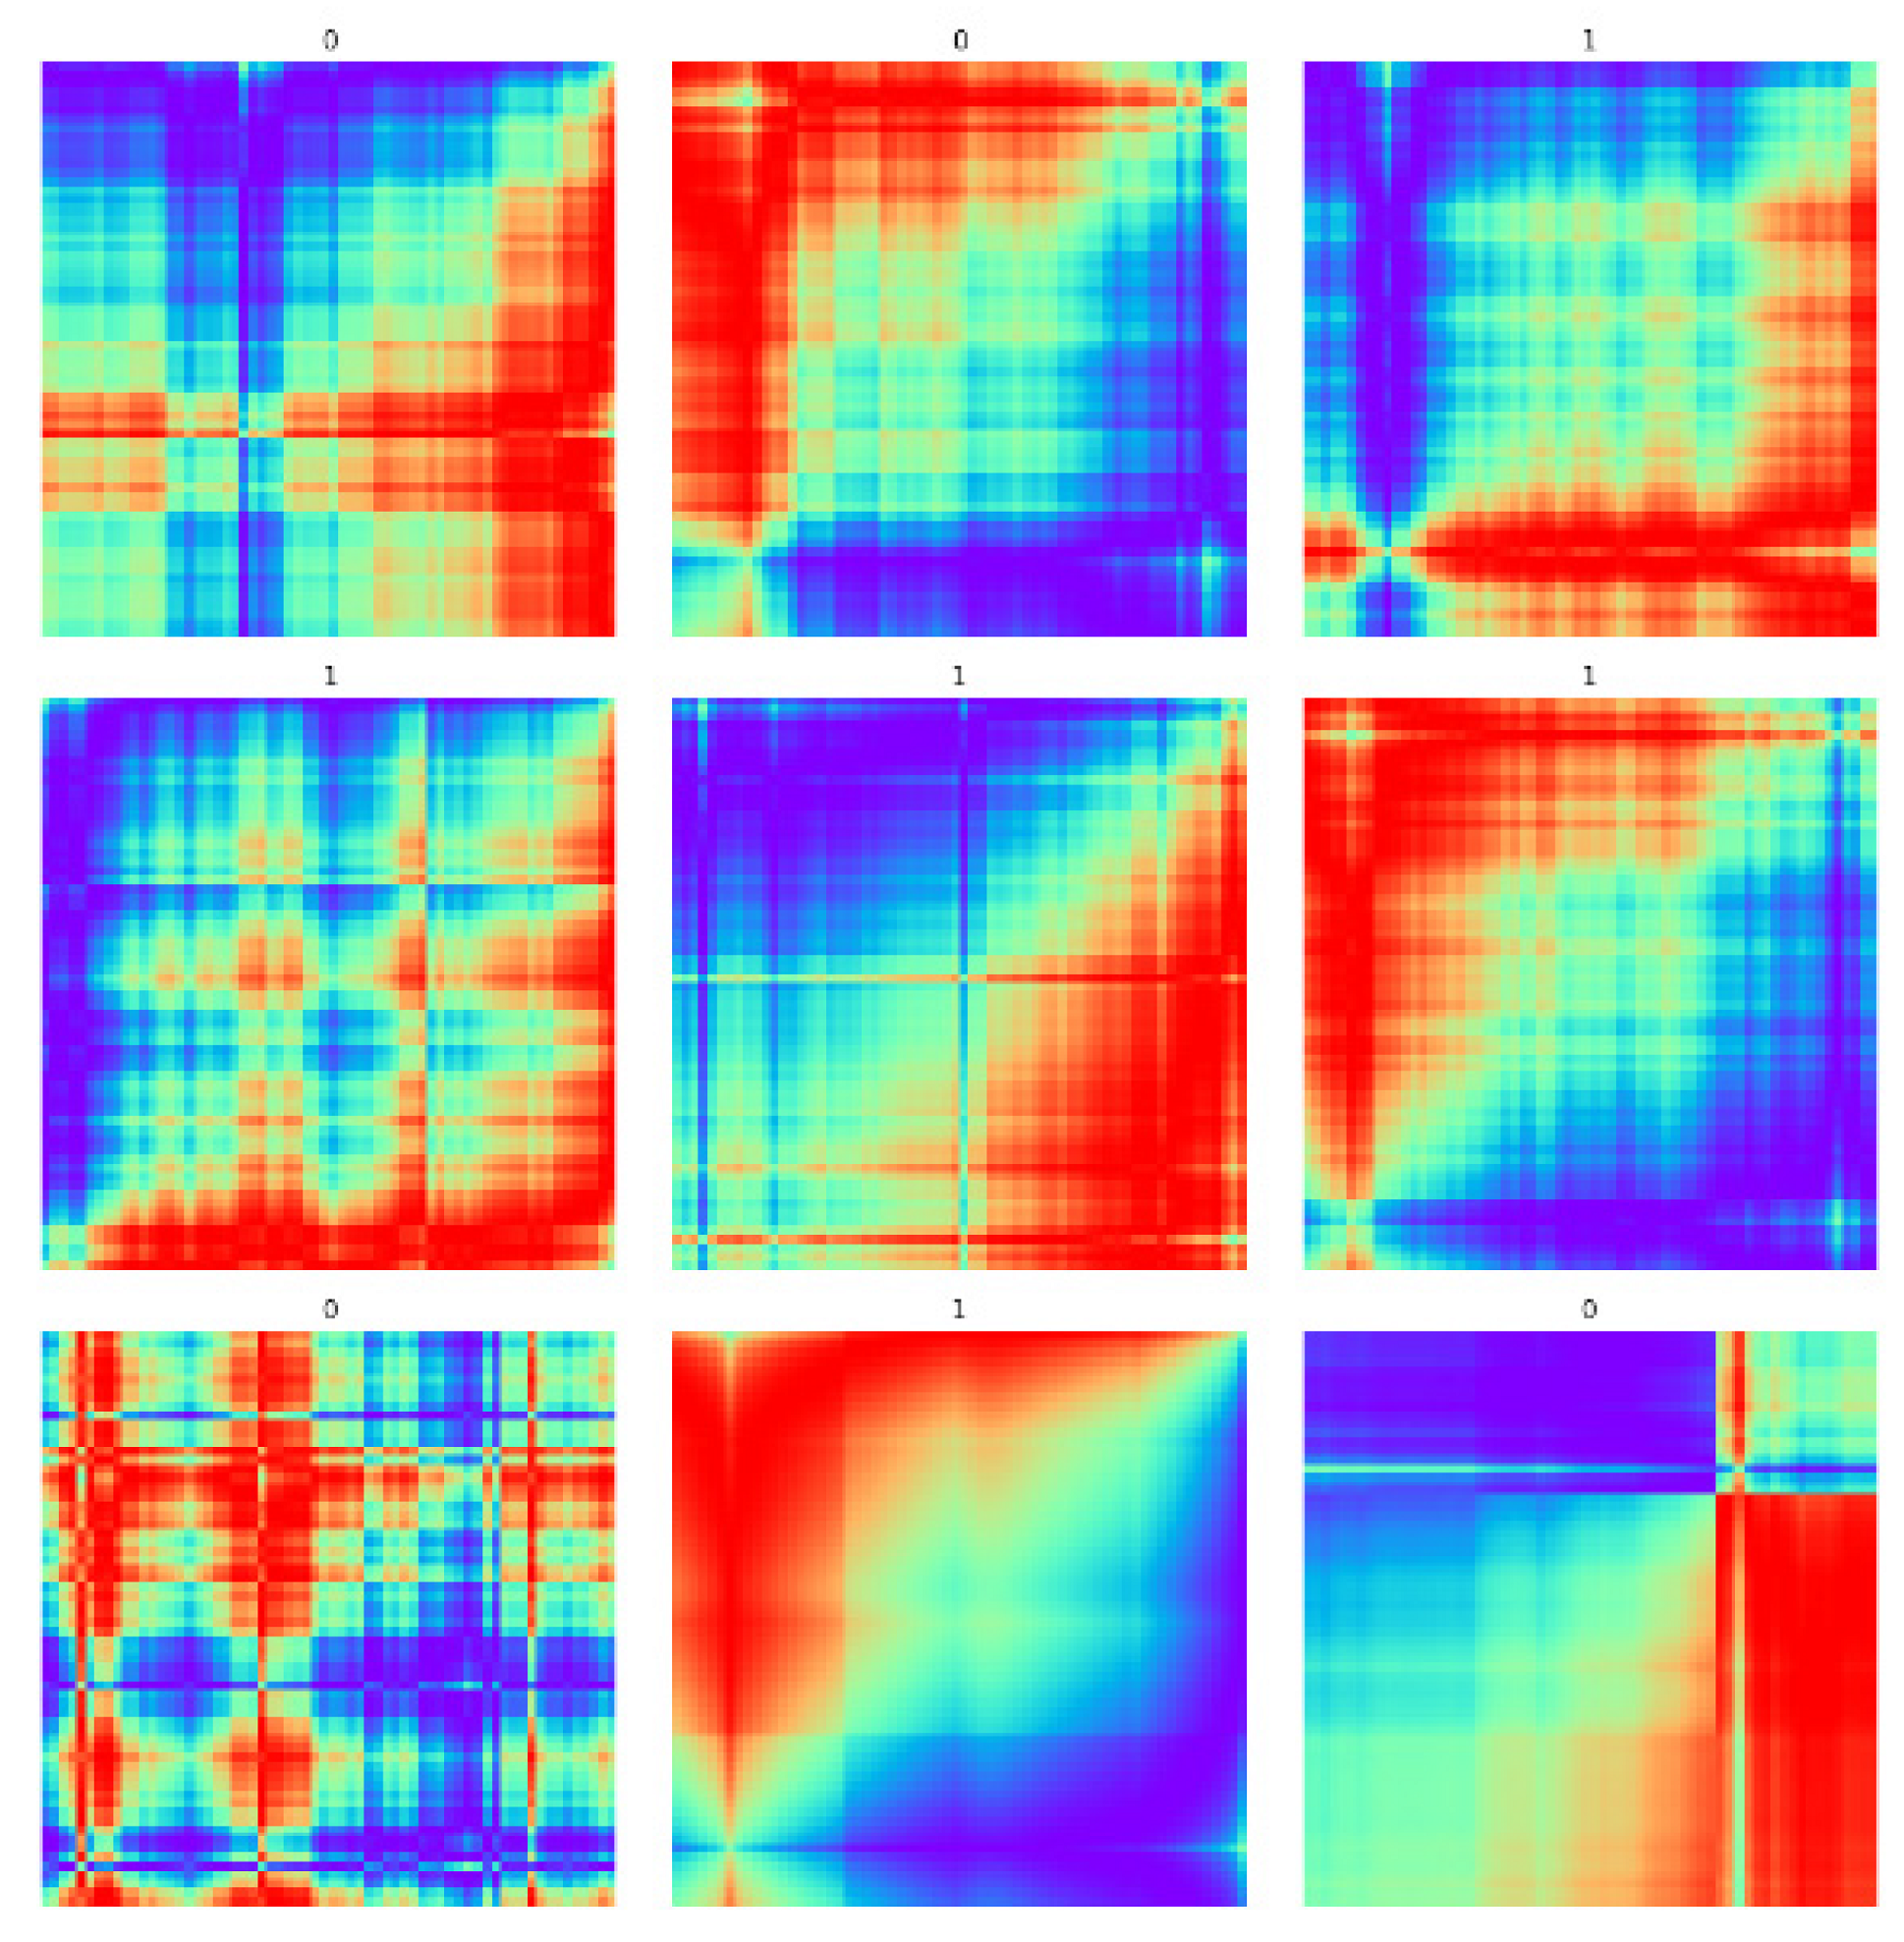
GADF images with labels
3. Research methods and procedures
The research process is developed by using PyTorch, and the experimental steps are described as follows:
1. Making a crawler program to collect TSMC stock history information and store it in the database. Use the data on the number of transactions and closing prices of TSMC from 2009 to 2020 published on the Taiwan Stock Exchange (TWSE) (quoted).
2. Normalize the required data.
3. Divide the data into a training set and a test set, and use the cycle Generative Adversarial Network to learn the relationship between volume and price to build a model and adjust the parameter settings for training.
4. Use the trained model to predict the test set data, put the price-volume relationship into the residual neural network and the long short-term memory model (LSTM), and compare the accuracy of the two models in predicting stock prices.
5. Perform short-term stock price forecasts, and evaluate the performance of the forecast results by using dynamic simulation system.
6. Integrate prediction results with technical analysis tools, namely Bollinger Bands, determine trading signals, and verify effects.
3.1. Data set
1. Source: Taiwan Stock Exchange
2. Stock information: TSMC (2330.TW)
3. Data interval: 2010/01/04 to 2020/12/31, a total of ten years of trading day data.
4. Historical data: closing price and trading volume on each trading day.
5. Training data: the first 90% of the total data is used as the training set, and 10% of the total data is used as the validation set.
6. Test data: the last 10% of the total data
3.2. Data pre-processing
The value range of the trading volume is different from the value of the stock value range. If it is directly normalized by the general method, the difference between the two values will be too large, which will affect the operation of the CycleGAN. In order to reduce this effect, this study converts the data into changes, then takes the log value to reduce the gap, and finally uses the Min-Max normalization method to make the data range between 0 and 1.
The Min-Max normalization formula is:
1. Training/validation/test data cutting
In order to avoid the problem of over fitting in the model, the data set is cut into three parts, and the whole time series data is divided into 90% of the training set and 10% of the validation set, and finally 10% of the training set is used as the test data.
3.3. Deep learning neural network architecture
(1) Cycle Generative Adversarial Network Design
Previous studies have pointed out that there is a joint effect between volume and price, and any model calculation results that use only one of these data will be incorrect. In order to learn the relationship between volume and price, this study uses a CycleGAN to learn; the core mechanism ─ ─ Cycle loss, its loss function is:
For each image from the domain, transform
the joint effect of the domain learning volume and price, that is, return to
the original image through the loop mechanism, the method is: 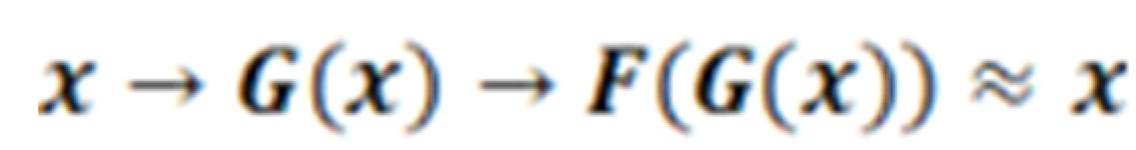 .
.
.Another core mechanism of the cyclic Generative Adversarial Networks is to combat loss, and its loss function is:
Among them, G try to make the generated image G(x) looks like a picture from the Y field, and try to distinguish Dy between the converted sample G(x) and the sample of the real Y field.
The goals of this network are:
Finally to solve:
This research treats price as the field and transaction volume as the field as the input to the cyclically generated confrontation network.
FC is the abbreviation of Fully Connective layer, in which stock price and transaction volume are matrix remodeling, making them the simulation data of a two-dimensional matrix, which is used as the input value of the generation model and the discriminant model.
Since the CycleGAN was originally used for mutual conversion in the image field, the data is first converted into two-dimensional data of the simulate image, through the Convolutional Neural Network (CNN) that has a good effect on the image, the architecture combined with the residual neural network is used as a generative model to produce works that are sufficient to deceive the discriminant model. The discriminant model also uses a convolutional neural network as a framework to determine whether the two-dimensional data is training data or fake works generated by the generative model.
1. Construct the residual neural network model: extract the features through the convolutional neural network to connect with the residual neural network, where 5 days of restoring stock prices and volume are used, and the residual neural network is designed to be 48 layers.
2. Construct a Long Short Term Memory mode(LSTM): Use the LSTM model to restore time series data of quantity and price. Here, 5 days of restoring stock price and volume are used, and the number of layers of the long- and short-term memory model is designed to be 4 layers.
(2) System engineering behavior and stock price prediction
In order to simulate the volatility of the stock market caused by the different potential volume-price relationship in the stock market, this study incorporates a system engineering framework (Figure 3) assumes that the Cycle Generative Adversarial Network generated fake works 、 by the potential future trend of volume and price; changes in the relationship between price and volume, acting as potential energy conversion kinetic energy, form the power of stock price changes and drive the stock market. among them,
1. Thrust (F): Xt is derived from fake works , the potential price is subtracted from the current price; Yt is obtained by subtracting G(x) from the potential quantity with the current quantity. By inputting Xt and Yt to the neural network to simulate the thrust of the potential energy rotation energy.
2. Market value (M): market value (stock price * number of issued). In the stock market, the growth rate of stock prices is related to market value and capital inflows. The same capital flows into different market capitalizations will have different stock price growth rates. Market value is regarded as an object and driven by thrust. This simulates that when the same thrust promotes different market values, the magnitude of stock price changes will also show different statement.
3. Friction (f): Friction is transaction tax, which is transaction volume * stock price * 0.3‰. In dynamic systems, friction is related to thrust. In the practice of stock market trading, it can be regarded as transaction tax. The source of stock price changes is a bargaining chip, but when it flows into the stock market, taxes will be deducted, creating resistance to stock transactions, so the transaction tax is used as a friction.
4. Resilience (R): According to the previous day’s rise and fall, the corresponding value will be given. The resilience of is related to the stored potential energy. The rise and fall of stocks have a continuous impact and will affect the future stock price the most. Assuming that a sharp rise in stock prices will result in more potential energy reserves, it will be less likely to continue to rise in the future, and vice versa.
5. Acceleration (a): The acceleration a is obtained from the distance formula, assuming that the initial velocity is 0, and k is the stock price at the time point (in days) to be predicted. The formula is as follows:
3.4. Bollinger Band Design
By using its extended indicator %b as a trading signal, it is used to obtain the strength of the stock price in the near future. We can know whether the stock price is currently at a relatively recent high/low point through this indicator and make trading decisions.
(a) Bollinger band formula
1. Middle band: simple moving average for N time period
2. Upper band: middle band + standard deviation of K × N time period
3. Lower band: Middle band-standard deviation of K × N time period
(b) Trading decision
1. Select the closing price of the day.
2. The three-band setting parameter K is obtained by experimenting with Bollinger Bands. Experiments 1 and 2 are used to obtain the K which can make it have the best average reporting rate.
3. The three-band setting parameter N is also obtained through experimental Bollinger bands, experiments 5~35, interval 5, and the parameter N that can make it have the best average reporting rate is obtained.
4. When setting %b indicator =>1, the stock should be sold (if it has not been bought before, it will not be sold)
5. The stock should be bought when the %b index<=0.
(c) Integration with stock prices forecasting
Add the forecast of the stock price to the Bollinger Band three band one day later, and know the current strength of the stock price through future information. If the stock price is predicted to be higher, you can know that the current is not relatively high, and you can wait for a period of time before selling, and vice versa. Hope to increase the rate of return on investment through this method.
4. Evaluation and experimental results
We will use three different models to predict and evaluate next point in time stock price.
1. MSE (Mean Squared Error): Calculate the expected value of the squared difference between the real value and the predicted value. MSE can be used not only to evaluate the model, but also to provide a better gradient for neural network-like convergence. It is expected that under the same learning rate, the closer the loss is to 0, the smaller the gradient.
2. MAE (Mean Abs Error): Calculate the expected value of the difference between the real value and the predicted value. MAE can better reflect the actual situation of the error between the predicted value and the real value.
3. Return On Investment (ROI): refers to the percentage rate between the return on investment and the cost. The formula is:
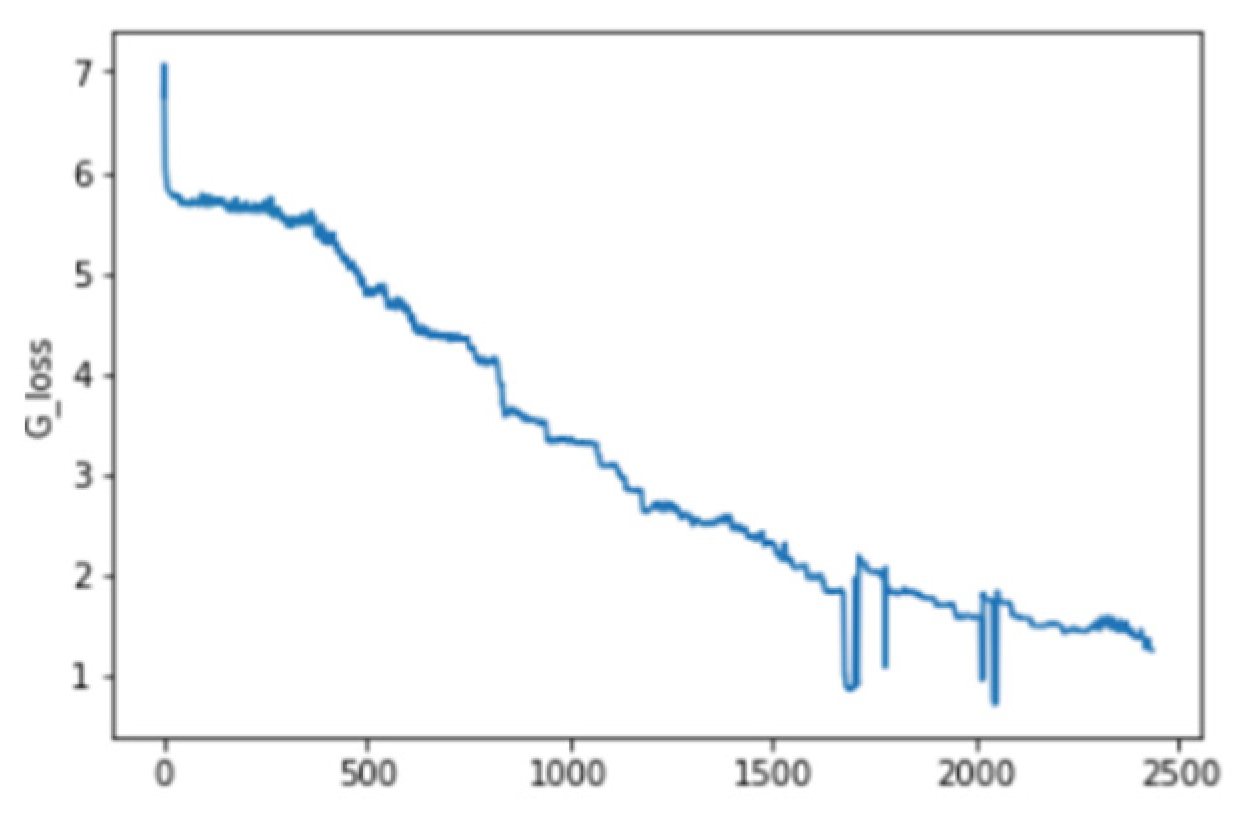
4.1. CycleGAN learning results of volume-price relationship
It can be seen here that the loss of Generator G, the loss of Generator F, and the cycle loss decrease significantly with the increase of epoch. And suppose that Cycle loss is a Hyper Parameter, and after training it to a certain level, it will no longer be trained.
Table 1. CycleGAN loss (MSE).
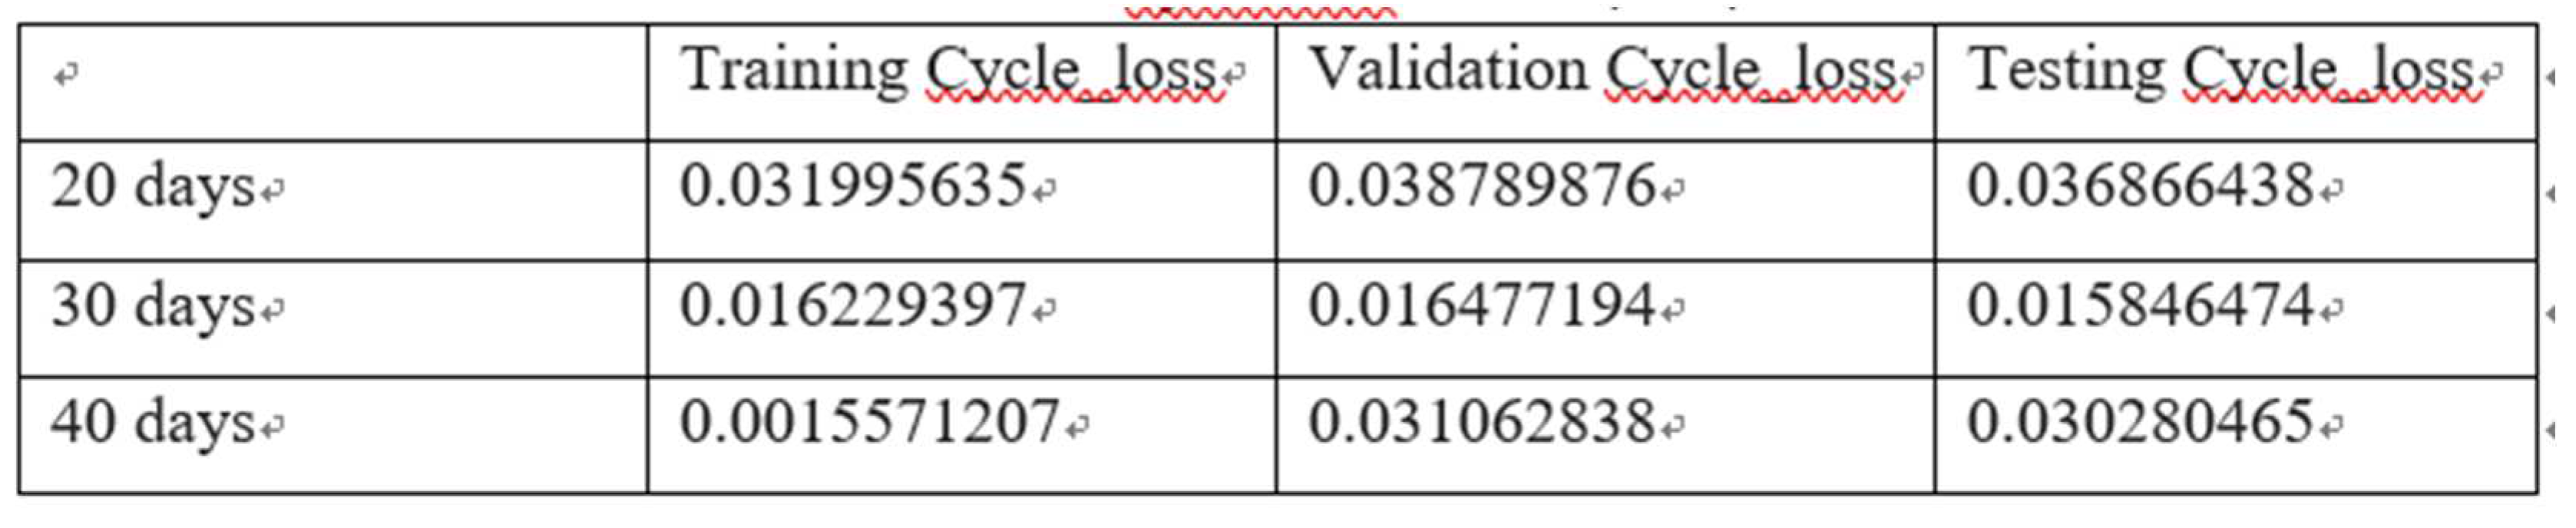
It can be seen that the network architecture of RESNET can well learn the relationship between volume and price, and the result of testing Cycle loss has also been significantly reduced. It shows that the relationship between volume and price can be learned by the cycle generative adversarial network. The 30-day volume and price can be used as input to obtain the lowest loss value. When the parameter n is set to 30, the cycle loss for training, verification, and testing is the lowest, and the gap is not large.
Table 2. Average gap (MAE) of RESNET’s forecast stock price.
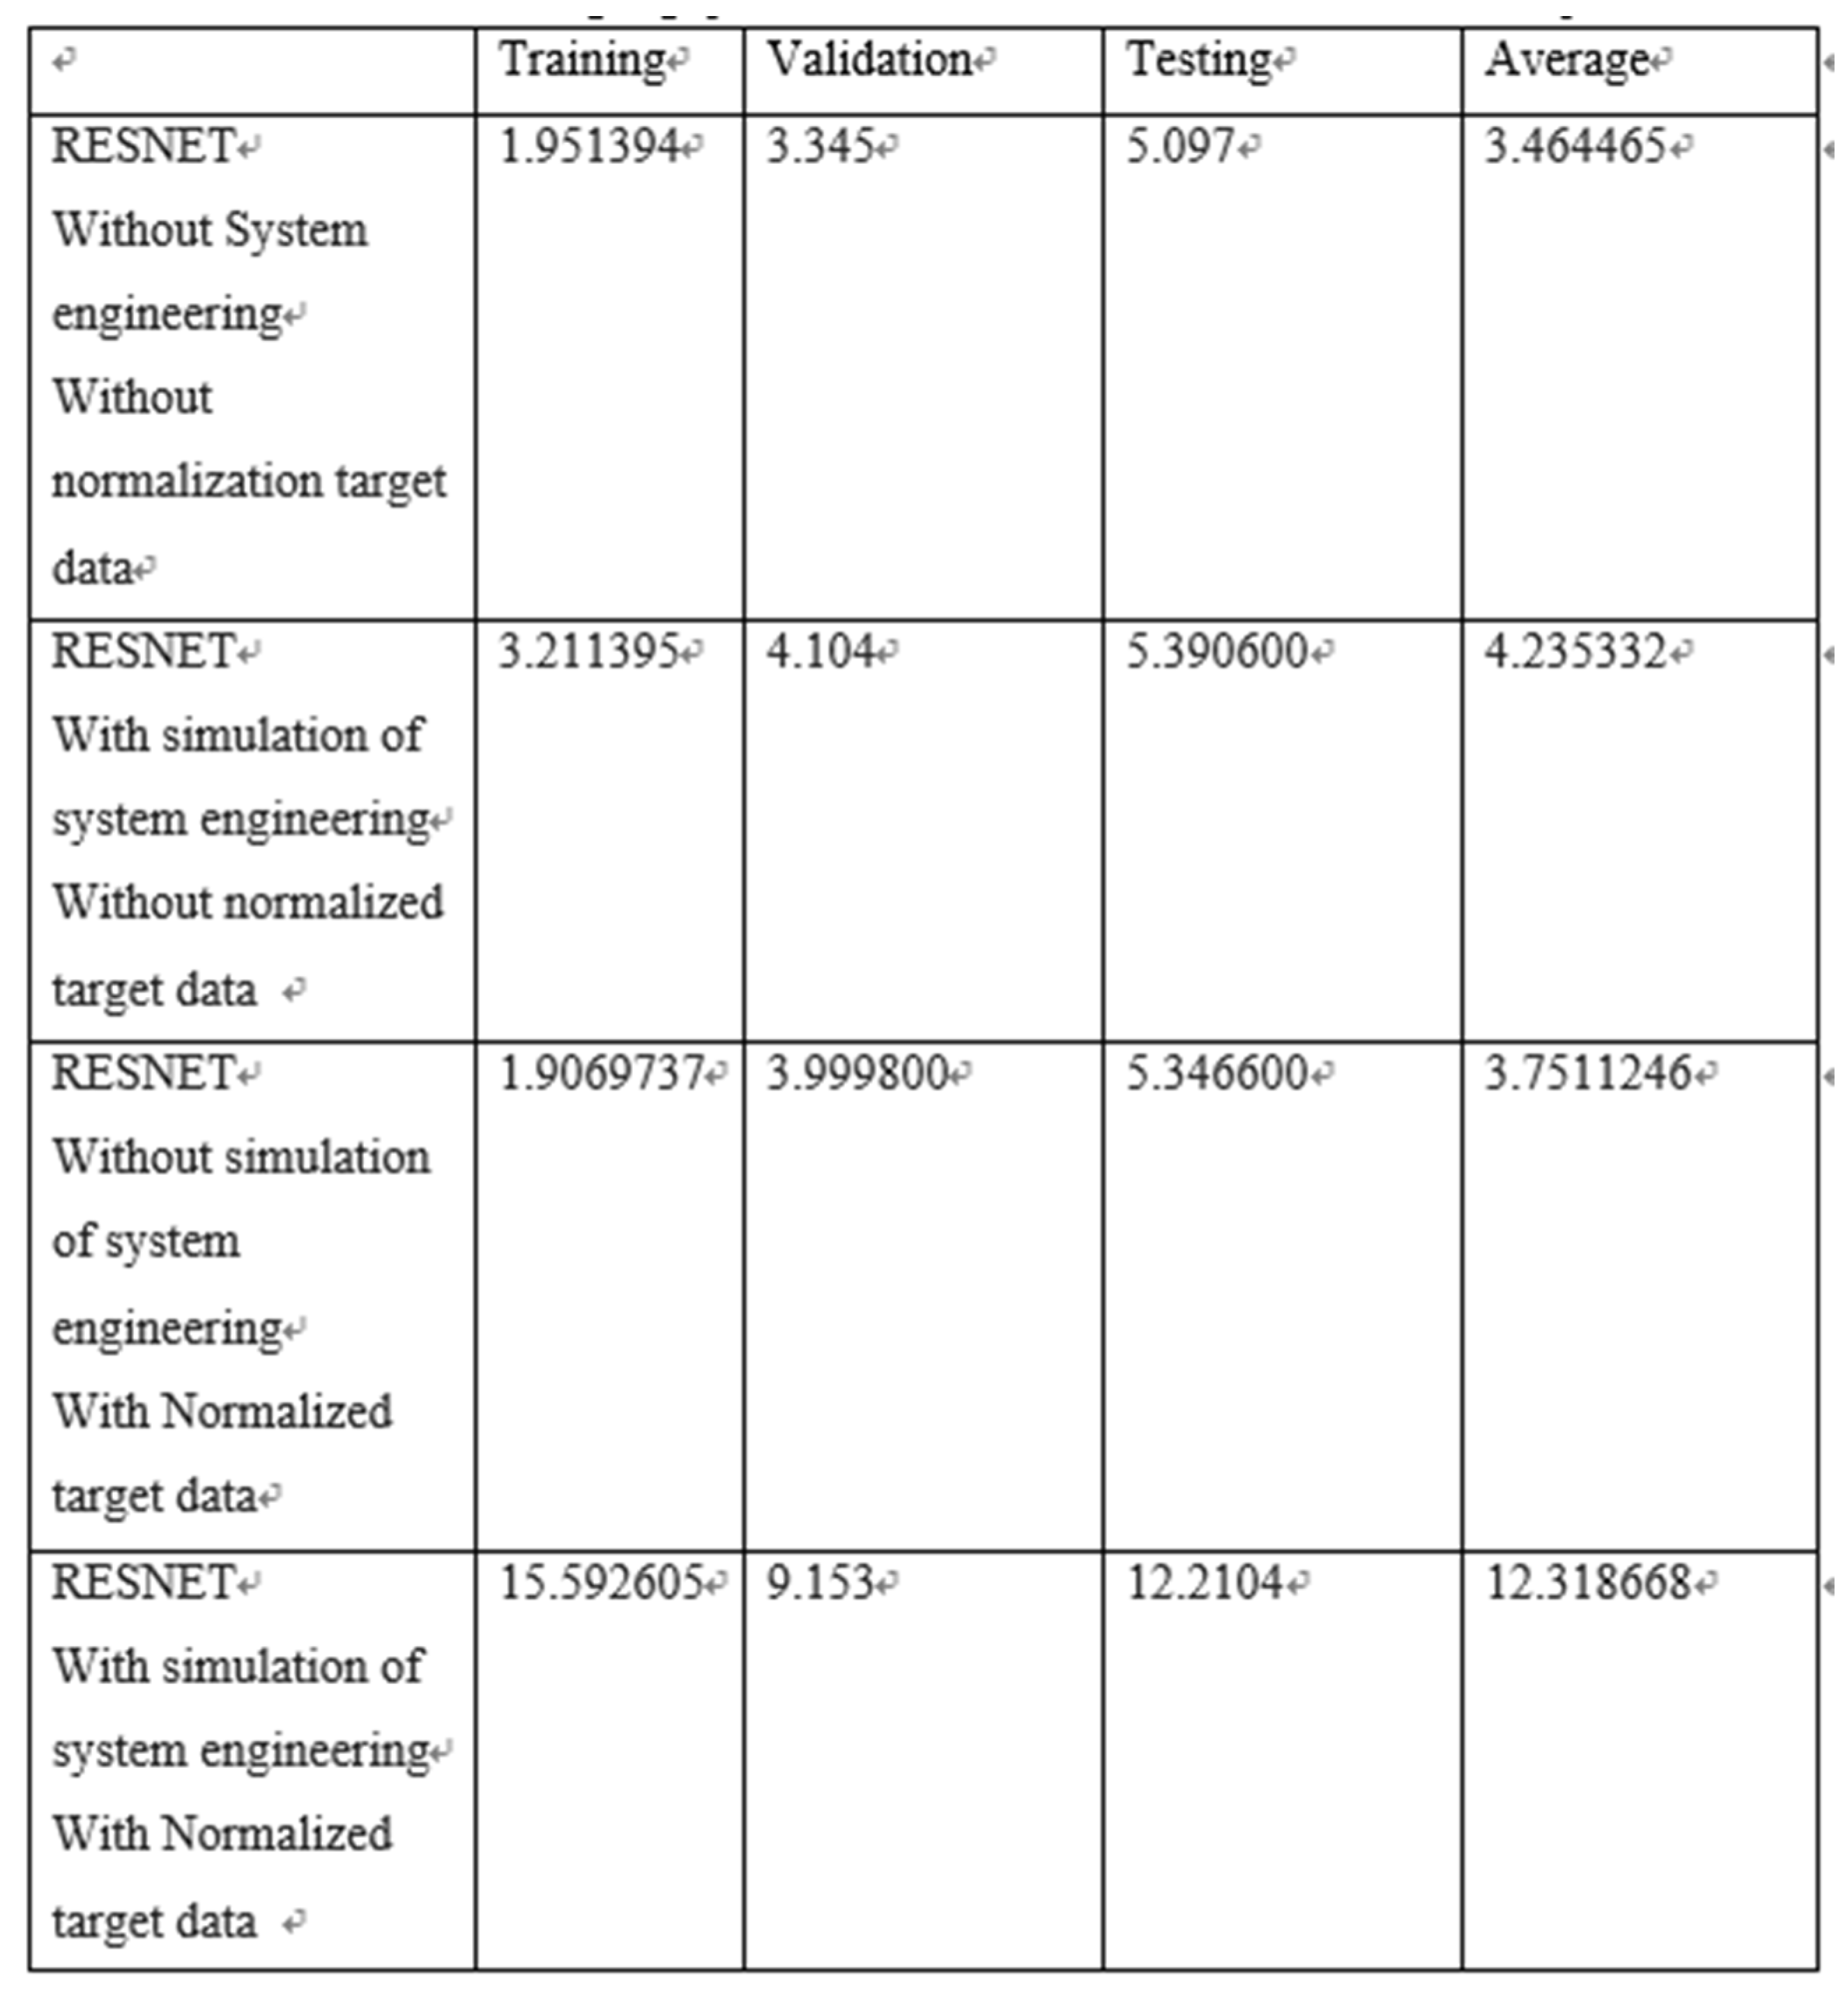
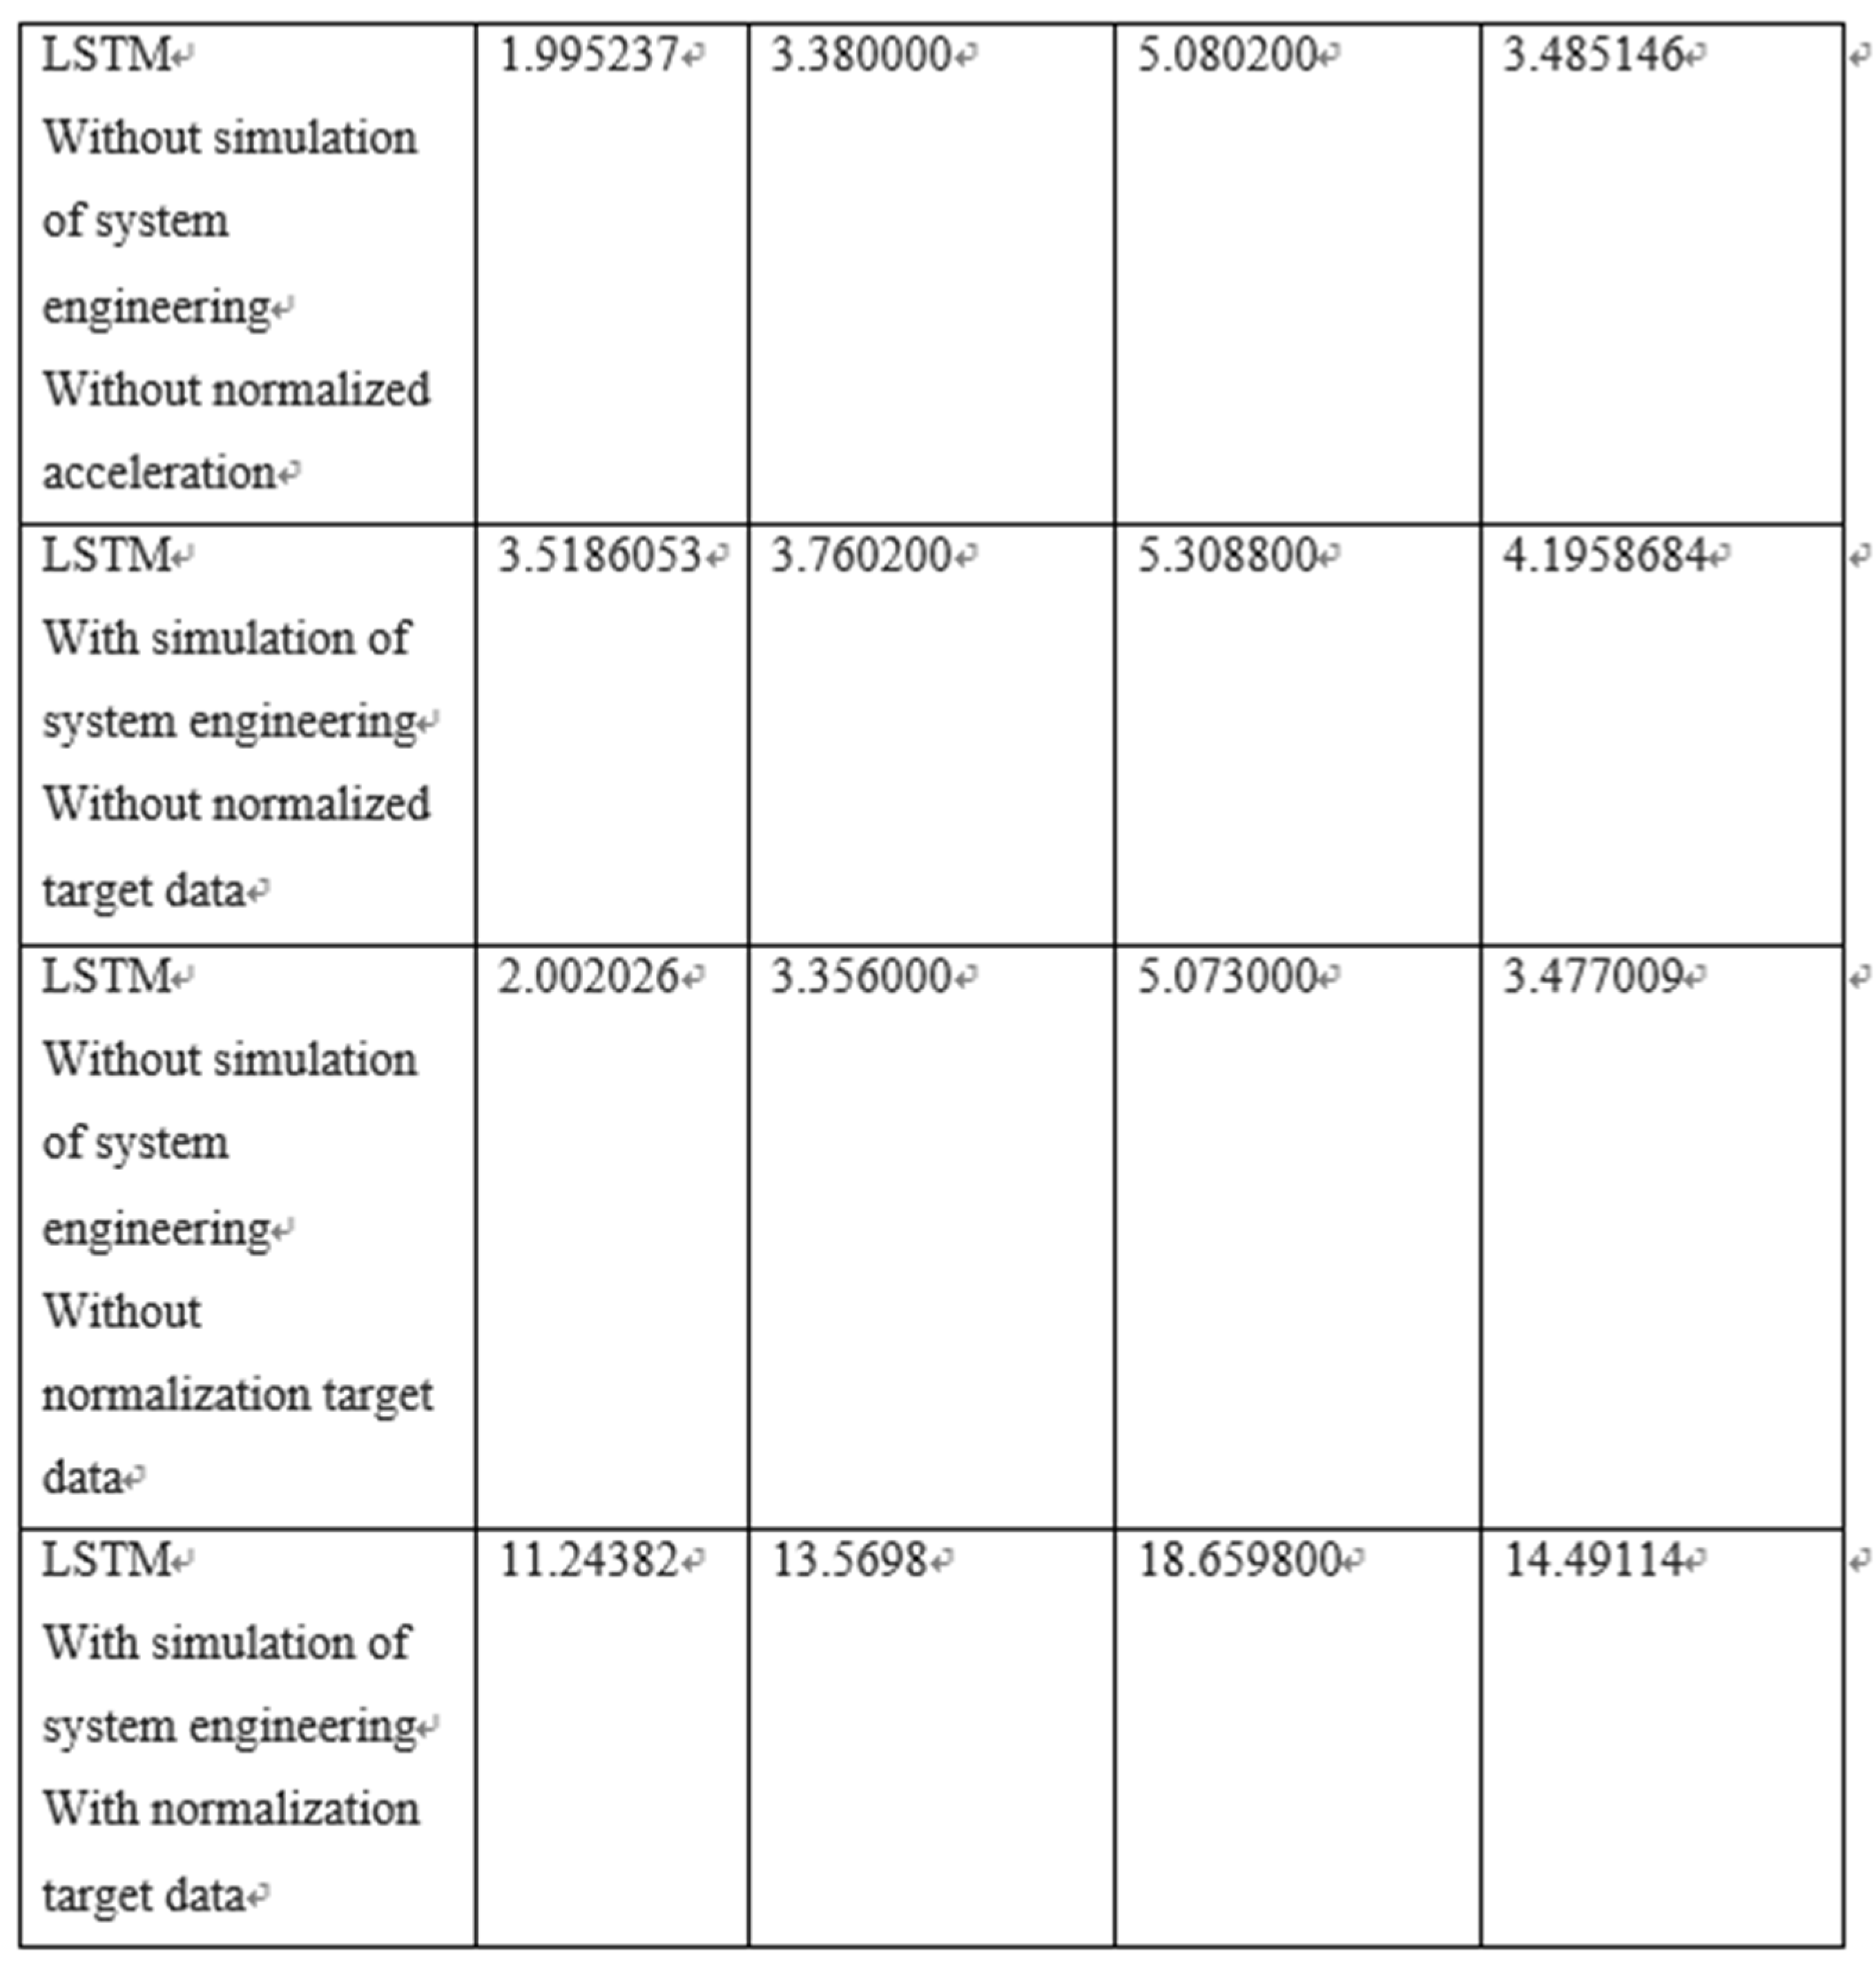
Table 3. LSTM predicts the MSE of stock prices.
4.2. The conclusion of the stock price forecasting.
4.2.1. Normalization and without normalization.
When applying linear regression neural network, the target data is usually normalized so that the loss will not be too large, leading to too long convergence time, or even failure to convergence. After this research uses the normalization of the target data, it leads to some problems:
a. Restore the gap in normalization: Considering the target data is subtracted from the stock price of day to day (in the simulation system engineering, the target data is divided by the square of the number of days), which may cause the value to be too small, leading to the normalization will have a gap with the original data after restoring.
b. For linear regression, the data gap before and after normalization is small: the original range of the data is between -1.8~2.3, and the so-called convergence time and failure to converge will not occur.
4.2.2. The performance of Stock price prediction
The performance of the predicted stock price lies in the normalization/non-normalization, and the simulation dynamic engineering module.
a. In the simulation system engineering, if the target data is normalized, the RESNET deep neural network has better learning ability for the target data than LSTM, but the learning ability without normalization and no target data normalization, LSTM performs better.
b. As for without simulation system engineering, if the target data is normalized, the training loss is reduced, the validation and test loss are increased, and the average result is poor, however, it will affect the results of RESNET more. On the contrary, it has little effect on LSTM, and its training, verification, and test losses are not much different.
c. Overall, the best performance of LSTM is better than RESNET under the integrated with simulation of system engineering. Its validation and test losses are closer to the training loss than the opponent, and the average loss of 4.1958684 is also better than RESNET’s 4.235332. However, RESNET is similar to LSTM under the solution without simulation system engineering integrated, and there is not much difference in training, validation, and test losses. However, in terms of average loss, RESNET’s loss of 3.464465 is slightly better than the other party’s 3.47009.
d. In terms of results, in the without simulation system engineering integration, the lowest and stocks price forecast gap can be obtained that RESNET combined without normalized target data obtain the best result 3.464465.
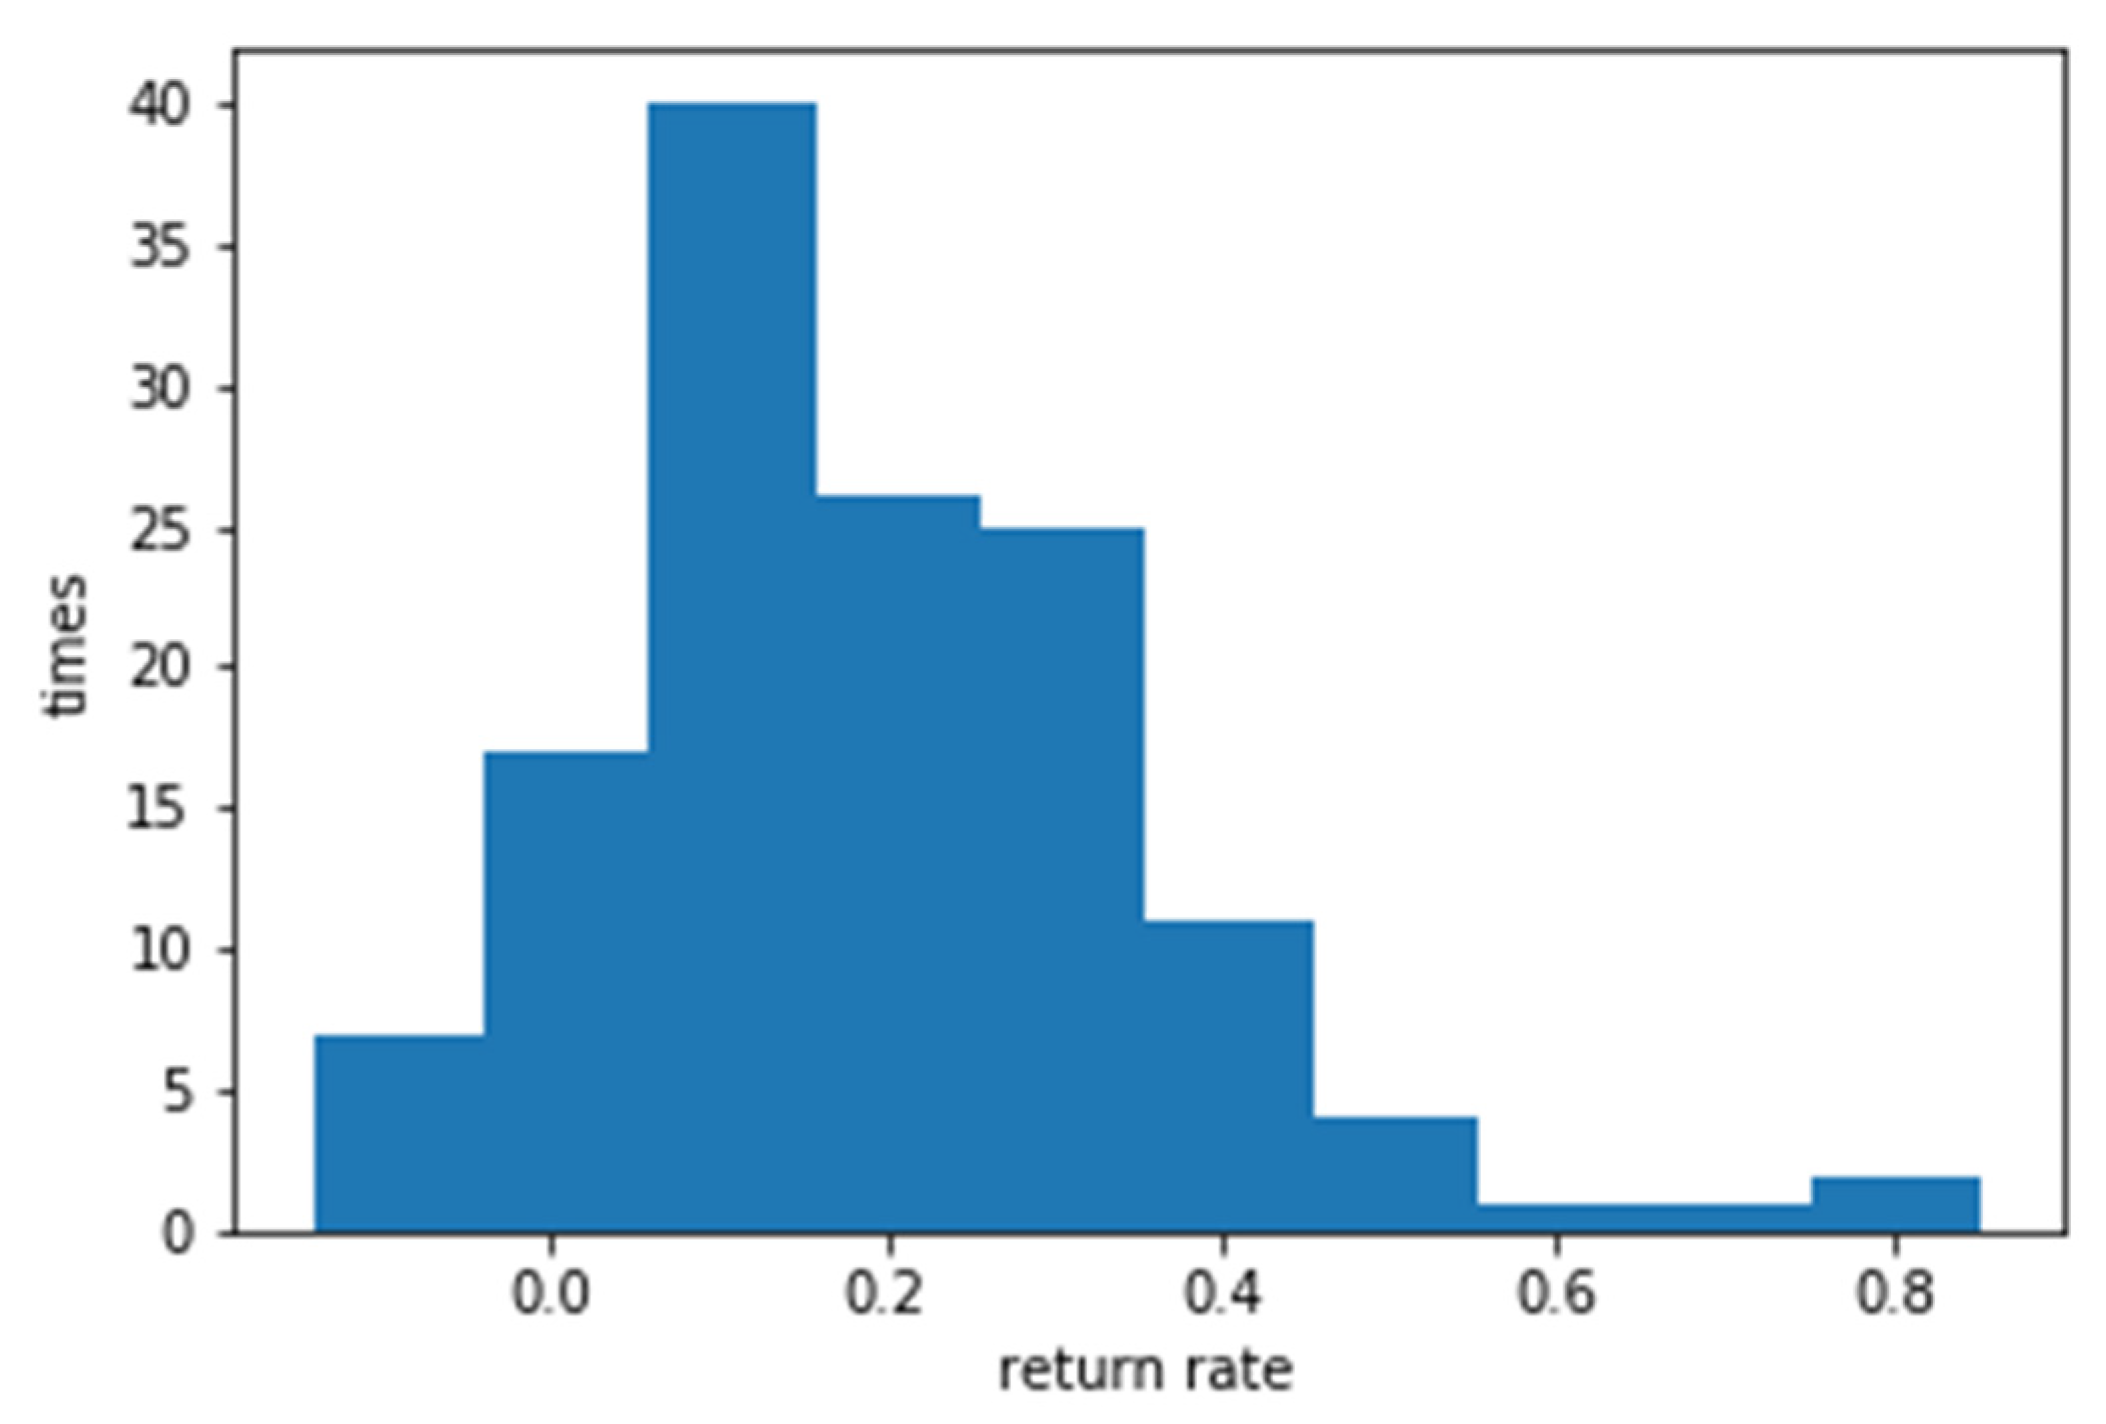
4.3. Trading signals and the return rate forecast
4.3.1. Research problems of Bollinger Bands
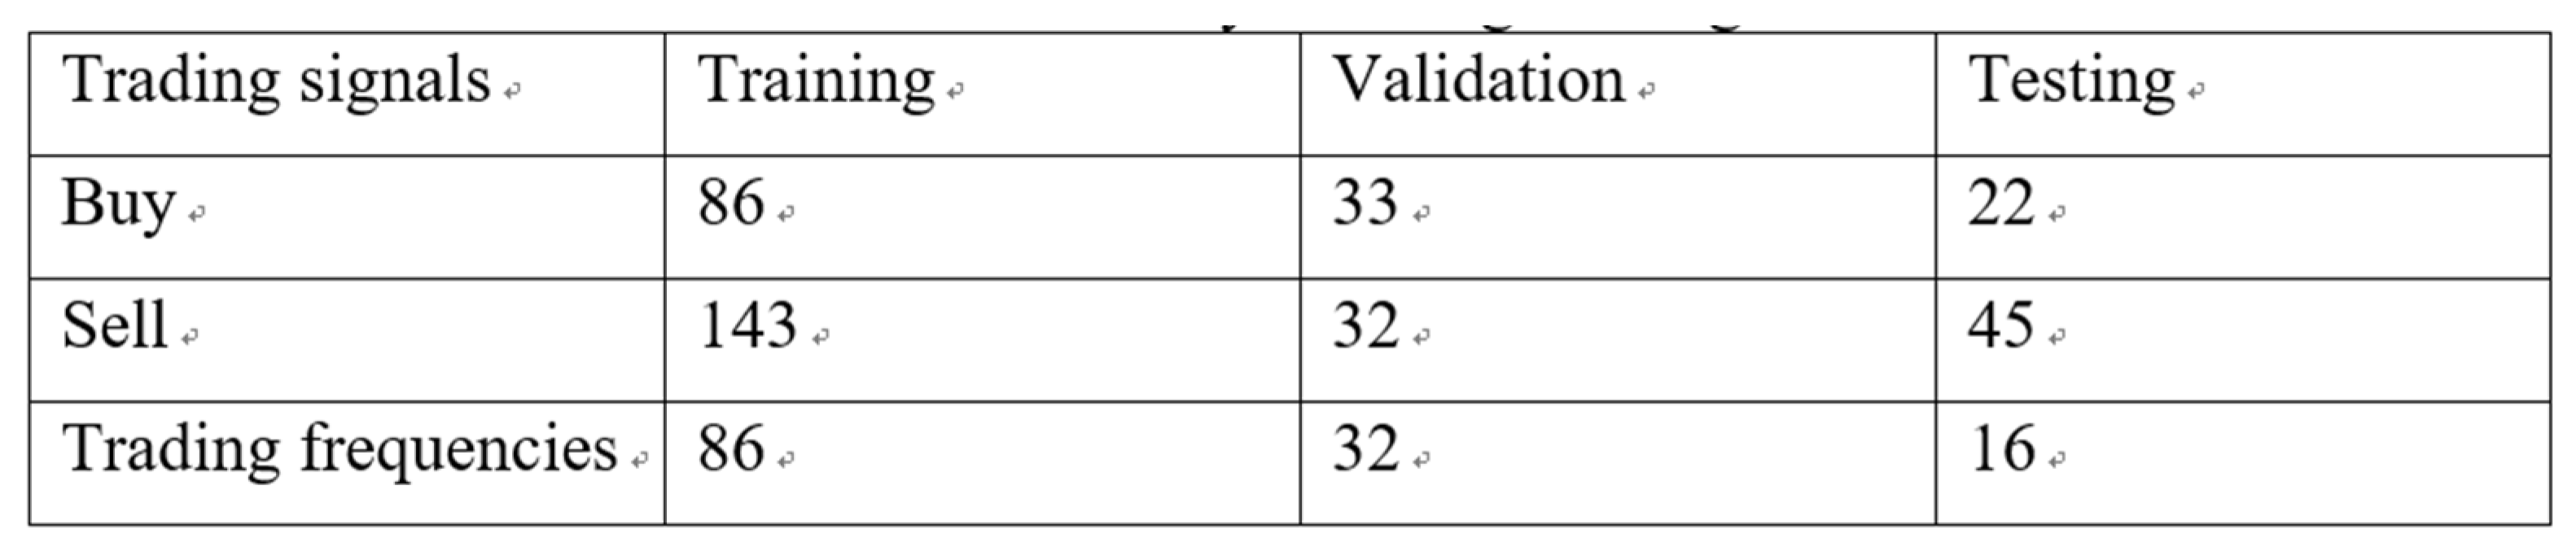
Set N as 35 and K as 2 to get the best reporting rate as follows:
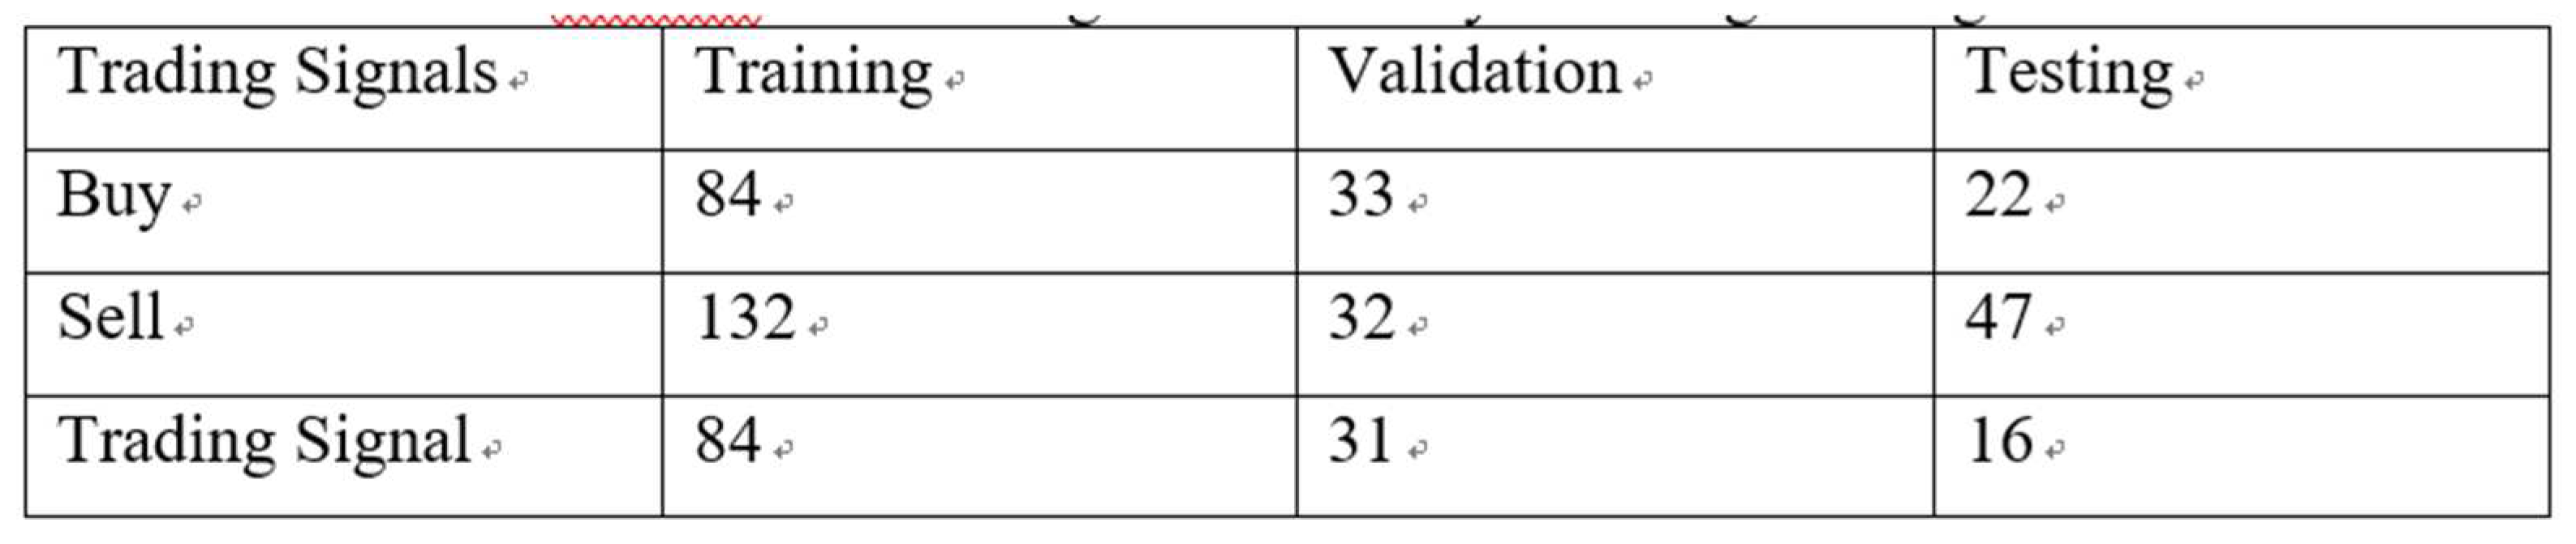
a. Number of trading signals
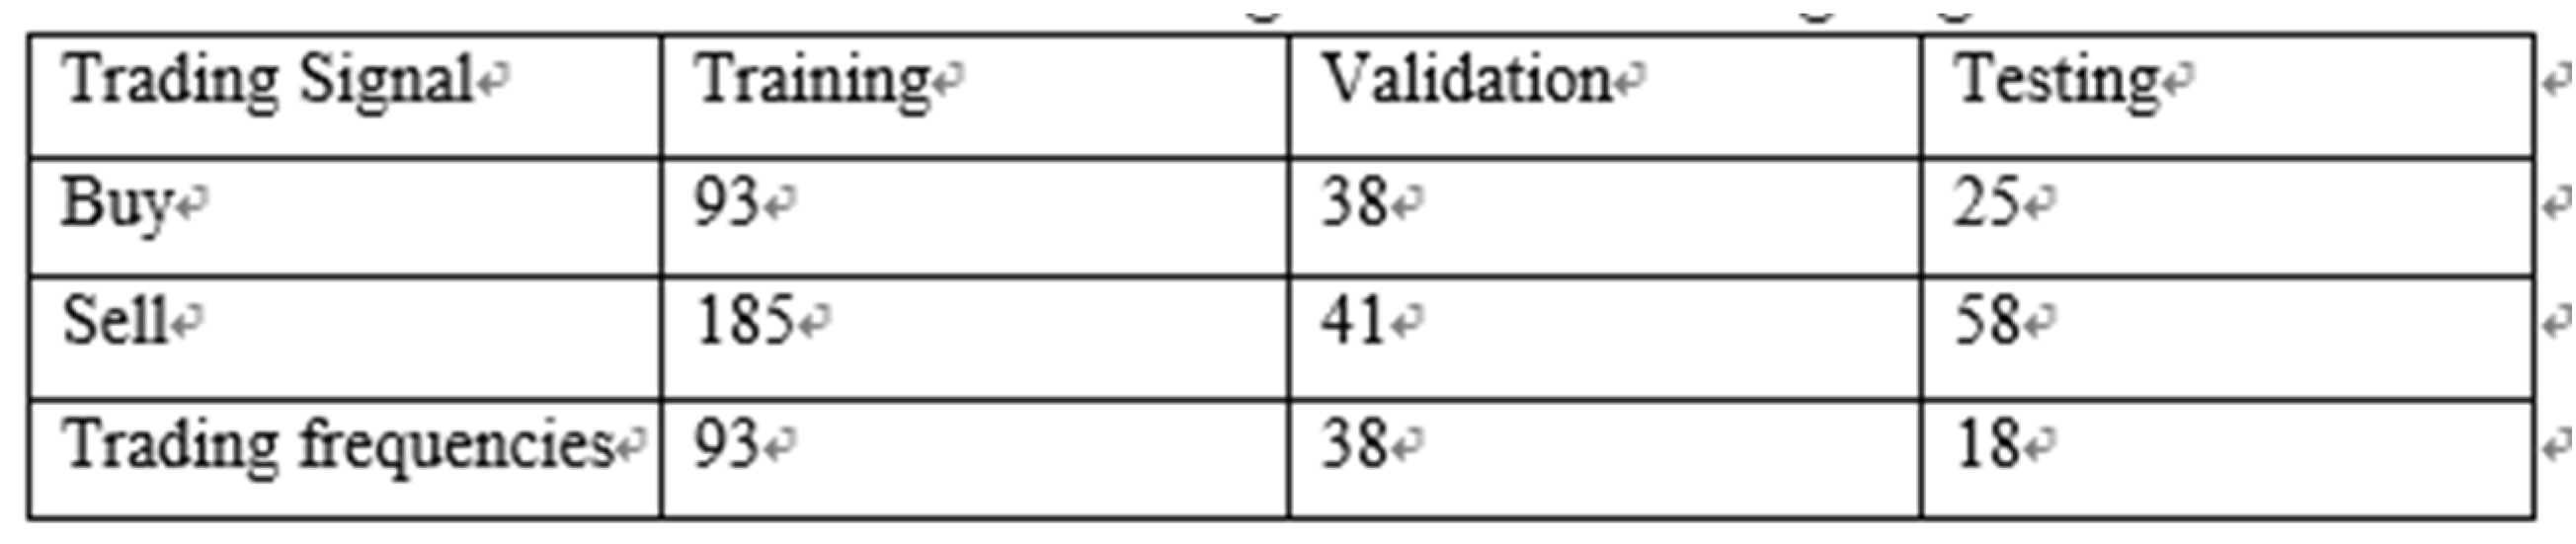
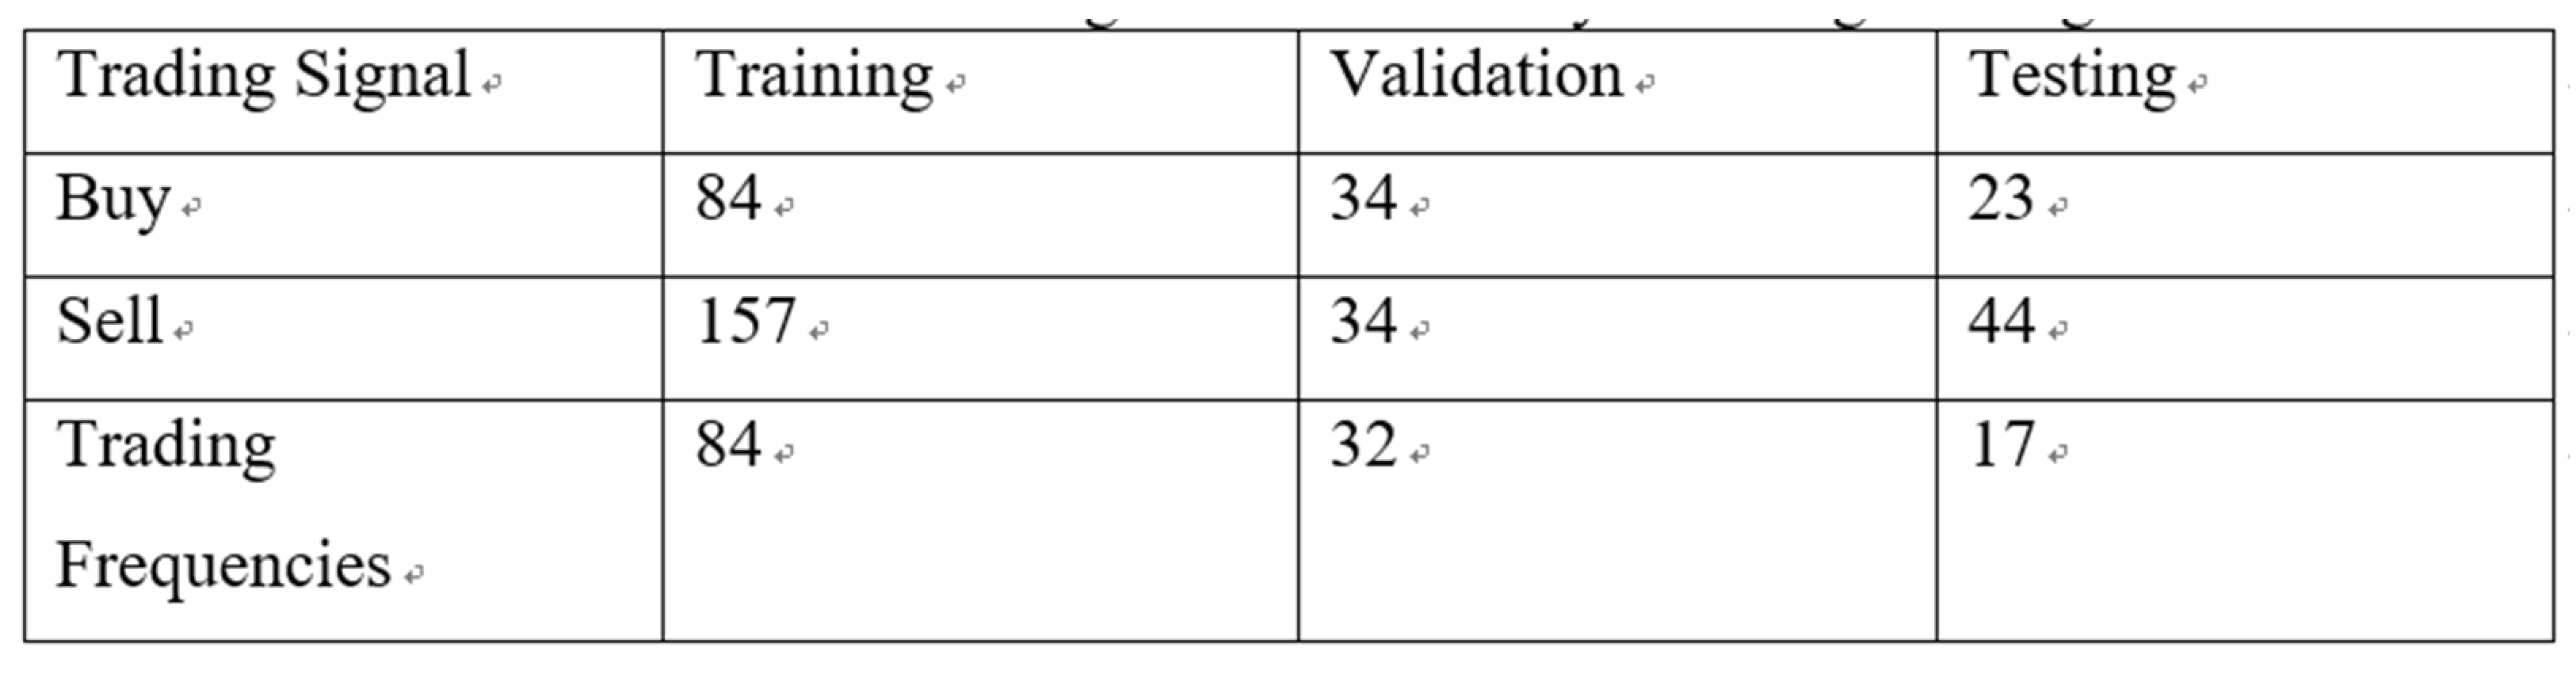
Table 4. Number of Bollinger Bands Trading Signals.
b. Average of return on investment
Table 5. Bollinger Bands Average of Return on Investment.
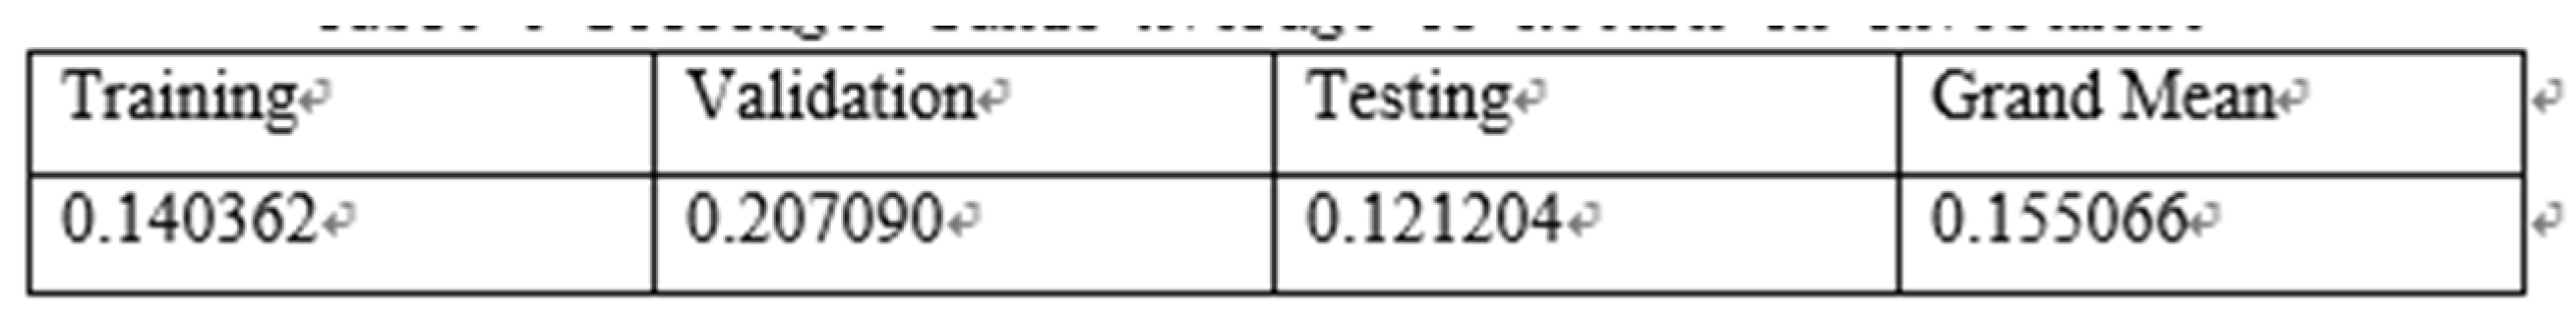
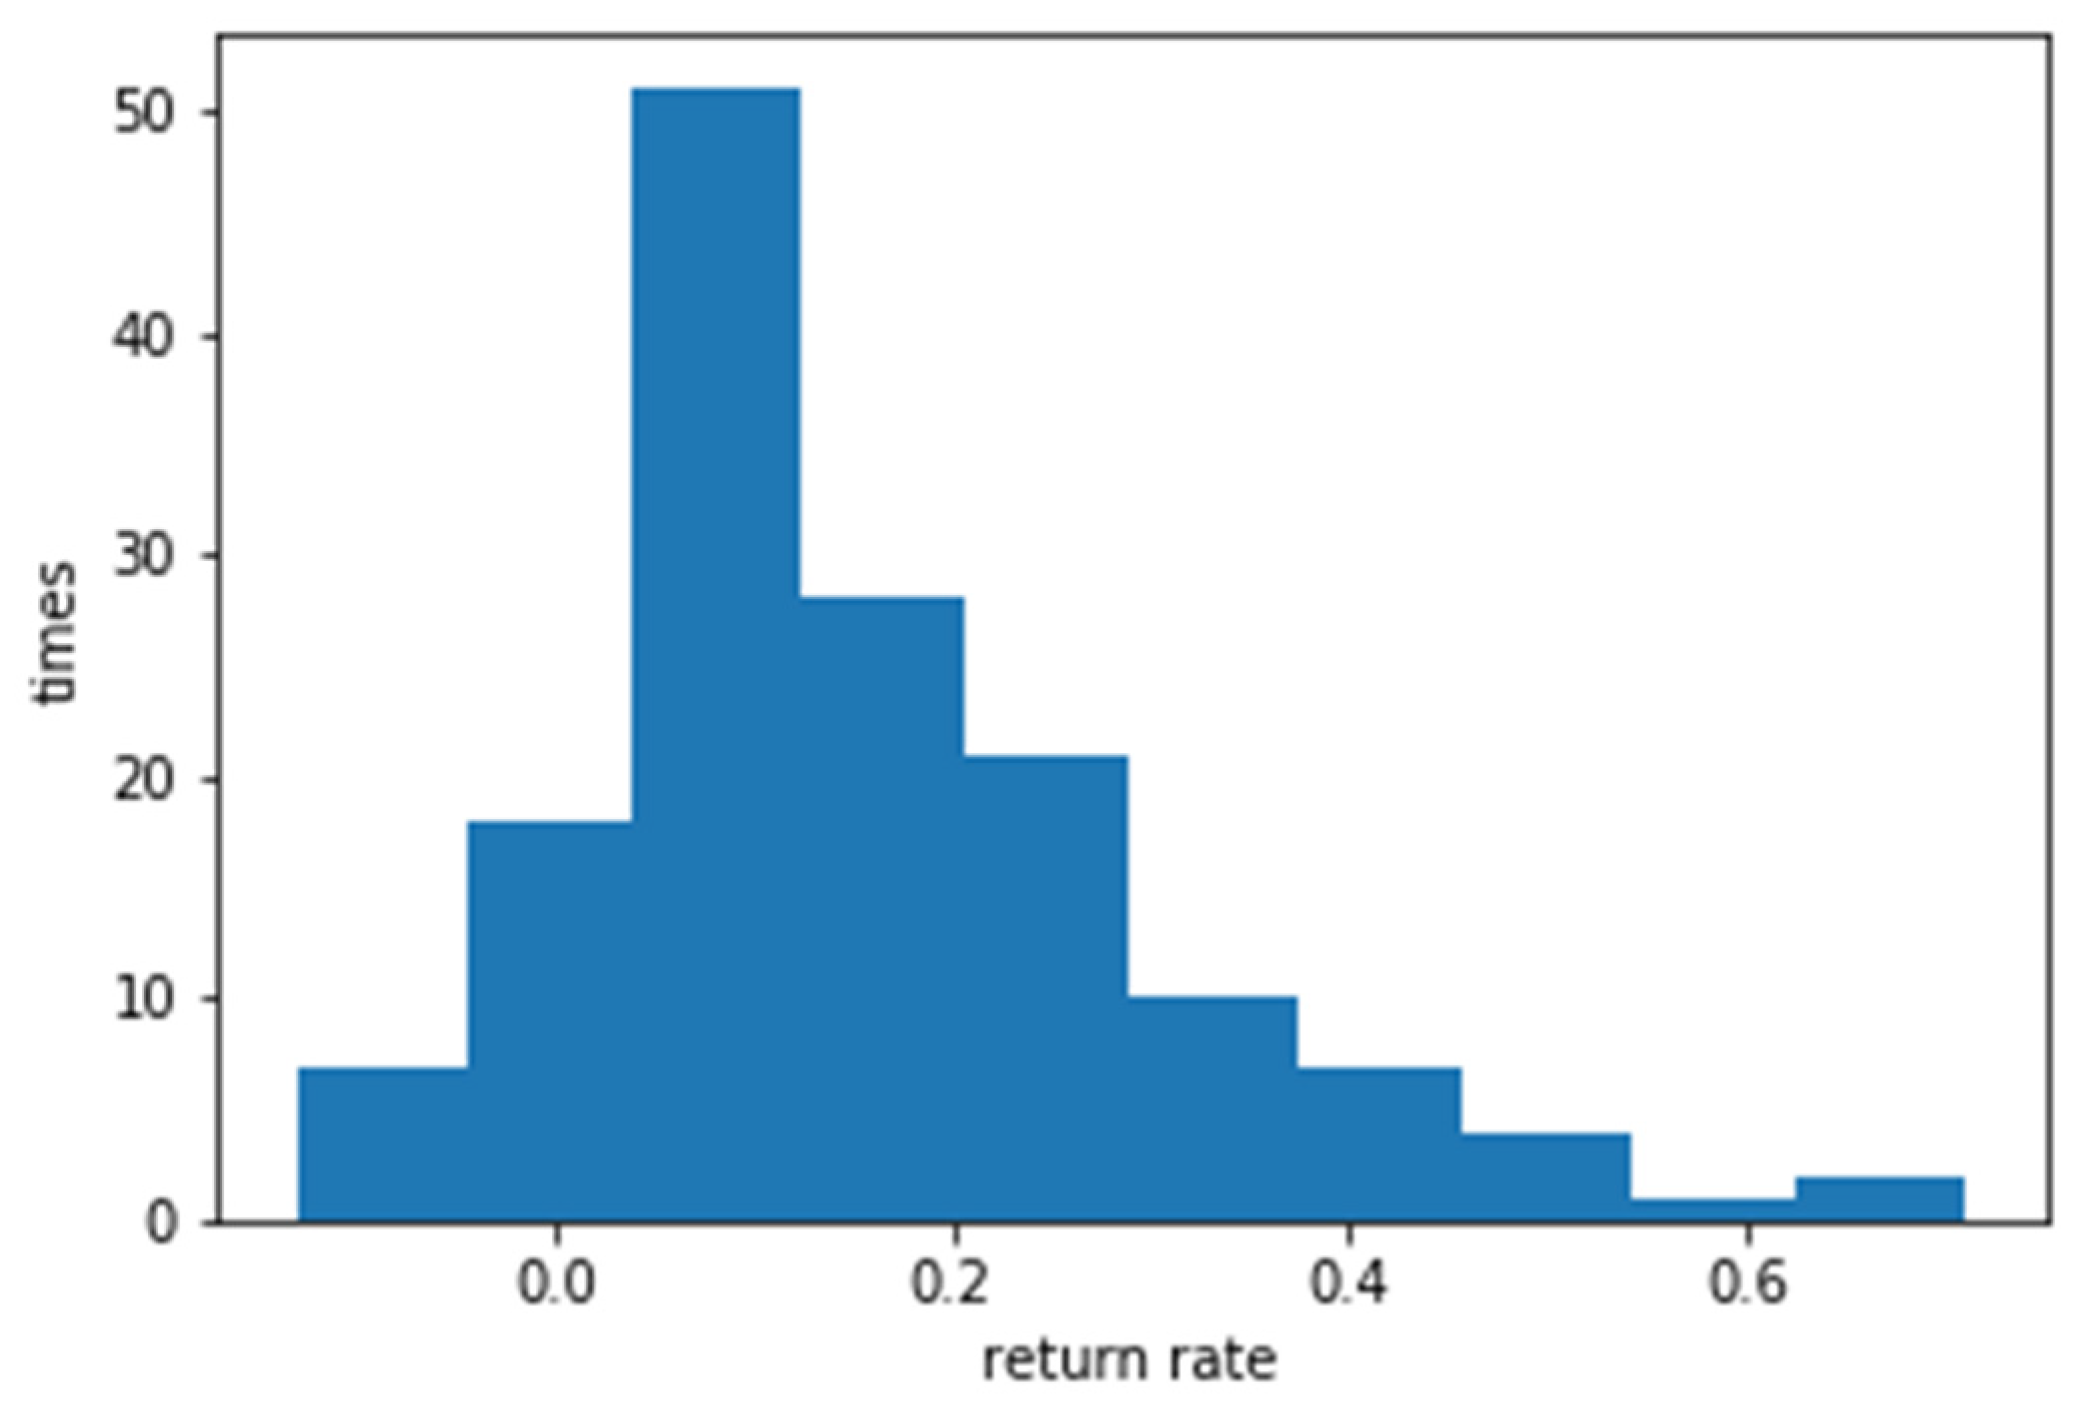
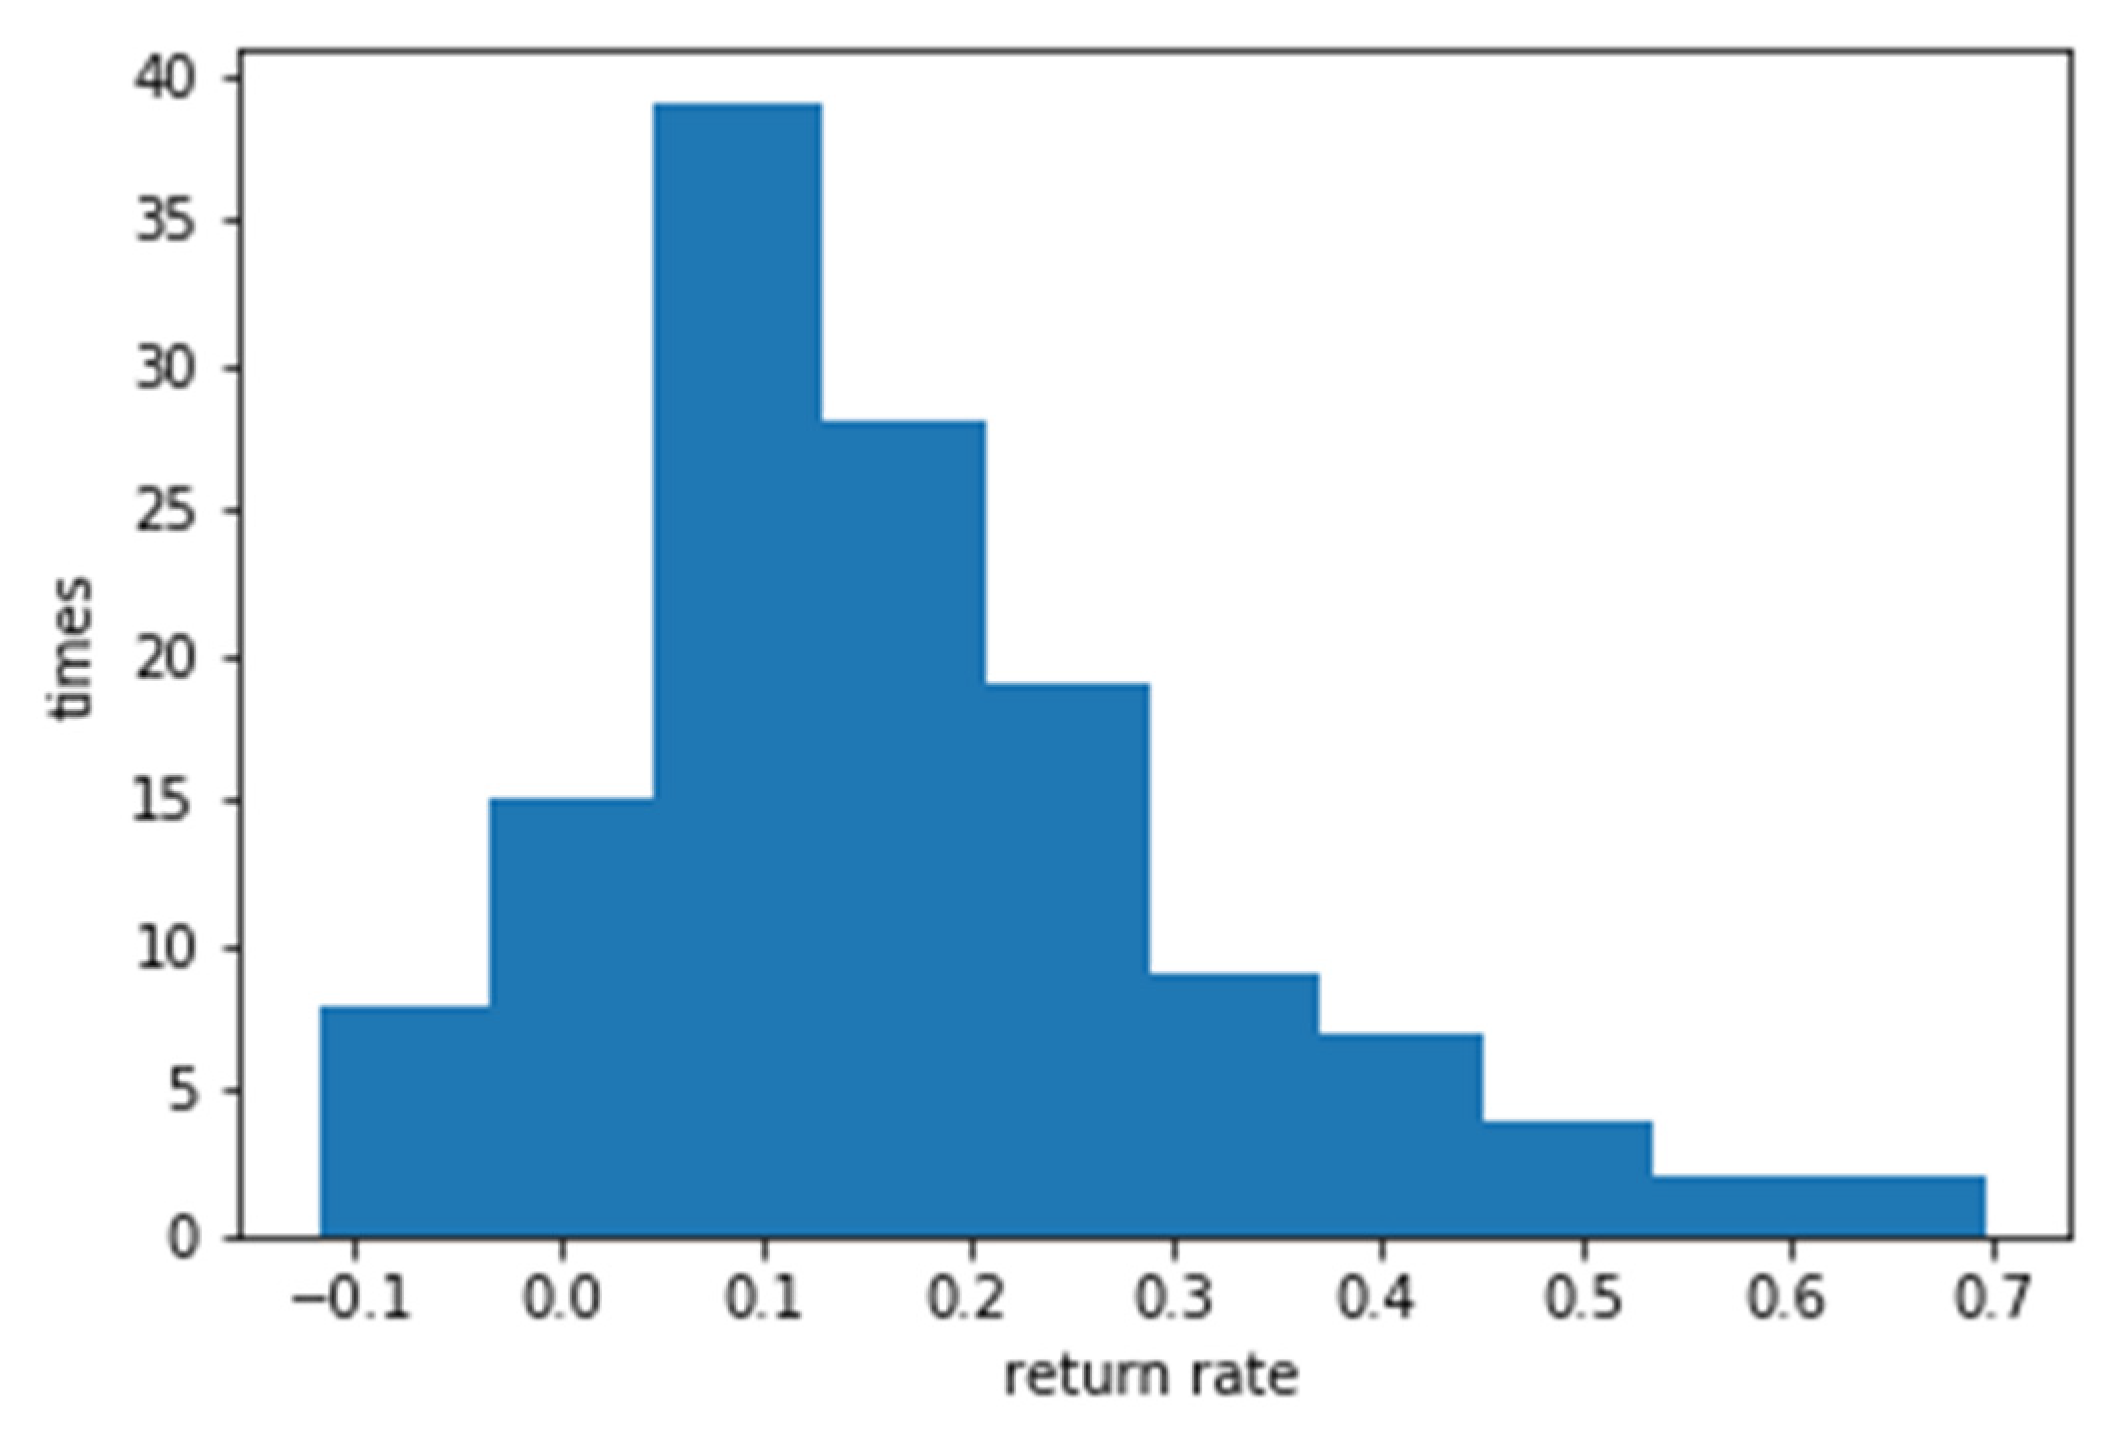
Figure 5.
Bollinger Bands Investment Return Rate.
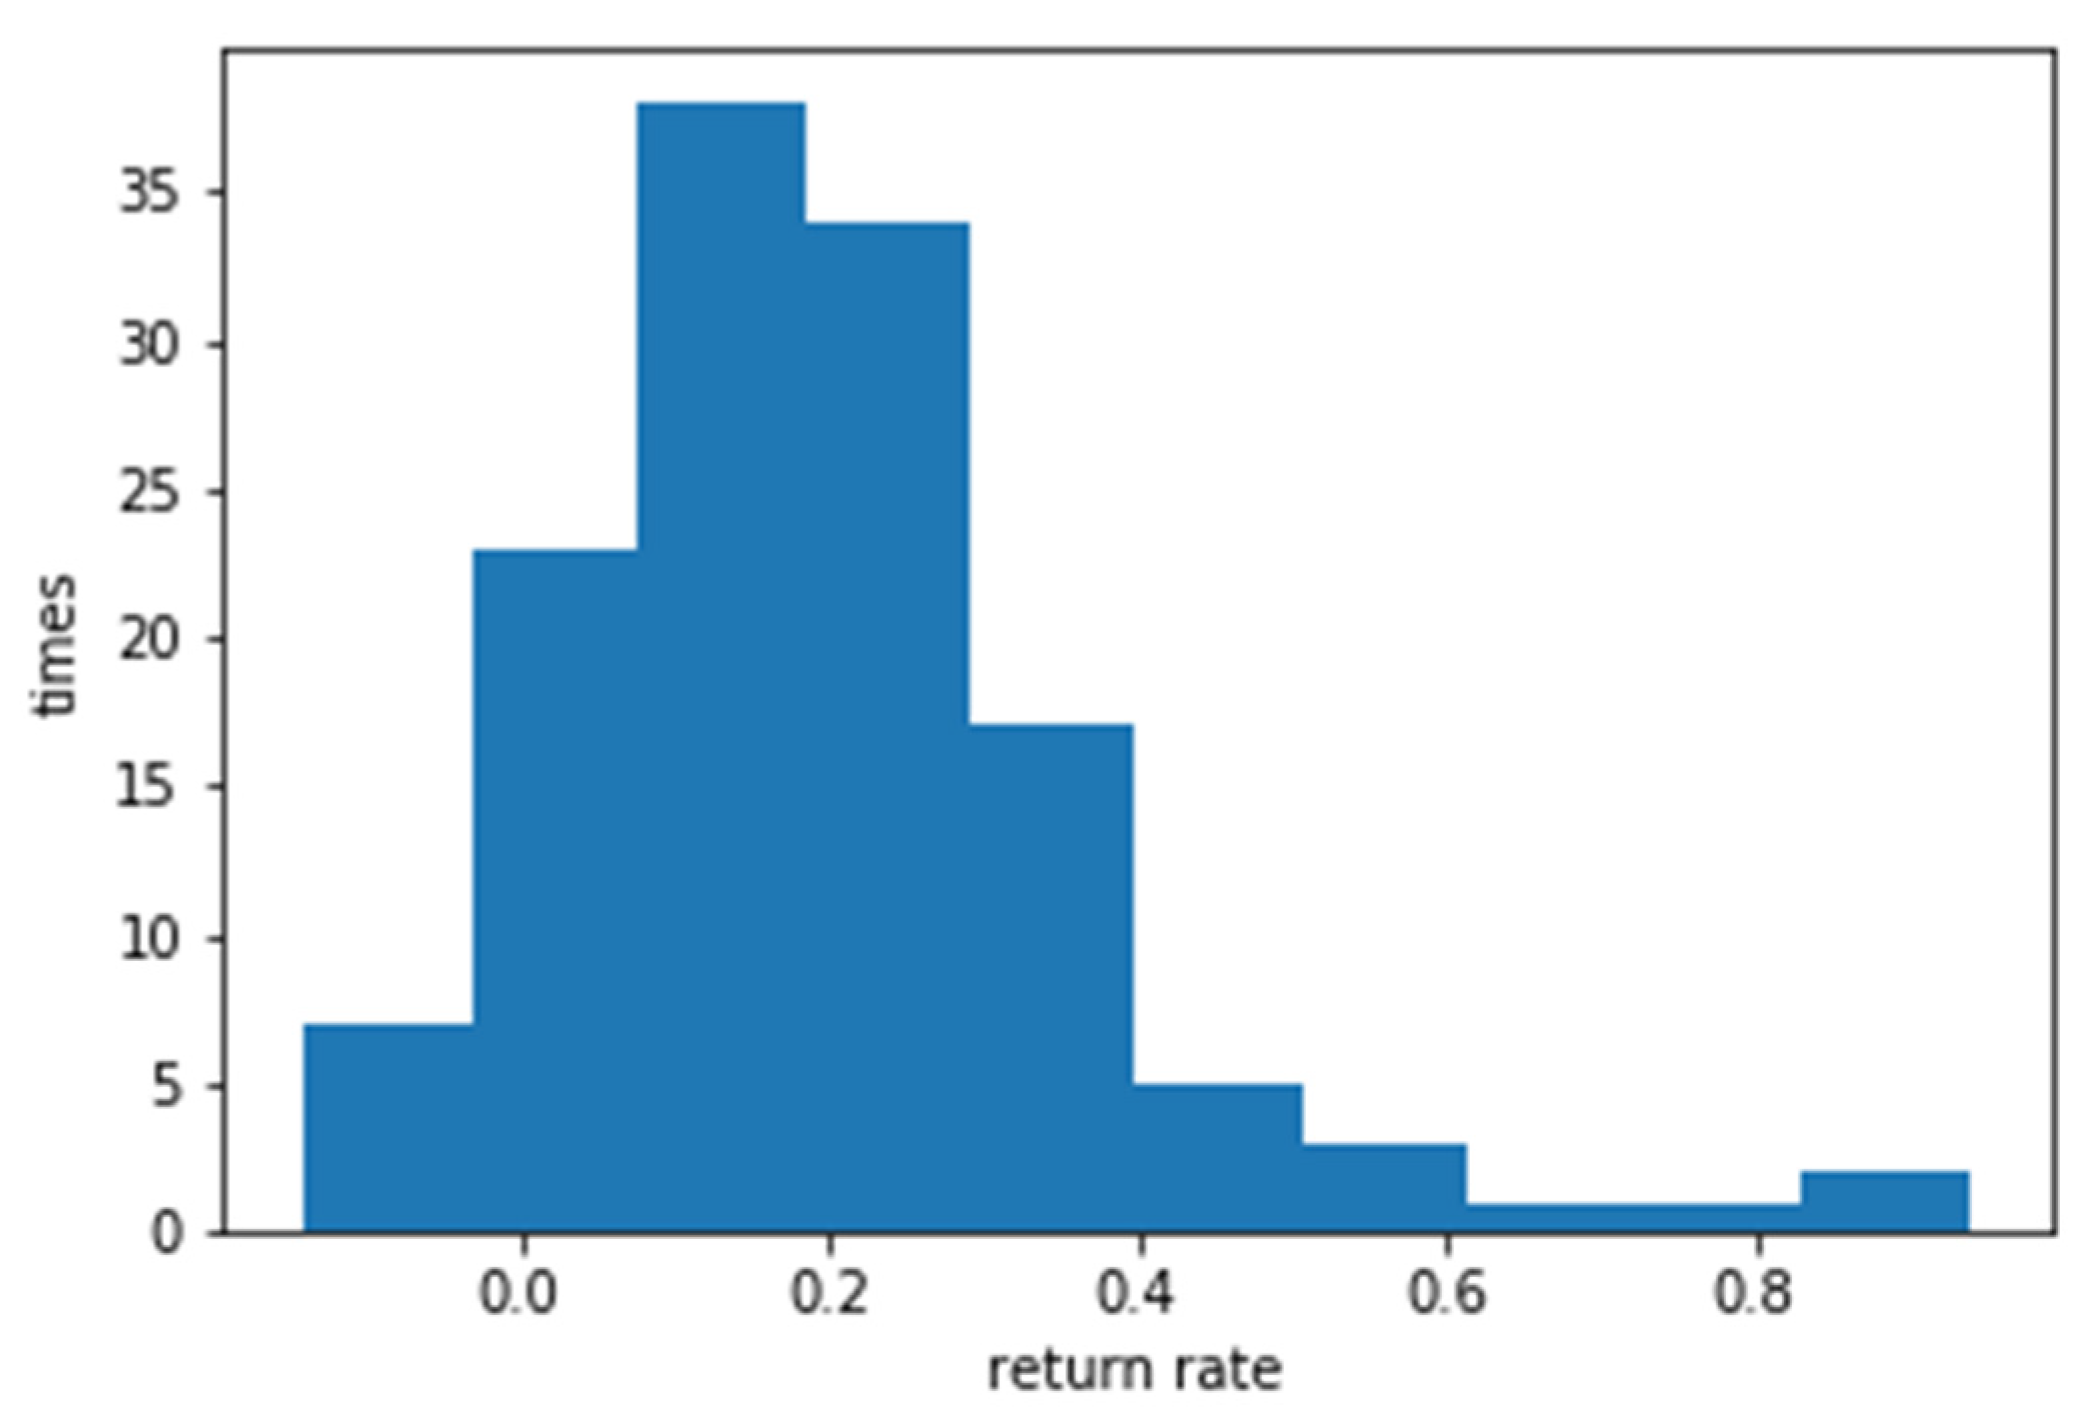
4.3.2. Simulation of the integrated solution for stock prediction with LSTM and Bollinger band without System Engineering
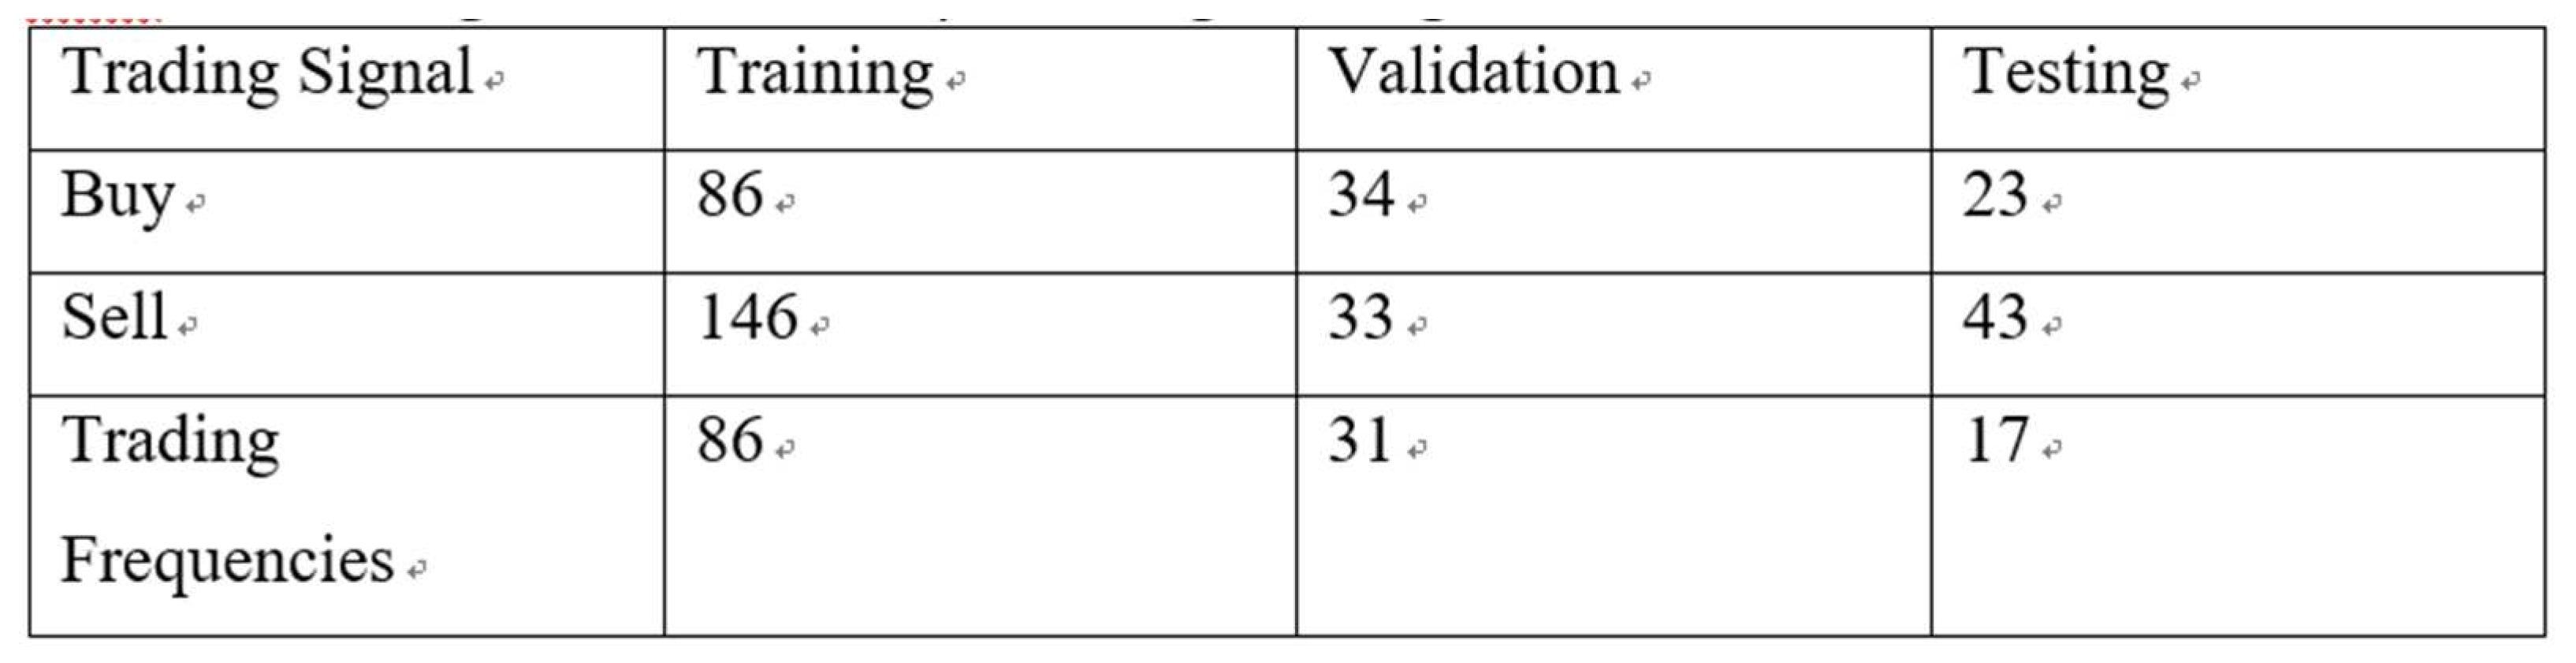
a. Number of trading signals
Table 6. Simulation of the integrated solution for trading signal with LSTM and Bollinger band without System Engineering.
b. Average return on investment
Table 7. Simulation of the integrated solution for stock price prediction average ROI with LSTM and Bollinger band with System Engineering.
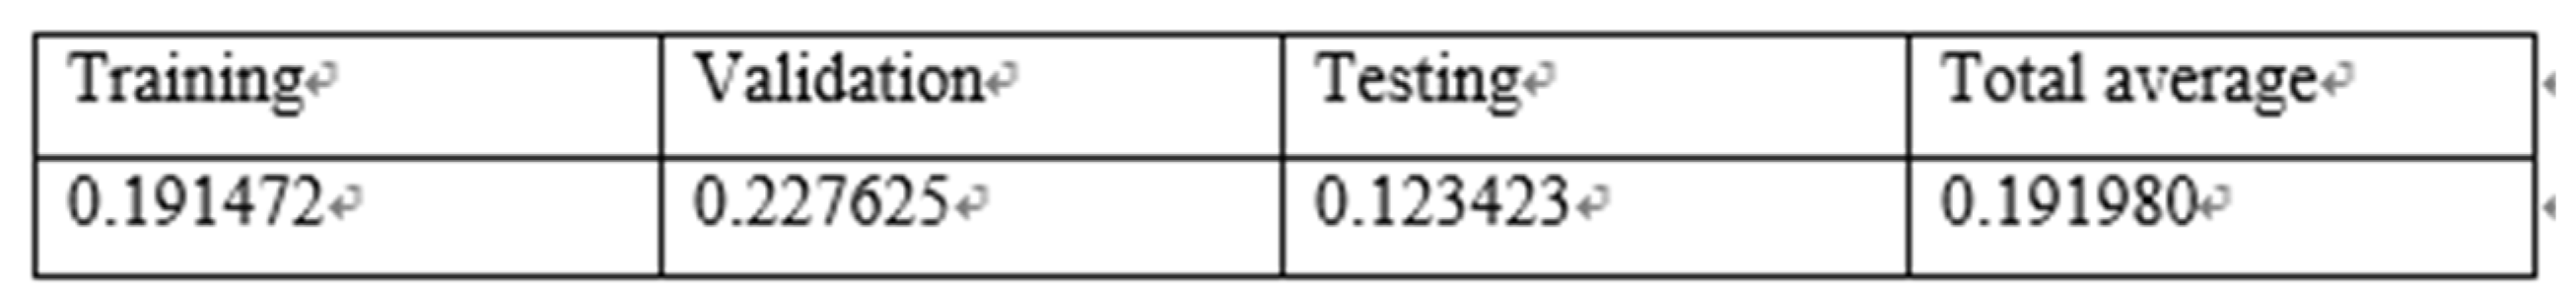
Figure 6.
Simulation of the integrated solution for the ROI of stock price prediction with LSTM and Bollinger band with System Engineering.
Figure 6.
Simulation of the integrated solution for the ROI of stock price prediction with LSTM and Bollinger band with System Engineering.
(3) Simulation of the integrated solution for stock price prediction with RESNET and Bolling Band with System Engineering
(1.) Number of trading signals
Table 8. Simulation of the integrated solution for price prediction and trading signal with ResNet and Bolling Band with System Engineering.
(2.) Average return on investment
Table 9. Bollinger Bands and Simulation System Dynamics RESNET Predicted Stock Price Integration Average Return on Investment.
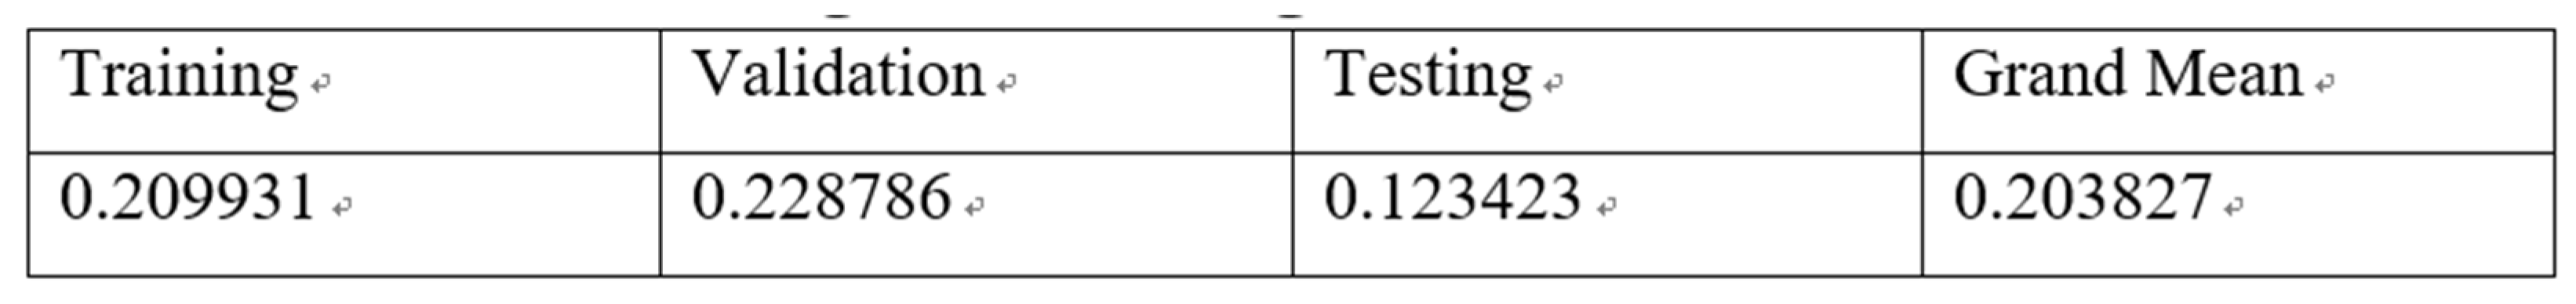
Figure 7.
Simulation of the integrated solution for stock price ROI with RESNET and Bolling Bang with System Engineering.
Figure 7.
Simulation of the integrated solution for stock price ROI with RESNET and Bolling Bang with System Engineering.
1. Simulation of the integrated solution for stock price prediction with LSTM and Bolling Bang without System Engineering
1. Number of trading signals
Table 10. Simulation of the integrated solution for stock price prediction with trading signal with LSTM and Bolling Band without System Engineering.
A. Average return on investment
Table 11. Simulation of the integrated solution for stock price prediction average ROI with LSTM and Bolling Bang without System Engineering.
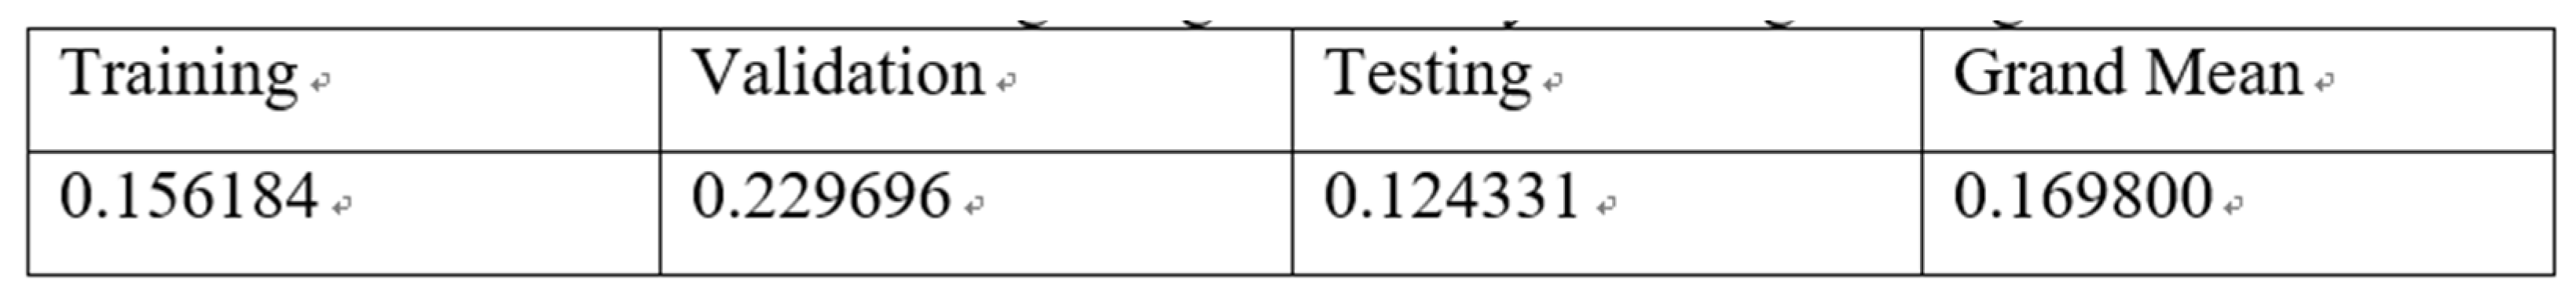
Figure 8.
Simulation of the integrated solution for ROI with LSTM and Bolling Bang without System Engineering.
Figure 8.
Simulation of the integrated solution for ROI with LSTM and Bolling Bang without System Engineering.
1. Simulation of the integrated solution for price prediction with RESNET and Bolling Band without System Engineering
Number of trading signals
Table 12. Simulation of the integrated solution for price prediction and trading signal with ResNet and Bolling Band without System Engineering.
A. Average return on investment
Table 13. The average ROI for Simulation of the integrated solution for price prediction and trading signal with RESNET and Bolling Band without System Engineering.
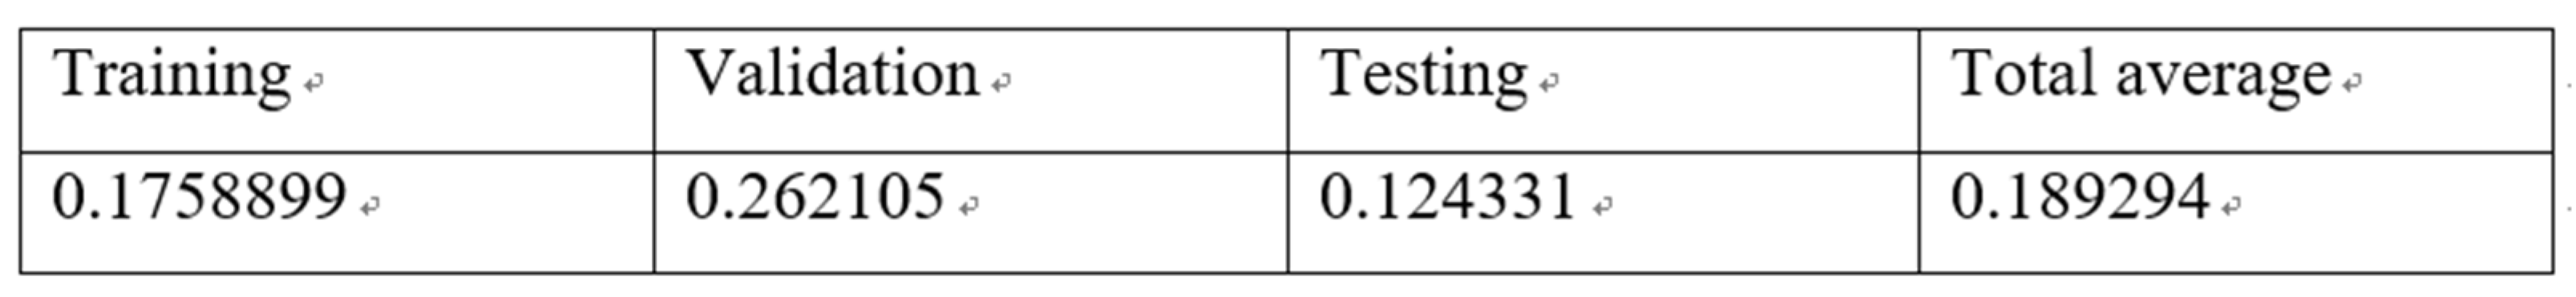
Table 14. Table of Return on Investment by Various Methods.
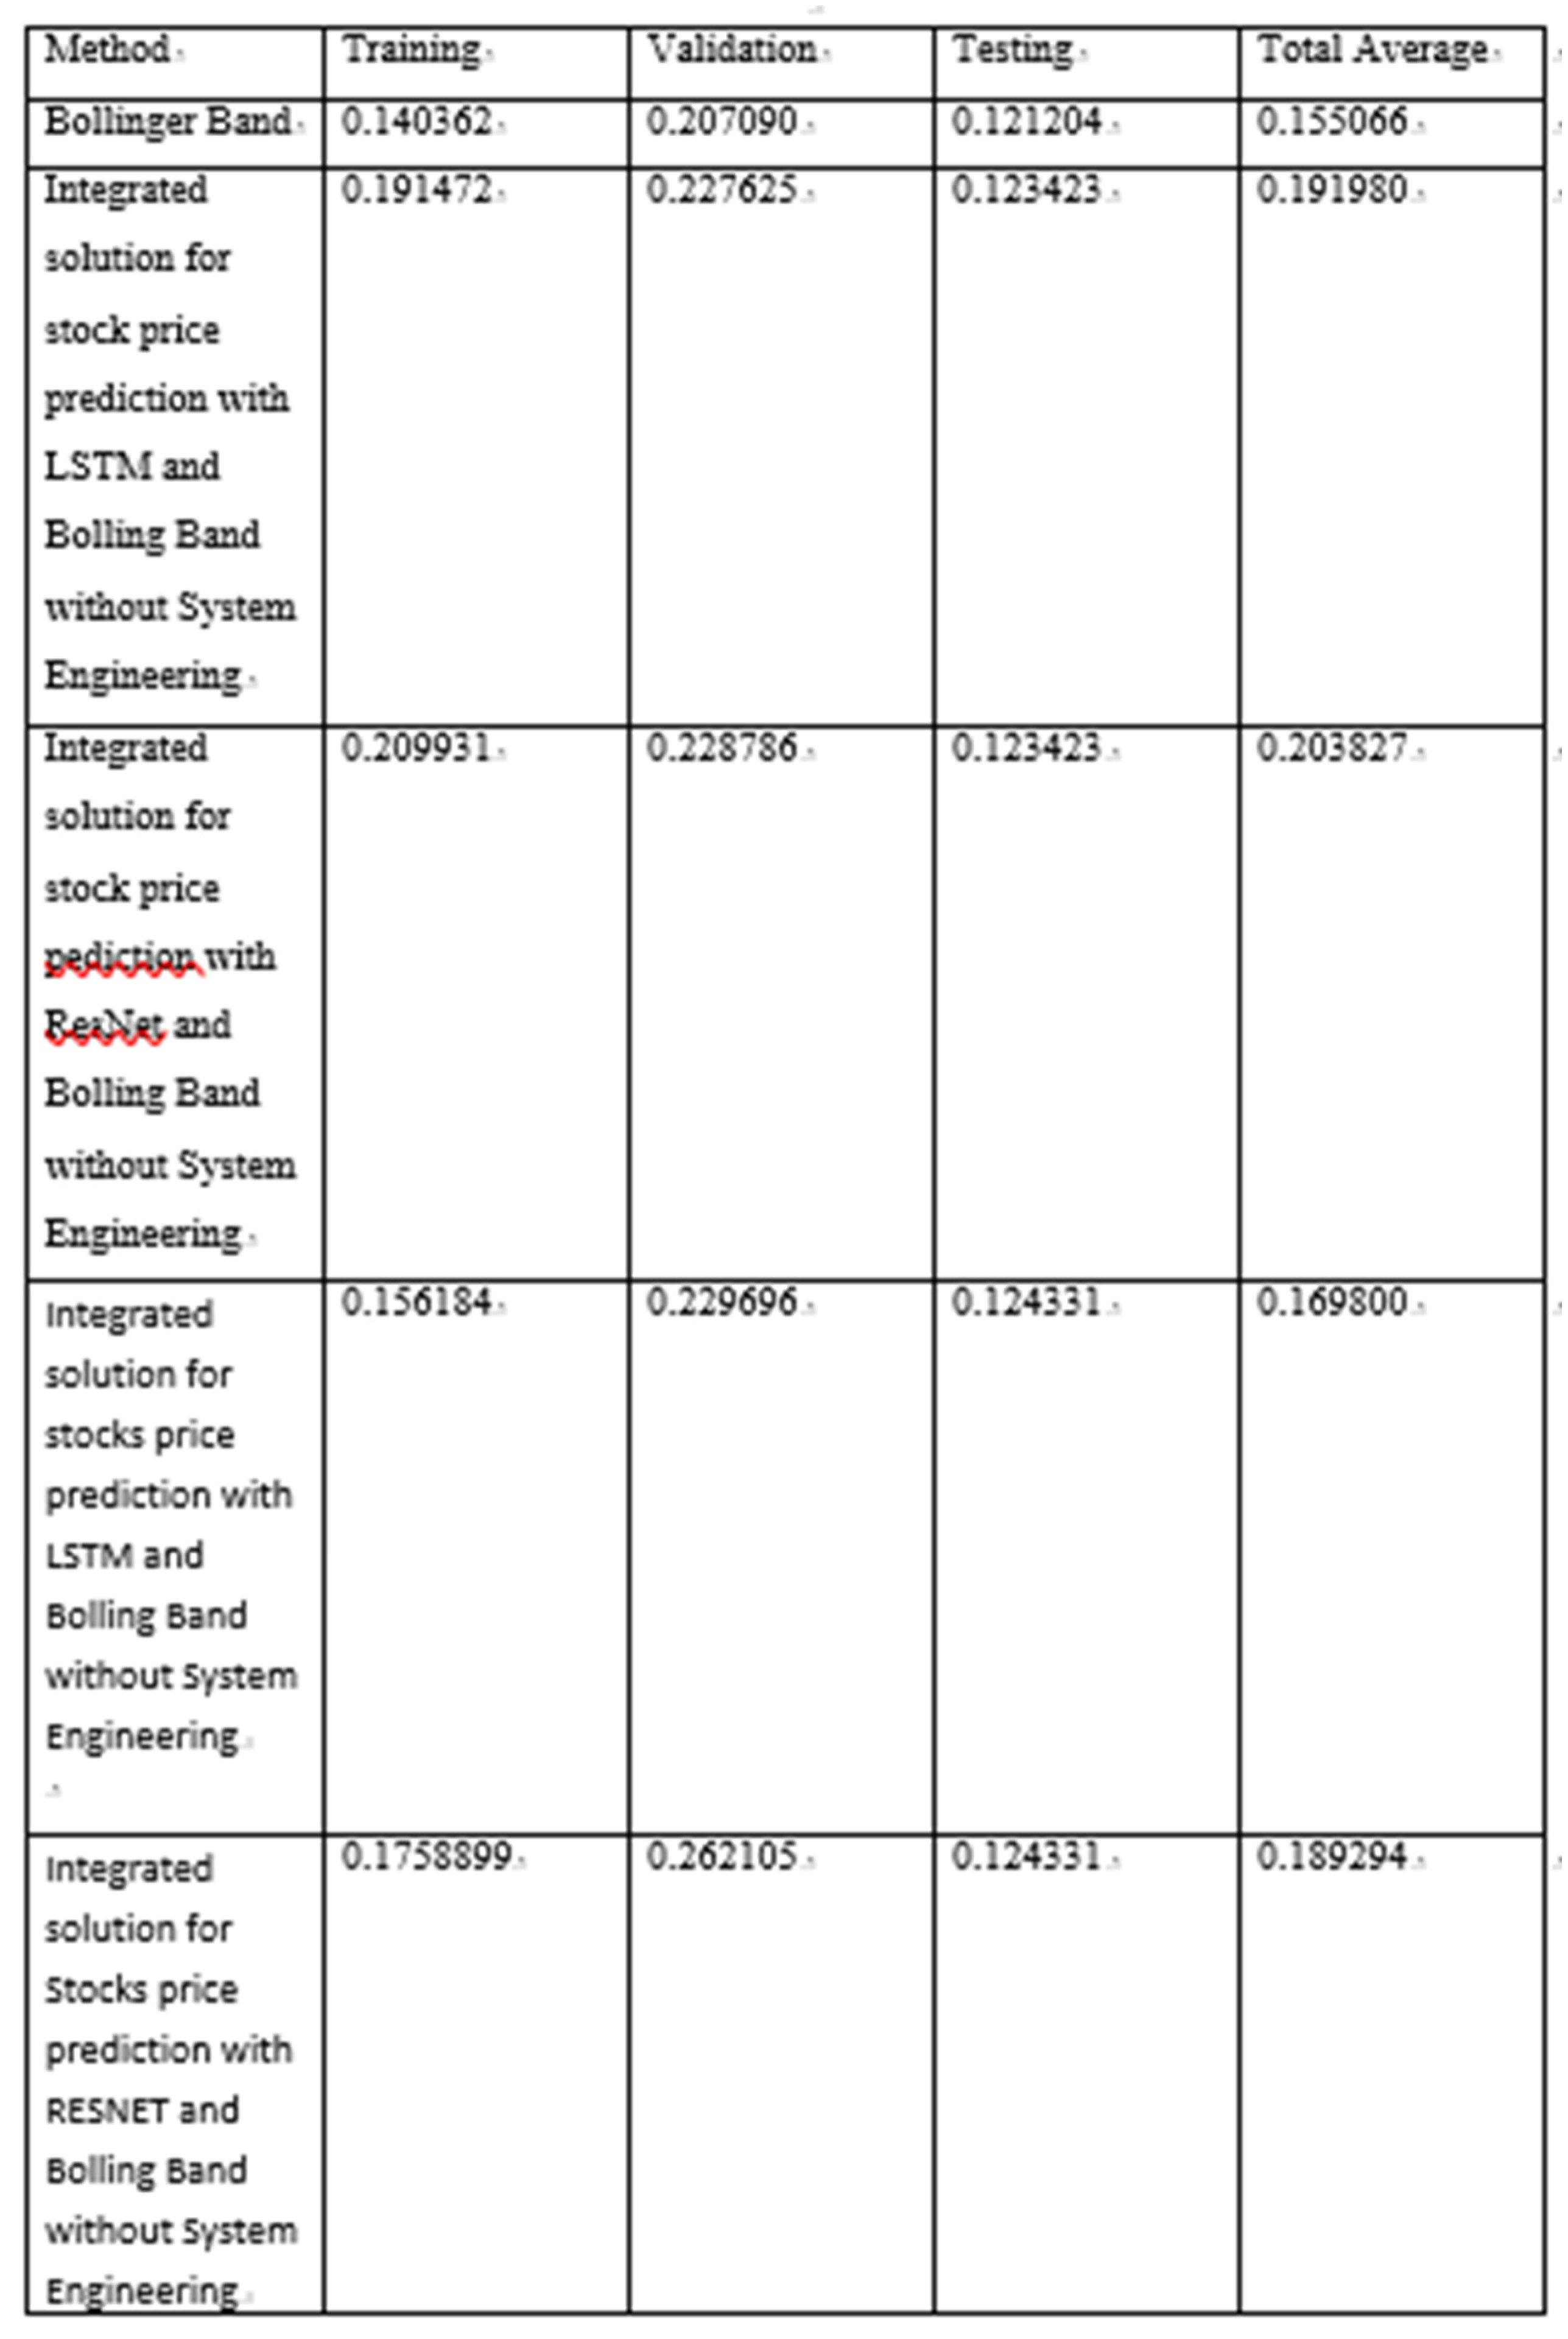
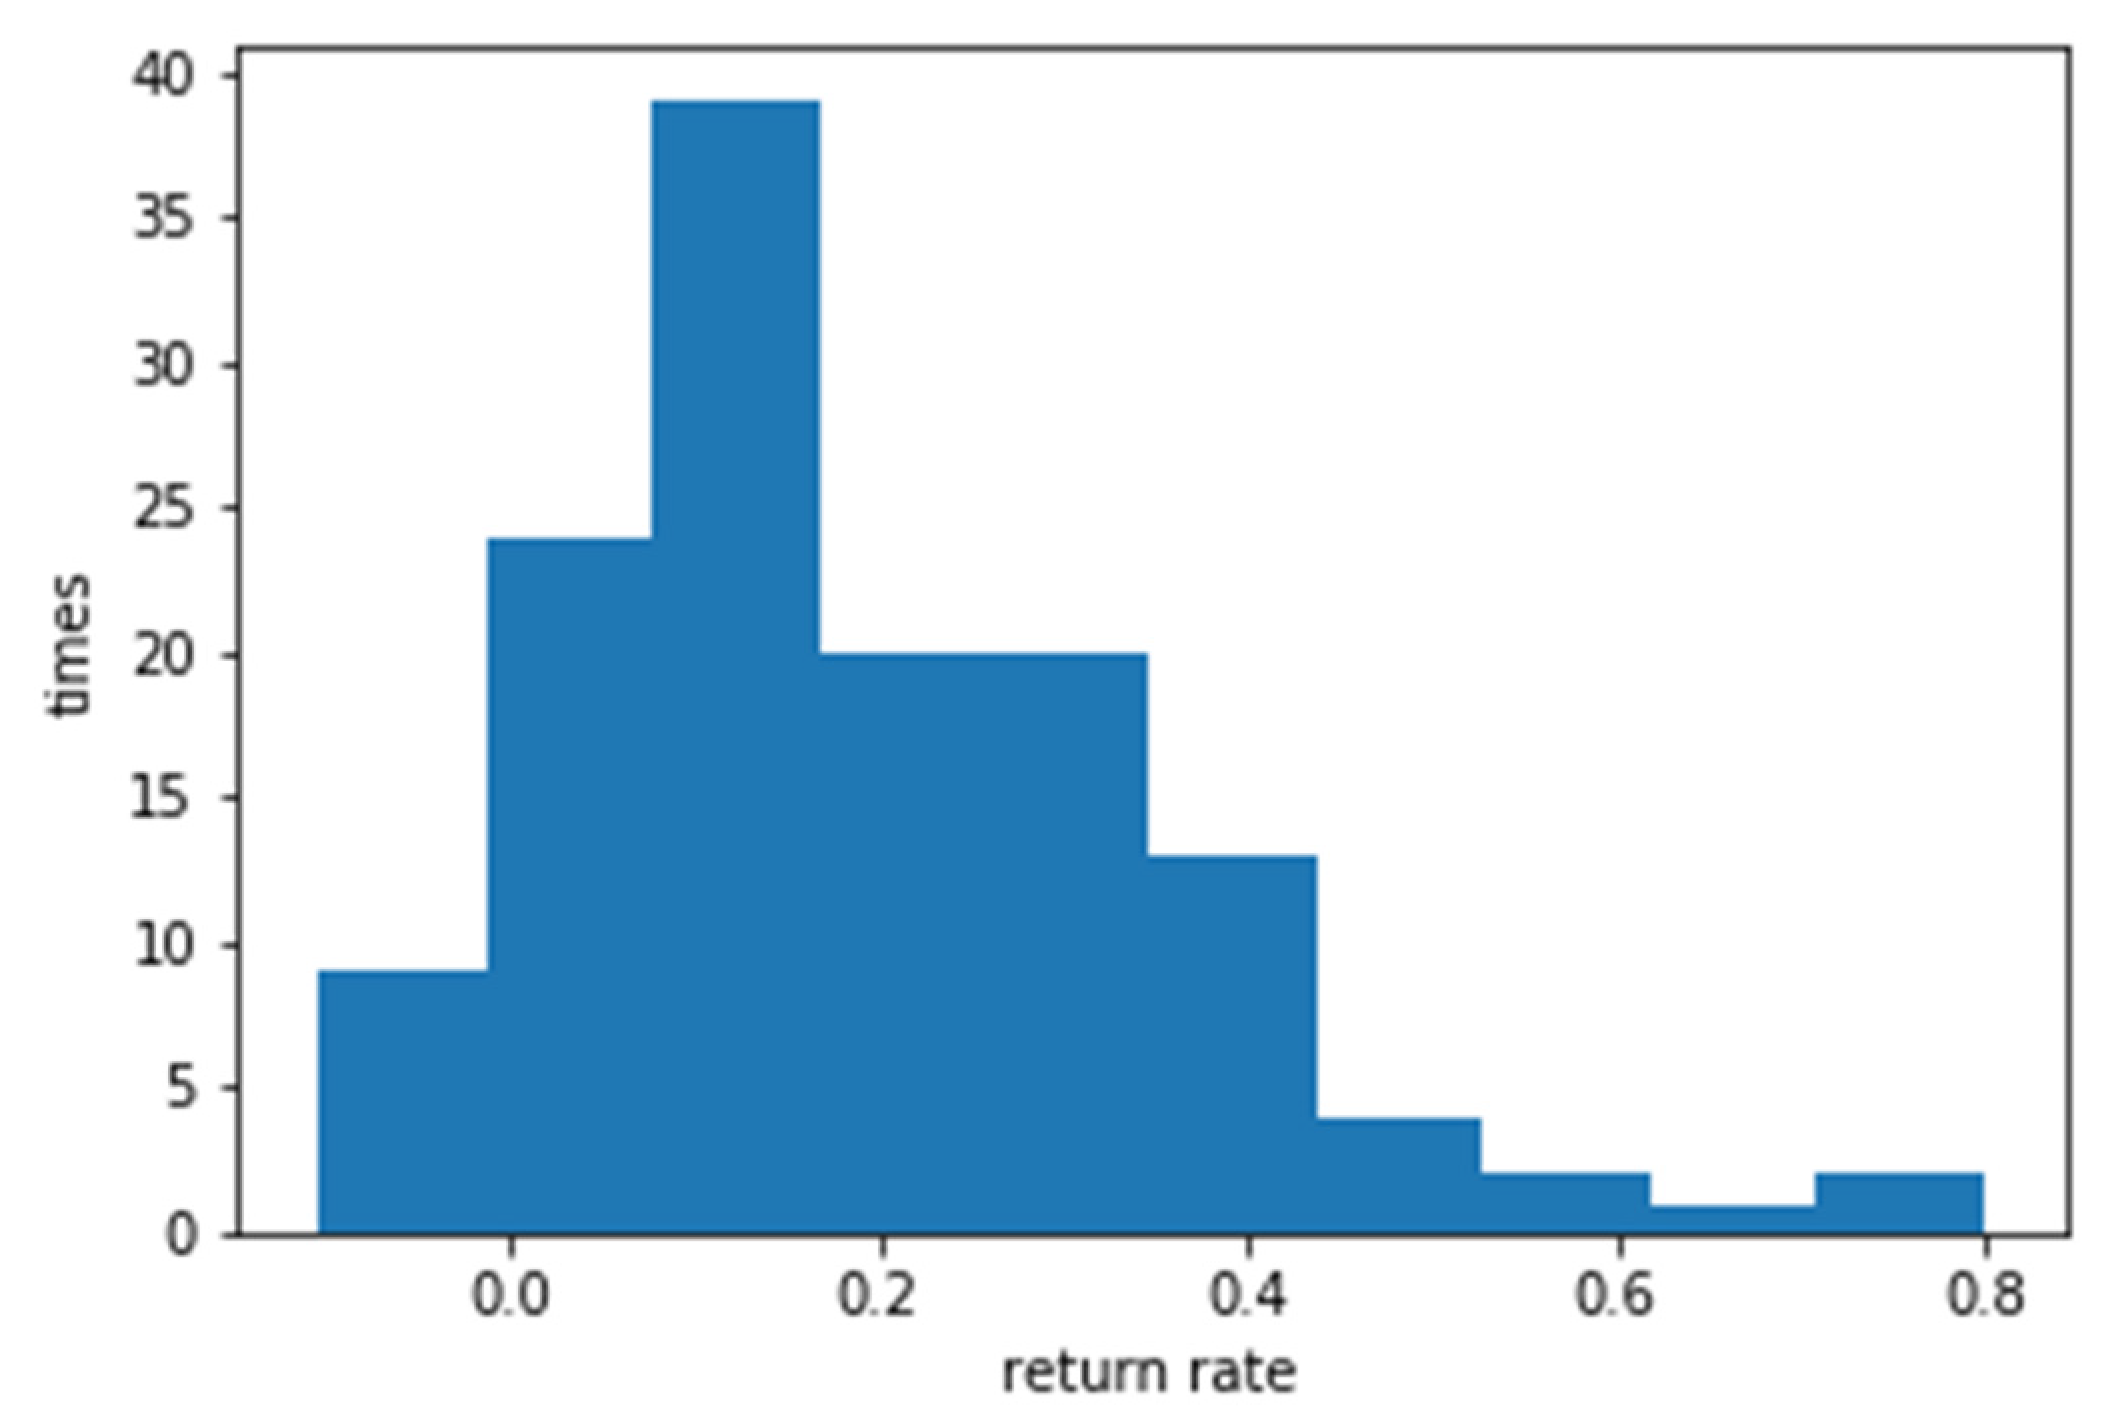
Figure 9.
Simulation of the integrated solution for ROI with RESNET and Bolling Bang without System Engineering.
Figure 9.
Simulation of the integrated solution for ROI with RESNET and Bolling Bang without System Engineering.
5. Conclusion of return on investment
Bollinger Bands was an effective method originally, through its extended index %b, as the basis for buying and selling decisions, effective investment strategies can be derived. Notwithstanding the above, the return on investment can indeed be increased again through the integration with the forecast stock price. Under the simulation system engineering, the average return on investment after integration with the LSTM forecast stock price is 19.1%, and the average return on investment after integration with the RESNET forecast stock price is 20.3%; without the simulation system engineering, the average investment after integration with the LSTM forecast stock price, the return rate was 16.9%, and the average return on investment after integration with the RESNET forecast stock price was 18.9%. Both under the simulation system engineering and without system engineering integration with LSTM stock price forecast have return on investment higher than the original Bollinger Bands average return on investment of 15.5%. The propose of experimental design is accurate that the current stock price still represents a relatively high/low point at present and in the future through the integration of future information to make better decisions.
6. Research conclusions and recommendations
This study applies neural networks to predict stock prices based on TSMC stock data from January 1, 2007 to December 31, 2018, and uses volume-price relations, system engineering, and Bollinger bang to build decision-making strategies to confirm the combination of stock prices forecasting. The result displays that with Bollinger Bands the return on investment has improved. The conclusion is as follows:
- This is the first research proposes the use of the potential structure of the relationship between volume and price, which combines convolutional layers and residual networks through a Cycle Generative Adversarial Network to observe and learn the relationship between volume and price. The contribution of this research is the experiments have proved that this network does have a joint effect between volume and price.
- Experimental testing of 20, 30, and 40 days of volume and price input into the Cycle Generative Adversarial Network, the results show that the lowest cycle loss can be obtained by using the volume and price of 30 days.
- Integrate the results of Cycle Generative Adversarial Network learning into the system engineering, assuming that the potential volume and price are different from the current volume and price, which will form momentum to affect the future stock price, which is achieved by simulating system engineering; on the other hand, it is assumed that the result of Cycle Generative Adversarial Network would be the future trend of volume and price for the prediction of stock prices by inputting to the neural network. The experiment discover that the latter’s stock price forecasting is more accurate, and its forecast stock price error is lower than the former.
- Continuing the results above, the latter RESNET predicts that the stock price will be the best in the experiment after 5 days (weekly), and the average error from the stock price is 3.464465, while the LSTM is 3.47009, which is slightly higher than the former.
- By predicting the integration of stock price and Bollinger bands after 5 days, experiments show that Bollinger bands with future information perform better than Bollinger bands that only use past information. Predicting stock prices does help the Bollinger band’s extension index %b to make good trading decisions which increased the average return on investment by 30%. This proves that the system engineering can be dealt with only to alarm the problem. It is another contribution for this research.
In view of the shortcomings of this research, we propose future improvements and develop-ment directions:
- Starting from the data, by collecting more foreign stock data to compare whether the domestic and foreign markets have the same effect, or the domestic stocks with lower trading volume, to further verify the versatility of this method.
- As far as trading strategies are concerned, currently only Bollinger Bands and its extension index %b are used as trading signals. Perhaps in the future, different types of trading signals can be tried to integrate with stock prices forecasting.
- In terms of neural network model and simulation system engineering, this study uses RESNET and LSTM to predict stock prices. In the future, we can consider using DenseNet and add more parameters to make it perform better in stock price predictions.
References
- Bollinger, J. (1992), ‘Using Bollinger Bands’, Stocks & Commodities, Vol.10:2, pp.47- 51.
- DeMark, T. R. (1984), ‘The New Science of Technical analysis’, New York:John Wiley and Sons, Inc.
- Gers, F. A. , Schmidhuber, J., and Cummins, F.(1999), ‘Learning to forget: Continual prediction with LSTM’, Proceedings of 9th International Conference on Artificial Neural Networks: ICANN, Edinburgh, UK, pp.850 – 855.
- He Kaiming, Zhang Xiangyu, Ren Shaoqing & Sun Jian (2016),’Deep residual learning for image recognition’, Proceedings of 2016 IEEE Conference on Computer Vision and Pattern Recognition (CVPR), Las Vegas, NV (652). pp 770 - 778.
- Hiemstra C and Jones, JD. (1994), ‘Testing for Linear and Nonlinear Granger Causality in the Stock Price-Volume Relation’, The Journal of Finance, Vol. XLIX, No. 5, pp.1639-1664.
- Hochreiter Sepp and Schmidhuber Jürgen (1997), ‘Long Short-Term Memory’, Neural Computation, Vol.9, No.8, pp.1735-1780.
- Goodfellow, Ian, Pouget-Abadie Jean, Mirza Mehdi, Xu Bing, Warde-Farley David, Ozair Sherjil, Courville Aaron, and Bengio Yoshua (2014), Generative Adversarial Nets’, Proceedings of Advances in Neural Information Processing Systems 27(NIPS 2014), Montreal, Canada.
- Karpoff, J.M. (1987), ‘The Relation between Price Changes and Trading Volume: A Survey,’ Journal of Financial And Quantitative Analysis, Vol. 22, No. 1.
- Seely Samuel (1972), ‘An Introduction to Engineering Systems,’ Pergamon Press Inc.
- Sheu, Her-Jiun, Wu Soushan and Ku Kuang-Ping(1998), ‘Cross-sectional relationships between stock returns and market beta, trading volume, and sales-to-price in Taiwan,’ International Review of Financial Analysis, 7, 1-18.
- Stickel, S.E. and Verrecchia R.E.(1994), ‘Evidence That Trading Volume Sustains Stock Price Changes’, Financial Analysts Journal, Vol. 50, No. 6, pp.57-67.
- Ying, Charles C. (1966), ‘Stock Market Prices and Volumes of Sales’, Econometrica, Vol. 34, No. 3, pp.676-685.
- Zhu, Jun-Yan, Park, Taesung, Isola, Phillip, & Efros, Alexei A..(2017), ‘Unpaired Image-to-Image Translation Using Cycle-Consistent Adversarial Networks’, Proceedings of the IEEE International Conference on Computer Vision (ICCV), 2017, Venice, Italy.
Figure 1.
Residual Block.
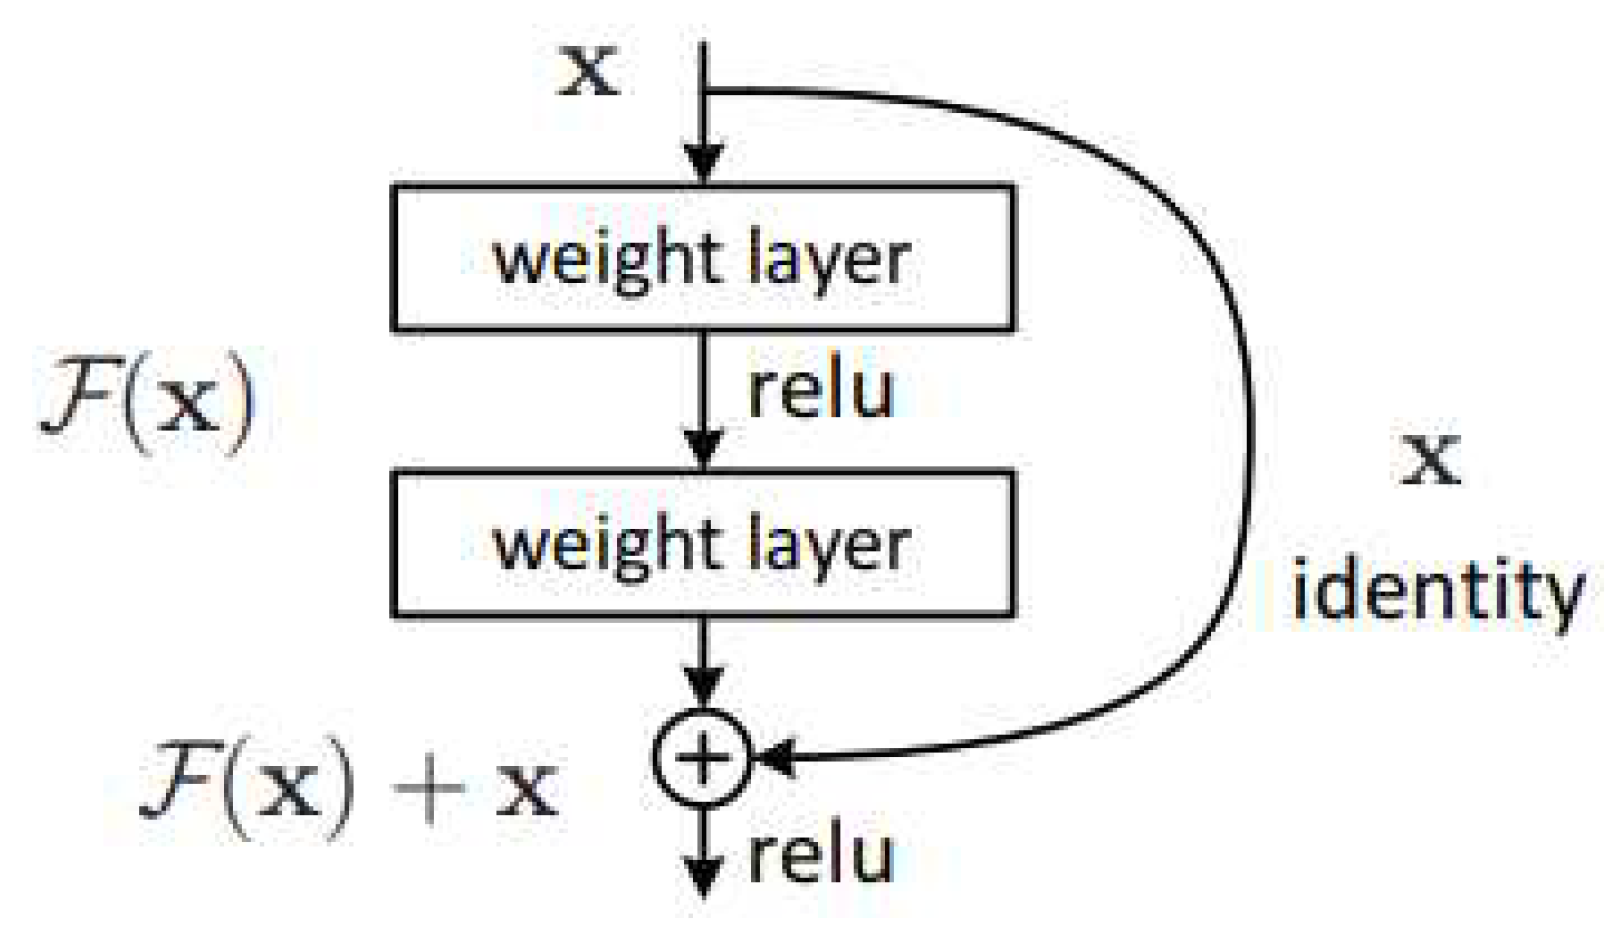
Figure 2.
Cycle Generative Adversarial Network design diagram.
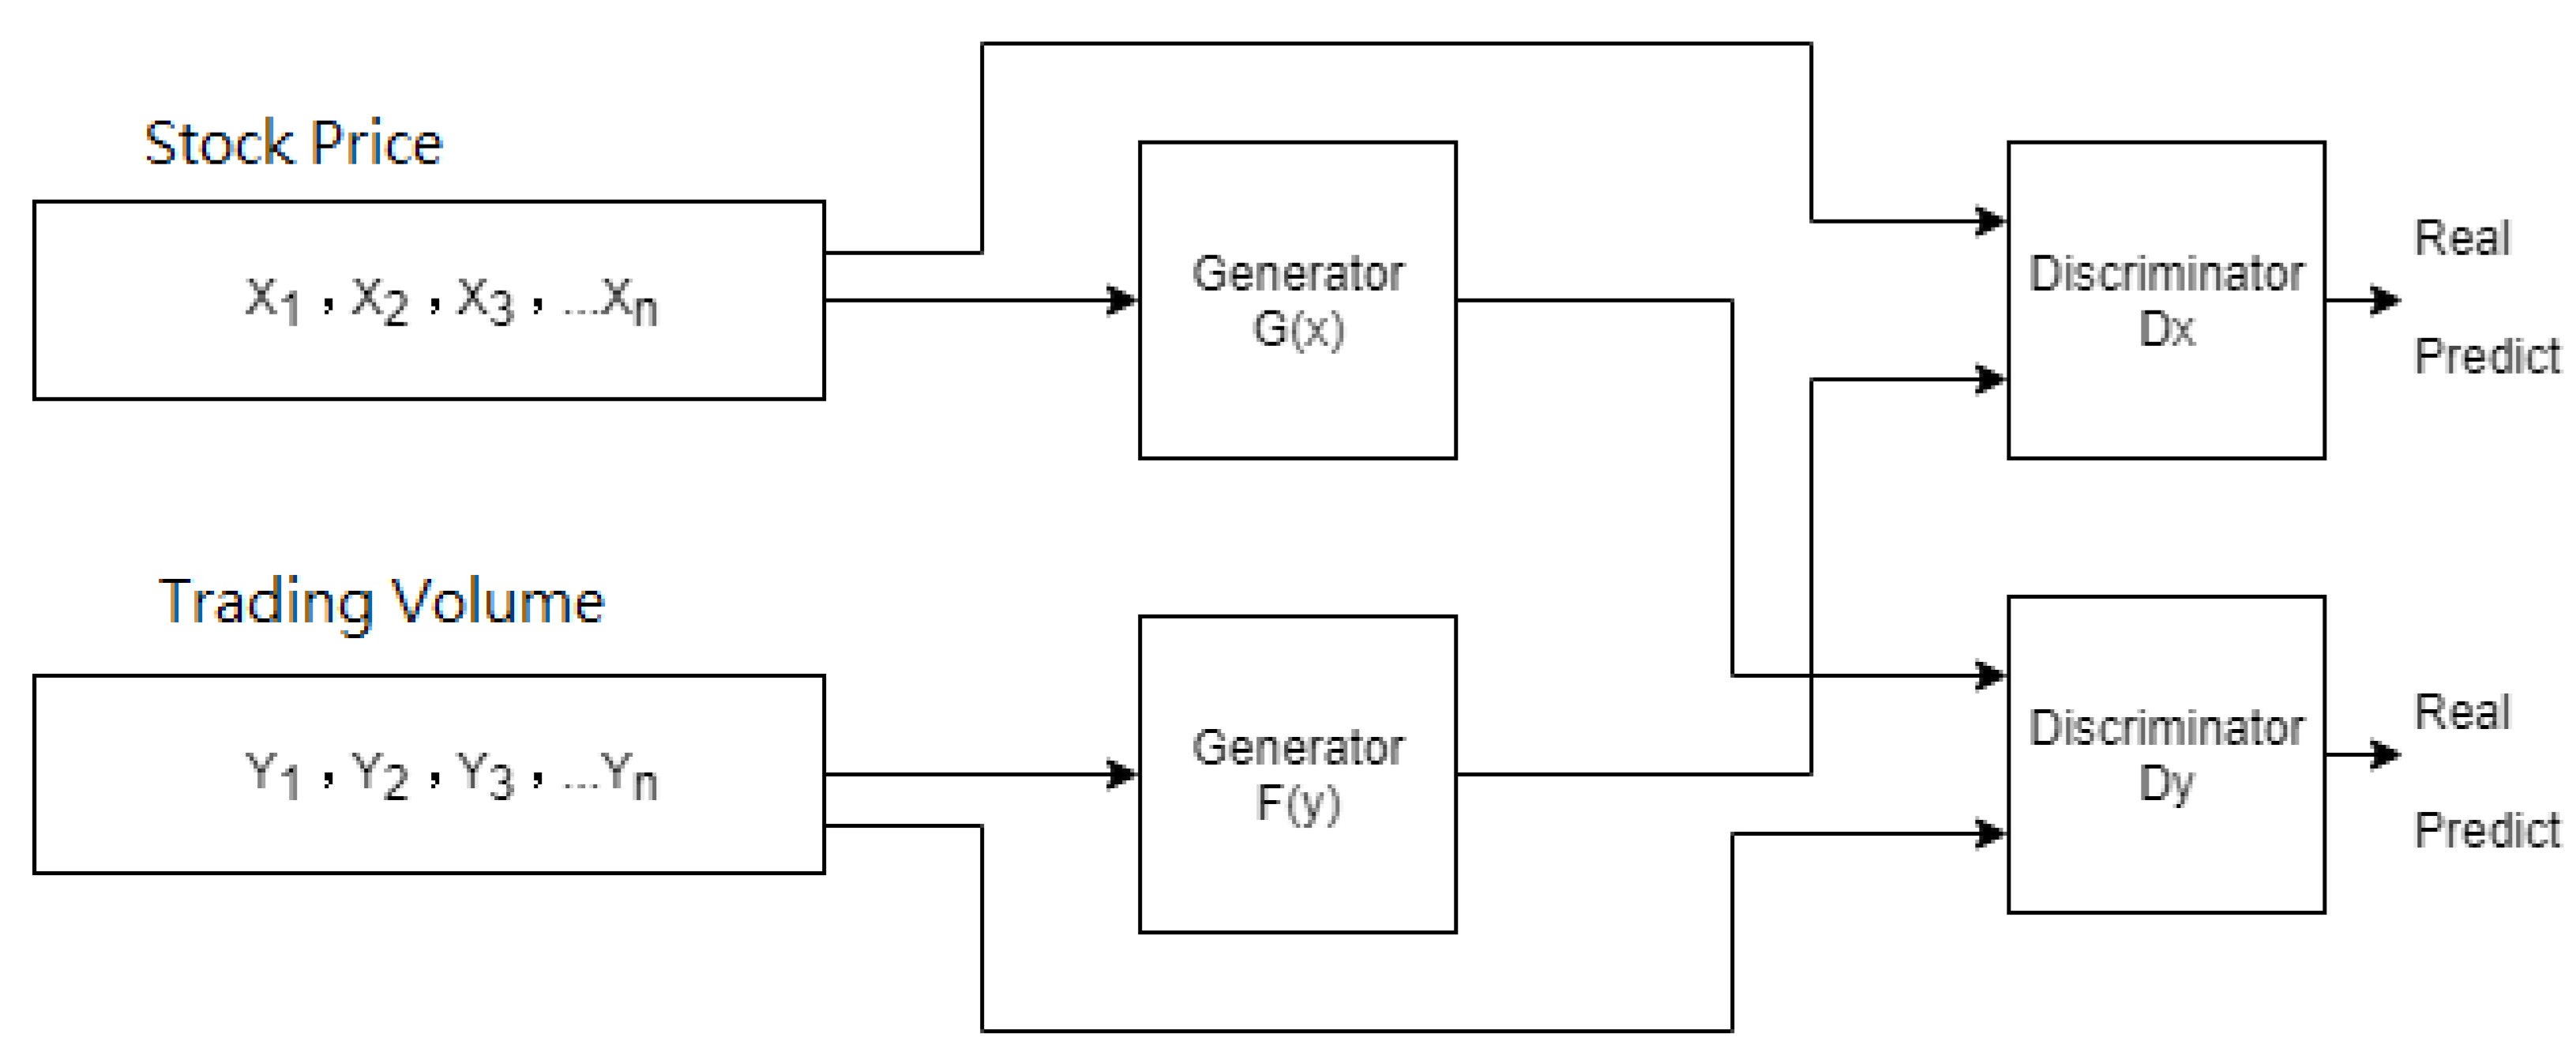
Figure 3.
Prediction framework of stock price with simulation system engineering.
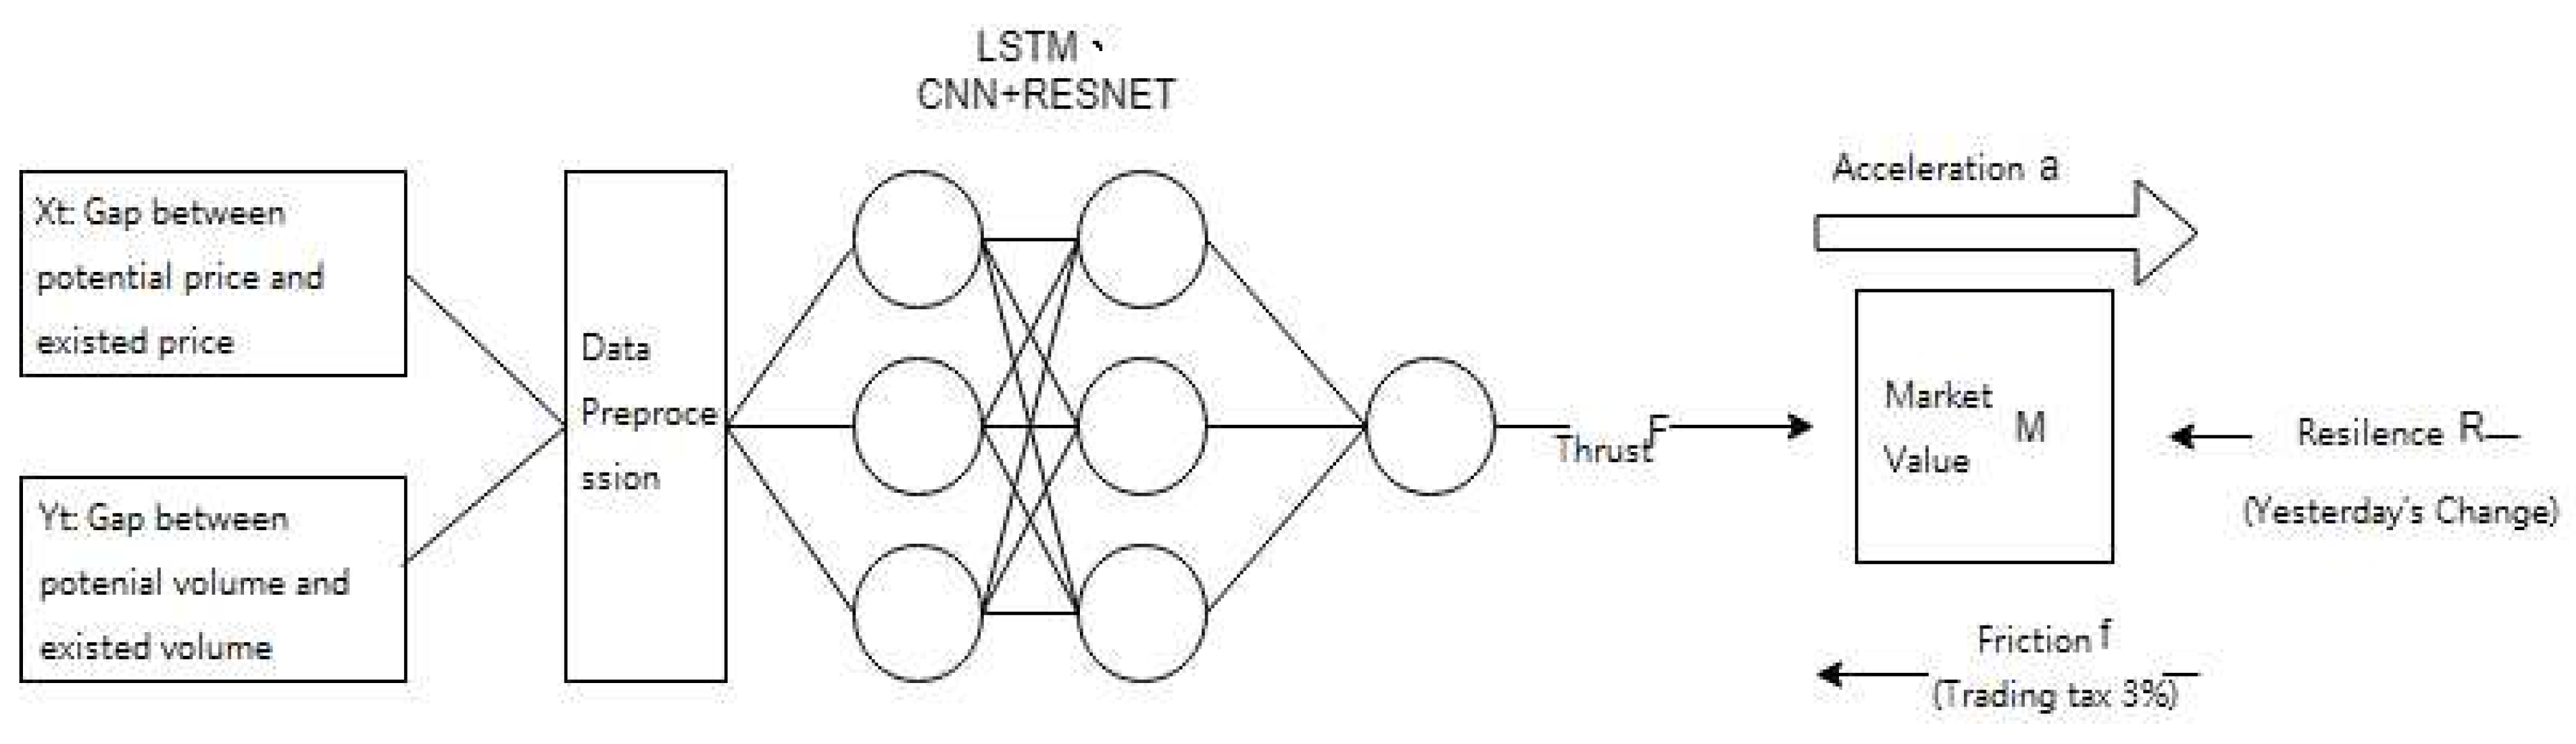
Figure 4.
CycleGAN loss.
Disclaimer/Publisher’s Note: The statements, opinions and data contained in all publications are solely those of the individual author(s) and contributor(s) and not of MDPI and/or the editor(s). MDPI and/or the editor(s) disclaim responsibility for any injury to people or property resulting from any ideas, methods, instructions or products referred to in the content. |
© 2023 by the authors. Licensee MDPI, Basel, Switzerland. This article is an open access article distributed under the terms and conditions of the Creative Commons Attribution (CC BY) license (https://creativecommons.org/licenses/by/4.0/).
Copyright: This open access article is published under a Creative Commons CC BY 4.0 license, which permit the free download, distribution, and reuse, provided that the author and preprint are cited in any reuse.


