Submitted:
25 August 2023
Posted:
29 August 2023
You are already at the latest version
Abstract
Keywords:
1. Introduction
2. Materials and Methods
2.1. Sample preparation
2.2. Microstructure characterization
2.3. Compression tests
2.4. Numerical permeability simulation
3. Results and discussion
3.1. Dilatometry analysis
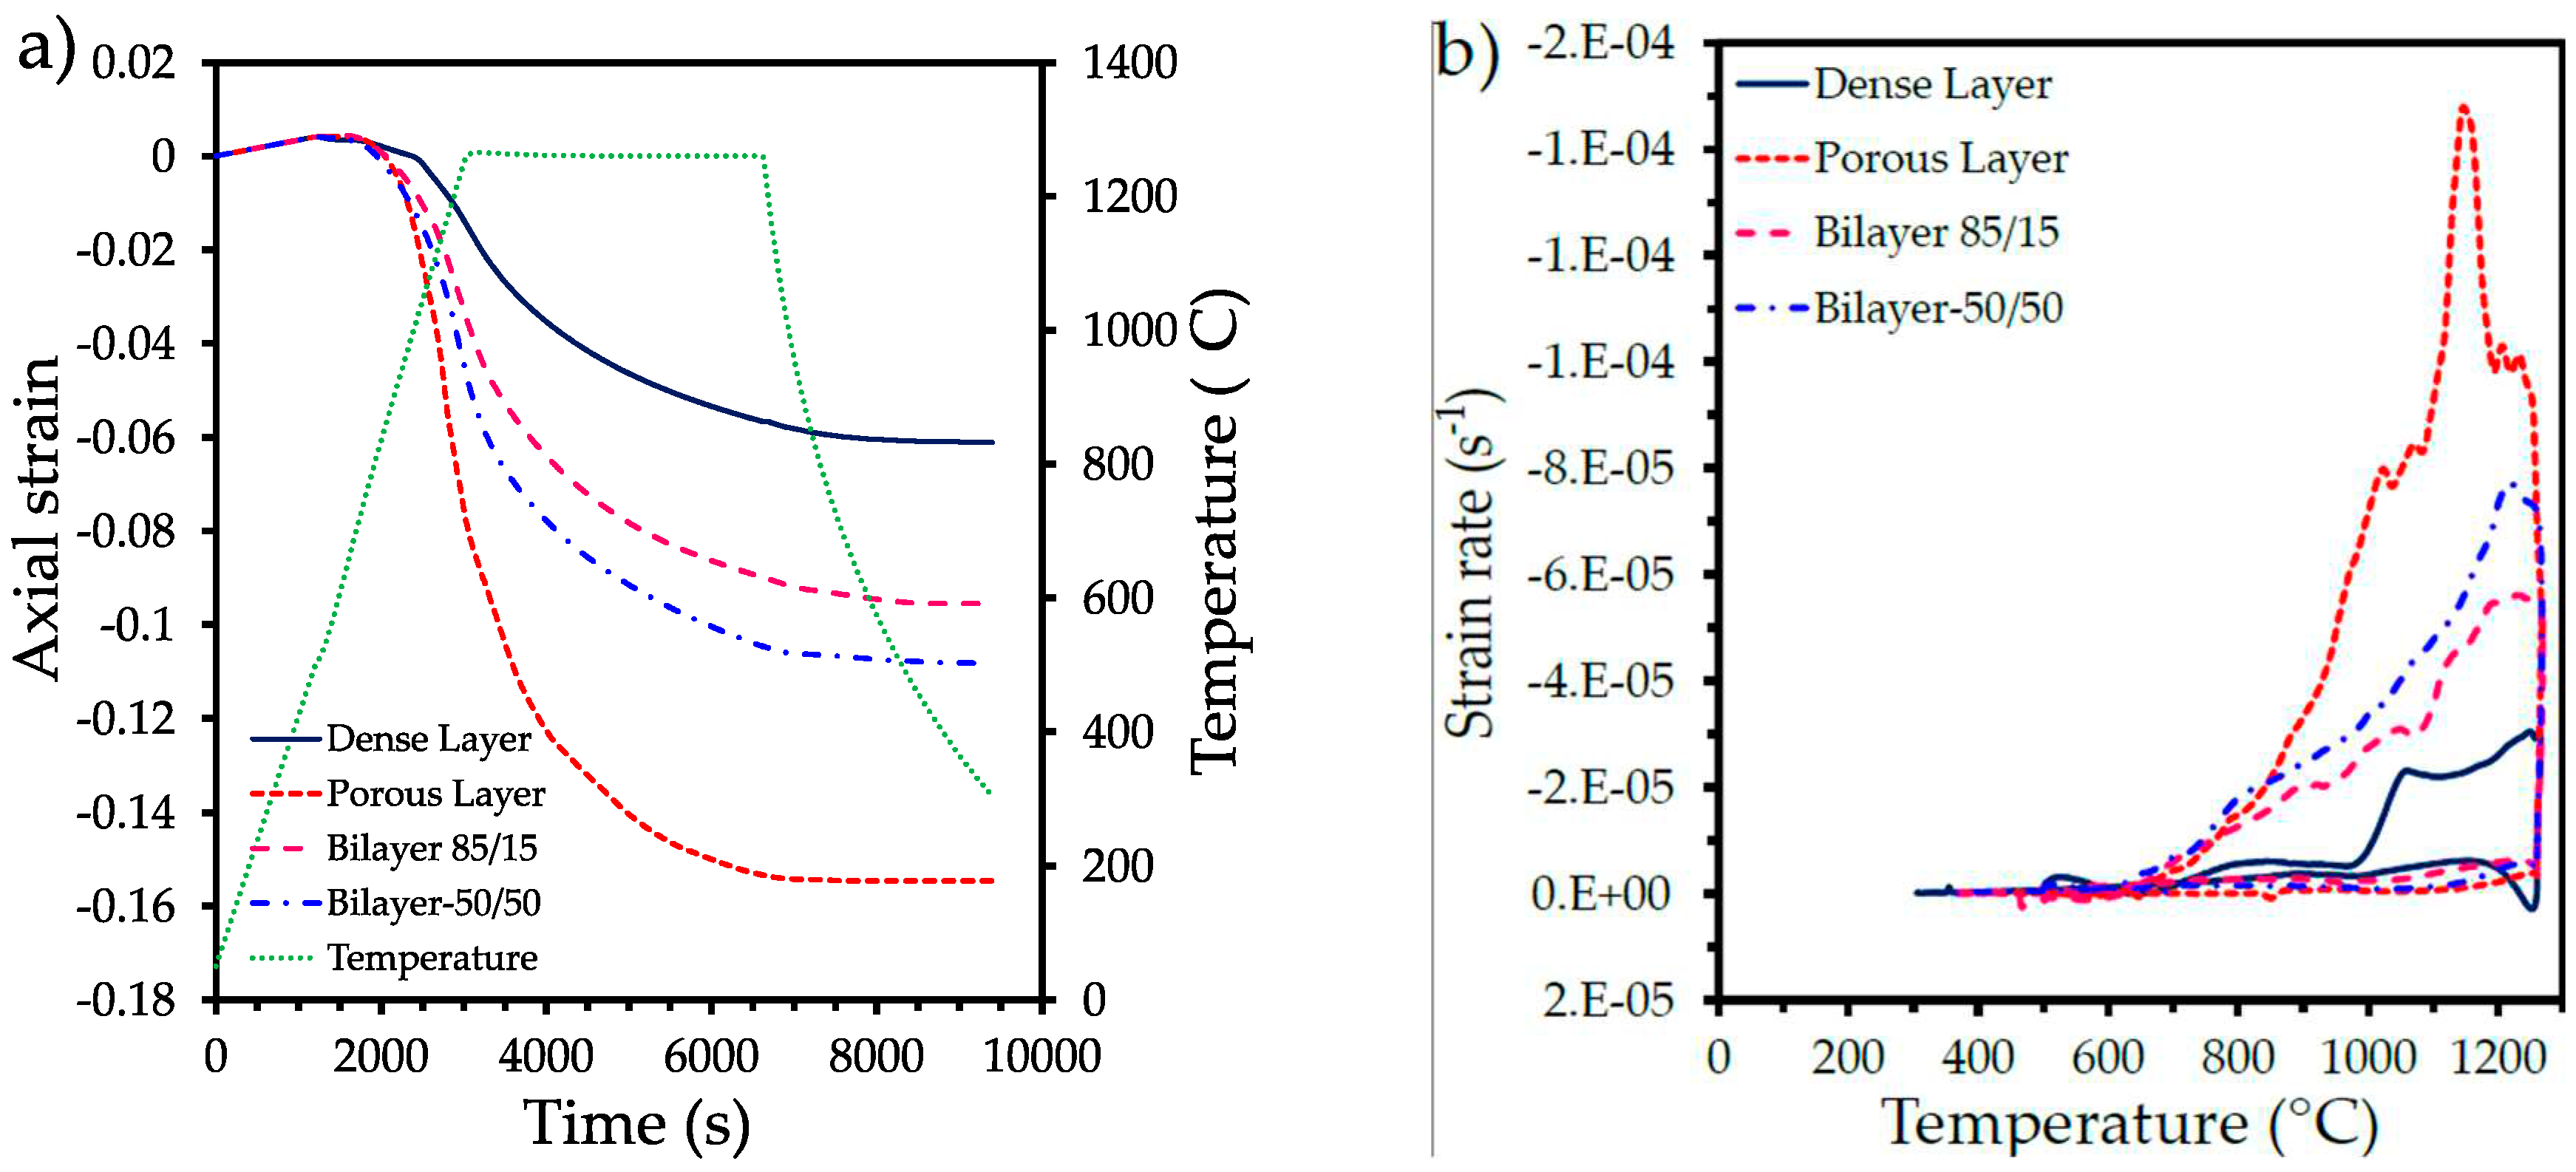
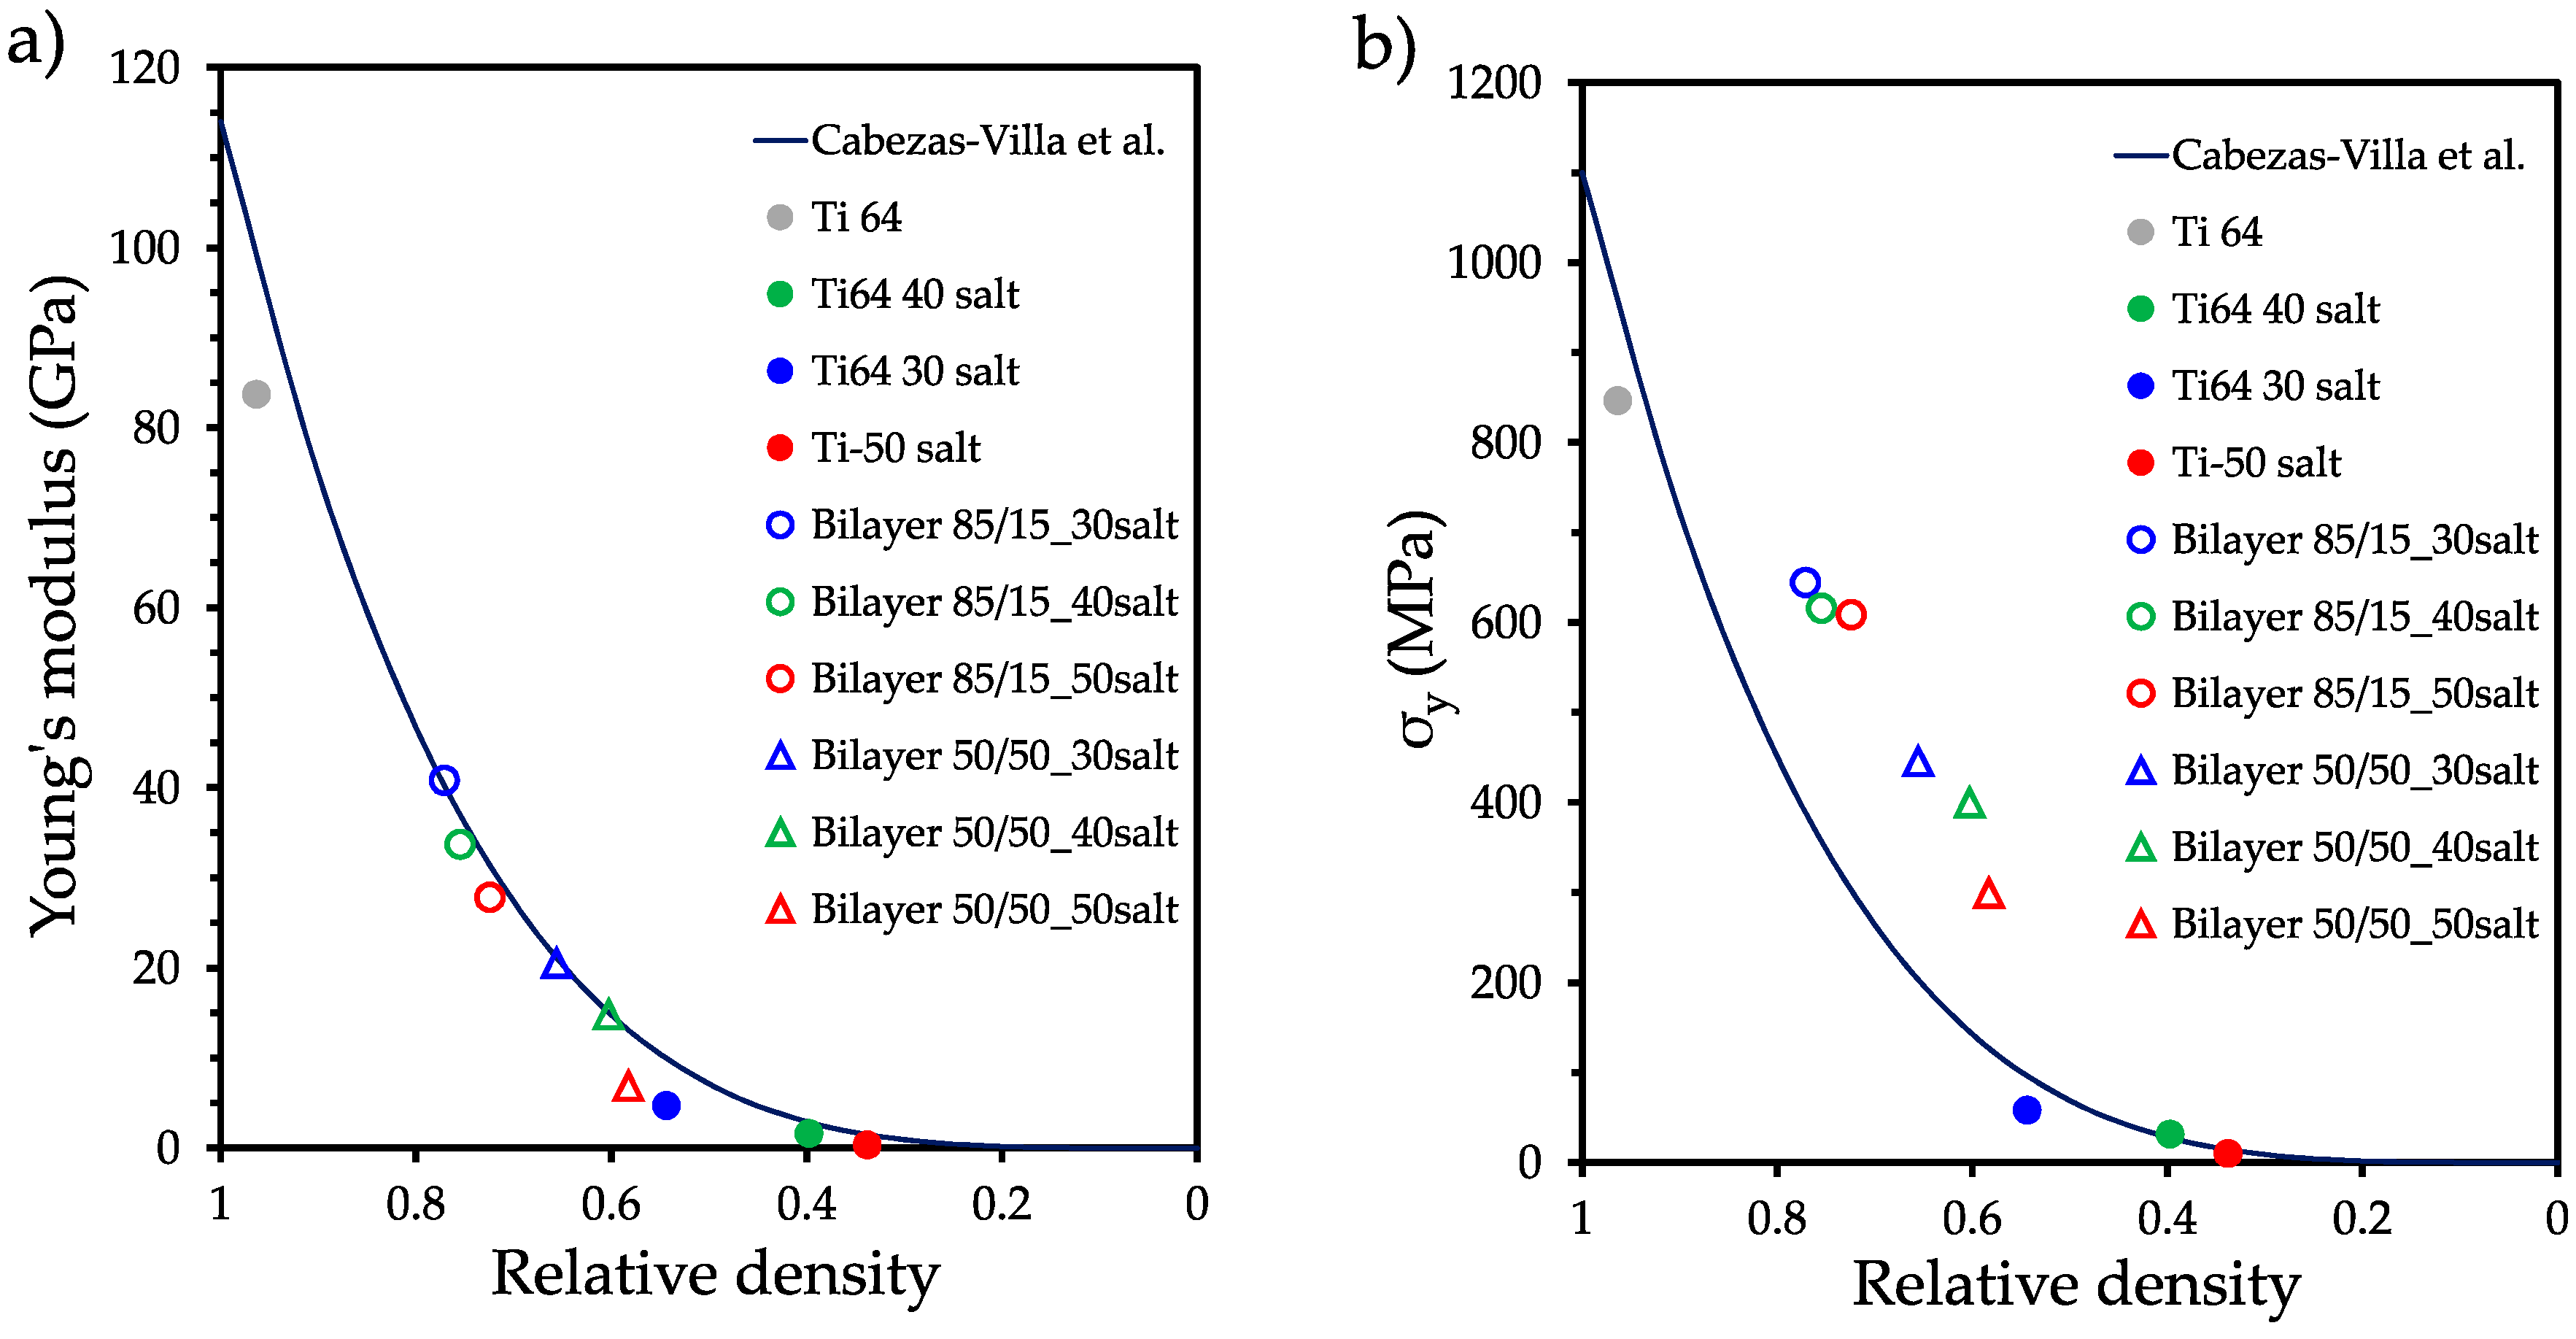
| Sample | Relative density (D) | Relative density (R-M) | Ratio DR-M/D |
|---|---|---|---|
| Ti6Al4V P0 | 0.9633 | -- | |
| Ti6Al4V P30 | 0.5436 | -- | |
| Ti6Al4V P40 | 0.3972 | -- | |
| Ti6Al4V P50 | 0.3378 | -- | |
| Bilayer 85/15 P30 | 0.7706 | 0.9043 | 1.17 |
| Bilayer 85/15 P40 | 0.7544 | 0.8837 | 1.17 |
| Bilayer 85/15 P50 | 0.7238 | 0.8753 | 1.20 |
| Bilayer 50/50 P30 | 0.6557 | 0.7532 | 1.14 |
| Bilayer 50/50 P40 | 0.6026 | 0.6800 | 1.12 |
| Bilayer 50/50 P50 | 0.5827 | 0.6502 | 1.11 |
3.2. Tomography analysis
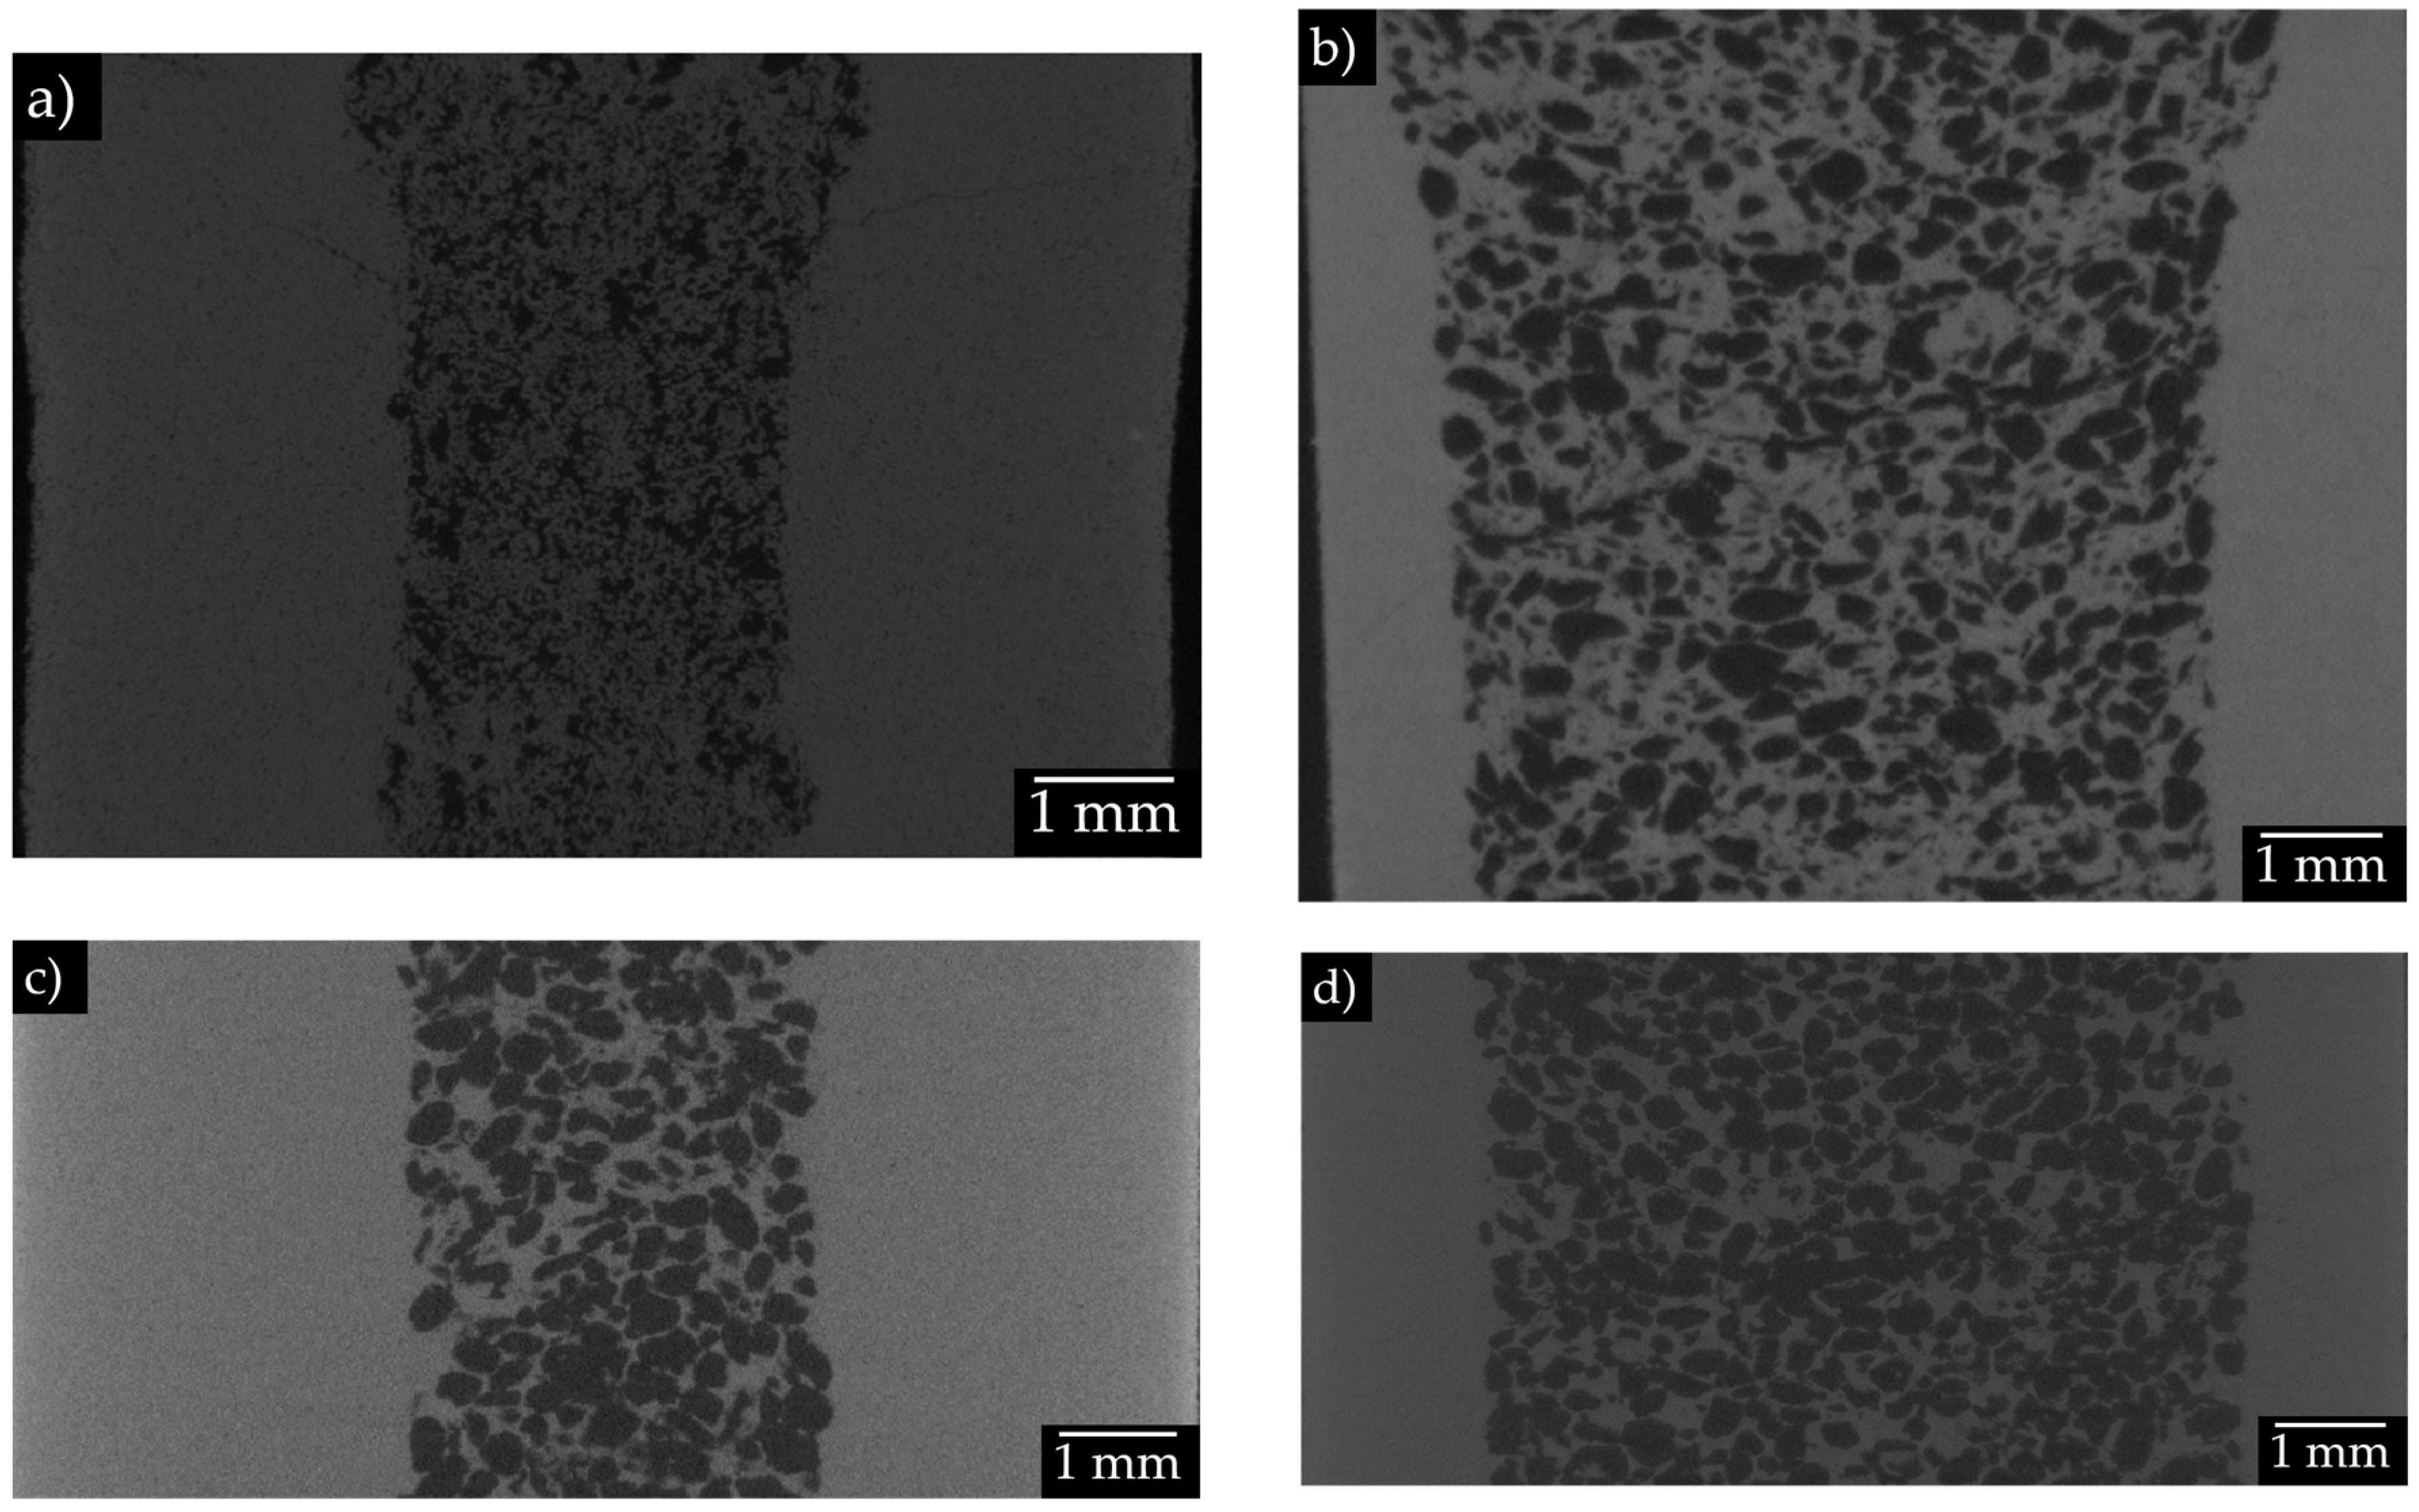
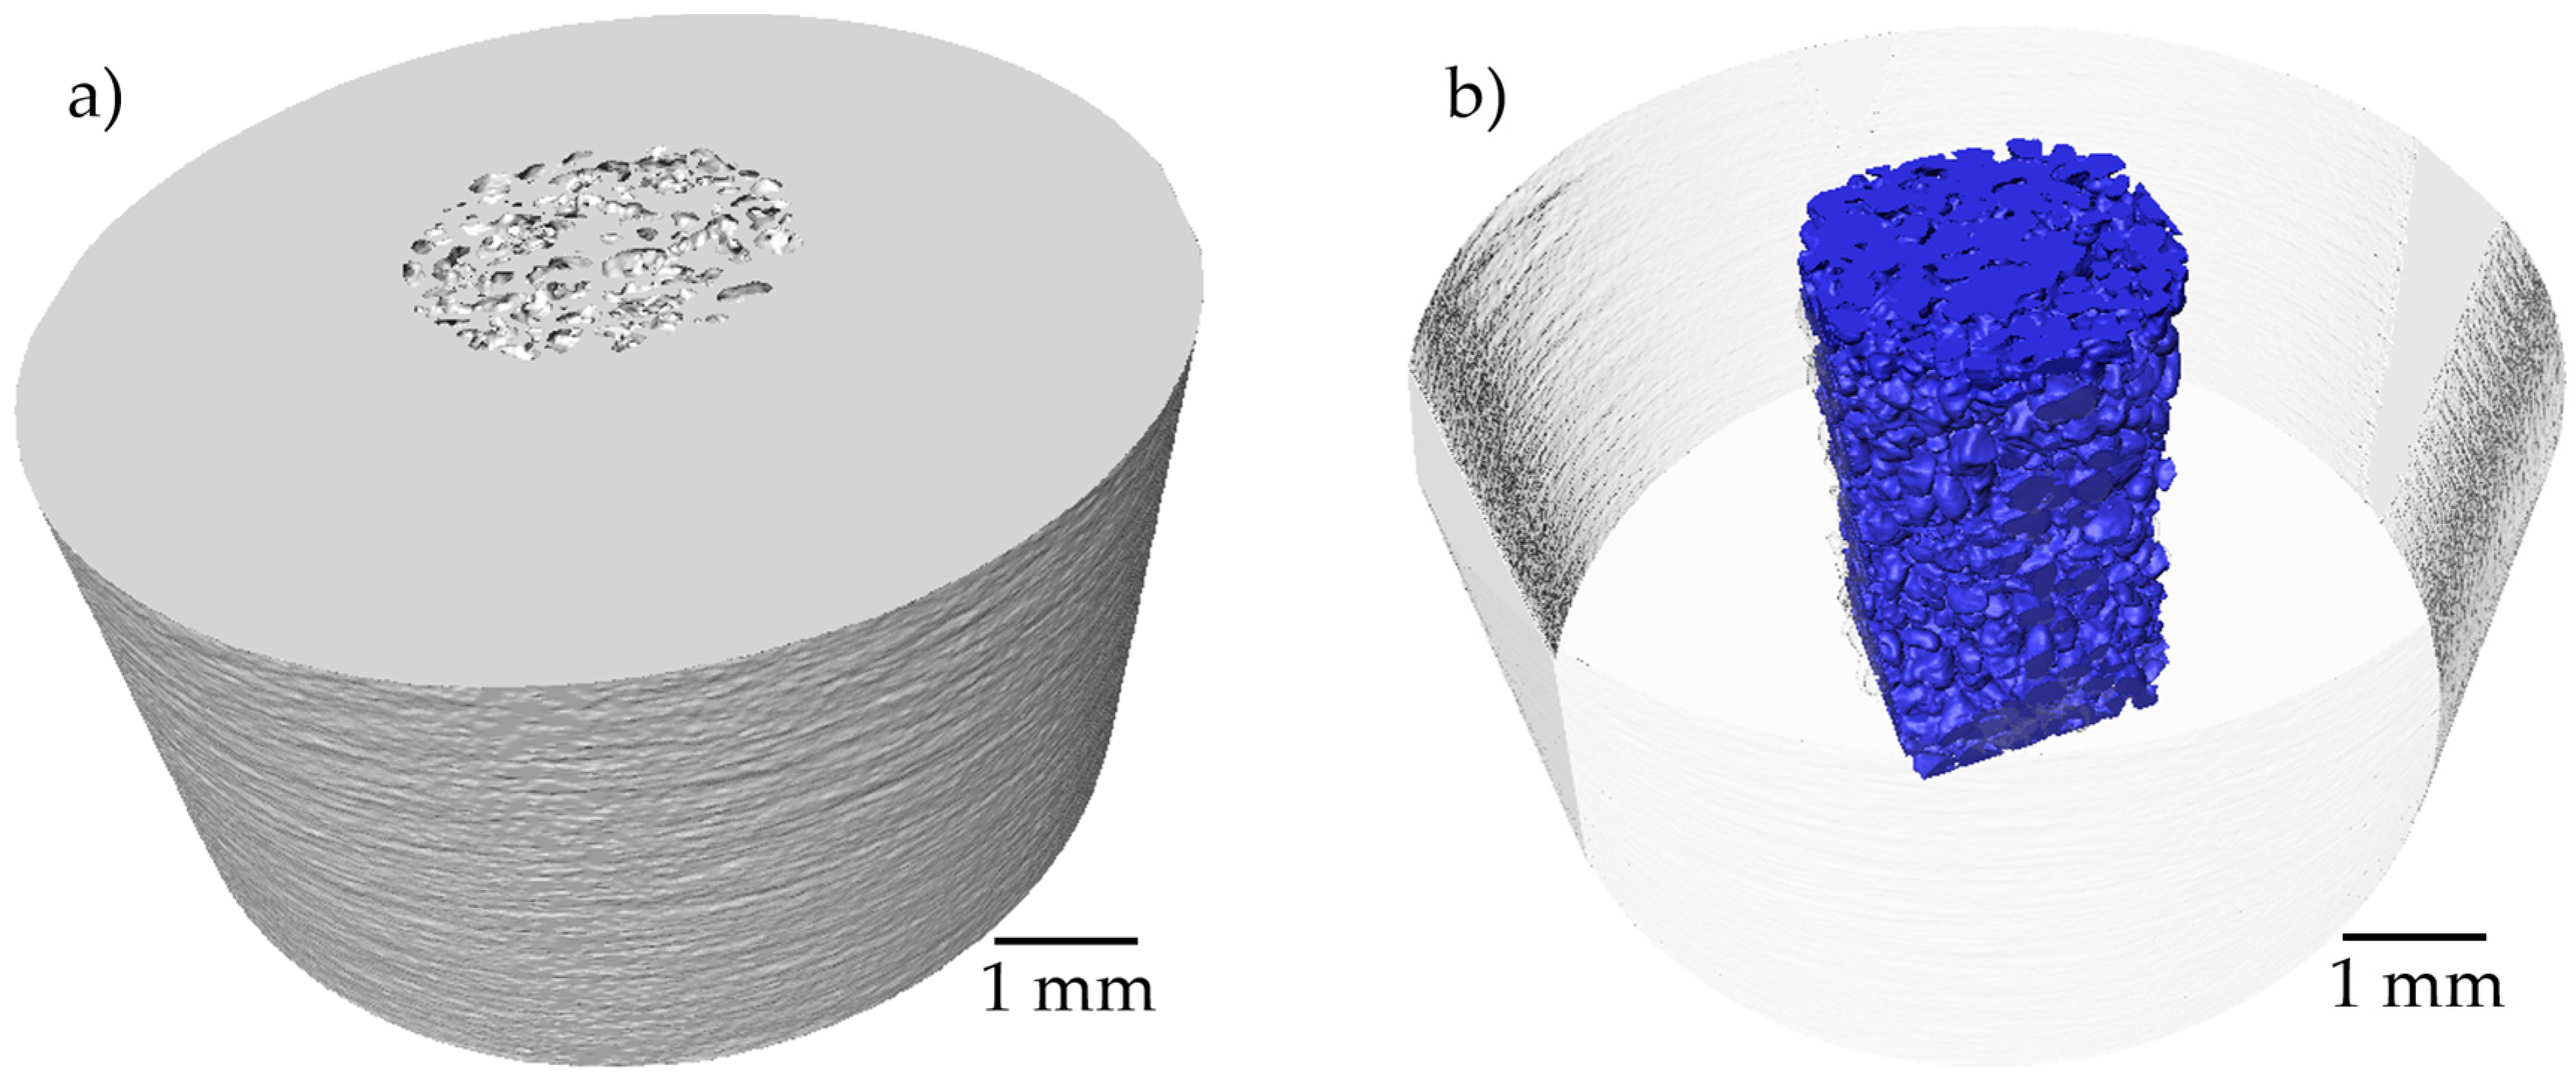
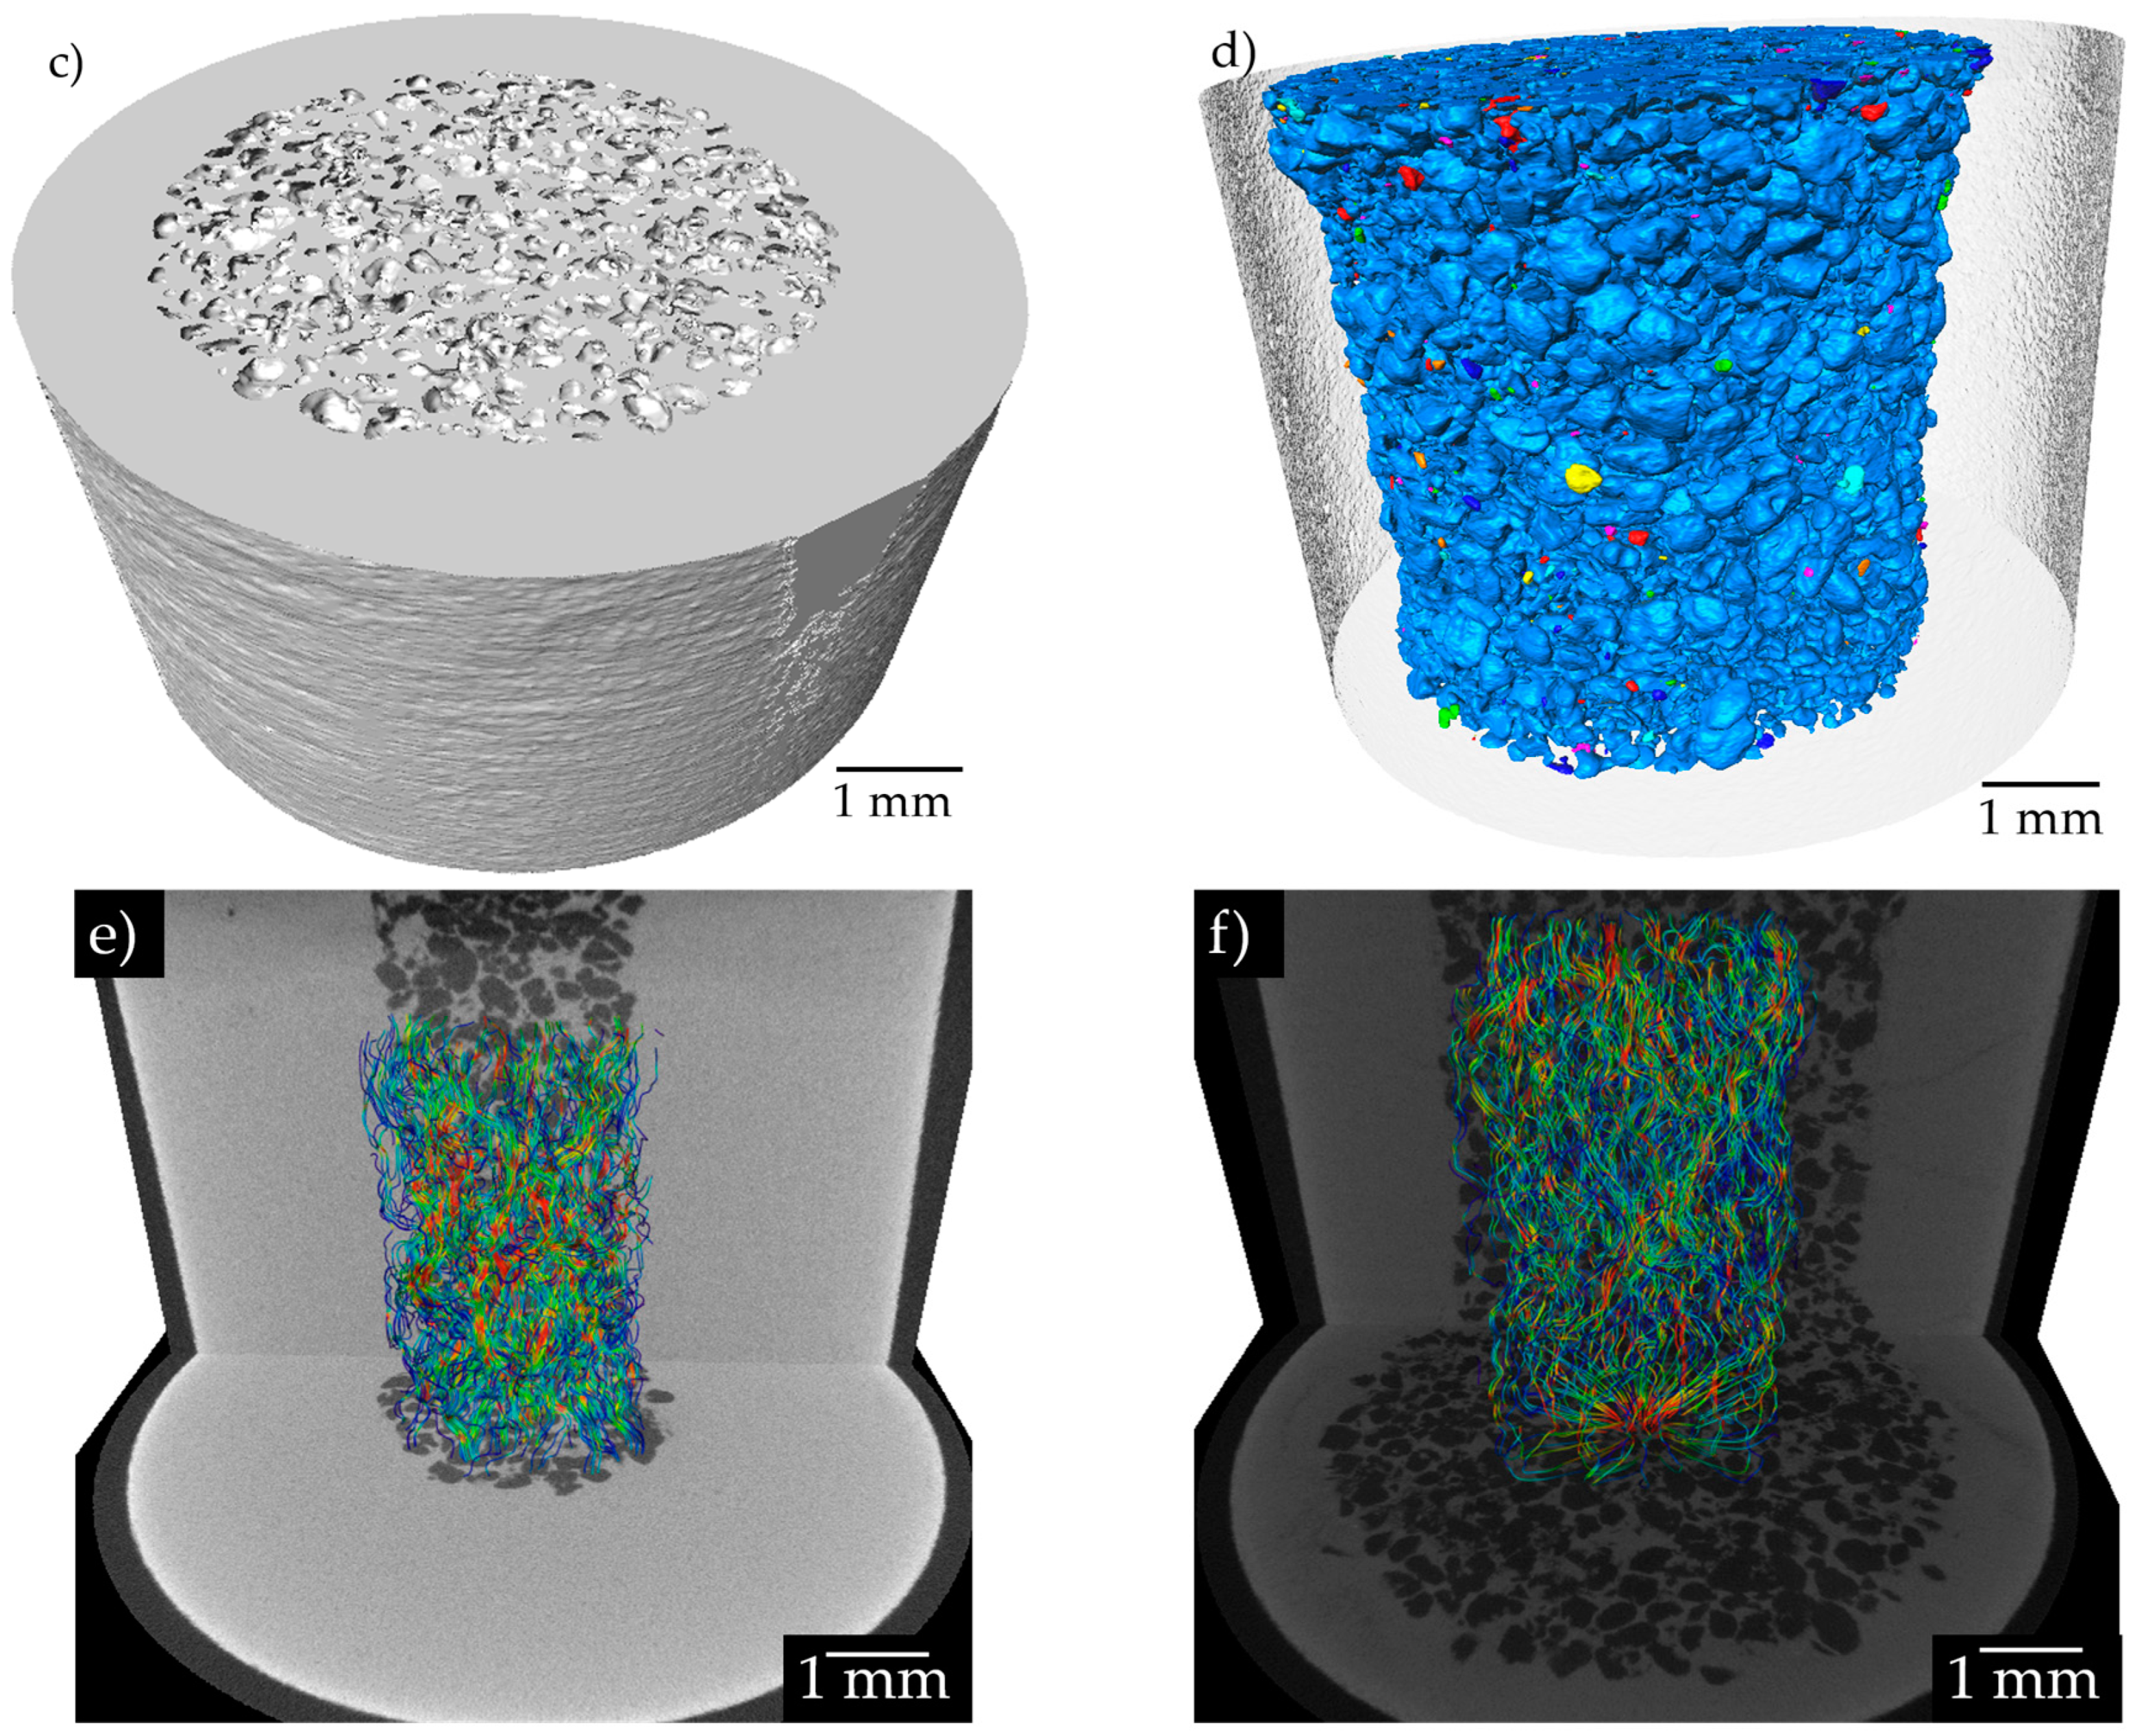
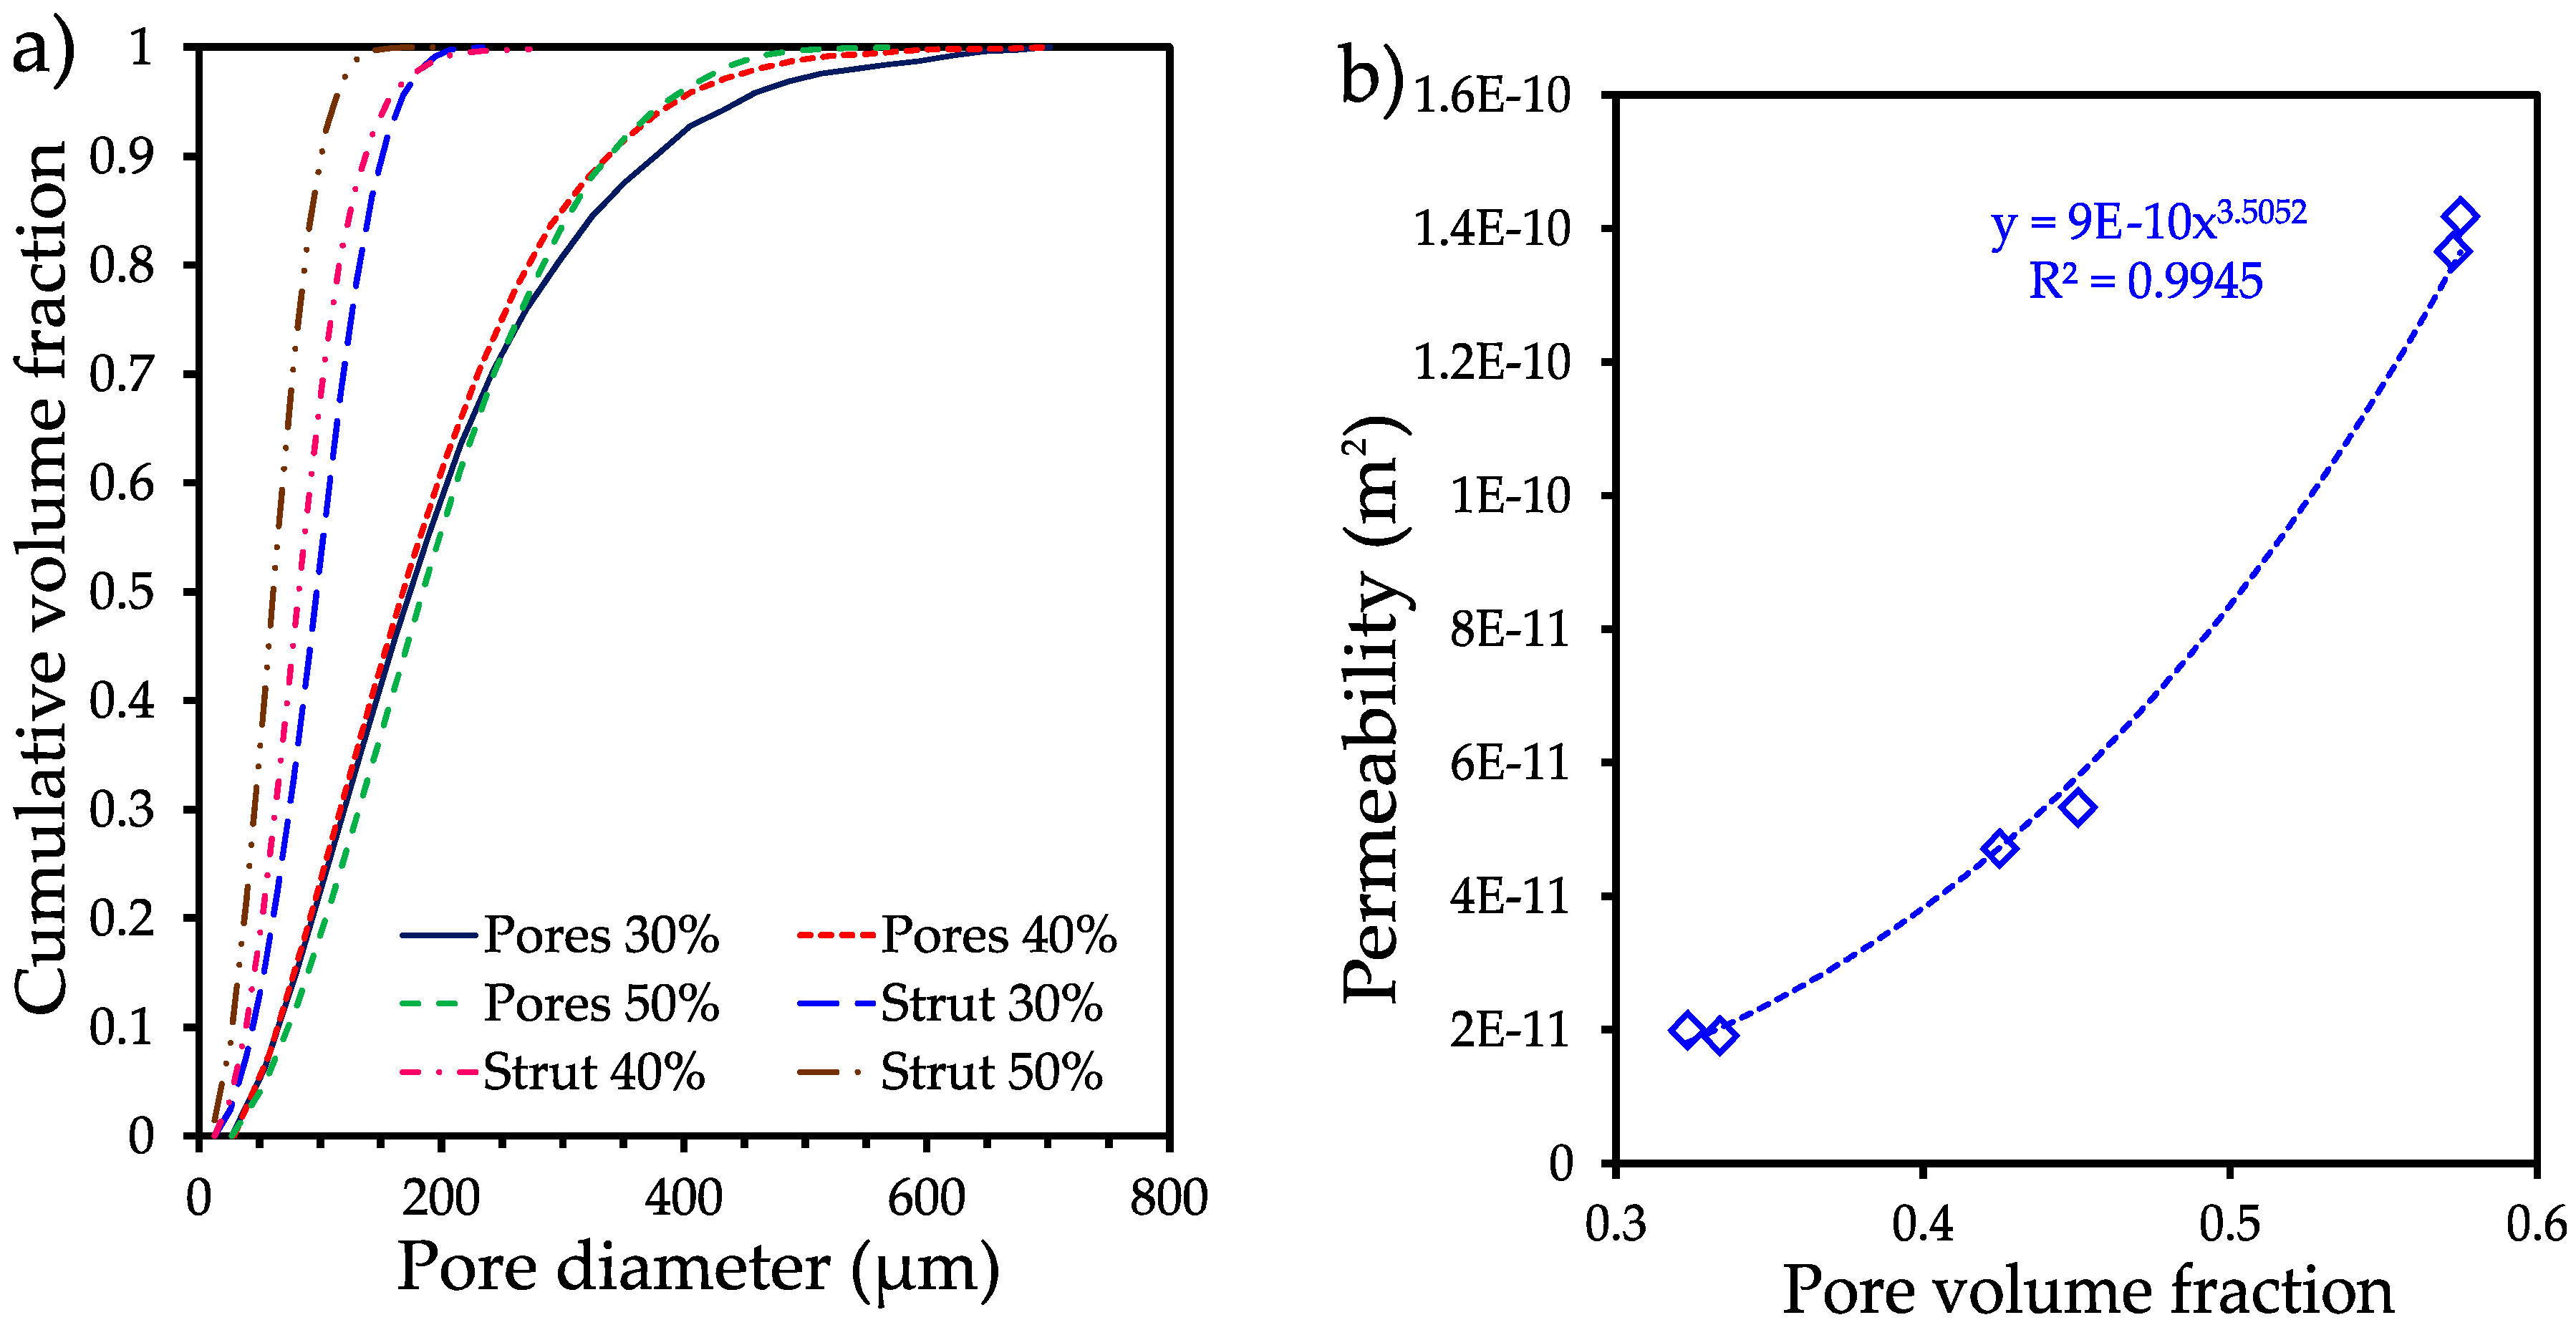
| Volume fraction of pore formers (%) | Pore volume fraction (%) | Median pore size (d50 µm) | Median strut size (d50 µm) | Permeability (m2 E-10) | Tortuosity |
|---|---|---|---|---|---|
| 30 | 32.32 | 174.10 | 97.12 | 0.19 | 1.82 |
| 40 | 42.50 | 168.36 | 82.26 | 0.47 | 1.58 |
| 50 | 57.26 | 184.79 | 61.27 | 1.36 | 1.37 |
3.3. Mechanical strength analysis
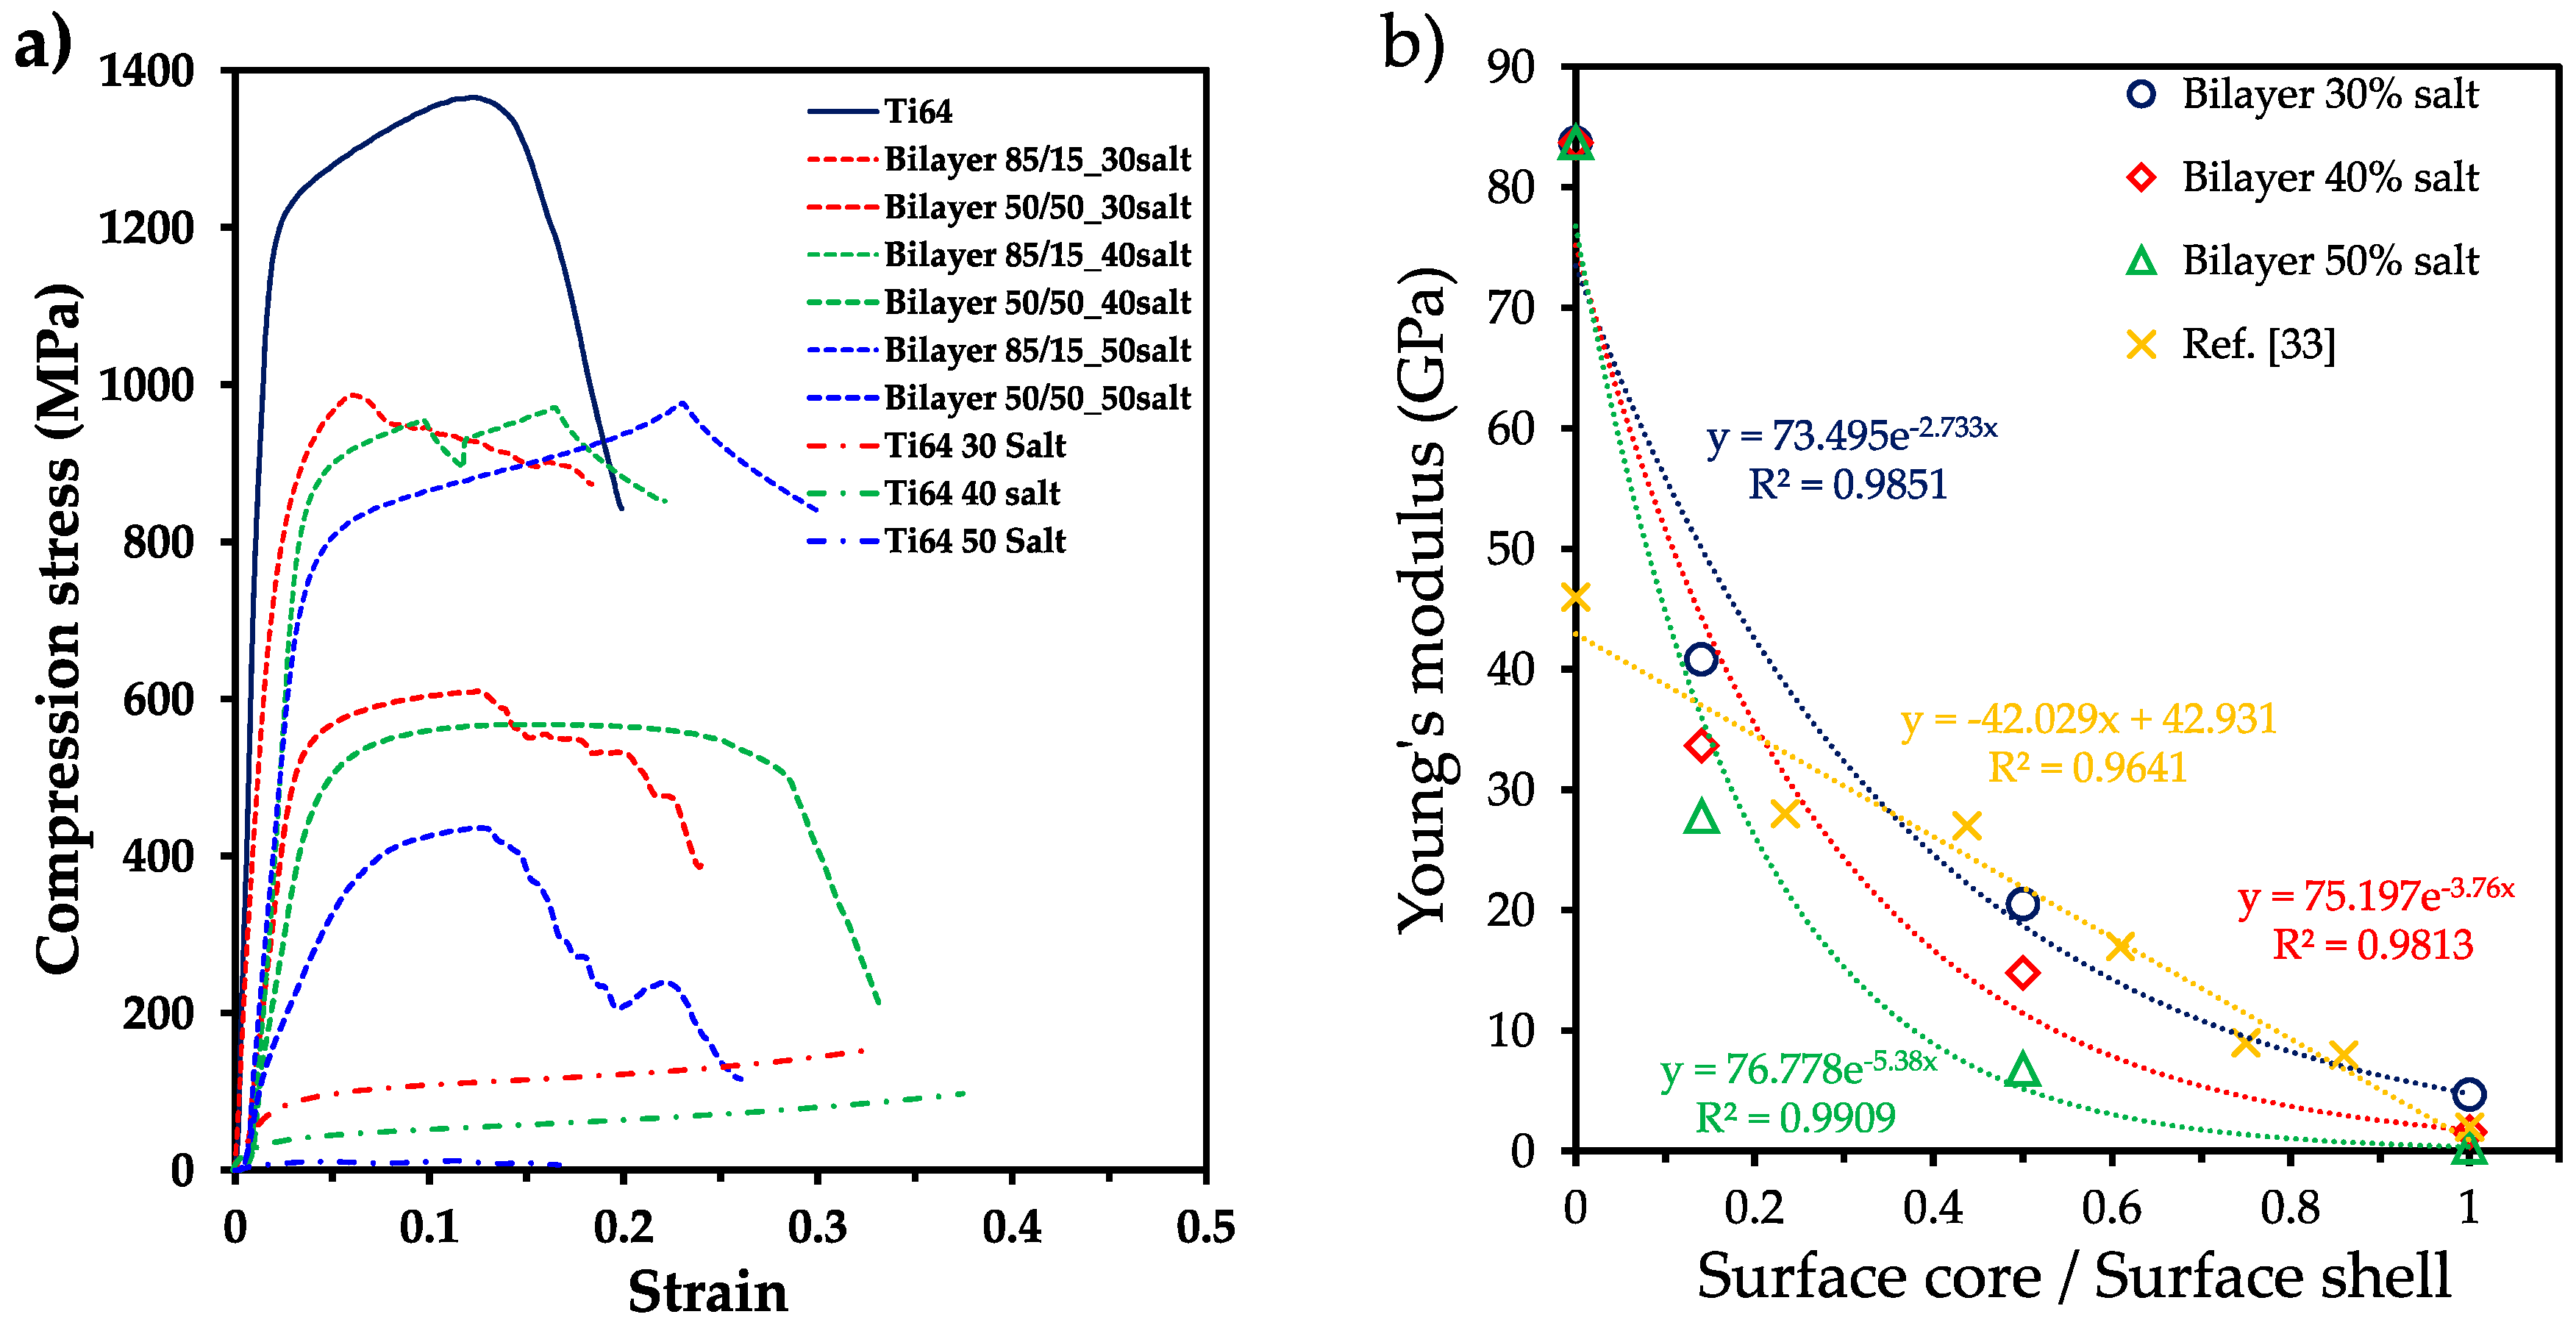
| Sample | E (GPa) | ER-M (GPa) | ER-M/E | σy (MPa) | σy R-M (MPa) | σy R-M/ σy | σy/E (10-3) |
|---|---|---|---|---|---|---|---|
| Ti6Al4V P0 | 83.7 | -- | 846.5 | 10.11 | |||
| Ti6Al4V P30 | 4.7 | -- | 58 | 12.34 | |||
| Ti6Al4V P40 | 1.6 | -- | 31.3 | 19.56 | |||
| Ti6Al4V P50 | 0.32 | -- | 9.7 | 30.31 | |||
| Bilayer 85/15 P30 | 40.8 | 72.59 | 1.77 | 643.9 | 735.61 | 1.14 | 15.78 |
| Bilayer 85/15 P40 | 33.7 | 44.15 | 2.15 | 445.5 | 451.81 | 1.01 | 21.73 |
| Bilayer 85/15 P50 | 27.8 | 72.15 | 2.14 | 615.5 | 731.86 | 1.18 | 18.26 |
| Bilayer 50/50 P30 | 20.5 | 42.60 | 2.87 | 399.8 | 438.44 | 1.09 | 27.01 |
| Bilayer 50/50 P40 | 14.8 | 71.97 | 2.58 | 608.5 | 728.82 | 1.19 | 21.88 |
| Bilayer 50/50 P50 | 6.83 | 42.60 | 6.23 | 299 | 438.44 | 1.46 | 43.77 |

4. Conclusions
Author Contributions
Funding
Institutional Review Board Statement
Informed Consent Statement
Data Availability Statement
Acknowledgments
Conflicts of Interest
References
- Wang, X.; Xu, S.; Zhou, S.; Xu, W.; Leary, M.; Choong, P.; Qian, M.; Brandt, M.; Xie, Y.M. Topological design and additive manufacturing of porous metals for bone scaffolds and orthopaedic implants: A review. Biomaterials 2016, 83, 127-141. https://doi.org/10.1016/j.biomaterials.2016.01.012. [CrossRef]
- Murr, L. E., Gaytan, S. M., Martinez, E., Medina, F., Wicker, R. B. Next generation orthopaedic implants by additive manufacturing using electron beam melting. Int. J. Biomater., 2012, 2012. https://doi.org/10.1155/2012/245727. [CrossRef]
- Chen, Q. Z., Thompson, I. D., Boccaccini, A. R. 45S5 Bioglass®-derived glass–ceramic scaffolds for bone tissue engineering. Biomaterials, 2006, 27(11), 2414-2425. https://doi.org/10.1016/j.biomaterials.2005.11.025. [CrossRef]
- Russell Levive, B., Spoere, S., Poggie, R. A., Della Valle, C. J., Jacobs, J. J. Experimental and clinical performance of porous tantalum in orthopaedic surgery. J Biomaterials, 2006, 27(27), 4671-81. https://doi.org/10.1016/j.biomaterials.2006.04.041. [CrossRef]
- España, F. A., Balla, V. K., Bose, S., Bandyopadhyay, A. (2010). Design and fabrication of CoCrMo alloy based novel structures for load bearing implants using laser engineered net shaping. Mater. Sci. Eng. C, 2010, 30(1), 50-57. https://doi.org/10.1016/j.msec.2009.08.006. [CrossRef]
- Bansiddhi, A., Sargeant, T. D., Stupp, S. I., Dunand, D. C. Porous NiTi for bone implants: a review. Acta Biomater., 2008, 4(4), 773-782. https://doi.org/10.1016/j.actbio.2008.02.009. [CrossRef]
- Ballarre, J., Manjubala, I., Schreiner, W. H., Orellano, J. C., Fratzl, P., Ceré, S. Improving the osteointegration and bone–implant interface by incorporation of bioactive particles in sol–gel coatings of stainless-steel implants. Acta Biomater., 2010, 6(4), 1601-1609. https://doi.org/10.1016/j.actbio.2009.10.015. [CrossRef]
- Shirazi, S. F. S., Gharehkhani, S., Mehrali, M., Yarmand, H., Metselaar, H. S. C., Kadri, N. A., Osman, N. A. A. A review on powder-based additive manufacturing for tissue engineering: selective laser sintering and inkjet 3D printing. Sci. Technol. Adv., 2015, 16(3), 033502. https://doi.org/10.1088/1468-6996/16/3/033502. [CrossRef]
- Arifvianto, B., Zhou, J. Fabrication of metallic biomedical scaffolds with the space holder method: a review. Mater, 2014, 7(5), 3588-3622. https://doi.org/10.3390/ma7053588. [CrossRef]
- Reig, L., Amigó, V., Busquets, D. J., Calero, J. A. Development of porous Ti6Al4V samples by microsphere sintering. Mater. Process. Technol, 2012, 212(1), 3-7. https://doi.org/10.1016/j.jmatprotec.2011.06.026. [CrossRef]
- Torres, Y., Rodríguez, J. A., Arias, S., Echeverry, M., Robledo, S., Amigo, V., Pavón, J. J. Processing, characterization and biological testing of porous titanium obtained by space-holder technique. J. Mater. Sci., 2012, 47, 6565-6576. https://doi.org/10.1007/s10853-012-6586-9. [CrossRef]
- Cabezas-Villa, J. L., Olmos, L., Bouvard, D., Lemus-Ruiz, J., Jiménez, O. Processing and properties of highly porous Ti6Al4V mimicking human bones. Mater. Res., 2018, 33(6), 650-661. https://doi.org/10.1557/jmr.2018.35. [CrossRef]
- Jakubowicz, J., Adamek, G., Dewidar, M. Titanium foam made with saccharose as a space holder. J. Porous Mater, 2013, 20, 1137-1141. https://doi.org/10.1007/s10934-013-9696-0. [CrossRef]
- Bahraminasab, M., Sahari, B. B., Edwards, K. L., Farahmand, F., Arumugam, M., Hong, T. S. Aseptic loosening of femoral components–a review of current and future trends in materials used. Mater. Des., 2012, 42, 459-470. https://doi.org/10.1016/j.matdes.2012.05.046. [CrossRef]
- Gibson, L. J., & Ashby, M. F. Cellular Solids: Structure and Properties. Cambridge Univ Press. Cambridge, UK, 1999, 175, 2nd ed.
- Phani, K. K., & Niyogi, S. K. Young’s modulus of porous brittle solids. J. Mater. Sci., 1987, 22, 257-263. https://doi.org/10.1007/BF01160581. [CrossRef]
- Nielsen, L. F. Elasticity and damping of porous materials and impregnated materials. J. Am. Ceram. Soc., 1984, 67(2), 93-98. https://doi.org/10.1111/j.1151-2916.1984.tb09622.x. [CrossRef]
- Breme, J., Wadewitz, V. Comparison of titanium-tantalum and titanium-niobium alloys for application as dental implants. The Int J Oral Maxillofac. Implants, 1989, 4(2), 113-118.
- Woodard, J. R., Hilldore, A. J., Lan, S. K., Park, C. J., Morgan, A. W., Eurell, J. A. C., Clark, S. G., Wheeler, M. B., Jamison, R. D. Johnson, A. J. W. The mechanical properties and osteoconductivity of hydroxyapatite bone scaffolds with multi-scale porosity. Biomaterials, 2007, 28(1), 45-54. https://doi.org/10.1016/j.biomaterials.2006.08.021. [CrossRef]
- Takemoto, M., Fujibayashi, S., Neo, M., Suzuki, J., Kokubo, T., Nakamura, T. Mechanical properties and osteoconductivity of porous bioactive titanium. Biomaterials, 2005, 26(30), 6014-6023. https://doi.org/10.1016/j.biomaterials.2005.03.019. [CrossRef]
- Dabrowski, B., Swieszkowski, W., Godlinski, D., Kurzydlowski, K. J. Highly porous titanium scaffolds for orthopaedic applications. ACS Appl. Bio Mater. B, 2010, 95(1), 53-61. https://doi.org/10.1002/jbm.b.31682. [CrossRef]
- Wang, C. A., Le, H., & Huang, Y. Rapid assembly processes of ordered inorganic/organic nanocomposites. Biomimetics: Learning From Nature, 2010, 1-24.
- Kienapfel, H., Sprey, C., Wilke, A., Griss, P. Implant fixation by bone ingrowth. J. Arthroplasty, 1999, 14(3), 355-368. https://doi.org/10.1016/S0883-5403(99)90063-3. [CrossRef]
- Singh, R., Lee, P. D., Lindley, T. C., Dashwood, R. J., Ferrie, E., Imwinkelried, T. (2009). Characterization of the structure and permeability of titanium foams for spinal fusion devices. Acta Biomater., 2009, 5(1), 477-487. https://doi.org/10.1016/j.actbio.2008.06.014. [CrossRef]
- Varley, M. C., Neelakantan, S., Clyne, T. W., Dean, J., Brooks, R. A., Markaki, A. E. Cell structure, stiffness and permeability of freeze-dried collagen scaffolds in dry and hydrated states. Acta Biomater., 2016, 33, 166-175. https://doi.org/10.1016/j.actbio.2016.01.041. [CrossRef]
- Olmos, L., Bouvard, D., Cabezas-Villa, J. L., Lemus-Ruiz, J., Jiménez, O., Arteaga, D. Analysis of compression and permeability behavior of porous Ti6Al4V by computed microtomography. Met. Mater. Int., 2019, 25(3), 669-682. https://doi.org/10.1007/s12540-018-00223-w. [CrossRef]
- Nauman, E. A., Fong, K. E., Keaveny, T. M. Dependence of intertrabecular permeability on flow direction and anatomic site. Ann. Biomed. Eng., 1999, 27, 517-524. https://doi.org/10.1114/1.195. [CrossRef]
- Dewidar, M. M., Lim, J. K. Properties of solid core and porous surface Ti–6Al–4V implants manufactured by powder metallurgy. J. Alloys Compd, 2008, 454(1-2), 442-446. https://doi.org/10.1016/j.jallcom.2006.12.143. [CrossRef]
- Lee, J. H., Park, H. J., Hong, S. H., Kim, J. T., Lee, W. H., Park, J. M., Kim, K. B. Characterization and deformation behavior of Ti hybrid compacts with solid-to-porous gradient structure. Mater. Des., 2014, 60, 66-71. https://doi.org/10.1016/j.matdes.2014.03.051. [CrossRef]
- Ahmadi, S., & Sadrnezhaad, S. K. A novel method for production of foamy core@ compact shell Ti6Al4V bone-like composite. J. Alloys Compd, 2016, 656, 416-422. https://doi.org/10.1016/j.jallcom.2015.09.248. [CrossRef]
- Olmos, L., Mihalcea, E., Vergara-Hernández, H. J., Bouvard, D., Jimenez, O., Chávez, J., Camacho, N., Macías, R. Design of architectured Ti6Al4V-based materials for biomedical applications fabricated via powder metallurgy. Mater. Today Commun., 2021, 29, 102937. https://doi.org/10.1016/j.mtcomm.2021.102937. [CrossRef]
- Okuma, G., Kadowaki, D., Shinoda, Y., Akatsu, T., Guillon, O., Wakai, F. Determination of the size of representative volume element for viscous sintering. JCS-Japan, 2016, 124(4), 421-425. https://doi.org/10.2109/jcersj2.15275. [CrossRef]
- Trueba, P., Chicardi, E., Rodríguez-Ortiz, J. A., Torres, Y. Development and implementation of a sequential compaction device to obtain radial graded porosity cylinders. J. Manuf. Process, 2020, 50, 142-153. https://doi.org/10.1016/j.jmapro.2019.12.011. [CrossRef]
- Cocks, A. C. Constitutive modelling of powder compaction and sintering. Prog. Mater. Sci., 2001, 46(3-4), 201-22. https://doi.org/10.1016/S0079-6425(00)00017-7. [CrossRef]
- Parthasarathy, J., Starly, B., Raman, S., Christensen, A. Mechanical evaluation of porous titanium (Ti6Al4V) structures with electron beam melting (EBM). Mech Behav Biomed Mater, 2010, 3(3), 249-259. https://doi.org/10.1016/j.jmbbm.2009.10.006. [CrossRef]
- Sallica-Leva, E., Jardini, A. L., Fogagnolo, J. B. Microstructure and mechanical behavior of porous Ti–6Al–4V parts obtained by selective laser melting. Mech Behav Biomed Mater, 2013, 26, 98-108. https://doi.org/10.1016/j.jmbbm.2013.05.011. [CrossRef]
- Coffigniez, M., Gremillard, L., Balvay, S., Lachambre, J., Adrien, J., Boulnat, X. Direct-ink writing of strong and biocompatible titanium scaffolds with bimodal interconnected porosity. Addit. Manuf, 2021, 39, 101859. https://doi.org/10.1016/j.addma.2021.101859. [CrossRef]
- Itälä, A. I., Ylänen, H. O., Ekholm, C., Karlsson, K. H., Aro, H. T. (2001). Pore diameter of more than 100 μm is not requisite for bone ingrowth in rabbits. J. Biomed. Mater. Res, 2001, 58(6), 679-683. https://doi.org/10.1002/jbm.1069. [CrossRef]
- Taniguchi, N., Fujibayashi, S., Takemoto, M., Sasaki, K., Otsuki, B., Nakamura, T., Matsuda, T., Kokubo, T., Matsuda, S. Effect of pore size on bone ingrowth into porous titanium implants fabricated by additive manufacturing: an in vivo experiment. Mater. Sci. Eng. C, 2016, 59, 690-701. https://doi.org/10.1016/j.msec.2015.10.069. [CrossRef]
- Bohner, M., Baroud, G., Bernstein, A., Doebelin, N., Galea, L., Hesse, B., ... & Seeherman, H. Characterization and distribution of mechanically competent mineralized tissue in micropores of β-tricalcium phosphate bone substitutes. Today Commun., 2017, 20(3), 106-115. https://doi.org/10.1016/j.mattod.2017.02.002. [CrossRef]
- Kaviany, M., Principles of Heat Transfer in Porous Media, 1995, Springer-Verlag, New York.
- Katz, A. J., & Thompson, A. H. Quantitative prediction of permeability in porous rock. Phys. Rev. B, 1986, 34(11), 8179. https://doi.org/10.1103/PhysRevB.34.8179. [CrossRef]
- Torres, Y., Lascano, S., Bris, J., Pavón, J., & Rodriguez, J. A. Development of porous titanium for biomedical applications: A comparison between loose sintering and space-holder techniques. Mater. Sci. Eng. C, 2014, 37, 148-155. https://doi.org/10.1016/j.msec.2013.11.036. [CrossRef]
- Song, Y., Xu, D. S., Yang, R., Li, D., Wu, W. T., & Guo, Z. X. (1999). Theoretical study of the effects of alloying elements on the strength and modulus of β-type bio-titanium alloys. Mater. Sci. Eng. A, 1999, 260(1-2), 269-274. https://doi.org/10.1016/S0921-5093(98)00886-7. [CrossRef]
- Kováčik, J. Correlation between Young’s modulus and porosity in porous materials. J. Mater. Sci. Lett, 1999, 18(13), 1007-1010.
- Nielsen, L. F. Elasticity and damping of porous materials and impregnated materials. J. Am. Ceram. Soc., 1984, 67(2), 93-98. https://doi.org/10.1111/j.1151-2916.1984.tb09622.x. [CrossRef]
- Phani, K. K., & Niyogi, S. K. Young’s modulus of porous brittle solids. J. Mater. Sci., 1987, 22(1), 257-263. https://doi.org/10.1007/BF01160581. [CrossRef]
Disclaimer/Publisher’s Note: The statements, opinions and data contained in all publications are solely those of the individual author(s) and contributor(s) and not of MDPI and/or the editor(s). MDPI and/or the editor(s) disclaim responsibility for any injury to people or property resulting from any ideas, methods, instructions or products referred to in the content. |
© 2023 by the authors. Licensee MDPI, Basel, Switzerland. This article is an open access article distributed under the terms and conditions of the Creative Commons Attribution (CC BY) license (http://creativecommons.org/licenses/by/4.0/).


