Submitted:
25 August 2023
Posted:
29 August 2023
You are already at the latest version
Abstract
Keywords:
1. Introduction
2. Results
2.1. Clinical Characteristics of the study population
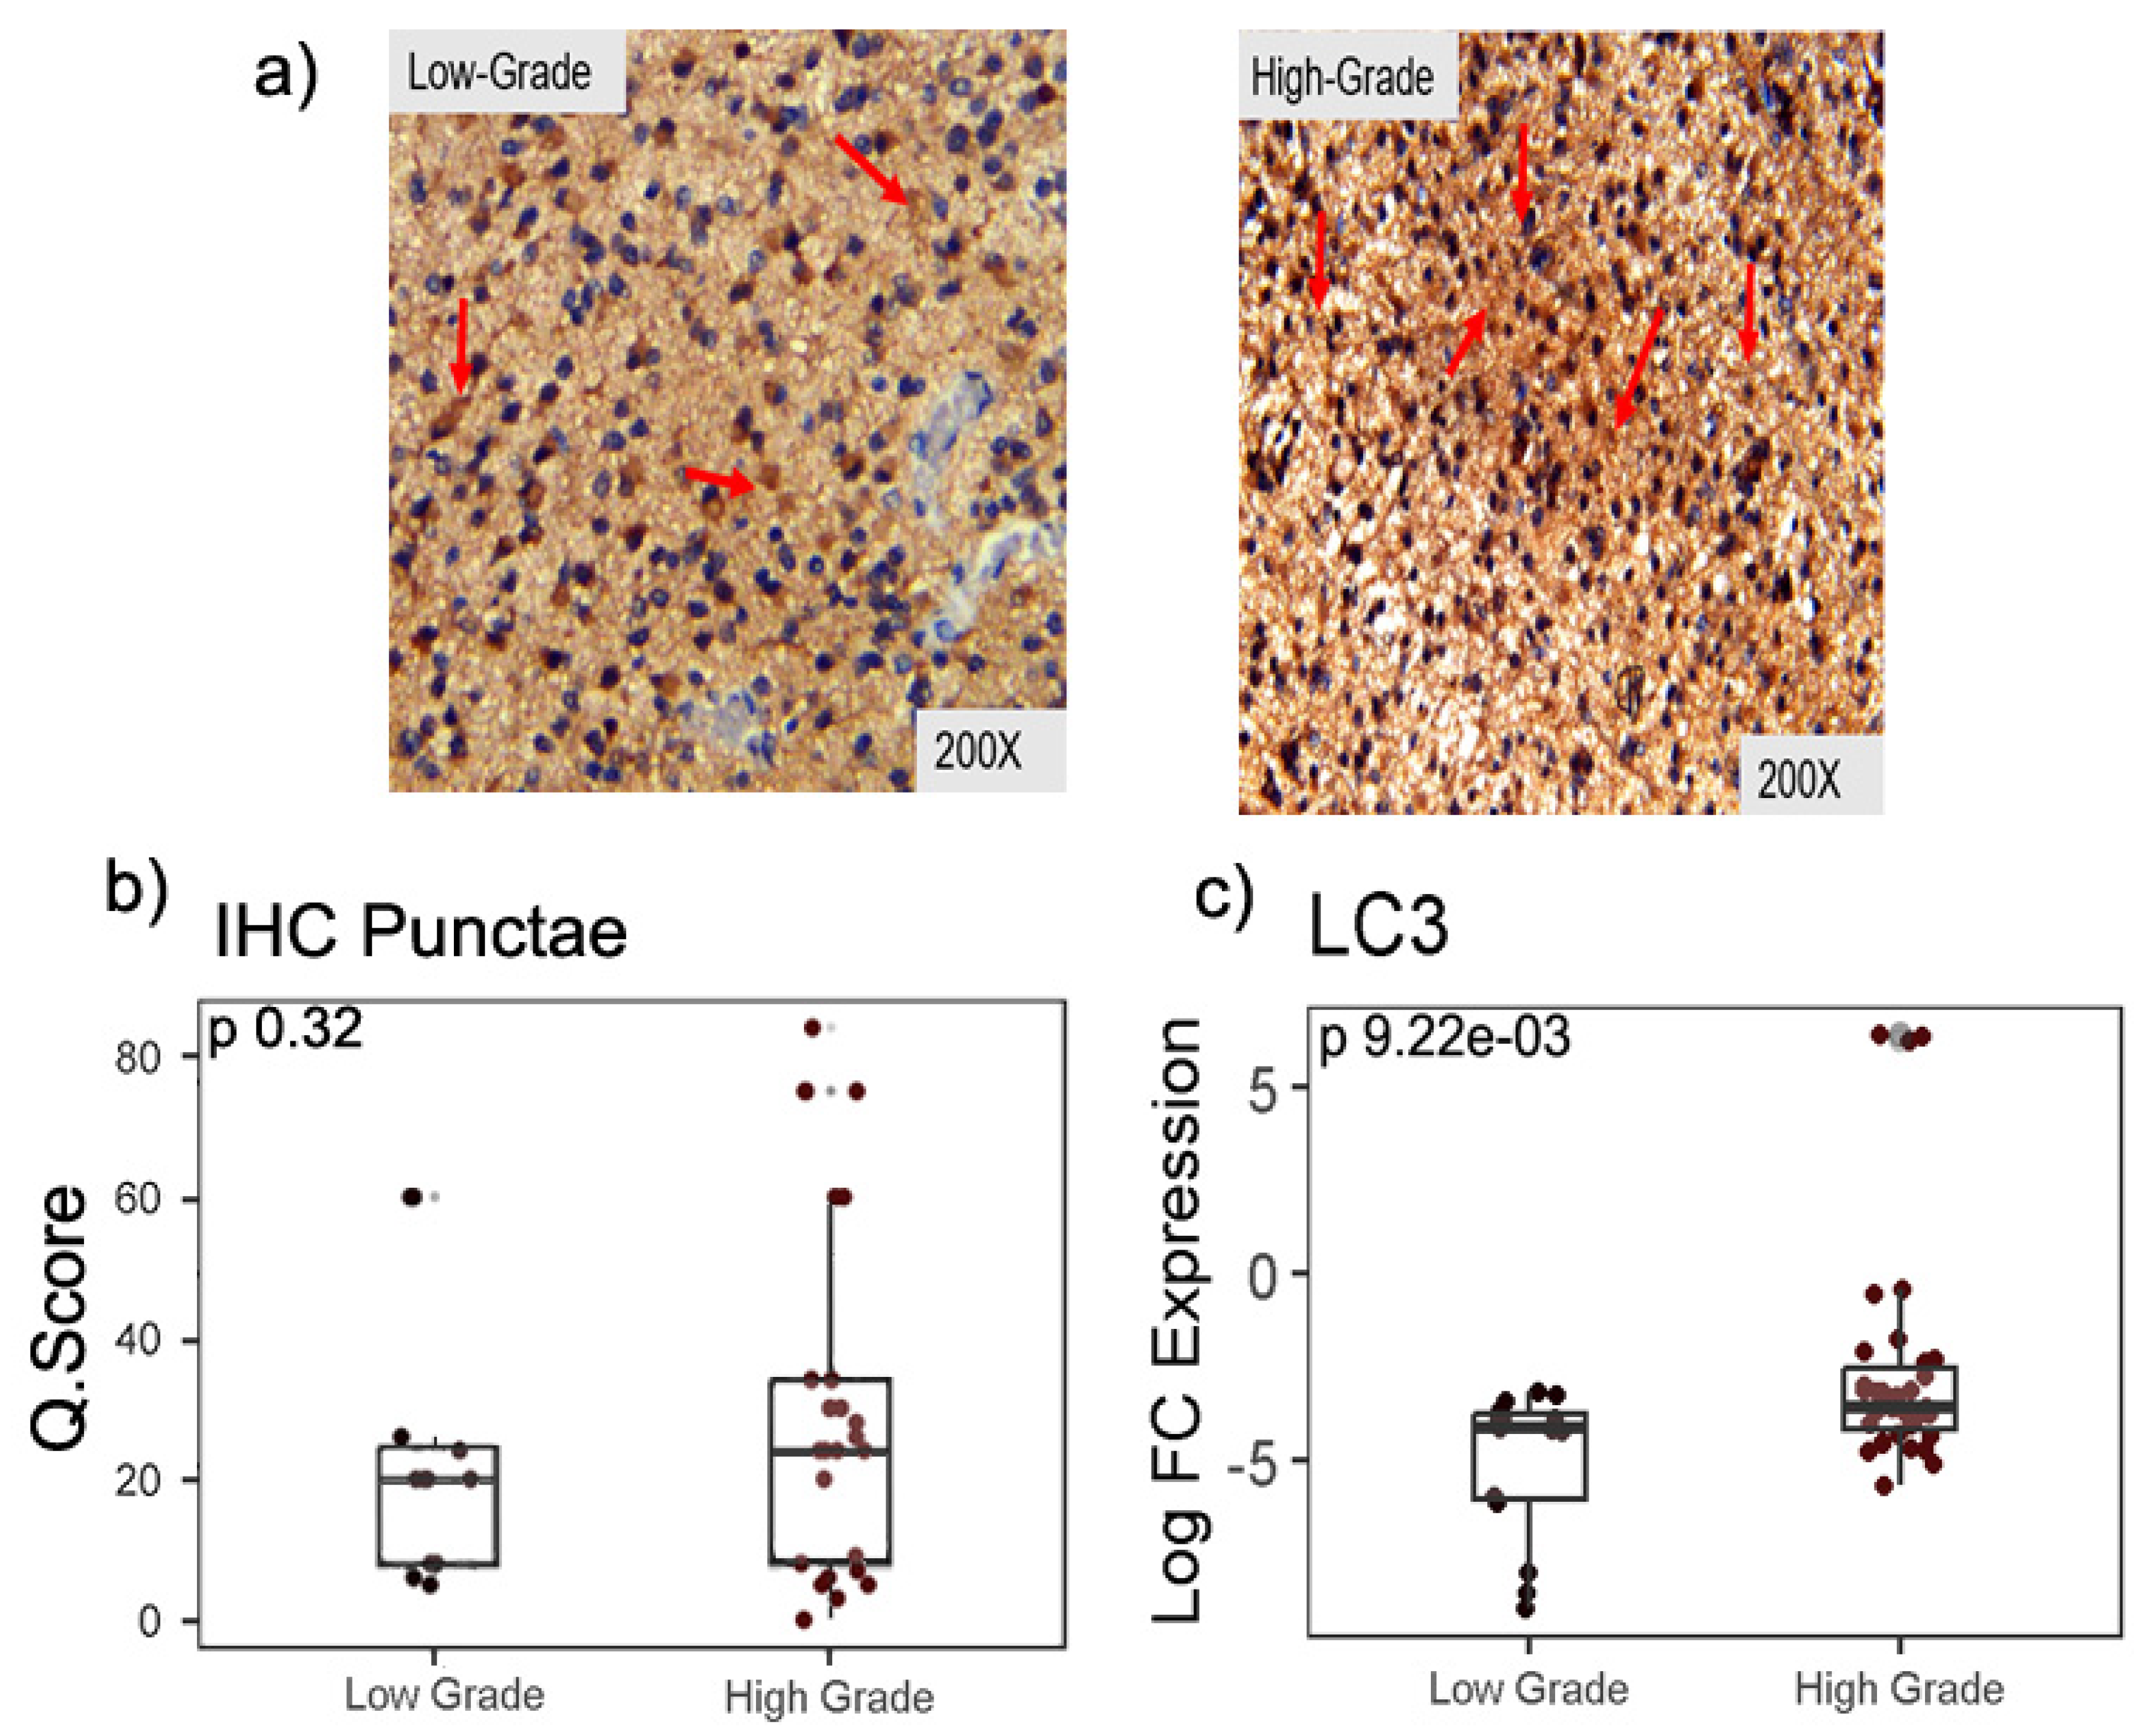
2.2. Expression of autophagy marker LC3-II in LGG and HGG samples
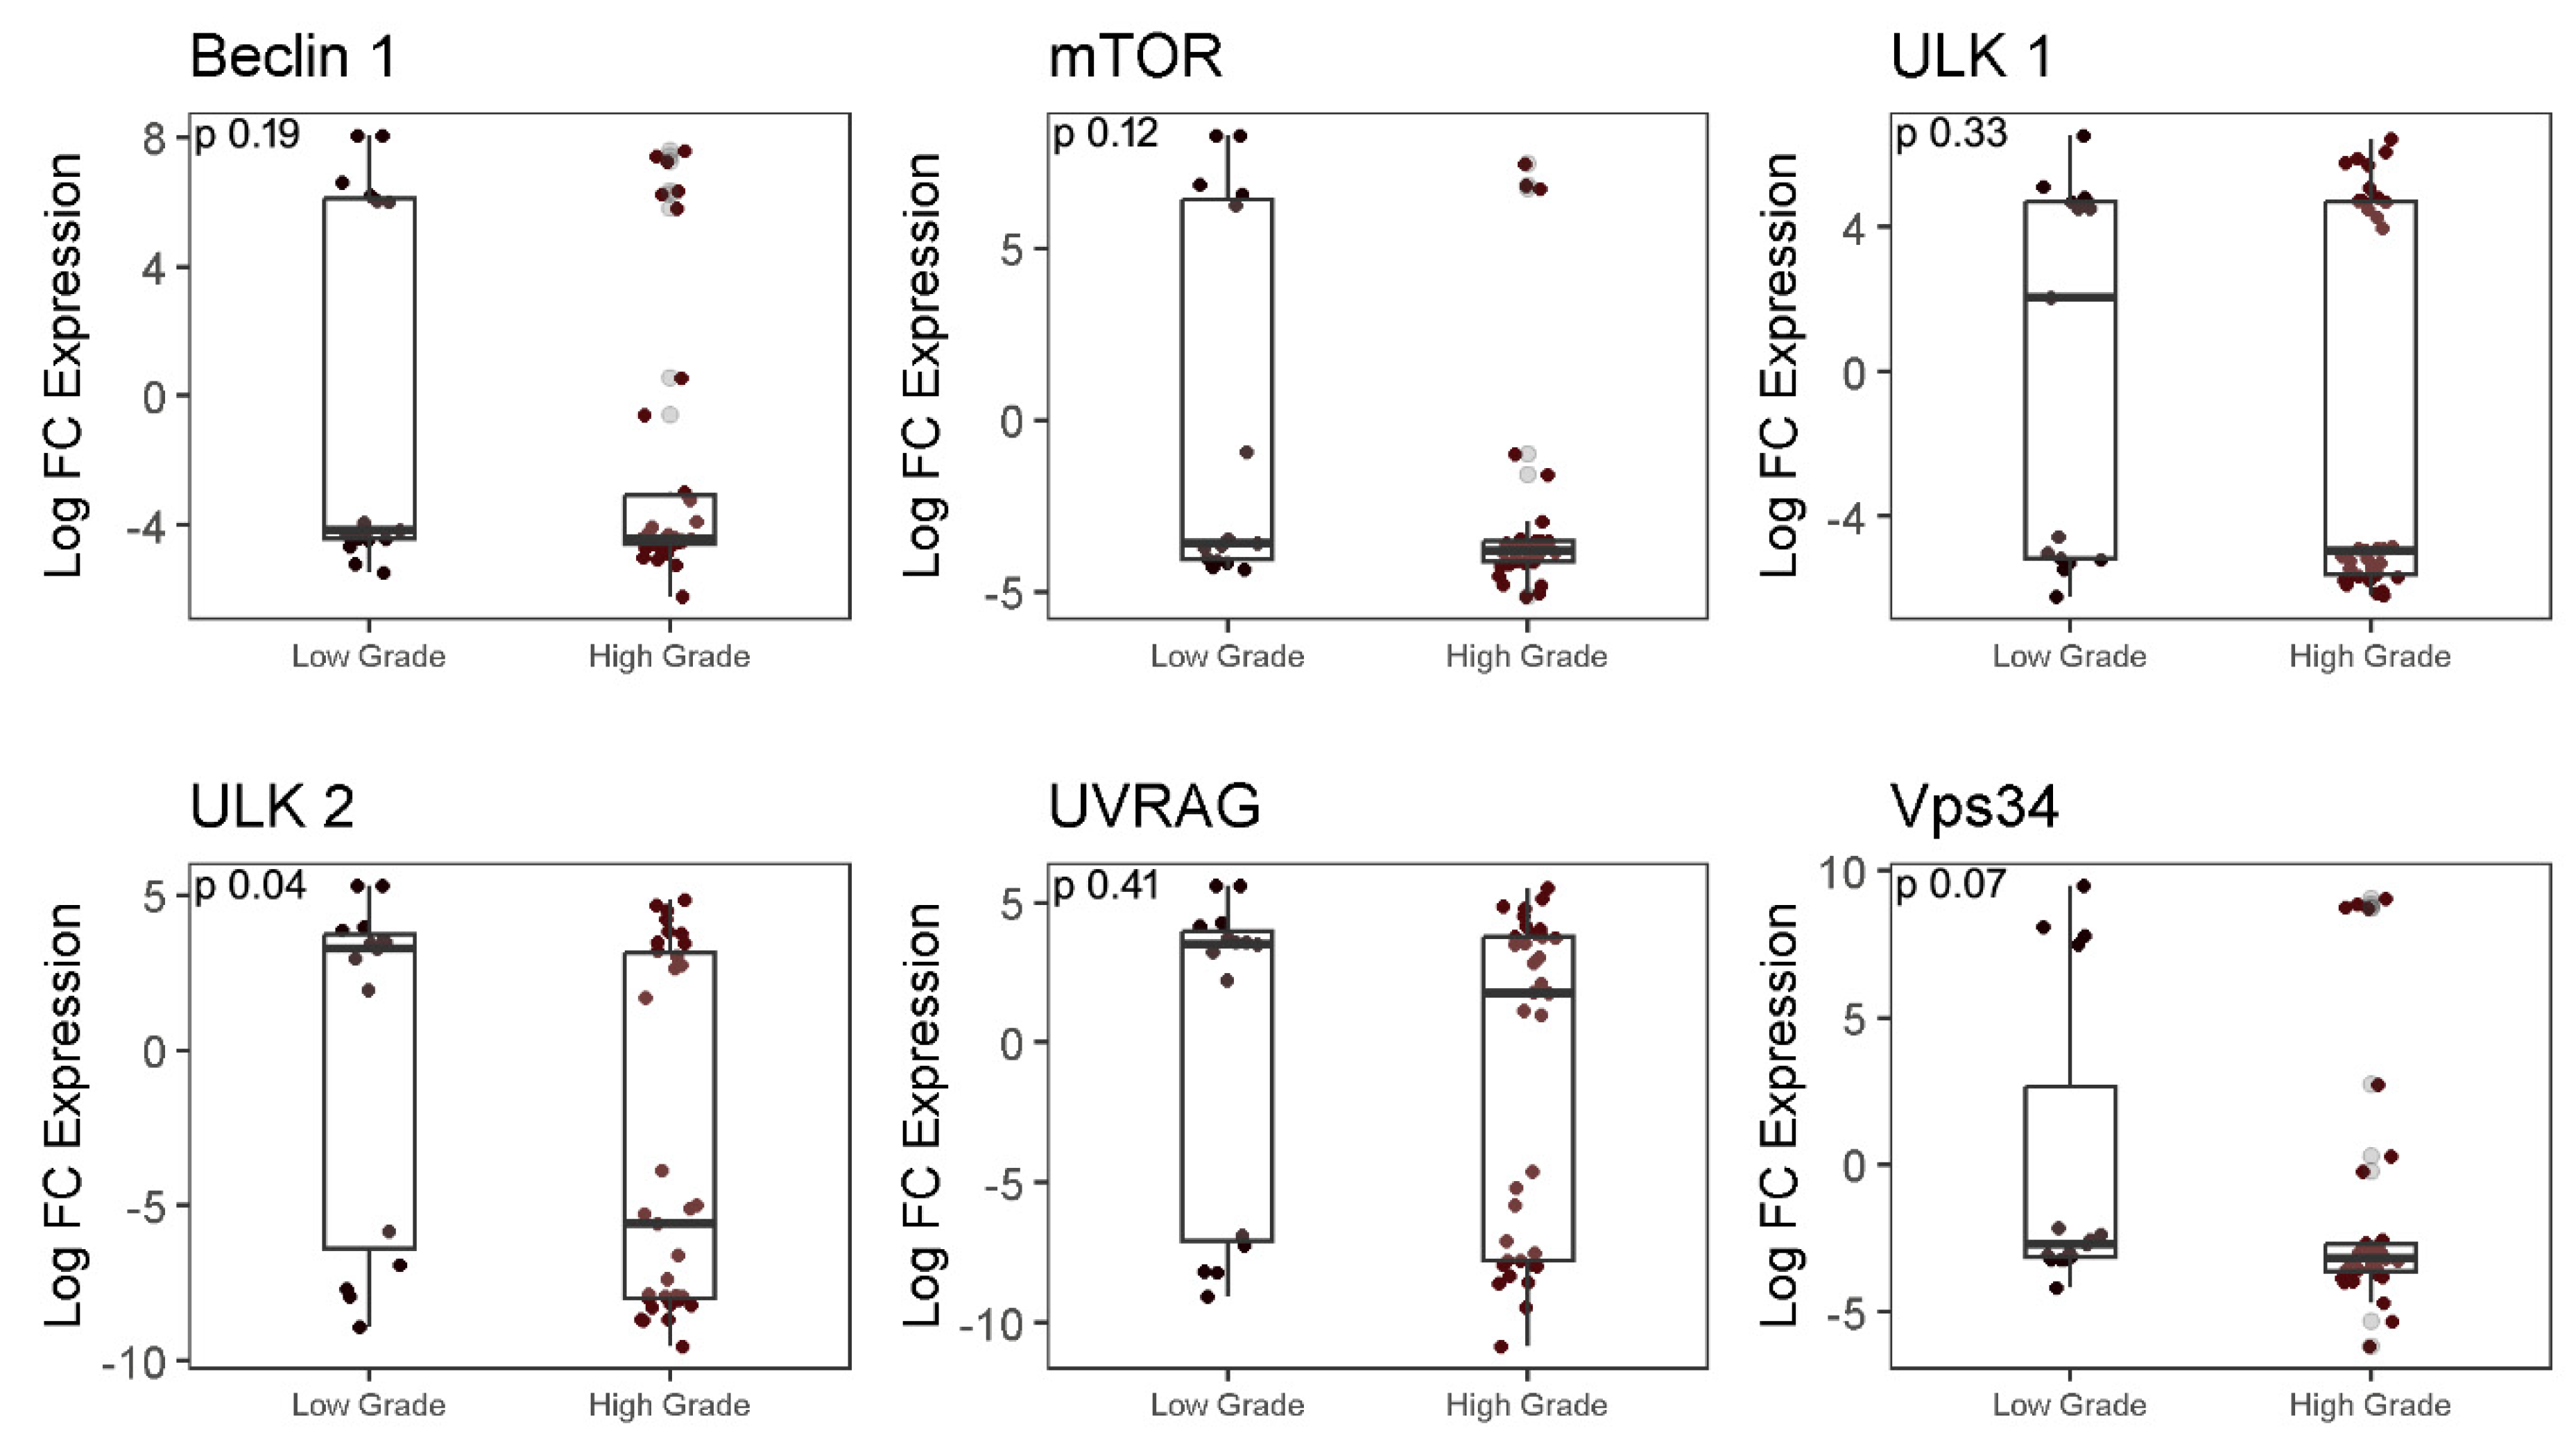
2.3. Analysis of autophagy-associated genes in LGG and HGG samples
2.4. Analysis of PTEN/PI3K/AKT genes in LGG and HGG samples
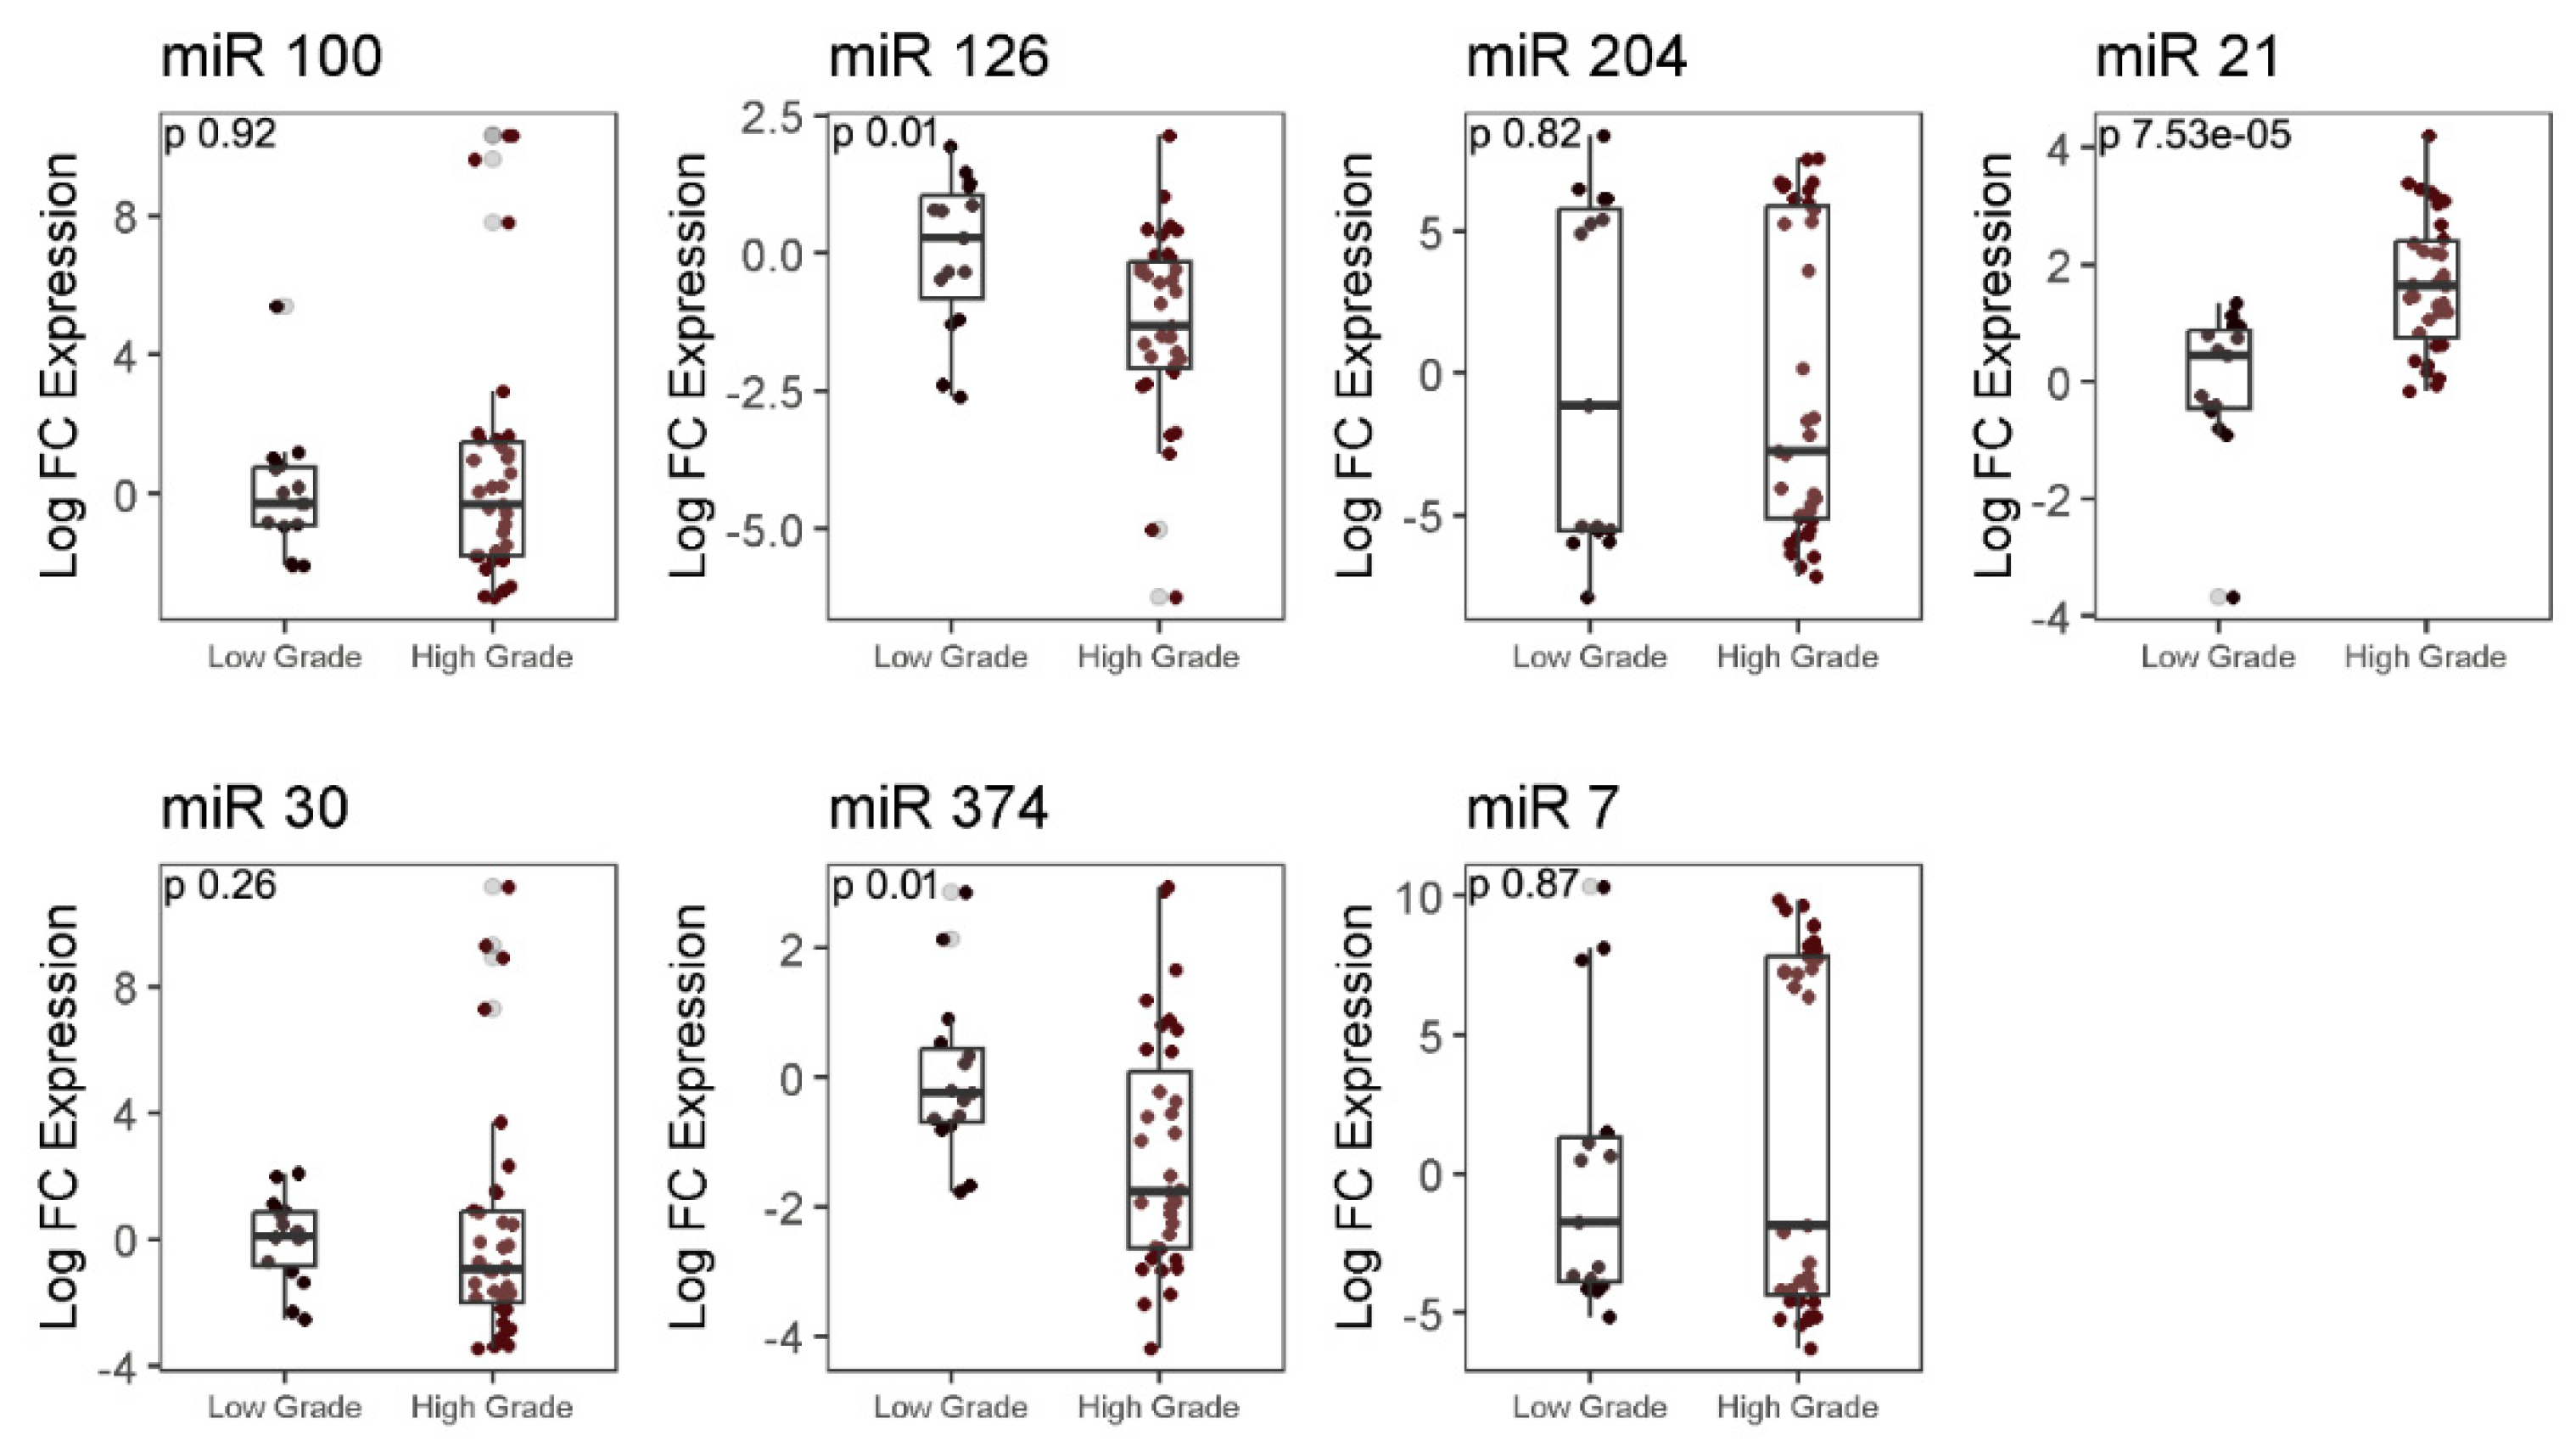
2.5. Analysis of differential expression of autophagy-associated miRNAs in LGG and HGG samples
2.6. Correlation of expression of microRNAs and other autophagy-associated genes in LGG and HGG samples
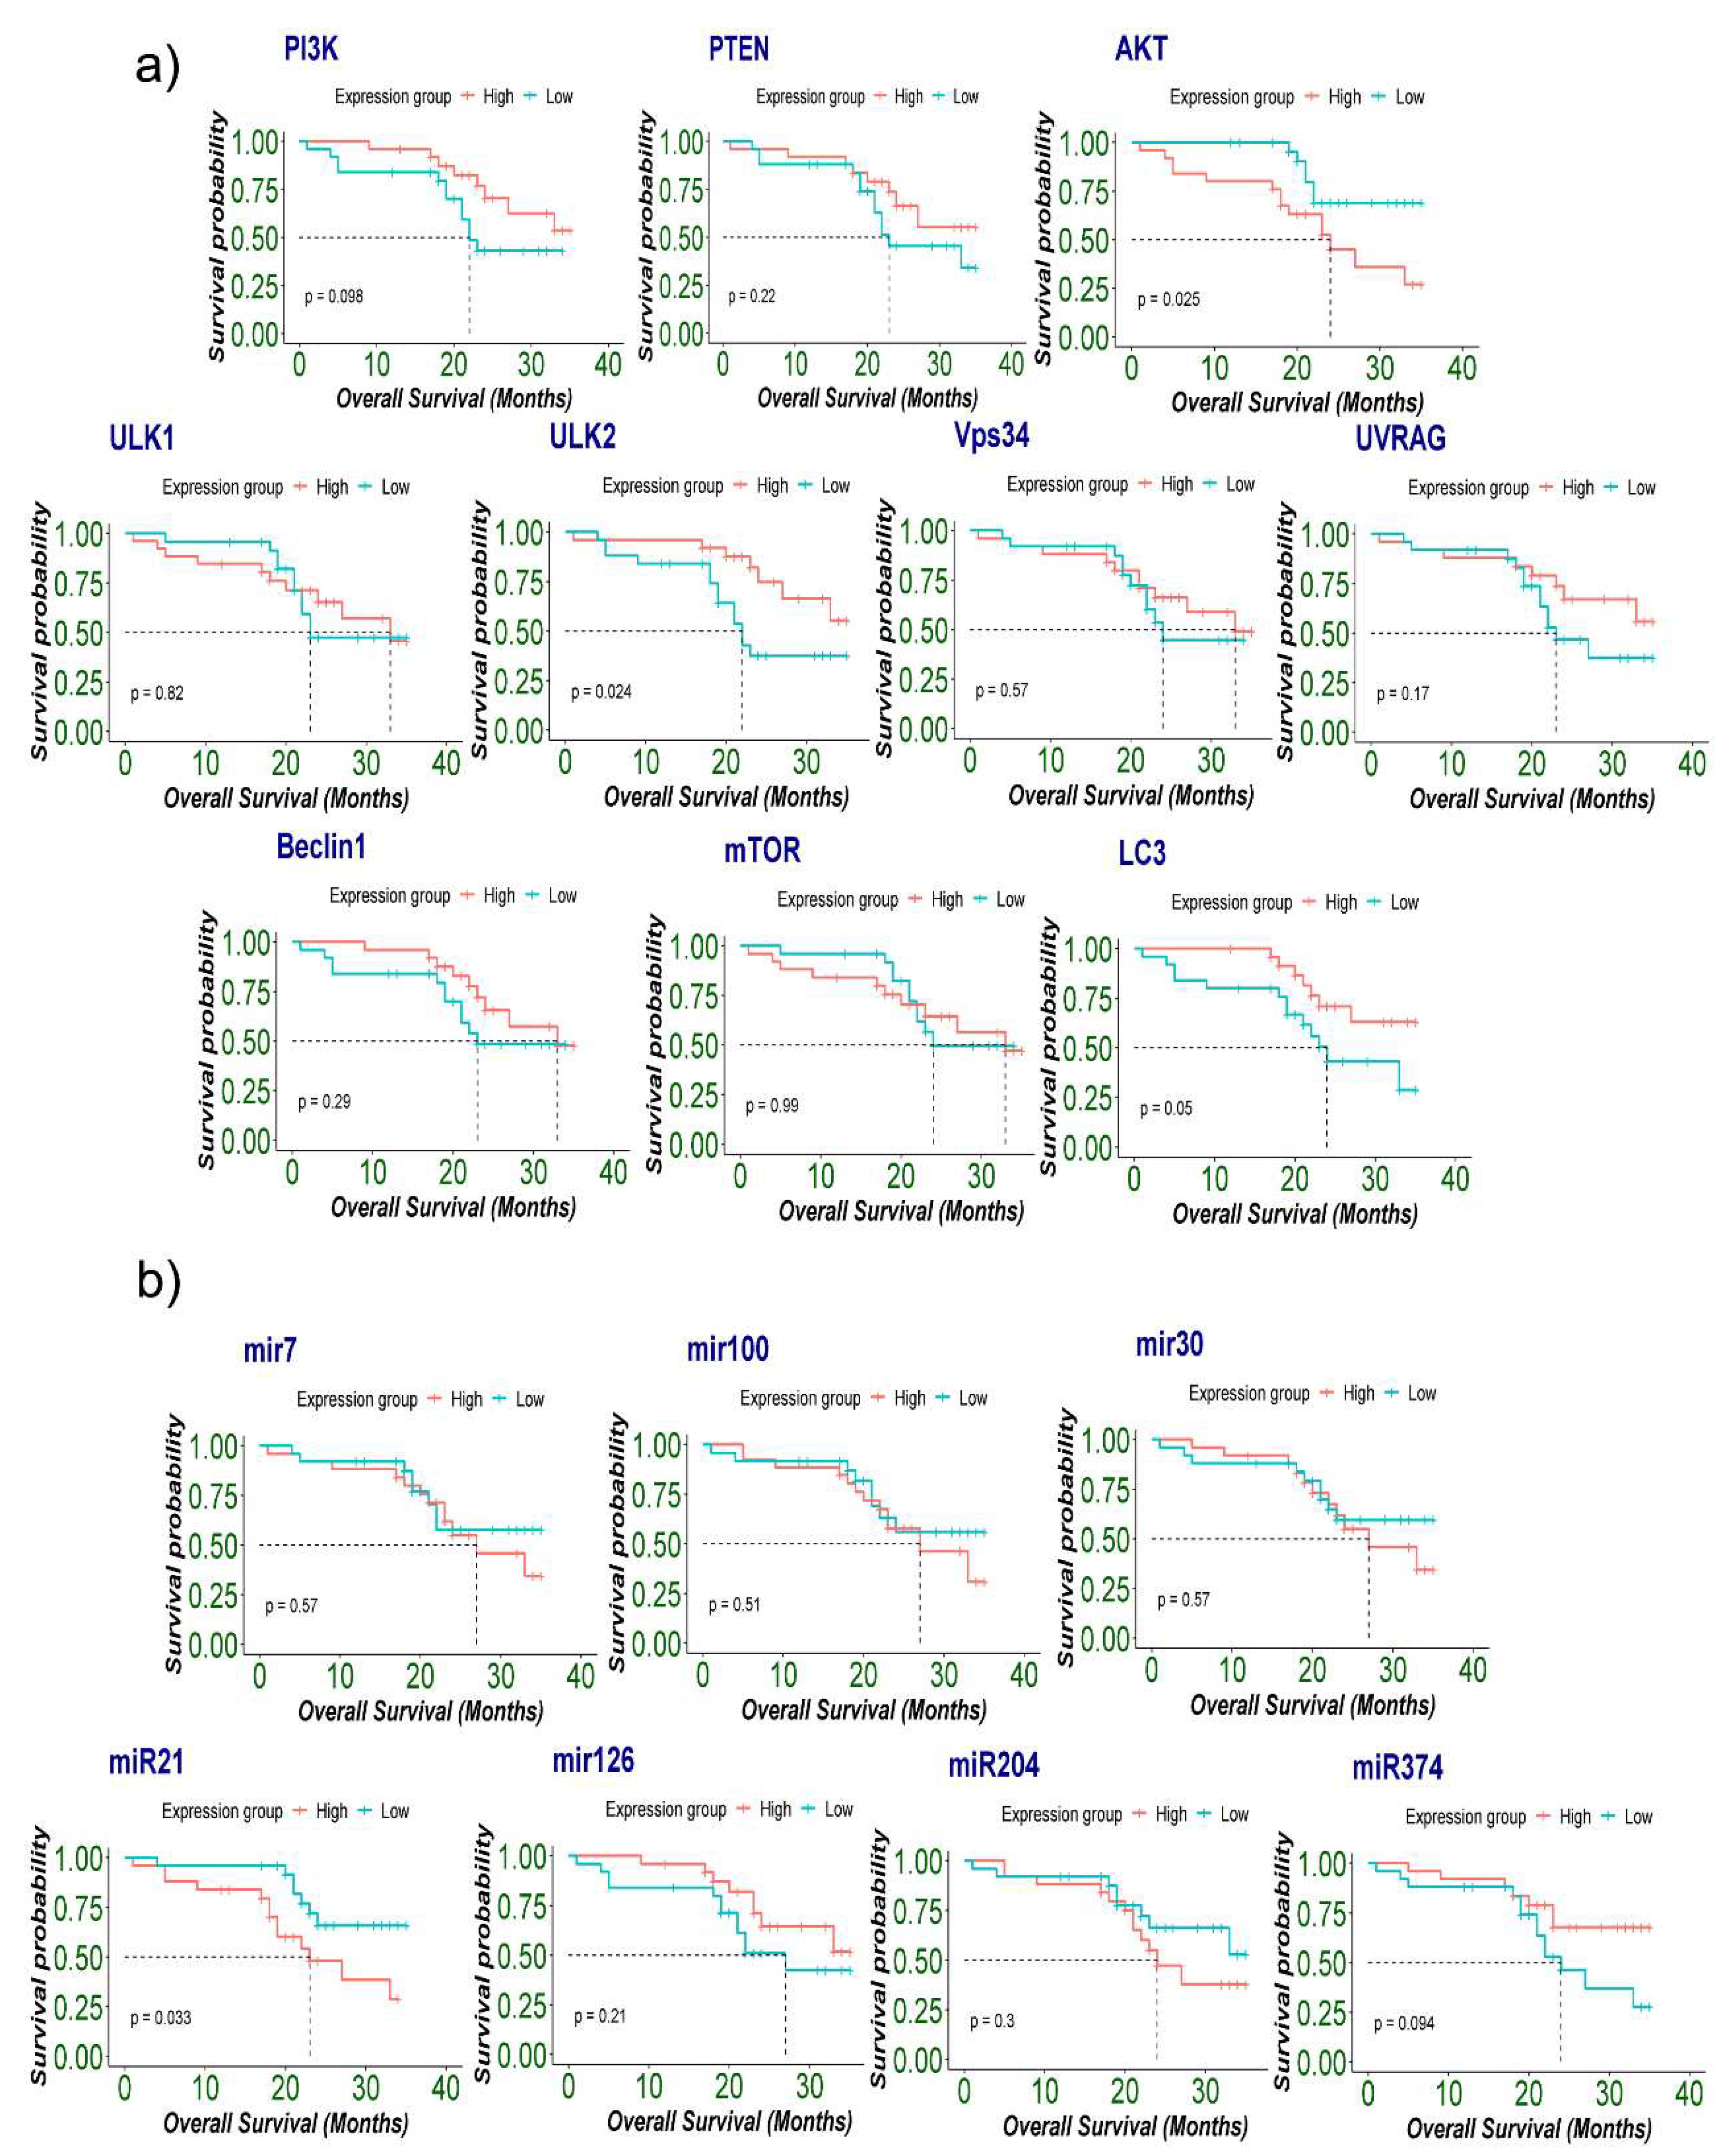
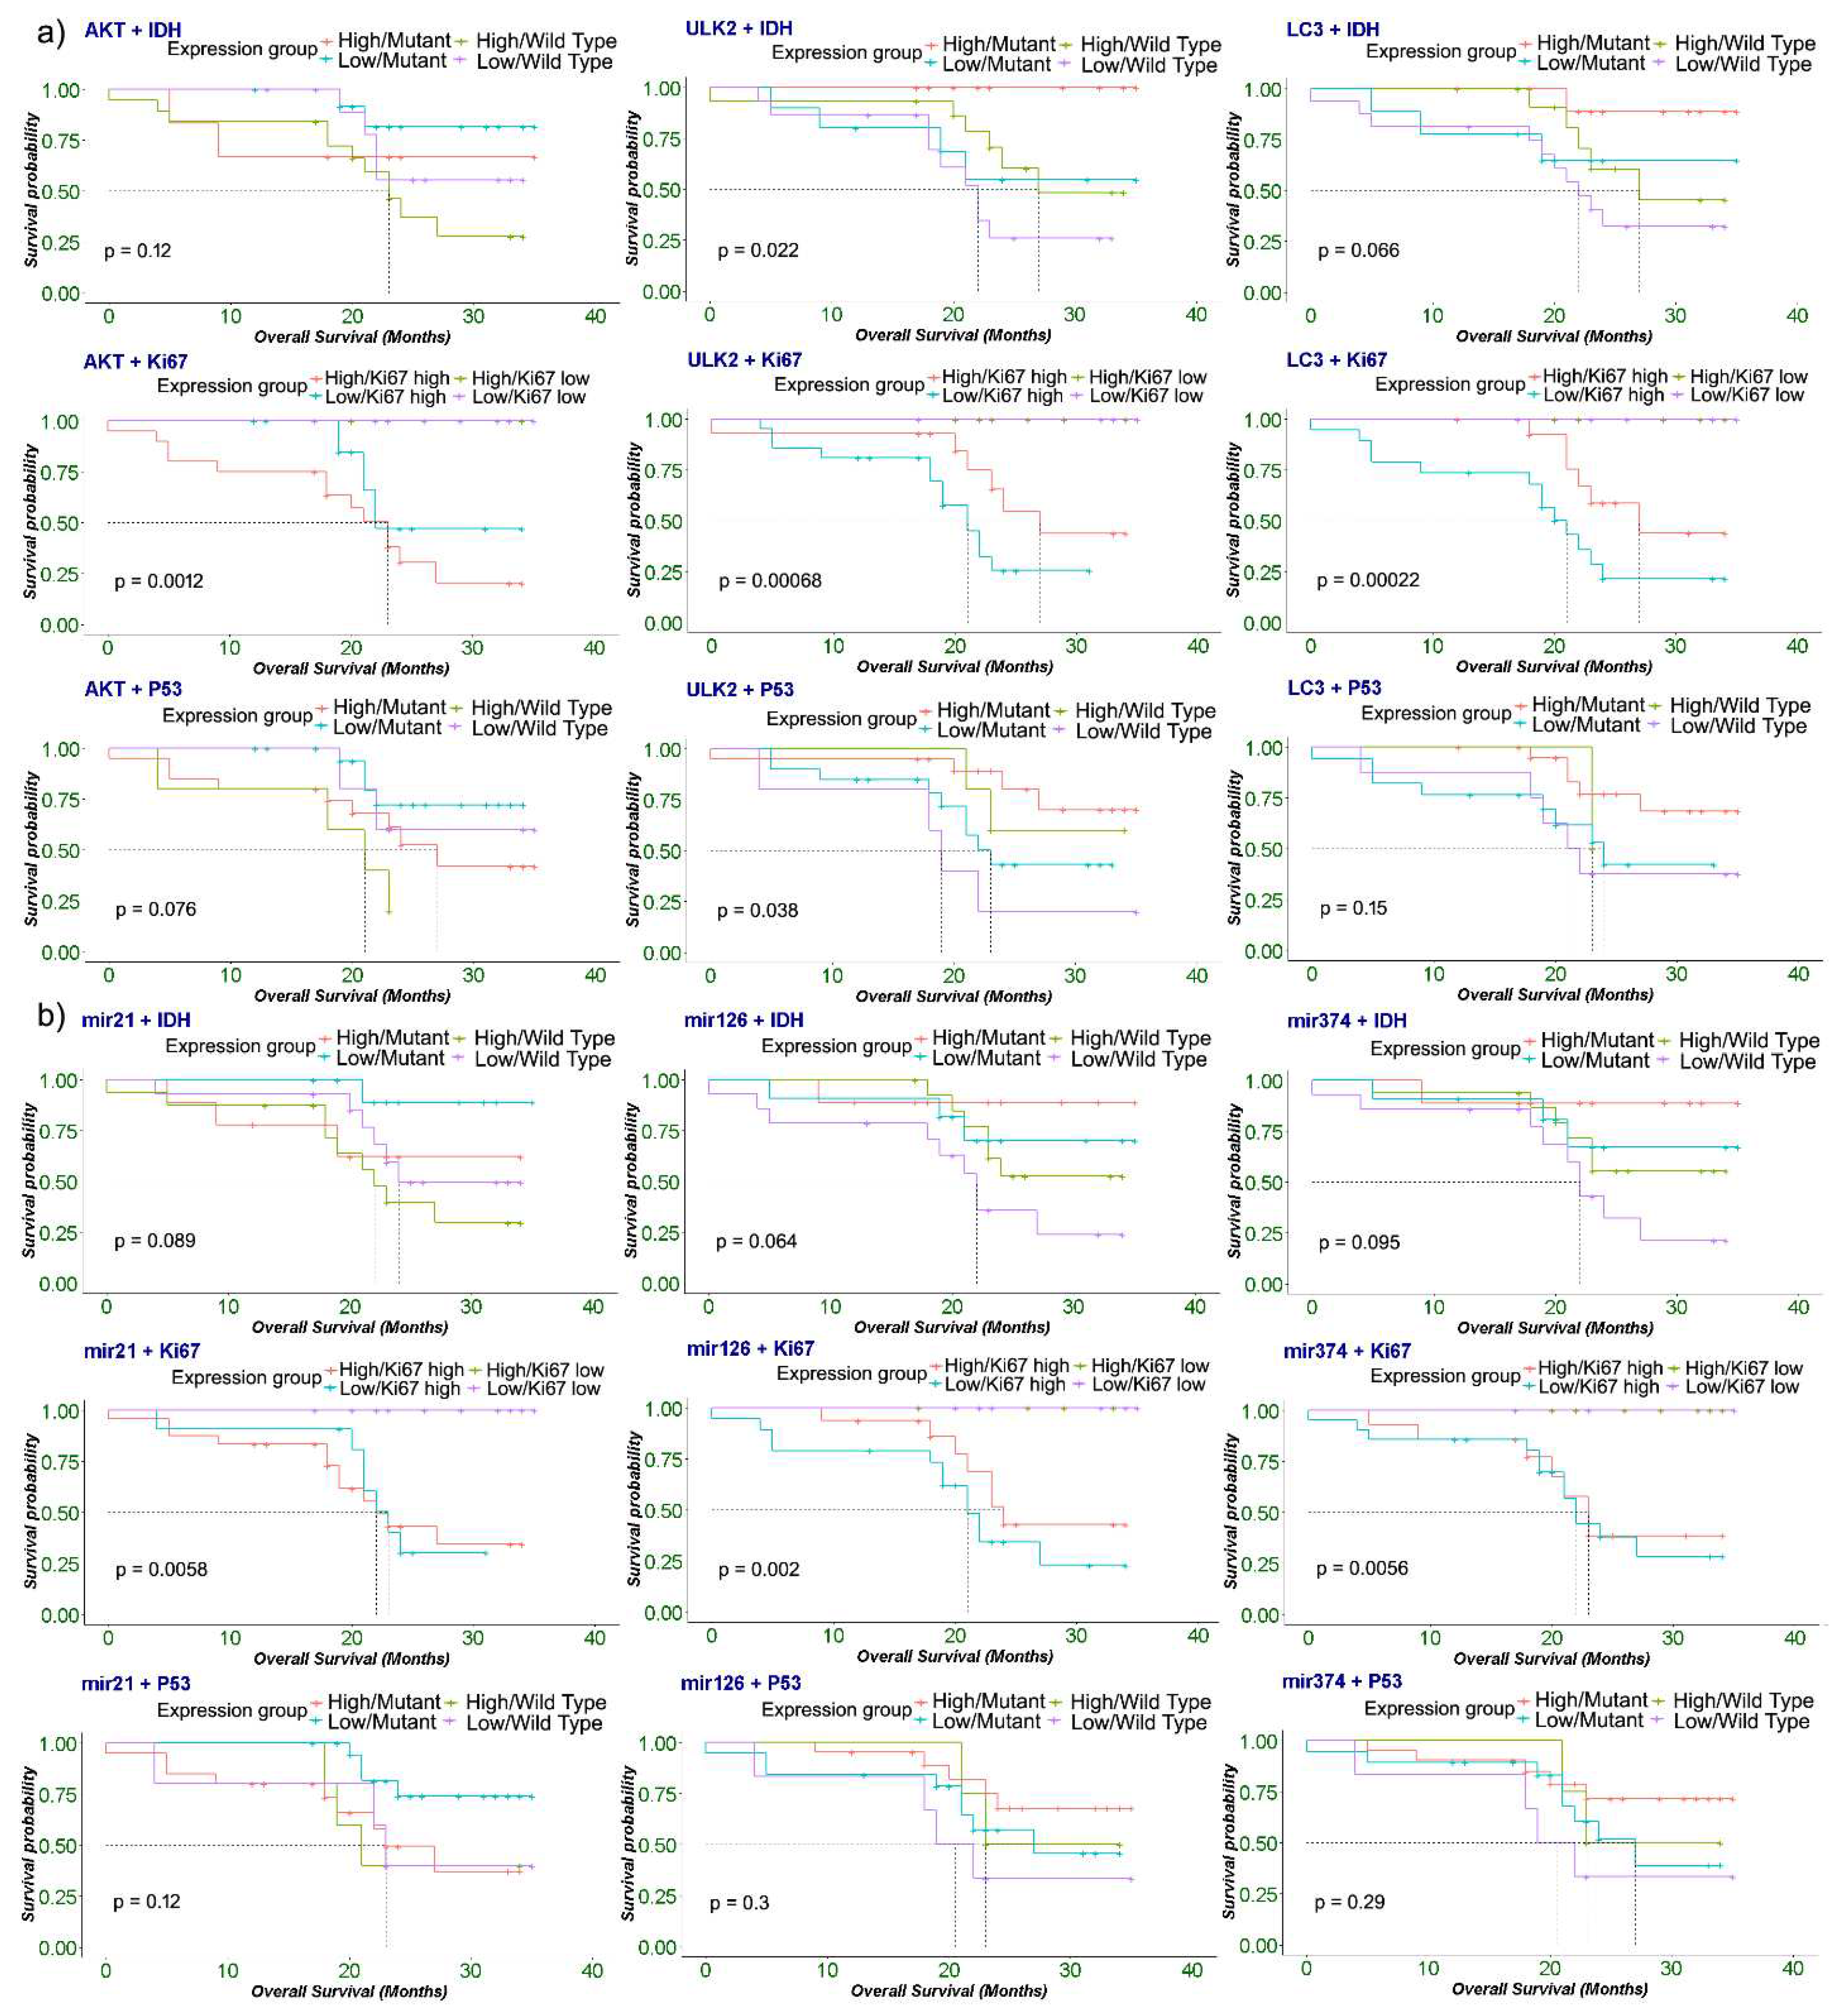
2.7. Association of expression of autophagy-associated genes and microRNAs with patient’s survival and cancer prognosis
3. Discussion
4. Methods
4.1. Patient selection
4.2. Histopathology and immunohistochemistry
4.3. RNA extraction, DNase Treatment of RNA, and CDNA synthesis
4.4. Analysis of gene expression using quantitative real-time PCR (qPCR)
4.5. Statistical analysis
Author Contributions
Funding
Institutional Review Board Statement
Informed Consent Statement
Data Availability Statement
Conflicts of Interest
Appendix A
| Forward primer | Reverse primer | ||
| Genes & microRNAs | Beclin1 | 5’-AATGACTTTTTTCCTTAGGGGG-3’ | 5’ -GTGGCTTTTGTGGATTTTTTCT-3’ |
| Mtor | 5’-TGGGACAGCATGGAAGAATA-3’ | 5’- TGTTGTGCCAAGGAGAAGAG-3’ | |
| UVRAG | 5′- CTGTTGCCCTTGGTTATACTGC -3′ | 5′- GATGATTTCTTCTGCTTGCTCC -3′ | |
| VPS34 | 5′-GCTGTCCTGGAAGACCCAAT-3′ | 5′-TTCTCACTGGCAAGGCCAAA-3′ | |
| PTEN | 5’CCAAGCTTATGACAGCCATCATC-3’ | 5’-CGCGGATCCTCAGACTTTTGTAA-3’ | |
| ULK1 | 5’-GGACACCATCAGGCTCTTCC-3’ | 5’-GAAGCCGAAGTCAGCGATCT-3’ | |
| ULK2 | 5’-TTCCTGCTCTAAGGGTTTGCTT-3’ | 5’-CCAGCGAGGGAGAACAACTG-3’ | |
| PI3K | 5’ - ATGCAAATTCAGTGCAAAGG-3’ | 5’ - CGTGTAAACAGGTCAATGGC-3’ | |
| AKT | 5’ -GCAGCACGTGTACGAGAAGA-3’ | 5’ -GGTGTCAGTCTCCGACGTG-3’ | |
| miR-7 | 5’ -AAAACTGCTGCCAAAACCAC-3’ | 5’ -GCTGCATTTTACAGCGACCAA-3’ | |
| miR-30 | 5’ -GGGGTGTAAACATCCTCGACTG-3’ | 5’ -ATTGCGTGTCGTGGAGTCG-3’ | |
| miR-100 | 5’ -GAACCCGTAGATCCGAACT-3’ | 5’ -CAGTGCGTGTCGTGGAGT-3’ | |
| miR-126 | 5’ TATGGTTGTTCTCGACTCCTTCAC-3’ | 5’ TCGTCTGTCGTACCGTGAGTAAT-3’ | |
| miR-21 | 5’-GTCGTATCCAGTGATACGACTCAACA-3’ | 5’ -GTCGTATCCAGTGCAGGGTCC-3’ | |
| miR-374 | 5’ -CCCGGGTTATAATACAACCTG-3’ | 5’ -CTCAACTGGTGTCGTGGAGTC-3’ | |
| miR-204 | 5’ -GCTACAGTCTTTCTTCATGTG-3’ | 5’ -CCAGTGATGACAATTGAACG-3’ |
References
- Hersh, A.M.; Gaitsch, H.; Alomari, S.; Lubelski, D.; Tyler, B.M. Molecular Pathways and Genomic Landscape of Glioblastoma Stem Cells: Opportunities for Targeted Therapy. Cancers 2022, 14, 3743. [Google Scholar] [CrossRef] [PubMed]
- Chaurasia, A.; Park, S.-H.; Seo, J.-W.; Park, C.-K. Immunohistochemical Analysis of ATRX, IDH1 and p53 in Glioblastoma and Their Correlations with Patient Survival. J. Korean Med Sci. 2016, 31, 1208–1214. [Google Scholar] [CrossRef] [PubMed]
- Pistritto, G.; Trisciuoglio, D.; Ceci, C.; Garufi, A.; D’Orazi, G. Apoptosis as anticancer mechanism: function and dysfunction of its modulators and targeted therapeutic strategies. Aging 2016, 8, 603–619. [Google Scholar] [CrossRef]
- Wang, G.; Wang, J.J.; Tang, H.M.; To, S.S.T. Targeting strategies on miRNA-21 and PDCD4 for glioblastoma. Arch. Biochem. Biophys. 2015, 580, 64–74. [Google Scholar] [CrossRef] [PubMed]
- Zarzynska, J.M. The Importance of Autophagy Regulation in Breast Cancer Development and Treatment. BioMed Res. Int. 2014, 2014, 1–9. [Google Scholar] [CrossRef] [PubMed]
- Schlã¤Fli, A.; Berezowska, S.; Adams, O.; Langer, R.; Tschan, M. Reliable LC3 and p62 autophagy marker detection in formalin fixed paraffin embedded human tissue by immunohistochemistry. Eur. J. Histochem. 2015, 59, 2481. [Google Scholar] [CrossRef]
- Ju, J.; Fesler, A.; Liu, H.; Wu, N.; Liu, F.; Ling, P. Autophagy regulated by miRNAs in colorectal cancer progression and resistance. Cancer Transl. Med. 2017, 3, 96–100. [Google Scholar] [CrossRef] [PubMed]
- Rao, X.; Huang, X.; Zhou, Z.; Lin, X. An improvement of the 2ˆ(–delta delta CT) method for quantitative real-time polymerase chain reaction data analysis. Biostat. Bioinform. Biomath. 2013, 3, 71–85. [Google Scholar]
- Zhu, L.; Mou, Q.; Wang, Y.; Zhu, Z.; Cheng, M. Resveratrol contributes to the inhibition of liver fibrosis by inducing autophagy via the microRNA-20a-mediated activation of the PTEN/PI3K/AKT signaling pathway. Int. J. Mol. Med. 2020, 46, 2035–2046. [Google Scholar] [CrossRef] [PubMed]
- Thambi, R. Histopathological Analysis of Brain Tumours- A Seven Year Study from a Tertiary Care Centre in South India. J. Clin. Diagn. Res. 2017, 11, EC05–EC08. [Google Scholar] [CrossRef]
- Samad, L.; Jawed, F.; Sajun, S.Z.; Arshad, M.H.; Baig-Ansari, N. Barriers to Accessing Surgical Care: A Cross-Sectional Survey Conducted at a Tertiary Care Hospital in Karachi, Pakistan. World J. Surg. 2013, 37, 2313–2321. [Google Scholar] [CrossRef] [PubMed]
- Enam, S.A.; Abdullah, U.E.H.; Laghari, A.A.; Khalid, M.U.; Rashid, H.; Jabbar, A.A.; Mubarak, F.; Hafiz, A.; Shamim, S. Current management of glioma in Pakistan. Glioma 2019, 2, 139. [Google Scholar] [CrossRef]
- Stark, A.M.; Doukas, A.; Hugo, H.-H.; Mehdorn, H.M. The expression of mismatch repair proteins MLH1, MSH2 and MSH6 correlates with the Ki67 proliferation index and survival in patients with recurrent glioblastoma. Neurol. Res. 2010, 32, 816–820. [Google Scholar] [CrossRef] [PubMed]
- Parzych, K.R.; Klionsky, D.J. An Overview of Autophagy: Morphology, Mechanism, and Regulation. Antioxidants Redox Signal. 2014, 20, 460–473. [Google Scholar] [CrossRef] [PubMed]
- Casares-Crespo, L.; Calatayud-Baselga, I.; García-Corzo, L.; Mira, H. On the Role of Basal Autophagy in Adult Neural Stem Cells and Neurogenesis. Front. Cell. Neurosci. 2018, 12, 339. [Google Scholar] [CrossRef] [PubMed]
- Liu, J.; et al. Prognostic significance of p62/SQSTM1 subcellular localization and LC3B in oral squamous cell carcinoma. British journal of cancer 2014, 111, 944–954. [Google Scholar] [CrossRef]
- Klionsky, D.J.; Abeliovich, H.; Agostinis, P.; Agrawal, D.K.; Aliev, G.; Askew, D.S.; Baba, M.; Baehrecke, E.H.; Bahr, B.A.; Ballabio, A.; et al. Guidelines for the use and interpretation of assays for monitoring autophagy in higher eukaryotes. Autophagy 2008, 4, 151–175. [Google Scholar] [CrossRef]
- Jiang, T.; Wu, Z. Immunohistochemical assessment of autophagic protein LC3B and p62 levels in glioma patients. Int. J. Clin. Exp. Pathol. 2018, 11, 862–868. [Google Scholar]
- Aoki, H.; Kondo, Y.; Aldape, K.; Yamamoto, A.; Iwado, E.; Yokoyama, T.; Hollingsworth, E.F.; Kobayashi, R.; Hess, K.; Shinojima, N.; et al. Monitoring autophagy in glioblastoma with antibody against isoform B of human microtubule-associated protein 1 light chain 3. Autophagy 2008, 4, 467–475. [Google Scholar] [CrossRef]
- Shukla, S.; Patric, I.R.P.; Patil, V.; Shwetha, S.D.; Hegde, A.S.; Chandramouli, B.A.; Arivazhagan, A.; Santosh, V.; Somasundaram, K. Methylation Silencing of ULK2, an Autophagy Gene, Is Essential for Astrocyte Transformation and Tumor Growth. J. Biol. Chem. 2014, 289, 22306–22318. [Google Scholar] [CrossRef]
- Boyd, N.H.; Tran, A.N.; Bernstock, J.D.; Etminan, T.; Jones, A.B.; Gillespie, G.Y.; Friedman, G.K.; Hjelmeland, A.B. Glioma stem cells and their roles within the hypoxic tumor microenvironment. Theranostics 2021, 11, 665–683. [Google Scholar] [CrossRef] [PubMed]
- Zhao, Z.; et al. Knockdown lncRNA CRNDE enhances temozolomide chemosensitivity by regulating autophagy in glioblastoma. Cancer Cell International 2021, 21, 1–15. [Google Scholar] [CrossRef] [PubMed]
- Crabtree, J.S.; Jelinsky, S.A.; Harris, H.A.; Choe, S.E.; Cotreau, M.M.; Kimberland, M.L.; Wilson, E.; Saraf, K.A.; Liu, W.; McCampbell, A.S.; et al. Comparison of Human and Rat Uterine Leiomyomata: Identification of a Dysregulated Mammalian Target of Rapamycin Pathway. Cancer Res 2009, 69, 6171–6178. [Google Scholar] [CrossRef] [PubMed]
- Jiang, L.; Wang, C.; Lei, F.; Zhang, L.; Zhang, X.; Liu, A.; Wu, G.; Zhu, J.; Song, L. miR-93 Promotes Cell Proliferation in Gliomas through Activation of PI3K/Akt Signaling Pathway. Oncotarget 2015, 6, 8286–8299. [Google Scholar] [CrossRef] [PubMed]
- Xu, X.; Wang, W.; Su, N.; Zhu, X.; Yao, J.; Gao, W.; Hu, Z.; Sun, Y. miR-374a promotes cell proliferation, migration and invasion by targeting SRCIN1 in gastric cancer. FEBS Lett. 2014, 589, 407–413. [Google Scholar] [CrossRef] [PubMed]
- Peralta-Zaragoza, O.; Deas, J.; Meneses-Acosta, A.; De la O-Gómez, F.; Fernández-Tilapa, G.; Gómez-Cerón, C.; Benítez-Boijseauneau, O.; Burguete-García, A.; Torres-Poveda, K.; Bermúdez-Morales, V.H.; et al. Relevance of miR-21 in regulation of tumor suppressor gene PTEN in human cervical cancer cells. BMC Cancer 2016, 16, 1–16. [Google Scholar] [CrossRef] [PubMed]
- Sun, L.-H.; Tian, D.; Yang, Z.-C.; Li, J.-L. Exosomal miR-21 promotes proliferation, invasion and therapy resistance of colon adenocarcinoma cells through its target PDCD4. Sci. Rep. 2020, 10, 1–8. [Google Scholar] [CrossRef] [PubMed]
- Seo, Y.-E.; Suh, H.-W.; Bahal, R.; Josowitz, A.; Zhang, J.; Song, E.; Cui, J.; Noorbakhsh, S.; Jackson, C.; Bu, T.; et al. Nanoparticle-mediated intratumoral inhibition of miR-21 for improved survival in glioblastoma. Biomaterials 2019, 201, 87–98. [Google Scholar] [CrossRef]
- Yang, C.H.; Yue, J.; Pfeffer, S.R.; Fan, M.; Paulus, E.; Hosni-Ahmed, A.; Sims, M.; Qayyum, S.; Davidoff, A.M.; Handorf, C.R.; et al. MicroRNA-21 Promotes Glioblastoma Tumorigenesis by Down-regulating Insulin-like Growth Factor-binding Protein-3 (IGFBP3). J. Biol. Chem. 2014, 289, 25079–25087. [Google Scholar] [CrossRef]
- Dong, Q.; Yuan, G.; Liu, M.; Xie, Q.; Hu, J.; Wang, M.; Liu, S.; Ma, X.; Pan, Y. Downregulation of microRNA-374a predicts poor prognosis in human glioma. Exp. Ther. Med. 2019, 17, 2077–2084. [Google Scholar] [CrossRef]
- Zhang, S.-B.; Liu, T.-J.; Pu, G.-H.; Li, B.-Y.; Gao, X.-Z.; Han, X.-L. MicroRNA-374 Exerts Protective Effects by Inhibiting SP1 Through Activating the PI3K/Akt Pathway in Rat Models of Myocardial Ischemia-Reperfusion After Sevoflurane Preconditioning. Cell. Physiol. Biochem. 2018, 46, 1455–1470. [Google Scholar] [CrossRef] [PubMed]
- Zhu, H.; Wu, H.; Liu, X.; Li, B.; Chen, Y.; Ren, X.; Liu, C.-G.; Yang, J.-M. Regulation of autophagy by a beclin 1-targeted microRNA, miR-30a, in cancer cells. Autophagy 2009, 5, 816–823. [Google Scholar] [CrossRef] [PubMed]
- Sibilano, M.; Tullio, V.; Adorno, G.; Savini, I.; Gasperi, V.; Catani, M.V. Platelet-Derived miR-126-3p Directly Targets AKT2 and Exerts Anti-Tumor Effects in Breast Cancer Cells: Further Insights in Platelet-Cancer Interplay. Int. J. Mol. Sci. 2022, 23, 5484. [Google Scholar] [CrossRef] [PubMed]
- Chen, S.-R.; Cai, W.-P.; Dai, X.-J.; Guo, A.-S.; Chen, H.-P.; Lin, G.-S.; Lin, R.-S. Research on miR-126 in glioma targeted regulation of PTEN/PI3K/Akt and MDM2-p53 pathways. Eur. Rev. Med Pharmacol. Sci. 2019, 23, 3461–3470. [Google Scholar] [PubMed]
- Akkoc, Y.; Gozuacik, D. MicroRNAs as major regulators of the autophagy pathway. Biochimica et Biophysica Acta (BBA)-Molecular Cell Research 2020, 1867, 118662. [Google Scholar] [CrossRef] [PubMed]
- Gu, D.-N.; Jiang, M.-J.; Mei, Z.; Dai, J.-J.; Dai, C.-Y.; Fang, C.; Huang, Q.; Tian, L. microRNA-7 impairs autophagy-derived pools of glucose to suppress pancreatic cancer progression. Cancer Lett. 2017, 400, 69–78. [Google Scholar] [CrossRef]
- Korać, P.; Antica, M.; Matulić, M. MiR-7 in Cancer Development. Biomedicines 2021, 9, 325. [Google Scholar] [CrossRef]
- Seca, H.; Lima, R.; Lopes-Rodrigues, V.; Guimaraes, J.; Gabriela, G.; Vasconcelos, M. Targeting miR-21 Induces Autophagy and Chemosensitivity of Leukemia Cells. Curr. Drug Targets 2013, 14, 1135–1143. [Google Scholar] [CrossRef]
- Duzgun, Z.; Eroglu, Z.; Avci, C.B. Role of mTOR in glioblastoma. Gene 2016, 575, 187–190. [Google Scholar] [CrossRef]
- Mecca, C.; Giambanco, I.; Donato, R.; Arcuri, C. Targeting mTOR in Glioblastoma: Rationale and Preclinical/Clinical Evidence. Dis. Markers 2018, 2018, 1–10. [Google Scholar] [CrossRef]
- Hashemi, M.; Etemad, S.; Rezaei, S.; Ziaolhagh, S.; Rajabi, R.; Rahmanian, P.; Abdi, S.; Koohpar, Z.K.; Rafiei, R.; Raei, B.; et al. Progress in targeting PTEN/PI3K/Akt axis in glioblastoma therapy: Revisiting molecular interactions. BioMedicine 2023, 158, 114204. [Google Scholar] [CrossRef] [PubMed]
- Morelli, M.B.; Nabissi, M.; Amantini, C.; Maggi, F.; Ricci-Vitiani, L.; Pallini, R.; Santoni, G. TRPML2 Mucolipin Channels Drive the Response of Glioma Stem Cells to Temozolomide and Affect the Overall Survival in Glioblastoma Patients. Int. J. Mol. Sci. 2022, 23, 15356. [Google Scholar] [CrossRef] [PubMed]
- Cj, P.L.; et al. High LC3/Beclin expression correlates with poor survival in glioma: a definitive role for autophagy as evidenced by in vitro autophagic flux. Pathology & Oncology Research 2019, 25, 137–148. [Google Scholar]
- Stafford, M.C.; Willoughby, C.E.; Walsh, C.P.; McKenna, D.J. Prognostic value of miR-21 for prostate cancer: a systematic review and meta-analysis. Biosci. Rep. 2022, 42, BSR20211972. [Google Scholar] [CrossRef] [PubMed]
- Irimie-Aghiorghiesei, A.I.; et al. Prognostic value of MiR-21: an updated meta-analysis in Head and Neck Squamous Cell Carcinoma (HNSCC). Journal of clinical medicine 2019, 8, 2041. [Google Scholar] [CrossRef]
- Sufianov, A.; Begliarzade, S.; Ilyasova, T.; Liang, Y.; Beylerli, O. MicroRNAs as prognostic markers and therapeutic targets in gliomas. Non-coding RNA Res. 2022, 7, 171–177. [Google Scholar] [CrossRef]
- Nieland, L.; van Solinge, T.S.; Cheah, P.S.; Morsett, L.M.; El Khoury, J.; Rissman, J.I.; Kleinstiver, B.P.; Broekman, M.L.; Breakefield, X.O.; Abels, E.R. CRISPR-Cas knockout of miR21 reduces glioma growth. Mol. Ther. - Oncolytics 2022, 25, 121–136. [Google Scholar] [CrossRef]
- Cui, H.; Mu, Y.; Yu, L.; Xi, Y.-G.; Matthiesen, R.; Su, X.; Sun, W. Methylation of the miR-126 gene associated with glioma progression. Fam. Cancer 2015, 15, 317–324. [Google Scholar] [CrossRef]
- Shukla, A.; Sehgal, M.; Singh, T.R. Hydroxymethylation and its potential implication in DNA repair system: A review and future perspectives. Gene 2015, 564, 109–118. [Google Scholar] [CrossRef]

| Clinicopathological features | Values (%) |
|---|---|
|
Gender Male Female |
34 (68%) 16 (32%) |
|
Age (years) Medians (range) |
38 (4-70) |
|
Histological type (WHO grade) II III IV |
15 (30%) 5 (10%) 30 (60%) |
|
Histological group LGG HGG |
15 (30%) 35 (70%) |
|
Status at 4 years Dead Alive LTFU |
18 (36%) 31 (62%) 1 (20%) |
|
Recurrence No recurrence Recurrence |
30 (62%) 9 (38%) |
|
Radiotherapy Yes No |
23 (46%) 23 (46%) |
|
Chemotherapy Yes No |
23 (46%) 23 (46%) |
| Adjuvant chemoradiotherapy |
21 (42%) |
|
Postoperative KPS score >=80 <80 |
22 (44%) 26 (52%) |
|
Overall survival months Median (Range) |
22.6 (4-35) |
|
Molecular Profile IDH-1 Mutation ATRX Retained p53 Overexpression Ki-67 Overexpression |
20 (40%) 50 (100%) 40 (80%) 35 (35%) |
| Table 2 | Total No. of samples | ATRX | IDH1 | p53 | Ki67 | |||||||
|---|---|---|---|---|---|---|---|---|---|---|---|---|
| Factors | n=50 | Retained n=50 |
Loss n=0 |
Wild Type n=30 |
Mutant n=20 |
P-value | Positive n=40 |
Negative n=10 |
P-value | High n=35 |
Low n=15 |
P-value |
|
Age <40 |
32 | 32 (100%) | 0 (0%) | 19 (59.3%) | 13 (40.6%) | 1 | 27 (84.3%) | 5 (15.6%) | 0.5 | 18 (56.2%) | 14 (43.7%) |
0.005 |
| >40 | 18 | 18 (100%) | 0 (0%) | 11 (61.1%) | 7 (38.8%) | 13 (72.2%) | 5 (27.7%) | 17 (94.4%) | 1 (5.5%) | |||
|
Gender Female |
16 | 16 (100%) | 0 (0%) | 9 (56.2%) | 7 (43.7%) | 0.76 | 12 (75%) | 4 (25%) | 0.7 | 13 (81.2%) | 3 (18.7%) | 0.32 |
| Male | 34 | 34 (100%) | 0 (0%) | 21 (61.7%) | 13 (38.2%) | 28 (82.3%) | 6 (17.6%) | 22 (64.7%) | 12 (35.2%) | |||
|
Histological Type LGG (grade II) |
15 | 15 (100%) | 0 (0%) | 8 (53.3%) | 7 (46.66%) | 0.23 | 13 (86.66%) | 2 (13.33%) | 0.7 | 1(6.66) | 14 (93.33%) | <0.001 |
| HGG (III, IV) | 35 | 35(100%) | 0 (0%) | 22 (62.85%) | 13 (37.14%) | 27 (77.14%) | 8 (22.85%) | 34 (97.14%) | 1 (2.85%) | |||
|
Chemotherapy Yes |
23 | 23 (100%) | 0 (0%) | 11 (47.8%) | 12 (52.1%) | 0.23 | 19 (82.6%) | 4 (17.3%) | 0.7 | 21 (91.3%) | 2 (8.6%) | 0.001 |
| No | 23 | 23 (100%) | 0 (0%) | 16 (69.5%) | 7 (30.4%) | 17 (73.9%) | 6 (26%) | 10 (43.4%) | 13 (56.5%) | |||
|
Radiotherapy Yes |
23 | 23 (100%) | 0 (0%) | 11 (47.8%) | 12 (52.1%) | 0.23 | 19 (82.6%) | 4 (17.3%) | 0.7 | 20 (86.9%) | 3 (13%) | 0.01 |
| No | 23 | 23 (100%) | 0 (0%) | 16 (69.5%) | 7 (30.4%) | 17 (73.9%) | 6 (26%) | 11 (47.8%) | 12 (52.1%) | |||
|
Recurrence Yes |
19 | 19 (100%) | 0 (0%) | 12 (63.1%) | 7 (36.8%) | 0.62 | 16 (84.2%) | 3 (15.7%) | 0.8 | 15 (78.9%) | 4 (21%) | 0.54 |
| No | 30 | 30 (100%) | 0 (0%) | 18 (60%) | 12 (40%) | 23 (76.6%) | 7 (23.3%) | 19 (63.3%) | 11 (36.6%) | |||
|
Current Status Dead |
18 | 18 (100%) | 0 (0%) | 14 (77.7%) | 4 (22.2%) | 0.13 | 13 (72.2%) | 5(27.7%) | 0.2 | 16 (51.6%) | 15(48.3%) | 0.004 |
| Alive | 31 | 31 (100%) | 0 (0%) | 15 (48.3%) | 16 (51.6%) | 27 (87%) | 4(12.9%) | 6 (40%) | 9 (60%) | |||
|
Tumor Type Oligodendroglioma |
15 | 15 (100%) | 0 (0%) | 6 (40%) | 9 (60%) | 0.19 | 13 (86.6%) | 2 (13%) | 0.5 | 7 (46.6%) | 8 (53.3%) | <0.001 |
| Glioblastoma | 29 | 29 (100%) | 0 (0%) | 20 (68.9%) | 9 (31%) | 22 (75.8%) | 7 (24.1%) |
29 (100%) |
0 (0%) |
|||
| Astrocytoma | 6 | 6 (100%) | 0 (0%) | 4 (66.6%) | 2 (33.3%) | 5 (83.3%) | 1 (16.6%) | 1 (16.66%) | 5 (83.33%) | |||
| Correlation between Gene to miRs in Low Grade Glioma | |||||||||||||||
| Genes/miRs | miR-7 | miR-30 | miR-100 | miR-126 | miR-204 | miR-374 | miR-21 | ||||||||
| ULK2 | 0.85 | 0.56 | 0.81 | 0.15 | 0.58 | 0.68 | 0.21 | ||||||||
| AKT | 0.45 | 0.19 | 0.04 | 0.11 | 0.19 | 0.16 | 0.03 | ||||||||
| LC3 | -0.31 | -0.02 | 0.02 | 0.24 | -0.18 | -0.09 | 0.43 | ||||||||
| miR-21 | 0.12 | 0.05 | 0.01 | 0.56 | 0.23 | 0.08 | 1.00 | ||||||||
| Correlation between Gene to Genes in Low Grade Glioma | |||||||||||||||
|
Genes /miRs |
ULK2 | AKT | LC3 | miR-21 | PI3K | PTEN | ULK1 | Vps34 | mTOR | Beclin | UVRAG | ||||
| ULK2 | 1.00 | 0.39 | -0.08 | 0.21 | 0.46 | 0.92 | 0.41 | 0.49 | 0.59 | 0.51 | 0.80 | ||||
| AKT | 0.39 | 1.00 | -0.38 | 0.03 | -0.02 | 0.24 | -0.31 | -0.21 | -0.05 | 0.11 | 0.30 | ||||
| LC3 | -0.08 | -0.38 | 1.00 | 0.43 | -0.01 | -0.02 | -0.12 | 0.00 | -0.14 | 0.00 | 0.01 | ||||
| miR-21 | 0.21 | 0.03 | 0.43 | 1.00 | 0.09 | 0.31 | 0.04 | 0.37 | 0.30 | 0.13 | 0.23 | ||||
| Correlation between Gene to miRs in Low Grade Glioma | ||||||||||||||||
| Genes/miRs | miR-7 | miR-30 | miR-100 | miR-126 | miR-204 | miR-374 | miR-21 | |||||||||
| ULK2 | 0.40 | 0.27 | 0.16 | 0.32 | 0.12 | 0.50 | 0.21 | |||||||||
| AKT | 0.66 | 0.41 | 0.30 | 0.38 | 0.40 | 0.35 | 0.38 | |||||||||
| LC3 | -0.03 | 0.08 | 0.20 | 0.07 | 0.22 | 0.01 | -0.19 | |||||||||
| miR-21 | 0.26 | 0.40 | 0.12 | 0.08 | -0.14 | 0.11 | 1.00 | |||||||||
| Correlation between Gene to Genes in High Grade Glioma | ||||||||||||||||
| Genes/miRs | ULK2 | AKT | LC3 | miR-21 | PI3K | PTEN | ULK1 | Vps34 | mTOR | Beclin | UVRAG | |||||
| ULK2 | 1.00 | 0.50 | -0.02 | 0.21 | 0.49 | 0.63 | 0.53 | 0.63 | 0.59 | 0.55 | 0.66 | |||||
| AKT | 0.50 | 1.00 | 0.13 | 0.38 | 0.48 | 0.48 | 0.59 | 0.56 | 0.43 | 0.34 | 0.69 | |||||
| LC3 | -0.02 | 0.13 | 1.00 | -0.19 | -0.02 | 0.18 | 0.06 | 0.19 | 0.09 | -0.15 | 0.13 | |||||
| miR-21 | 0.21 | 0.38 | -0.19 | 1.00 | 0.12 | 0.03 | 0.24 | 0.09 | -0.05 | -0.14 | 0.29 | |||||
| Univariable Cox regression | |||
|---|---|---|---|
| Genes | HR Ratio | CI (Lower 0.95 - Upper 0.95) | p-value (Log Rank) |
| AKT | 2.829 | 0.135 : 0.921 | 0.03* |
| ULK2 | 0.355 | 1.111 : 7.113 | 0.02* |
| LC3 | 0.41 | 0.968: 6.127 | 0.05* |
| miR-21 | 2.637 | 0.150 : 0.955 | 0.03* |
| miR-126 | 0.56 | 0.722: 4.35 | 0.2 |
| miR-374 | 0.463 | 0.859: 5.414 | 0.09 |
Disclaimer/Publisher’s Note: The statements, opinions and data contained in all publications are solely those of the individual author(s) and contributor(s) and not of MDPI and/or the editor(s). MDPI and/or the editor(s) disclaim responsibility for any injury to people or property resulting from any ideas, methods, instructions or products referred to in the content. |
© 2023 by the authors. Licensee MDPI, Basel, Switzerland. This article is an open access article distributed under the terms and conditions of the Creative Commons Attribution (CC BY) license (http://creativecommons.org/licenses/by/4.0/).


