1. Introduction
In recent years, global warming has become a major concern globally. According to the United Nations Intergovernmental Panel on Climate Change (IPCC 2021), the global temperature is still rising at a certain rate; China is vulnerable to global climate change, particularly in northwest China, global warming is more visible in some areas, and global warming may increase the frequency of extreme events.1,2. Climate change may cause changes in the yield of crops because agriculture is highly dependent on climate change. Similarly, Irrigation, pest and diseases and climate change impact cotton productivity. Several academic studies have examined the effects of climate change on cotton production. For future cotton cultivation planning, it is essential to examine how climate change affects suitable cotton-growing regions. The planting of long staple cotton in Xinjiang has changed, and the climate environment in some planting areas is no longer suitable for planting long staple cotton crops3.
Long-staple cotton is hybrid cotton, the best fiber-quality cotton varieties in the world4,5, and the world's best tetraploid cultivated cotton6,7. Its quality is essential and prominent in industrial production applications8 due to its soft and long fibers and kidney bean shape 9. In terms of structure, fiber has 90% cellulose having primary and secondary walls and a lumen. Moreover, the cuticle comprises wax, proteins, and pectin10. Thus, these structural components profoundly impact fiber’s production, processing, and storage performance. Hence, this cotton can be very suitable for the clothing industry as raw material and has significant advantages in terms of comfort and durability[7].
Long-staple cotton has high demand in the global market, and China is a major country in the clothing manufacturing industry 11. Thus, an urgent agenda is improving cotton's quality and economic benefits and sustainably developing the cotton industry according to local conditions. As China's most important long-staple cotton-producing zone, Xinjiang dominates the primary market for Chinese cotton. It even influences China's international position regarding the long-staple cotton market12. The cotton variety grown in Xinjiang is mostly long-staple cotton13,14. However, it has been cultivated successfully in Central Asia since 1953 for 70 years, among more than 70 varieties 15. Although the quality of Xinjiang long-staple cotton is currently at the forefront of the world[12], its yield shows a continuous upward tendency.
In China, Xinjiang is a high-quality long-staple cotton industry that contributes over 95% of the total production nationwide. Xinjiang cotton has achieved satisfying results due to climate and environmental factors. Although, climate factors, like limited water resources, temperature and rainfall, affect the growth of cotton [13]. Low temperature may lead to slow growth and development of long staple- cotton. Further high temperatures may also affect the volume of cotton bells and the number of cottonseeds. Similarly, water is also another important factor affecting long-staple cotton. If the water is insufficient, it may affect the photosynthesis of long staple cotton and yield. The terrain of the planting area might affect the absorption of water. For different stages, the temperature and water requirements of long staple cotton are different, which requires us to select climate factors when determining the influence factors comprehensively. Therefore, maintaining the unique and precious industry of long-staple cotton, maximising the regional advantages of Xinjiang, and guaranteeing the sustainable and steady development of cotton production is challenging. However, Xinjiang is extremely sensitive to global climate change[14], and changes may happen to the cultivated area, and suitable regions can migrate due to global warming17.
The distribution of crop suitability has been studied using multiple models concerning the advantages of low cost, high efficiency, and easy to control by many scholars18,19. However, the suitable geographical locations and the unique climatic characteristics with the help of the MaxEnt model and Species Distribution Modeling (SDM) tools are not explored clearly. Therefore this study has utilized SDM [20], a method to simulate the species’ geographical distribution based on known distribution data and influencing environmental factors, which can predict the species distribution range and shift to climate change in the present and future. Generally, there are several sub-types of models under SDM, for example, statistical models, including generalized linear models (GLM); or based on machine learning methods, and the maximum entropy (MaxEnt) model21–23. MaxEnt model has the advantage of convenience because it analyzes according to the existing distribution points of small samples and has a good simulation effect[20,21]. Thus, we used the Maxent model (designed by Java language) and ArcGIS (version 10.8) tool was used for data classification processing and analysis26, to examine the factors that affect cotton growth, and analyzed the suitable distribution areas for Xinjiang long-staple cotton as well as potential distribution zone under various future climates27.
This study hopes to predict the suitable planting area and future development trend of long staple cotton through the abovementioned model, closely related to the quality and yield of long and short cotton. First, we explored the influence of climate, topographic, and soil factors on long staple cotton in Xinjiang and obtained the larger environmental factors affecting long staple cotton. To determine whether the distribution of long staple cotton in Xinjiang meets the highest benefit in the current environment, which is favourable to the sustainable development of long staple cotton, firstly determine the most suitable area for planting long staple cotton. This area is then determined according to the specific distribution of various suitable influencing factors. Finally, the future climate data from the three scenarios were used to determine the expansion direction of suitable habitat under the future climate conditions, and the average expansion distance of suitable areas of long staple cotton in Xinjiang by 2070, which will help people to make whole preparations for the change of long staple cotton.
2. Data and methods
2.1. Study area
Xinjiang (73°40′-96°18′E, 34°25′-48°10′N) is located on the northwest border of China and lying in the hinterland of Eurasia. It is surrounded by "three mountains (the northernmost part of Xinjiang is the Mount Altai, the southernmost part is the Kunlun Mountain, and the Tianshan Mountain lies across the middle part of Xinjiang, dividing Xinjiang into north and south parts) accompanied by two basins". The altitude of Xinjiang Province fluctuates greatly. The highest point is located at K2 in the Karakoram of 8611 meters above sea level, and the lowest is located at Aydingkol Lake in Turpan, 155 meters underneath. Xinjiang has typical temperate continental arid climate with sparse precipitation, high evaporation, extremely uneven spatiotemporal distribution of water resources, and an average annual sunshine time of 2300-3200 hours28. Thus, the duration of sunlight and the daily temperature difference create unique conditions for the growth of long-staple cotton.
2.2. Data collection
2.2.1. Species Distribution Data
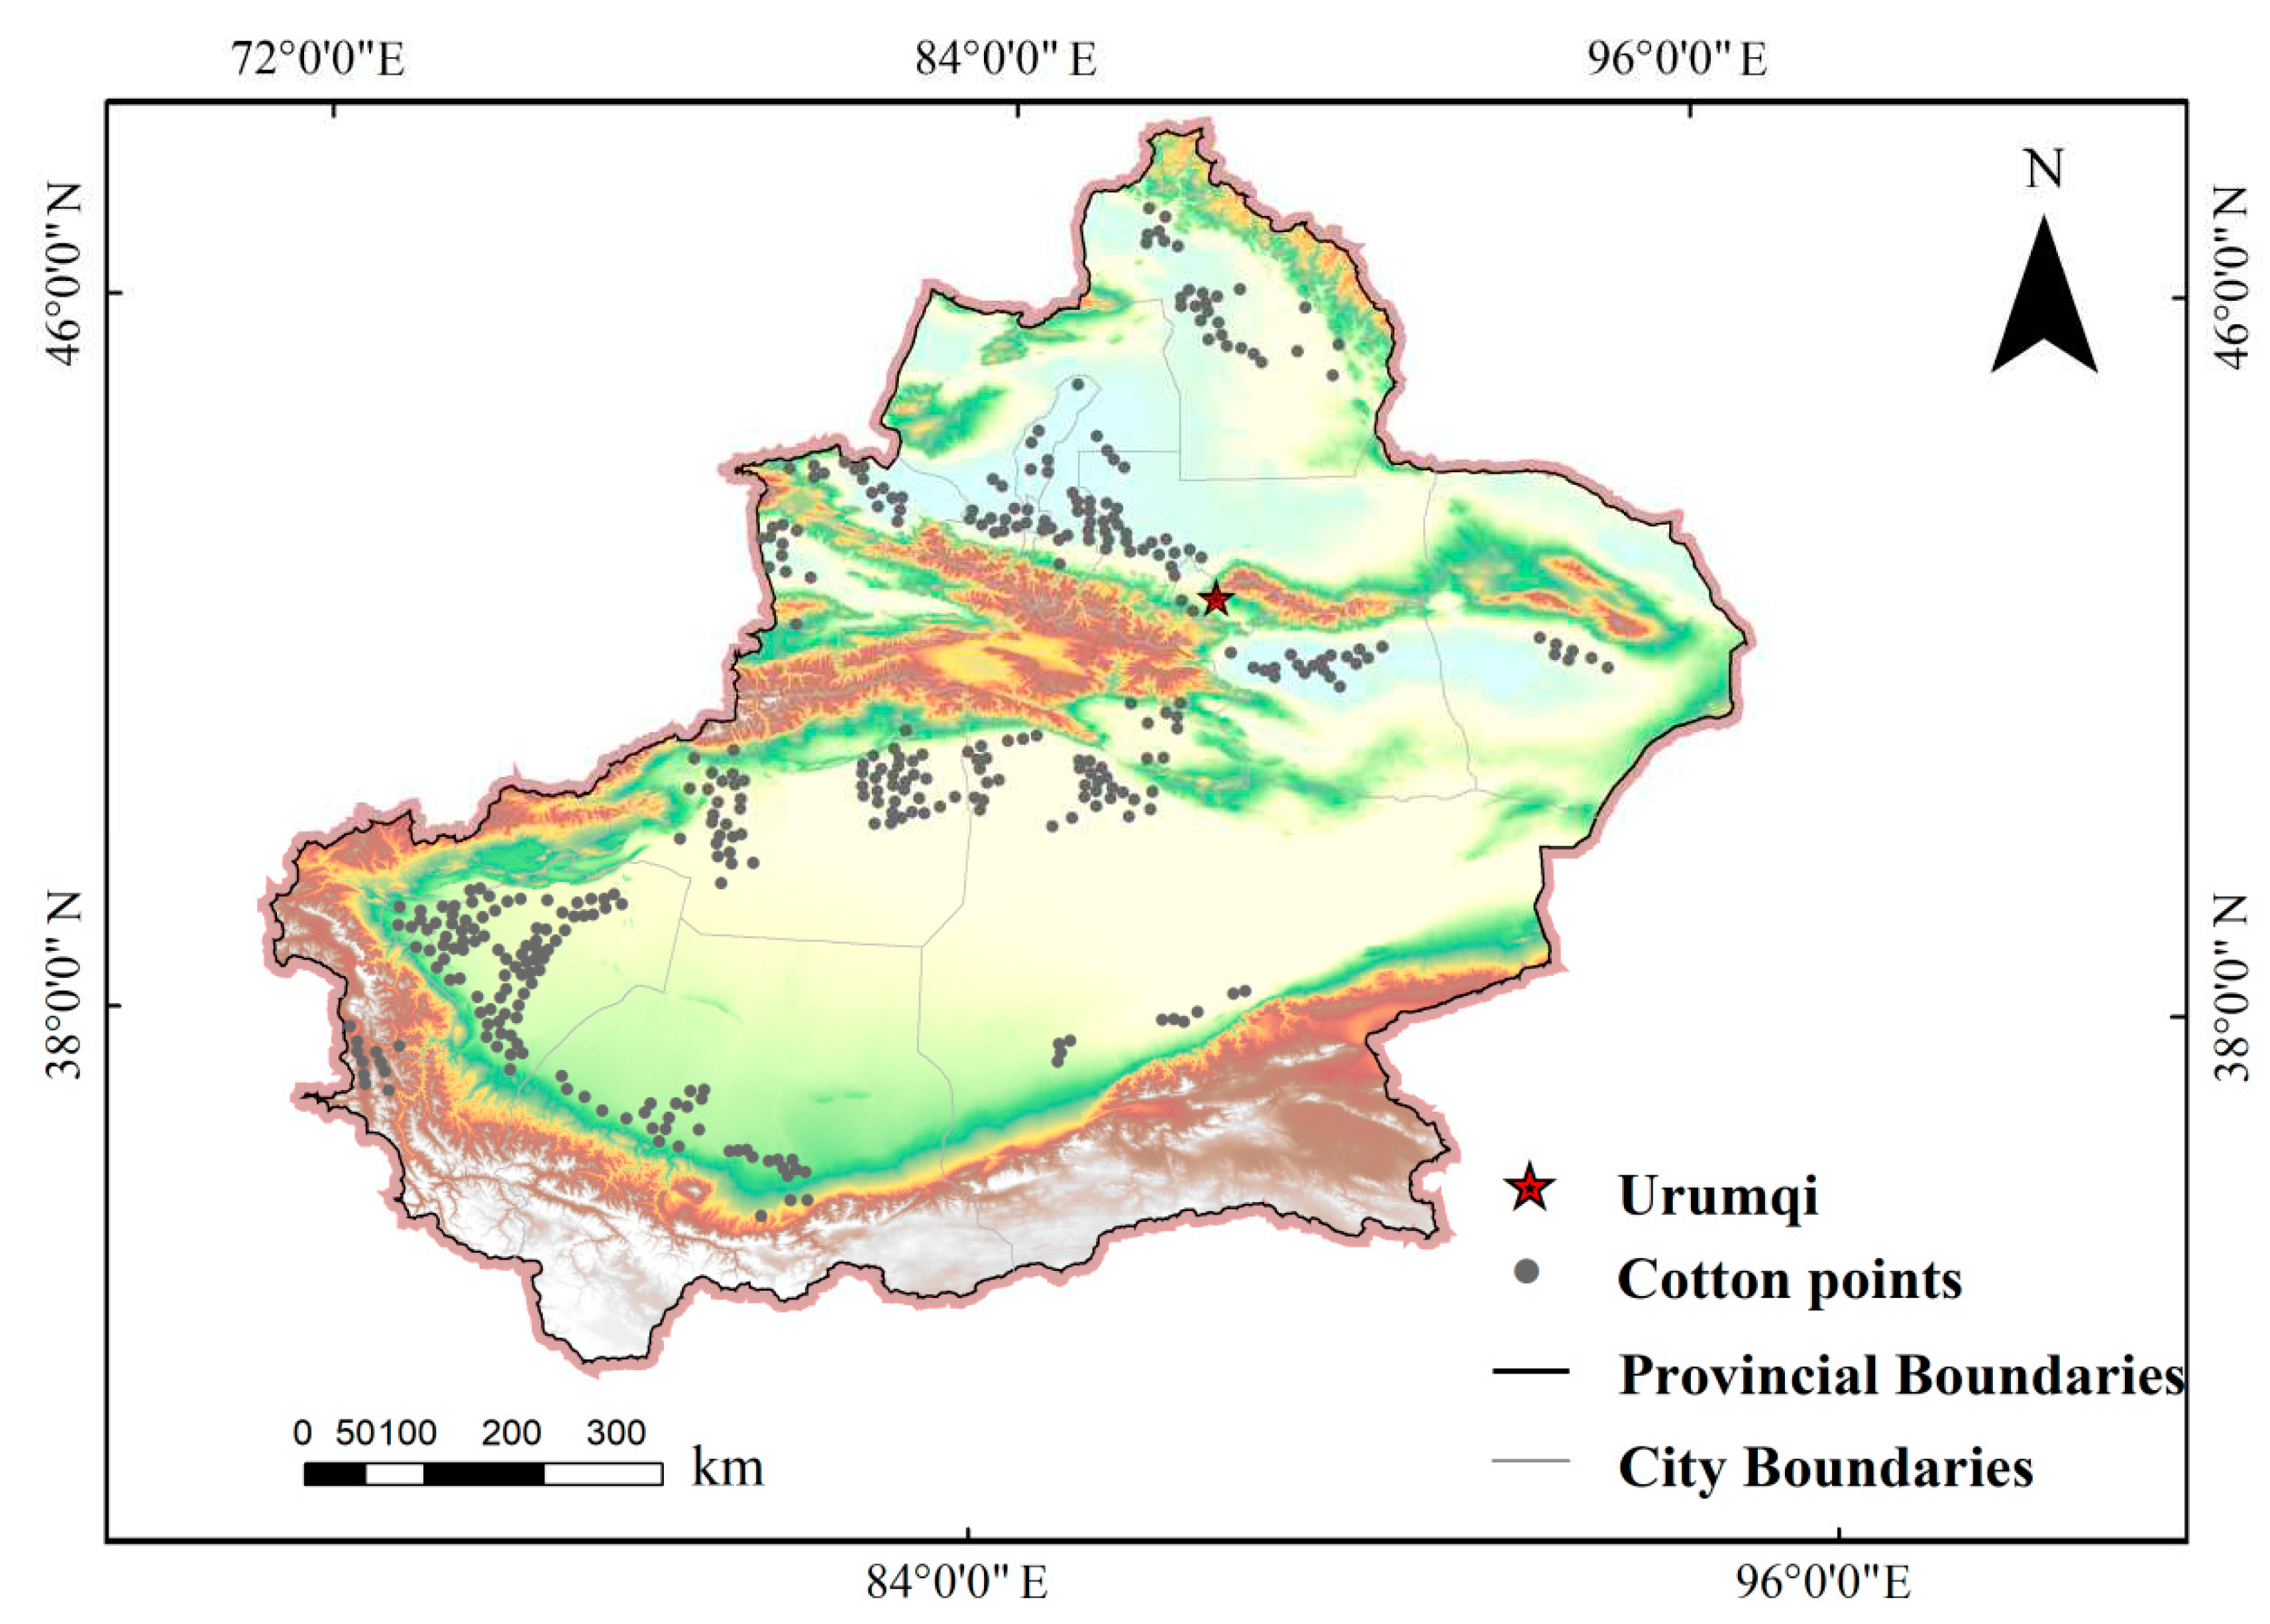
We searched Xinjiang long-staple cotton data through the Web of Science (WOS), China National Knowledge Infrastructure (CNKI), Google Academic, and databases such as the Global Biodiversity Information Facility (GBIF). Then we obtained 1026 accurate point data for cotton location and put them into ArcGIS software. To prevent model overfitting caused by sampling bias, which may even reduce predictive ability later on, we used the SDM toolbox 2.4 in ArcGIS[25 and the deviation correction method of system resampling based on the attributes of environmental variables. This method means only limited sites are kept within a certain distance. Buffer analysis was conducted for cotton samples with a radius of 20km, and only one distribution point within the overlapping buffer zone was kept in ArcGIS. Therefore, the model overfitting matter could be effectively reduced, and 375 distribution point data were obtained through screening (
Figure 1)
29,30.
2.2.2. Climatic & Environmental Variables Data
Planting patterns of long-staple cotton are low height, high dense, and early sowing are interdependent and, when worked together, yield high 31. Among them, low height refers to dwarfing cultivation; through dwarfing plants, the angle distribution of branches and leaves is reasonable, and photosynthesis is increased. While, High dense refers to rational close planting, which may fully utilize light and heat resources during the growth. Early sowing means that the sowing time for long-staple cotton in southern Xinjiang is in mid-April, while in northern Xinjiang, it is in late April. Before sowing, methods such as sun drying and seed soaking are used to promote the early germination of seeds. During field observations, it is likely that mulch film is used primarily to increase the soil temperature, promote the growth of long-staple cotton seedlings, and increase the soil moisture content. Therefore, this study simulates the multi-dimensional factors that affect the classification of cotton’s suitable zone through climate, terrain, and soil factors.
The Administrative division map of Xinjiang comes from the Resources and Environment Science and Data Center (
http://www.resdc.cn/), DEM data with 2.5min resolution comes from the geospatial data cloud(
http://www.gscloud.cn/search), Then data sets were merged, trimmed, processed (spatial analysis) in ArcGIS software to obtain the slope and aspect of this study area. This article's current and future climate data were downloaded from the WorldClim global climate database(
https://www.worldclim.org). 19 bioclimatic variables were included, with a selected spatial resolution of 1KM and a coordinate system of GCS_WGS_1984
32.
The data information about the "current" scenario mainly includes data from 1950 to 2000, while the climate data for the "future" scenario is selected from climate data from 2061 to 2080 (around 2070s), using the Shared Social-economic Pathways (SSPs) including SSP126 data, SSP245 data, and SSP585 data, provided by China's National Climate Center's BCC-CSM2-MR and CMIP6
32. Among these data, SSP126 data represents the comprehensive impact of low radiative forcing, low vulnerability, and low mitigation pressure, and sustainable development is relatively slow, lower than the current trend. SSP245 represents medium Radiative forcing and medium social vulnerability, and global economic development maintains the current trend. The SSP585 data represents the future rapid growth of the global economy to energy-intensive labor and life and large-scale extraction of fossil fuels, which is higher than the current trend
33. In addition, we also downloaded 11 soil factors data with a resolution of 2.5 min from the World Soil Database(
https://www.fao.org/) (
Table 1).
2.3. Application and Evaluation of Maxent Model
MaxEnt model is an Ecological niche model developed by Phillips, based on the maximum entropy principle and JAVA language, which is suitable for studying the known geographical distribution data and the potential distribution of species of environmental variables in the study area.
We loaded the processed species point, bioclimate, and terrain data into the Maxent model. Due to some correlation between environmental factors, we first imported all environmental factors into the Maxent model. Then during the calculation process, we set the training and testing dataset proportions to be 75% and 25% respectively, namely a 3:1 ratio34, with 10000 iterations and 10 repetitions to eliminate randomness35. Besides, Jackknife resampling was used to measure the contribution of each influential factor towards the model, and a response curve characterized the relationship between variable factors and species suitability. Finally, results were output in the logistic format, operation results were consecutive values between 0-1, and the format for species distribution was ASCII. After that, Pearson correlation analysis was performed on each environmental variable in order to effectively avoid factors with high correlation but low contribution36–38. Thus, the most relevant factors were chosen to compare factors with correlation and actual significance39.
Prediction and Classification for Suitability
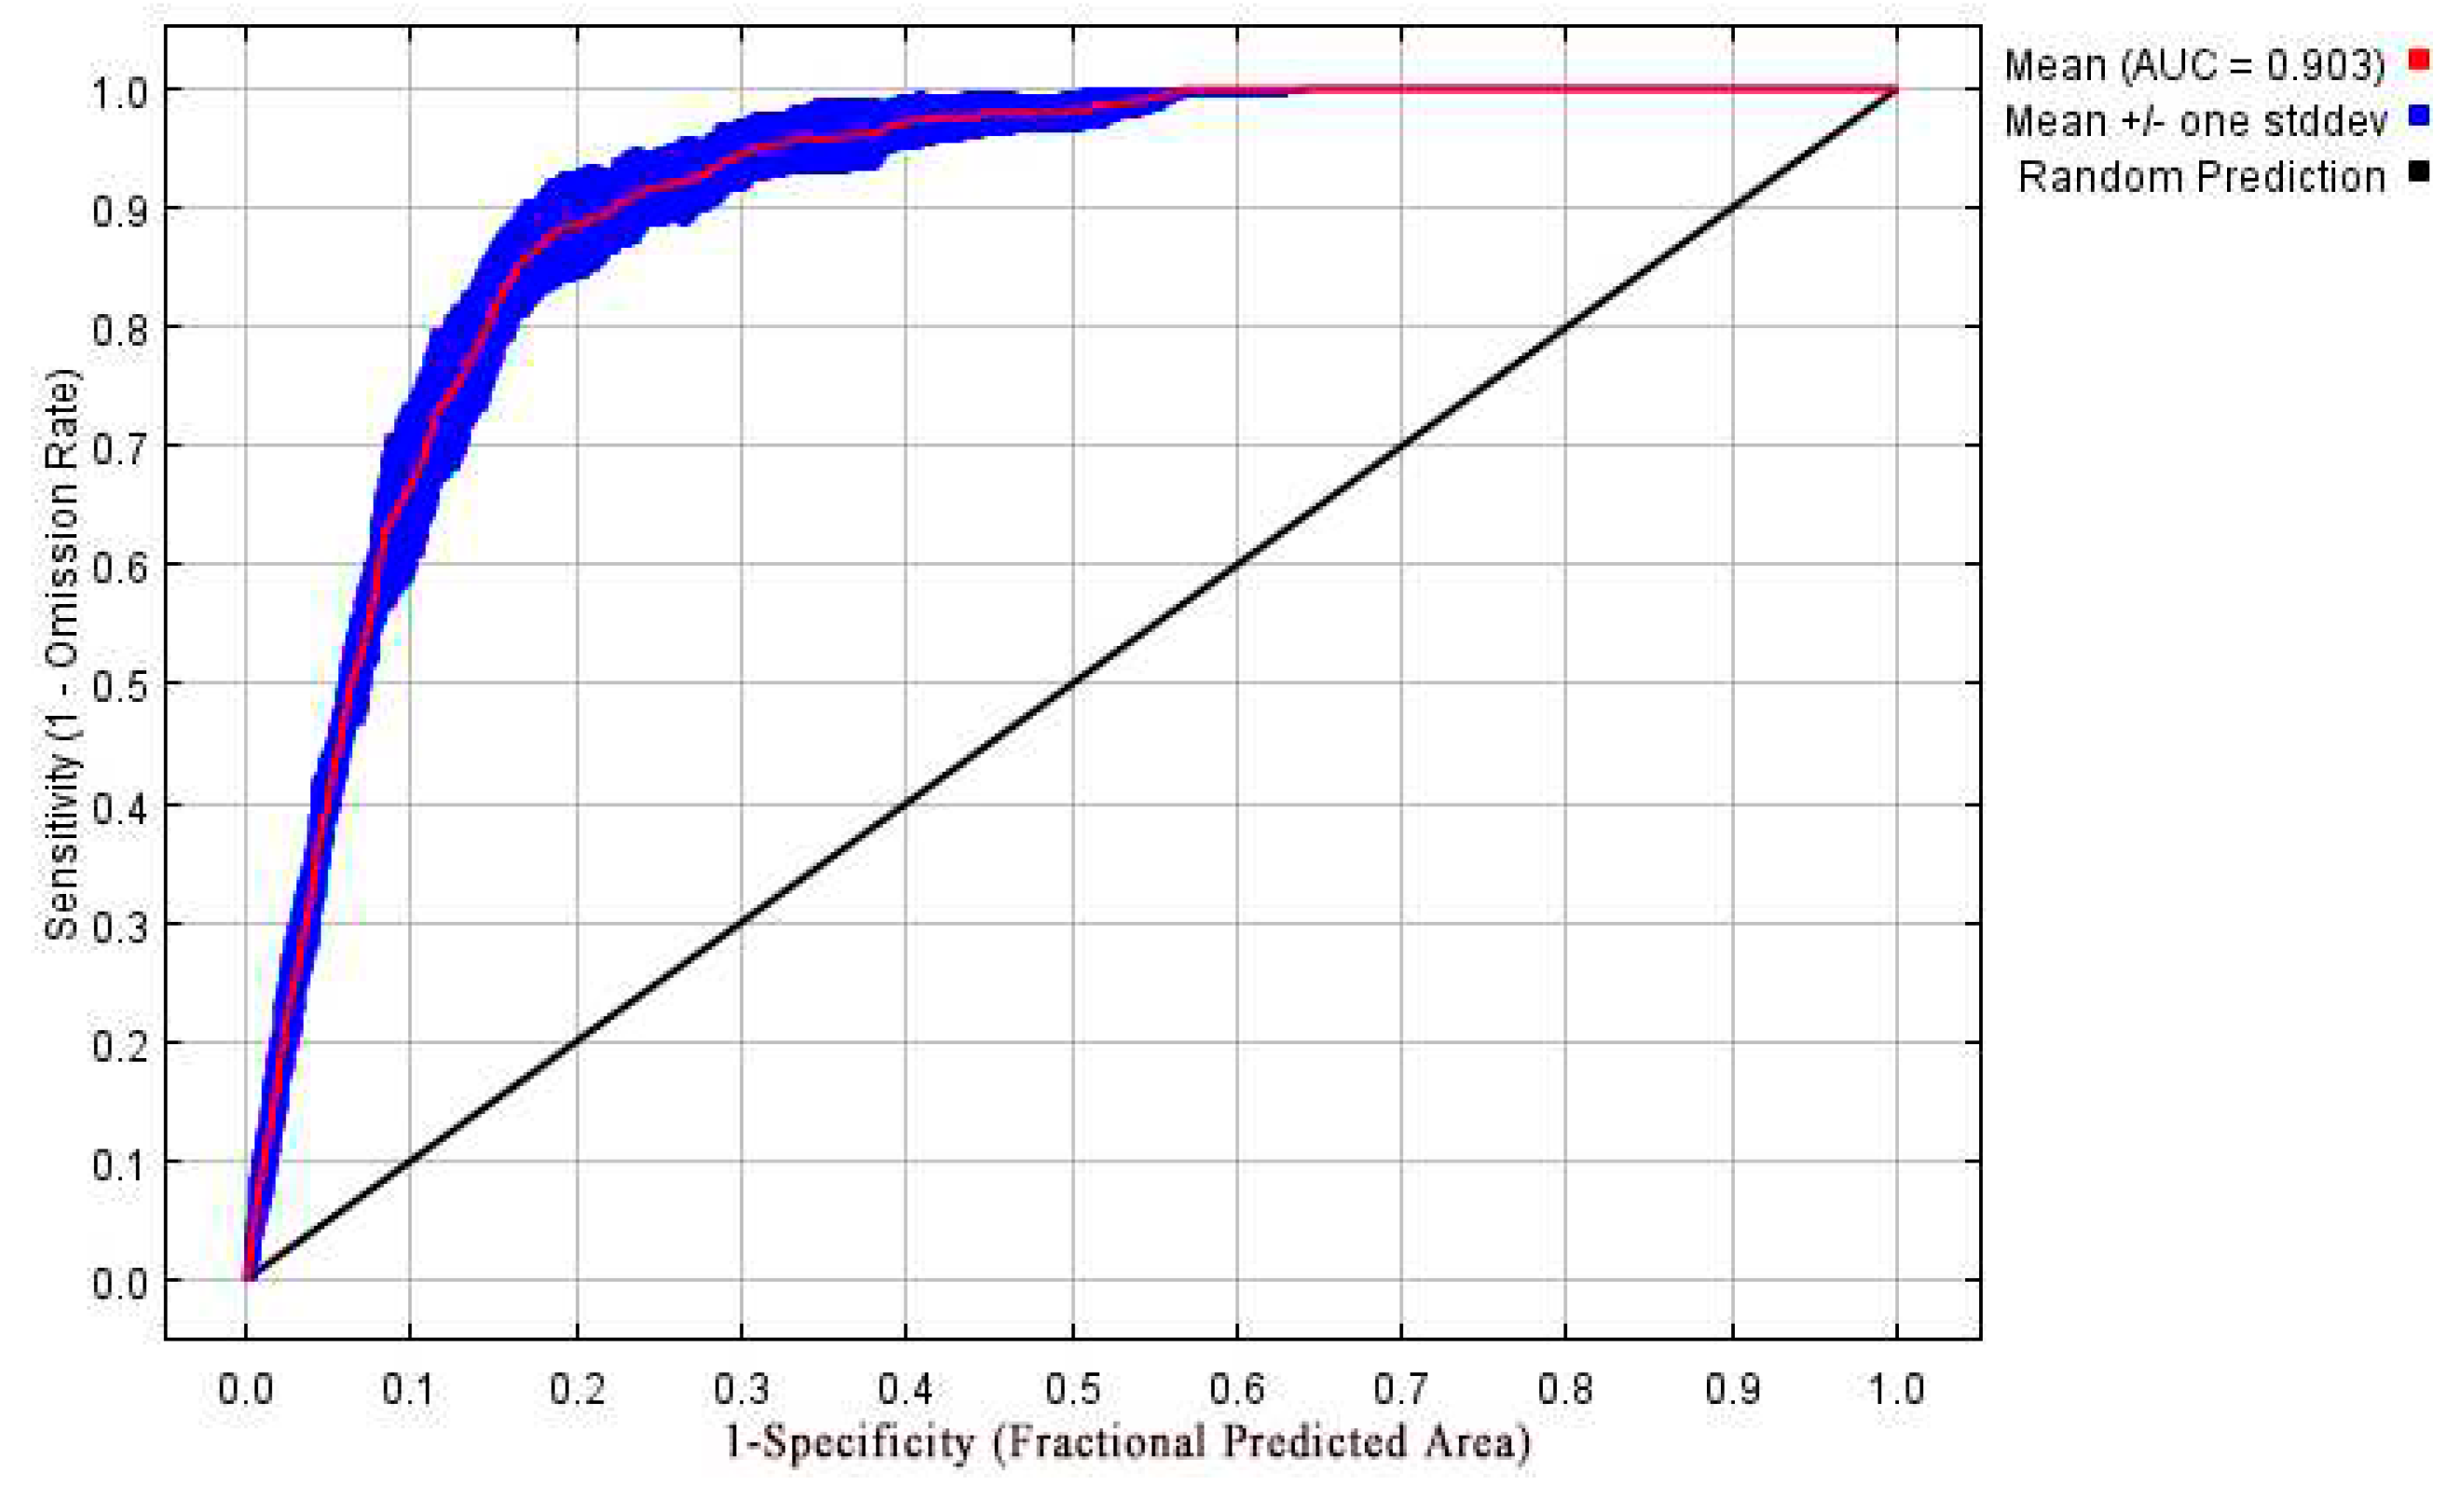
According to model prediction results, the average AUC (area under the curve) value for the training set is 0.912 ± 0.002, while the AUC value for the test set is 0.900 ± 0.023 (
Figure 2), which is significantly higher than the random prediction (0.5), indicating that the prediction accuracy excellently fit for the model
40.
Aiming at improving the differentiation and practicality of habitat-suitable areas, we imported the ASC file (output by Maxent) into ArcGIS software. We used "vector to raster" and "reclassification" tools to classify species' potentially suitable distribution areas. Utilizing the natural break method, the threshold standard for a suitable area is P ≥ 0.7, and an area that meets the standard means a highly suitable area, an area fitting 0.3 ≤ P < 0.7 conditions refers to a medium suitable area, and zone with 0.1 ≤ P < 0.3 settings can be viewed as a low suitable area, and the rest area(P < 0.1) is an unsuitable area39,41.
2.4. The Migration Trend of Suitable Region’s Centroids
If the current period was the base period, we could predict the planting range of long-staple cotton during the 2070s period (from 2061 to 2080). We used SSP126, SSP245, and SSP585 data from the Shared Socio-economic Paths (SSPs) provided by CMIP6, representing greenhouse gas emission scenarios: low, medium, and high, respectively42,43. Later, ArcGIS was used to project, resample, crop, and reclassify the spatial data, with ASCII output data for backup.
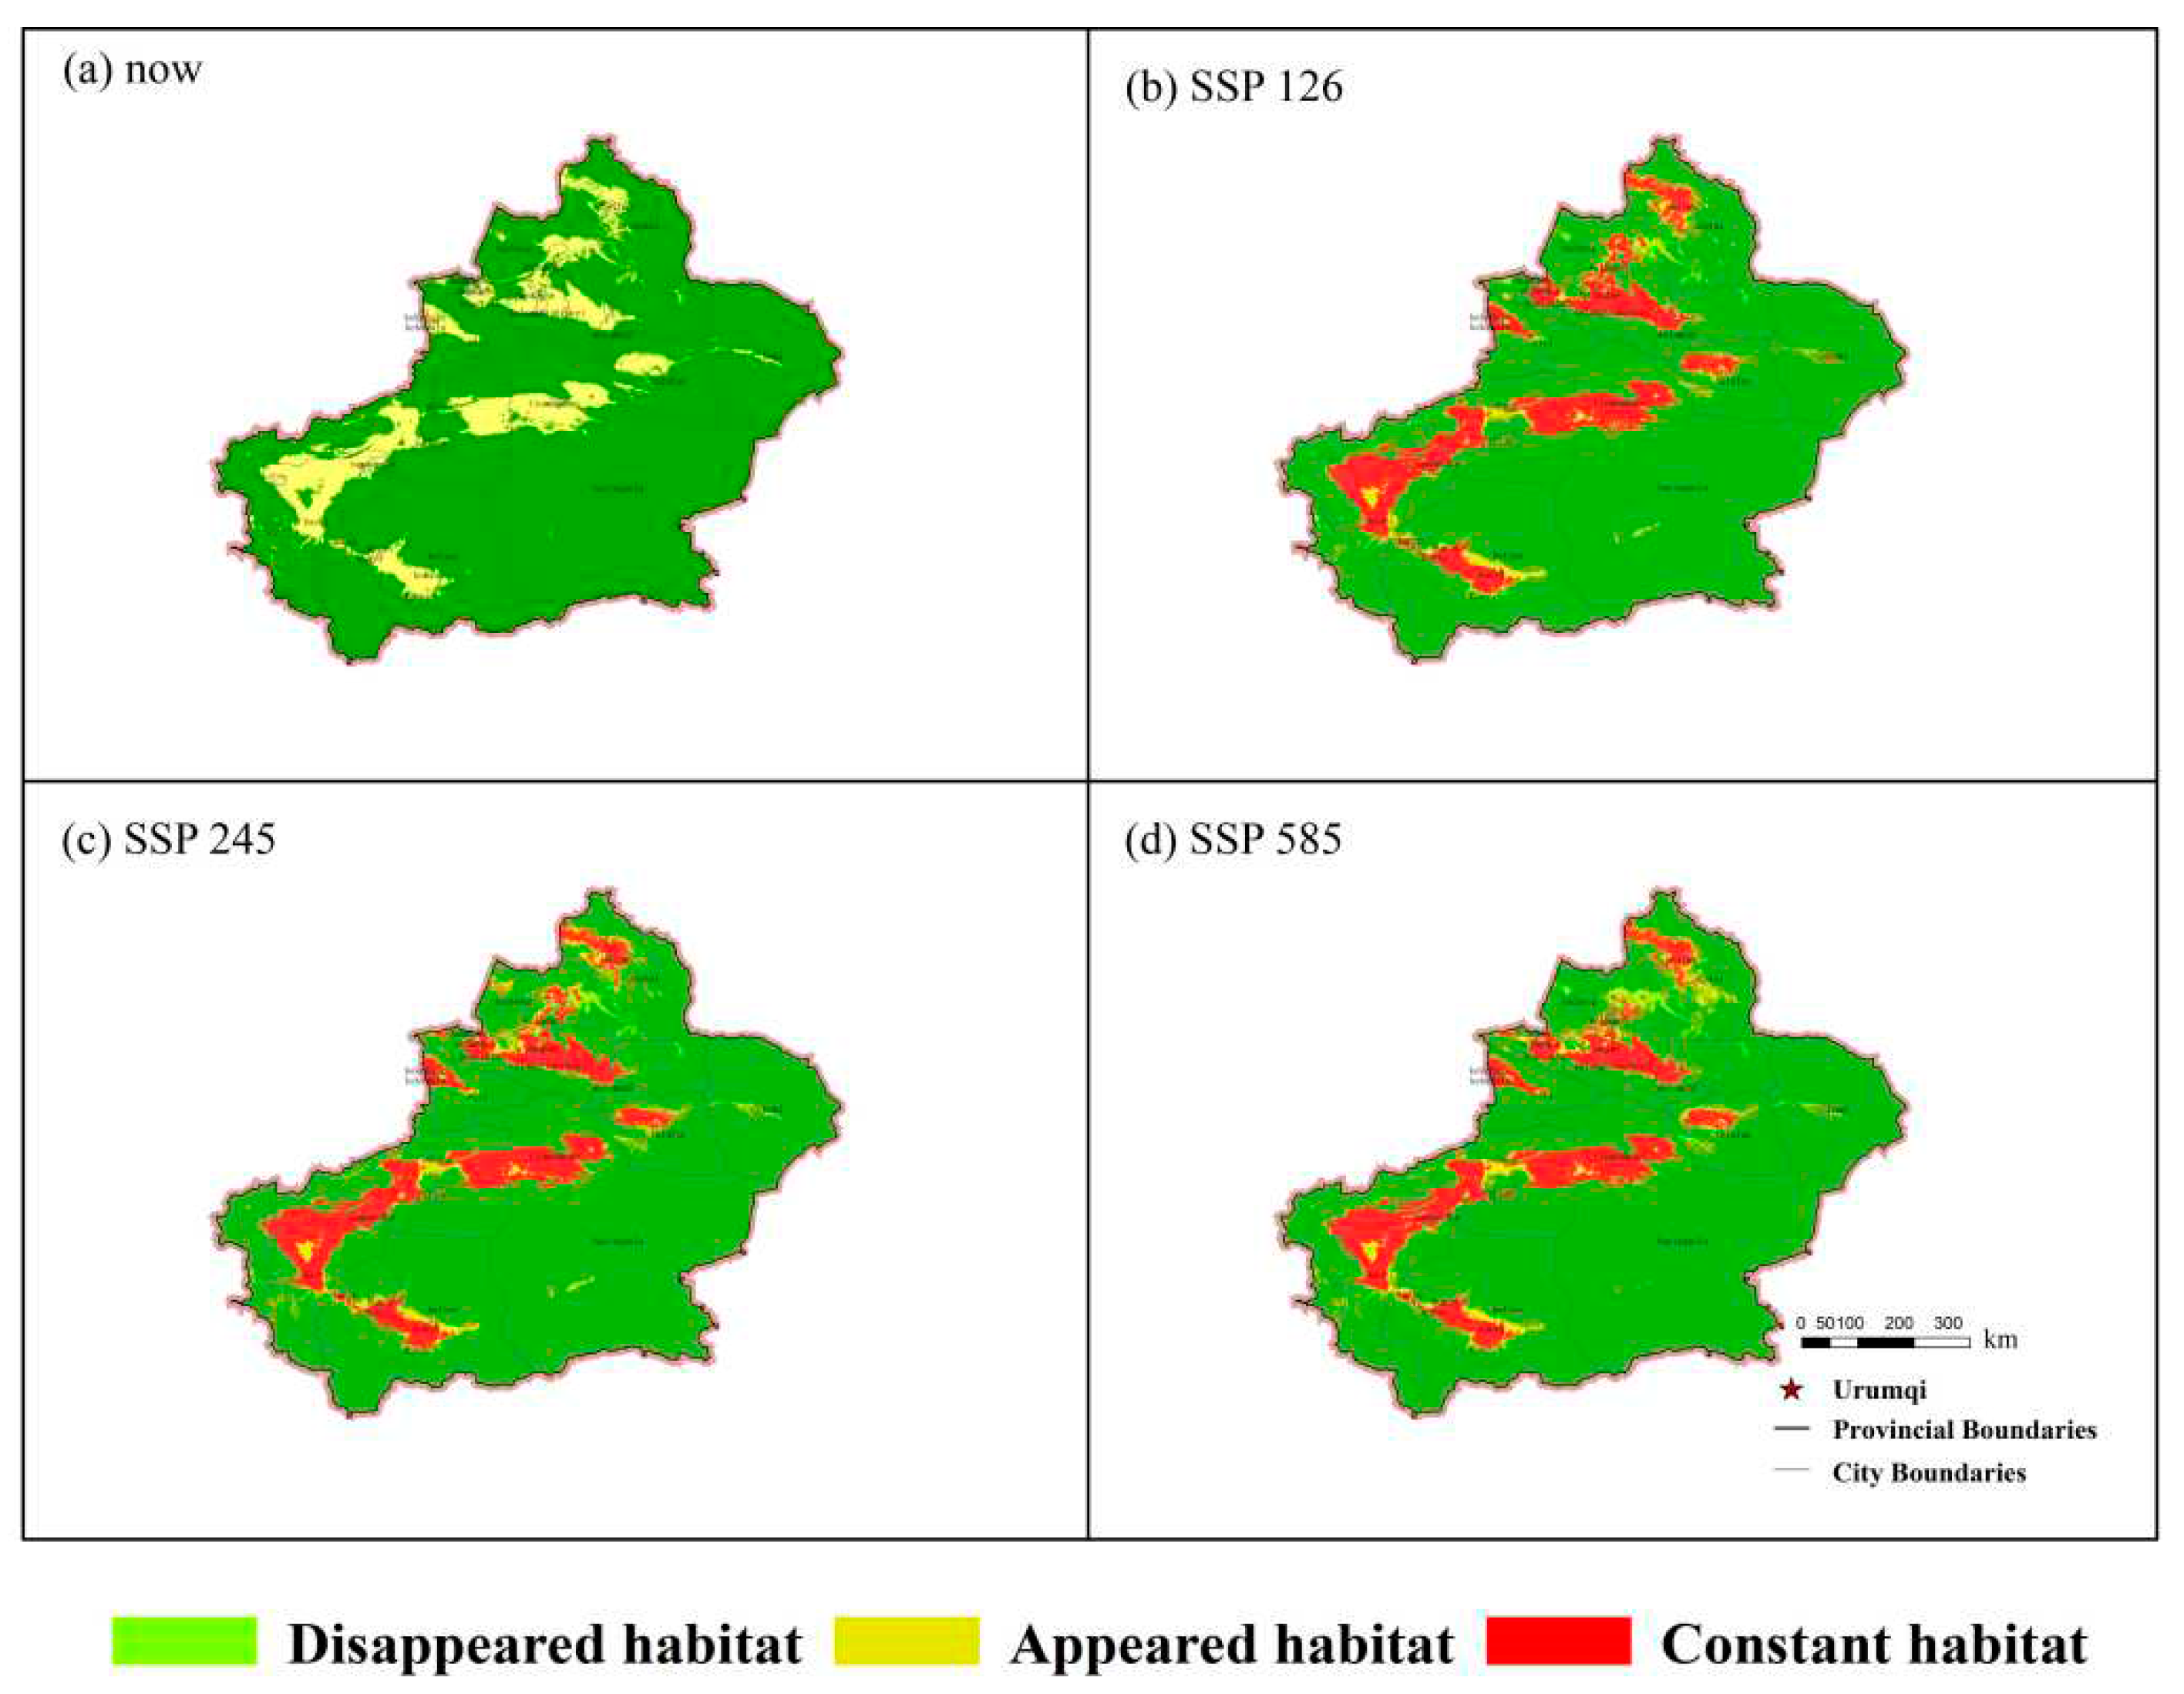
We only chose climate data for model running and projected the model into current and three different future climate conditions to obtain suitable distribution maps for cotton growth under current and future climate conditions (SSP126, SSP245, SSP585). This time, the sum of the maximum sensitivity and specificity was selected as the optimal threshold, and then the reclassification tool was used to convert the four newly generated probability distribution maps into binary maps for long-staple cotton, where "0" represents the unsuitable area, and "1" denotes the suitable area. After that, the con function in the raster calculator is used to calculate the suitable climate area in the future. If distribution maps with grid values of 0, 1, 2, and 3, that means: "0" represents no future nor present fitting this cotton planting, "1" represents that it is currently suitable and not suitable for planting in the future; namely the shrinking area disappears in the future, "2" shows that it is not suitable for planting in the future, that is, the expansion area, and "3" represents that it is both suitable for planting in the future and present, that is, the stable area.
Next, we used the ArcGIS zonal tool to process the raster data of each suitable area and obtained the centroids of each suitable distribution area under different climate change scenarios in the current period and 2070s. The spatial displacement of the centroids is used to represent the distribution changes of the entire range of suitable areas for long-staple cotton. And explore the migration and changes of centroids in suitable grades and suitable regions in long-staple cotton under three climate scenarios: RCP2.6, RCP4.5, and RCP8.5.
3. Results and Analysis
3.1. Assessment for Importance of Environmental Variables
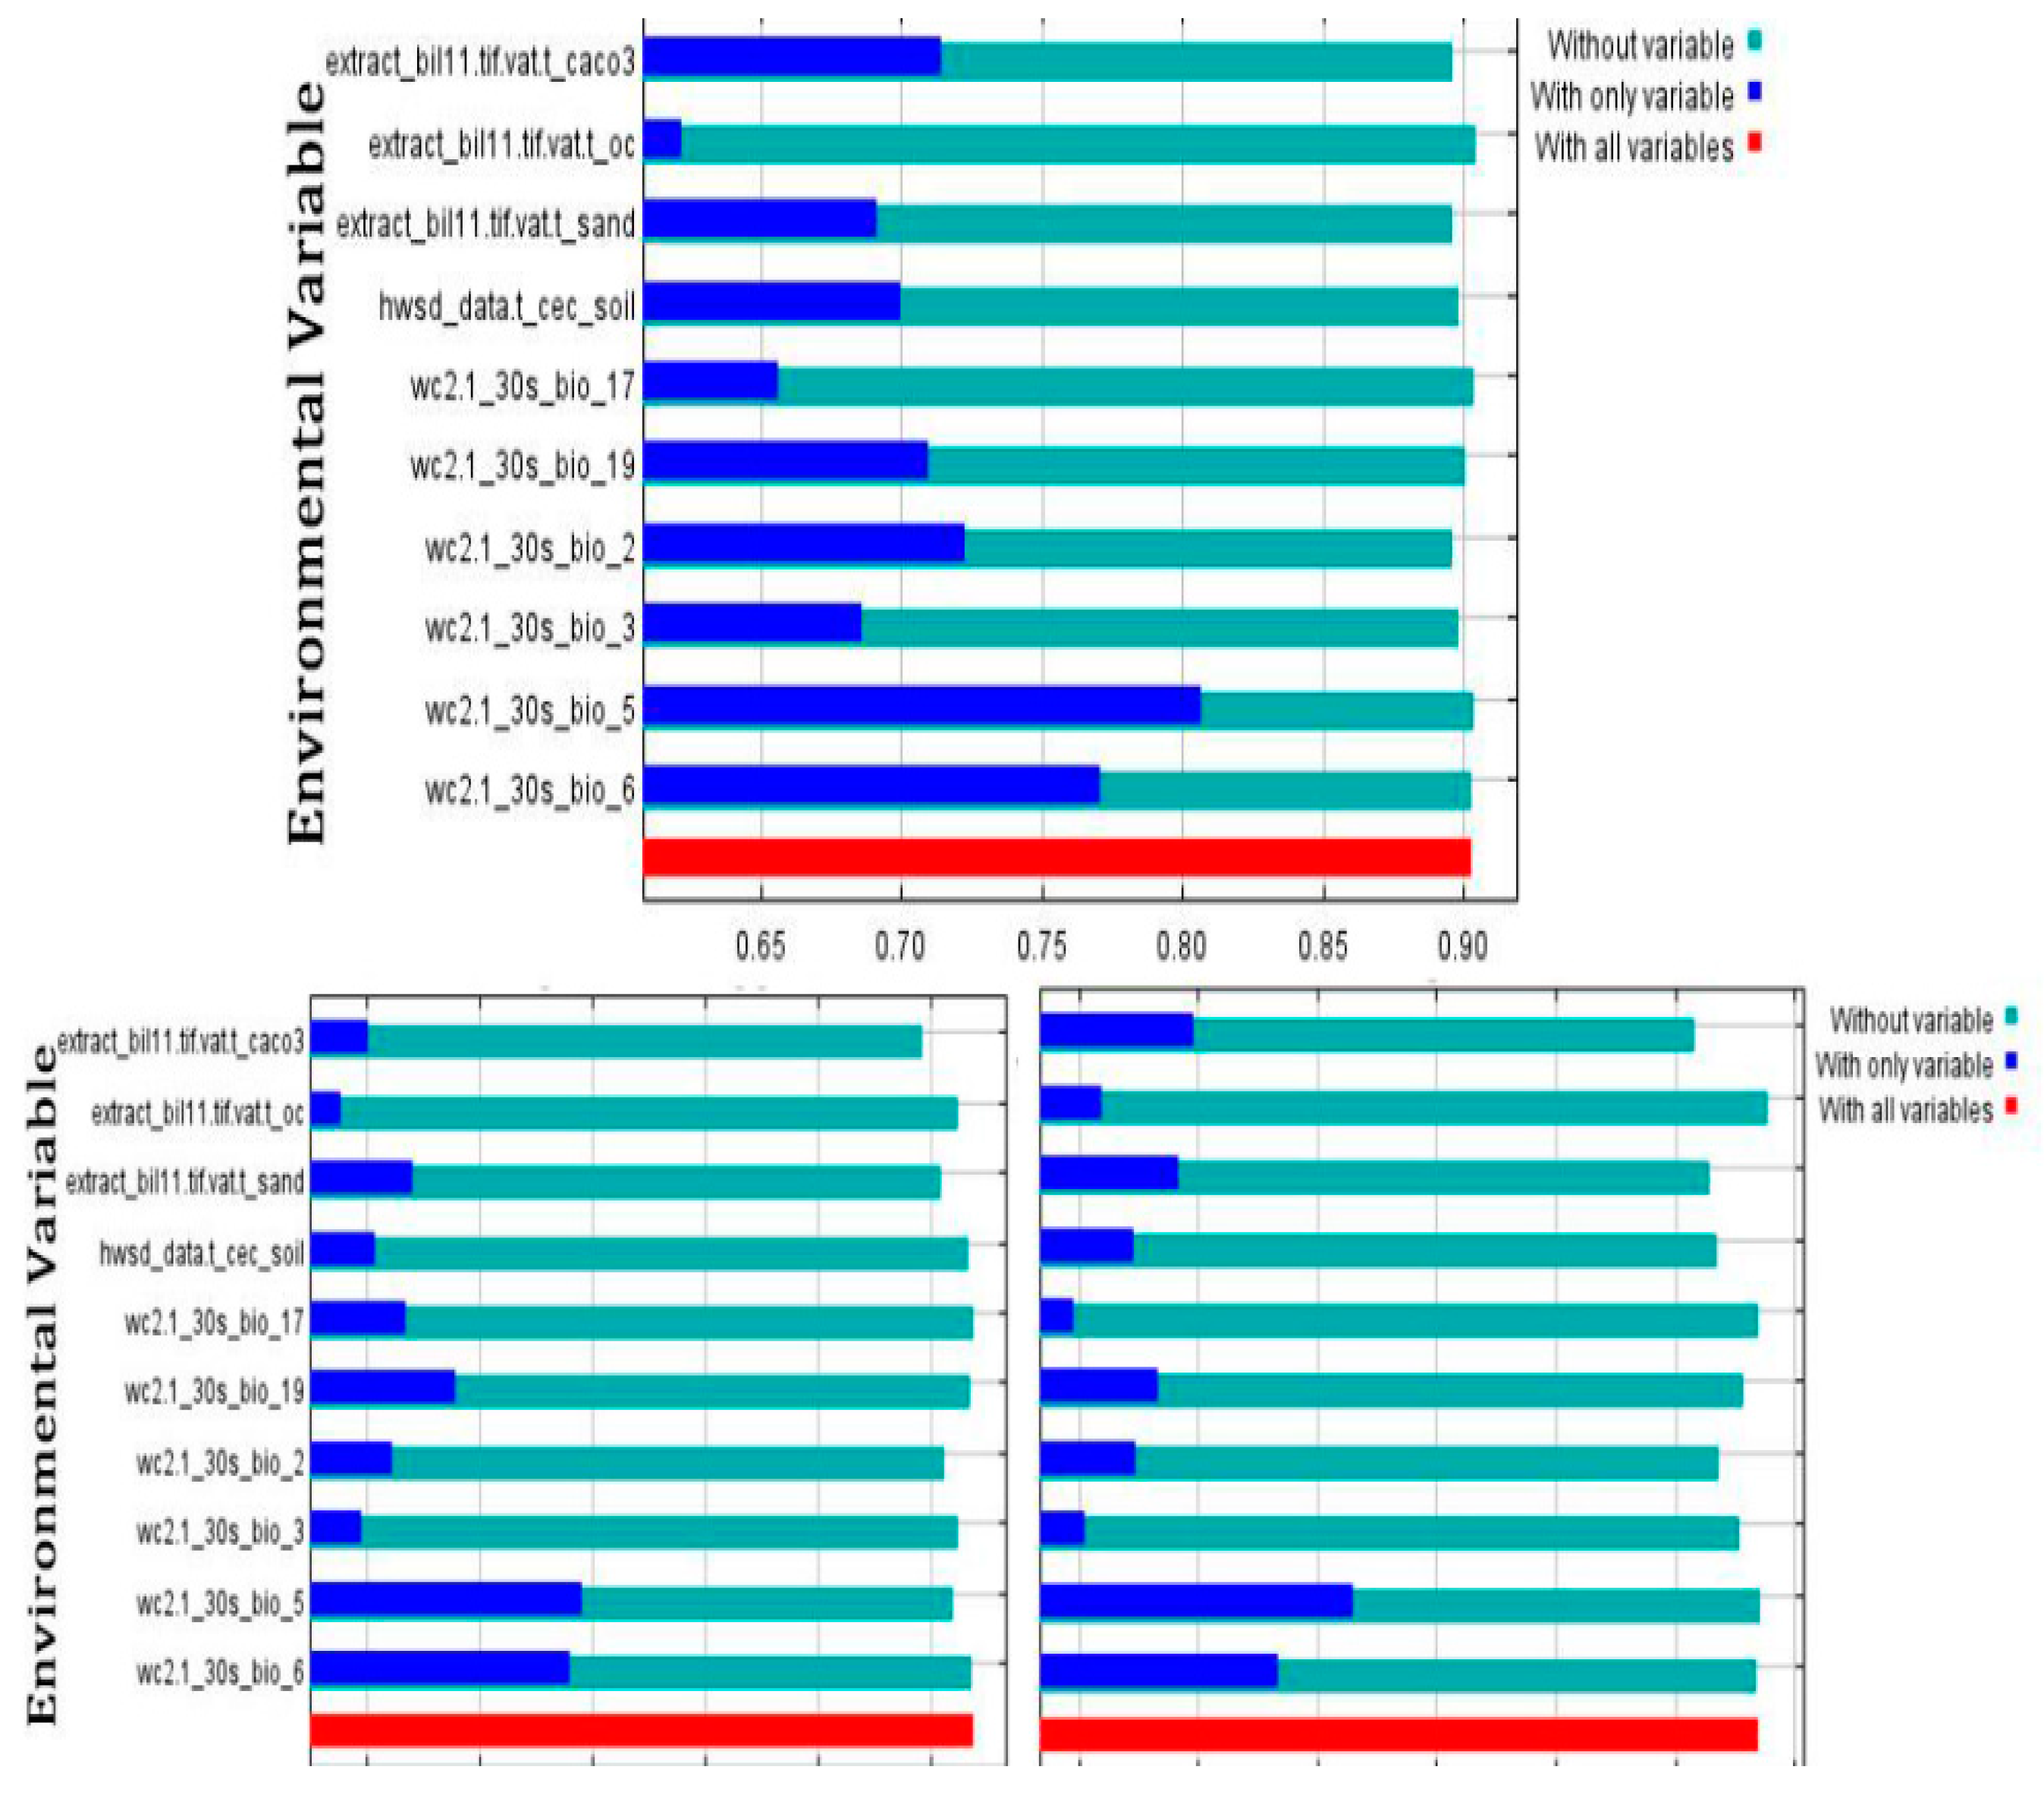
The importance of environmental factors on species’ potentially suitable distribution can be evaluated from the contribution rate, 10-fold cross-validation, and replacement rate in the output results by MaxEnt software. While in the establishment of the model, the variables that have significant impacts on the simulation prediction results are the lowest temperature in the coldest month (Bio6), the highest temperature in the hottest month (Bio5), the average monthly temperature difference (Bio2), the driest season precipitation (Bio17), sand content (T_sand), the coldest season precipitation (Bio19), organic carbon content (T0c), carbonate content (Tcaco3), isotherm (Bio3), and soil cation exchange capacity (T_cec_soil), contributing 19.9%, 13.8%, 8.5%, 8.4%, 7.2%, 6.4%, 4.6%, 4.1%, 3.6%, and 3.4%, respectively, with a cumulative contribution rate of 78.9% (
Table 2).
When environmental factors were used separately, the sequence (according to the AUC values in descending order,
Figure 3a) was the hottest month's highest temperature (Bio5), coldest month's lowest temperature (Bio6), warmest season's average temperature (Bio10), monthly temperature difference (Bio2), carbonate content (T_CaCO
3), coldest season precipitation (Bio19), soil cation exchange capacity (T_cec_soil), sand content (T_sand), isotherm (Bio3), driest season precipitation (Bio17), and organic carbon content (T_OC). The AUC plot showed Bio5 and Bio6 (about temperature) were the most influential single variable while predicting almost over 0.75 in AUC. Similarly, these two factors prominent among the variables in regularized training gain (
Figure 3b) and test gain (
Figure 3c). However, in
Figure 3b, Bio19 (Precipitation of Coldest Quarter) is in the third position. At the same time, T_CaCO
3 (Carbonate content) also ranked third. Based on these factors, the soil might be neglected according to the training results (
Figure 3b); actually, they were competitive over variables of precipitation based on the test results (
Figure 3c).
T, we found that climate factors prominent among these variables after comprehensive analysis; for instance, the most significant ones were the highest temperature in the hottest month (Bio5), the lowest temperature in the coldest month (Bio6), the coldest season precipitation (Bio19), and the average monthly temperature difference (Bio2). As can be easily seen, the growth of long-staple cotton is mainly related to temperature and precipitation. Thus, the cotton distribution in Xinjiang is consistent with the spatial distribution pattern of these two-factor conditions, namely on the north and south sides of the Tianshan Mountains, the northern foot of the Kunlun Mountains west part, and the southern foot of Altai Mountains. In southern Xinjiang, it is mainly distributed around the marginal of the Taklamakan Desert, extending from the foot of the mountain to the desert along the river.
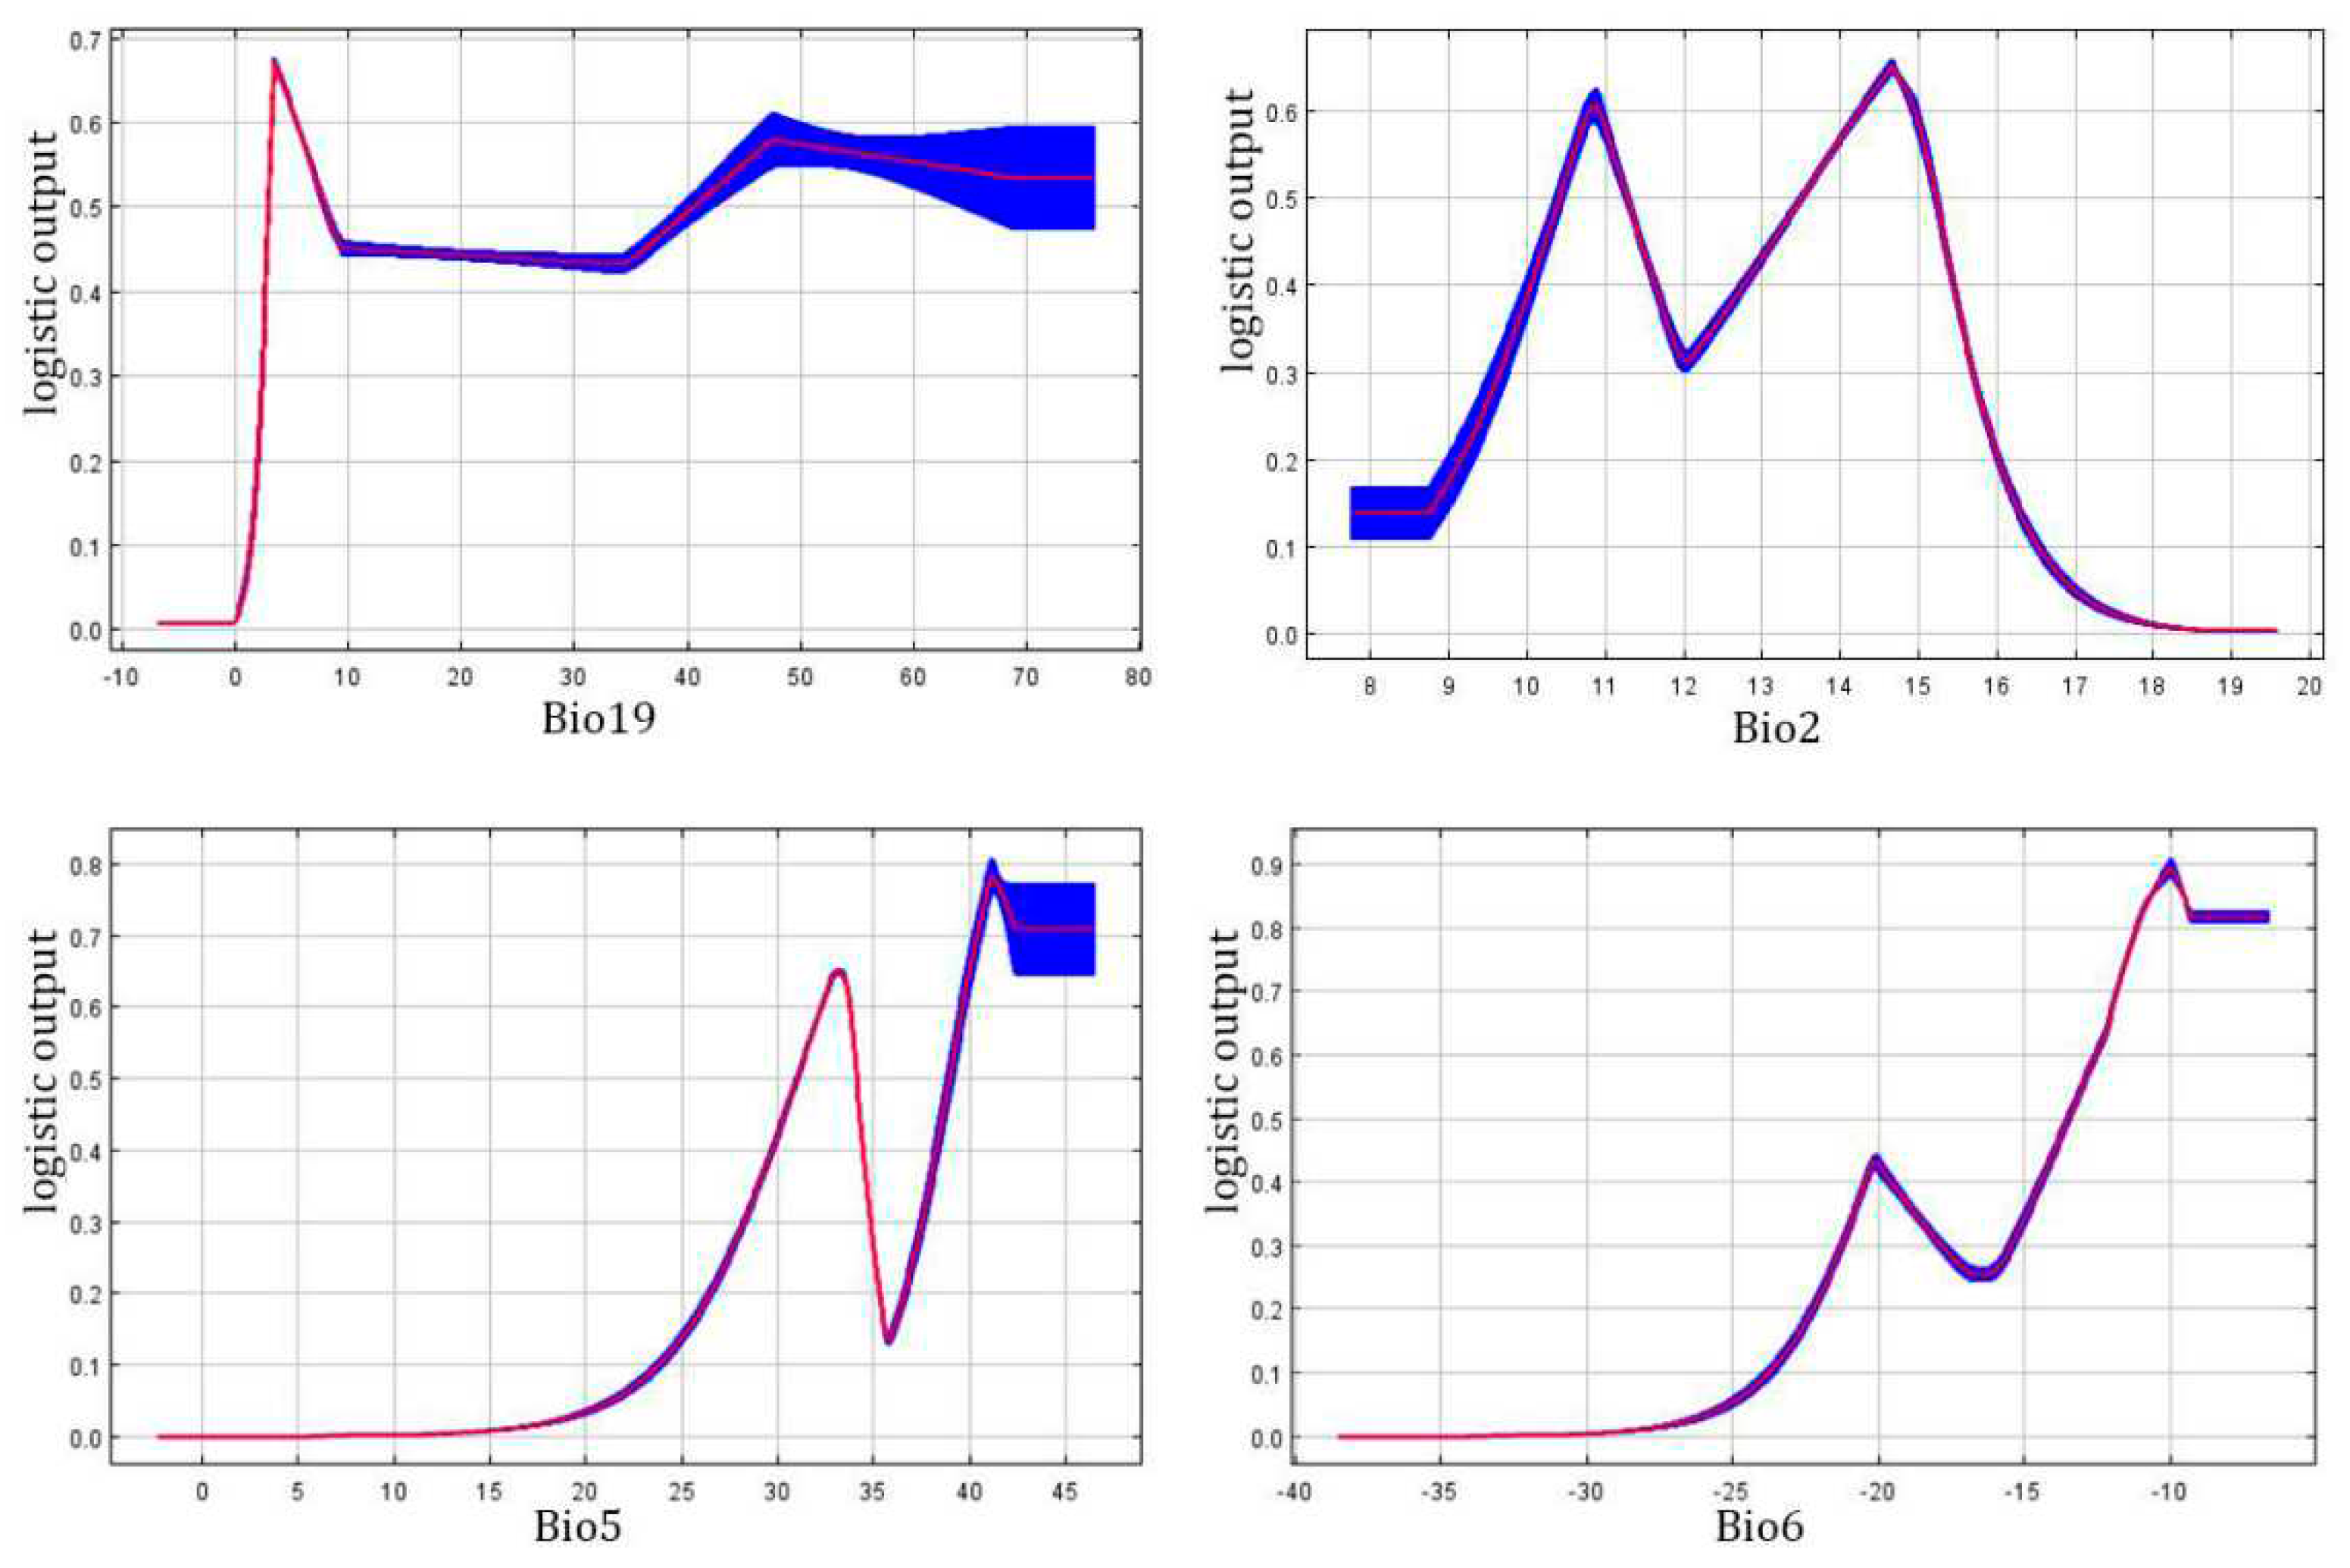
Four environmental factors that played a dominant role in potentially suitable distribution were selected in the study, and they have joint effects on cotton’s each growth stage, ultimately reflecting the suitable growth of long-staple cotton in the study area (
Figure 4).
When the monthly temperature difference (Bio 2) is lower than 9℃, the probability of long-staple cotton is around 0.13; when the monthly temperature difference is greater than 9.6℃ and less than 15.7℃, the probability is above 0.3 with a bimodal curve, firstly arises till 0.6 at 11℃ then decreases till 0.3 at 12℃, next ascend again with a peak at 0.66, after that the curve goes downwards as the monthly temperature difference is greater than 15℃.
When the lowest temperature in the coldest month (Bio 6) is less than -25℃, the probability of existence is almost 0 and unsuitable for growth. When it is greater than -25℃ and less than -15℃, the possibility of existence is slightly higher, under 0.5. The probability increases from 0.3 to 0.9 as the temperature rises from -15℃ to -10℃; then, the probability of existence remains stable at 0.8 with a temperature higher than -10℃. The same tendency also occurs for Bio5 (highest temperature in the hottest month); within a specific range, the probability arises as the variable value upwards. Then the probability drops after a small peak but strongly reaches another higher peak and keeps still later.
If we emphasise the biological characteristics of long-staple cotton, we may find that it requires high temperatures during its growth. Moreover, long-staple cotton is a light-loving crop, and more than twelve hours of daily sunlight in specific periods is more conducive to its growth44. Luckily, the experimental results are in line with its physiological characteristics.
3.2. Potentially Suitable Distribution Areas Under Current Climate Conditions
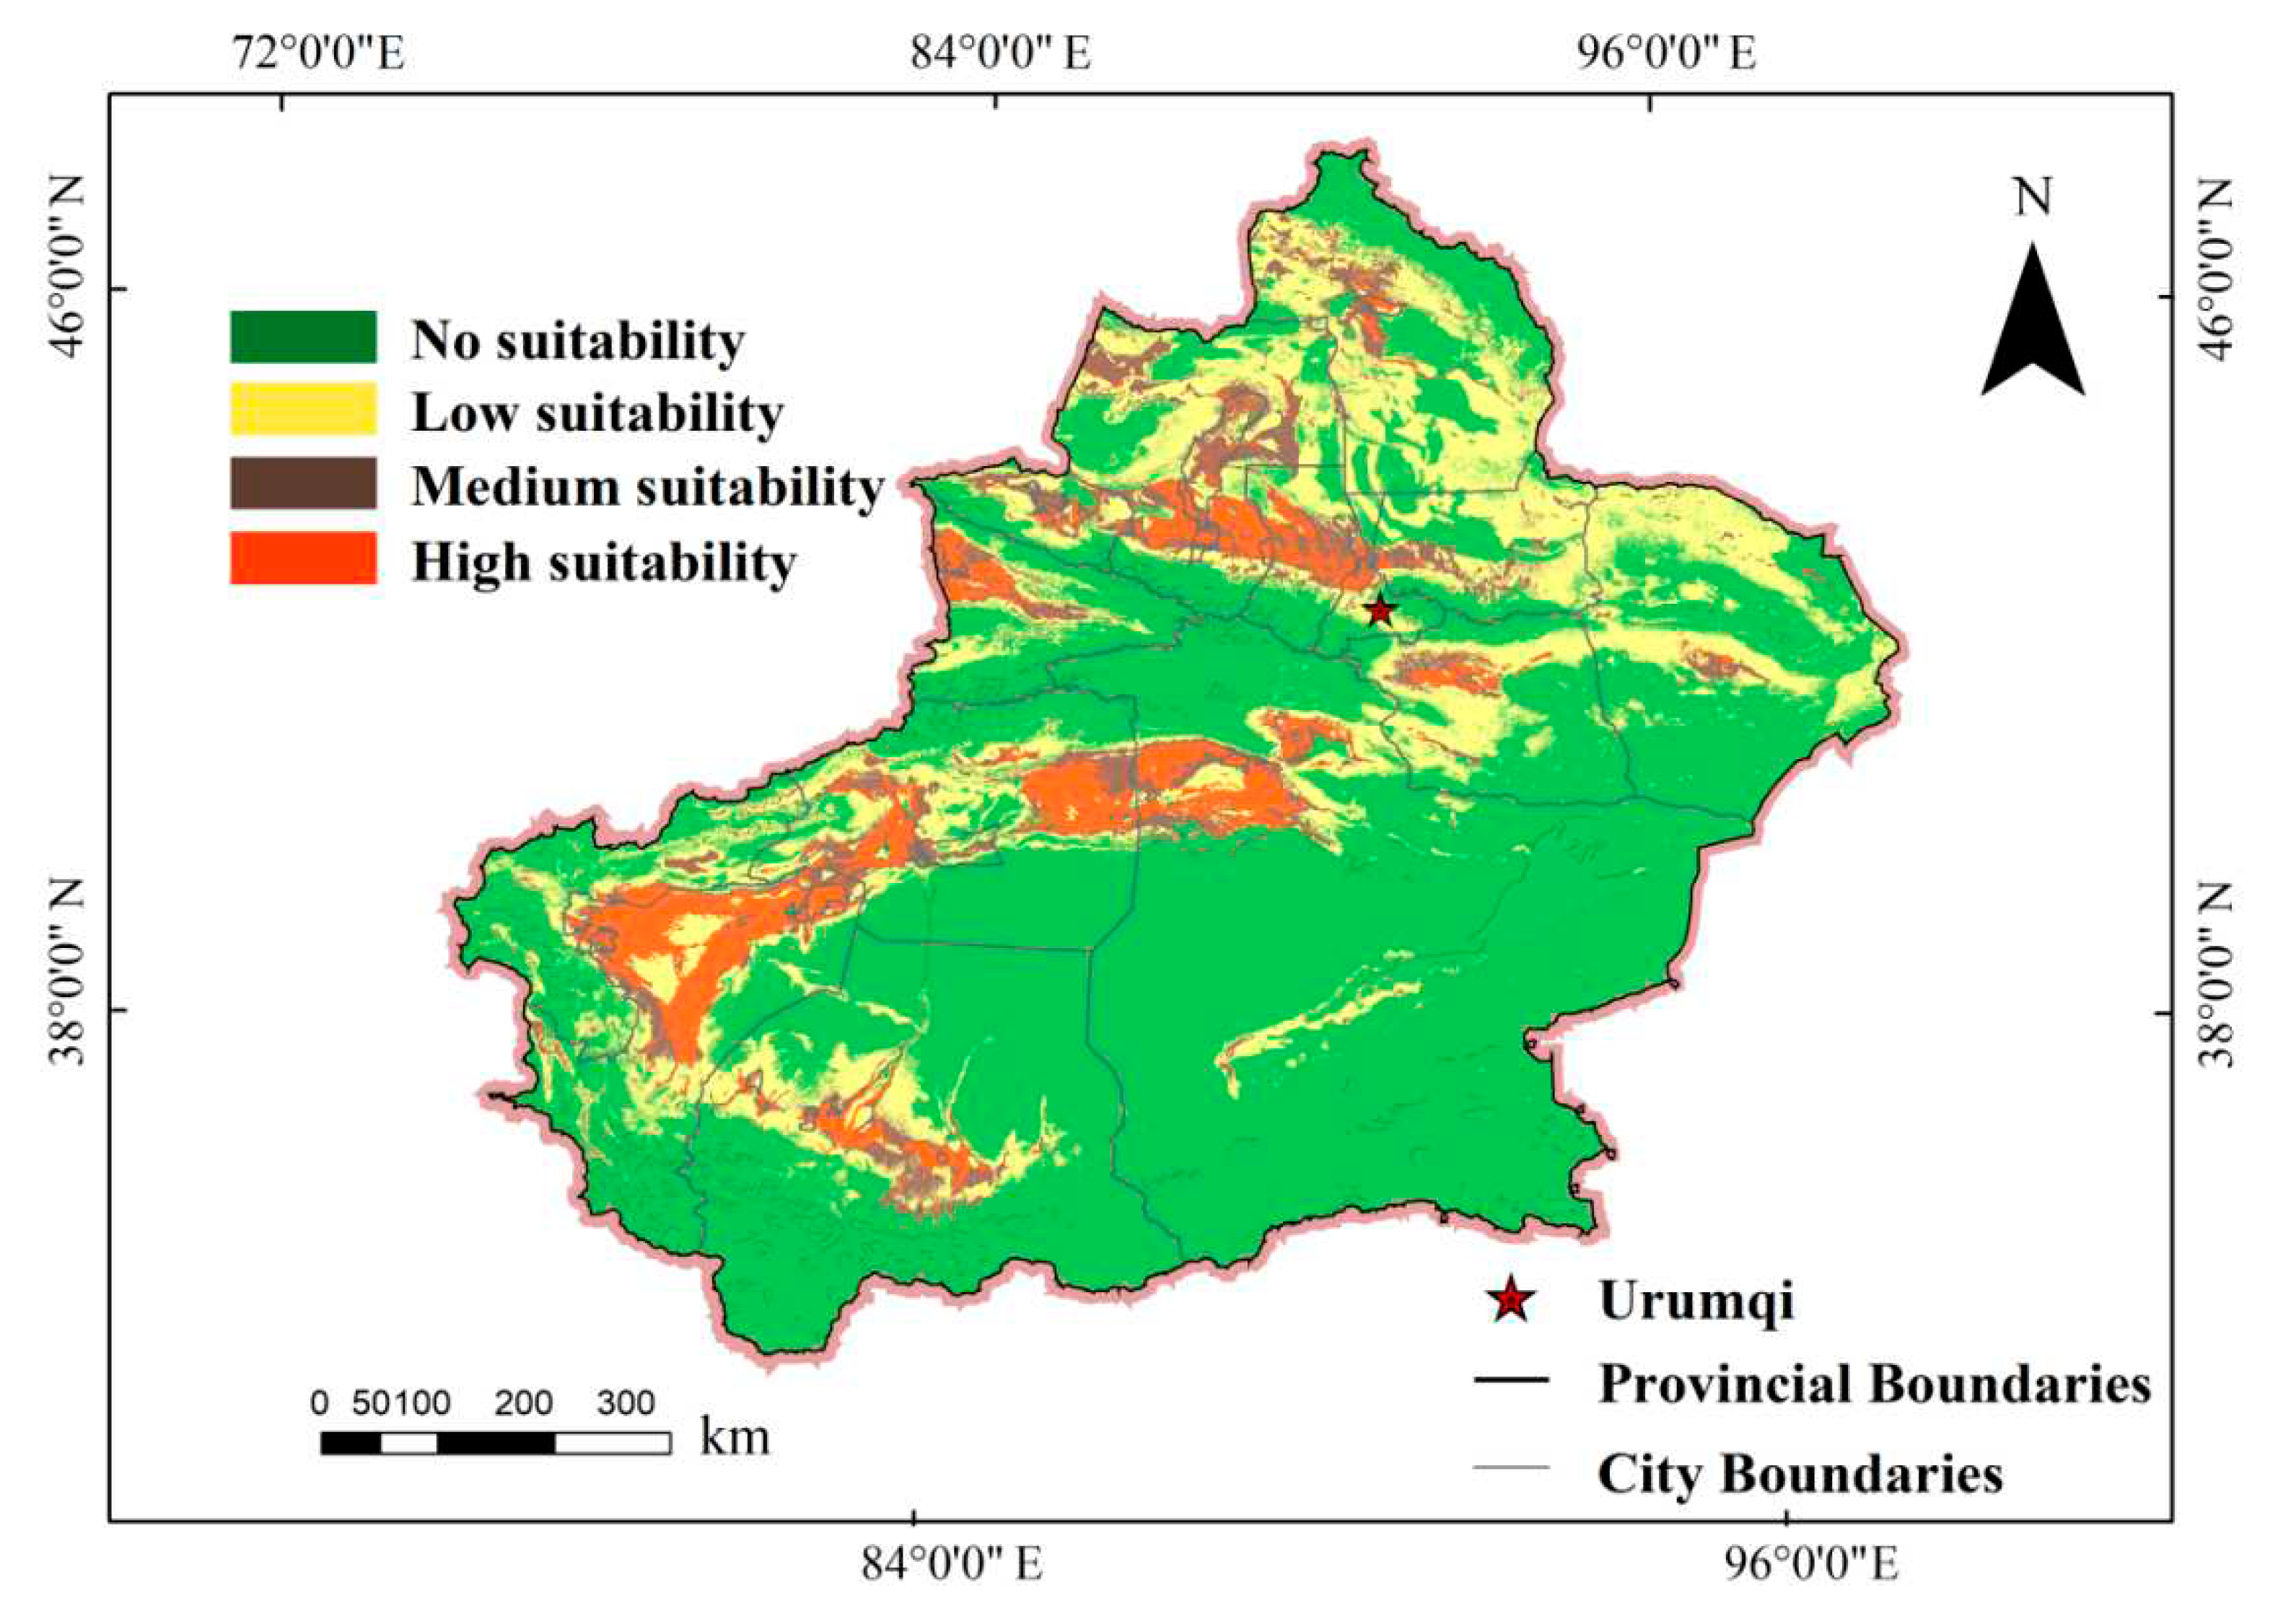
The prediction results of the MaxEnt model are shown in
Figure 5, with a high suitability area of approximately 1.3 × 10
5 Km
2. In terms of southern Xinjiang, a highly suitable distribution area is mainly on the edge of the Taklamakan Desert, and the northern part is larger than the southern edge, corresponding to the administrative division, that is, north Kashgar, central and western Aksu Prefecture and central and eastern regions, northern Bayingol Mongolian Autonomous Prefecture, central and western Hotan Prefecture. In addition, there are dotted distributions in Turpan and other places. As Xinjiang north, it is concentrated at the northern foot of Tianshan Mountain, corresponding to the south of Tacheng Prefecture (part of Ili Kazakh Autonomous Prefecture), Yining City region, and the west of Changji Hui Autonomous Prefecture. While the moderate suitable area is approximately 1.9 ×10
5 Km
2, and the area of low-potential suitability area is about 0.4 × 10
5 Km
2, which is widely distributed in the Junggar Basin in the northern Xinjiang region. The southern Xinjiang region is still around the edge of the Tarim Basin, located at the periphery of the high and moderate suitable areas.
3.3. Suitable distribution areas and changes of future climate scenarios
According to the results in
Figure 6, under the climate scenario of SSP126, the average temperature increased by about 1.8℃ during the 2070s period, and the stable area of long-staple cotton was 2.51×10
5 Km
2, this area is and will be suitable for growing region, and the area of the vanishing area is about 0.38×10
5 Km
2, while the expansion area is up to 0.53×10
5 Km
2, in general, the suitable planting area of cotton is expanding, with the total area increasing by 5.8%.
Under the climate scenario of SSP245, during the 2070s period, the average temperature increased by about 2.7 ℃, and the stable area was 2.51×10⁵ Km2, with an area of about 0.38×10⁵ Km2, while the expansion area reached 0.62×10⁵Km2, the suitable planting area is expanding, with the total area increasing by 9.4%.
Under the climate scenario of SSP585, the average temperature increased by about 4.4℃ in the 2070s, and the stable area was 2.45×10⁵ Km2, with an area of about 0.45×10⁵ Km2. In contrast, the expansion area reached 0.63×10⁵ Km2, and the planting area of the suitable area is expanding, with the total area increasing by 7.3%.
The trend of suitable areas under the three climate scenarios simulation is consistent, with the area of the expansion area significantly larger than the area of the disappearance area, which is consistent with the biological characteristics of long-staple cotton. In the future, the average temperature will increase to some extent, and long-staple cotton is a species that likes light and warmth; thus, the temperature change can promote some areas previously limited by temperature to be newly suitable. For example, as shown in the three subplots b, c, and d of
Figure 6, the central part of Altay Prefecture, the central part of Aksu Prefecture, Holtan Prefecture, and other local areas have changed from the original unsuitable growing region to the suitable area.
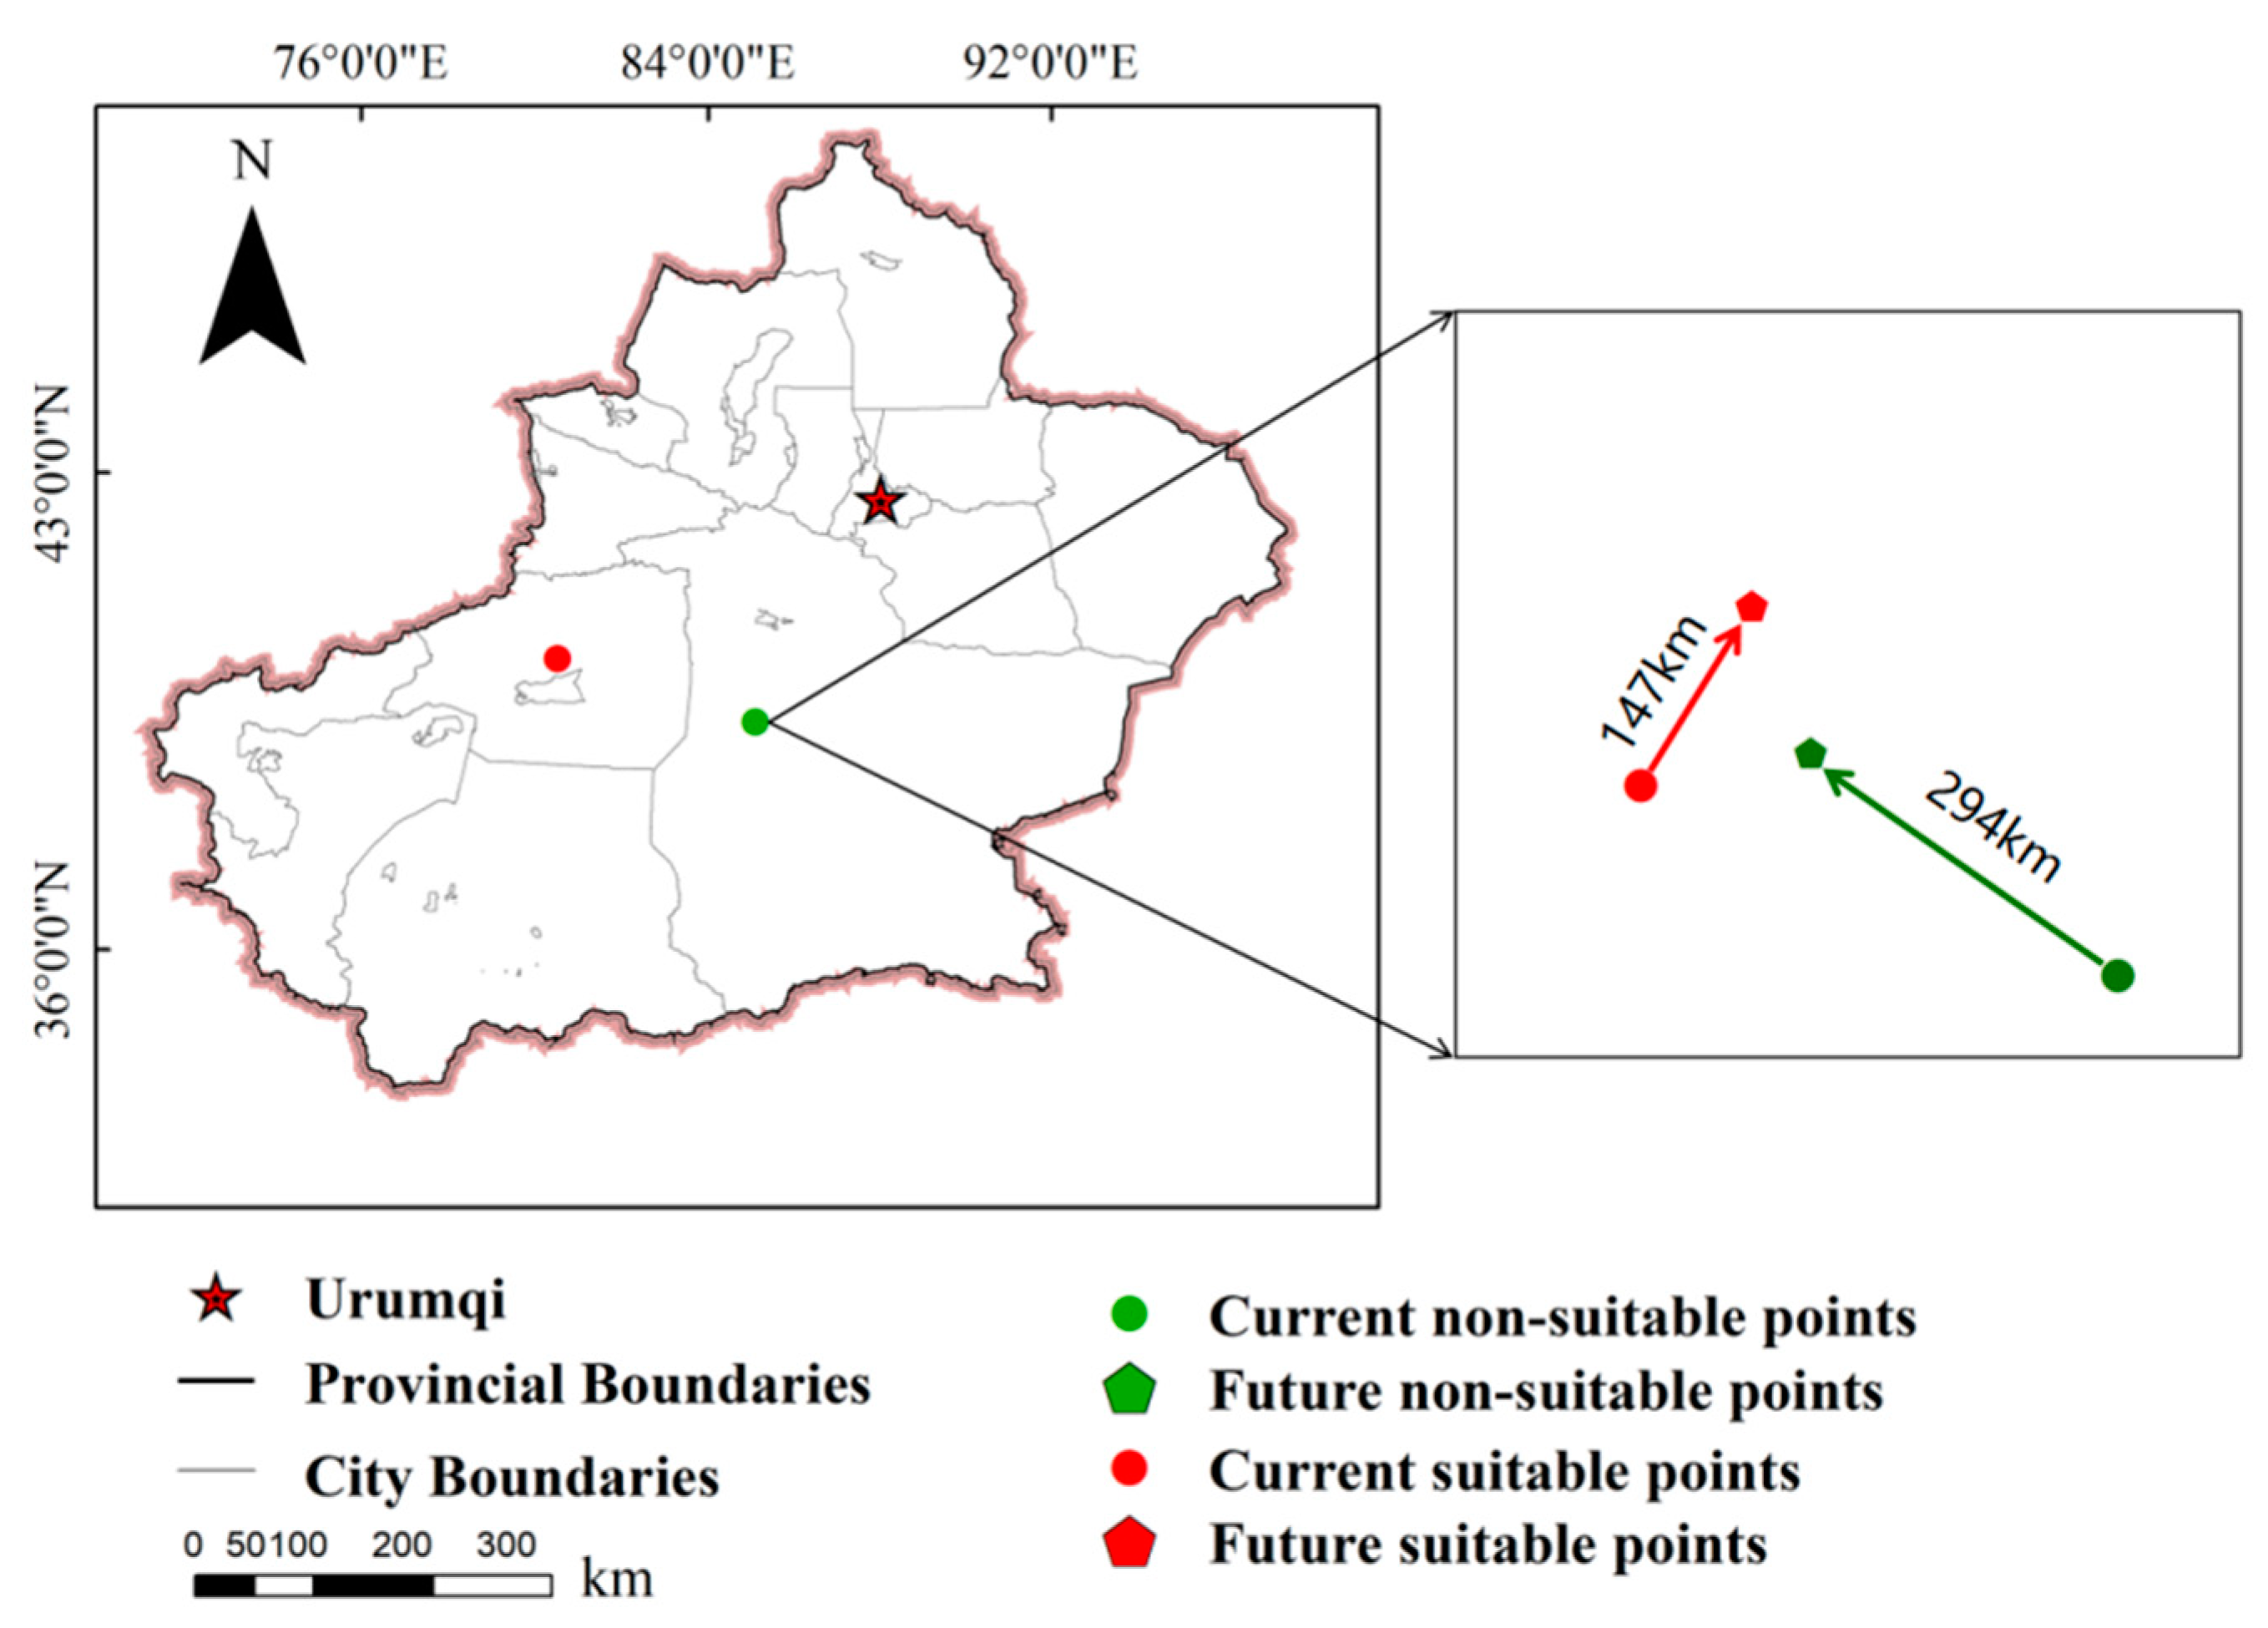
According to the calculation results of ArcGIS's zonal tool, it was found that the centroids of the suitable areas did move to some extent under the three climate models. In the 2070s, the center point of the suitable area for long-staple cotton migrated to the northeast with a straight distance of 147km, while the center point of the suitable area headed its way to the southwest with a straight distance of 48km. The center point of the low suitable area migrated to the northwest with a straight distance of 29km. The center point of the unsuitable area moves towards the northwest direction by nearly 294km (
Figure 7).
3.4. Coordination of Ecological Suitable Areas
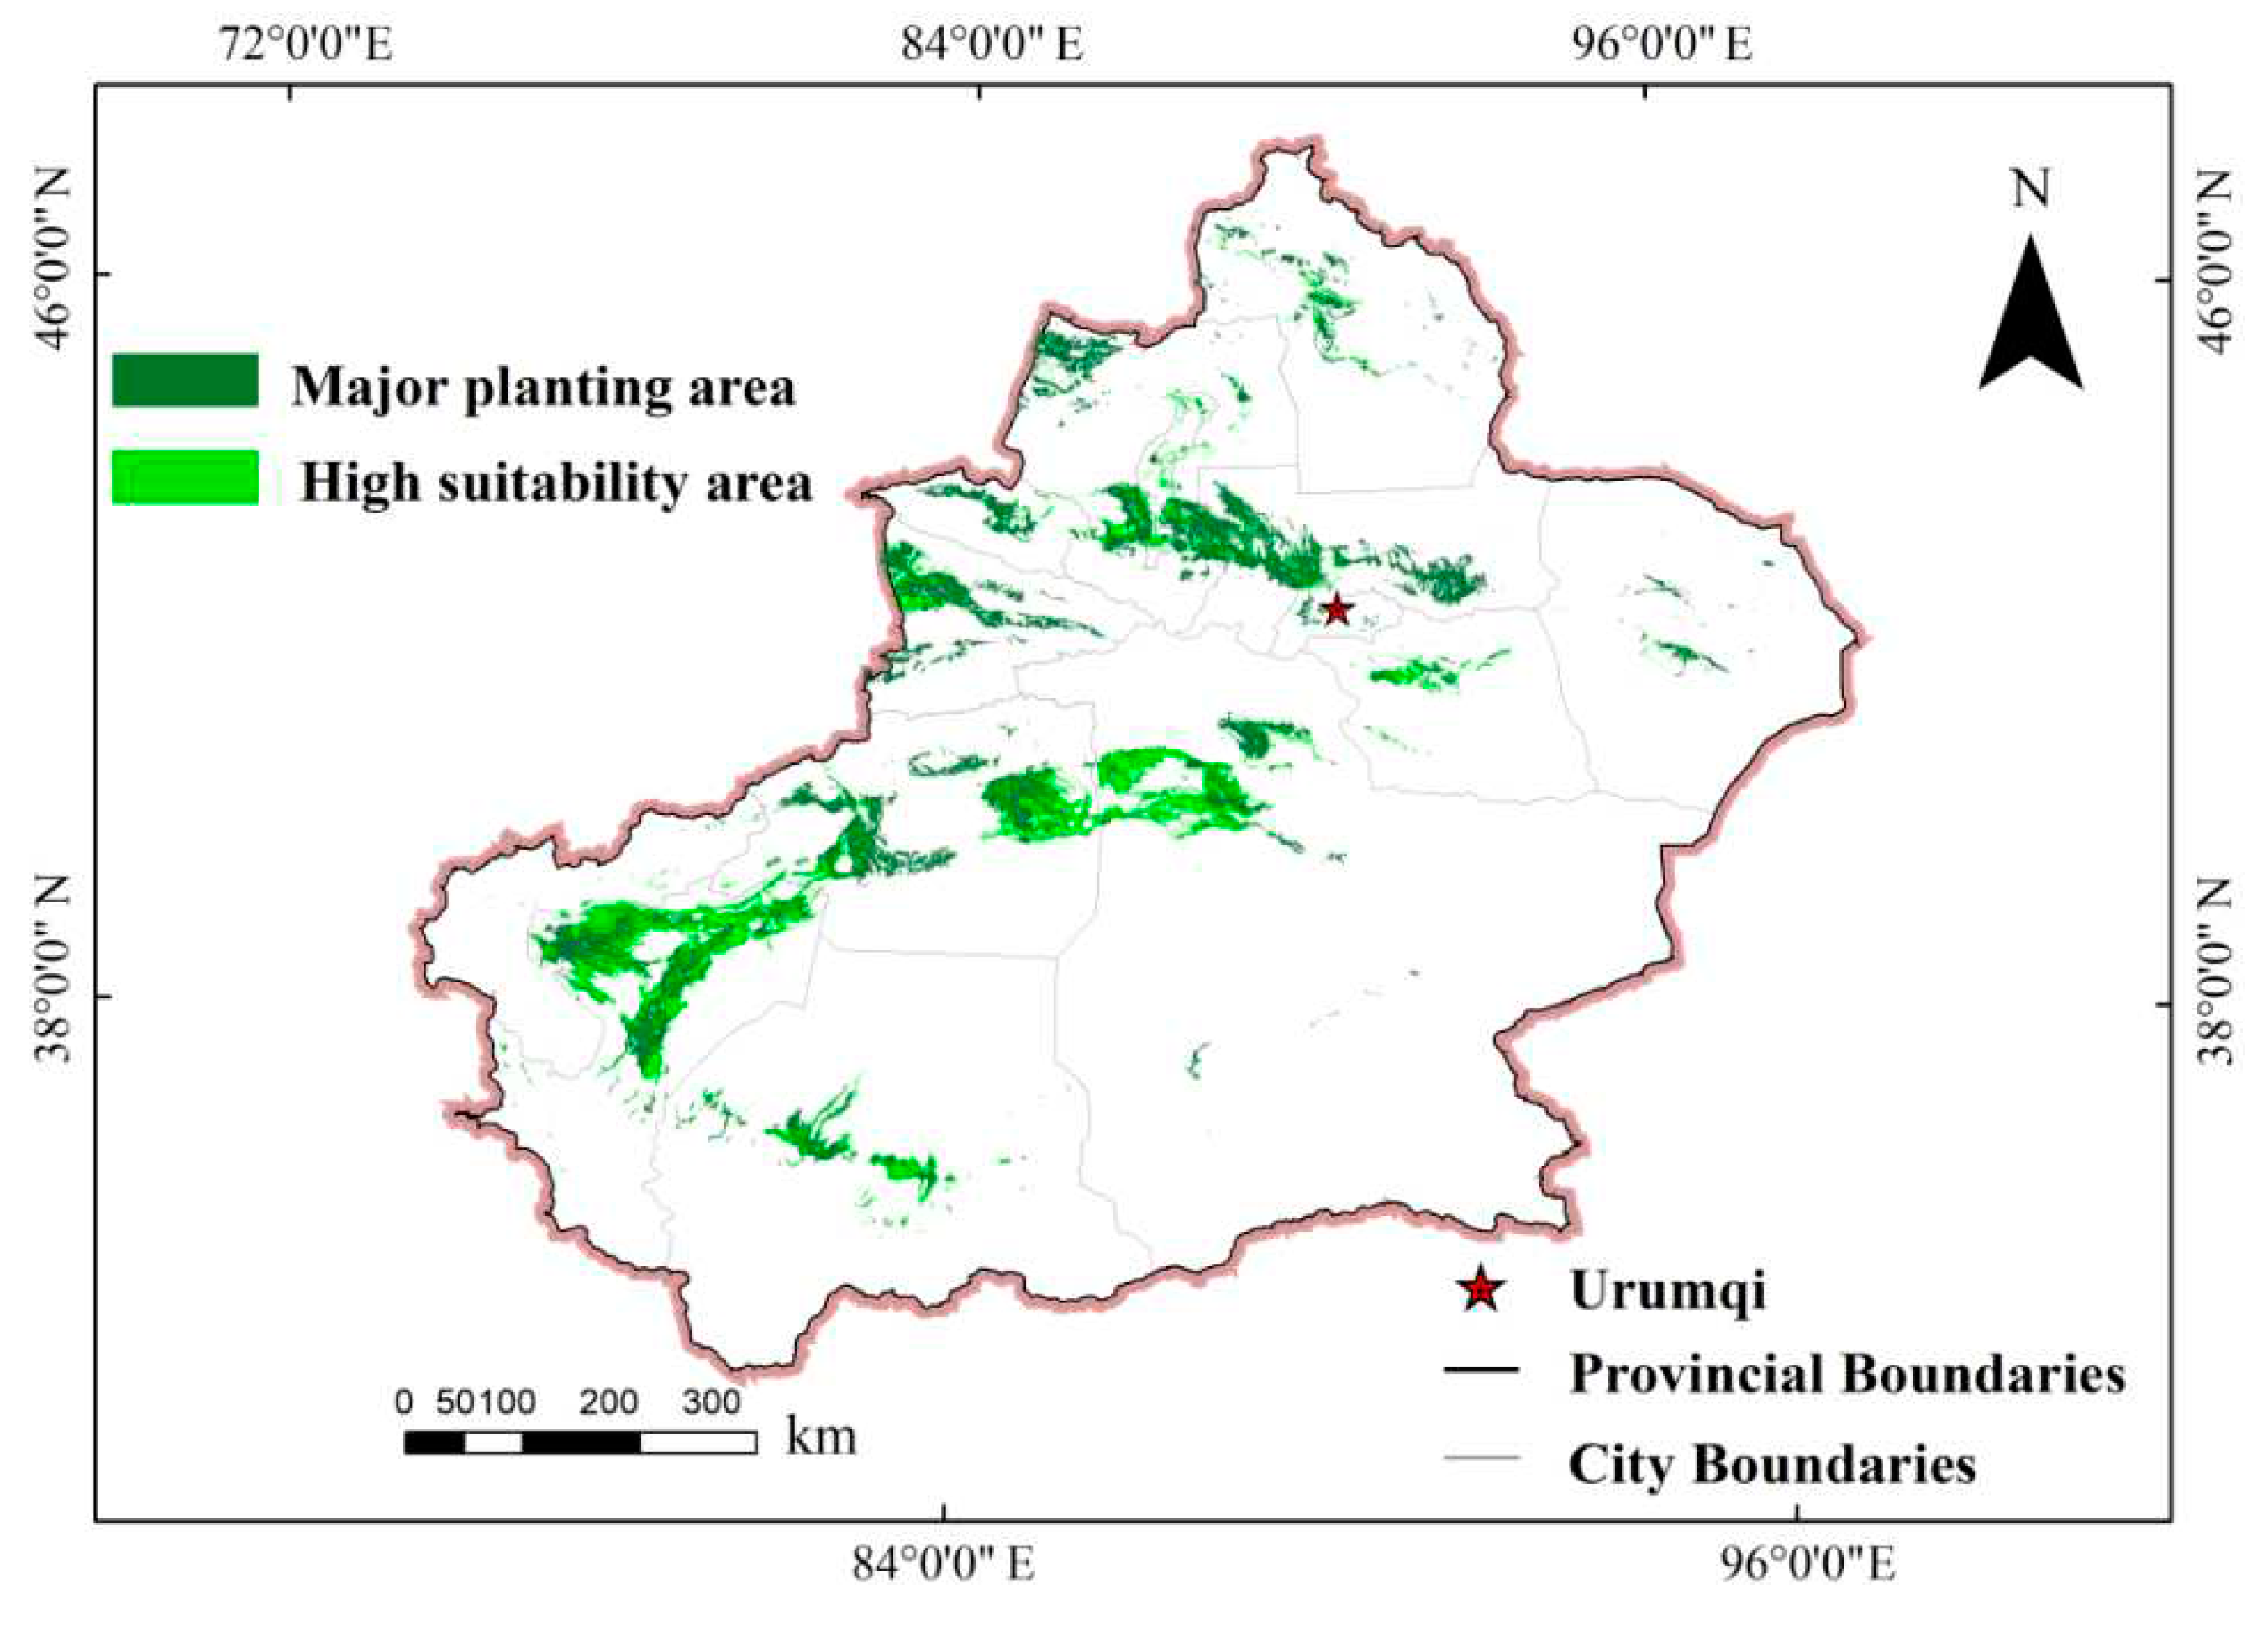
It can be seen from
Figure 8 below that the growing region of Xinjiang long-staple cotton is mainly distributed in the western and northern edges of the Tarim Basin, the northern foot of Tianshan Mountain, and other places, which are consistent with the predicted suitable areas. Still, some areas such as Turpan region, the northwest of Bayingolin Mongol Autonomous Prefecture, are theoretically suitable for planting long-staple cotton however have not been grown yet
45.
4. Discussion
4.1. Evaluation for Model Accuracy
The average AUC value of the model’s training set is 0.912, and the AUC value for the test set is 0.900, both of which are greater than 0.9, indicating that the model prediction accuracy is well. The predicted results are highly consistent with record points of long-staple cotton and previous research results, showing that this study's results have good accuracy and credibility3.
4.2. Main environmental factors that affect the distribution
Temperature and precipitation are the main factors affecting plant growth19. The main influential factors for this study include the highest temperature, the coldest month, the lowest temperature, the coldest season precipitation, and the average monthly temperature difference. The results indicate that Xinjiang long-staple cotton is significantly affected by temperature. This is slightly different from the study results of Xiaoping Chen and Yanmin Yang, mainly because there is generally less precipitation in Xinjiang, and the growth of long-staple cotton primarily relies on artificial irrigation46,47. Therefore, humans can appropriately compensate for the limitations of precipitation factors, and the impact on cotton is insignificant.
Among the climate factors that affect the potential distribution of long-staple cotton, the monthly average temperature difference in the 11-15℃ zone is suitable for its growth, while the highest temperature in the hottest month is 20-35℃, the lowest temperature in the coldest month is -15 to -10℃, and the precipitation in the coldest season is 50—70mm. Overall, long-staple cotton requires heat quite a lot throughout its entire growth period, which is consistent with the results of Fulu Tao, as heat condition is an essential factor affecting cotton’s growth18,48. The most suitable temperature for the emergence of long-staple cotton during the seedling stage is between 25 and 30℃, which is consistent with the research results of Conaty W, as lower temperatures can lead to slow emergence and even cause rotted seed49. The daily temperature difference of around 14℃ in early autumn can meet the active accumulated temperature required for its growth. The lowest temperature in the coldest month is -15~-10℃, consistent with the results of Shkolnik, inseparable from the characteristics of long-staple cotton itself50. It requires a lot of heat throughout the growth process, and the same is true in the coldest month. The high and low temperatures strongly affect the growth status of long-staple cotton. The monthly average temperature difference of 11-15℃ fits well because, under this temperature condition, long-staple cotton can store energy as much as possible and grow well. The coldest season has a precipitation of 50—70mm because long-staple cotton has specific requirements for water in the coldest season (during sprouting and seedlings period), so the area where the precipitation meets the conditions is likely to be suitable.
The sand content has the highest impact on long-staple cotton among the soil factors. This is consistent with the findings of Aliani H scholars51, that’s because soil with certain sand content may have better water permeability and breathability. Besides, since there is little precipitation in Xinjiang, most of the cultivation needs irrigation. Thus, soil with high sand content is more likely to have water reaching the cotton roots to replenish water timely for its growth. However, Vahidi M scholars have different conclusions52. They believed that the influencing factor also includes the PH value of soil because the soil PH is positively correlated with the annual average temperature in Xinjiang, and the change is small. Hence, the soil PH in the study area has no significant effect on the growth of long-staple cotton.
Among the terrain factors, the impact of various factors may not seem significant to cotton growth. This is because most of the cultivated areas in Xinjiang are flat and large areas; under this condition, slope and aspect have a little significant impact on the growth of long-staple cotton.
4.3. Migration and Prospect for Future Distribution
Given the three scenarios of RCP2.6, RCP4.5, and RCP8.5, climate warming will result in a significant increase in heat resources, and the suitable distribution area for long-staple cotton will increase to various degrees, with expansion areas generally tending towards high latitude areas. Compared with the planting area of 2070s long-staple cotton, we found that in the SSP126 and SSP245 scenarios, the expansion area increased by 3.8×10⁴km2 and by 4.5×104km2 in the SSP585 scenarios. Simultaneously, the center of mass of the suitable area of long-staple cotton migrated 147km to the northeast. At the same time, the center of mass of the suitable area of long-staple cotton migrated 147km to the northeast. This is consistent with the findings of Mai, because future climate change may significantly improve the heat resources in high-latitude regions, and the planting area of warm crops will also head North, which is consistent with the results of Na Li3,53.
However, according to the comparison, most areas of Xinjiang are consistent with the forecasted results; the actual planting area and the suitable distribution area of long-staple cotton overlap degree reached 83%, some differences between the best suitable area for cotton and the actual distribution still exist, indicating that there is much room for adjustment in cotton planting strategy, for example in the Turpan area, Bayingolin Mongolian Autonomous Prefecture, and other places, some suitable for planting long-staple cotton but not planted. The government and relevant departments could adopt necessary measures to adjust the future planting tactics of Xinjiang long-staple cotton to achieve optimal results.
4.4. Shortcomings of the Model
For a particular species, many factors affect its growth status, such as climate, terrain, and human activities. However, only climate, terrain, and soil factors were used for maximum entropy model simulation in our study, with potential human activity factors ignored, which may lead to some discrepancies between the predicted results of this study and the actual results.
As for the influential factors of human activities, they mainly intervene in the planting area of long-staple cotton by changing terrain factors and improving hydrological conditions. However, according to the results of this study, the slope and aspect of terrain factors may have little impact on the suitable distribution area; that is to say, we might ignore the effects of human activities on terrain factors. As for water factors, irrigation is often used to increase water resources, but the biological characteristics of long-staple cotton are salt alkali and drought resistance and do not require excessive watering. So, the factors affecting human activities that were ignored in this study may not significantly impact the final results. Therefore, the influence of human activities and policy factors should also be considered in future studies in Xinjiang.
5. Conclusion
This research took Xinjiang as the focused area and used the MaxEnt model and ArcGIS (version 10.8) software, based on 375 long-staple cotton growth sites and 27 environmental factors (in three levels: climate, terrain, soil), to explore the impact factors of potential distribution areas of long-staple cotton. According to the analysis results, the suitable habitat area for long-staple cotton is mainly located at the edge of Tarim Basin and the Junggar Basin, namely the northern foot of the western Kunlun Mountains, the Piedmont Alluvial fan, and Piedmont plain on the north and southern sides of Tianshan Mountains, especially in Aksu Prefecture, northeast Kashgar, northern Bayingolin Mongol Autonomous Prefecture, western Changji Hui Autonomous Prefecture, western and south Ili Kazakh Autonomous Prefecture. One of the environmental factors that affect the potential distribution most is temperature, including the coldest month's lowest temperature, the hottest month's highest temperature, and the average temperature of the warmest season, while the coldest season's precipitation also strongly impacts the precipitation factor. In the context of future climate change, the suitable area for long-staple cotton will expand towards the northwest, while the northeast region will gradually shrink. The expansion area is larger than the disappearance area under various climate scenarios.
Author Contributions
CRediT authorship contribution statement: Lingling Li: method, scheme design, data management, resources, first draft, review, verification, investigation, visualization, software, formal analysis, method, Sance Zhang: resources, formal analysis, writing, Yimin Gao: conceptualization, method, supervision, resources, review, verification, editing, Hongqi Wu: supervision, Investigation, resources, review, editing.
Funding
This research works as supported by the technical innovation guidance special fund of Shaanxi province (Grant Nos. “2020QFY07-03”).
Data Availability Statement
All the data used for several analyses are freely available and resources are mentioned within the paper.
Conflicts of Interest
The authors declare that they have no known competing financial interests or personal relationships that could have appeared to influence the work reported in this paper.
Declaration of Competing Interest
The authors declare that they have no known competing financial interests or personal relationships that could have appeared to influence the work reported in this paper.
References
- Dai, Y.; Yang, J.; Hu, W.; Zahoor, R.; Chen, B.; Zhao, W.; Meng, Y.; Zhou, Z. Simulative Global Warming Negatively Affects Cotton Fiber Length through Shortening Fiber Rapid Elongation Duration. Sci Rep 2017, 7 (1). [Google Scholar] [CrossRef] [PubMed]
- Liu, Y.; Geng, X.; Hao, Z.; Zheng, J. Changes in Climate Extremes in Central Asia under 1.5 and 2◦ c Global Warming and Their Impacts on Agricultural Productions. Atmosphere (Basel) 2020, 11 (10). [Google Scholar] [CrossRef]
- Li, N.; Lin, H.; Wang, T.; Li, Y.; Liu, Y.; Chen, X.; Hu, X. Impact of Climate Change on Cotton Growth and Yields in Xinjiang, China. Field Crops Res 2020, 247. [Google Scholar] [CrossRef]
- Hashima, W. A.; Elhawary, I. A. The Globalization of the Egyptian Cotton Spinning Industry via Engineering Units. Part 2: The Impact of the Latest Generation of Egyptian Cotton on the Quality Factor of Its Yarn. Alexandria Engineering Journal 2022, 61 (6). [Google Scholar] [CrossRef]
- Zhao, N.; Wang, W.; Grover, C. E.; Jiang, K.; Pan, Z.; Guo, B.; Zhu, J.; Su, Y.; Wang, M.; Nie, H.; Xiao, L.; Guo, A.; Yang, J.; Cheng, C.; Ning, X.; Li, B.; Xu, H.; Adjibolosoo, D.; Aierxi, A.; Li, P.; Geng, J.; Wendel, J. F.; Kong, J.; Hua, J. Genomic and GWAS Analyses Demonstrate Phylogenomic Relationships of Gossypium Barbadense in China and Selection for Fibre Length, Lint Percentage and Fusarium Wilt Resistance. Plant Biotechnol J 2022, 20 (4), 691–710. [Google Scholar] [CrossRef]
- Qin, G.; Zhao, N.; Wang, W.; Wang, M.; Zhu, J.; Yang, J.; Lin, F.; Huang, X.; Zhang, Y.; Min, L.; Chen, G.; Kong, J. Glyphosate-Induced Abscisic Acid Accumulation Causes Male Sterility in Sea Island Cotton. Plants 2023, 12 (5). [Google Scholar] [CrossRef]
- Smith, C. W.; Hague, S.; Hequet, E. F.; Jones, D. TAM 04 O-16L Long-Staple Upland Cotton with Improved Strength. J Plant Regist 2011, 5 (1), 109–112. [Google Scholar] [CrossRef]
- Zeng, J.; Yao, D.; Luo, M.; Ding, L.; Wang, Y.; Yan, X.; Ye, S.; Wang, C.; Wu, Y.; Zhang, J.; Li, Y.; Ran, L.; Dai, Y.; Chen, Y.; Wang, F.; Lai, H.; Liu, N.; Fang, N.; Pei, Y.; Xiao, Y. Fiber-Specific Increase of Carotenoid Content Promotes Cotton Fiber Elongation by Increasing Abscisic Acid and Ethylene Biosynthesis. Crop Journal 2023. [Google Scholar] [CrossRef]
- Gupta, B. Textile Fiber Morphology, Structure and Properties in Relation to Friction; 2008. [CrossRef]
- Segal, L.; Wakelyn, P. J. Cotton Fibres; 1985. [CrossRef]
- Hosseini Ravandi, S. A.; Valizadeh, M. Properties of Fibers and Fabrics That Contribute to Human Comfort. In Improving Comfort in Clothing; Elsevier, 2011; pp 61–78. [CrossRef]
- Shi, X.; Wang, C.; Zhao, J.; Wang, K.; Chen, F.; Chu, Q. Increasing Inconsistency between Climate Suitability and Production of Cotton (Gossypium Hirsutum L.) in China. Ind Crops Prod 2021, 171. [Google Scholar] [CrossRef]
- Dai, J.; Dong, H. Intensive Cotton Farming Technologies in China: Achievements, Challenges and Countermeasures. Field Crops Research. January 2014, pp 99–110. [CrossRef]
- Zhao, N.; Wang, W.; Grover, C. E.; Jiang, K.; Pan, Z.; Guo, B.; Zhu, J.; Su, Y.; Wang, M.; Nie, H.; Xiao, L.; Guo, A.; Yang, J.; Cheng, C.; Ning, X.; Li, B.; Xu, H.; Adjibolosoo, D.; Aierxi, A.; Li, P.; Geng, J.; Wendel, J. F.; Kong, J.; Hua, J. Genomic and GWAS Analyses Demonstrate Phylogenomic Relationships of Gossypium Barbadense in China and Selection for Fibre Length, Lint Percentage and Fusarium Wilt Resistance. Plant Biotechnol J 2022, 20 (4), 691–710. [Google Scholar] [CrossRef]
- Lerman, Z. בירושלים העברית האוניברסיטה חקלאית בכלכלה למחקר המרכז ומנהל חקלאית לכלכלה המחלקה Structure and Performance of Agriculture in Central Asia Structure and Performance of Agriculture in Central Asia 1. http://departments.agri.huji.ac.il/economics/index.html.ת.ד.
- Li, S. Y.; Miao, L. J.; Jiang, Z. H.; Wang, G. J.; Gnyawali, K. R.; Zhang, J.; Zhang, H.; Fang, K.; He, Y.; Li, C. Projected Drought Conditions in Northwest China with CMIP6 Models under Combined SSPs and RCPs for 2015–2099. Advances in Climate Change Research 2020, 11 (3), 210–217. [Google Scholar] [CrossRef]
- Chao, C.; Pang, Y.; Lizhen, Z. Impacts of Climate Change on Cotton Yield in China from 1961 to 2010 Based on Provincial Data; 2015; Vol. 29.
- Luo, Q.; Bange, M.; Clancy, L. Cotton Crop Phenology in a New Temperature Regime. Ecol Modell 2014, 285, 22–29. [Google Scholar] [CrossRef]
- Sun, J.; Cheng, G. W.; Li, W. P. Meta-Analysis of Relationships between Environmental Factors and Aboveground Biomass in the Alpine Grassland on the Tibetan Plateau. Biogeosciences 2013, 10 (3), 1707–1715. [Google Scholar] [CrossRef]
- Brown, J. L.; Bennett, J. R.; French, C. M. SDMtoolbox 2.0: The next Generation Python-Based GIS Toolkit for Landscape Genetic, Biogeographic and Species Distribution Model Analyses. PeerJ 2017, 5, e4095. [Google Scholar] [CrossRef]
- Austin, M. Species Distribution Models and Ecological Theory: A Critical Assessment and Some Possible New Approaches. Ecological Modelling. January 10, 2007, pp 1–19. [CrossRef]
- Heumann, B. W.; Walsh, S. J.; Verdery, A. M.; McDaniel, P. M.; Rindfuss, R. R. Land Suitability Modeling Using a Geographic Socio-Environmental Niche-Based Approach: A Case Study from Northeastern Thailand. Annals of the Association of American Geographers 2013, 103 (4), 764–784. [Google Scholar] [CrossRef]
- Phillips, S. B.; Aneja, V. P.; Kang, D.; Arya, S. P. Modelling and Analysis of the Atmospheric Nitrogen Deposition in North Carolina. In International Journal of Global Environmental Issues; Inderscience Publishers, 2006; Vol. 6, pp 231–252. [CrossRef]
- Mugiyo, H.; Chimonyo, V. G. P.; Kunz, R.; Sibanda, M.; Nhamo, L.; Ramakgahlele Masemola, C.; Modi, A. T.; Mabhaudhi, T. Mapping the Spatial Distribution of Underutilised Crop Species under Climate Change Using the MaxEnt Model: A Case of KwaZulu-Natal, South Africa. Clim Serv 2022, 28. [Google Scholar] [CrossRef]
- Su, P.; Zhang, A.; Wang, R.; Wang, J.; Gao, Y.; Liu, F. Prediction of Future Natural Suitable Areas for Rice under Representative Concentration Pathways (Rcps). Sustainability (Switzerland) 2021, 13 (3), 1–20. [Google Scholar] [CrossRef]
- Phillips, S. J.; Anderson, R. P.; Dudík, M.; Schapire, R. E.; Blair, M. E. Opening the Black Box: An Open-Source Release of Maxent. Ecography 2017, 40 (7), 887–893. [Google Scholar] [CrossRef]
- Lobell, D. B.; Schlenker, W.; Costa-Roberts, J. Climate Trends and Global Crop Production since 1980. Science (1979) 2011, 333 (6042), 616–620. [Google Scholar] [CrossRef]
- YIN, S. Y.; WANG, T.; HUA, W.; MIAO, J. P.; GAO, Y. Q.; FU, Y. H.; MATEI, D.; TYRLIS, E.; CHEN, D. Mid-Summer Surface Air Temperature and Its Internal Variability over China at 1.5 °C and 2 °C Global Warming. Advances in Climate Change Research 2020, 11 (3), 185–197. [Google Scholar] [CrossRef]
- Brown, J. L.; Bennett, J. R.; French, C. M. SDMtoolbox 2.0: The next Generation Python-Based GIS Toolkit for Landscape Genetic, Biogeographic and Species Distribution Model Analyses. PeerJ 2017, 5, e4095. [Google Scholar] [CrossRef]
- Verbruggen, H.; Tyberghein, L.; Belton, G. S.; Mineur, F.; Jueterbock, A.; Hoarau, G.; Gurgel, C. F. D.; De Clerck, O. Improving Transferability of Introduced Species’ Distribution Models: New Tools to Forecast the Spread of a Highly Invasive Seaweed. PLoS One 2013, 8 (6). [Google Scholar] [CrossRef]
- Zhong, R.; Tian, F.; Yang, P.; Yi, Q. Planting and Irrigation Methods for Cotton in Southern Xinjiang, China. Irrigation and Drainage 2016, 65 (4), 461–468. [Google Scholar] [CrossRef]
- Fick, S. E.; Hijmans, R. J. WorldClim 2: New 1-Km Spatial Resolution Climate Surfaces for Global Land Areas. International Journal of Climatology 2017, 37 (12), 4302–4315. [Google Scholar] [CrossRef]
- Riahi, K.; van Vuuren, D. P.; Kriegler, E.; Edmonds, J.; O’Neill, B. C.; Fujimori, S.; Bauer, N.; Calvin, K.; Dellink, R.; Fricko, O.; Lutz, W.; Popp, A.; Cuaresma, J. C.; KC, S.; Leimbach, M.; Jiang, L.; Kram, T.; Rao, S.; Emmerling, J.; Ebi, K.; Hasegawa, T.; Havlik, P.; Humpenöder, F.; Da Silva, L. A.; Smith, S.; Stehfest, E.; Bosetti, V.; Eom, J.; Gernaat, D.; Masui, T.; Rogelj, J.; Strefler, J.; Drouet, L.; Krey, V.; Luderer, G.; Harmsen, M.; Takahashi, K.; Baumstark, L.; Doelman, J. C.; Kainuma, M.; Klimont, Z.; Marangoni, G.; Lotze-Campen, H.; Obersteiner, M.; Tabeau, A.; Tavoni, M. The Shared Socioeconomic Pathways and Their Energy, Land Use, and Greenhouse Gas Emissions Implications: An Overview. Global Environmental Change 2017, 42, 153–168. [Google Scholar] [CrossRef]
- Phillips, S. J.; Dudík, M.; Phillips, S. J. Modeling of Species Distributions with Maxent: New Extensions and a Comprehensive Evaluation. [CrossRef]
- Shi, X.; Wang, J.; Zhang, L.; Chen, S.; Zhao, A.; Ning, X.; Fan, G.; Wu, N.; Zhang, L.; Wang, Z. Prediction of the Potentially Suitable Areas of Litsea Cubeba in China Based on Future Climate Change Using the Optimized MaxEnt Model. Ecol Indic 2023, 148. [Google Scholar] [CrossRef]
- Cui, X.; Wang, W.; Yang, X.; Li, S.; Qin, S.; Rong, J. Potential Distribution of Wild Camellia Oleifera Based on Ecological Niche Modeling. Biodiversity Science 2016, 24 (10), 1117–1128. [Google Scholar] [CrossRef]
- Li, J.; Chang, H.; Liu, T.; Zhang, C. The Potential Geographical Distribution of Haloxylon across Central Asia under Climate Change in the 21st Century. Agric For Meteorol 2019, 275, 243–254. [Google Scholar] [CrossRef]
- Zeng, Y.; Low, B. W.; Yeo, D. C. J. Novel Methods to Select Environmental Variables in MaxEnt: A Case Study Using Invasive Crayfish. Ecol Modell 2016, 341, 5–13. [Google Scholar] [CrossRef]
- Liu, G.; Mai, J. Habitat Shifts of Jatropha Curcas L. in the Asia-Pacific Region under Climate Change Scenarios. Energy 2022, 251. [Google Scholar] [CrossRef]
- Swets, J. A. Measuring the Accuracy of Diagnostic Systems. www.sciencemag.org.
- Yan, H.; He, J.; Xu, X.; Yao, X.; Wang, G.; Tang, L.; Feng, L.; Zou, L.; Gu, X.; Qu, Y.; Qu, L. Prediction of Potentially Suitable Distributions of Codonopsis Pilosula in China Based on an Optimized MaxEnt Model. Front Ecol Evol 2021, 9. [Google Scholar] [CrossRef]
- Teichmann, C.; Jacob, D.; Remedio, A. R.; Remke, T.; Buntemeyer, L.; Hoffmann, P.; Kriegsmann, A.; Lierhammer, L.; Bülow, K.; Weber, T.; Sieck, K.; Rechid, D.; Langendijk, G. S.; Coppola, E.; Giorgi, F.; Ciarlo, J. M.; Raffaele, F.; Giuliani, G.; Xuejie, G.; Sines, T. R.; Torres-Alavez, J. A.; Das, S.; Di Sante, F.; Pichelli, E.; Glazer, R.; Ashfaq, M.; Bukovsky, M.; Im, E. S. Assessing Mean Climate Change Signals in the Global CORDEX-CORE Ensemble. Clim Dyn 2021, 57 (5-6), 1269–1292. [Google Scholar] [CrossRef]
- Vautard, R.; Kadygrov, N.; Iles, C.; Boberg, F.; Buonomo, E.; Bülow, K.; Coppola, E.; Corre, L.; van Meijgaard, E.; Nogherotto, R.; Sandstad, M.; Schwingshackl, C.; Somot, S.; Aalbers, E.; Christensen, O. B.; Ciarlo, J. M.; Demory, M. E.; Giorgi, F.; Jacob, D.; Jones, R. G.; Keuler, K.; Kjellström, E.; Lenderink, G.; Levavasseur, G.; Nikulin, G.; Sillmann, J.; Solidoro, C.; Sørland, S. L.; Steger, C.; Teichmann, C.; Warrach-Sagi, K.; Wulfmeyer, V. Evaluation of the Large EURO-CORDEX Regional Climate Model Ensemble. Journal of Geophysical Research: Atmospheres 2021, 126 (17). [Google Scholar] [CrossRef]
- Luo, Q.; Bange, M.; Clancy, L. Cotton Crop Phenology in a New Temperature Regime. Ecol Modell 2014, 285, 22–29. [Google Scholar] [CrossRef]
- Luo, Q.; Bange, M.; Clancy, L. Cotton Crop Phenology in a New Temperature Regime. Ecol Modell 2014, 285, 22–29. [Google Scholar] [CrossRef]
- Yang, Y.; Yang, Y.; Han, S.; Macadam, I.; Liu, D. L. Prediction of Cotton Yield and Water Demand under Climate Change and Future Adaptation Measures. Agric Water Manag 2014, 144, 42–53. [Google Scholar] [CrossRef]
- Chen, X.; Qi, Z.; Gui, D.; Gu, Z.; Ma, L.; Zeng, F.; Li, L. Simulating Impacts of Climate Change on Cotton Yield and Water Requirement Using RZWQM2. Agric Water Manag 2019, 222, 231–241. [Google Scholar] [CrossRef]
- Tao, F.; Xiao, D.; Zhang, S.; Zhang, Z.; Rötter, R. P. Wheat Yield Benefited from Increases in Minimum Temperature in the Huang-Huai-Hai Plain of China in the Past Three Decades. Agric For Meteorol 2017, 239, 1–14. [Google Scholar] [CrossRef]
- Conaty, W. C.; Burke, J. J.; Mahan, J. R.; Neilsen, J. E.; Sutton, B. G. Determining the Optimum Plant Temperature of Cotton Physiology and Yield to Improve Plant-Based Irrigation Scheduling. Crop Sci 2012, 52 (4), 1828–1836. [Google Scholar] [CrossRef]
- Shkolnik, I. M.; Pigol’tsina, G. B.; Efimov, S. V. Agriculture in the Arid Regions of Eurasia and Global Warming: RCM Ensemble Projections for the Middle of the 21st Century. Russian Meteorology and Hydrology 2019, 44 (8), 540–547. [Google Scholar] [CrossRef]
- Aliani, H.; BabaieKafaky, S.; Saffari, A.; Monavari, S. M. Land Evaluation for Ecotourism Development—an Integrated Approach Based on FUZZY, WLC, and ANP Methods. International Journal of Environmental Science and Technology 2017, 14 (9), 1999–2008. [Google Scholar] [CrossRef]
- Vahidi, M. J.; Behdani, M. A.; Servati, M.; Naderi, M. Fuzzy-Based Models’ Performance on Qualitative and Quantitative Land Suitability Evaluation for Cotton Cultivation in Sarayan County, South Khorasan Province, Iran. Environ Monit Assess 2023, 195 (4). [Google Scholar] [CrossRef] [PubMed]
- Mai, J.; Liu, G. Modeling and Predicting the Effects of Climate Change on Cotton-Suitable Habitats in the Central Asian Arid Zone. Ind Crops Prod 2023, 191. [Google Scholar] [CrossRef]
|
Disclaimer/Publisher’s Note: The statements, opinions and data contained in all publications are solely those of the individual author(s) and contributor(s) and not of MDPI and/or the editor(s). MDPI and/or the editor(s) disclaim responsibility for any injury to people or property resulting from any ideas, methods, instructions or products referred to in the content. |
© 2023 by the authors. Licensee MDPI, Basel, Switzerland. This article is an open access article distributed under the terms and conditions of the Creative Commons Attribution (CC BY) license (http://creativecommons.org/licenses/by/4.0/).
