Preprint
Article

Structural Damage Detection Technique of Secondary Building Components using Piezoelectric Sensor

Altmetrics

Downloads

109

Views

30

Comments

0

A peer-reviewed article of this preprint also exists.

Submitted:

23 August 2023

Posted:

23 August 2023

You are already at the latest version

Alerts
Abstract
With demand for the long-term continued use of existing building facilities, structural health monitoring and damage detection are attracting interest from society. Sensors of various types have been practically applied in the industry to satisfy this need. Among the sensors, piezoelectric sensors are an extremely promising technology by virtue of their cost advantages and durability. Although they have been used in aerospace and civil engineering, their application for building engineering remains limited. Remarkably, recent catastrophic seismic events have further rein-forced the necessity of rapid damage detection and quick judgment about the safe use of facilities. Faced with these circumstances, this study was conducted to assess the applicability of piezoelectric sensors to evaluate building components. Specifically, this study emphasizes structural damage caused by earthquakes. After first applying to cyclic loading tests to composite beam component specimens and steel frame subassemblies with a folded roof plate, the prospective damage posi-tions were also found using finite element analysis. Crack propagation and buckling locations were predicted adequately. The piezoelectric sensors provided output when the concrete slab showed tensile cracks, or when the folded roof plate experienced local buckling. Furthermore, damage expansion and progression were detected multiple times during loading tests. Results showed that the piezoelectric sensors can detect structural damage of building components, demonstrating their potential for use in inexpensive and stable monitoring systems.
Keywords: 
Subject: Engineering  -   Architecture, Building and Construction

1. Introduction

In recent times, powerful earthquakes have struck cities worldwide, one after another. Since establishing the Sendai framework at the UN World Conference on Disaster Risk Reduction in 2015, the demand for resilience strengthening of structures is further attracting international researchers’ interest. This situation certainly includes buildings of various types.
Structural health monitoring fulfills an important role in the peri-disaster and post-disaster phases, respectively during and after disasters. Building collapse must be prevented even after an earthquake. A recent catastrophic event, the 2015 Gorka earthquake, caused the complete collapse of 500,000 buildings and the partial collapse of 250,000 buildings, according to the Japan International Cooperation Agency (JICA) [1]. Another recent seismic event, the 2023 Turkey–Syria earthquake, caused more than 164,000 buildings to be destroyed or severely damaged, as reported by the Turkish Ministry. Such damage derives from a lack of proper assessment of structural capacity and a lack of rapid seismic strengthening. Findings indicate that continuous efforts at damage prevention must be pursued locally and globally.
Most buildings in countries with strict seismic design criteria, such as those of Japan, can withstand strong ground motions. Nevertheless, several buildings have been reportedly unable to maintain their functions because of damage to secondary building components [2]. Eventually, some buildings became unsafe for use as evacuation shelters during post-disaster phases of recovery [3]. In addition, the durations required for emergent inspections have been raised as a primary concern. In spite of enormous efforts by engineers and public servants, damage inspections after the 2016 Kumamoto earthquake took 57 days to complete [4]. One reason underlying this long period is that the engineers able to complete on-site inspections were few at the municipality level. However, in contrast to restrictions of human resources, demands from society for the continuity of building use are skyrocketing.
Faced with these needs, structural health monitoring and damage detection are attracting interest among researchers and engineers. Generally, they are classifiable as global and local approaches [5]. It is noteworthy that global structural health monitoring uses the following representative methods: 1) natural frequency-based methods, 2) mode shape-based methods, 3) dynamically measured flexibility matrix based methods, 4) neural network methods, and 5) generic algorithm methods [6].
Ji et al. [7] conducted full-scale shaking table tests as well as monitoring of building vibration. Results obtained by analyzing the shift of natural frequencies of building structures demonstrated the effectiveness of vibration-based damage diagnosis.
Okada et al. reported the application of a three-dimensional structural monitoring system for a full-scale six-story RC building [8]. In addition, a cost efficient method was established to interpolate responses from the limited recorded data.
Moreover, Gislason et al. [9] proposed an automated structural health monitoring system based on time history analysis. Through rigorous numerical modeling, it was demonstrated that damage can be identified with story-level precision. The degree of damage can be quantified accurately based on floor accelerations caused by ambient wind forces.
In addition, Alampalli et al. [10] classically investigated the sensitivity of modal characteristics to damage in a laboratory-scaled bridge span. Through the comprehensive investigation, Alampalli et al. [10] concluded that the local damage does not necessarily change mode shapes more significantly at the damage location or near damage locations than in other areas.
Structural health monitoring and damage detection at the local level are also continuing their evolution internationally. For this purpose, sensors of various kinds, such as strain gauges, accelerometers, fiber optical sensors, displacement sensors, piezoelectric sensors, and Doppler vibrometers, have been developed to realize structural health monitoring [11]. The classical technique to detect local damage uses strain gauges. Recently, they have become widely available on the market. However, they are fragile and unsuitable for long-term monitoring. Consequently, they are commonly used for laboratory experiments.
The recent development of image sensing has realized damage detection using digital images. Earlier achievements by Chida and Takahashi [4] enabled the detection and evaluation of quantitative damage at the ground level of timber houses using pre-post morphological processing combined with semantic segmentation by deep learning.
From a simplified perspective, Kishiki et al. [12] attempted to visualize the residual strength of buckled steel members. The magnitude of buckling deformation was measured during cyclic loading tests. The strength and deformation magnitude were correlated. Ultimately, an evaluation equation was proposed for instant strength evaluation.
Recent efforts at structural health monitoring are being aimed at sensors of novel types, specifically piezoelectric sensors. Such sensors detect the applied force or displacement and then generate a voltage. Compared with other monitoring sensors and techniques, piezoelectric sensors provide numerous benefits such as small size, light weight, low cost, high sensitivity, and availability in various formats [11]. By virtue of these benefits, piezoelectric sensors are applied practically for aerospace and civil engineering structures [13].
Earlier, Harada et al. [14] used piezoelectric sensors to detect crack propagation in steel specimens and RC beams. Conversions of the output voltage and strain are interrelated experimentally and theoretically. Furthermore, Harada et al. [14] reported that a charge amplifier with low energy consumption took stable measurements in a static condition. Therefore, Harada et al. [14] concluded that the piezoelectric sensor is effective, particularly for local and severe damage such as that associated with concrete crack expansion.
In terms of building applications, one of the authors enthusiastically investigated the application of piezoelectric sensors for building components. Earlier, the applicability of the sensor was studied for exposed column base connections [15], and welded connections between a beam and column [16] because they are prone to being damaged in strong earthquakes. The result demonstrated that the piezoelectric sensor adequately detects structural damage in the inelastic phase. Therefore, this sensor is promising for use in an inexpensive and durable health monitoring system.
Generally, buildings comprise main structural components (columns, beams, etc.) and secondary components (concrete slabs, folded roof plates, etc.). Earlier reports revealed that the secondary components function as a restraint on the primary structural members. Their restraint performance is generally represented as the spring stiffness or strength [17,18,19,20,21,22,23,24].
Steel beams are assembled with a concrete slab through shear connectors in an ordinary building with several floors (Figure 1(a)). It is widely recognized that a concrete slab demonstrates restraint performance along the in-plane direction and out-of-plane direction. Although cracks in the concrete slab originate during cyclically applied stress from the earthquake, enhancement of the buckling strength was confirmed by experimentation [25].
By contrast, single-story buildings (gymnasiums, warehouses, etc.) on the top floor of multiple-story buildings can only have folded roof plates (Figure 1(b)). According to an earlier experiment, the folded roof plate demonstrates high restraint performance, but its rigidity is much lower than that of a concrete slab. Their buckling strength was derived theoretically and analytically in an earlier study [26]. In addition, the mechanical performance of the folded roof plate was evaluated at the component level [27].
As evaluation methods are becoming more sophisticated, as introduced above, the necessity of securing the designed restraint performance is being raised as an important concern. However, structural health monitoring and damage detection technology are usually intended for the global frame or for the primary structural components. Considering that the bracings are generally damaged before member buckling and subsequent strength deterioration, damage detection of secondary structural components is rather important.
Based on the discussion presented above, this study was conducted to detect concrete slabs and folded roof plate damage using inexpensive yet consistent and reliable measures. Specifically, this study applies piezoelectric sensors. For this purpose, this study applied cyclic loading tests to a component model of composite beam and steel frame subassembly with folded roof plates. Because the prospective damage position must be analyzed in advance, finite element analysis (FEA) is demonstrated for these assessments. The sensor output and the damage state were compared to investigate their adaptability to the damage detection of secondary building components.

2. Structural Damage Detection of a Concrete Slab using Piezoelectric Sensors

2.1. Outline of experiment

2.1.1. Specimen configuration

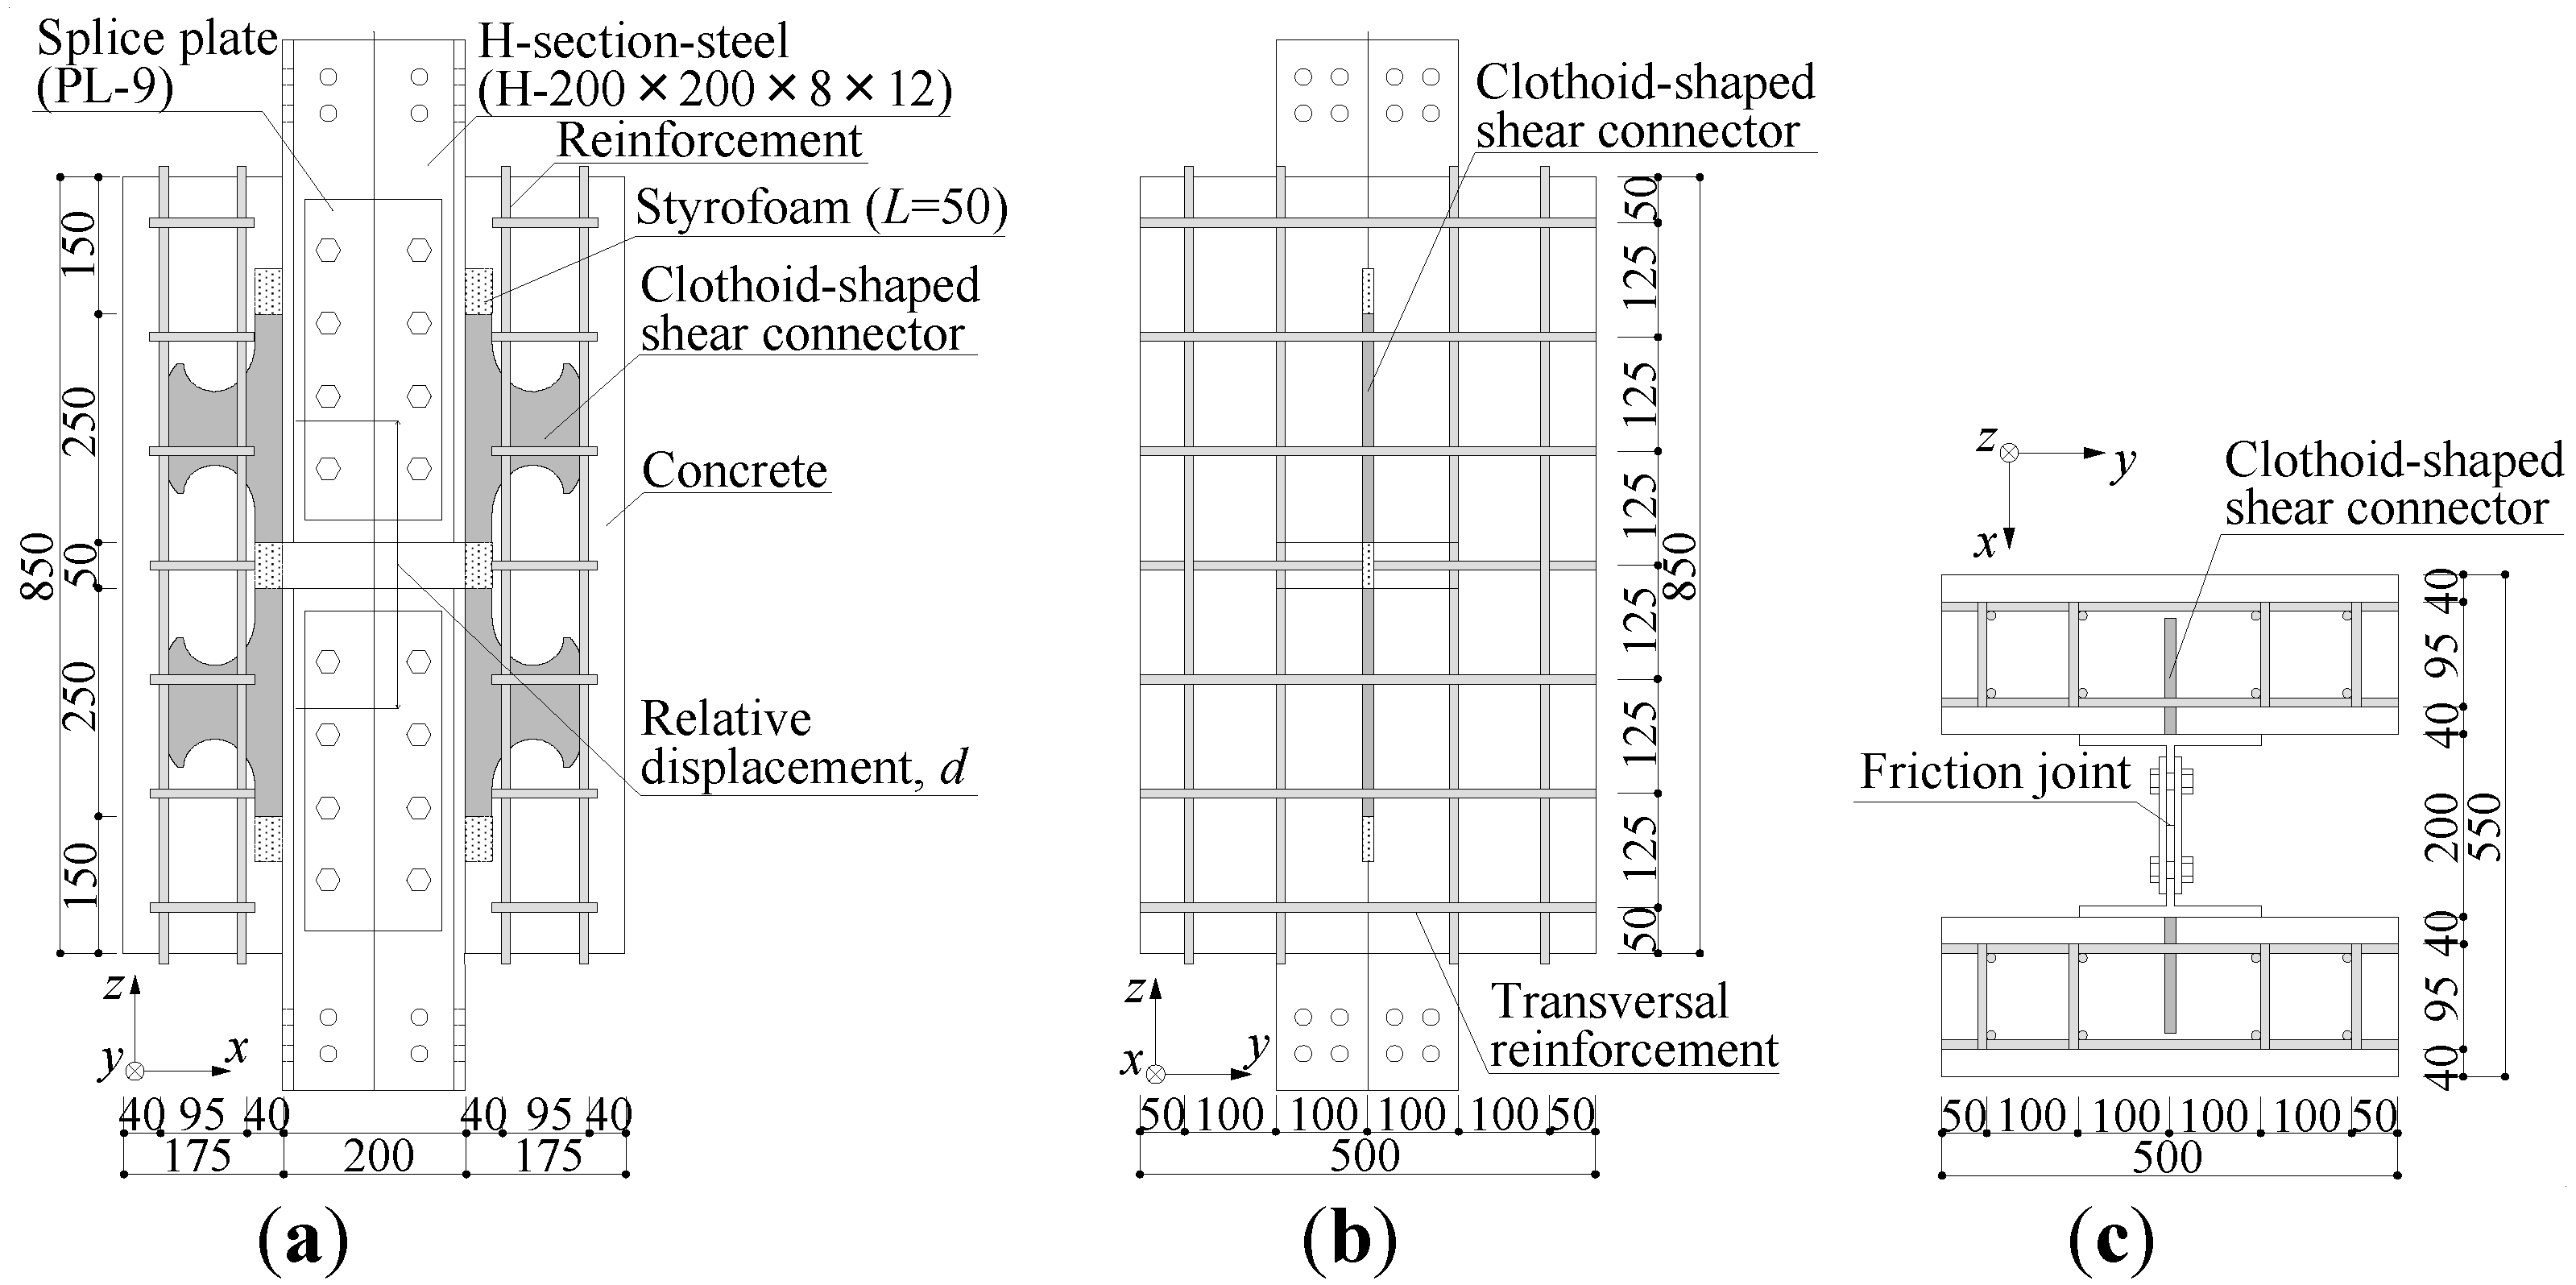
Figure 2 portrays the configuration of the composite beam component model. The specimen was designed for earlier experiments [17,18,19,20,21,22,23,24]. The specimen comprised two concrete slabs, longitudinal and transversal reinforcements, four clothoid-shaped shear connectors, and two H-section steels. The specimen configuration was designed as symmetric relative to the z-axis to eliminate eccentricity. The clothoid-shaped shear connector thickness was 16 mm. The longitudinal diameter and transversal rebar were 10 mm.
The casting orientation is widely acknowledged as influencing the mechanical performance of the shear connection. Therefore, the Japan Society of Steel Construction (JSSC) recommends replication of the structure concerned when engineers manufacture the shear connection component model [28]. For this study, we therefore poured concrete along the x-axis to model the composite beam. Two specimen parts were assembled using high-strength bolts and splice plates before loading tests.
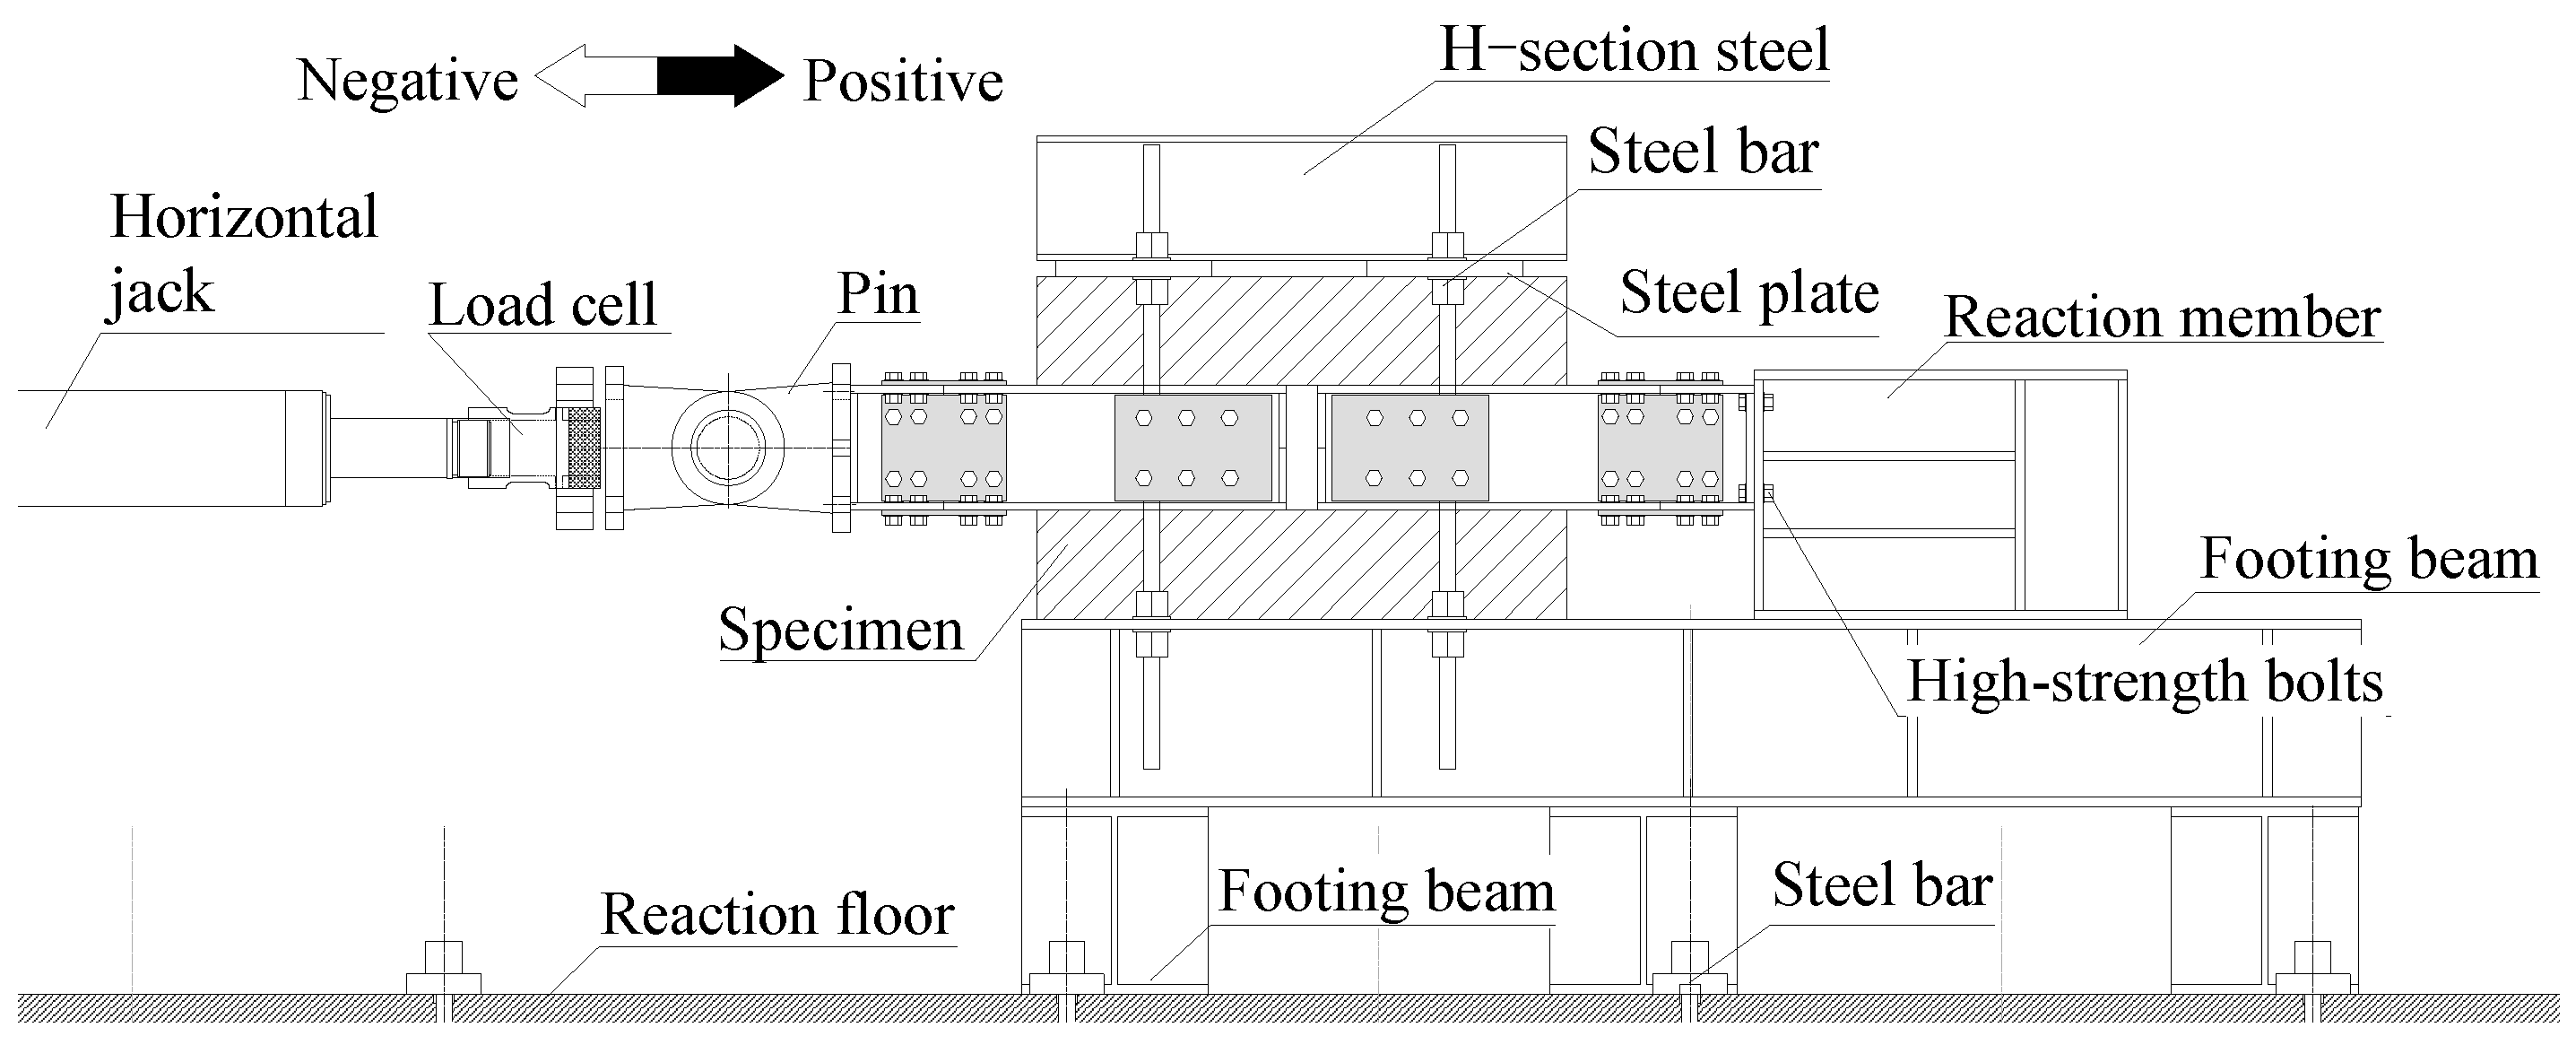
presents an illustration of the loading frame. The specimen was placed widthwise on the footing beam. The single side of H-section steel was connected to the reaction member by high-strength bolts. Then the imposed shear force was transferred to the reaction floor. The shear force was carried cyclically by a 1,000 kN capacity hydraulic jack.

2.1.2. Loading protocols

For the loading test, the amplitude was controlled based on the relative displacement of two shear connectors (designated as connector relative displacement, d). The loading protocol was fully reversed loading. Compressive and tensile stresses were applied for the concrete slab in positive and negative side loading.

2.1.3. Material properties

Table 1 shows the mix design of the concrete. The water/cement ratio (W/C) was 53.0%. Table 2, Table 3 and Table 4 present the material test results. The material tests of the concrete and steel members were conducted in accordance with JIS A 1108 [29] for the compressive strength test of the concrete, JIS A 1113 [30] for the splitting tensile strength of the concrete, and JIS Z 2241 [31] for the tensile strength test of the steel. The compressive and tensile strengths were, respectively, 26.4 N/mm2 and 2.1 N/mm2 (Table 2). The yield and ultimate strength of the shear connector, web, and flange plates were distributed respectively as 257–293 and 436–458 N/mm2 (Table 3). The yield strength and the ultimate strength of the reinforcement were, respectively, 378 N/mm2 and 509 N/mm2 (Table 4).

2.1.4. Curing conditions

Specimens were demolded on the seventh day after concrete casting. They were air-cured up to the day of the loading test. The concrete specimens for the material tests were cured in the same room to give all of them an identical temperature history.

2.2. Outline of finite element analysis

2.2.1. Configuration of finite element analysis

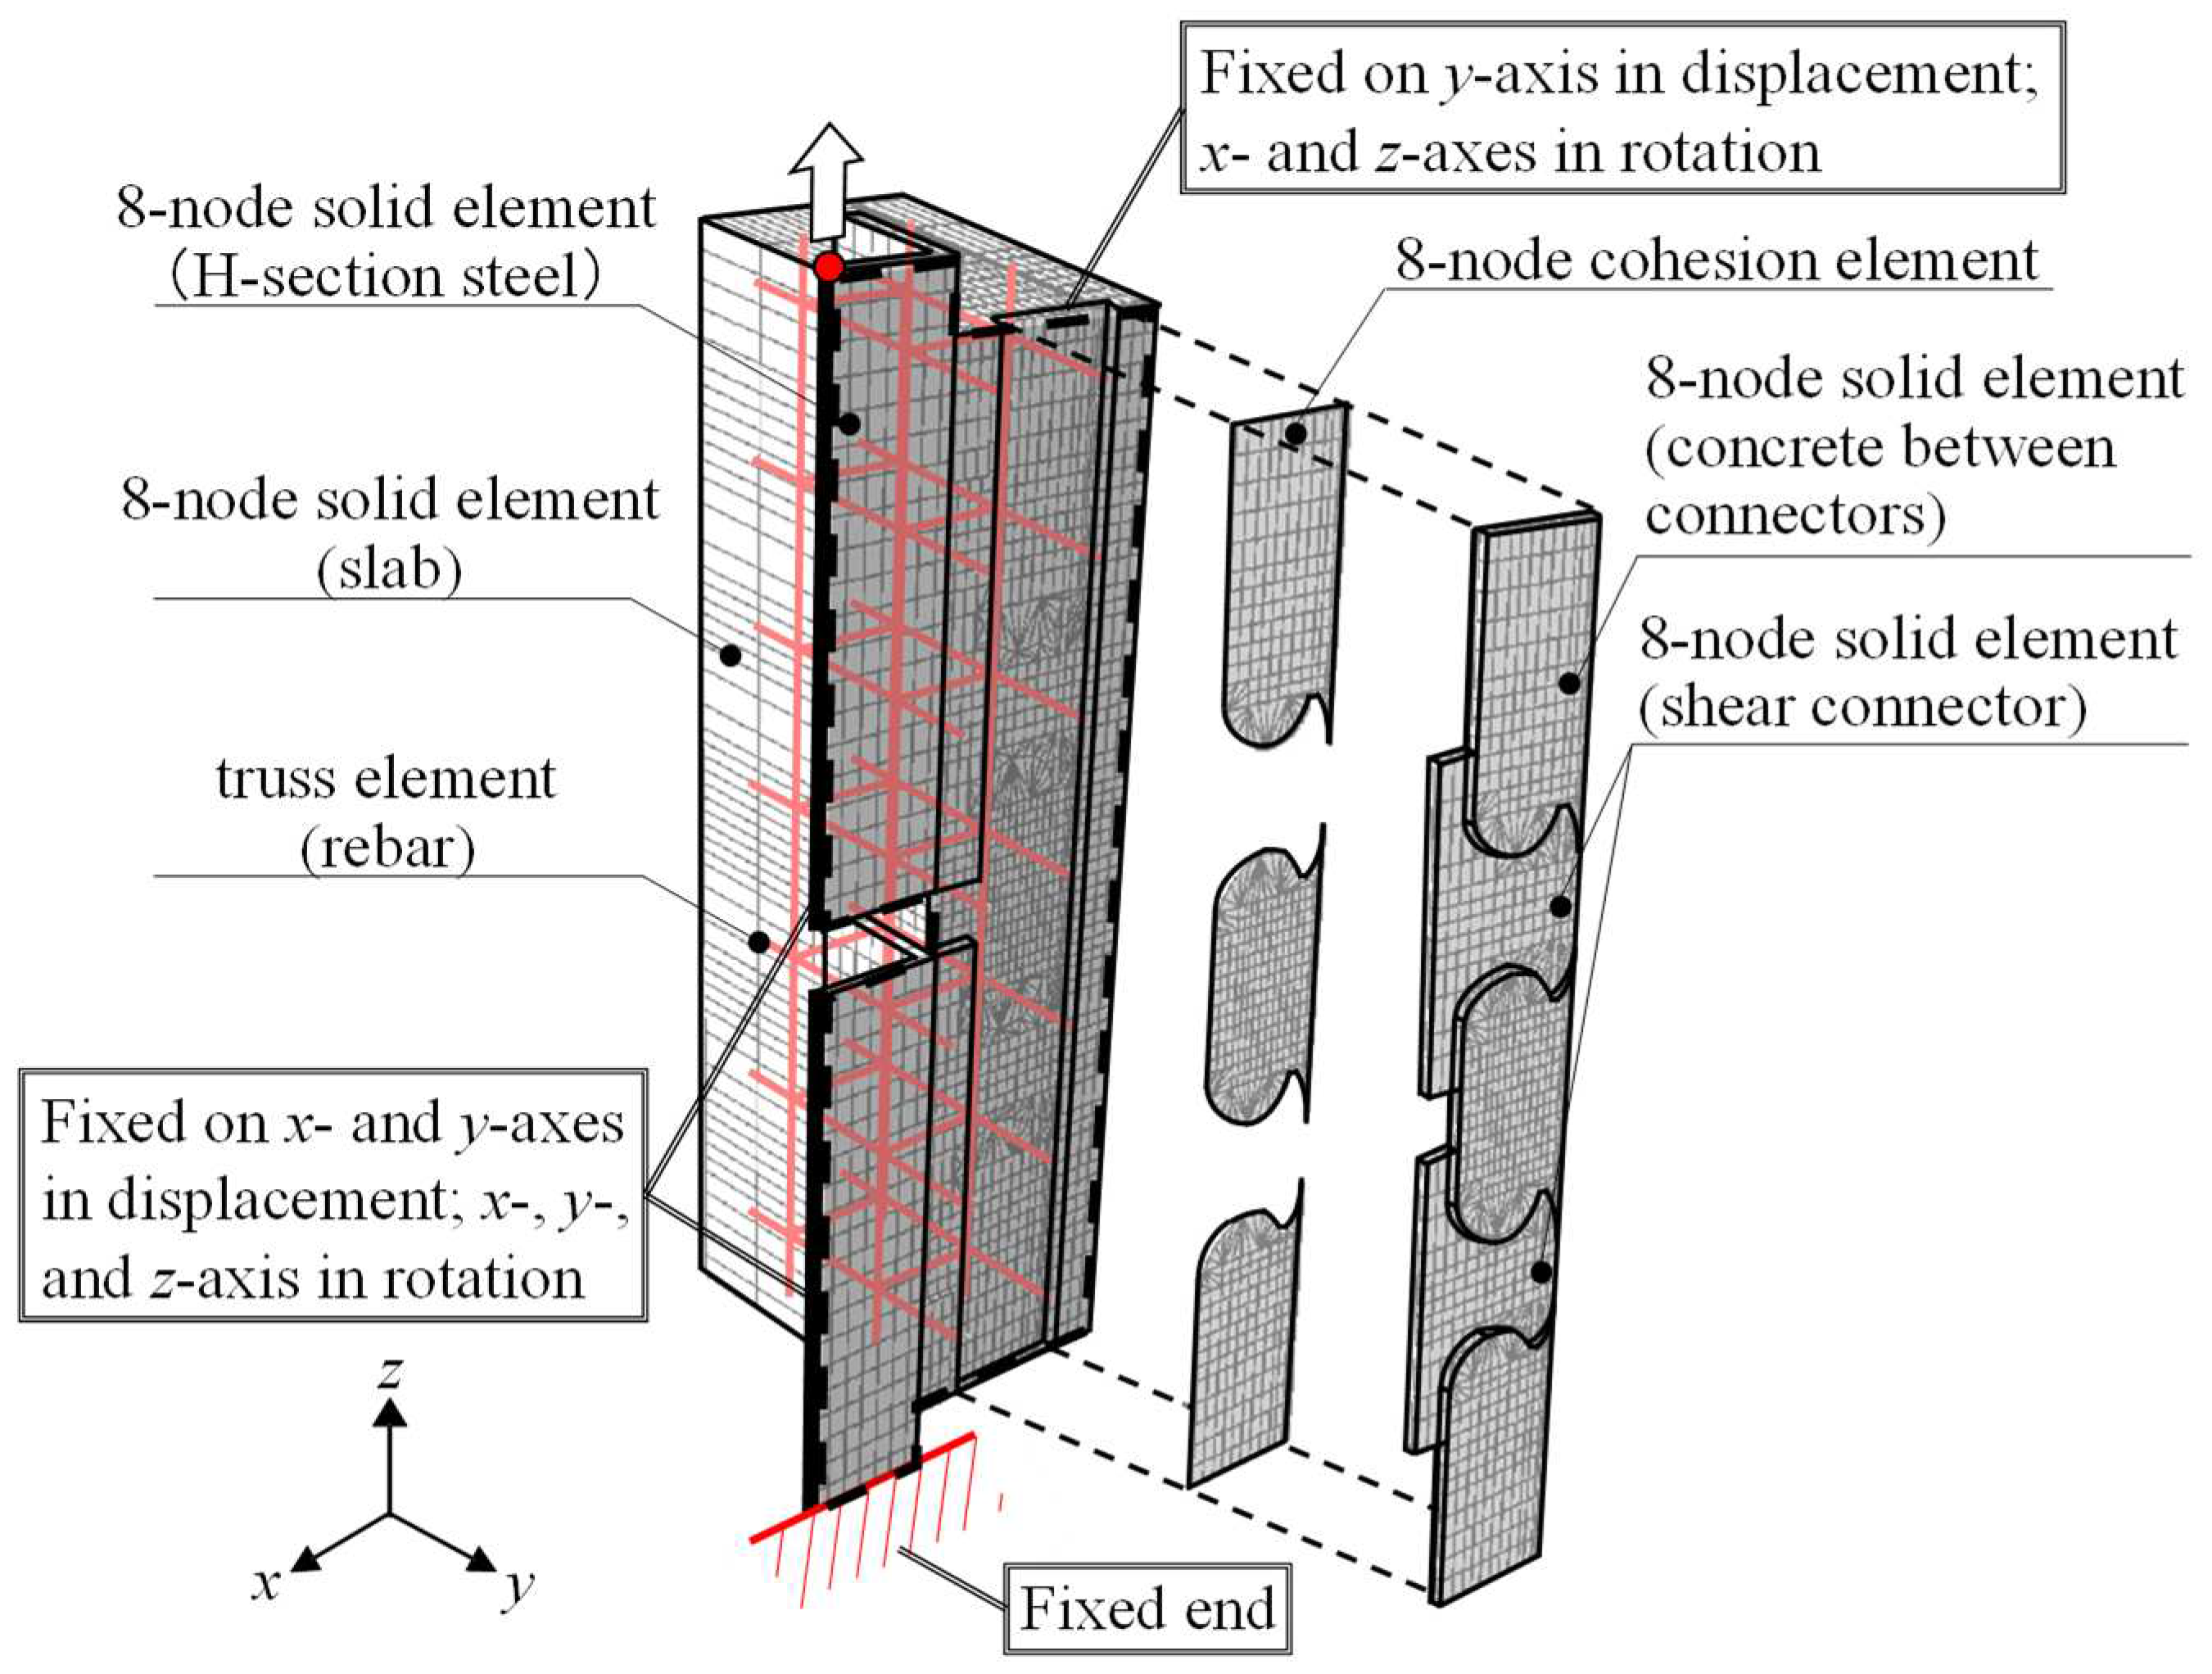
An FEA model was demonstrated to determine the piezoelectric sensor positions. Figure 4 exhibits the FEA model configuration. Using the symmetricity of the specimen configuration, a quarter part of the specimen was extracted for the analysis. ABAQUS (ver. 2021) was used for this simulation. Embracing the advantage of the convergence, an explicit module was used to analyze the composite beam component model.
As exhibited in Figure 4, the H-section steel, shear connector, and concrete slab were built with the solid element. The reinforcements were modeled by the truss elements. Separation through a tensile crack is represented by the 0.1-mm-thick cohesion element. The element was placed on the interface between the concrete block and the concrete between the shear connectors. The respective sides of the cohesion element were tied to the concrete block and the remaining concrete parts. When the deformation was imposed on the shear connector, the cohesion element deformed and carried the reaction force. According to the constitutive law described later, the cohesion element depleted its strength gradually and vanished in the ultimate state. The concrete blocks were therefore discretized after vanishing.
The encastre constraint is given at the bottom of the H-section steel. The boundary condition to satisfy the symmetricity was provided to the web plate and concrete slab center. Loading was imposed at the top of the H-section steel.
The contact pair was defined between the shear connector-to-concrete and concrete-to-H-section steel. The friction and initial adhesion were not given because the shear connector surfaces were greased for the experiment. Furthermore, the embedded constraint was given to the reinforcements related to the concrete slab.

2.2.2. Constitutive law of concrete and slab separation

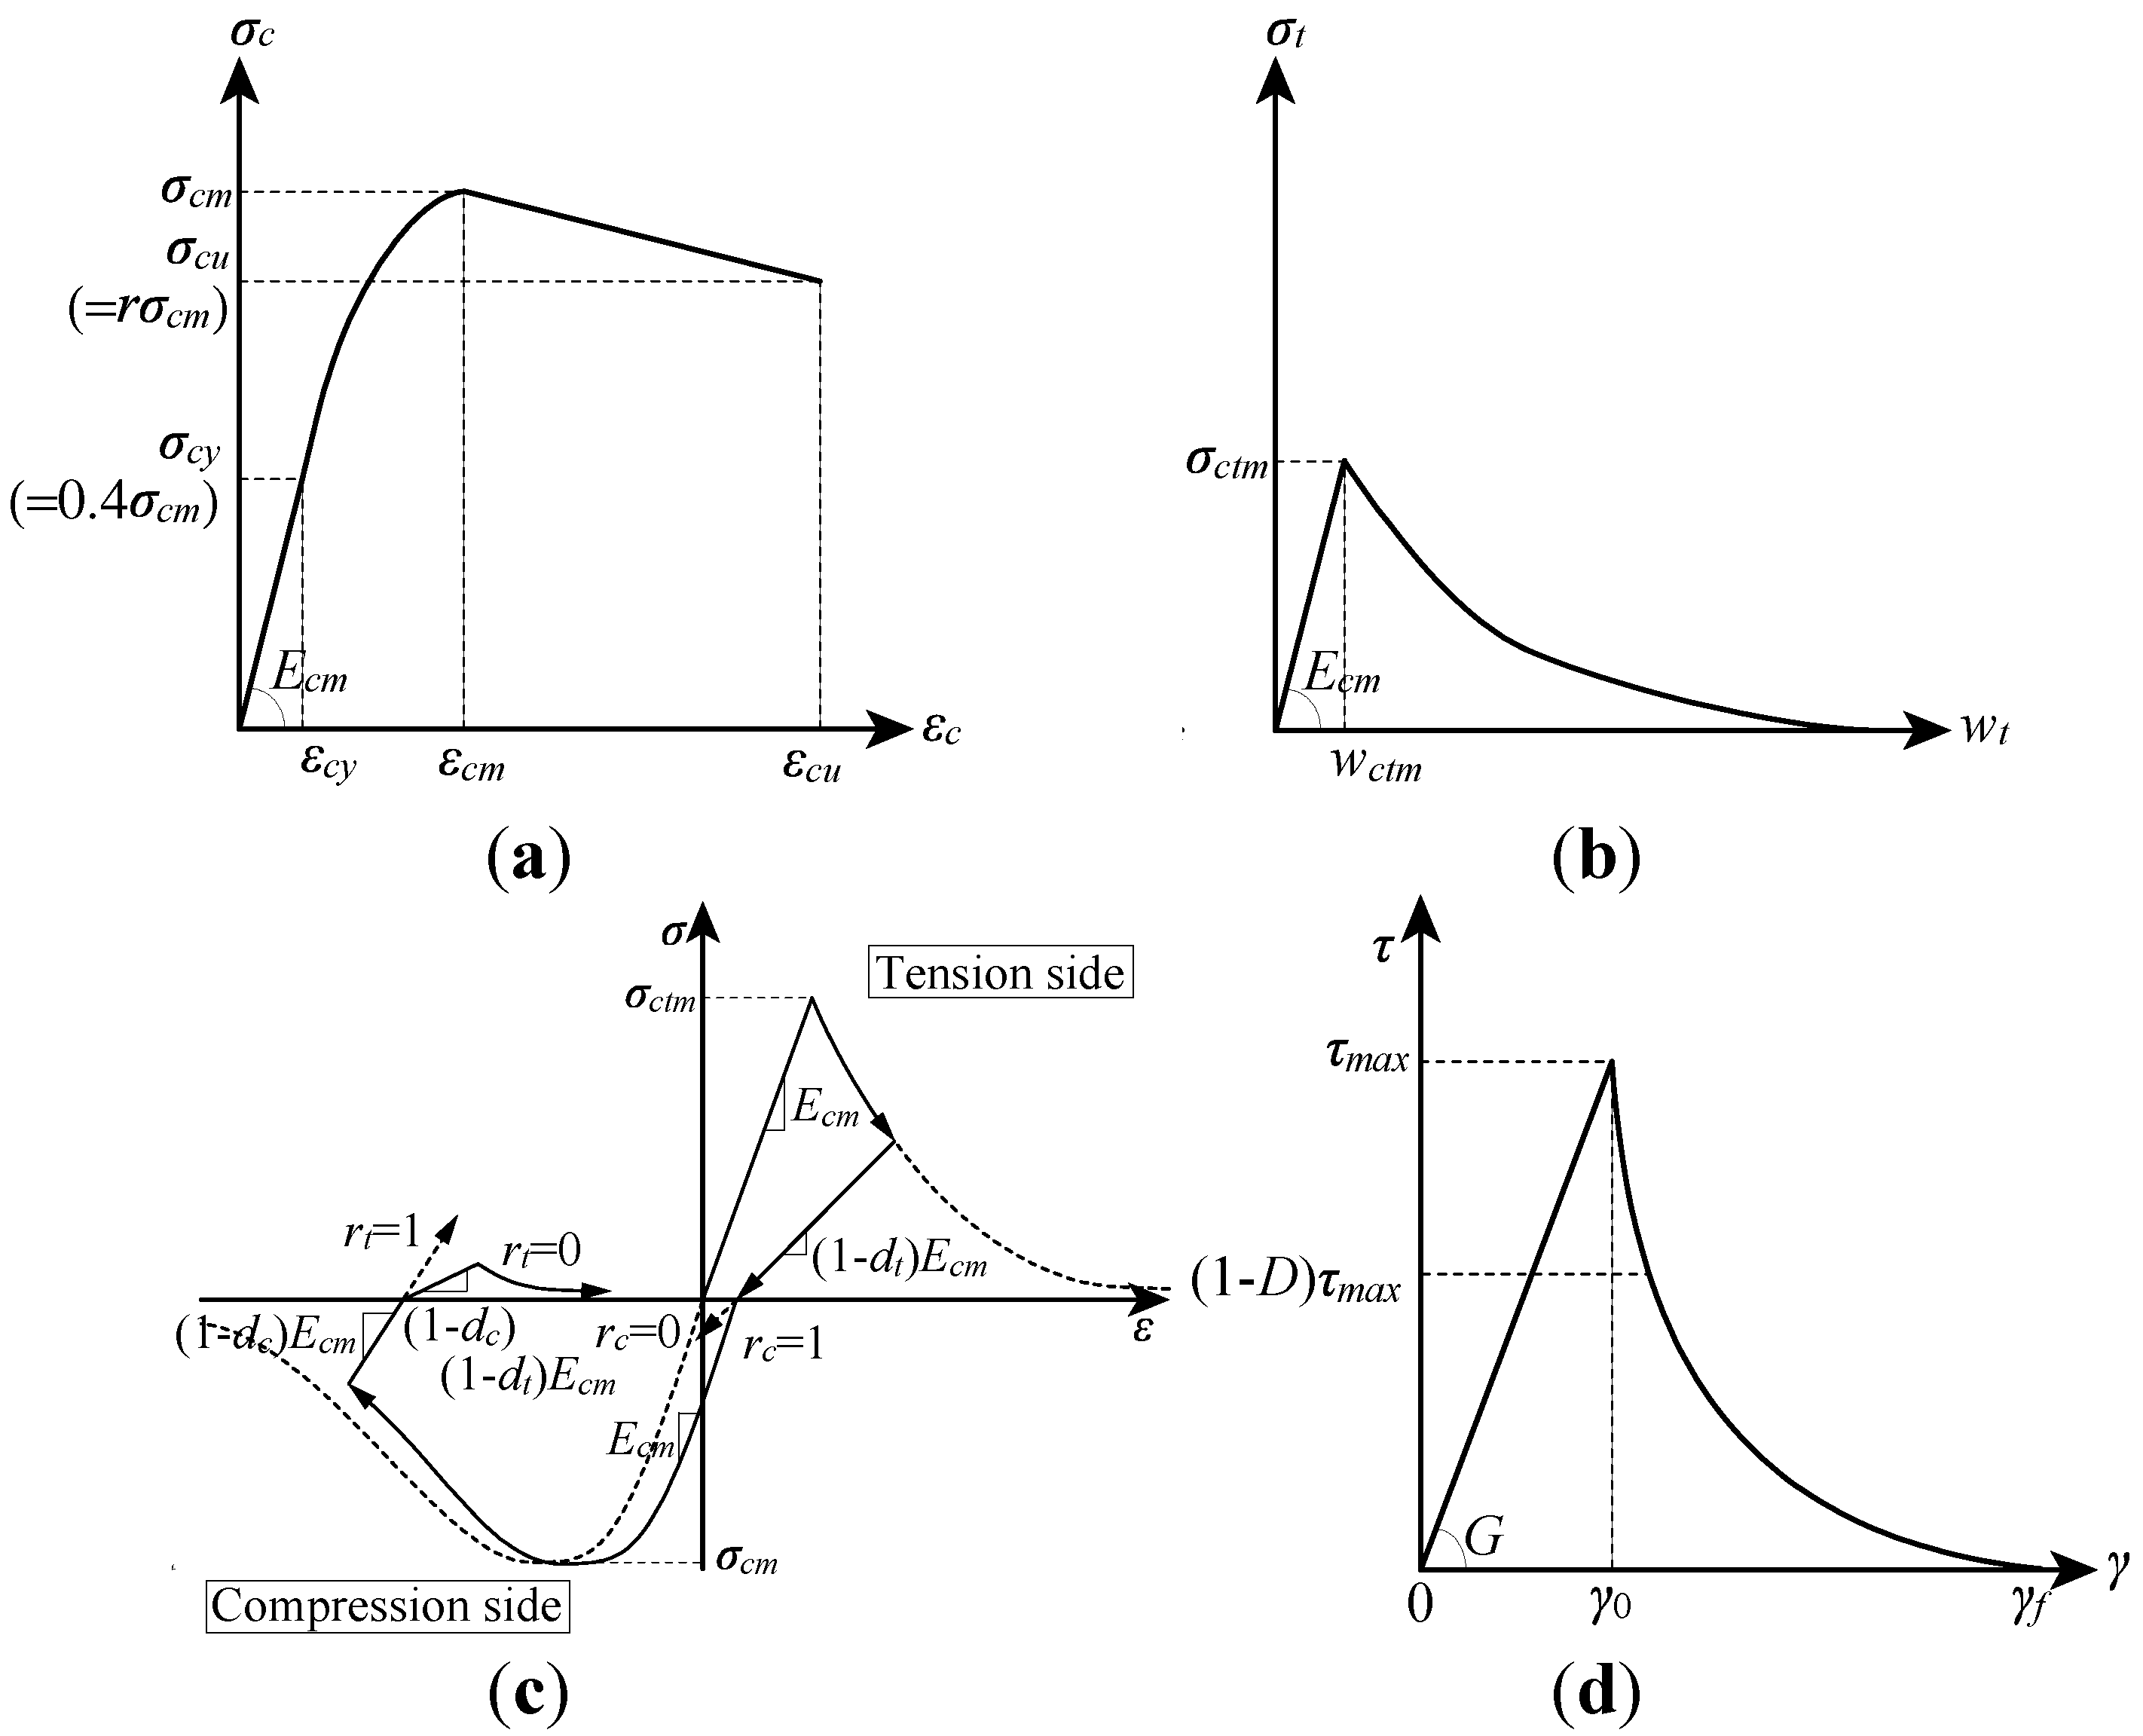
Figure 5(a), (b), and (c) respectively present the constitutive law of concrete under compressive, tensile, and cyclic stresses.
The elastic limit was 40% of the maximum strength, as required by Eurocode-4 [32]. The parabolic function from the elastic limit to the maximum strength is presented in Eq. (1). In addition, the strain at the peak strength can be computed using Eq. (2) as
σ c = k ε c / ε c m ε c / ε c m 2 1 + k 2 ε c / ε c m σ c m
ε c m = 0.07 σ c m 0.31 0.28   [ % ]
where σcm denotes the compressive strength of concrete and εcm represents strain at peak strength. An earlier study [33] showed that the strength dropped linearly to 85% of the ultimate strength at ultimate strain σcu=0.01.
The stress–strain relation in the tension side was defined by Eq. (3) in accordance with an earlier study [34]. The tensile strength was computed using Eq. (4) [35]. The fracture energy was calibrated using Eq. (5) [36].
σ t = σ c t m 1 + 0.5 σ c t m G F w t 3
σ c t m = 0.291 × σ c m 0.637
G F = 10 × d m a x 1 / 3 × σ c m 1 / 3
In those equations, σt stands for the tensile strength of concrete, wt expresses the crack width, σctm denotes the ultimate tensile strength, GF symbolizes the fracture energy, and dmax signifies the maximum size of the aggregate.
Figure 5(c) depicts the stiffness recovery of the unloading and reloading phases. The degree of stiffness degradation was determined by damage factors dc and dt. An earlier study [37] used the following equations for considering the constraint by the steel members. The present study therefore applies the identical equation.
d t = 1.24 k t σ c t m w t   ( 0.99 )
d c = k c i ε c 1 + ε c / ε 0 n n ( ε c 0.0184 ) 0.3485   ( ε c > 0.0184 )
In those equations, the constants kci, ε0, n, and kt are given respectively as 155, 0.0035, 1.08, and 386 N/mm2/m in accordance with an earlier report [37].

2.2.3. Constitutive law of cohesion element

Figure 5(d) presents the constitutive law of the cohesion element. The shear stress–strain relation was constructed based on earlier experimentally obtained results [38]. The shear stiffness G was calibrated using Eq. (8). The damage function D governing strength deterioration was computed using Eq. (9). The ultimate shear strength τmax was calculated using Eq. (10).
G = 43.0 × ω / ω r × σ c m / σ c m , r 1 / 3
D = γ γ 0 γ f γ 0
τ m a x = σ c m 3
Therein, ω represents the concrete weight in unit volume, ωr denotes the concrete weight in unit volume of reference case (=24 kN/m3), σcm,r expresses the concrete strength of reference case (=25.9 N/mm2), γ stands for the shear displacement, γ0 signifies the effective displacement at damage initiation, and γf symbolizes the effective displacement at complete failure.

2.2.4. Constitutive law of shear connector and rebar

The stress–strain relation of the shear connector is determined by the combined hardening law with the three backstresses. The hardening parameters were set as identical to those reported from earlier research [39,40,41,42,43,44,45] because the same type of steel was used for this study.

2.2.5. Finite element analysis results and piezoelectric sensor positions

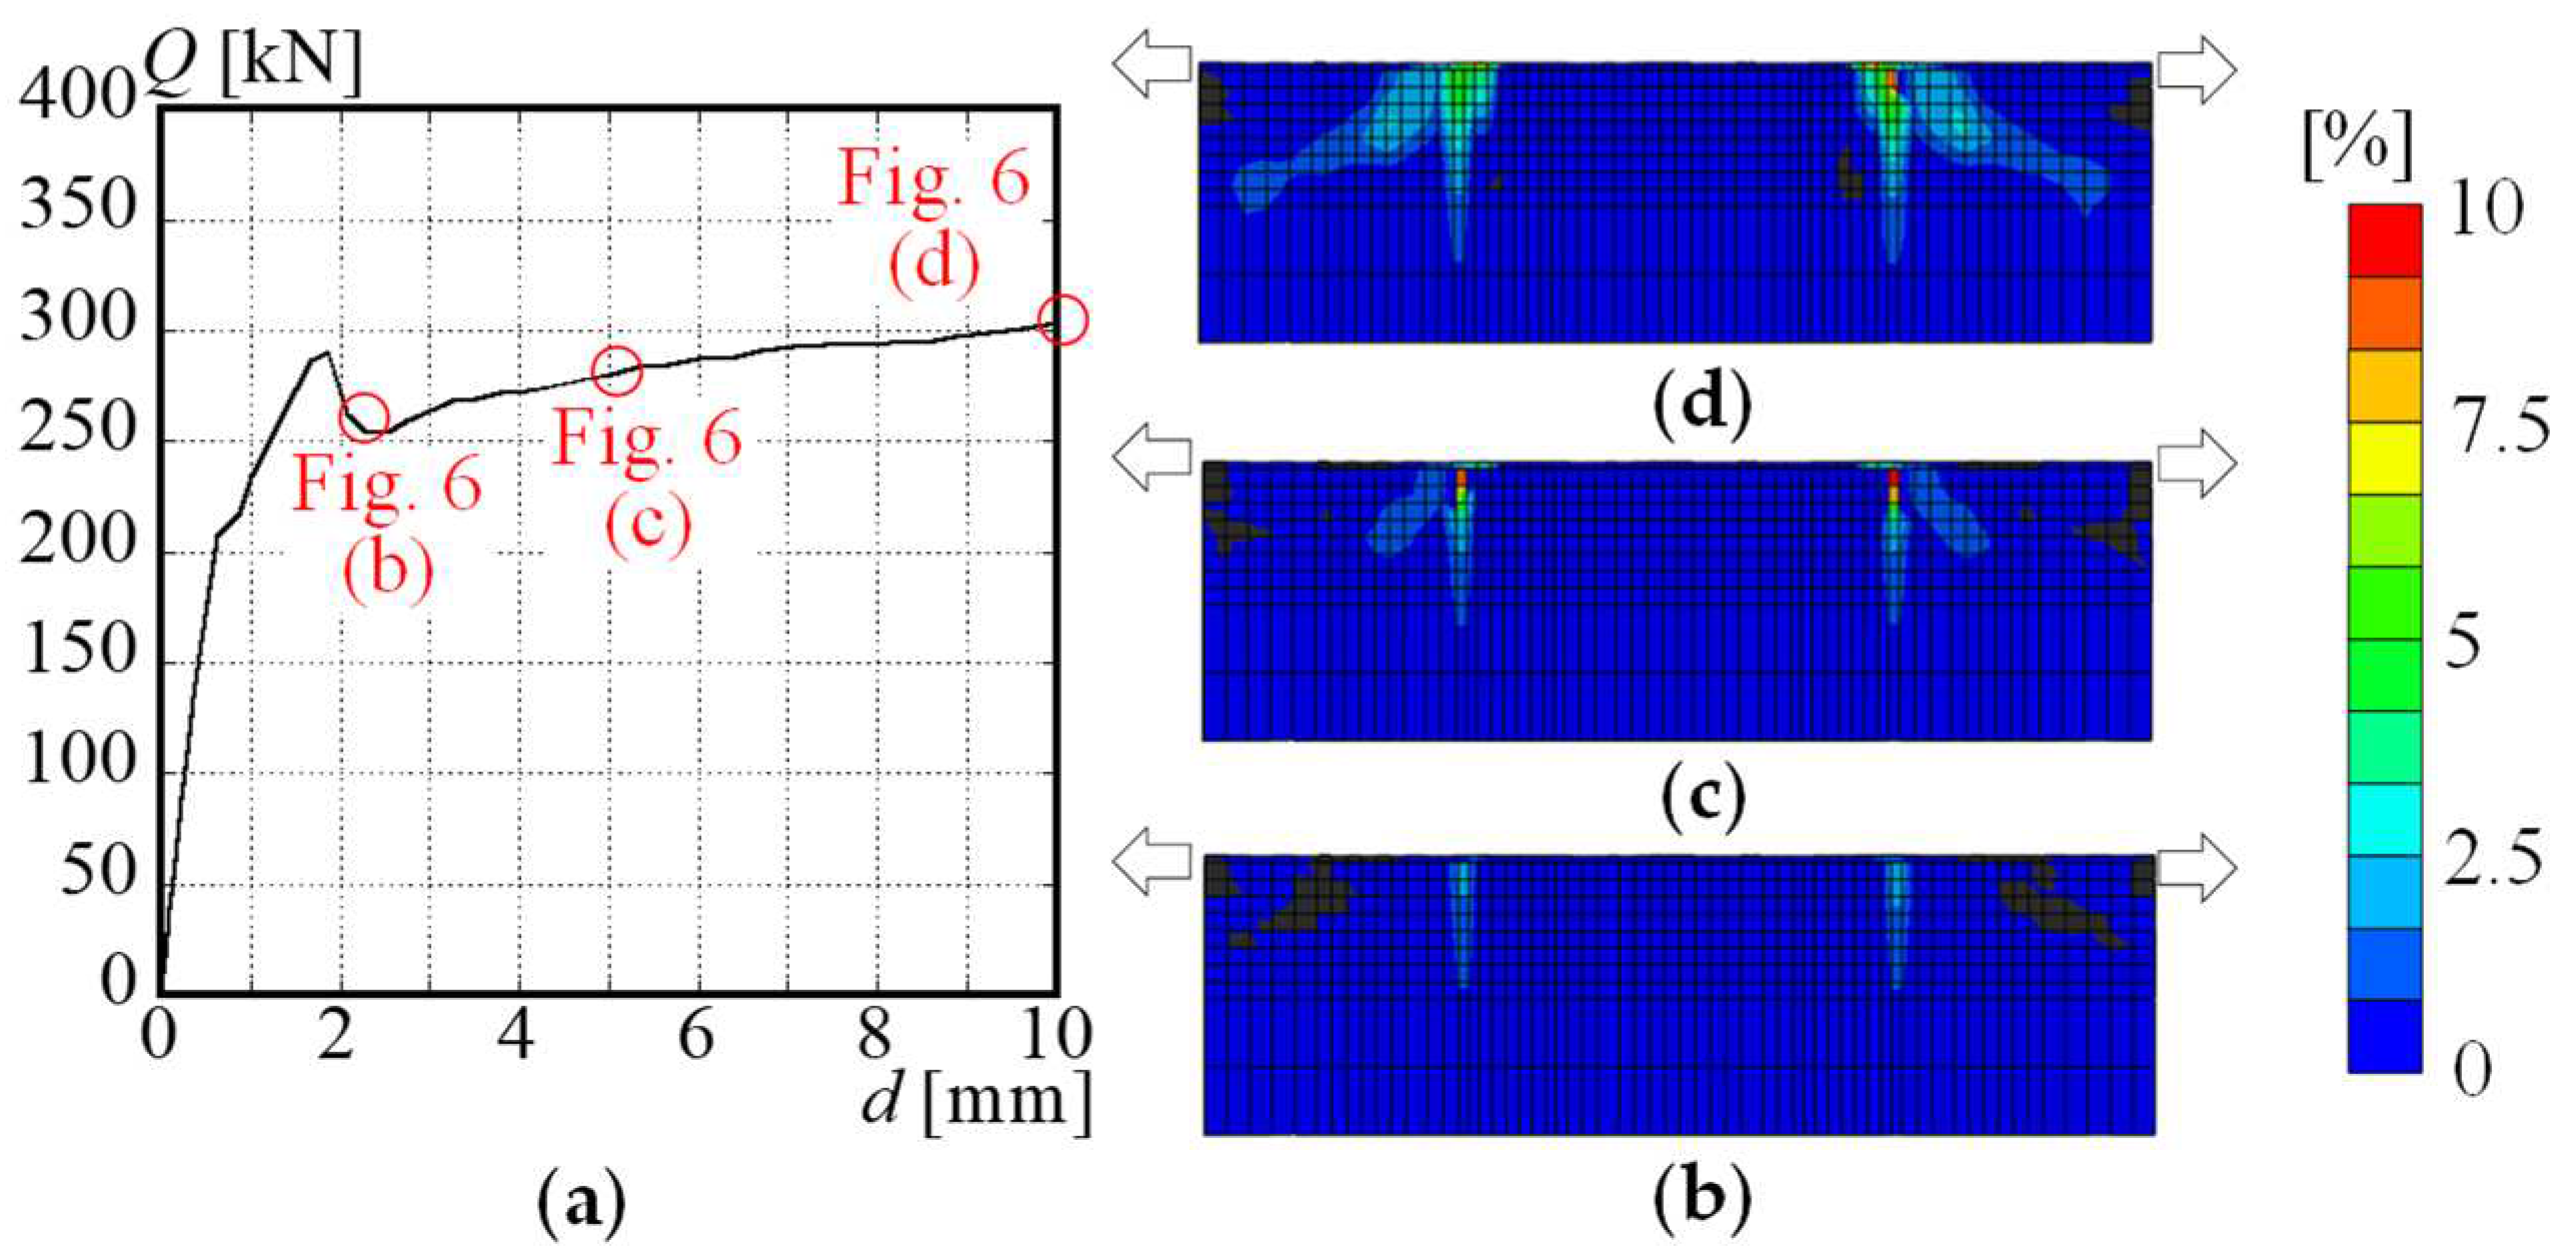
Figure 6 presents an illustration of the load–displacement relation and crack propagation. In Figure 6, the shear force once dropped at around d=1.9 mm. This reduction derived from crack initiation at the embedded position of the shear connector. The plastic tensile strain distribution is presented in Figure 6(b)–(d). The crack propagated toward the transversal direction. However, the shear force recovered gradually using the stress transfer to the reinforcement. The damage spread with the increase in the loading amplitude (Figure 6(c)), after which the damage further propagated diagonally (Figure 6(d)). The observation presented in Figure 6 confirms that the damage should be detected aside from the embedded positions of the shear connectors.
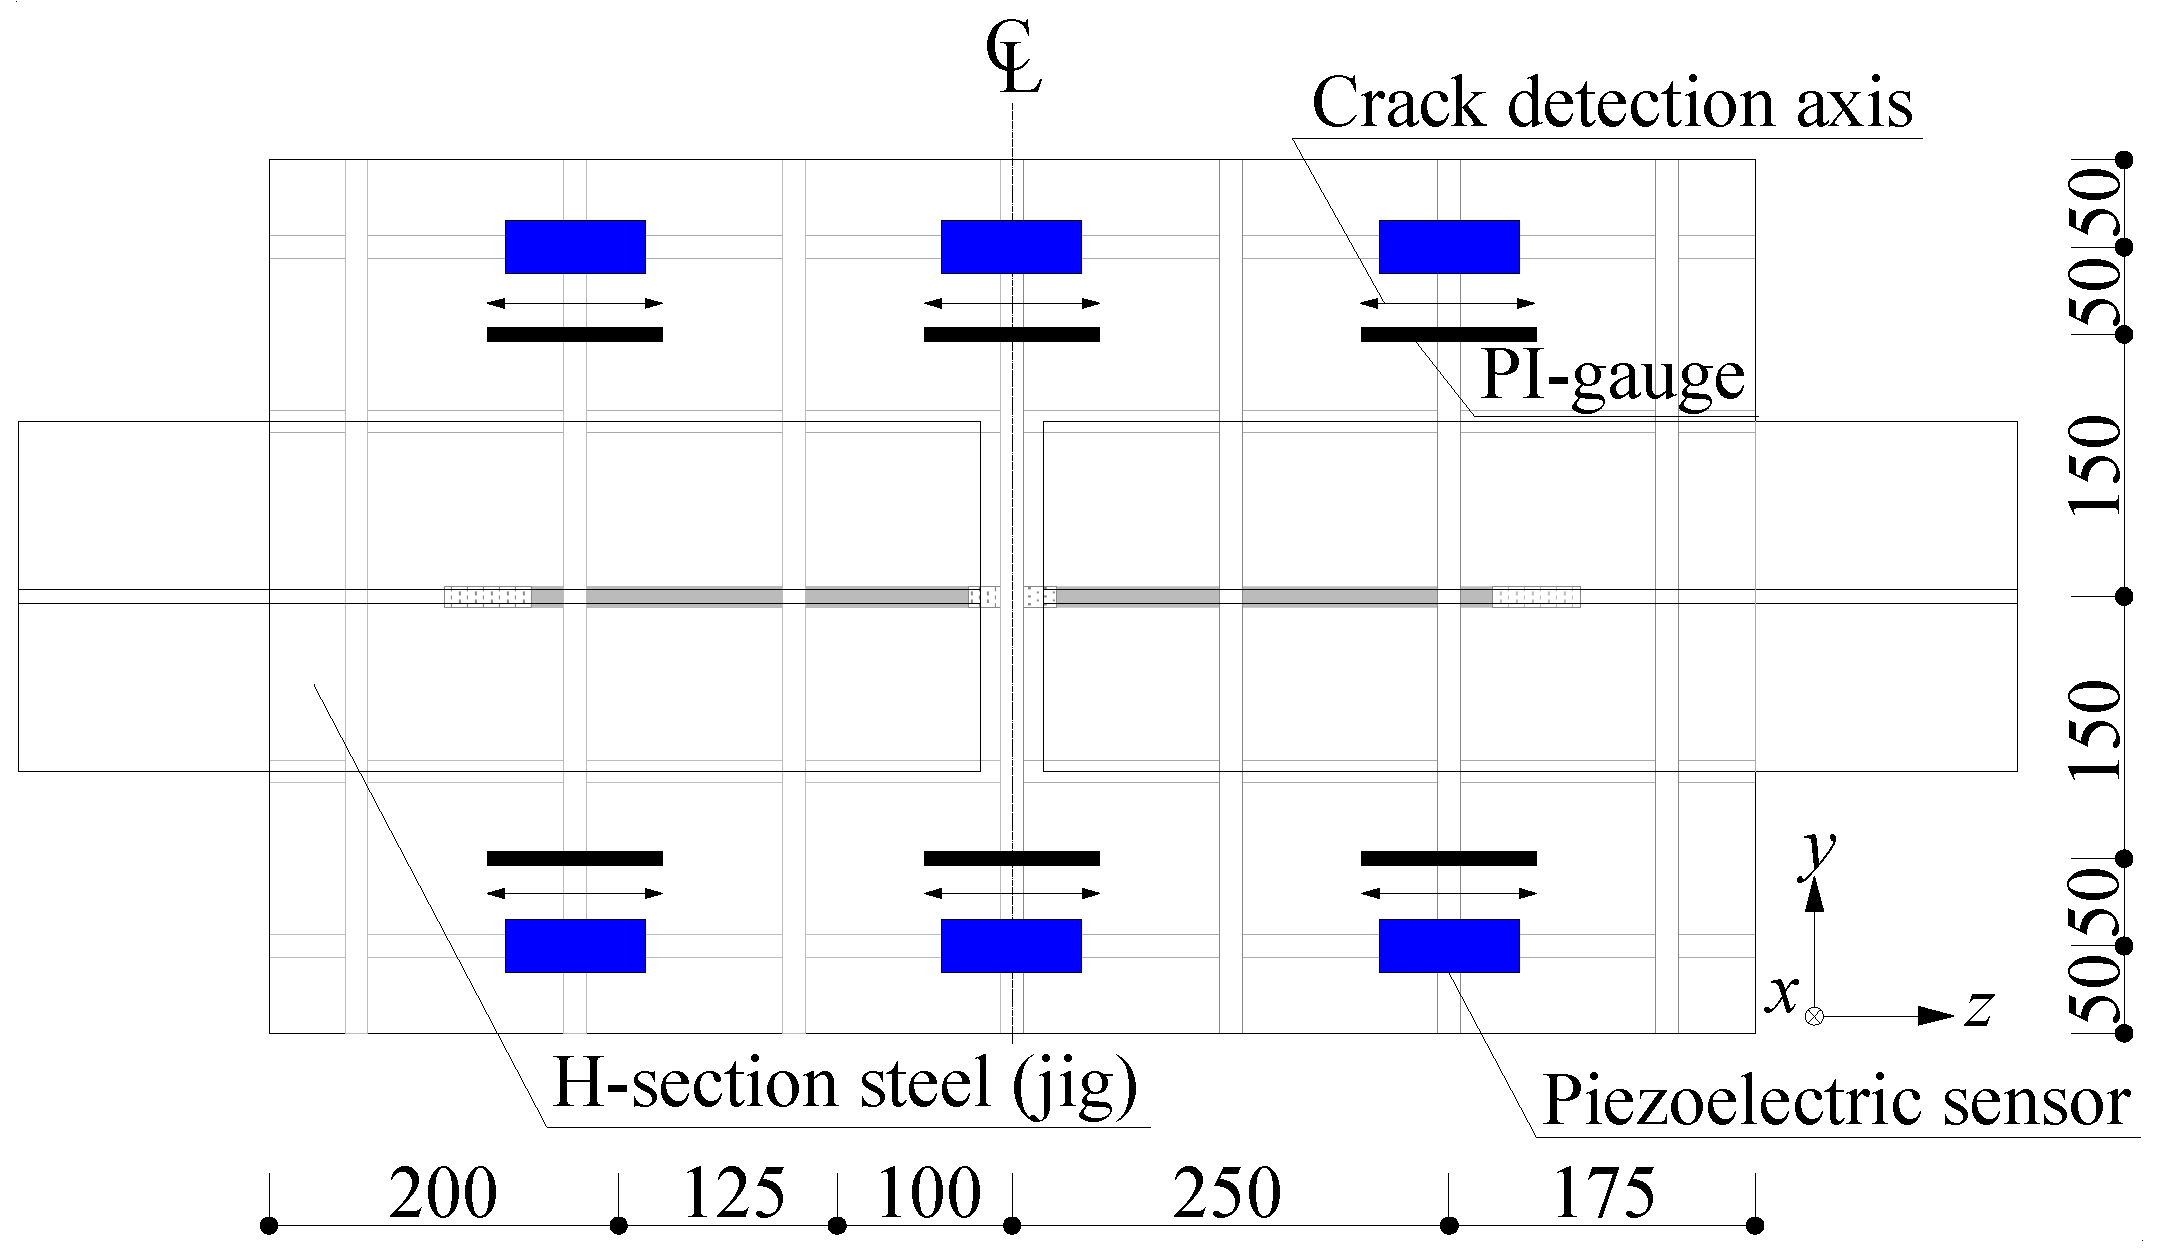
Based on the observations presented above, this study determined the piezoelectric sensor installation position, as presented in Figure 7. The six piezoelectric sensors were attached to capture the tensile cracks. In addition, the PI gauges are set beside the piezoelectric sensors to ascertain the damage detection sensitivity. For the installation, the concrete slab surface was ground; the sensor was glued rigidly. During loading tests, the sensor was not peeled up to the final loading cycle.

2.3. Results of experiments and damage detection

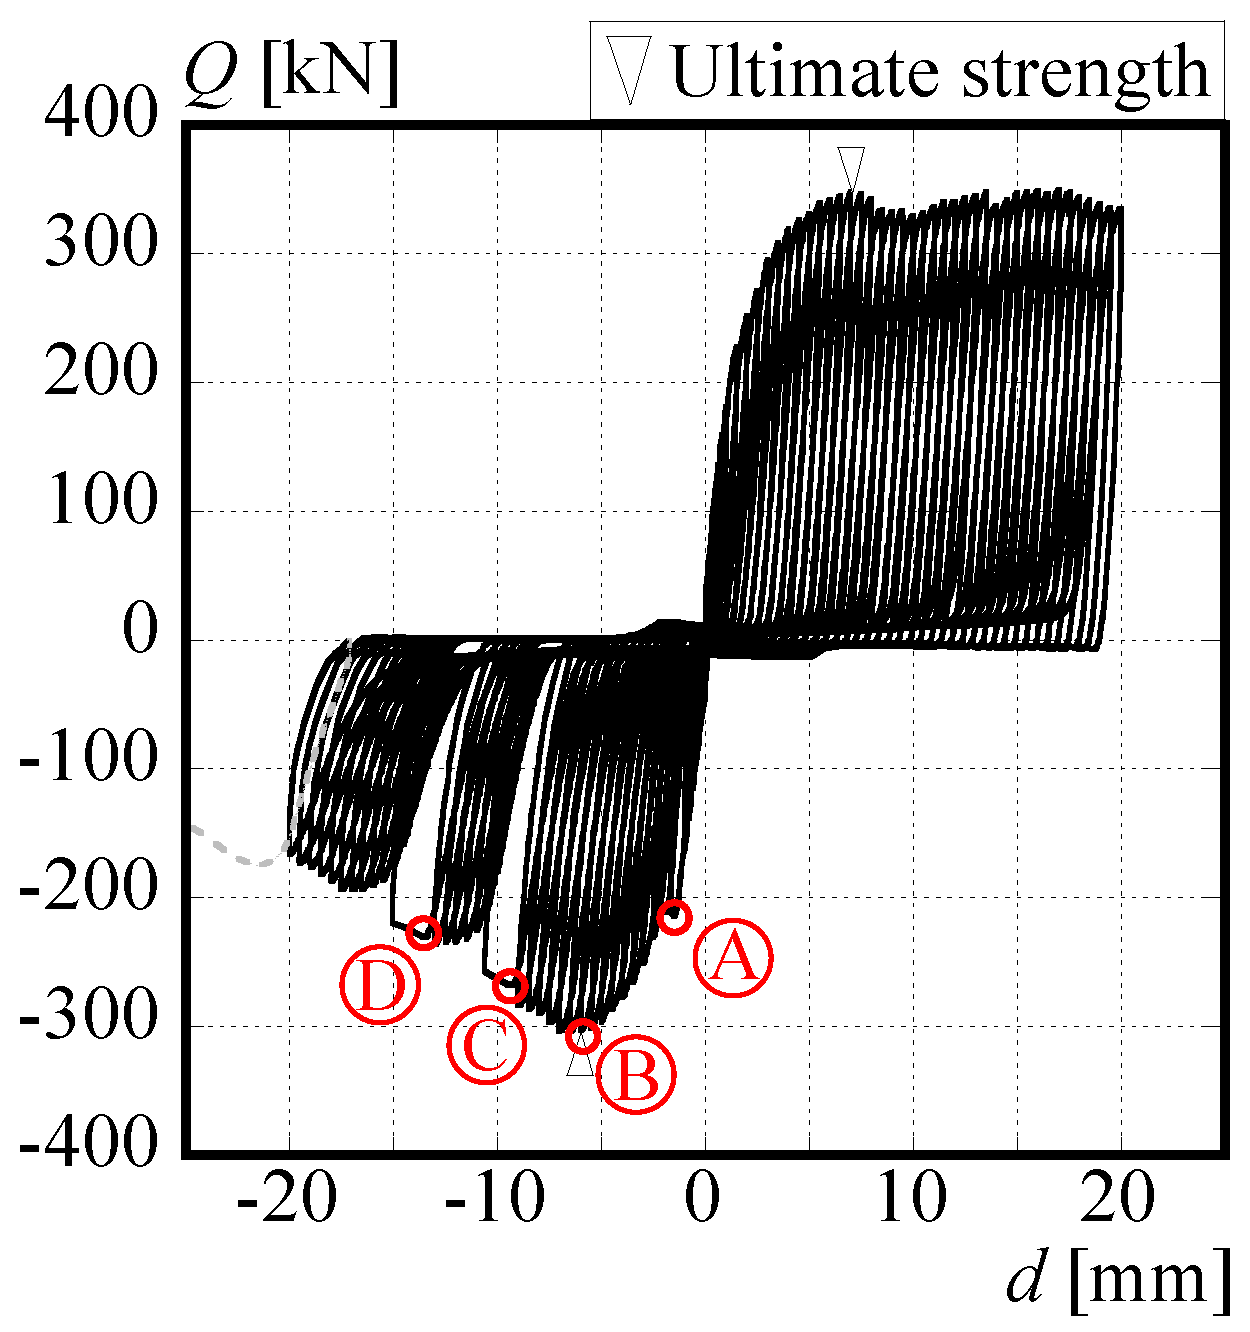
Figure 8 presents an illustration of the experimentally obtained result. Although the hysteresis was stable on the compression (positive) side, the strength deterioration and rapid displacement enlargement occurred several times. The first crack initiation was detected at d= -1.4 mm (point A). Figure 9 displays the fracture process. Although it is noticeable in the load–displacement relation, the cracks are not visible in Figure 9(a). This finding corroborates that visual inspection alone presents some difficulty in identifying the concrete damage. The peak strength was performed at d=-6.0 mm (point B). The strength degraded gradually during subsequent loading cycles. The transversal damage is visible at this stage in Figure 9(b). Furthermore, rapid strength degradation occurred at around d=-10.0 mm (point C) and d=-13.5 mm (point D).
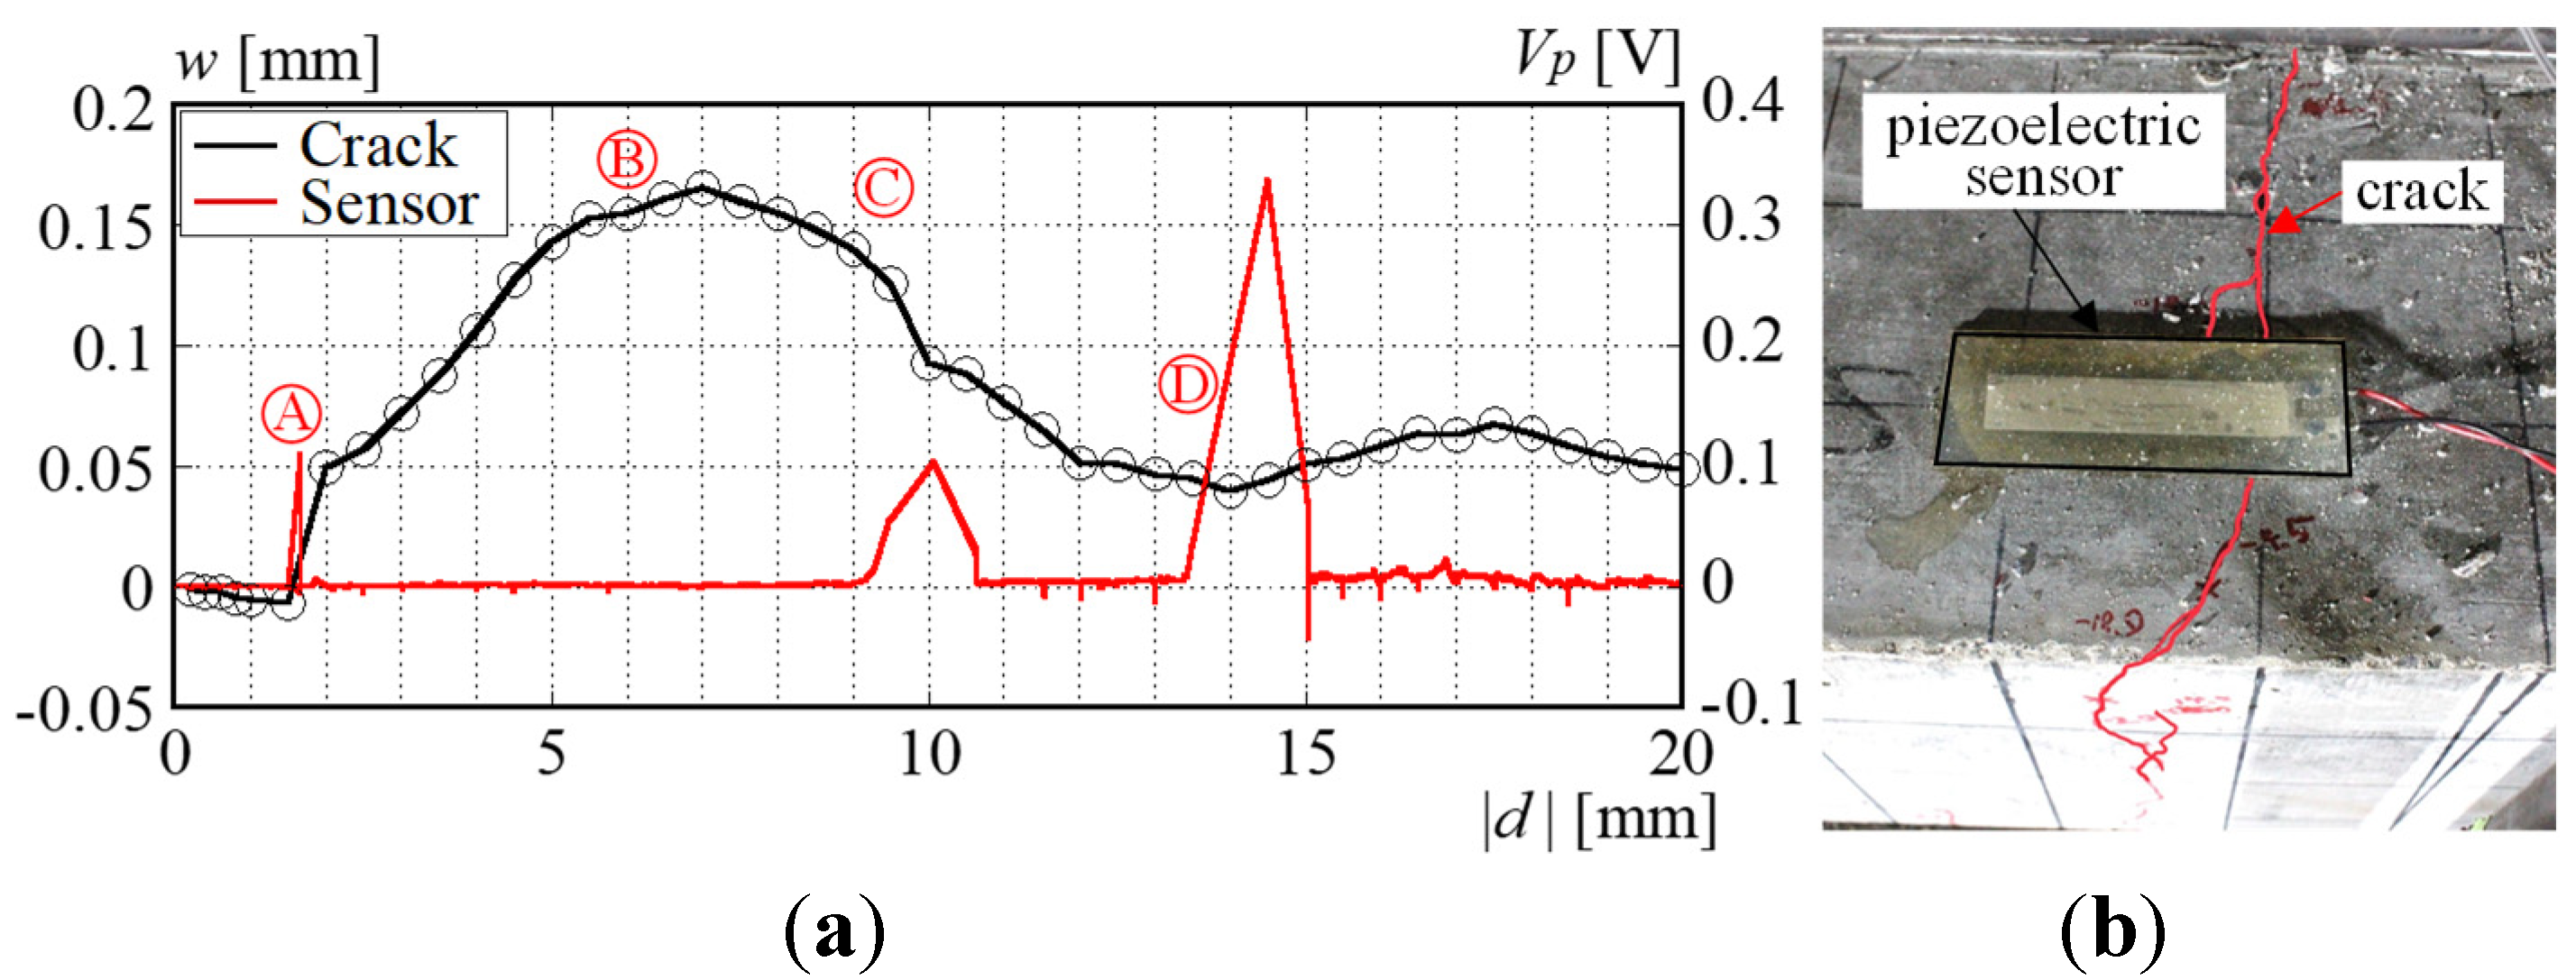
Figure 10 shows the crack width wc transition and the piezoelectric sensor output Vp. The horizontal axis is the absolute value of the loading amplitude. The skeleton part of the hysteresis curve on the negative side is extracted. In addition, Figure 10(b) demonstrates that the sensor position appropriately captures the tensile crack, thereby penetrating the sensor transversally. The piezoelectric sensor output is significant at |d|=1.6 mm (point A), 10.0 mm (point C), and 14.5 mm (point D). In Figure 10, the crack width suddenly increases at point A and hits its peak near the ultimate shear strength (point B). During the subsequent loading cycle, the damage concentrates on the corresponding part. At point D, the position concerned becomes the origin of further damage. Consequently, the crack expands again, developing the prominent sensor output.
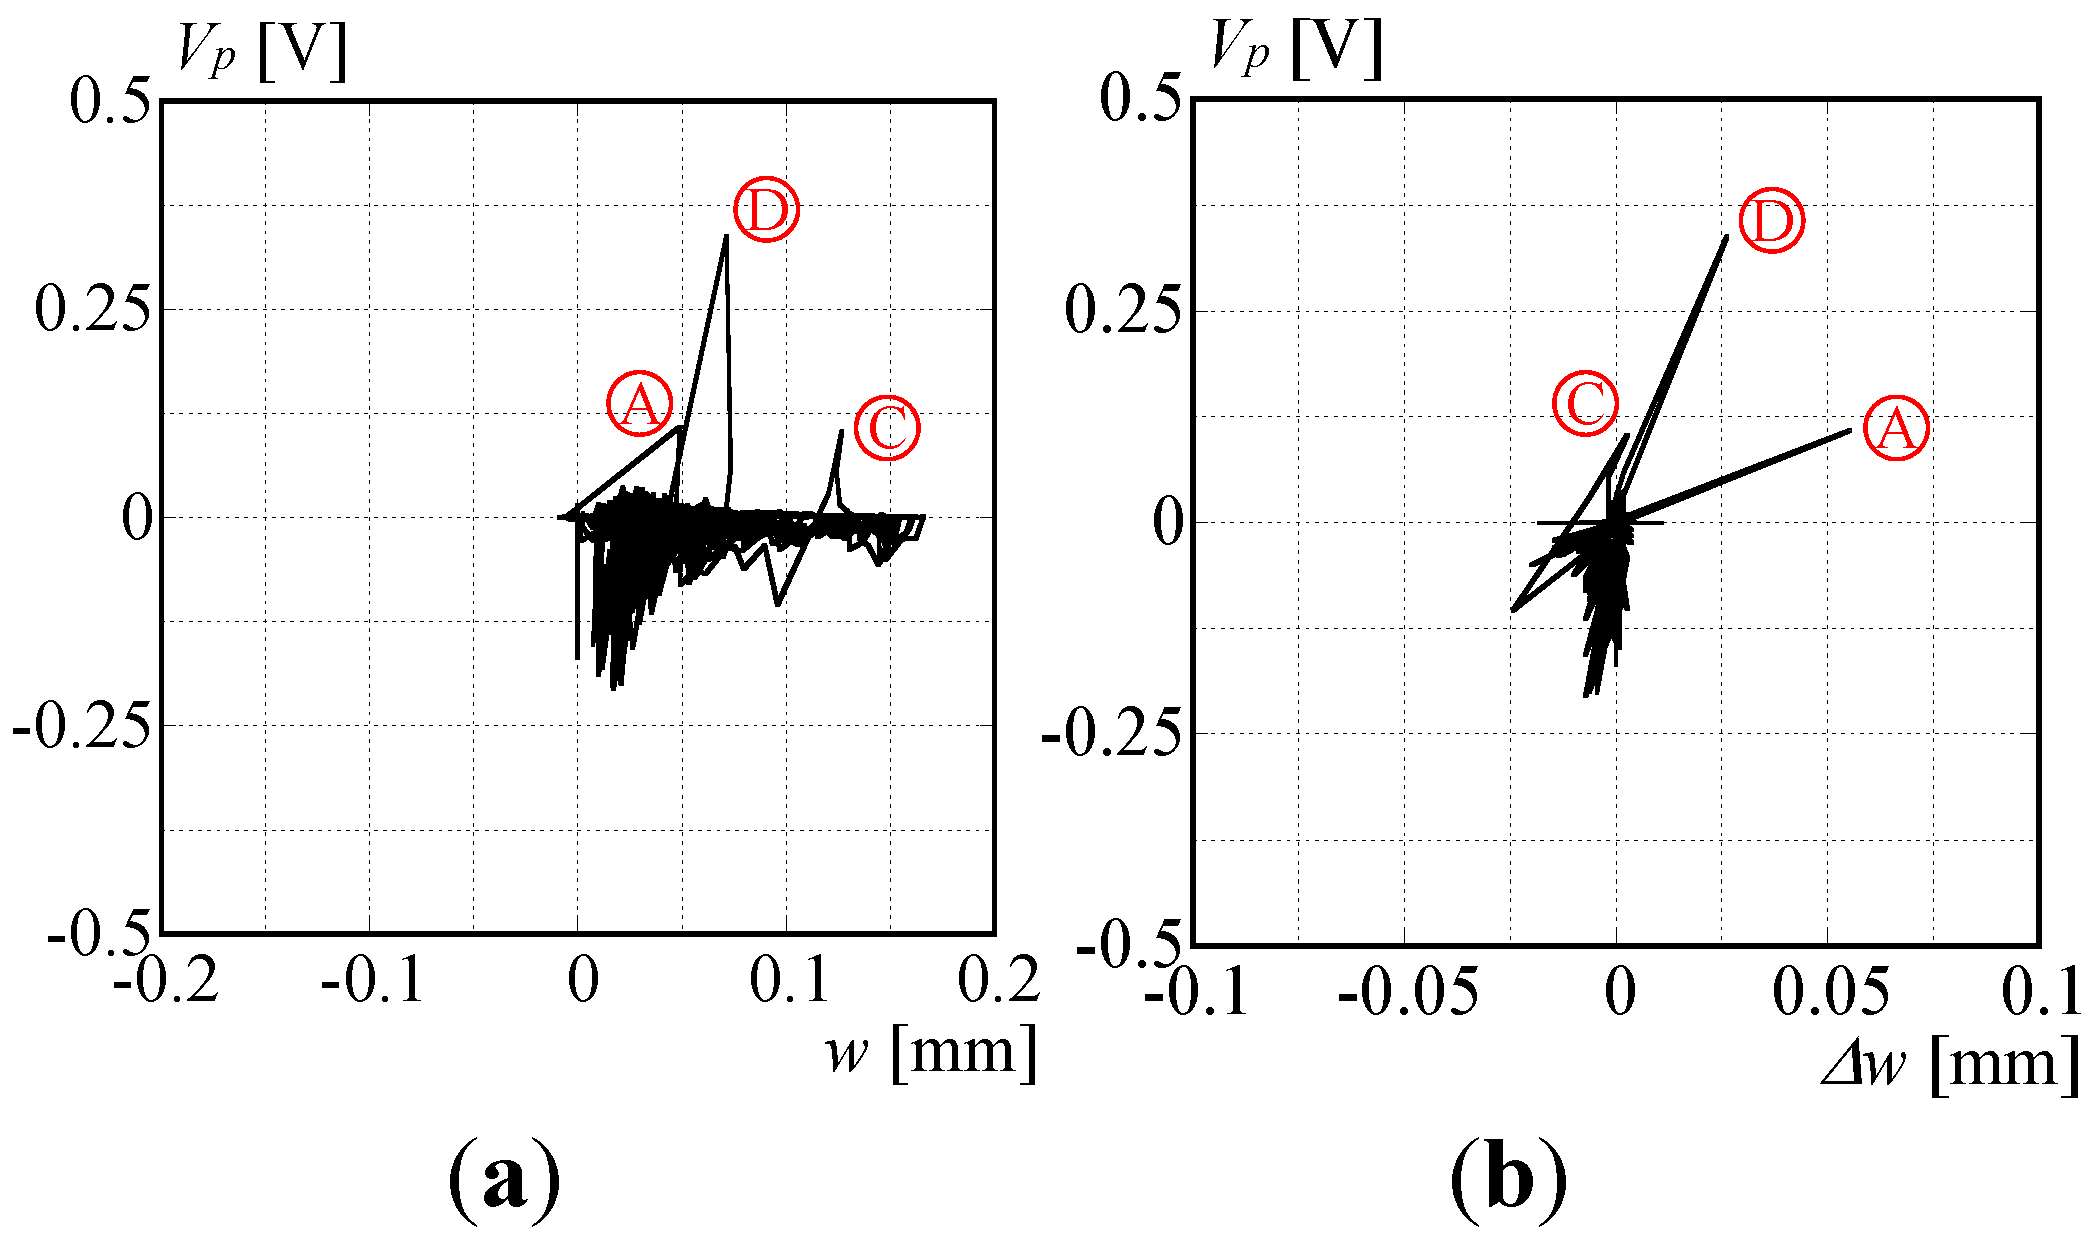
To deepen our understanding of piezoelectric sensor behavior, the relation between crack width and sensor output is presented directly for comparison in Figure 11. In Figure 11(a), the reaction of the piezoelectric sensor was arranged by the crack width. As one might expect, the apparent relation is not visible in the figure. Consequently, the piezoelectric sensor does not provide data related to the degree of concrete damage in the current measurement system. Instead, if the sensor output is arranged by the rate of crack expansion, the relation becomes much more apparent. This outcome corroborates that the piezoelectric sensor is helpful for detecting the damage origin. In future research, the method to convert the sensor output into the crack width will be calibrated, referring to an earlier investigation [8]. Therefore, this is a promising method of replacing the ordinary measurement scheme using strain or PI gauges.

3. Damage Detection of Folded Roof Plate using Piezoelectric Sensor

3.1. Test setup of cyclic loading test on I-shaped beam with folded roof plate

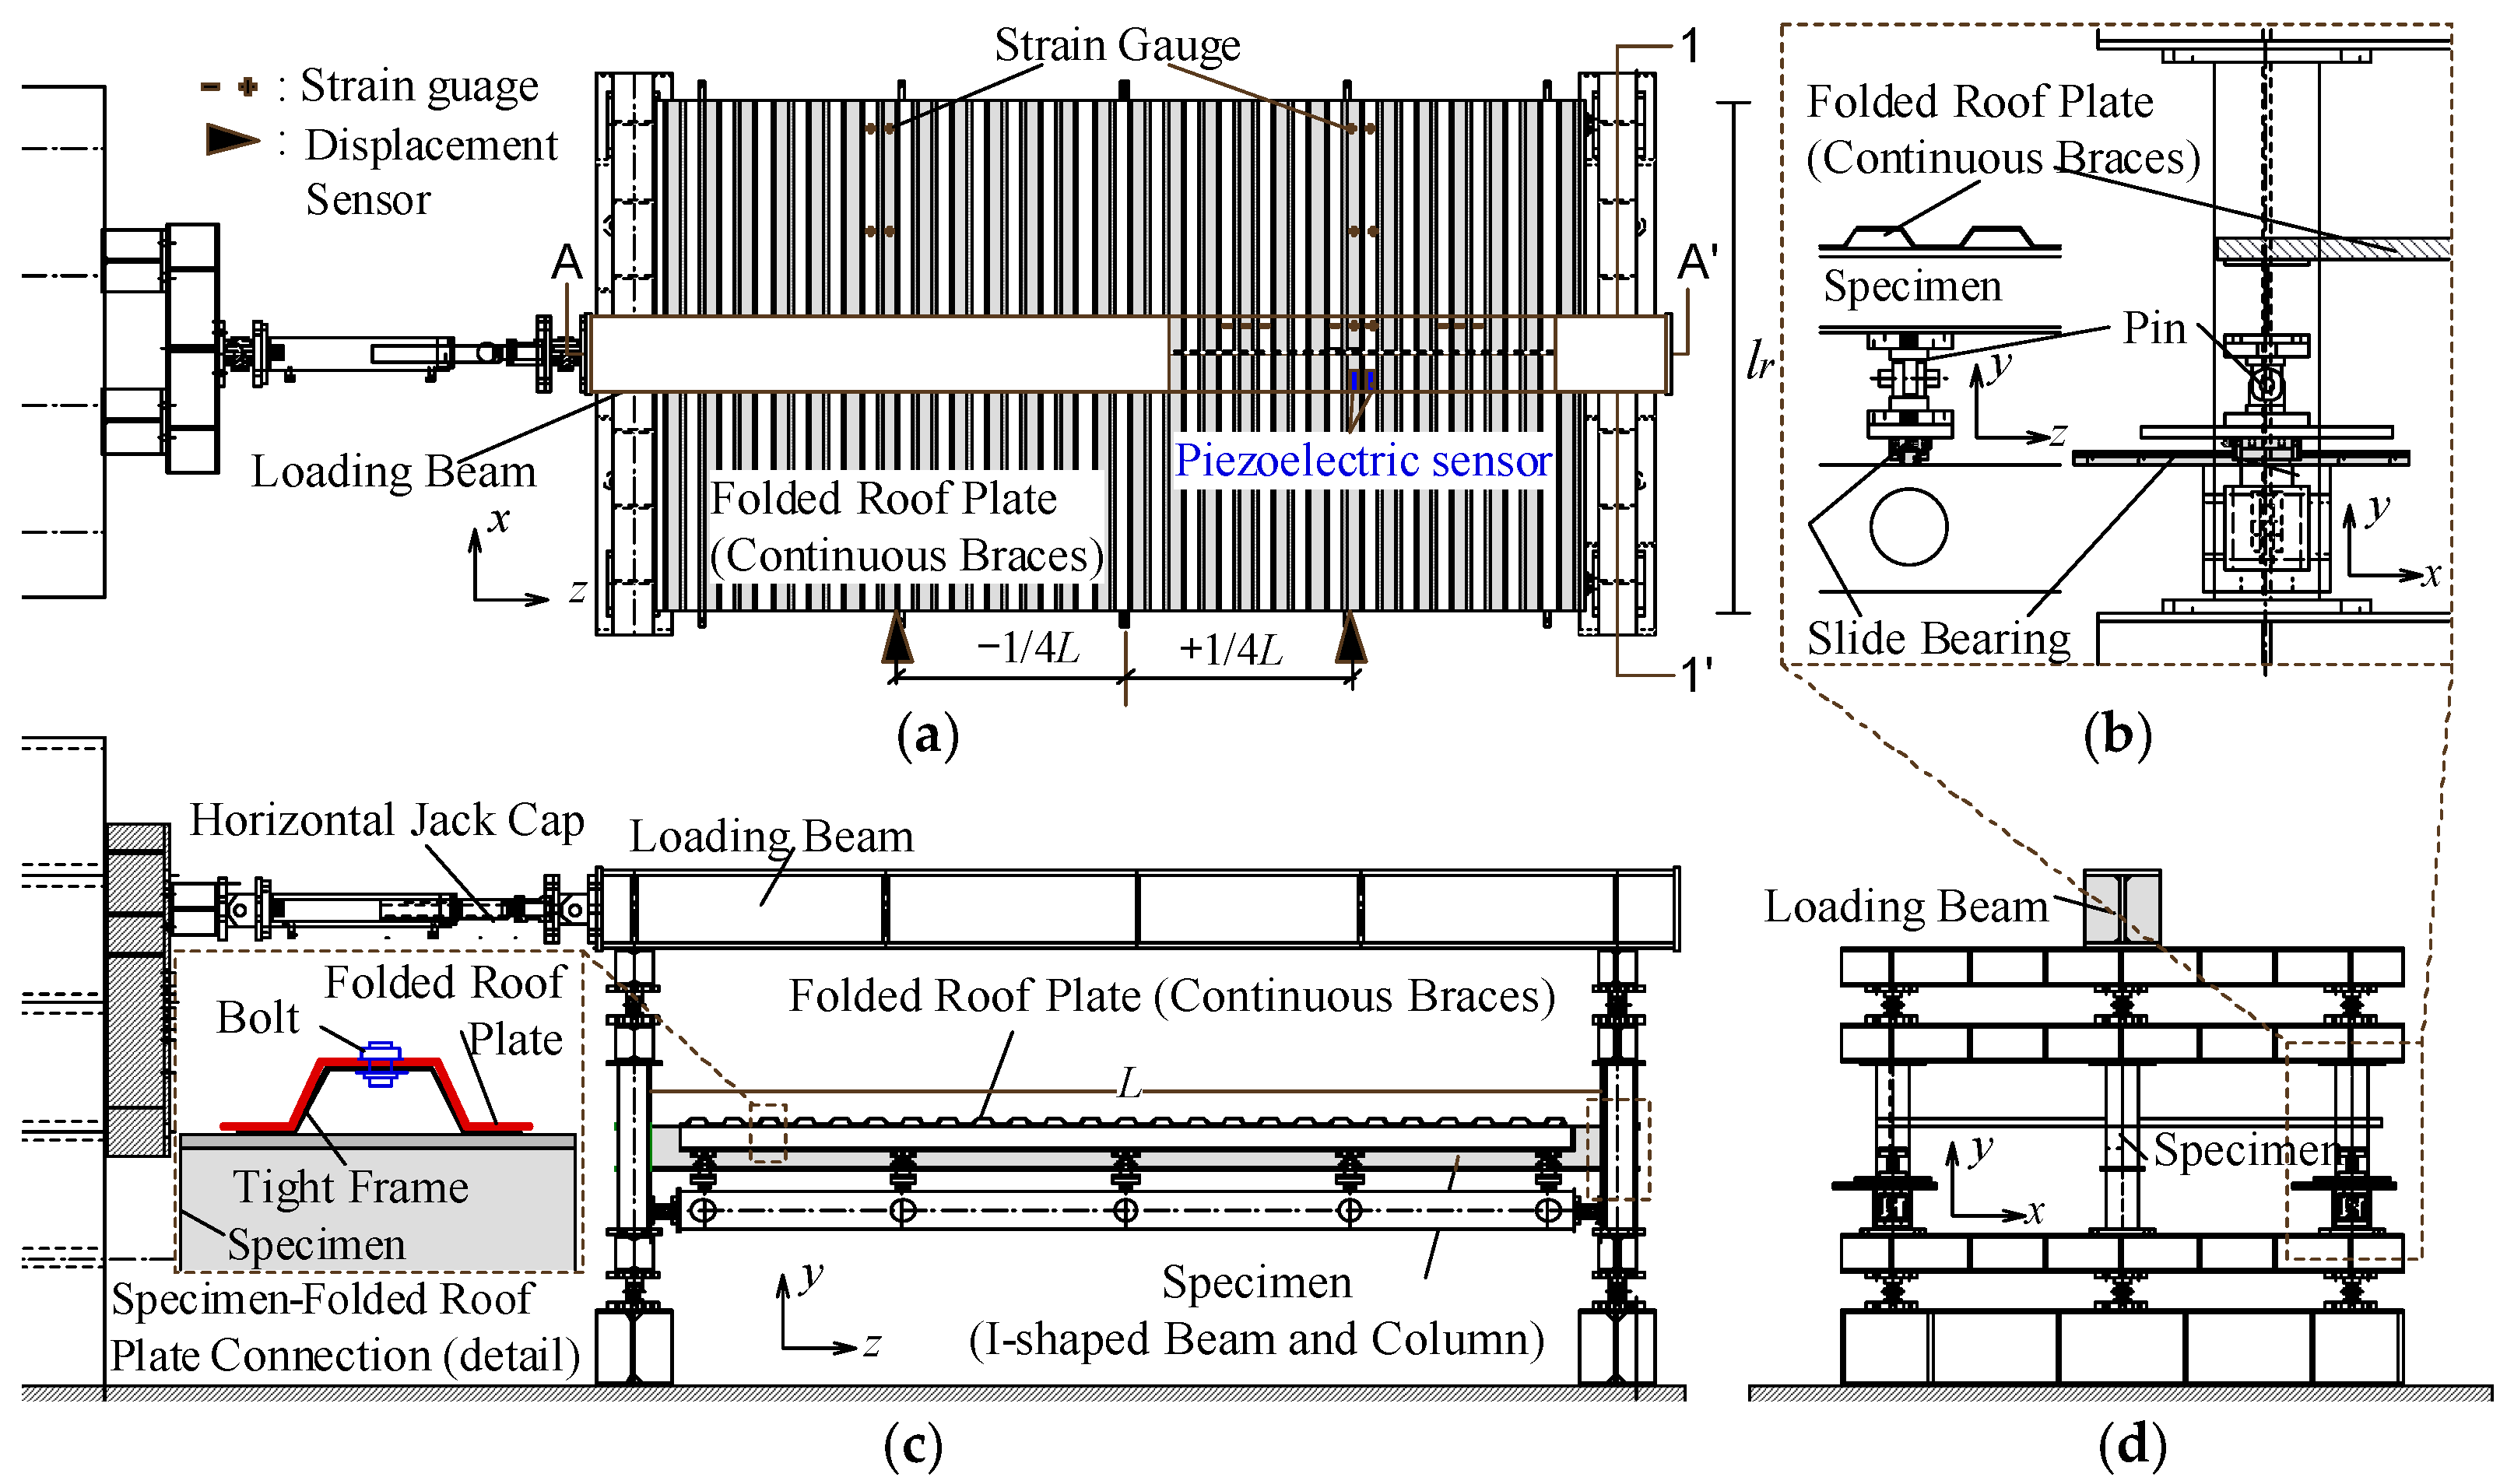
Figure 12 depicts the loading frame and specimen setup. The apparatus was designed in reference to earlier experimentation [46]. The force was imposed on the loading beam through the hydraulic jack. The specimen part, consisting of an I-shaped beam and the folded roof plate, was settled inside the frame. Consequently, the specimen was subjected to non-symmetric bending. In addition, both sides of the folded roof plate were pin-constrained with the slider (Figure 12(b)). Therefore, the folded roof plate does not carry the axial force.
The two specimens had different beam lengths. The beam heights were 250 mm and 200 mm for specimens No. 1 and No. 2. The respective beam widths were 80 mm and 100 mm. The beam lengths were 3675 mm and 3700 mm, with slenderness ratios of 222 and 166. The connection detail between the folded roof plate and the tight frame is presented in Figure 12(c). In conformity with the actual buildings, the folded roof plate was bolted to the tight frame. The tight frame was fillet welded to the flange face. The tight frame had 30 mm width and 3.2 mm thickness. The material test results are presented in Table 5.
The loading amplitude was controlled by the column rotation. The amplitude was standardized by the full plastic rotation angle θp, which serves the beam to reach the full plastic moment Mp,b. The full plastic rotation angle θp is calculable as shown in Eq. (11).
θ p = M p , b L 6 E b I b 1 + I b H 2 I c L
In that equation, Eb stands for the elastic modulus of steel, Ib represents the moment of inertia of beam along the strong axis, Ic denotes the moment of inertial of H-section column, and H stands for the column length. The loading protocol was the gradually increased loading. The target amplitude was enlarged to ±0.5θp, ±1.0θp, ±2.0θp, ±3.0θp, ±4.0θp, ±5.0θp, ±6.0θp.

3.2. Preliminary analysis of folded roof plates and piezoelectric sensor installation

This section describes preliminary analysis of the folded roof plate conducted to ascertain the piezoelectric sensor position. A portion of the folded roof plate was extracted and was subjected to the three-point bending test. The loading point was the middle part of the roof plate. The center part of the specimen was coupled with the reference point. The concentration force was given to the reference point. The loading modeled the flexural moment carried by beam rotation. Then the force was applied monotonically downward.
Figure 13(a) shows the FEA model of a segment of the folded roof plate. The boundary conditions are also presented in Figure 13(a). The analysis used ABAQUS (ver. 2021) with the standard solver package. The loading was force-controlled until strength deterioration employing the originated local buckling. The finer mesh was built around the center part, where the most significant bending moment was carried, to reproduce the buckling behavior accurately.
The constitutive law of the material was a simple bilinear model connecting the lower yield point and the ultimate strength of the material test result. The simulation did not consider fracture because the experiment did not observe it.
Figure 13(b) presents the local buckling deformation. The buckling deformation occurred around the center part, issuing from the bolt hole. When lateral–torsional buckling originates in the I-shaped beam, the folded roof plate is subjected to the rotational moment transferred through the bolt. Ultimately, the folded roof plate starts to buckle. Furthermore, the magnitude of deformation is increased beside the hole. Based on these observations, the sensor location was determined as 100 mm distant from the bolt hole (Figure 12(a)).

3.3. Results of cyclic loading tests and piezoelectric sensor output

Figure 14(a) and (b) show the cyclic loading test results. The horizontal axis is the column rotation. The vertical axis is the applied bending moment. The specimen demonstrates stable spindle-shaped hysteresis. However, with increasing loading amplitude, the beam failed because of lateral buckling, causing gradual strength deterioration. However, it is noteworthy that the structural performance is enhanced considerably compared to that of a bare steel beam. This trend reinforces the inference that the restraint from the folded roof plate improves the structural performance of beams that fail because of lateral buckling.
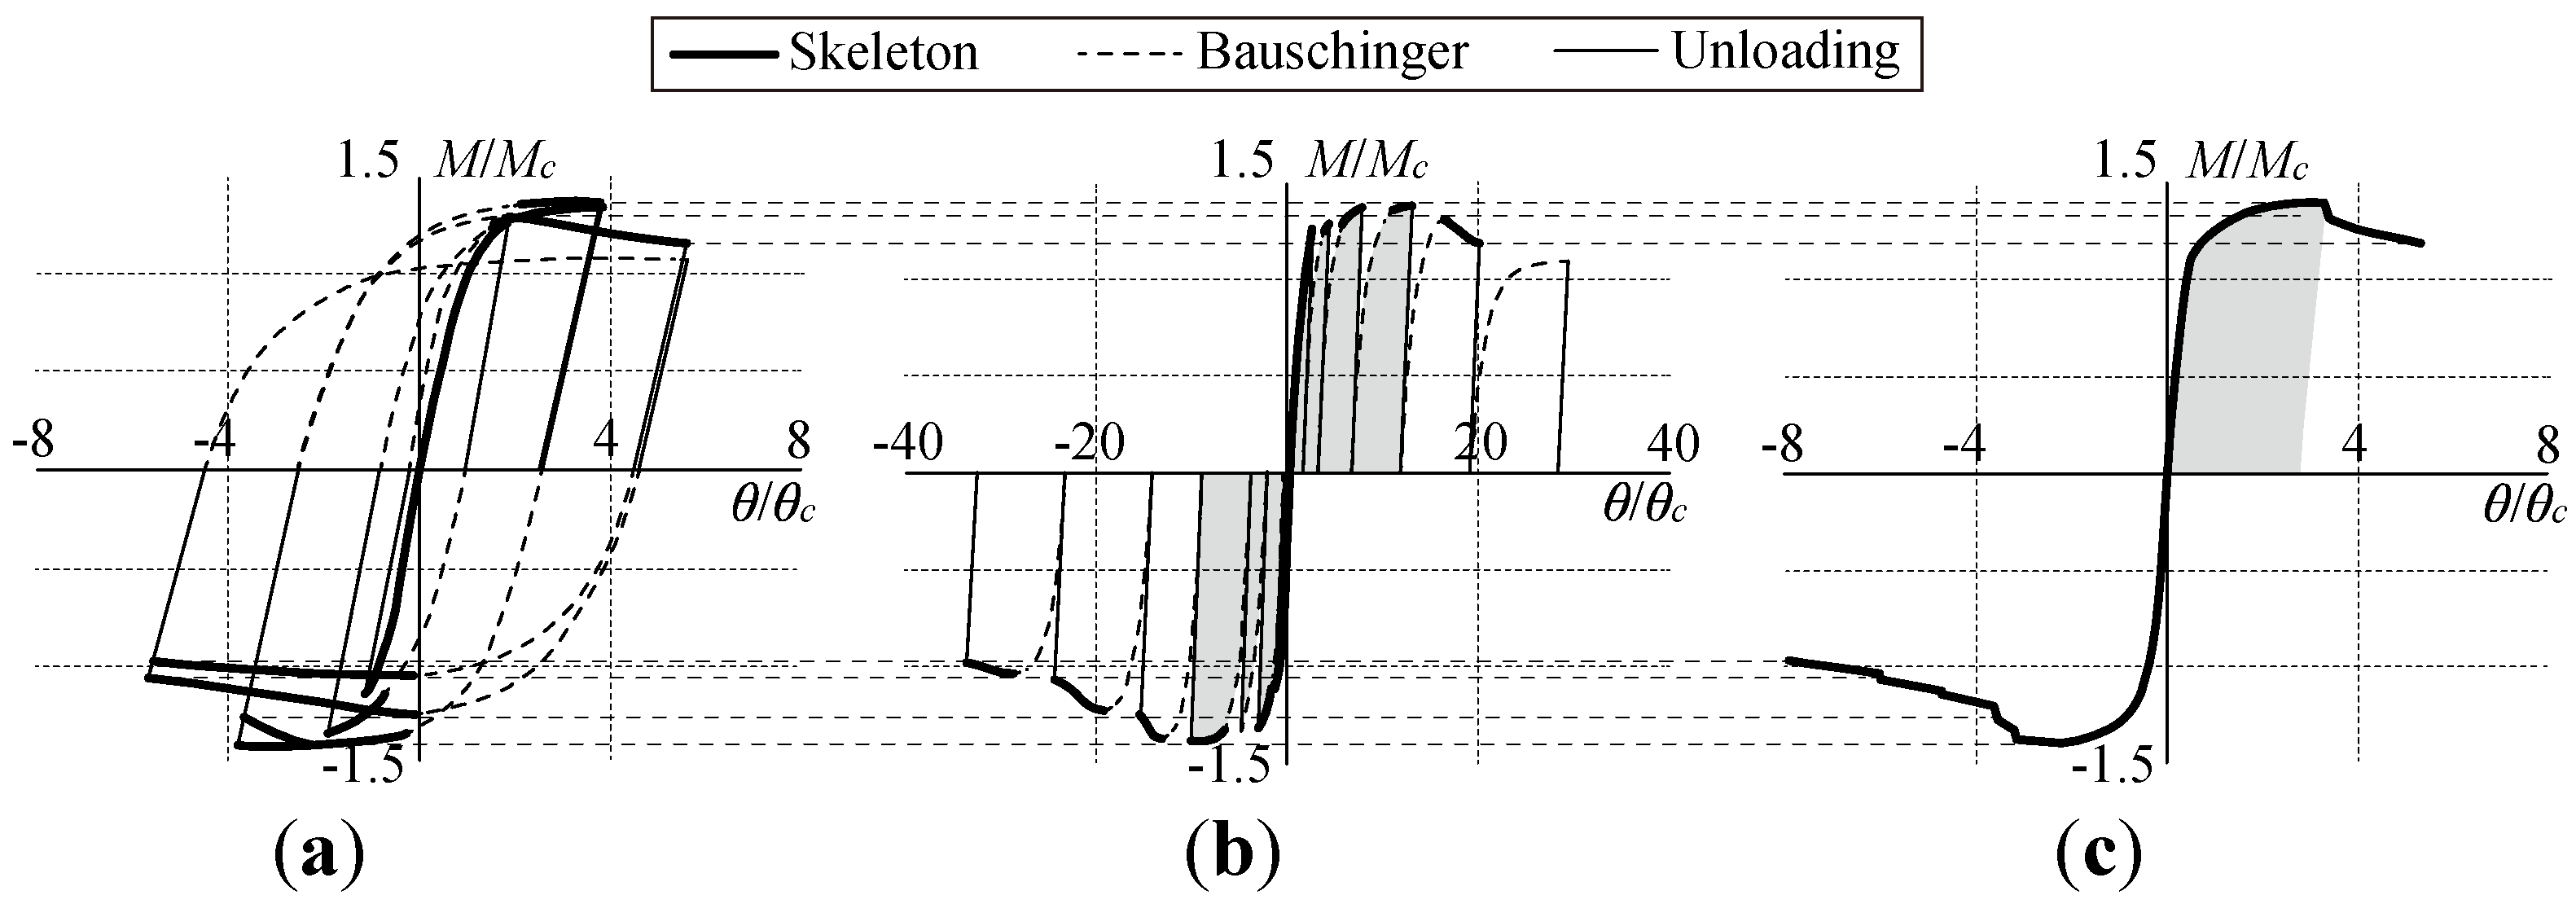
For a better understanding of sensor output, the cyclic hysteresis curve is converted to a skeleton curve. Figure 15 presents the procedure used to draw the skeleton curve. This procedure is identical to that used for earlier research [47]. Figure 15(a) portrays the hysteresis curve, (b) is the cumulative hysteresis curve, and (c) is the skeleton curve. The hysteresis loop of a steel member can be decomposed into the skeleton part (drawn with bold lines), the Bauschinger part (drawn with dashed lines), and the elastic unloading part (drawn with dotted line). The skeleton part is defined as a part in which the steel member experiences stress for the first time. The Bauschinger parts are areas other than the elastic unloading part.
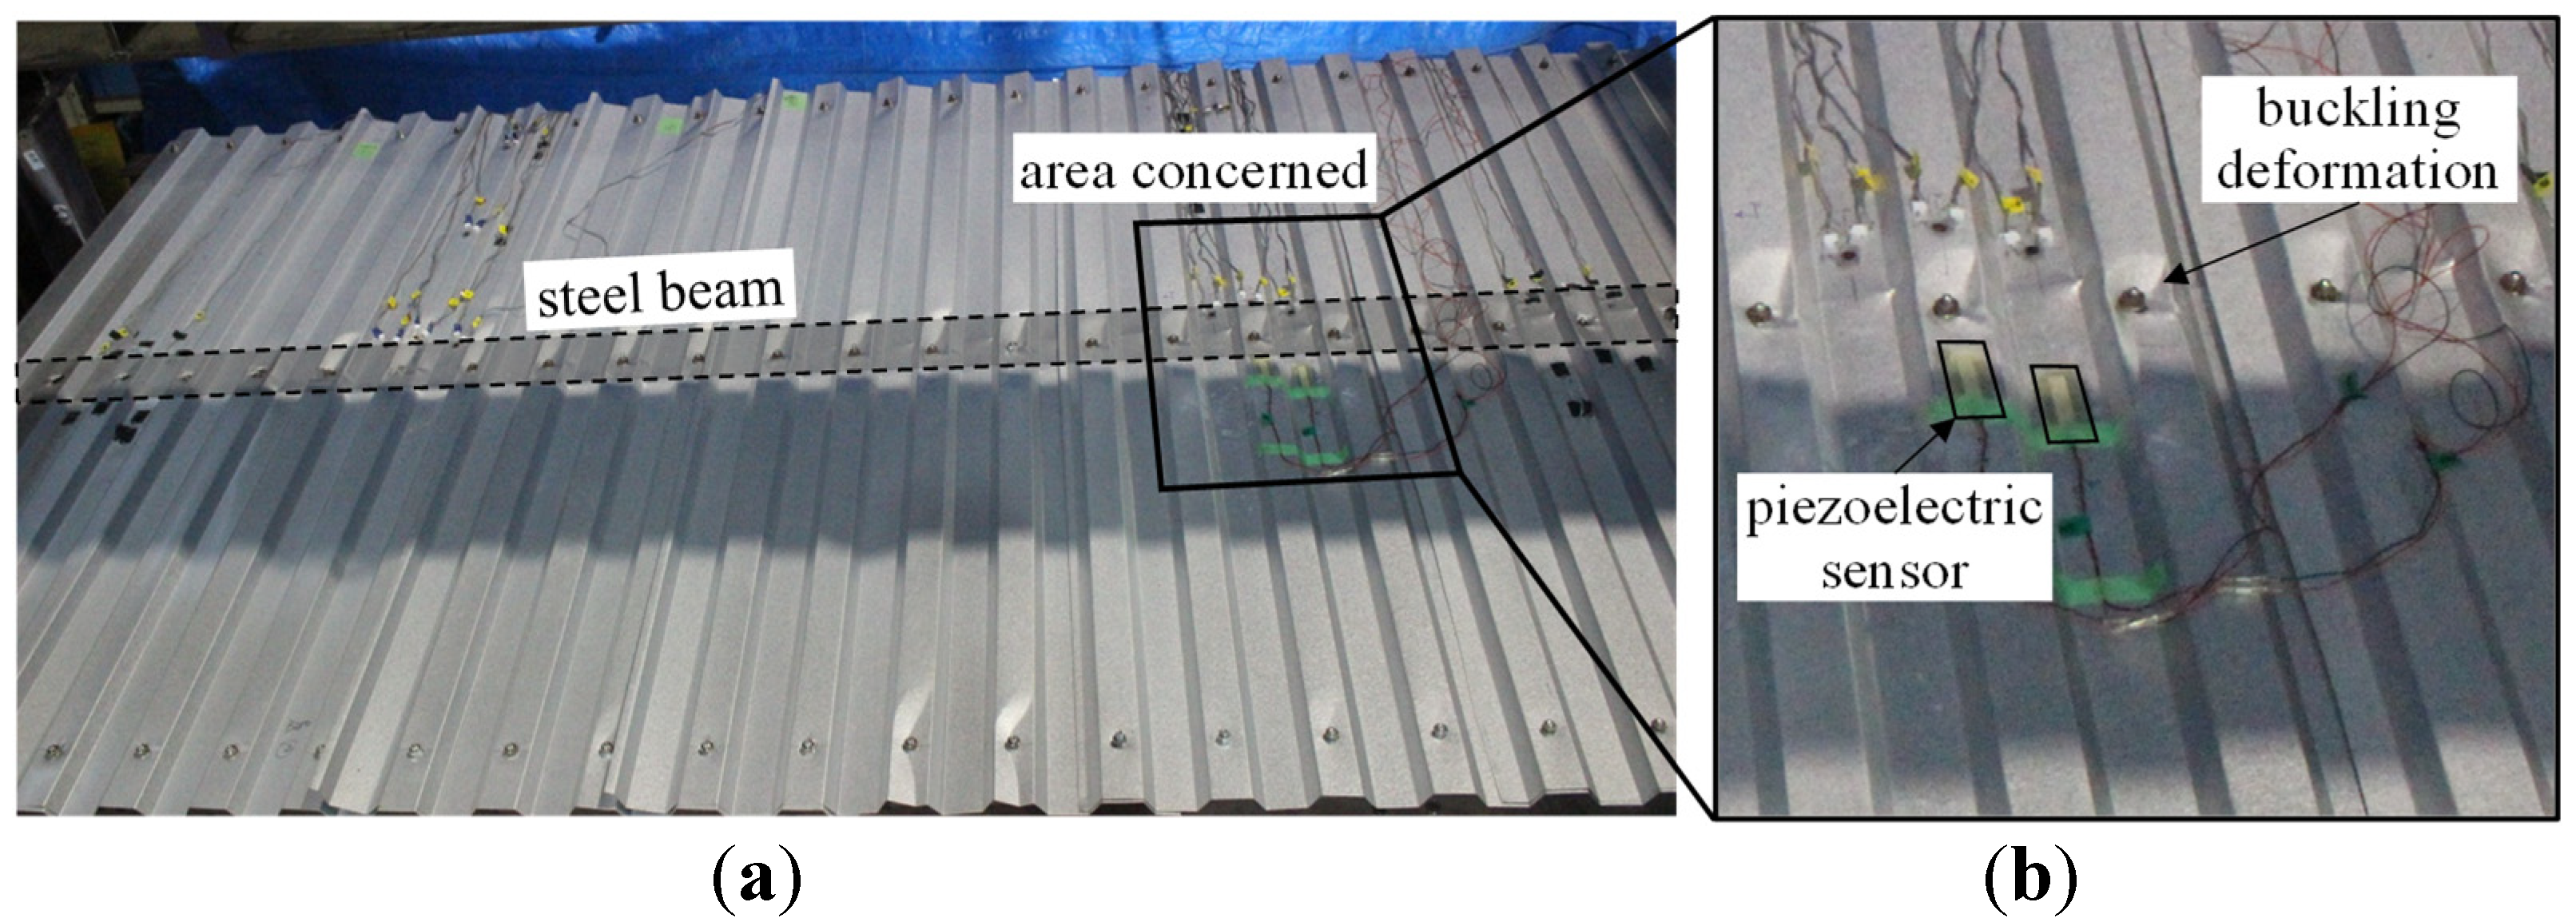
Figure 16 presents the ultimate state of the folded steel plate attached to the specimen. As expected from the preliminary analysis, the buckling deformation became especially pronounced at the connection part. Therefore, the piezoelectric sensor captured the buckling deformation, as presented in Figure 16(b).
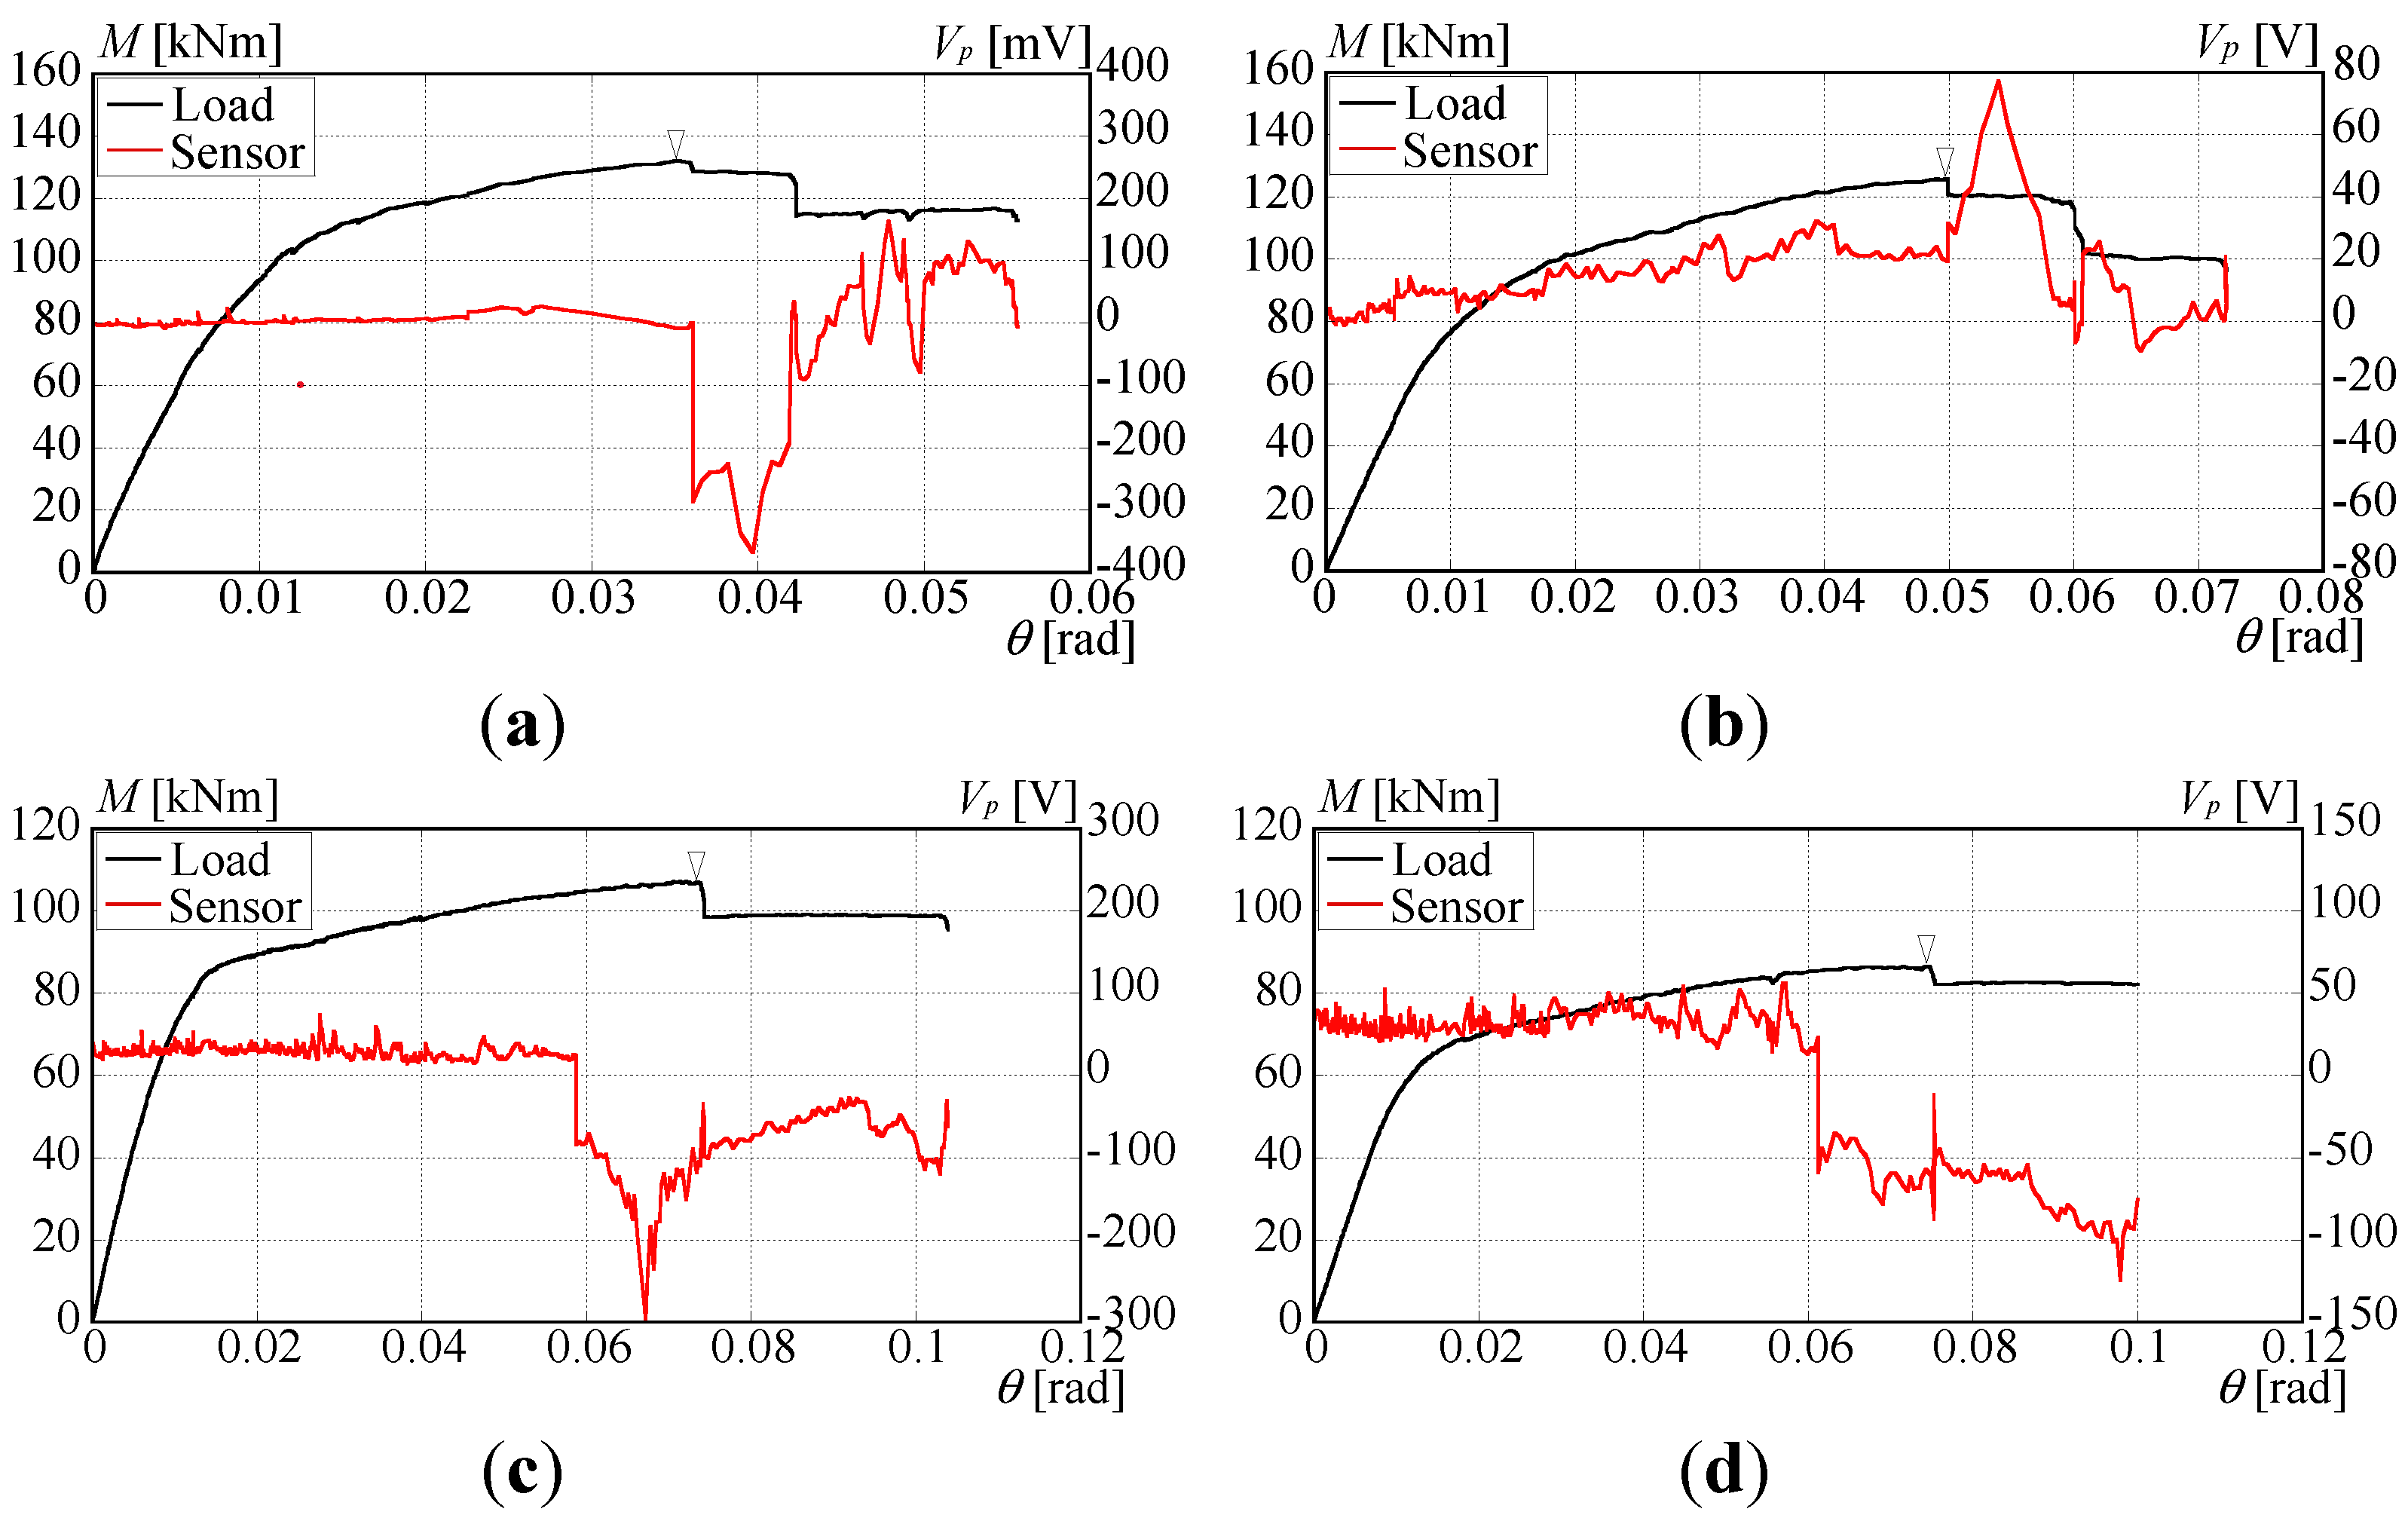
Figure 17 exhibits the skeleton curve and the sensor output at the respective measurement steps. In the initial phase, the significant sensor output was not visible because the out-of-plane deformation did not increase in the small loading amplitude. Instead, the piezoelectric sensor began to present a spike when the beam reached the ultimate state. It seems reasonable that the deformation of the folded steel plate increases after the sidesway of the beam. Therefore, damage detection of the piezoelectric sensor is primarily effective for verifying the possibility of buckling origination and the degradation of the restraint performance of folded roof plates.
The outcomes of this research emphasize the applicability of piezoelectric sensors for structural damage detection. A simplified system to monitor and alert building damage will be reported and verified for future research using shaking table tests.

4. Conclusion

This study was conducted to elucidate the applicability of a piezoelectric sensor for damage detection in secondary building components. The first half of the paper presented findings for a concrete slab, exhibiting rapid crack origination and expansion. The latter half described results for a folded roof plate, with bracing against torsional deformation of the I-shaped beam. A cyclic loading test and preliminary analysis were described for both components to elucidate the piezoelectric sensor behavior. A summary of the findings is presented below.
1)
The optimal sensor location for the concrete slab was retrieved to be beside the embedded position of the shear connector. That position in the case of the folded roof plate was found to be around the bolt connection.
2)
The piezoelectric sensor produces prominent output when the concrete crack penetrates the sensor. Unlike standard strain gauges, the piezoelectric sensor can detect damage occurrence several times, which is a preferable characteristic for long-term monitoring.
3)
The piezoelectric sensor detects the forced deformation of a folded roof plate by beam torsion, thereby demonstrating the applicability of monitoring lateral buckling origination during the cyclical application of stress.

Author Contributions

Conceptualization, A.S. and N.S; methodology, A.S.; software, W.L.; validation, W.L. and Y.Y.; formal analysis, W.L; investigation, Y.Y.; resources, Y.K and N.S.; data curation, A.S. and W.L; writing—original draft preparation, A.S.; writing—review and editing, W.L., D.S., Y.K.; visualization, A.S.; supervision, Y.K and N.S.; project administration, A.S., Y.K. and N.S; funding acquisition, A.S., W.L.,Y.Y, and N.S.

Funding

This research was funded by JSPS KAKENHI (Grant Number 20H00290) (Principal Investigator: Dr. Nobuyoshi Shimoi), JSPS KAKENHI (Grant Number 23K13392) (Principal Investigator: Dr. Atsushi Suzuki) and Shanghai Pujiang Program (Grant No. 22PJD097) (Principal Investigator: Dr. Wang Liao), and JSPS KAKENHI (Grant Number 22K14369) (Principal Investigator: Dr. Yuki Yoshino). We express our deepest gratitude for their sincere support.

Data Availability Statement

The raw/processed data necessary to reproduce these findings cannot be shared at this time because the data also form part of an ongoing study.

Acknowledgments

In this section, you can acknowledge any support given which is not covered by the author contribution or funding sections. This may include administrative and technical support, or donations in kind (e.g., materials used for experiments).

Conflicts of Interest

The authors declare that they have no known competing financial interest or personal relationship that could have appeared to influence the work reported in this paper.

References

  1. Japan International Cooperation Agency (JICA). The project for assessment of earthquake disaster risk for the Kathmandu Valley in Nepal, Final Report, Volume 2 Main Report, 2018, JICA.
  2. Y. Matsumoto, S. Yamada, J. Iyama, T. Koyama, S. Kishiki, Y. Shimada, H. Asada, M. Ikenaga. Damage to steel educational facilities in the 2011 East Japan Earthquake: Part 1 Outline of the reconnaissance and damage to major structural components. 15th World Conference on Earthquake Engineering, Lisbon, Portugal, 24-28 September 2012.
  3. Suzuki, T. Fujita, Y. Kimura. Identifying damage mechanisms of gymnasium structure damaged by the 2011 Tohoku earthquake based on biaxial excitation. Structures 2022, 35, 1321–1338. [CrossRef]
  4. H. Chida, N. Takahashi. Study on image diagnosis of timber houses damaged by earthquake using deep learning. Japan Architectural Review 2021, 4(3), 420–430. [CrossRef]
  5. P.C. Chang, A. Flatau, S.C. Liu. Review paper: health monitoring of civil infrastructure. Structural Health Monitoring 2003, 2(3), 257–267. [CrossRef]
  6. E.P. Carden, P. Fanning. Vibration based condition monitoring: a review. Structural Health Monitoring 2004, 3(4), 355–377. [CrossRef]
  7. X. Ji, G.L. Fenves, K. Kajiwara, M. Nakashima. Seismic damage detection of a full-scale shaking table test structure. Journal of Structural Engineering 2011, 137(1), 14–21. [CrossRef]
  8. K. Okada, R. Shiroishi, Y. Morii, R. Sagawa. Method of structural health monitoring after earthquake using limited accelerometer – case study of large-scale shaking table test on six story RC building. Concrete Journal 2017, 55(2), 138–145. (in Japanese).
  9. G.P. Gislason, Q. Mei, M. Gul. Rapid and automated damage detection in buildings through ARMAX analysis of wind induced vibrations. Frontiers in Built Environment 2019, 5(16), 1–15. [CrossRef]
  10. S. Alampalli, G. Fu, E.W. Dillon. Signal versus noise in damage detection by experimental modal analysis. Journal of Structural Engineering 1997, 123(2), 237–245. [CrossRef]
  11. M. Ju, Z. Dou, J. Li, X. Qiu, B. Shen, S. Zhang, F. Yao, W. Gong, K. Wang. Piezoelectric materials and sensors for structural health monitoring: fundamental aspects, current status, and future perspectives. Sensors 2023, 23(1), 543. [CrossRef]
  12. S. Kishiki, Y. Iwasaki, Evaluation of residual strength based on local buckling deformation of steel column – quick inspection method for steel structures based on the visible damage Part 3, Journal of Structural and Construction Engineering (Transactions of AIJ) 2017, 82(735), 735–743. (in Japanese). [CrossRef]
  13. Aabid, B. Parveez, M.A. Raheman, Y.E. Ibrahim, A. Anjum, M. Hrairi, N. Parveen, J.M. Zayan. A review of piezoelectric material-based structural control and health monitoring techniques for engineering structures: challenges and opportunities. Actuators 2021, 10(5), 101. [CrossRef]
  14. T. Harada, K. Yokoyama, K. Tanabe, Study of crack detection of civil infrastructure using PVDF film sensor. Journal of Structural Engineering 2013, 59A, 47–55.
  15. N. Shimoi, T. Nishida, A. Obata, K. Nakasho, H. Madokoro, C. Cuadra. Comparison of displacement measurements in exposed type column base using piezoelectric dynamic sensors and static sensors. American Journal of Remote Sensing 2016, 4(5), 23–32. [CrossRef]
  16. N. Shimoi, C. Cuadra, H. Madokoro, K. Nakasho. Comparison of displacement measurements and simulation on fillet weld of steel column base. International Journal of Mechanical Engineering and Applications 2020, 8(5), 111–117. [CrossRef]
  17. Suzuki, Y. Kimura. Cyclic behavior of component model of composite beam subjected to fully reversed cyclic loading. Journal of Structural Engineering 2019, 145(4), 04019015. [CrossRef]
  18. Suzuki, K. Abe, Y. Kimura. Restraint performance of stud connection during lateral-torsional buckling under synchronized in-plane displacement and out-of-plane rotation. Journal of Structural Engineering 2020, 146(4), 04020029. [CrossRef]
  19. Suzuki, K. Abe, K. Suzuki, Y. Kimura. Cyclic behavior of perfobond shear connectors subjected to fully reversed cyclic loading. Journal of Structural Engineering 2021, 147(3), 04020355. [CrossRef]
  20. Suzuki, K. Suzuki, Y. Kimura. Ultimate shear strength of perfobond shear connectors subjected to fully reversed cyclic loading. Engineering Structures 2021 248, 113240. [CrossRef]
  21. Suzuki, Y. Kimura. Mechanical performance of stud connection in steel–concrete composite beam under reversed stress. Engineering Structures 2021, 249, 113338. [CrossRef]
  22. K. Suzuki, A. Suzuki, Y. Kimura. Ultimate shear strength of component model of composite beam with perfobond shear connector. Materials Science Forum, Virtual, Online, 26-28 June 2021. [CrossRef]
  23. Suzuki, K. Hiraga, Y. Kimura. Cyclic behavior of steel-concrete composite dowel by clothoid-shaped shear connectors under fully reversed cyclic stress. Journal of Advanced Concrete Technology 2023, 21, 76–91. [CrossRef]
  24. Suzuki, K. Hiraga, Y. Kimura. Mechanical performance of puzzle-shaped shear connectors subjected to fully reversed cyclic stress. Journal of Structural Engineering 2023, 149(7), 04023087. [CrossRef]
  25. Y. Liu, B. Sun, Experimental investigation and finite element analysis for mechanical behavior of steel–concrete composite beams under negative bending. International Conference on Mechanics and Civil Engineering, Wuhan, China, 13-14 December 2014. [CrossRef]
  26. Y. Kimura, Y. Sato, A. Suzuki. Effect of fork restraint of column on lateral buckling behavior for H-shaped steel beams with continuous braces under flexural moment gradient. Journal of Structural and Construction Engineering (Transactions of AIJ) 2022, 87(793), 316–327. (in Japanese). [CrossRef]
  27. W. Liao, Y. Yoshino, Y. Kimura, Experimental study on the effect of H-shaped beam-folded roof plate joints on the rotational bracing stiffness of folded roof plates as continuous braces. Steel Construction Engineering 2021, 28(112), 101–110.
  28. Japan Society of Steel Construction (JSSC). Guideline of standard push-out tests of headed stud and current situation of research on stud shear connectors. Japan Society of Steel Construction: Tokyo, Japan, 1996.
  29. Japan Industrial Standards (JIS). Method of test for compressive strength of concrete JIS A 1108. Japan Standard Association: Tokyo, Japan, 2006.
  30. Japan Industrial Standards (JIS). Method of test for splitting tensile strength of concrete JIS A 1113. Japan Standard Association: Tokyo, Japan, 2006.
  31. Japan Industrial Standards (JIS). Metallic materials – tensile testing method of test at room temperature JIS Z 2241. Japan Standard Association, Tokyo, Japan. 2011.
  32. Eurocode-4. Design of composite steel and concrete structures Part 1–1: rules for buildings. European Committee for Standardization, Brussels, Belgium, 2004.
  33. T.N. Huu, S.E. Kim. Finite element modeling of push-out tests for large stud shear connectors. Journal of Constructional Steel Research 2009, 65, 1909–1920.
  34. Hillerborg. Stability problems in fracture mechanics testing in fracture of concrete and rock. International Conference on Recent Developments in the Fracture of Concrete and Rocks 1989, 369-378.
  35. T. Noguchi, F. Tomosawa. Relationship between compressive strength and various mechanical properties of high strength concrete. Journal of Structural and Construction Engineering (Transactions of AIJ) 1995, 472, 11–16. (in Japanese). [CrossRef]
  36. Y. Kitsutaka, S. Nakamura, H. Mihashi. Simple evaluation method for the bilinear type tension softening constitutive law of concrete. Proceedings of the Japan Concrete Institute 1998, 20, 181–186.
  37. Y. Goto, K.P. Ghosh, N. Kawanishi. Nonlinear finite-element analysis for hysteretic behavior of thin-walled circular steel columns with in-filled concrete. Journal of Structural Engineering 2010, 136(11), 1413–1422. [CrossRef]
  38. Y. Doukan, K. Fujii, Y. Tamiya, T. Fujii. Consideration of load transfer mechanism of perforated rib shear connectors. Journal of Structural Engineering 2014, 60A, 827–836.
  39. Y. Kimura, A. Suzuki, K. Kasai. Estimation of plastic deformation capacity for I-shaped beams with local buckling under compressive and tensile forces. Journal of Structural and Construction Engineering (Transactions of AIJ) 2016, 81(730), 2133–2142. [CrossRef]
  40. Suzuki, Y. Kimura, K. Kasai. Plastic deformation capacity of H-shaped beams collapsed with combined buckling under reversed axial forces. Journal of Structural and Construction Engineering (Transactions of AIJ) 2019, 83(744), 297–307. [CrossRef]
  41. Suzuki, Y. Kimura, K. Kasai. Rotation capacity of I-shaped beams collapsed with lateral-torsional buckling under reversed axial forces. Japan Architectural Review 2019, 2(4), 451-464. [CrossRef]
  42. Suzuki, Y. Kimura, K. Kasai. Rotation capacity of I-shaped beams under alternating axial forces based on buckling-mode transitions. Journal of Structural Engineering 2020, 146(6), 04020089. [CrossRef]
  43. Suzuki, Y. Kimura. Rotation capacity of I-shaped beam failed by local buckling in buckling-restrained braced frames with rigid beam-column connections. Journal of Structural Engineering 2023, 149(2), 04022243. [CrossRef]
  44. S. M. Fujak, Y. Kimura, A. Suzuki. Estimation of elastoplastic local buckling capacities and novel classification of I-beams based on beam’s elastic local buckling strength. Structures 2022, 39, 765-781. [CrossRef]
  45. S. M. Fujak, A. Suzuki, Y. Kimura. Estimation of ultimate capacities of Moment-Resisting Frame’s subassemblies with Mid-Storey Pin connection based on elastoplastic local buckling. Structures 2023, 48, 410-426. [CrossRef]
  46. Y. Yoshino, W. Liao, Y. Kimura. Restraint effect on lateral buckling load of continuous braced H-shaped beams based on partial frame loading tests. Journal of Structural and Construction Engineering (Transactions of AIJ) 2022, 87(797), 634–645. (in Japanese). [CrossRef]
  47. Y. Kimura. Effect of loading hysteretic program on plastic deformation capacity and cumulative plastic deformation capacity for H-shaped beam with local buckling – database of experimentally obtained results for cantilever with H-section. Journal of Structural and Construction Engineering (Transactions of AIJ) 2011, 76(664), 1143–1151. (in Japanese).
Figure 1. Installation of secondary structural components: (a) Concrete slab; (b) Folded roof plate.
Preprints 83097 g001
Figure 2. Component model of composite beam (unit: mm): (a) Side view; (b) Front view; (c) cross-section view.
Preprints 83097 g002
Figure 3. Loading frame.
Preprints 83097 g003
Figure 4. Finite element analysis model.
Preprints 83097 g004
Figure 5. Constitutive law of concrete and separation: (a) Compression; (b) Tension; (c) Cyclic; (d) Separation.
Preprints 83097 g005
Figure 6. Distribution of tensile cracks: (a) Load-displacement relation; (b) d=2.1 mm; (c) d=5.0 mm; (d) d=10.0 mm.
Preprints 83097 g006
Figure 7. Positions of piezoelectric sensors.
Preprints 83097 g007
Figure 8. Cyclic behavior of the specimen.
Preprints 83097 g008
Figure 9. Fracture process: (a) d=-2.0 mm; (b) d=-6.0 mm; (c) d=-10.0 mm; (d) d=-14.0 mm.
Preprints 83097 g009
Figure 10. Transition of crack width and piezoelectric sensor output: (a) transition of crack width and sensor output; (b) crack and sensor positions.
Preprints 83097 g010
Figure 11. Relation between slab damage and piezoelectric sensor output: (a) crack width; (b) crack width velocity.
Preprints 83097 g011
Figure 12. Loading frame: (a) Floor plan; (b) Slider detail; (c) A-A’ section view; (d) 1-1’ section view.
Preprints 83097 g012
Figure 13. FEA model and buckling deformation: (a) FEA model; (b) buckling deformation.
Preprints 83097 g013
Figure 14. Cyclic behavior of I-shaped beam assembled with a folded roof plate.: (a) No. 1; (b) No. 2.
Preprints 83097 g014
Figure 15. Procedure used to draw the skeleton curve: (a) Hysteresis curve; (b) cumulative hysteresis curve; (c) skeleton curve.
Preprints 83097 g015
Figure 16. Ultimate state of the folded steel plate: (a) Deformation on the whole part; (b) Zoomed image of sensor.
Preprints 83097 g016
Figure 17. Skeleton curve and output of the piezoelectric sensor: (a) Positive (No. 1); (b) Negative (No. 1); (c) Positive (No. 2); (d) Negative (No. 2).
Preprints 83097 g017
Table 1. Mix proportions.
W/C s/a Unit materials content [kg/m3]
Water Cement Sand Gravel Admixture
53.0 47.5 178 336 829 933 4.36
Table 2. Material properties (concrete).
Compressive strength
[N/mm2]
Tensile strength
[N/mm2]
Modulus of elasticity [N/mm2]
26.4 2.1 22,836
Table 3. Material properties (steel plate).
Part Thickness
[mm]
Yield strength
[N/mm2]
Ultimate strength [N/mm2] Elongation
[%]
Connector 16 285 436 46
Web 8 293 458 37
Flange 12 257 440 43
Table 4. Material properties (steel bar).
Diameter [mm] Yield strength [N/mm2] Ultimate strength [N/mm2] Elongation [%]
10 378 509 28
Table 5. Material test results.
Part Specimen Thickness [mm] Yield strength [N/mm2] Ultimate strength [N/mm2]
Flange No. 1 6 313.9 465.9
No. 2 6 294.8 443.5
Web No. 1 9 368.3 475.1
No. 2 8 334.1 456.2
Folded roof plate No. 1 0.5 347.4 393.1
No. 2 0.5 341.7 389.9
Disclaimer/Publisher’s Note: The statements, opinions and data contained in all publications are solely those of the individual author(s) and contributor(s) and not of MDPI and/or the editor(s). MDPI and/or the editor(s) disclaim responsibility for any injury to people or property resulting from any ideas, methods, instructions or products referred to in the content.
Copyright: This open access article is published under a Creative Commons CC BY 4.0 license, which permit the free download, distribution, and reuse, provided that the author and preprint are cited in any reuse.
Prerpints.org logo

Preprints.org is a free preprint server supported by MDPI in Basel, Switzerland.

Subscribe

© 2024 MDPI (Basel, Switzerland) unless otherwise stated