
Submitted:
17 August 2023
Posted:
18 August 2023
You are already at the latest version
Abstract
This study focused on demonstrating the potential of classification algorithm in the chemical composition characterization of transiting exoplanets. The Python-based module PLATON 5.3 for forward modelling of transiting planet spectra was used to simulate a set of transmission spectra of an exoplanet with size Rp = 1.40*Rjupiter, and mass Mp = 0.73*Mjupiter orbiting around the host star of size Ms = 1.16*Msun and surface temperature of 1200 Kelvin. The gas composition of the exoplanet atmosphere was varied at low and high levels of 3-gas mix of CO2, O2, N2 and CH4 resulting to eight classes of spectra. The transit spectra were then used as input data to a forward neural network classifier with the eight gas composition classes as target outputs. The trained classifier achieved at most 97.9% overall accuracy.
Keywords:
classification
; transit spectra
; exoplanet atmosphere
1. Introduction
As of February 2023, around 5040 exoplanets have been identified [1] but the characterization of exoplanet atmosphere is still a challenging task amid significant progress in improvement of telescopes and data analytics [2]. Only a handful of observed exoplanets have been characterized in terms of atmosphere composition [3], which is vital for various purposes including the search of habitable planets.
Among the various methods of exoplanet observation for atmosphere characterization, transmission spectroscopy is a common method used [4] specially when the orbit of the exoplanet aligns between the host star and the observing telescope (on Earth or around Earth). Typically, the data analysis task to be done given that an actual measurement has been made is by using calibration spectra to estimate from a measured transmission (absorption) spectra the amounts of the atmospheric chemicals. The data analytics approach study presented in this paper reformulates the data analysis problem by looking at it as a classification problem (Figure 1).
Posing the data analytics task as a classification problem requires two data components when training a classifier: (1) spectral data as input, and (2) label of the spectral data as output. This dataset structure can be created using known models about exoplanet atmosphere composition, and one platform that has been developed for simulation of transmission spectra of transiting exoplanet is the PLATON 5.3 [5], which is a Python-based module. With this data analytics workflow of simulating transmission spectra from randomized levels of gases (CO2, O2, N2 and CH4) via the PLATON 5.3 platform followed by the training of a forward neural network (NN) classifier (Figure 1), we show in this paper the potential of classification algorithm in characterizing the atmosphere composition of transiting exoplanet by using transit depth-versus-wavelength datasets.
2. Methodology
A schematic overview of the data analysis workflow is shown in Figure 1. This data analytics workflow leverages on the capability of transit-depth-versus-wavelength spectral data to capture the characteristic atmosphere fingerprint of the transiting exoplanet [4]. The datasets and Python codes in Jupyter Notebook files used in this study are provided online via the GitHub repository of the work [6].
The transit spectra datasets were simulated using the Python-based module PLATON 5.3 [5] (Figure 1a). The 3-gas mix combinations used in the simulation of spectra are summarized in Table 1. For the atmosphere composition simulations, the following star-planet parameters were used: an exoplanet with size Rp = 1.40*Rjupiter, and mass Mp = 0.73*Mjupiter orbiting around the host star of size Ms = 1.16*Msun and surface temperature of 1200 Kelvin. These parameter levels were the default settings in the PLATON 5.3 modules example simulation codes [5] and were kept the same in the work. The number of random simulations (n) in each class was varied at n = 10 and n = 100. A sample graphical rendering of the transit depth-versus-wavelength for the spectra Set I is shown in Figure 2.
3. Results
4. Discussion
Overall, the trained classifiers can achieve very good classification performance reaching 97.9% overall accuracy. The higher number of spectral data, which is n = 100 in this study, favors higher prediction accuracy. The levels of precision, recall, and F1-score of the trained classifiers also indicate low misclassification rates. Based on these results of training forward NN classifiers on the transit spectra generated via PLATON 5.3, we conclude that a classification algorithm can be a potential method of characterizing the atmosphere of transiting exoplanets.
Author Contributions
Conceptualization, D.L.B.F., A.T., A.M., and W.S.; methodology, D.L.B.F. and A.T.; software, D.L.B.F. and A.T.; formal analysis, D.L.B.F., A.T., A.M. and W.S.; writing, D.L.B.F., A.T., A.M. and W.S.; funding acquisition, D.L.B.F. and A.T. All authors have read and agreed to the published version of the manuscript.
Funding
This research was funded by the Louisiana Space Grant Consortium (LaSPACE), Louisiana USA under their LURA program with sub-award number PO-0000206339 under the primary NASA grant 80NSSC20M0110. A.T. was the funded student and D.L.B.F. was the principal investigator.
Data Availability Statement
The datasets and Python codes as Jupyter notebook files are provided online via the GitHub repository of the project: https://github.com/dhanfort/TransitExoplanet_Spectra_Classif.git [6] .
Acknowledgments
We appreciate the continued support of LaSPACE to undergraduate students who want to pursue research in STEM and space-related projects.
Conflicts of Interest
The authors declare no conflict of interest. The funders had no role in the design of the study; in the collection, analyses, or interpretation of data; in the writing of the manuscript; or in the decision to publish the results.
Appendix A
In the following equations, these notations are used: TP = True positive; FP = False positive; FN = False negative. F1-score is a measure of accuracy at each class.
A.1 Equation of Precision
A.2 Equation of Recall
A.3 Equation of F1-Score
References
- Rein, H. A proposal for community driven and decentralized astronomical databases and the Open Exoplanet Catalogue. arXiv 2012, arXiv:1211.7121. [Google Scholar] [CrossRef]
- Charbonneau, D.; Brown, T.M.; Noyes, R.W.; Gilliland, R.L. Detection of an Extrasolar Planet Atmosphere*. The Astrophysical Journal 2002, 568, 377. [Google Scholar] [CrossRef]
- Rukdee, S. Ultra-high resolution spectroscopy from ground and space for exoplanet atmosphere characterization. In Proceedings of the 2nd Innovation Aviation & Aerospace Industry - International Conference 2021, Chiang Mai, Thailand; 2021. [Google Scholar]
- Kreidberg, L. Exoplanet Atmosphere Measurements from Transmission Spectroscopy and other Planet-Star Combined Light Observations. arXiv 2017, arXiv:1709.05941. [Google Scholar]
- Michael Zhang; Yayaati Chachan; Eliza M.-R. Kempton; Heather Knutson; Chang, W. PLATON II: New Capabilities And A Comprehensive Retrieval on HD 189733b Transit and Eclipse Data. arXiv 2004, arXiv:2004.09513.
- Fortela, D.L.B. GitHub repo: Transiting Exoplanet Spectra Classification. Available online: https://github.com/dhanfort/TransitExoplanet_Spectra_Classif.git (accessed on 17 August 2023).
Figure 1.
Schematic overview of the data analytics workflow implemented in this study. a) simulation of transit spectra using the PLATON 5.3 module, b) training a forward NN classifier.
Figure 1.
Schematic overview of the data analytics workflow implemented in this study. a) simulation of transit spectra using the PLATON 5.3 module, b) training a forward NN classifier.
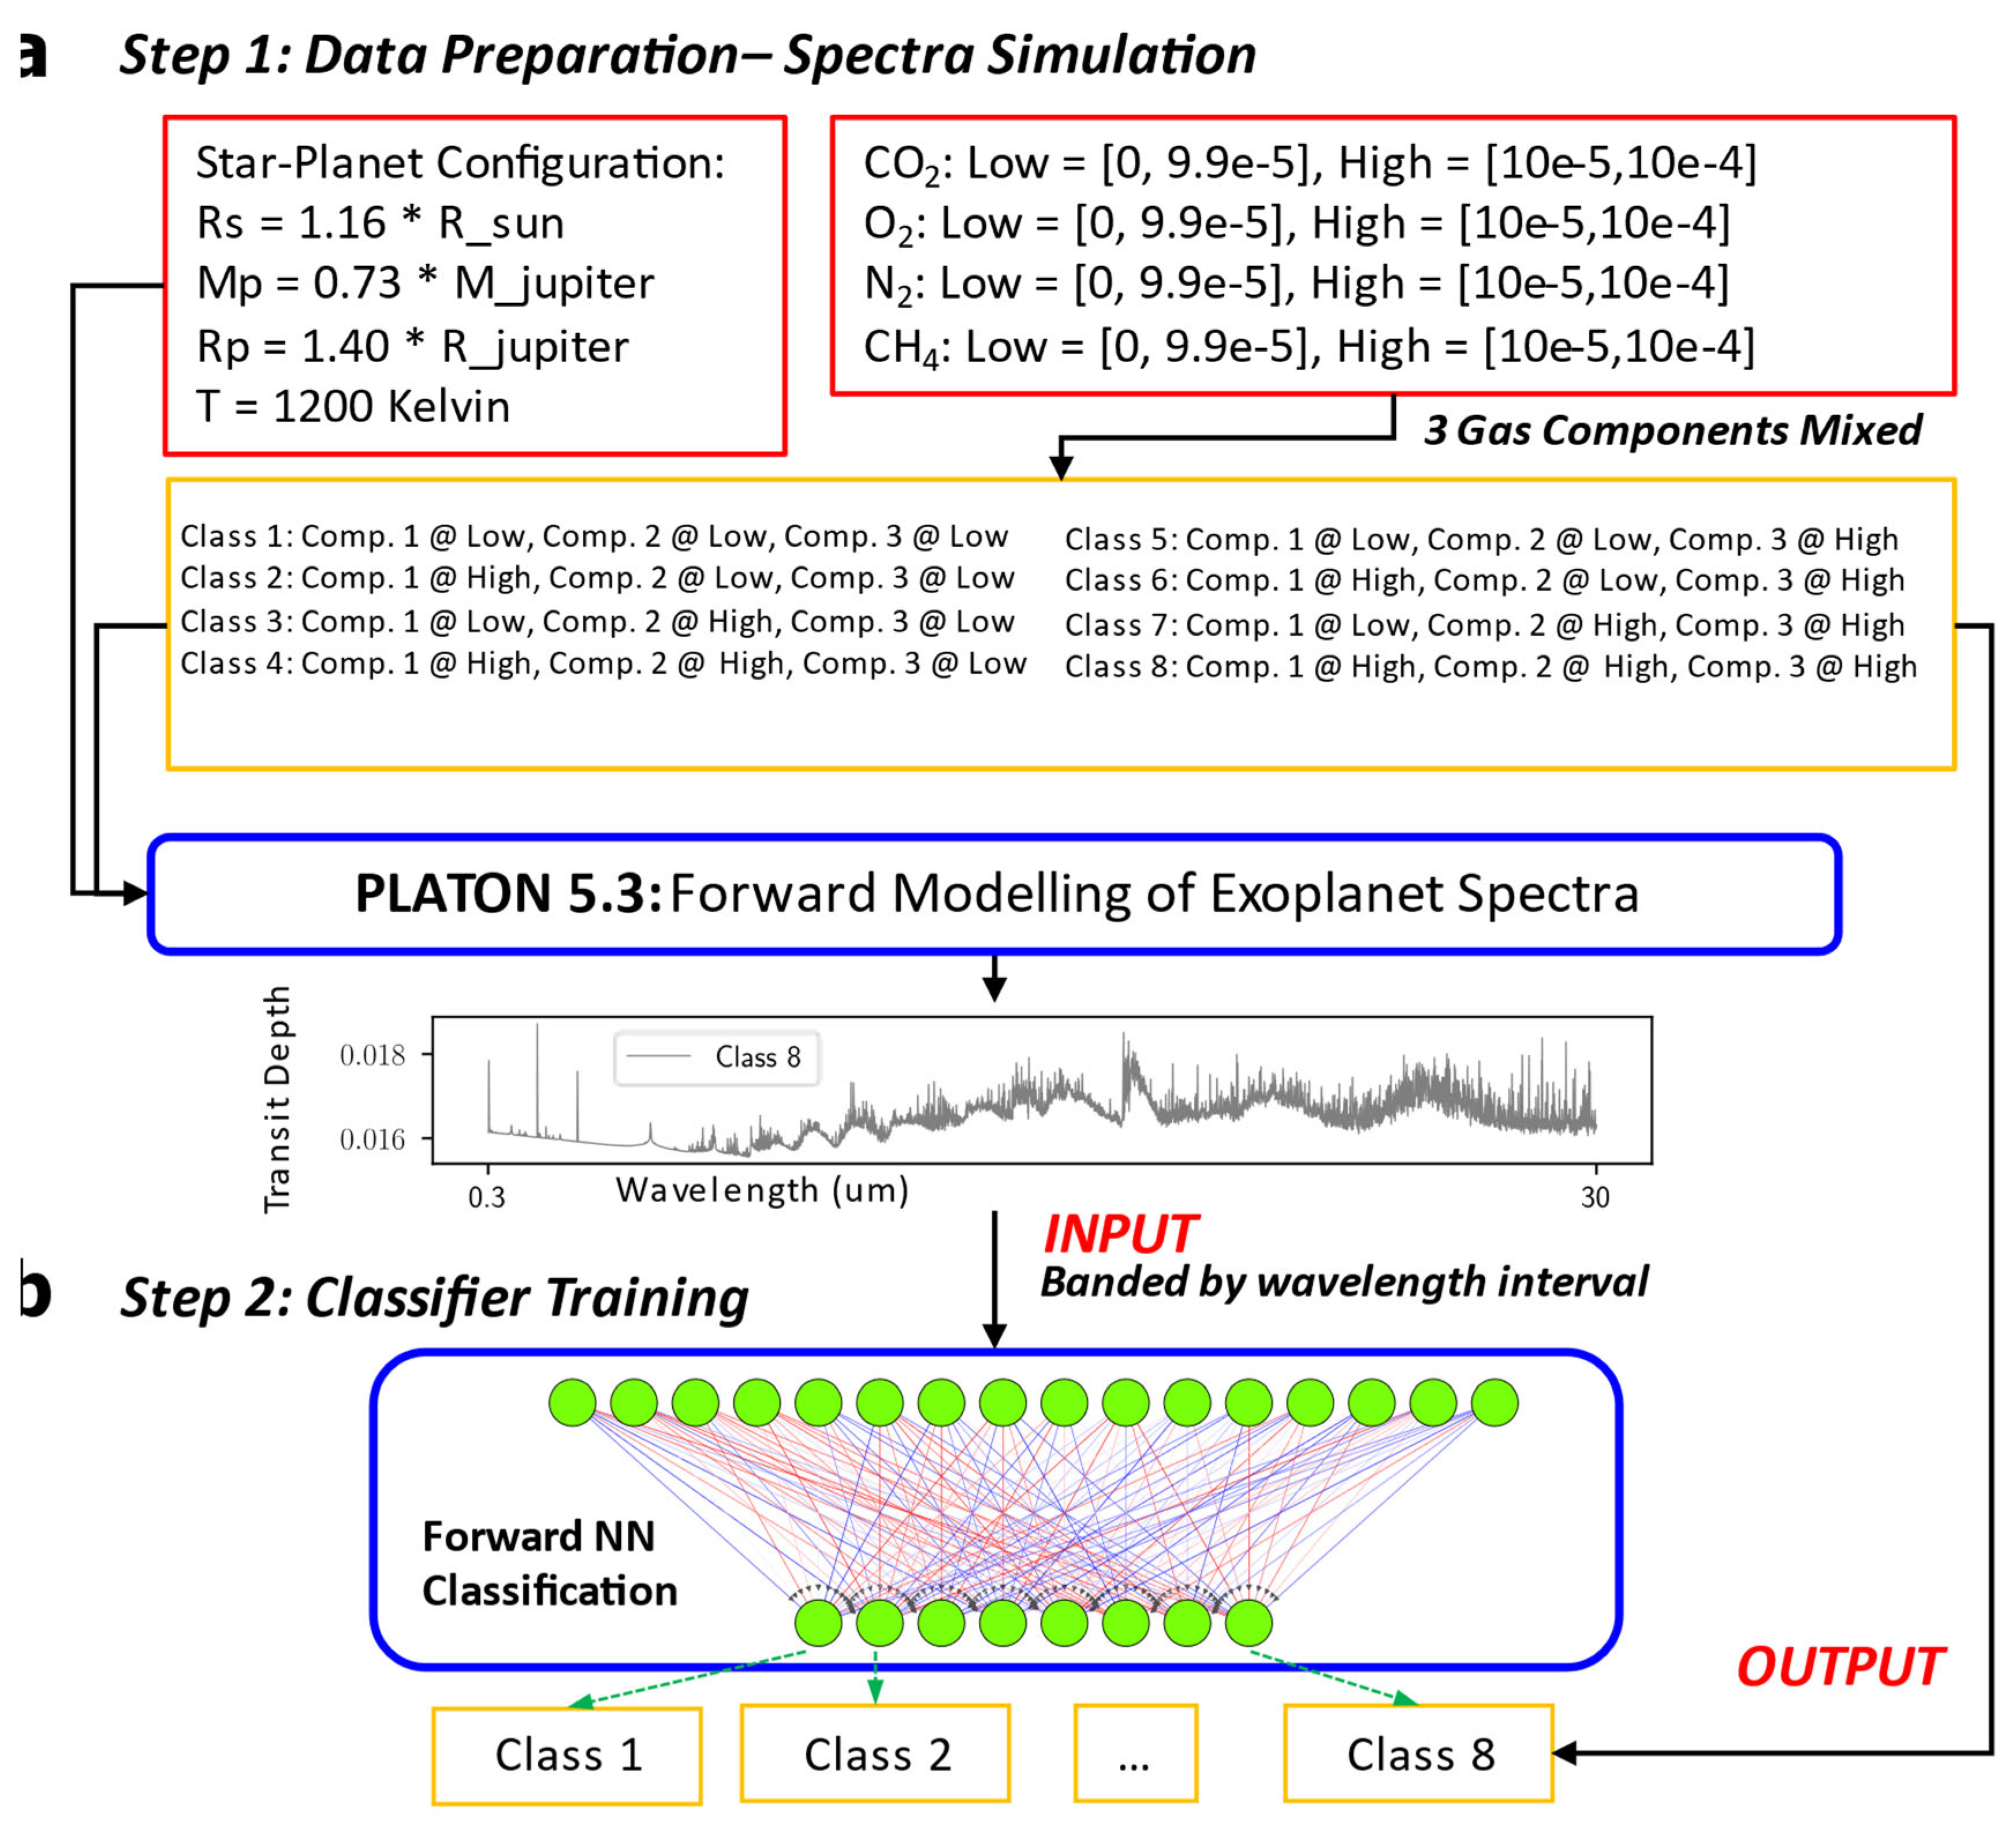
Figure 2.
Graphical rendering of sample transit spectra for the Set I of experiments. One spectra sample was taken from each class.
Figure 2.
Graphical rendering of sample transit spectra for the Set I of experiments. One spectra sample was taken from each class.
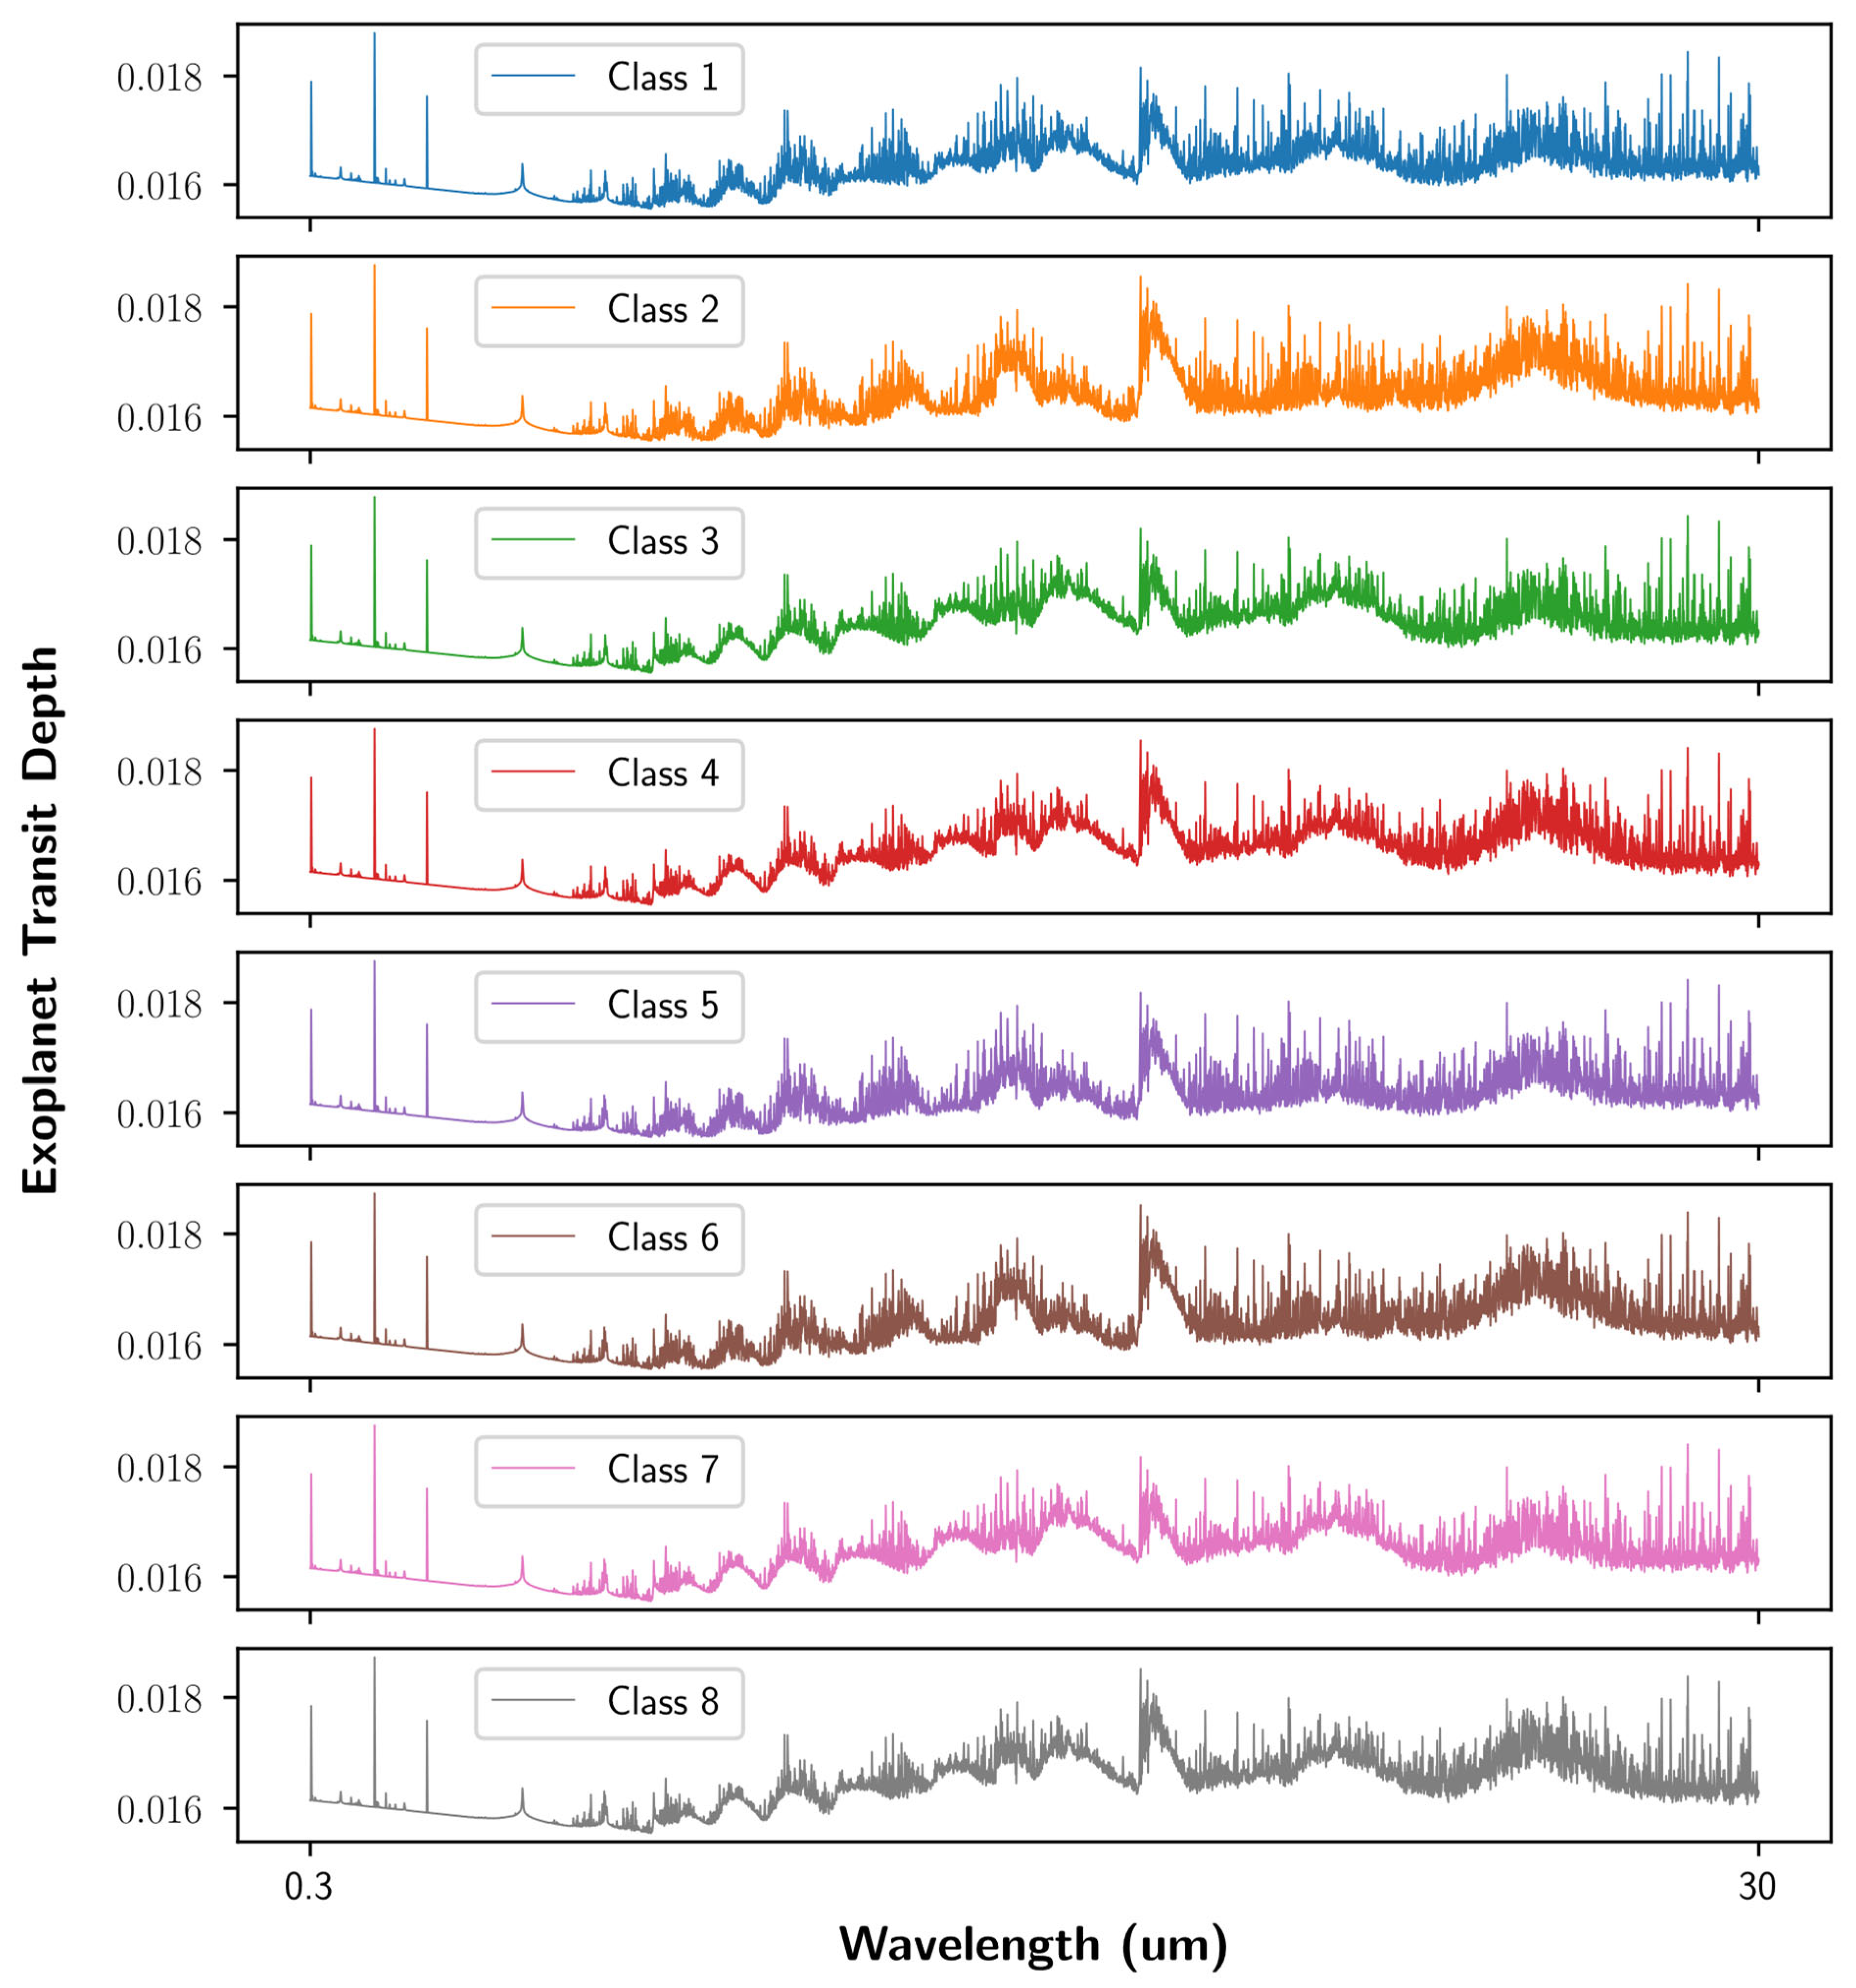
Figure 3.
Multi-class confusion matrix for all the classifier models for varied gas-mix experiments at varying number of random samples in each class n=10 and n=100. a) Set I for CO2/CH4/O2 mix, b) Set II for CO2/CH4/N2 mix, and c) Set III for CO2/O2/N2 mix.
Figure 3.
Multi-class confusion matrix for all the classifier models for varied gas-mix experiments at varying number of random samples in each class n=10 and n=100. a) Set I for CO2/CH4/O2 mix, b) Set II for CO2/CH4/N2 mix, and c) Set III for CO2/O2/N2 mix.
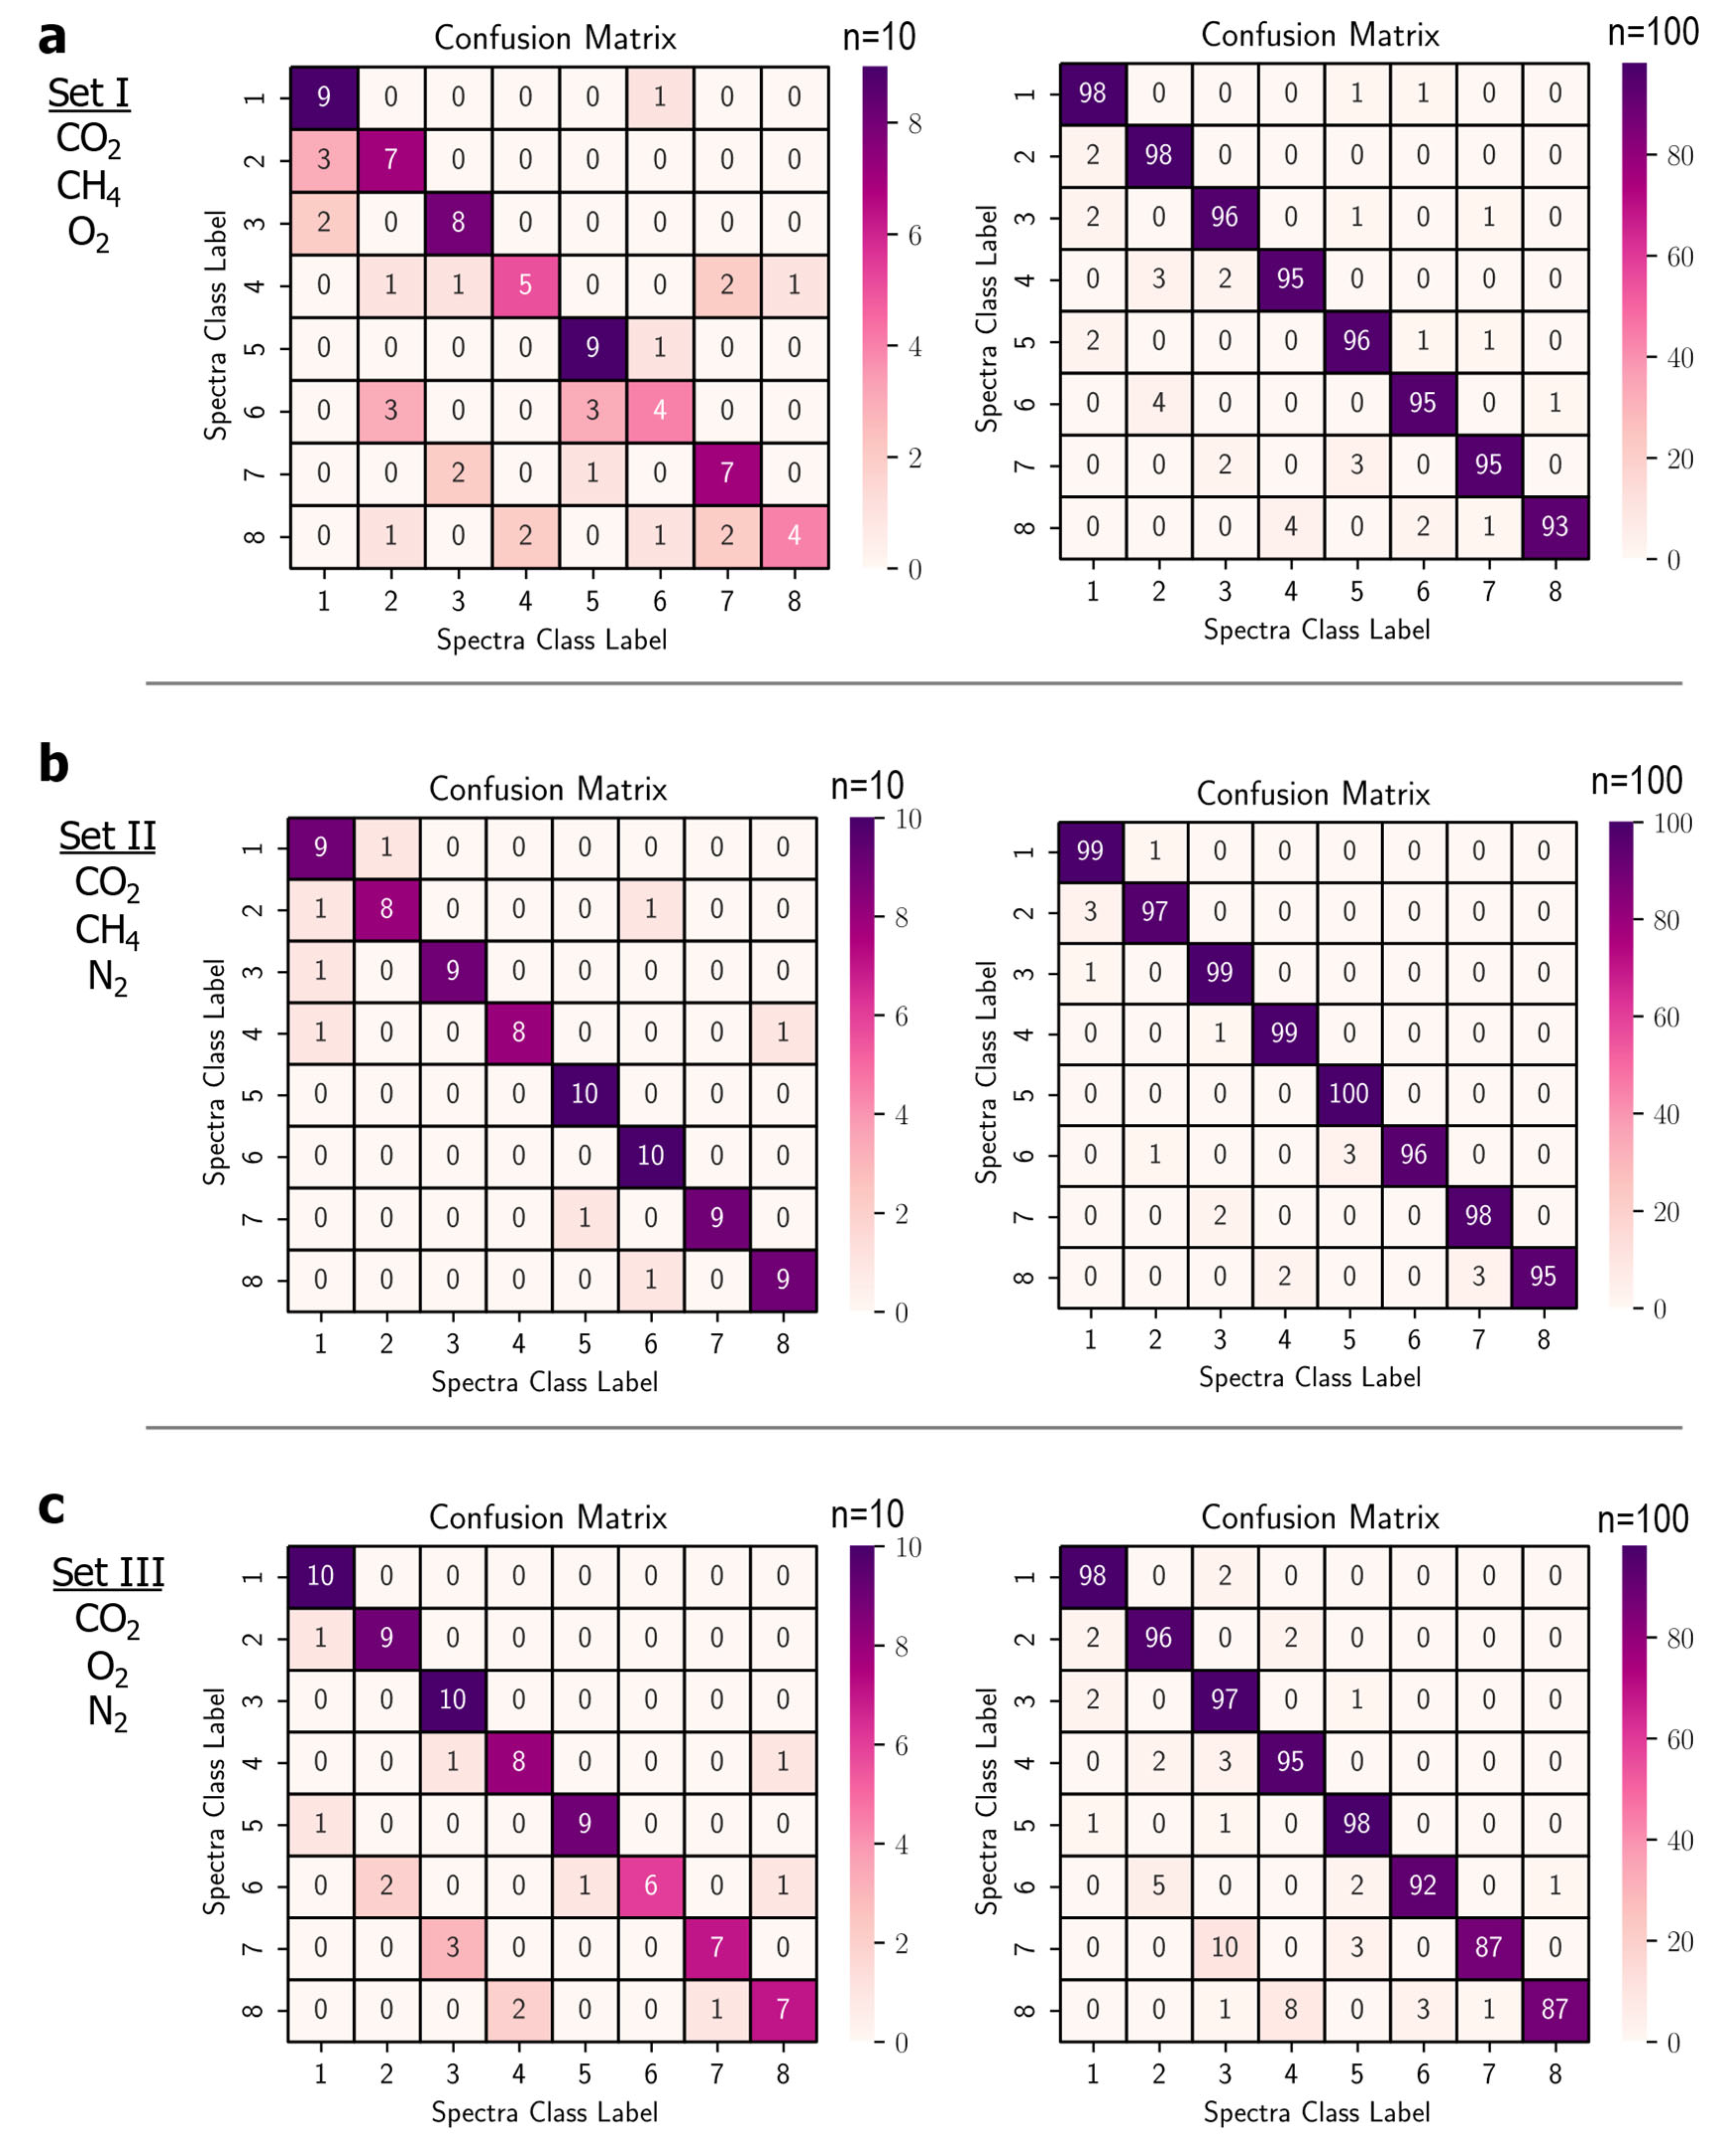
Figure 4.
One-versus-rest ROC curves for all the classifier models for varied gas-mix experiments at varying number of random samples in each class n=10 and n=100. a) Set I for CO2/CH4/O2 mix, b) Set II for CO2/CH4/N2 mix, and c) Set III for CO2/O2/N2 mix. The highest posisble area under the curve (AUC) value is 1.0 indicating good discrimination performance of the classifier favoring very high true positive rate and very low false positive rate.
Figure 4.
One-versus-rest ROC curves for all the classifier models for varied gas-mix experiments at varying number of random samples in each class n=10 and n=100. a) Set I for CO2/CH4/O2 mix, b) Set II for CO2/CH4/N2 mix, and c) Set III for CO2/O2/N2 mix. The highest posisble area under the curve (AUC) value is 1.0 indicating good discrimination performance of the classifier favoring very high true positive rate and very low false positive rate.
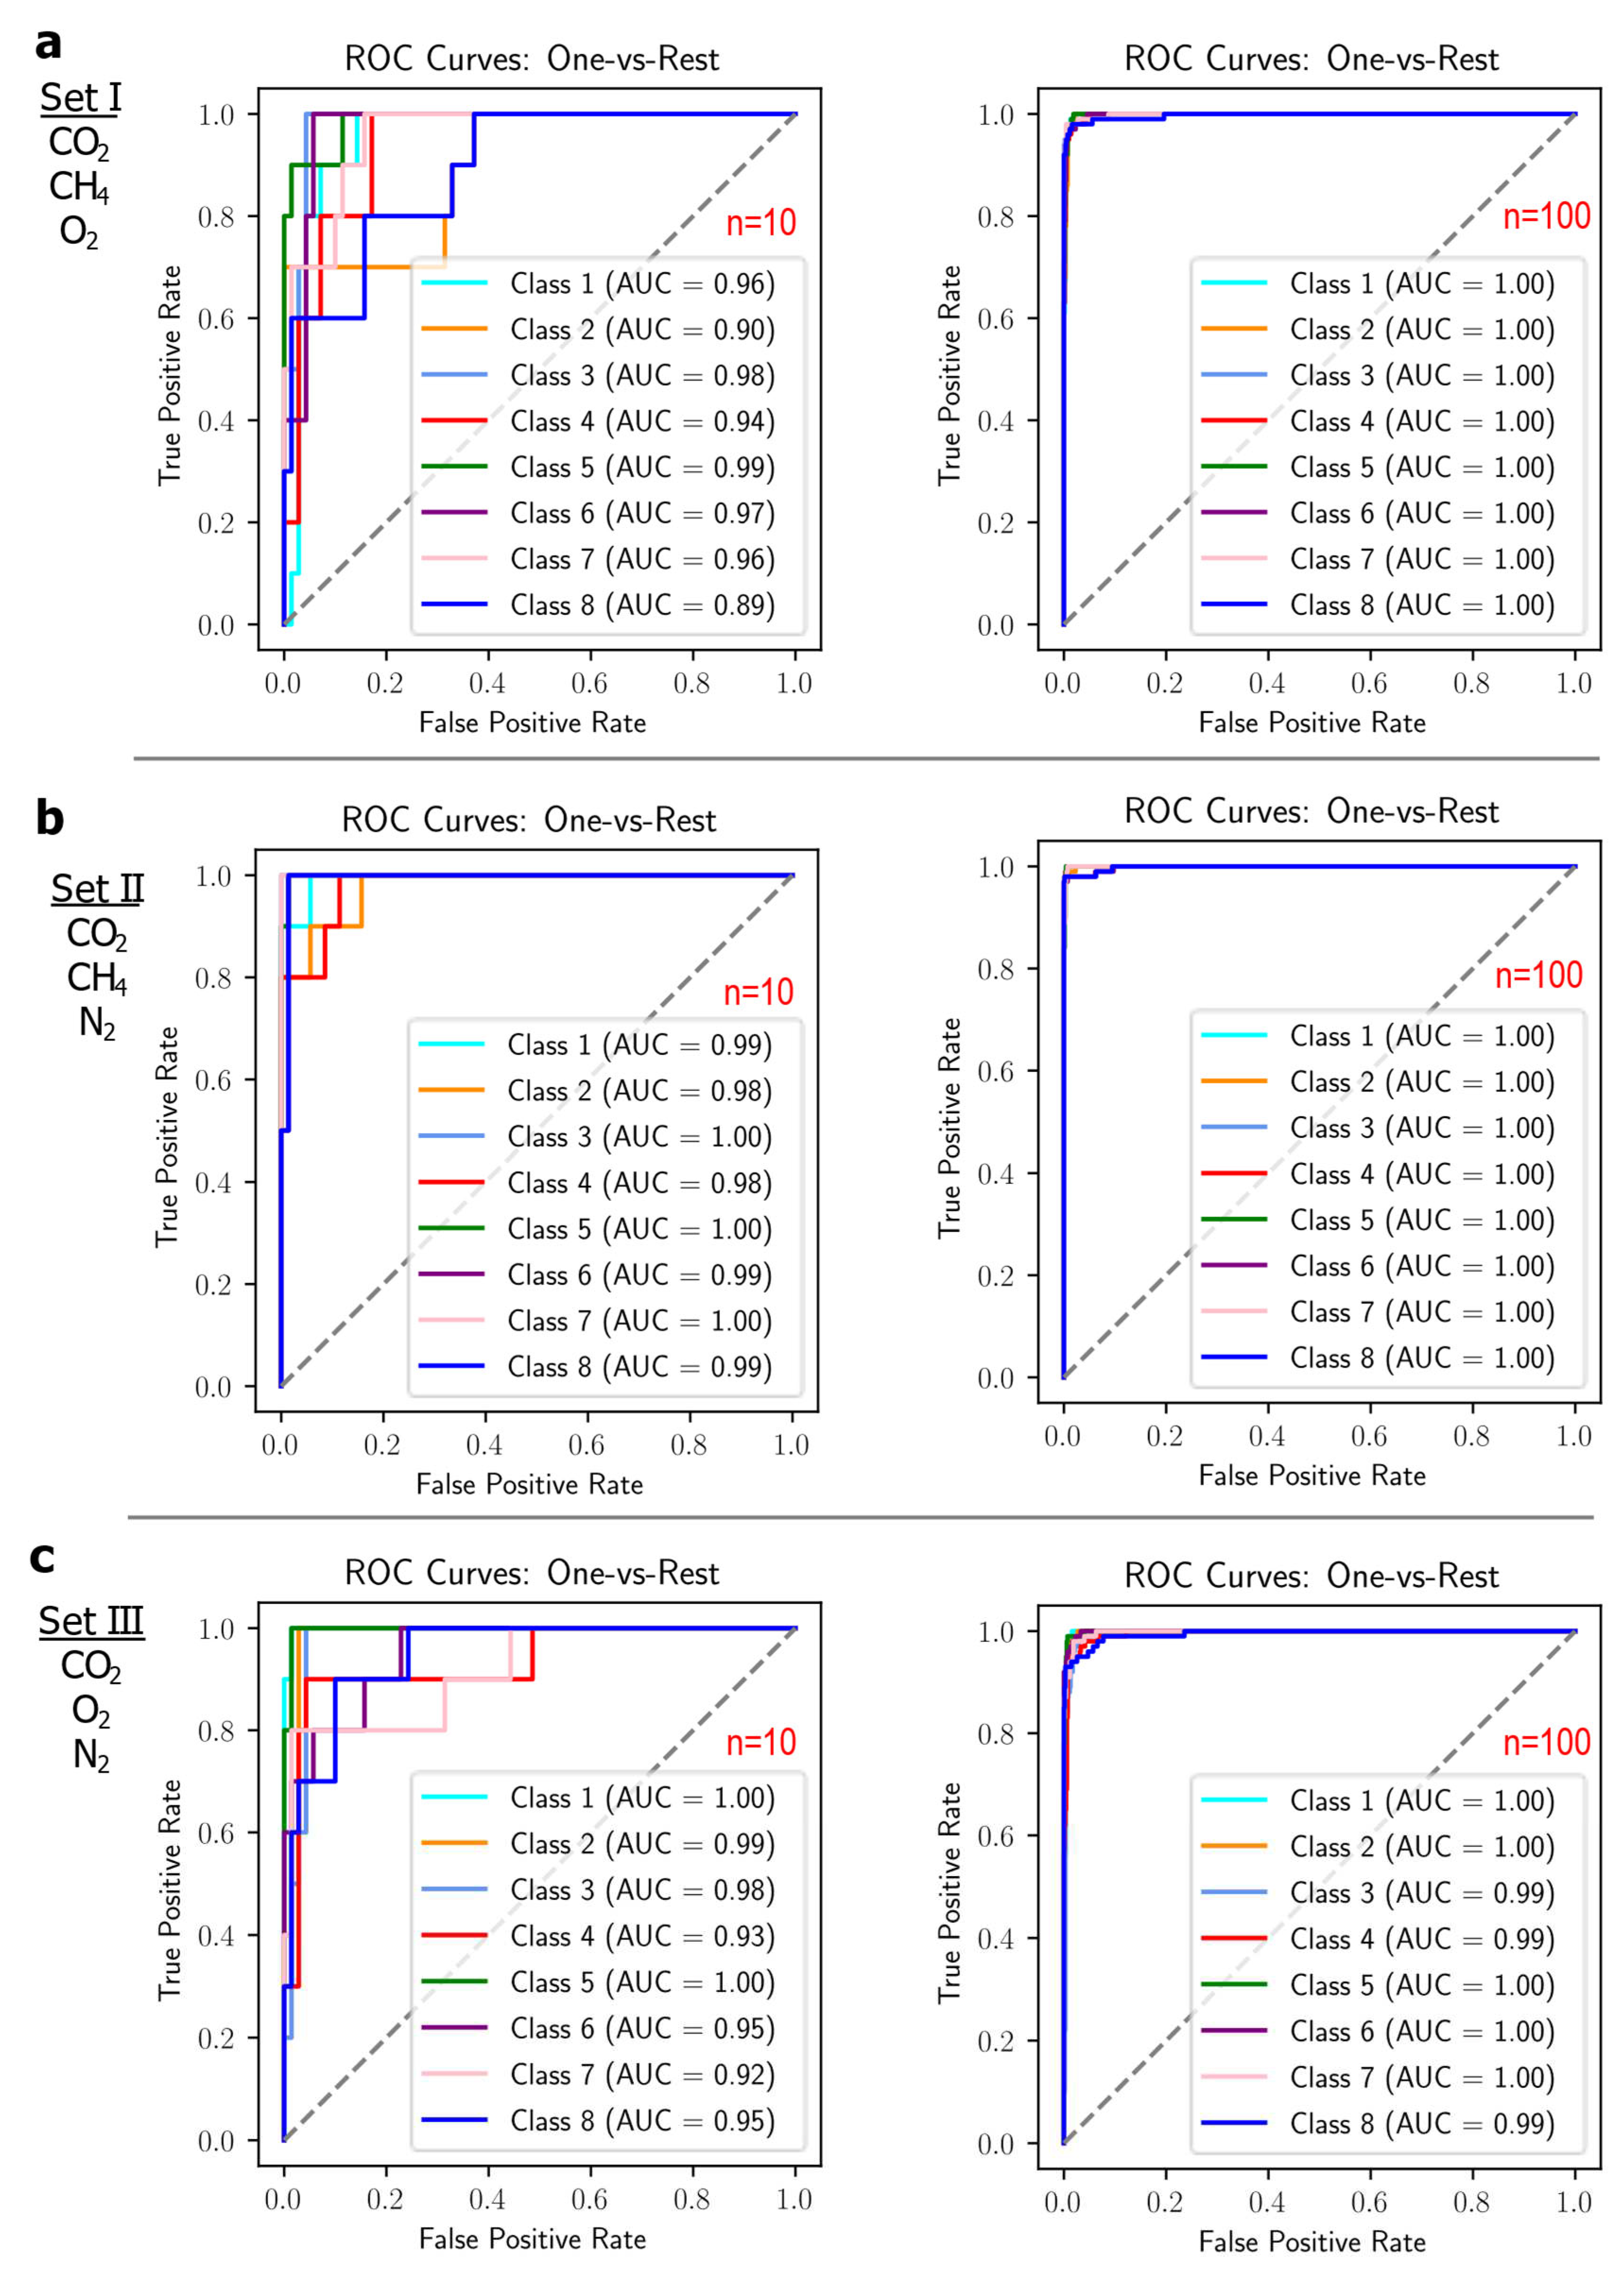

Table 1.
Gas mix simulated in the three spectra sets used in the study.
| Spectra Set | Gas Component 1 | Gas Component 2 | Gas Component 3 |
|---|---|---|---|
| I | CO2 | CH4 | O2 |
| II | CO2 | CH4 | N2 |
| III | CO2 | O2 | N2 |
Table 2.
Summary of classification performance of the forward NN classifier for sets at n=100.
| Set I: CO2/CH4/O2; n =100 | ||||
| Spectra Class | Precision | Recall | F1-score | Support |
| 1 | 0.942308 | 0.98 | 0.960784 | 100 |
| 2 | 0.933333 | 0.98 | 0.956098 | 100 |
| 3 | 0.96 | 0.96 | 0.96 | 100 |
| 4 | 0.959596 | 0.95 | 0.954774 | 100 |
| 5 | 0.950495 | 0.96 | 0.955224 | 100 |
| 6 | 0.959596 | 0.95 | 0.954774 | 100 |
| 7 | 0.969388 | 0.95 | 0.959596 | 100 |
| 8 | 0.989362 | 0.93 | 0.958763 | 100 |
| Overall Accuracy = 0.9575 | ||||
| Set II: CO2/CH4/N2; n =100 | ||||
| Spectra Class | Precision | Recall | F1-score | Support |
| 1 | 0.961165 | 0.99 | 0.975369 | 100 |
| 2 | 0.979798 | 0.97 | 0.974874 | 100 |
| 3 | 0.970588 | 0.99 | 0.980198 | 100 |
| 4 | 0.980198 | 0.99 | 0.985075 | 100 |
| 5 | 0.970874 | 1 | 0.985222 | 100 |
| 6 | 1 | 0.96 | 0.979592 | 100 |
| 7 | 0.970297 | 0.98 | 0.975124 | 100 |
| 8 | 1 | 0.95 | 0.974359 | 100 |
| Overall Accuracy = 0.97875 | ||||
| Set III: CO2/O2/N2; n =100 | ||||
| Spectra Class | Precision | Recall | F1-score | Support |
| 1 | 0.951456 | 0.98 | 0.965517 | 100 |
| 2 | 0.932039 | 0.96 | 0.945813 | 100 |
| 3 | 0.850877 | 0.97 | 0.906542 | 100 |
| 4 | 0.904762 | 0.95 | 0.926829 | 100 |
| 5 | 0.942308 | 0.98 | 0.960784 | 100 |
| 6 | 0.968421 | 0.92 | 0.94359 | 100 |
| 7 | 0.988636 | 0.87 | 0.925532 | 100 |
| 8 | 0.988636 | 0.87 | 0.925532 | 100 |
| Overall Accuracy = 0.9375 | ||||
Disclaimer/Publisher’s Note: The statements, opinions and data contained in all publications are solely those of the individual author(s) and contributor(s) and not of MDPI and/or the editor(s). MDPI and/or the editor(s) disclaim responsibility for any injury to people or property resulting from any ideas, methods, instructions or products referred to in the content. |
© 2023 by the authors. Licensee MDPI, Basel, Switzerland. This article is an open access article distributed under the terms and conditions of the Creative Commons Attribution (CC BY) license (https://creativecommons.org/licenses/by/4.0/).
Copyright: This open access article is published under a Creative Commons CC BY 4.0 license, which permit the free download, distribution, and reuse, provided that the author and preprint are cited in any reuse.