Submitted:
17 August 2023
Posted:
18 August 2023
You are already at the latest version
Abstract
Keywords:
1. Introduction
2. Results
2.1. Baseline characteristics of the study participants
2.2. Association of changes in clinical indices at different 3-month intervals
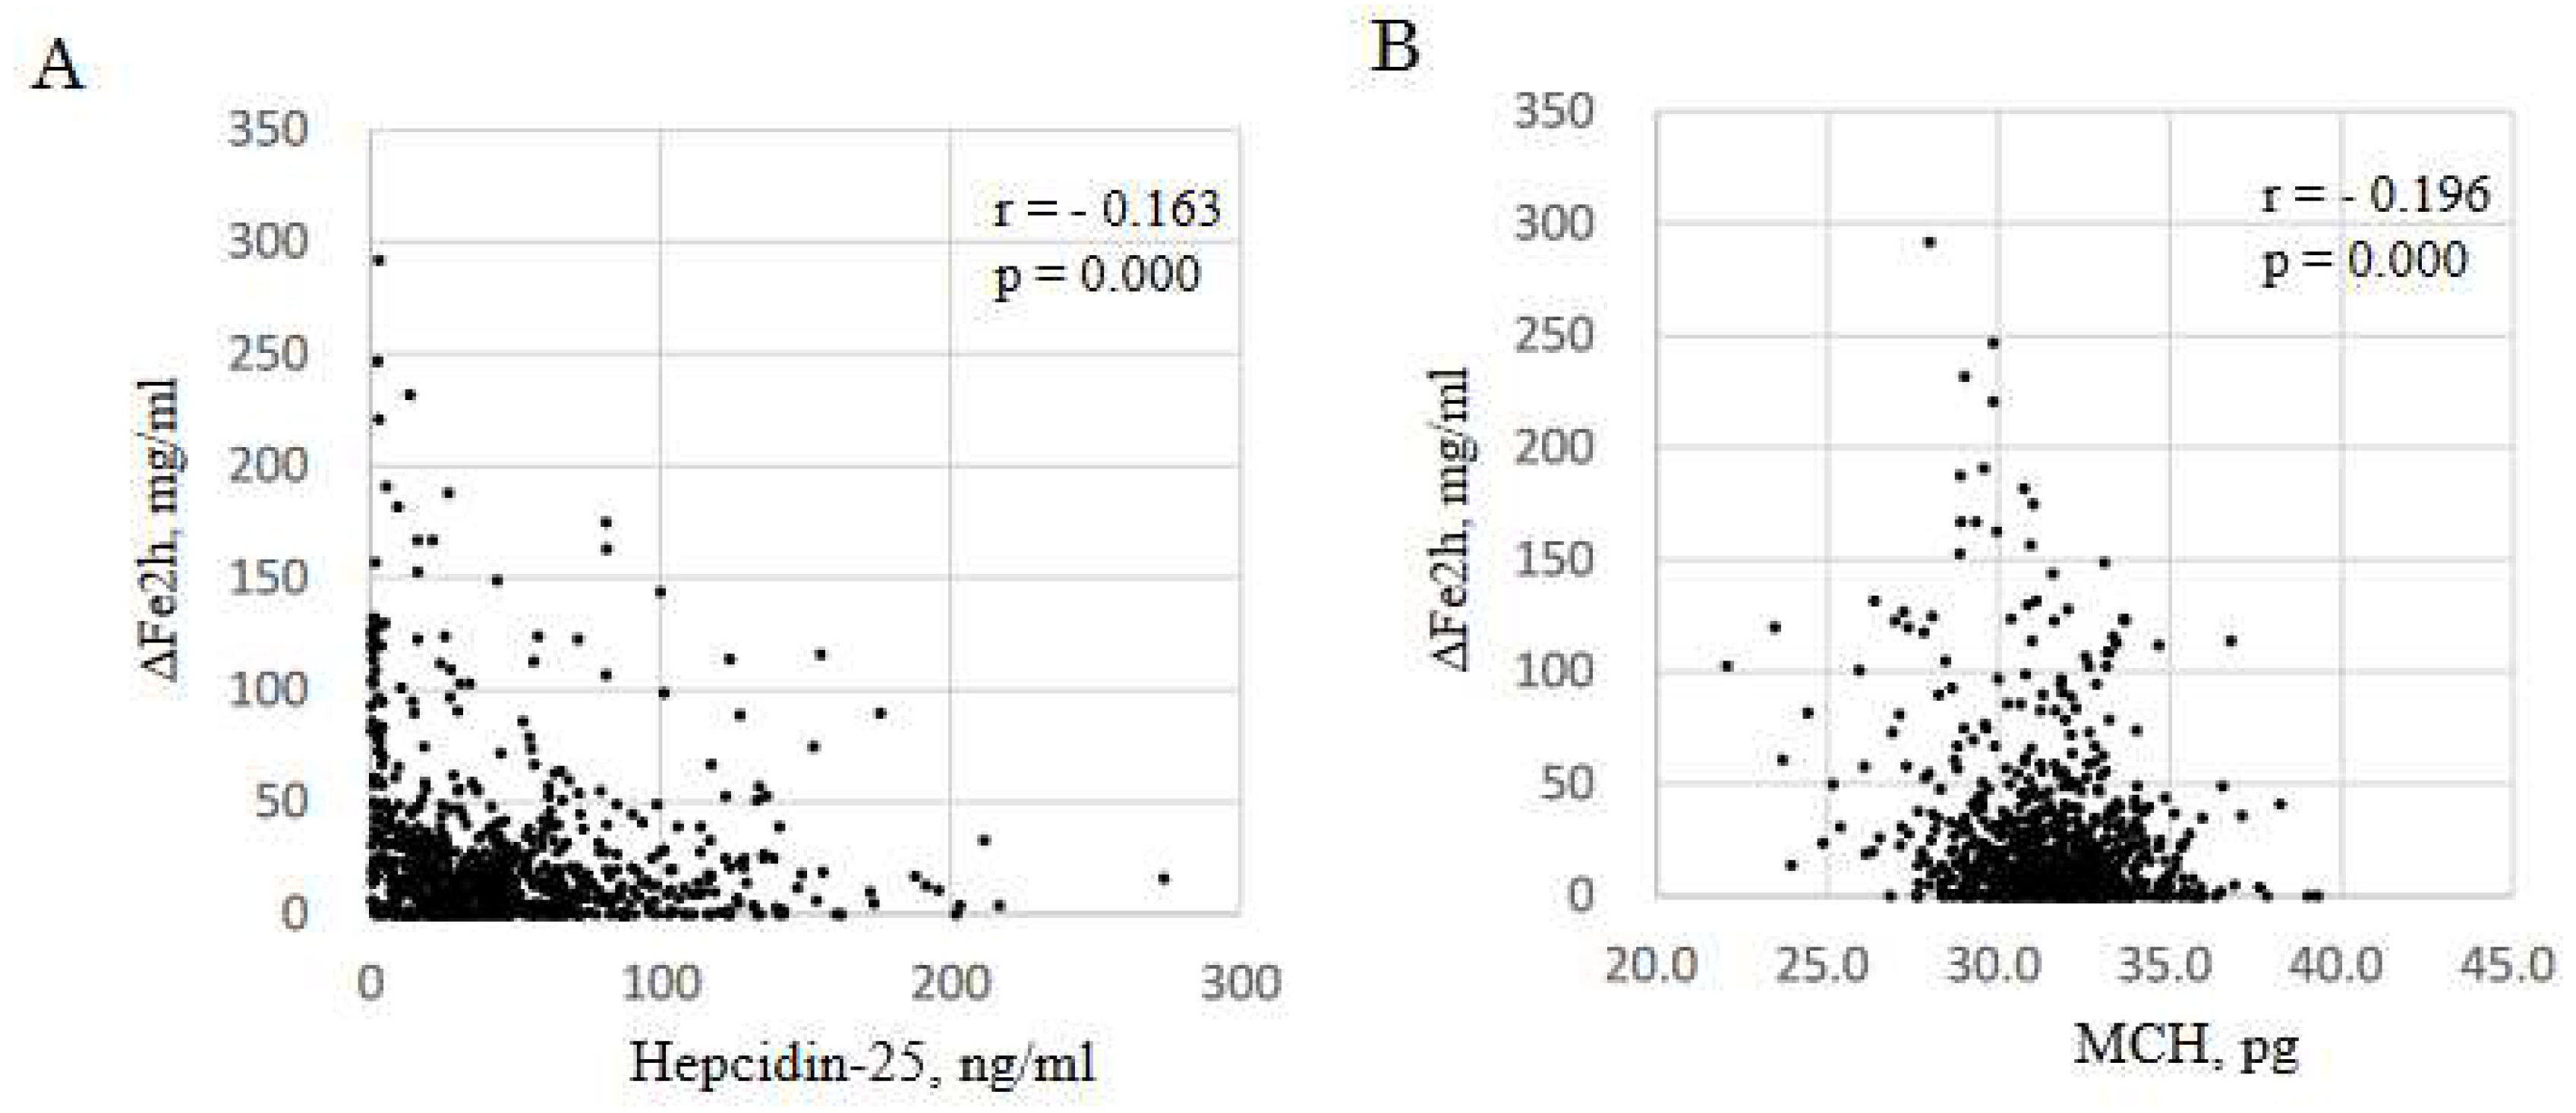
2.3. Association of ΔFe2h with iron variables
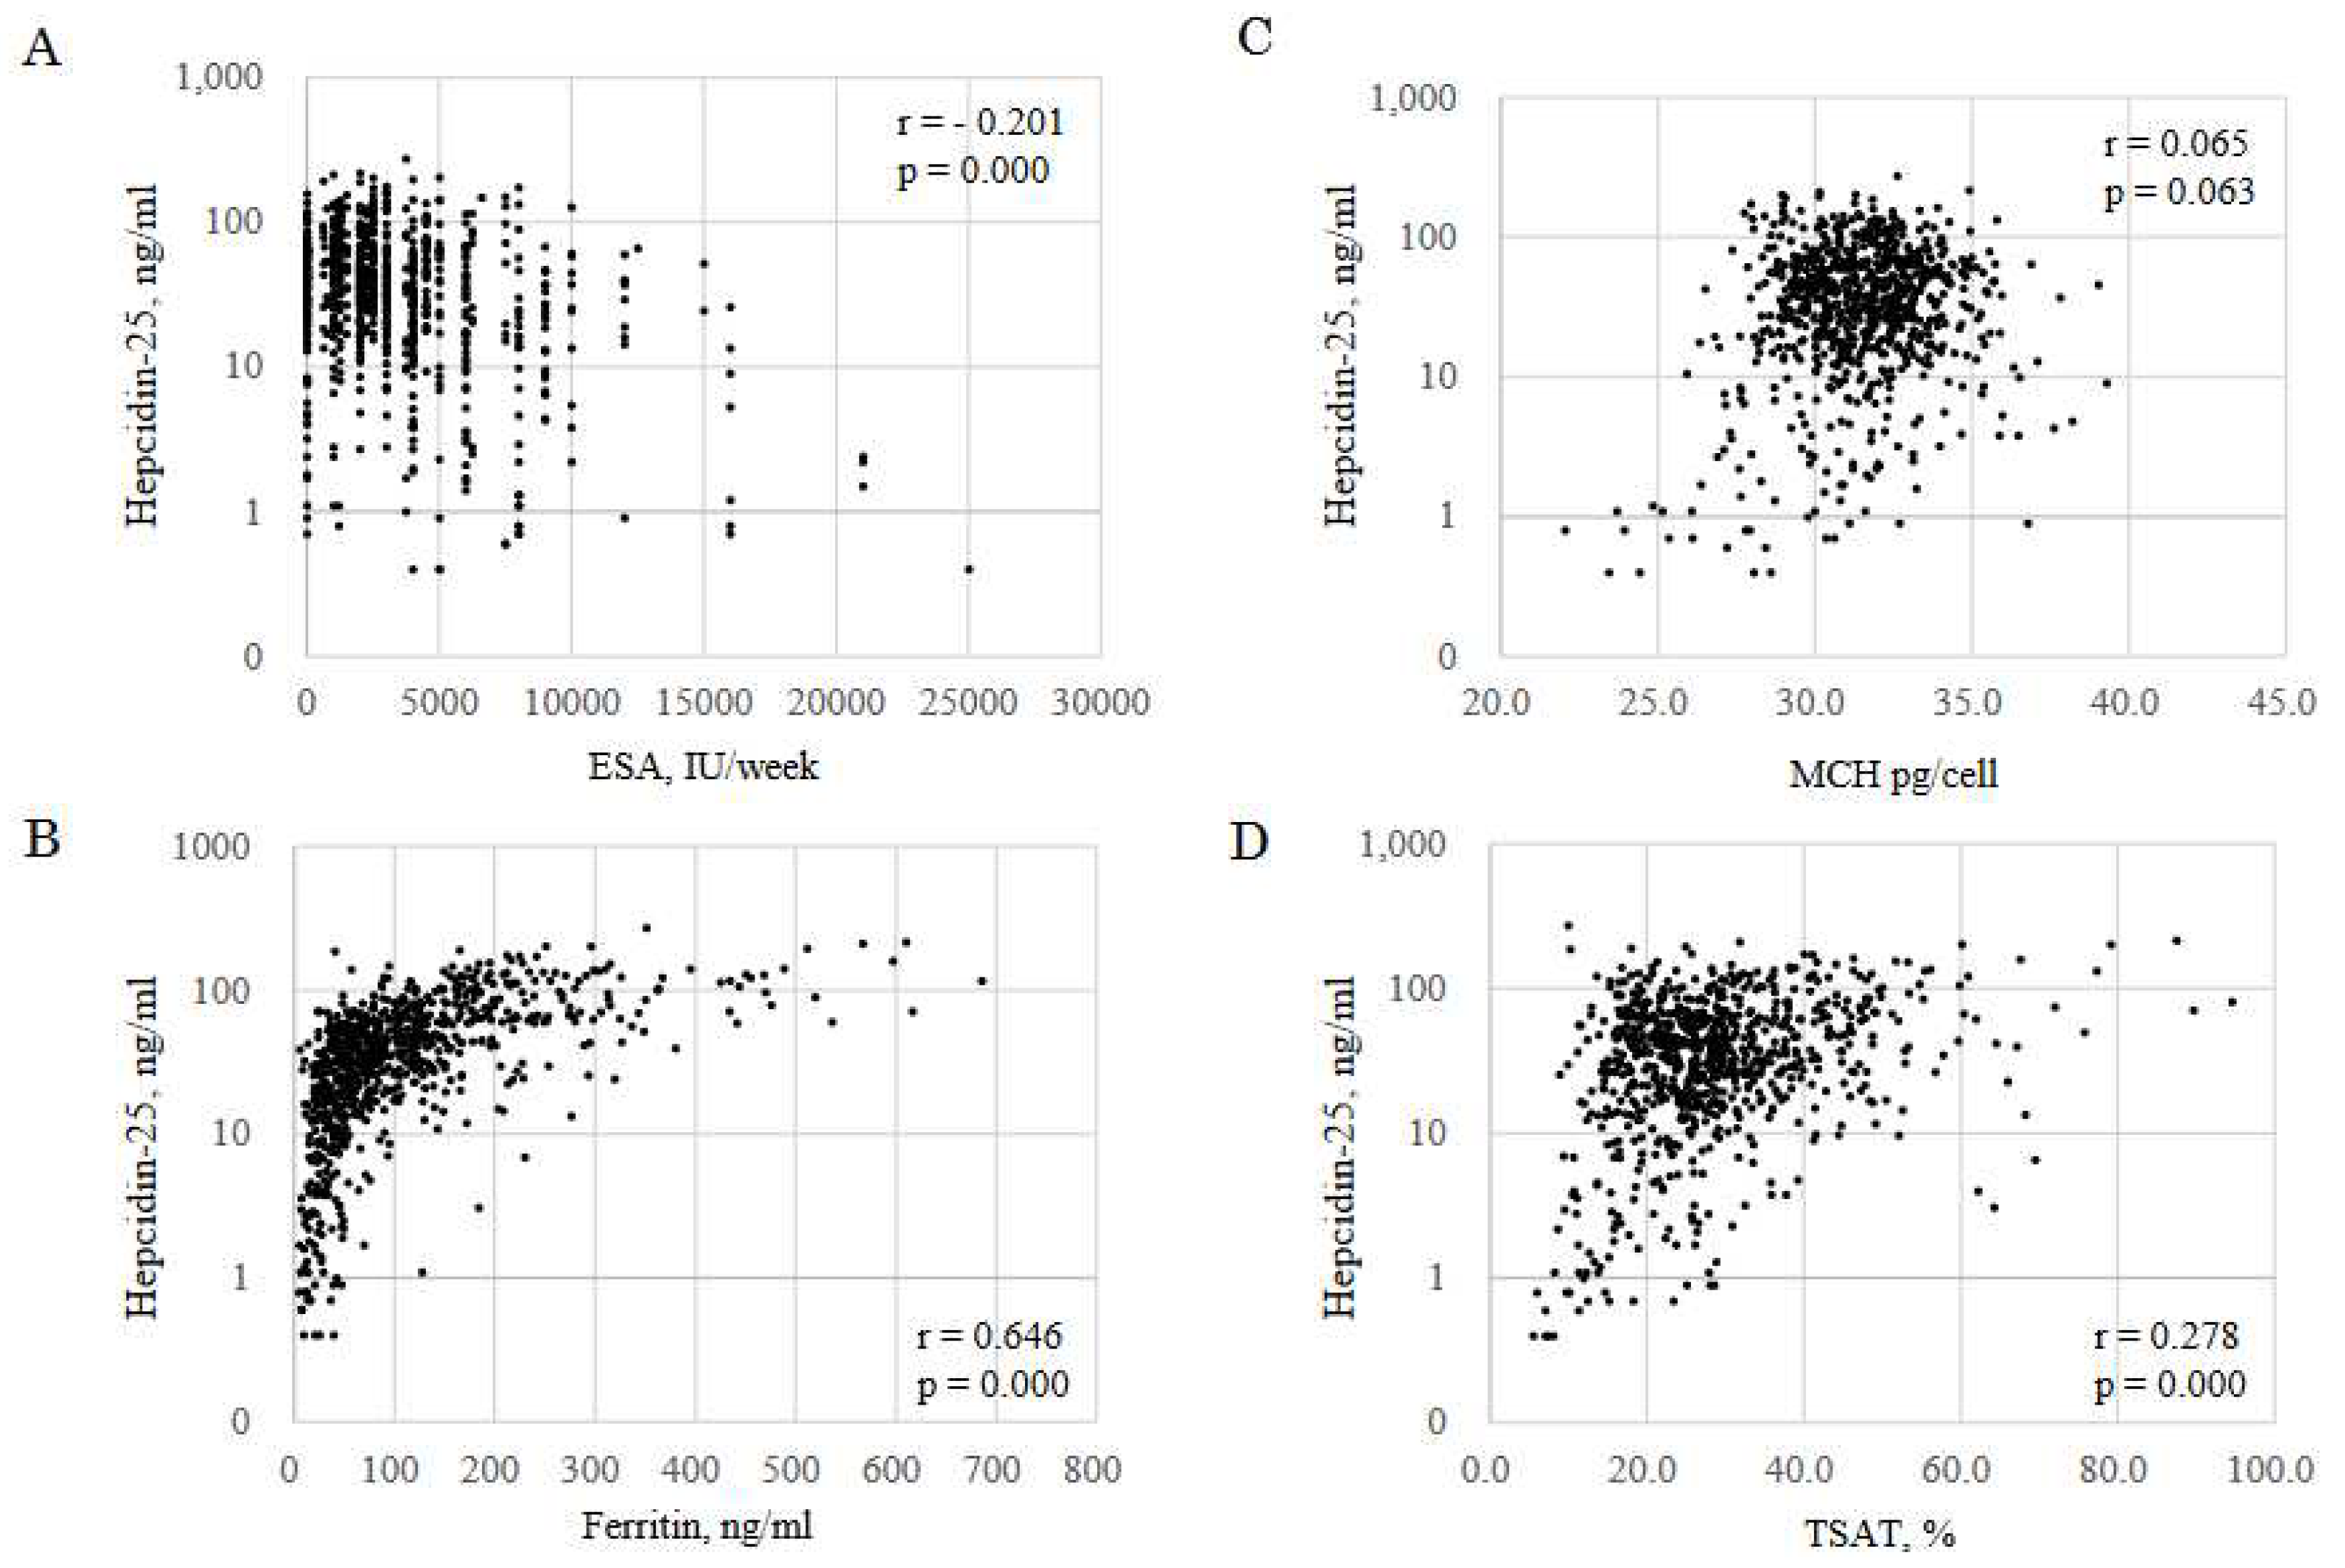
2.4. Association of hepcidin-25 with iron variables
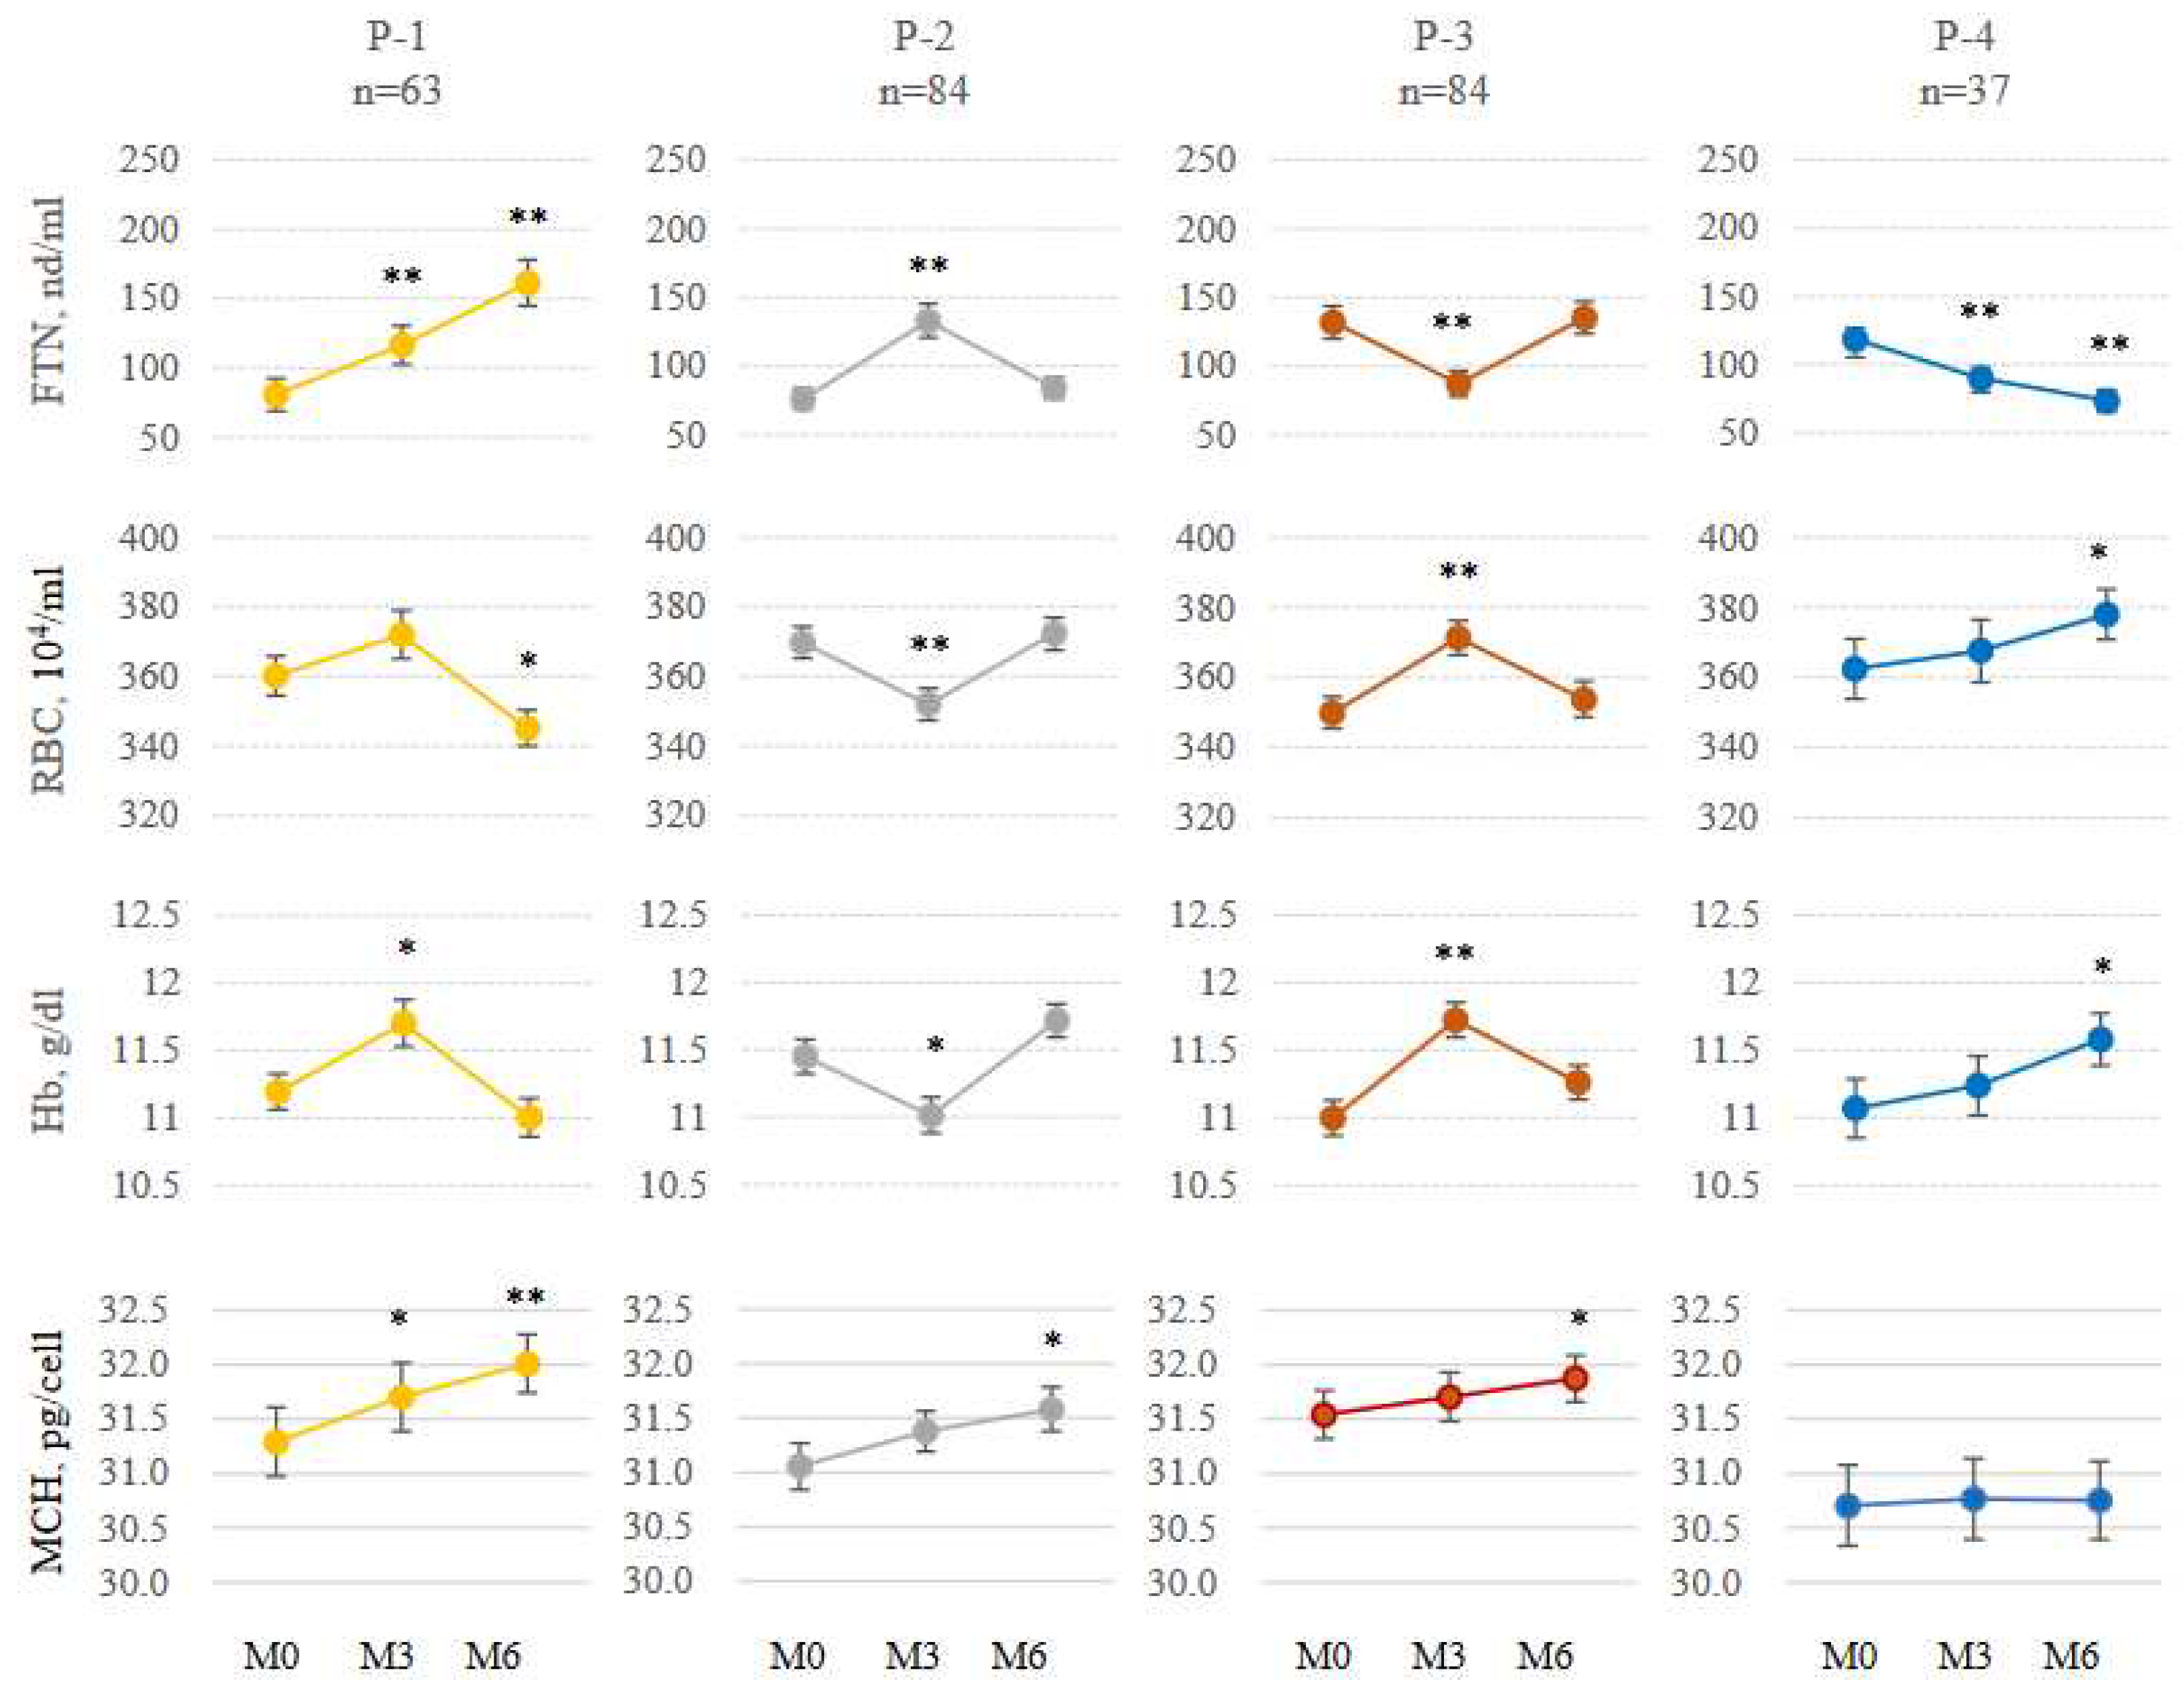
2.5. Patterns of FTN fluctuations
2.6. Background of changes in FTN
3. Discussion
4. Materials and methods
4.1. Study design and data sources
4.2. Procedures
4.3. Estimating iron absorption
4.4. Statistical analysis
Author Contributions
Funding
Institute Review Board Statement
Informed Consent Statement
Acknowledgments
Conflicts of Interest
References
- Fishbane, S.; Spinowitz, B. Update on anemia in ESRD and earlier stages of CKD: core curriculum 2018. Am J Kidney Dis. 2018, 71, 423–35. [CrossRef]
- Besarab, A.; Coyne, D.W. Iron supplementation to treat anemia in patients with chronic kidney disease. Nat Rev Nephrol. 2010, 6, 699–710. [CrossRef]
- Pergola, P.E.; Fishbane, S.; Ganz, T. Novel oral iron therapies for iron deficiency anemia in chronic kidney disease. Adv Chronic Kidney Dis. 2019, 26, 272–91. [CrossRef]
- Yokoyama, K.; Akiba, T.; Fukagawa, M.; Nakayama, M.; Sawada, K.; Kumagai, Y.; Chertow, G.M.; Hirakata H. Long-term safety and efficacy of a novel iron-containing phosphate binder, JTT-751, in patients receiving hemodialysis. J Ren Nutr. 2014, 24, 261–267. [CrossRef]
- Lewis, J.B.; Sika, M.; Koury, M.J.; Chuang, P.; Schulman, G.; Smith, M.T.; Whittier, F.C.; Linfert, D.R.; Galphin, C.M.; Athreya, B.P. et al. Ferric citrate controls phosphorus and delivers iron in patients on dialysis. J Am Soc Nephrol. 2015, 26, 493–503. [CrossRef]
- Umanath, K.; Jalal, D.I.; Greco, B.A.; Umeukeje, E.M.; Reisin, E.; Manley, J.; Zeig, S.; Negoi, D.G.; Hiremath, A.N.; Blumenthal, S.S. et al. Ferric citrate reduces intravenous iron and erythropoiesis-stimulating agent use in ESRD. J Am Soc Nephrol. 2015, 26, 2578–2587. [CrossRef]
- Kühn, L.C. Iron regulatory proteins and their role in controlling iron metabolism. Metallomics. 2015, 7, 232–243. [CrossRef]
- Ramanathan, G.; Olynyk, J.K.; Ferrari, P. Diagnosing and preventing iron overload. Hemodial Int 21(Suppl 1): 2017, S58–S67. [CrossRef]
- Roe, M.A.; Collings, R.; Dainty, J.R.; Swinkels, D.W.; Fairweather-Tait, S.J. Plasma hepcidin concentrations significantly predict interindividual variation in iron absorption in healthy men. Am J Clin Nutr. 2009, 89, 1088–1091. [CrossRef]
- Honda, H.; Kobayashi, Y.; Onuma, S.; Shibagaki, K.; Yuza, T.; Hirao, K.; Yamamoto, T.; Tomosugi, N.; Shibata, T. Associations among erythroferrone and biomarkers of erythropoiesis and iron metabolism, and treatment with long-term erythropoiesis-stimulating agents in patients on hemodialysis. PLoS One 2016, 11, e0151601. [CrossRef]
- Pak, M.; Lopez, M.A.; Gabayan, V.; Ganz, T.; Rivera, S. Suppression of hepcidin during anemia requires erythropoietic activity. Blood 2006, 108, 3730–3735. [CrossRef]
- Gulec, S.; Anderson, G.J.; Collins, J.F. Mechanistic and regulatory aspects of intestinal iron absorption. Am J Physiol Gastrointest Liver Physiol. 2014,307, G397–G409. [CrossRef]
- Kautz, L.; Jung, G.; Valore, E.V.; Rivella, S.; Nemeth, E.; Ganz, T. Identification of erythroferrone as an erythroid regulator of iron metabolism. Nat Genet. 2014, 46, 678-684. [CrossRef]
- Li, H.; Ginzburg, Y.Z. Crosstalk between iron metabolism and erythropoiesis. Adv Hematol. 2010, 2010, 605435. [CrossRef]
- Verga Falzacappa, M.V.; Vujic Spasic, M.; Kessler, R.; Stolte, J.; Hentze, M.W.; Muckenthaler, M.U. STAT3 mediates hepatic hepcidin expression and its inflammatory stimulation. Blood. 2007, 109, 353–358. [CrossRef]
- Chaston, T.; Chung, B.; Mascarenhas, M.; Marks, J.; Patel, B.; Srai, S.K.; Sharp, P. Evidence for differential effects of hepcidin in macrophages and intestinal epithelial cells. Gut 2008, 57, 374–382. [CrossRef]
- Brasse-Lagnel, C.; Karim, Z.; Letteron, P.; Bekri, S.; Bado, A.; Beaumont, C. Intestinal DMT1 cotransporter is down-regulated by hepcidin via proteasome internalization and degradation. Gastroenterology 2011, 140, 1261–1271. [CrossRef]
- Nemeth, E.; Ganz, T. Hepcidin-Ferroportin Interaction Controls Systemic Iron Homeostasis. Int J Mol Sci. 2021, 22, 6493. [CrossRef]
- Wintrobe, M.M. The erythrocyte. In: Wintrobe MM, editor. Clinical hematology. 6 th ed. Philadelphia: Lea & Febiger, 1967, Chap 2: 63–103.
- Vajpayee, N.; Graham, S.S.; Bem, S. Basic examination of blood and bone marrow. In: McPherson RA, Pincus MR, editor. Henry’s clinical diagnosis and management by laboratory methods. 22nd ed. Philadelphia: WB Saunders, 2011, Chap 30: 509-35.
- Kawabata, H. Transferrin and transferrin receptors update. Free Radic Biol Med. 2019, 133, 46-54. [CrossRef]
- Eschbach, J.W.; Cook, J.D.; Scribner, B.H.; Finch, C.A. Iron balance in hemodialysis patients. Ann Intern Med. 1977, 87, 710-713. [CrossRef]
- Camaschella, C.; Nai, A.; Silvestri L. Iron metabolism and iron disorders revisited in the hepcidin era. Haematologica. 2020, 105, 260-272. [CrossRef]
- Egrie, J.C.; Strickland, T.W.; Lane, J.: Aoki, K.; Cohen, A.M.; Smalling, R.; Trail, G.; Lin, F.K.; Browne, J.K.; Hines, D.K. Characterization and biological effects of recombinant human erythropoietin. Immunobiology 1986, 172, 213–224. [CrossRef]
- Kawabata, H..; Fleming, R.E.; Gui, D.; Moon, S.Y.; Saitoh, T.; O'Kelly, J.; Umehara, Y.; Wano, Y.; Said, J.W.; Koeffler, H.P. Expression of hepcidin is down-regulated in TfR2 mutant mice manifesting a phenotype of hereditary hemochromatosis, Blood 2005,105, 376–381. [CrossRef]
- Daru, J.; Colman, K.; Stanworth, S.J; De La Salle, B.; Wood, E.M.; Pasricha, S.R. Serum ferritin as an indicator of iron status: what do we need to know?Am J Clin Nutr. 2017, 106, 1634S-1639S. [CrossRef]
- Babitt, J.L.; Eisenga, M.F.; Haase, V.H.; Kshirsagar, A.V.; Levin, A.; Locatelli, F.; Małyszko, J.; Swinkels, D.W.; Tarng, D.C.; Cheung, M. et al. Controversies in optimal anemia management: conclusions from a kidney disease: Improving Global Outcomes (KDIGO) Conference. Kidney Int. 2021, 99,1280–1295. [CrossRef]
- Tsubakihara, Y.; Nishi, S.; Akiba, T.; Hirakata, H.; Iseki, K.; Kubota, M.; Kuriyama, S.; Komatsu, Y.; Suzuki, M.; Nakai, S. et al. 2008 Japanese Society for Dialysis Therapy: guidelines for renal anemia in chronic kidney disease. Ther Apher Dial. 2010, 14,240–275. [CrossRef]
- Soe-Lin, S.; Apte, S.S.; Andriopoulos, B.Jr.; Andrews, M.C.; Schranzhofer, M.; Kahawita, T.; Garcia-Santos, D.; Ponka, P. et al. Nramp1 promotes efficient macrophage recycling of iron following erythrophagocytosis in vivo. Proc Natl Acad Sci USA. 2009, 106, 5960–5965. [CrossRef]
- Zhang, D.L.; Ghosh, M.C.; Ollivierre, H.; Li, Y.; Rouault, T.A. Ferroportin deficiency in erythroid cells causes serum iron deficiency and promotes hemolysis due to oxidative stress. Blood 2018, 132, 2078–2087. [CrossRef]
- Coffey, R.; Ganz, T. Iron homeostasis: an anthropocentric perspective. J Biol Chem. 2017, 292, 12727–12734. [CrossRef]
- Santini, V.; Girelli, D.; Sanna, A.; Martinelli, N.; Duca, L.; Campostrini, N.; Cortelezzi, A.; Corbella, M.; Bosi, A.; Reda, G. et al. Hepcidin levels and their determinants in different types of myelodysplastic syndromes. PLOS ONE 2011, 6, e23109. [CrossRef]
- Tantiworawit, A.; Khemakapasiddhi, S.; Rattanathammethee, T.; Hantrakool, S.; Chai-Adisaksopha, C.; Rattarittamrong, E.; Norasetthada, L.; Charoenkwan, P.; Srichairatanakool, S.; Fanhchaksai, K. Correlation of hepcidin and serum ferritin levels in thalassemia patients at Chiang Mai University Hospital. Biosci Rep 2021, 41, BSR20203352. [CrossRef]
- Daimon, S. Efficacy for anaemia and changes in serum ferritin levels by long-term oral iron administration in haemodialysis patients. Ther Apher Dial 2019, 23, 444–450. [CrossRef]
- Rausa, M.; Pagani, A.; Nai, A.; Campanella, A.; Gilberti, M.E.; Apostoli, P.; Camaschella, C.; Silvestri, L. Bmp6 expression in murine liver non parenchymal cells: a mechanism to control their high iron exporter activity and protect hepatocytes from iron overload? PLoS One 2015, 10, e0122696. [CrossRef]
- Kawabata, H.; Usuki, K.; Shindo-Ueda, M.; Kanda, J.; Tohyama, K.; Matsuda, A.; Araseki, K.; Hata, T.; Suzuki, T.; Kayano, H. et al. Serum ferritin levels at diagnosis predict prognosis in patients with low blast count myelodysplastic syndromes. Int J Hematol 2019, 110, 533-42. [CrossRef]
- Murao, N.; Ishigai, M.; Yasuno, H.; Shimonaka, Y.; Aso Y. Simple and sensitive quantification of bioactive peptides in biological matrices using liquid chromatography/selected reaction monitoring mass spectrometry coupled with trichloroacetic acid clean-up. Rapid Commun Mass Spectrom. 2007, 21, 4033–4038. [CrossRef]
- Aljama, P.; Bommer, J.; Canaud, B.; Carrera, F.; Eckardt, K.U.; Hörl, W.H.; Krediet, R.T.; Locatelli, F.; Macdougall, I.C.; Wikström, B. Practical guidelines for the use of NESP in treating renal anaemia. Nephrol Dial Transpl. 2001,16 (Suppl 3), 22-28. [CrossRef]
- Carrera, F.; Lok, C.E.; de Francisco, A.; Locatelli, F.; Mann, J.F.; Canaud, B.; Kerr, P.G.; Macdougall, I.C.; Besarab, A.; Villa, G. et al. Maintenance treatment of renal anaemia in haemodialysis patients with methoxy polyethylene glycolepoetin beta versus darbepoetin alfa administered monthly: a randomized comparative trial. Nephrol Dial Transpl. 2010, 25, 4009-4017. [CrossRef]
- Conway, R.E.; Geissler, C.A.; Hider, R.C.; Thompson, R.P.; Powell, J.J. Serum iron curves can be used to estimate dietary iron bioavailability in humans. J Nutr. 2006, 136, 1910–1914. [CrossRef]
| Characteristics | Baseline (n = 268) |
|---|---|
| Age (years) | 63.0 (11.6) |
| Males, age, n (%) | 63.8 (11.3), 153 (57%) |
| Females, age, n (%) | 62.0 (12.0), 115 (43%) |
| Riona | |
| 3 tablets (750 mg of FCH) | 149 (55.6%) |
| 6 tablets (1500 mg of FCH) | 101 (37.7%) |
| 9 tablets (2250 mg of FCH) | 18 (6.7 %) |
| ESA | |
| EPO, n (%) | 40 (14.9%) |
| DP, n (%) | 133 (49.6%) |
| MC, n (%) | 65 (24.3%) |
| No ESA, n (%) | 30 (11.2%) |
| Baseline | 3 months | 6 months | |||||||||||
|---|---|---|---|---|---|---|---|---|---|---|---|---|---|
| M0 (n = 268) | M3 (n = 268) | M6 (n = 268) | |||||||||||
| mean | (sd) | mean | (sd) | mean | (sd) | p | |||||||
| ESA, IU/week | 3679.3 | (3406.8) | 3256.1 | (3205.9) | 3147.7 | (3026.6) | 0.001 | ||||||
| RBC, 104/ml | 360.3 | (44.5) | 364.9 | (48.4) | 360.9 | (45.5) | 0.216 | ||||||
| Hb, g/dl | 11.2 | (1.2) | 11.4 | (1.3) | 11.4 | (1.2) | 0.015 | ||||||
| Ht, % | 34.6 | (3.8) | 35.1 | (4.0) | 34.9 | (3.6) | 0.135 | ||||||
| MCV | 95.8 | (8.8) | 96.6 | (5.5) | 96.6 | (7.5) | 0.117 | ||||||
| MCH, pg/cell | 31.2 | (2.2) | 31.5 | (2.1) | 31.7 | (2.0) | 0.000 | ||||||
| Plat, 104/ml | 19.2 | (5.9) | 20.1 | (14.8) | 18.8 | (6.1) | 0.169 | ||||||
| S-Fe, mg/dl | 65.7 | (26.2) | 70.3 | (28.4) | 69.8 | (27.8) | 0.053 | ||||||
| Ferritin, ng/ml | 100.7 | (93.2) | 108.9 | (99.6) | 116.7 | (102.7) | 0.001 | ||||||
| TSAT, % | 27.4 | (11.6) | 28.9 | (12.0) | 29.5 | (12.5) | 0.047 | ||||||
| Hepcidin-25, ng/ml | 42.9 | (38.7) | 50.5 | (41.6) | 45.6 | (35.6) | 0.006 | ||||||
| DFe2h, mg/dl | 26.6 | (37.2) | 24.7 | (35.8) | 22.9 | (32.3) | 0.270 | ||||||
| P, mg/dl | 5·5 | (1.3) | 5.5 | (1.3) | 5.5 | (1.3) | 0.994 | ||||||
| Albumin, g/dl | 3.9 | (3.4) | 4.1 | (4.1) | 3.9 | (3·5) | 0.282 | ||||||
| AST, IU/L | 13.5 | (6.7) | 13.8 | (6.3) | 13.9 | (7.8) | 0.553 | ||||||
| ALT, IU/L | 11.4 | (5.4) | 11.9 | (7.6) | 12.2 | (9.4) | 0.152 | ||||||
| Al-P, IU/ml | 239·5 | (110.5) | 241.7 | (110.2) | 238 | (111.6) | 0.654 | ||||||
| γ-GTP, IU/L | 21·3 | (21.0) | 20.7 | (17.0) | 22.2 | (25.0) | 0.483 | ||||||
| time course | F | ||||||||||||||||
|---|---|---|---|---|---|---|---|---|---|---|---|---|---|---|---|---|---|
| iron variable | FCH (mg) | M0 | M3 | M6 | FCH | time | interaction | ||||||||||
| amounts | course | effects | |||||||||||||||
| DFe2h, mg/dl | 750 | 23.0 | (37.5) | 18.5 | (36.6) | 17.2 | (28.0) | 3.83* | 0.96 | 0.44 | |||||||
| 1500 | 29.9 | (37.1) | 29.6 | (35.3) | 29.1 | (36.2) | |||||||||||
| 2250 | 25.6 | (44.9) | 27.8 | (50.2) | 21.2 | (46.5) | |||||||||||
| Ferritin, ng/ml | 750 | 72.8 | (72.0) | 81.3 | (70.4) | 84.5 | (78.0) | 20.64** | 6.58* | 1.08 | |||||||
| 1500 | 136.7 | (103.8) | 147.9 | (120.8) | 160.3 | (114.4) | |||||||||||
| 2250 | 129.4 | (112.3) | 118.6 | (105.2) | 139.2 | (121.8) | |||||||||||
| Hepcidin-25, ng/ml | 750 | 33.9 | (32.2) | 41.1 | (32.8) | 36.6 | (24.5) | 15.97** | 2.40 | 0.67 | |||||||
| 1500 | 53.8 | (43.1) | 63.0 | (49.6) | 54.7 | (41.9) | |||||||||||
| 2250 | 56.4 | (44.7) | 58.9 | (39.5) | 68.8 | (51.2) | |||||||||||
| TSAT, % | 750 | 26.5 | (11.5) | 29.1 | (12.5) | 28.7 | (11.2) | 0.67 | 4.52* | 0.35 | |||||||
| 1500 | 28.4 | (11.7) | 28.4 | (11.2) | 29.9 | (13.6) | |||||||||||
| 2250 | 28.3 | (12.1) | 30.1 | (12.2) | 32.8 | (15.4) | |||||||||||
| RBC, 104/ml | 750 | 360.3 | (42.5) | 361.2 | (47.6) | 358.2 | (44.9) | 4.62* | 0.56 | 0.72 | |||||||
| 1500 | 365.3 | (44.9) | 372.5 | (48.7) | 368.7 | (42.5) | |||||||||||
| 2250 | 332.3 | (50.3) | 353.8 | (50.9) | 339.8 | (58.8) | |||||||||||
| Hb, g/dl | 750 | 11.2 | (1.1) | 11.3 | (1.2) | 11.3 | (1.2) | 4.46* | 5.77* | 0.70 | |||||||
| 1500 | 11.4 | (1.2) | 11.6 | (1.4) | 11.6 | (1.1) | |||||||||||
| 2250 | 10.6 | (1.5) | 11.3 | (1.4) | 11.1 | (1.5) | |||||||||||
| MCH, pg/cell | 750 | 31.1 | (2.3) | 31.5 | (2.2) | 31.6 | (2.2) | 1.37 | 10.31* | 0.92 | |||||||
| 1500 | 31.2 | (2.0) | 31.4 | (1.8) | 31.6 | (1.8) | |||||||||||
| 2250 | 32.1 | (2.0) | 32.2 | (2.5) | 32.3 | (2.0) | |||||||||||
| ESA, IU/week | 750 | 3701 | (3318) | 3231 | (3367) | 3015 | (3031) | 0.97 | 0.68 | 2.08 | |||||||
| 1500 | 3606 | (3477) | 3092 | (2738) | 3096 | (2773) | |||||||||||
| 2250 | 3902 | (3901) | 4375 | (4134) | 4527 | (4052) | |||||||||||
| Parameter estimates | ||||||||||
| DFe2h, mg/dl | 95%CI | p value | ||||||||
| Variables | B | SE | lower | upper | ||||||
| hepcidn-25, ng/ml | -0.155 | 0.045 | -0.242 | -0.068 | 0.001 | |||||
| RBC, 104/ml | 0.030 | 0.038 | -0.044 | 0.104 | 0.423 | |||||
| MCH, pg/cell | -2.574 | 0.943 | -4.421 | -0.726 | 0.006 | |||||
| TSAT, % | -0.115 | 0.106 | -0.322 | 0.092 | 0.275 | |||||
| Ferritin, ng/ml | 0.010 | 0.021 | -0.030 | 0.050 | 0.621 | |||||
| ESA, IU/week | 0.001 | 0.001 | 0.000 | 0.002 | 0.113 | |||||
| FCH, 750mg | -10.87 | 9.973 | -30.416 | 8.676 | 0.276 | |||||
| FCH, 1500mg | 0.103 | 9.759 | -19.025 | 19.231 | 0.992 | |||||
| FCH, 2250mg | 0a | |||||||||
| age | 0.018 | 0.123 | -0.224 | 0.259 | 0.884 | |||||
| sex, female | -1.888 | 3.096 | -7.956 | 4.179 | 0.542 | |||||
| sex, male | 0a | |||||||||
| Parameter estimates | |||||||||||||||||||||
| hepcidin-25, ng/dl | 95%CI | p value | ferritin, ng/dl | 95%CI | p value | ||||||||||||||||
| Variables | B | SE | lower | upper | B | SE | lower | upper | |||||||||||||
| hepcidn-25, ng/ml | 0.775 | 0.099 | 0.579 | 0.971 | 0.000 | ||||||||||||||||
| RBC, 104/ml | -0.468 | 0.077 | -0.607 | -0.328 | 0.637 | -0.466 | 0.071 | -0.605 | -0.327 | 0.000 | |||||||||||
| MCH, pg/cell | 2.908 | 1.583 | -0.196 | 6.011 | 0.042 | 2.809 | 1.589 | -0.305 | 5.923 | 0.077 | |||||||||||
| TSAT, % | 0.511 | 0.151 | 0.216 | 0.806 | 0.001 | 0.379 | 0.221 | -0.054 | 0.812 | 0.086 | |||||||||||
| Ferritin, ng/ml | 0.224 | 0.0211 | 0.183 | 0.266 | 0.000 | ||||||||||||||||
| ESA, IU/week | -0.002 | 0.000 | -0.002 | -0.001 | 0.000 | -0.002 | 0.001 | -0.004 | -0.000 | 0.050 | |||||||||||
| FCH, 750mg | -13.863 | 6.137 | -25.891 | -1.835 | 0.024 | -21.650 | 20.939 | -62.689 | 19.389 | 0.148 | |||||||||||
| FCH, 1500mg | -8.856 | 6.437 | -21.472 | 3.761 | 0.169 | 31.967 | 22.078 | -11.306 | 75.239 | 0.148 | |||||||||||
| FCH, 2250mg | 0a | 0a | |||||||||||||||||||
| age | 0.017 | 0.092 | -0.164 | 0.197 | 0.851 | -0.028 | 0.354 | -0.723 | 0.666 | 0.936 | |||||||||||
| sex, female | 10.051 | 2.491 | 5.170 | 14.933 | 0.000 | -6.049 | 8.075 | -21.876 | 9.778 | 0.454 | |||||||||||
| sex, male | 0a | 0a | |||||||||||||||||||
Disclaimer/Publisher’s Note: The statements, opinions and data contained in all publications are solely those of the individual author(s) and contributor(s) and not of MDPI and/or the editor(s). MDPI and/or the editor(s) disclaim responsibility for any injury to people or property resulting from any ideas, methods, instructions or products referred to in the content. |
© 2023 by the authors. Licensee MDPI, Basel, Switzerland. This article is an open access article distributed under the terms and conditions of the Creative Commons Attribution (CC BY) license (http://creativecommons.org/licenses/by/4.0/).


