Submitted:
15 August 2023
Posted:
16 August 2023
You are already at the latest version
Abstract
In the field of clinical medicine, the real-time monitoring of carbon dioxide gas exhaled by the human body is of great significance. At present, the detection devices in the market are mainly detected by sucking a small amount of gas in the nasal cavity to the detection device, and there are some problems such as too long sampling tubes, easy blockage or distortion, and abnormal gas dispersion. In this paper, a micro-nano optical fiber sensor that can directly detect the concentration of end-tidal carbon dioxide is proposed. The measurement is achieved by using the principle of high evanescent field absorption, and the operating band is 2.004 μm. The sensor uses micro-nano optical fiber as the sensing area, and then detects the presence of carbon dioxide gas exhaled by human body through optical power attenuation. The function of micro-nano fiber is to realize the transmission of signal light and also serve as the absorption medium of the gas to be measured. In addition, the variation of light power also reflects the respiratory cycle of the human body. The sensor can realize rapid real-time response to carbon dioxide gas detection, with small size, low cost, and easy to replace. It has great application potential in clinical scenarios such as Gastrointestinal Endoscopes that require real-time monitoring of human respiration.
Keywords:
respiratory carbon dioxide
; absorption theory
; micro-nano fiber
; optical sensor
1. Introduction
With the aging of the world's population, the proportion of patients with various underlying diseases is gradually increasing, and the demand for high-precision and low-cost human physiological index detection devices in the field of clinical medicine is also increasing simultaneously. For gastrointestinal endoscopy, routine anesthesia monitoring includes blood pressure and oxygen saturation. However, statistics show that the probability of respiratory complications during anesthesia is as high as 20-30% [1,2,3,4]. Therefore, it is necessary to develop a low-cost device for real-time and continuous concentration of end-tidal carbon dioxide monitoring. The detection of concentration of end-tidal carbon dioxide is more rapid, safe, non-invasive, and easy to operate than blood oxygen saturation detection. Clinical trials have shown that continuous concentration of end-tidal carbon dioxide monitoring can evaluate human circulatory function, identify airway obstruction, reduce the occurrence of hypoxemia events (oxygen saturation below 90%), and improve patient survival [5].
Because of high sensitivity and the characteristics of small volume, optical sensor is widely adopted in the form of gas sensor. Typical applications include hand-held respiratory monitoring sensor [6] and Capone5, which is monitoring equipment of pressure of end-tidal carbon dioxide (PetCO2) applied in the hospital [7]. These systems operate on the principle of non-dispersive infrared (NDIR) absorption, guiding the detected gas to a compact gas chamber device for detection [8,9]. However, potential problems remain, and there are some problems such as too long sampling tubes, easy blockage or distortion, and abnormal gas dispersion. Therefore, there is an urgent requirement to develop an optical sensor that can monitor exhaled CO2 in real time.
Micro-nano fiber can be applied in optical sensors due to its strong evanescent field, high sensitivity, ductility and flexibility. The characteristics of micro-nano optical fibers enable them to have a variety of application scenarios, including liquid refractive index measurement, temperature measurement, gas detection and pressure detection [10,11,12]. A large proportion of micro-nano optical fiber sensors mainly rely on the interaction between light and the object to be measured to detect the change of the refractive index of the optical fiber surface. For gas sensing, this requires the deposition of a specified polymer functional layer, such as a graphene matrix, on the surface of the micro-nano fiber to enhance the sensitivity of detection [13]. However, this method also has obvious limitations, including slow response speed and poor mechanical flexibility, which prevent this sensor from being widely adopted.
In this paper, we exploit an optical micro-nano fiber gas sensor based on the evanescent field absorption principle for monitoring carbon dioxide gas, and the operating light wavelength is 2.004 μm. On one thing, the micro-nano fiber is used for light transmission and transmits the light emitted by the laser source to the detector. It is also utilized as a sensing area to contact the gas to be measured. It is placed near the nasal cavity of the human body, and the periodic change of the carbon dioxide gas exhaled by the human body is reflected through the periodical change of the light power. In addition, compared with the traditional infrared and silicon photonic integrated gas sensors, the micro-nano fiber sensor has a simple structure, real-time monitoring, easy preparation, and other characteristics.
2. Principle and Simulation Modules:
Micro-nano fiber is a guided wave structure with a diameter of several microns. When the diameter of the optical fiber decreases gradually, the basic structure of the optical fiber is destroyed, and the propagating light will be exposed on the surface of the optical fiber in Figure 1.(a). The surface of fiber generates a strong evanescent field, which is extremely sensitive to the change in the surrounding environment[14]. During sensing, the robust evanescent field on the surface of the micro-nano fiber interacts with the exhaled carbon dioxide gas, resulting in an absorption phenomenon. In Figure 1.(b), the total length of the tapered fiber area is represented by L, and the diameter of the micro-nano fiber is denoted by D.
Figure 2 depicts the absorption lines of carbon dioxide gas molecules at 1atm, 296 K in different bands. Carbon dioxide gas has multiple absorption Windows in the infrared region, as shown in Figure 2. According to the vertical axis of the image, the intensity of the absorption spectral line gradually increases as the wavelength of the light moves from the near-infrared to the mid-infrared. For the 4.23 μm band, the absorption of carbon dioxide gas is high enough, but the light source in this band is more expensive than other bands, and the corresponding optical fiber and other equipment need to be customized. The 1.55 μm band light source is more common in market applications and is compatible with most types of optical fibers on the market, but its absorption coefficient is relatively low, resulting in low sensor sensitivity. In addition, there is a cross absorption peak between water and carbon dioxide near 2.68 to 2.80 μm. Therefore, we determined that the working wavelength is 2.004 μm, which corresponds to the strong absorption wavelength of carbon dioxide gas [15], and its and its spectral absorption intensity can reach 1.39×10⁻²¹ (cm−1/molecule∙cm−2).
The attenuation of light intensity can reflect the concentration of the gas to be measured, and it follows the Lambert-Beer law [17].
For the carbon dioxide gas sensor, c and L are the detected gas's concentration and absorption length, respectively, ε is the absorption coefficient of carbon dioxide, and I and I0 are the input and output light field intensities, respectively. The proportion of the evanescent field outside the optical fiber to the total energy is η, it can be calculated by the following formula:
Ptotal and Pgas are the optical power of the measured gas-covered and full-field areas, respectively. Pz represents the Poynting vector in the propagation direction of the z-axis [18]. It can be seen from formula (1) that η affects the attenuation of optical power and, thus, the effect of sensing. The higher the contact area between light and gas to be measured, the better the effect of gas and micro-nano fiber, and the more pronounced the absorption phenomenon of light.
Finite element analysis was used to simulate and calculate the variation of η with the diameter D of the tapered fiber when the operating wavelength was 2.004 μm, so as to determine the influence of different micro-nano fiber parameters on the experimental results. Figure 3.(a-c) shows the distribution of electric field modes of micro-nano fiber with different diameters, Figure 3(d) shows the change of η with the diameter D of the tapered fiber in which the refractive index of the core is 1.45, and the operating wavelength is 2.004 μm, which is corresponded to a strong absorption peak of carbon dioxide. When the micro-nano fiber’s diameter decreases, the evanescent field effect on the tapered fiber surface enhanced, but the transmission loss could be also increased.
3. Experiment and Results
Micro-nano fiber is typically fabricated by physically stretching single-mode fiber (SMF). Figure 4. (a) shows the optical micro-nano fiber drawing machine for preparing different kinds of micro-fiber. Figure 4. (b) shows the frame of hydrogen and oxygen, hydrogen above and oxygen below. The torch is used for melting and burning the fiber for fabricating micro-nano fiber. The tapered fiber will naturally form a conical transition region, as Figure 4. (c-f) shows. The parameters, such as the diameter D and the length L, can be controlled by adjusting the taper drawing process of the machine.
Through different application process settings, we have prepared five kinds of micro-nano fibers with varying waist and taper lengths diameters, as shown in Figure 5. The minimum diameter of the prepared micro-nano fiber is 1.00 μm, and its taper length is 60 μm. Subsequently, the exhaled carbon dioxide gas is monitored with different diameters of micro-nano fiber.
At present, there are two main clinical methods for CO2 concentration detection, the main-flow method and the side-flow method. The schematic diagram is shown in Figure 6 [19]. The side-flow method requires the attachment of a slender tube to the patient's pharynx. A sample of exhaled carbon dioxide gas is passed through a long tube into the air chamber, and changes in the concentration of carbon dioxide gas are observed using a monitor located away from the patient. On the contrary, the main-flow method to detect CO2 concentration refers to placing the sensor device directly under the nostrl, in direct contact with the exhaling carbon dioxide gas of the human body, and the sensing signal is transmitted to the monitor through an optical fiber. In this paper, CO2 concentration was measured by the main-flow method because that the experimental device is smaller in size, and the detection method is more direct and accurate, compared with the side-flow method.
The working principle of the micro-nano optical fiber sensor designed in the ex-periment is shown in Figure 7. The working wavelength of the light source (EP2004-0-DM-DX1-FM) is 2.004 μm. The micro-nano optical fiber is placed in a Nasal cavity tube,which is set near the human nasal cavity to directly sense the exhaled carbon dioxide gas, the influence of external air disturbance on the results can be avoided at the same time.The change of the concentration of carbon dioxide in the exhaled gas is characterized by the change of the detector (Thorlabs S401C) and optical power meter (Thorlabs PM100USB) which the periodic change of CO2 concentration is transferred to the periodic change of optical power. Therefore, micro-nano optical fibers can be adopted to monitor CO2 concentration and characterize the respiration cycle process.
Figure 8 shows the optical power change diagram of respiration monitored by mi-cro-nano fiber at different stages of respiration. Connect the micro-nano fiber to the detector, and its optical power remains stable without sensing, as shown in Figure 8.(a). When carbon dioxide gas is exhaled near the nasal cavity, the gas interacts with the light field on the surface of the micro-nano fiber, and evanescent field absorption occurs. Hence, the optical power reaching the detector will decline as the power curve in Figure 8.(a) decreases.When the air is inhaled near the nasal cavity, the carbon dioxide gas concentration near the nasal cavity becomes rarefied, and the absorption phenomenon is weakened. These reasons enable the power of the detector will increase and maintain the power level with the initial time until the next respiratory cycle begins. When the monitoring is finished, the optical power remains stable and is close to the initial optical power, as shown in Figure 8.(b).
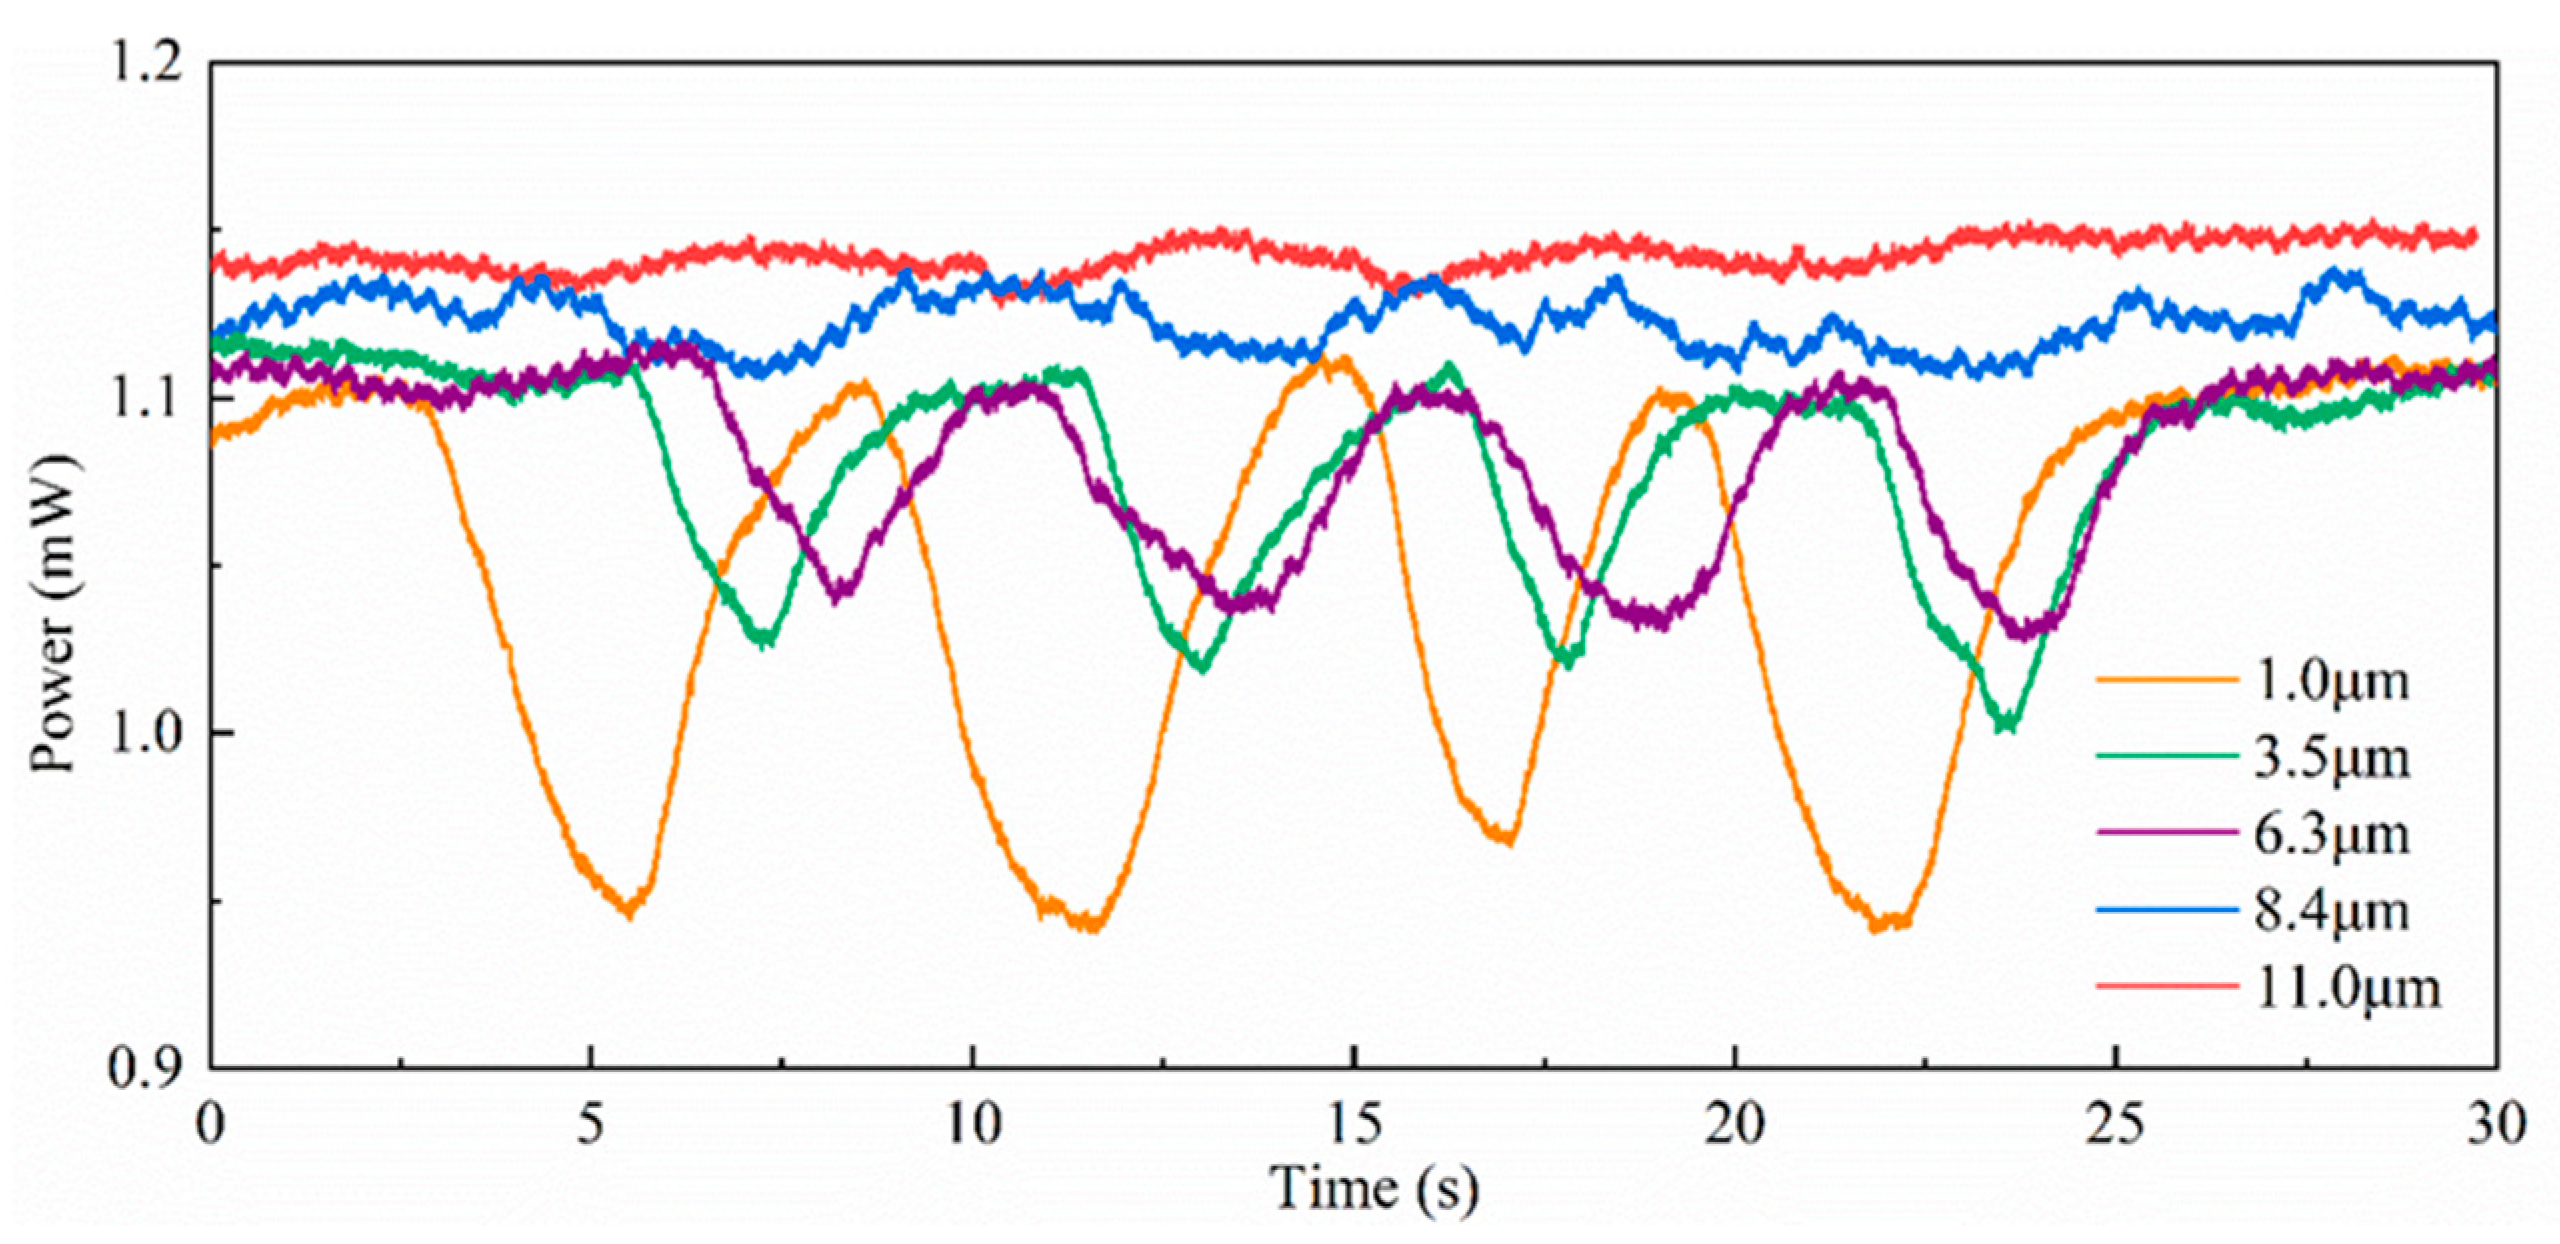
Illustrated in Figure 9 is the dynamic modulation of optical power, employed explicitly in the surveillance of CO2 concentration levels proximate to the nasal cavity. This examination is conducted across a spectrum of micro-nano fiber diameters. Notably, the initial power level manifests discernible disparities contingent upon the specific micro-nano fiber in consideration. This phenomenon emerges due to the inherent diversity in transmission losses, with smaller diameters typically afflicting a heightened degree of transmission loss.
In addition, the change amplitude of optical power is different with the different diameters of micro-nano fiber. When the diameter of the micro-nano fiber increases from D = 1.0 μm to D = 11.0 μm, increasingly insignificant changes in optical energy. That is to say, the thicker the diameter of the micro-nano fiber, the smaller the transformation of the optical power for monitoring carbon dioxide gas, which is caused by the gradual weakening of the evanescent field on the surface of the micro-nano fiber. When the micro-nano fiber radius is 11.0 μm, the optical power generally presents a straight line, and the sensing phenomenon is not apparent. The absorption of the evanescent field is relatively weak. In Figure 9, at the diameter D = 1.0 μm of micro-nano fiber, the change amplitude of optical power is the largest. Because the diameter of the optical fiber is slender, a more evanescent field will be exposed on the surface of the optical fiber. When the carbon dioxide gas sensing is carried out, the absorption degree is higher, and the optical power attenuation is also elevated.
Furthermore, in terms of the frequency of periodic change of optical power, the periodical change of exhaled carbon dioxide gas near the nasal cavity can be deduced by the periodical variation of optical power attenuation. When the micro-nano fiber diameter is 1.0 μm, the optical power attenuation is more prominent, and its sensitivity is higher from the above comparative experiments. In addition, the data showed four periodic changes in the optical power within 30 seconds of the monitoring time according to the experimental results of diameters of 1, 3.5, and 6.3 μm in Figure 9. Therefore, It can be calculated that the respiratory is 10-11 times/minute, and the result is consistent with the average human respiratory rate [6,20].
4. Discussion
The above experiments show the optical power variation with the exhaled carbon dioxide gas with different optical micro-nano fiber diameters. A conclusion is that the smaller the diameter of the micro-nano fiber, the higher the evanescent field of the fiber surface and the more sensitive the variation of the light power. However, when the diameter of the micro-nano fiber approaches hundreds of nanometers, the fiber break-age will occur easily, and the transmission loss will be higher, which makes it chal-lenging to prepare. Therefore, the micro-nano fiber with 1.0 μm diameter is applied to monitor the exhaled carbon dioxide gas near the nasal cavity is the most appropriate. The amplitude of light intensity variation indicates the concentration of carbon dioxide gas, and the periodic variation frequency of light intensity within the 30 s characterizes the respiratory frequency of the nasal cavity. It can be calculated that the respiratory is 10-11 times/minute from Figure 9.
The micro-nano fiber with a diameter of 1.0 μm tapered region was placed near the nasal cavity for real-time monitoring. With the periodic change of respiration, the optical power of the detector port also presents the same periodic change trend. Therefore, in this scheme, we adopted the periodic change of optical power at the detector end to characterize the periodic change of carbon dioxide gas at the end of human breath, and transform the monitoring of human respiratory rate into the frequency monitoring of optical power change. The results of this test are consistent with the normal respiratory rate of the human body, which is basically consistent with the respiratory rate results obtained by other studies.
In this paper, the absorption lines of carbon dioxide gas are analyzed, and a theoretical simulation of tapered fiber with different diameters is carried out. At the same time, micro-nano fibers were prepared, and different diameters of micro-nano fibers were tested. The results show that at the absorption wavelength of 2.004 μm, the scheme of using the periodic change of optical power transmitted by fiber to characterize the change of optical power at the expiratory end of the human nasal cavity is highly feasible, and the scheme has the characteristics of mainstream real-time monitoring, low cost, portability, and has valuable market application prospects.
5. Conclusion
In this paper,a sensor based on an optical micro-nano fiber for real-time exhaled carbon dioxide gas monitoring was designed and experimentally tested. The micro-nano fiber is applied both for light transmission and served as sensing region . The principle of sensing is evanescent field absorption. The respiratory process near the nasal cavity is reflected by the attenuation of optical power, and the periodical variation frequency of power characterizes respiratory rates. This innovative sensing approach holds promise for the real-time monitoring of CO2 concentration, offering a novel, straightforward, and cost-effective avenue for real-time sensing, as expounded within this discourse. Furthermore, the user's ventilatory function can also be broadly reflected by the time the optical power stays at the highest/lowest value, which is worthy of further research.
Author Contributions
Conceptualization, T.C. and Y.S.; methodology, T.C. and M.L.; software, T.C.and Y.S.; validation, Y.S. and X.W.; formal analysis, S.Z.; investigation, T.C.; resources, M.L.; data curation, S.Z.; writing—original draft preparation, T.C.; writing—review and editing, M.L.; visualization, Y.S.; supervision, M.L.; project administration, M.L.; funding acquisition, M.L. All authors have read and agreed to the published version of the manuscript.
Funding
This research was funded by the National Natural Science Foundation of China (No. 62027825), Natural Science Foundation of Jilin Province (No. 20220101130JC), Shandong Provincial Natural Science Foundation (ZR2019MC069). This work is also supported by the 111 Project of China (No. D21009).
Institutional Review Board Statement
Not applicable.
Informed Consent Statement
Not applicable.
Data Availability Statement
The authors confirm that the data supporting the findings of this study is available within the article.
Acknowledgments
The authors would like to thank Silun Du for his discussion on theory and simulation.
Conflicts of Interest
The authors declare no conflict of interest.
References
- Dossa, F.; Megetto, O.; Yakubu, M.; Zhang, D.D.Q.; Baxter, N.N. Sedation practices for routine gastrointestinal endoscopy: a systematic review of recommendations. BMC Gastroenterol. 2021, 21, 1–18. [Google Scholar] [CrossRef] [PubMed]
- Nay, M.-A.; Fromont, L.; Eugene, A.; Marcueyz, J.-L.; Mfam, W.-S.; Baert, O.; Remerand, F.; Ravry, C.; Auvet, A.; Boulain, T. High-flow nasal oxygenation or standard oxygenation for gastrointestinal endoscopy with sedation in patients at risk of hypoxaemia: a multicentre randomised controlled trial (ODEPHI trial). Br. J. Anaesth. 2021, 127, 133–142. [Google Scholar] [CrossRef]
- de Carvalho, A.L.R.; Vital, R.B.; de Lira, C.C.S.; Magro, I.B.; Sato, P.T.S.; Lima, L.H.N.; Braz, L.G.; Módolo, N.S.P. Laryngeal Mask Airway Versus Other Airway Devices for Anesthesia in Children With an Upper Respiratory Tract Infection: A Systematic Review and Meta-analysis of Respiratory Complications. Obstet. Anesthesia Dig. 2018, 127, 941–950. [Google Scholar] [CrossRef] [PubMed]
- Camargo, M.G.; Moreira, M.M.; Magro, D.O.; Santos, J.O.M.; Ayrizono, M.d.L.S. Volumetric capnography for respiratory monitoring of patients during routine colonoscopy with room-air and carbon dioxide insufflation. Arq Gastroenterol 2022, 59, 383–389. [Google Scholar] [CrossRef] [PubMed]
- Wang, W.; Zhao, Z.; Tian, X.; Ma, X.; Xu, L.; Shang, G. Noninvasive carbon dioxide monitoring in pediatric patients undergoing laparoscopic surgery: transcutaneous vs. end-tidal techniques. BMC Pediatr. 2023, 23, 1–8. [Google Scholar] [CrossRef] [PubMed]
- Vincent, T.; Gardner, J. A low cost MEMS based NDIR system for the monitoring of carbon dioxide in breath analysis at ppm levels. Sensors Actuators B: Chem. 2016, 236, 954–964. [Google Scholar] [CrossRef]
- Jaffe, M.B.; Orr, J. Continuous Monitoring of Respiratory Flow and CO2. IEEE Eng. Med. Biol. Mag. 2010, 29, 44–52. [Google Scholar] [CrossRef] [PubMed]
- Pandey, S.K.; Kim, K.-H. The Relative Performance of NDIR-based Sensors in the Near Real-time Analysis of CO2 in Air. Sensors 2007, 7, 1683–1696. [Google Scholar] [CrossRef] [PubMed]
- Gibson, D.; MacGregor, C. A Novel Solid State Non-Dispersive Infrared CO2 Gas Sensor Compatible with Wireless and Portable Deployment. Sensors 2013, 13, 7079–7103. [Google Scholar] [CrossRef] [PubMed]
- Wang, Y.; Chen, Z.; Chen, W.; Zhang, X. Refractive index and temperature sensor based on fiber ring laser with tapered seven core fiber structure in 2 μm band. Opt. Fiber Technol. 2020, 61, 102388. [Google Scholar] [CrossRef]
- Jin, W.; Ho, H.; Cao, Y.; Ju, J.; Qi, L. Gas detection with micro- and nano-engineered optical fibers. Opt. Fiber Technol. 2013, 19, 741–759. [Google Scholar] [CrossRef]
- Zhang, L.; Pan, J.; Zhang, Z.; Wu, H.; Yao, N.; Cai, D.; Xu, Y.; Zhang, J.; Sun, G.; Wang, L.; et al. Ultrasensitive skin-like wearable optical sensors based on glass micro/nanofibers. Opto-Electronic Adv. 2020, 3, 19002201–19002207. [Google Scholar] [CrossRef]
- Fu, H.; Jiang, Y.; Ding, J.; Zhang, J.; Zhang, M.; Zhu, Y.; Li, H. Zinc oxide nanoparticle incorporated graphene oxide as sensing coating for interferometric optical microfiber for ammonia gas detection. Sensors Actuators B: Chem. 2018, 254, 239–247. [Google Scholar] [CrossRef]
- Yang, S.; Wang, Y.; Kong, Y.; Huang, G.; Zhao, Z.; Wang, Y.; Xu, B.; Cui, J.; Mei, Y. Enhanced Evanescent Field Coupling of Smart Particles in Tubular Optical Microcavity for Sensing Application. Adv. Opt. Mater. 2021, 10, 2102158. [Google Scholar] [CrossRef]
- Hill, C.; Gordon, I.E.; Kochanov, R.V.; Barrett, L.; Wilzewski, J.S.; Rothman, L.S. HITRANonline: An online interface and the flexible representation of spectroscopic data in the HITRAN database. J. Quant. Spectrosc. Radiat. Transf. 2016, 177, 4–14. [Google Scholar] [CrossRef]
- Rothman, L.; Jacquemart, D.; Barbe, A. The HITRAN 2008 molecular spectroscopic database. J QUANT SPECTROSC RA 2009. [CrossRef]
- Zhang, G.; Wu, X. A novel CO2 gas analyzer based on IR absorption. Opt. Lasers Eng. 2004, 42, 219–231. [Google Scholar] [CrossRef]
- Wylleman, L.; O Costa, L.F.; Natario, J.A.M. Poynting vector, super-Poynting vector, and principal observers in electromagnetism and general relativity. Class. Quantum Gravity 2021, 38, 165009. [Google Scholar] [CrossRef]
- Shi, Z.G.; Liu, T.; Chen, B.; Cao, X.M.; Liu, W. Ventilation with a low tidal volume vs. an intermediate tidal volume during pleural decortication.. 2021, 91, 702–708. [Google Scholar]
- Vincent, T.; Wilson, A.; Hattersley, J.; Chappell, M.; Gardner, J. Design and Modelling of a Portable Breath Analyser for Metabolic Rate Measurement. Procedia Eng. 2014, 87, 668–671. [Google Scholar] [CrossRef]
Figure 1.
(a) Optical fiber evanescent field absorption detection principle; (b) Schematic diagram of the micro-nano fiber structure
Figure 1.
(a) Optical fiber evanescent field absorption detection principle; (b) Schematic diagram of the micro-nano fiber structure
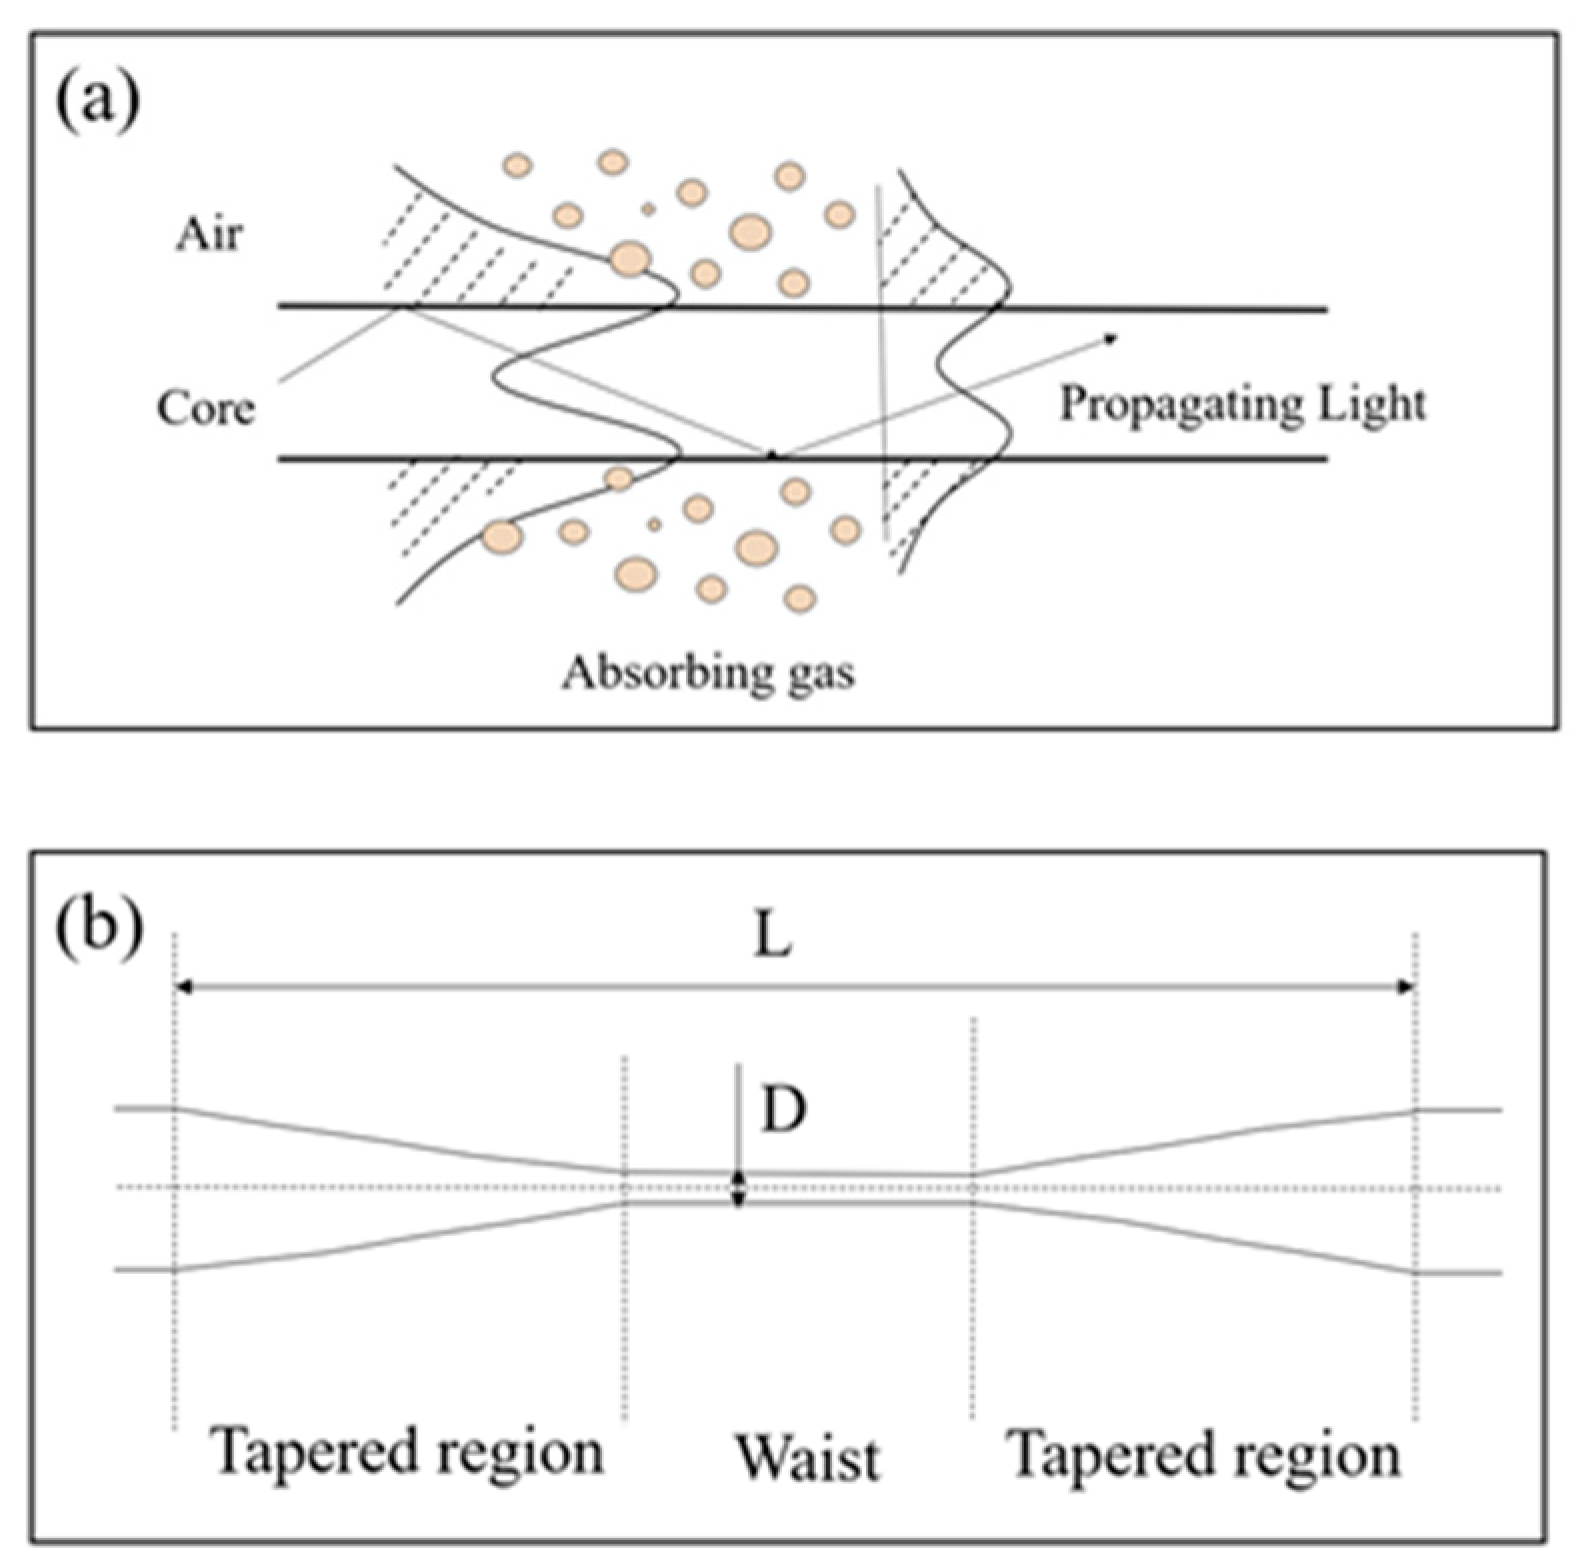
Figure 2.
CO2 absorption coefficient at 1.3-4.6 μm [16]
Figure 2.
CO2 absorption coefficient at 1.3-4.6 μm [16]
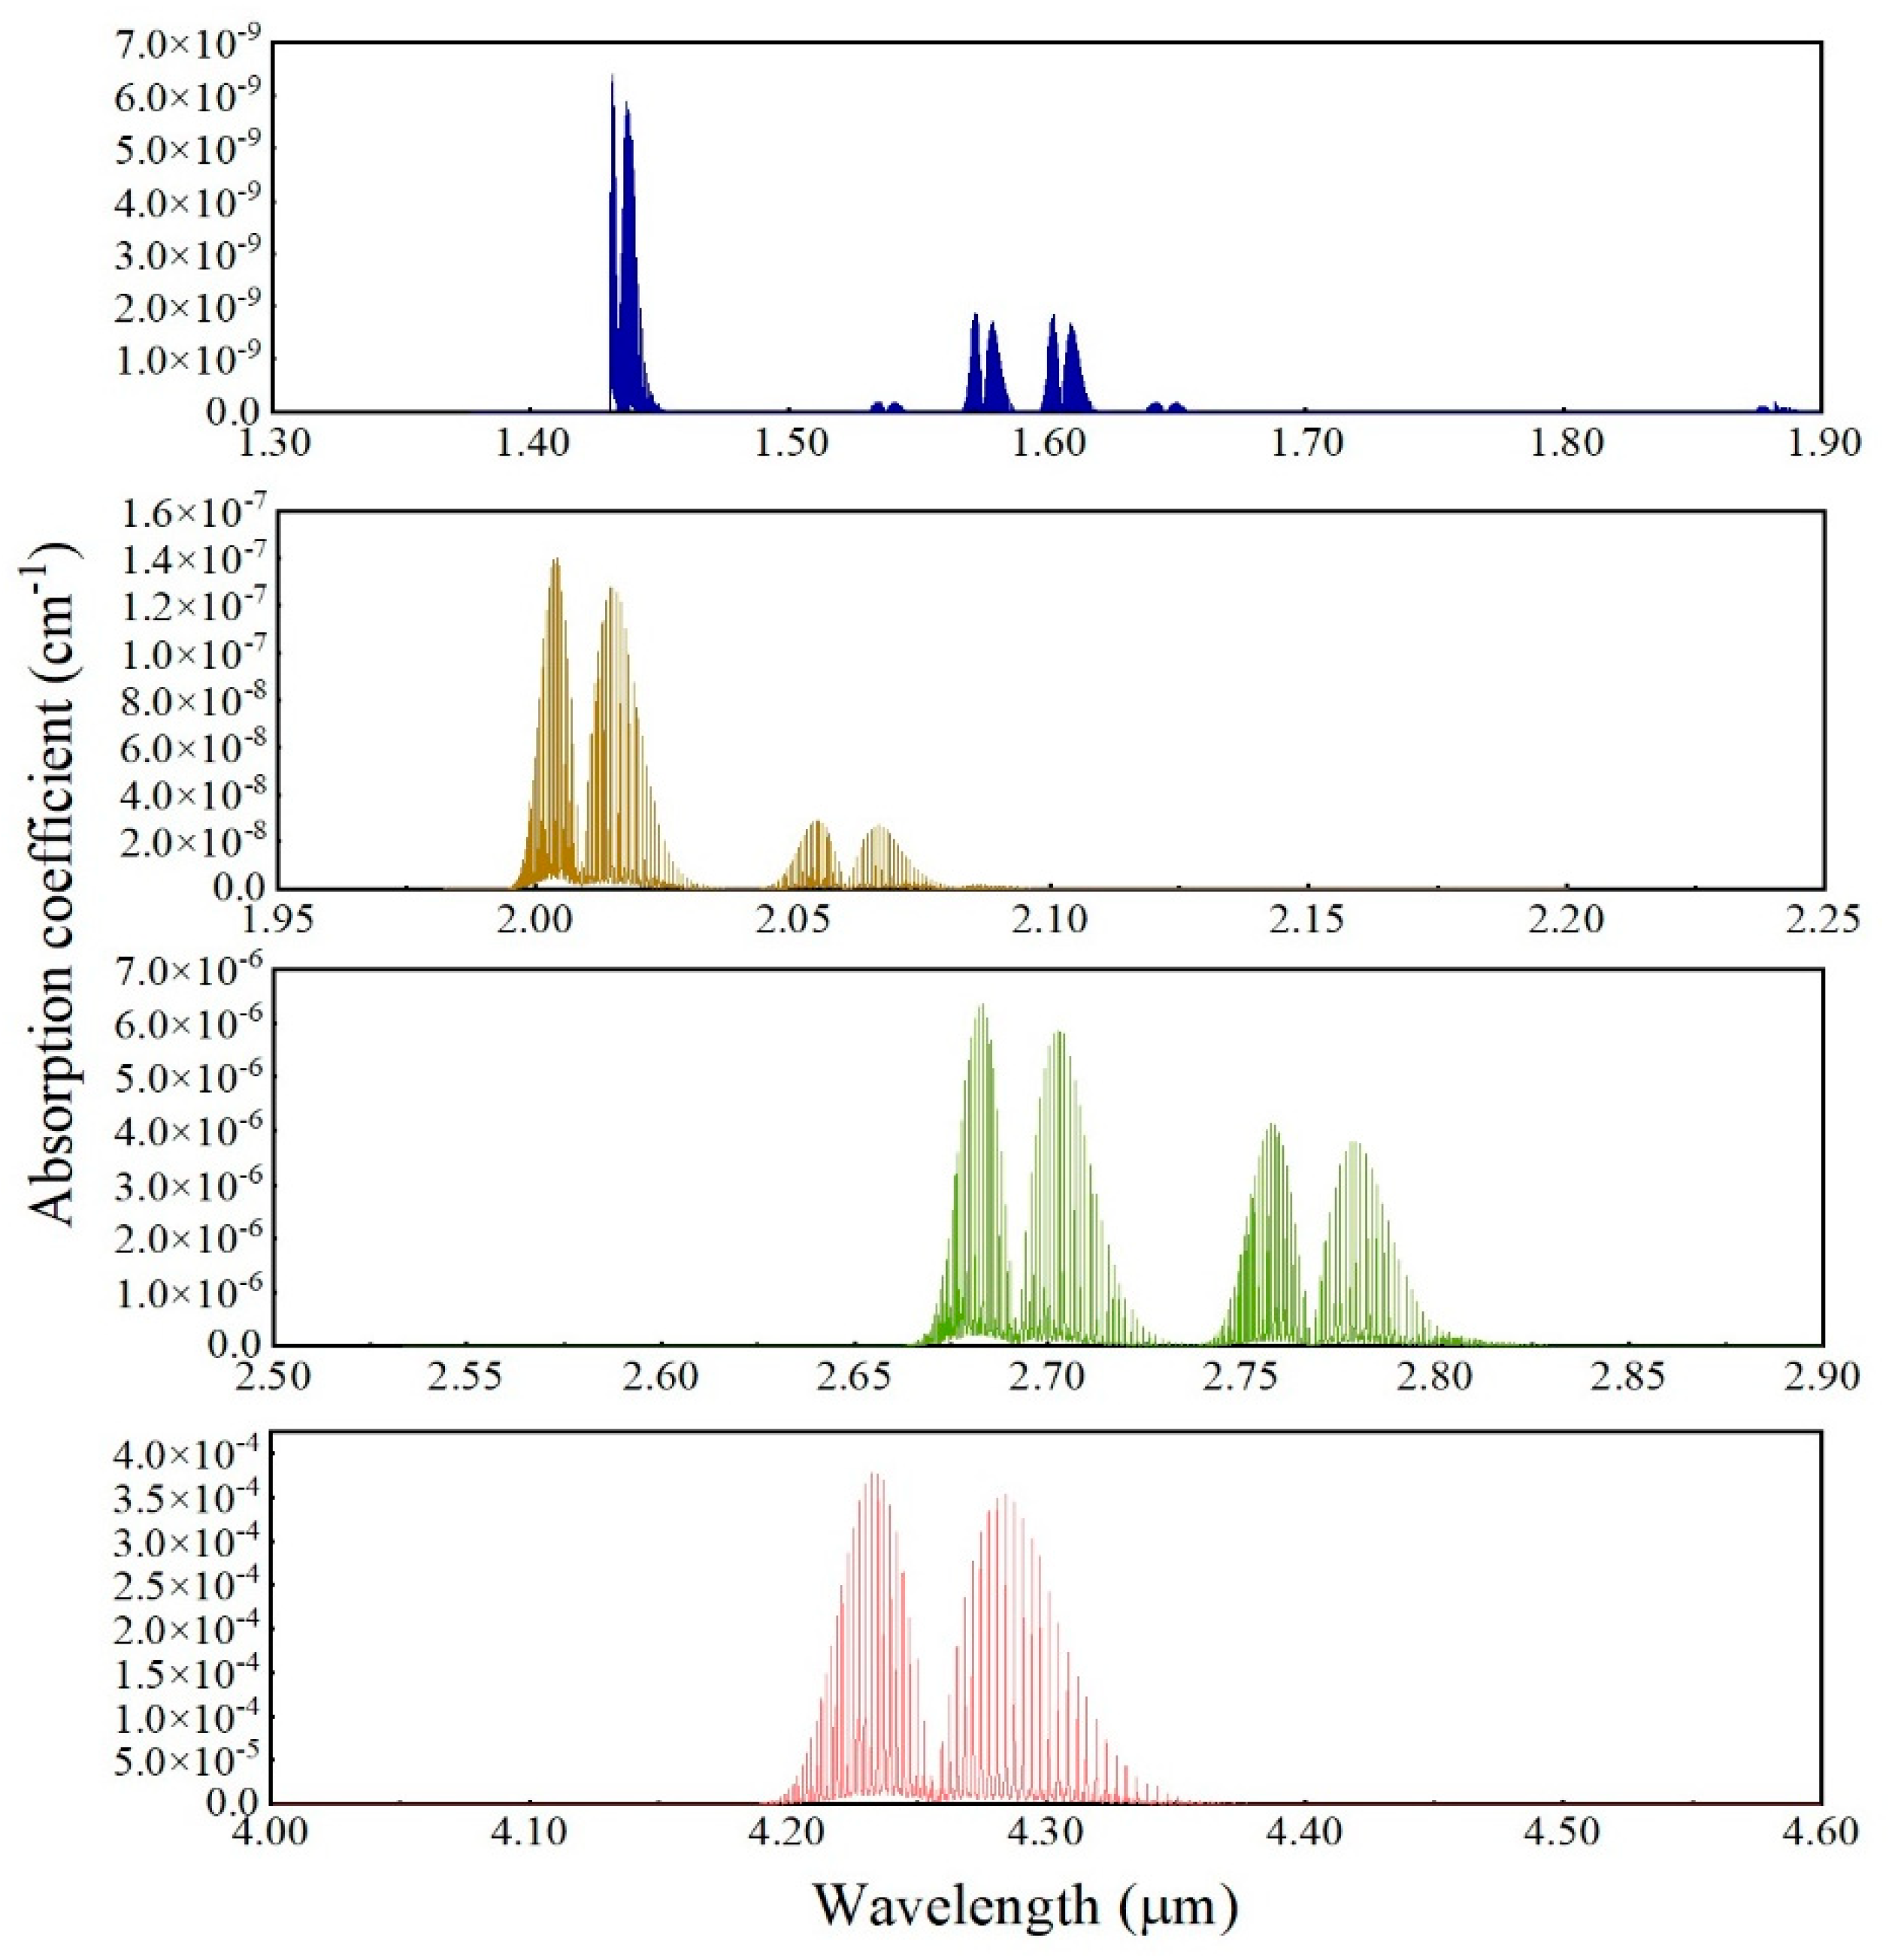
Figure 3.
The distribution of the electronic field distribution on the cross-section for micro-nano fiber when D is (a) 0.5 µm; (b) 1.0 µm; (c) 1.5 μm; (d) the variation of η versus diameter of micro-nano fiber.
Figure 3.
The distribution of the electronic field distribution on the cross-section for micro-nano fiber when D is (a) 0.5 µm; (b) 1.0 µm; (c) 1.5 μm; (d) the variation of η versus diameter of micro-nano fiber.
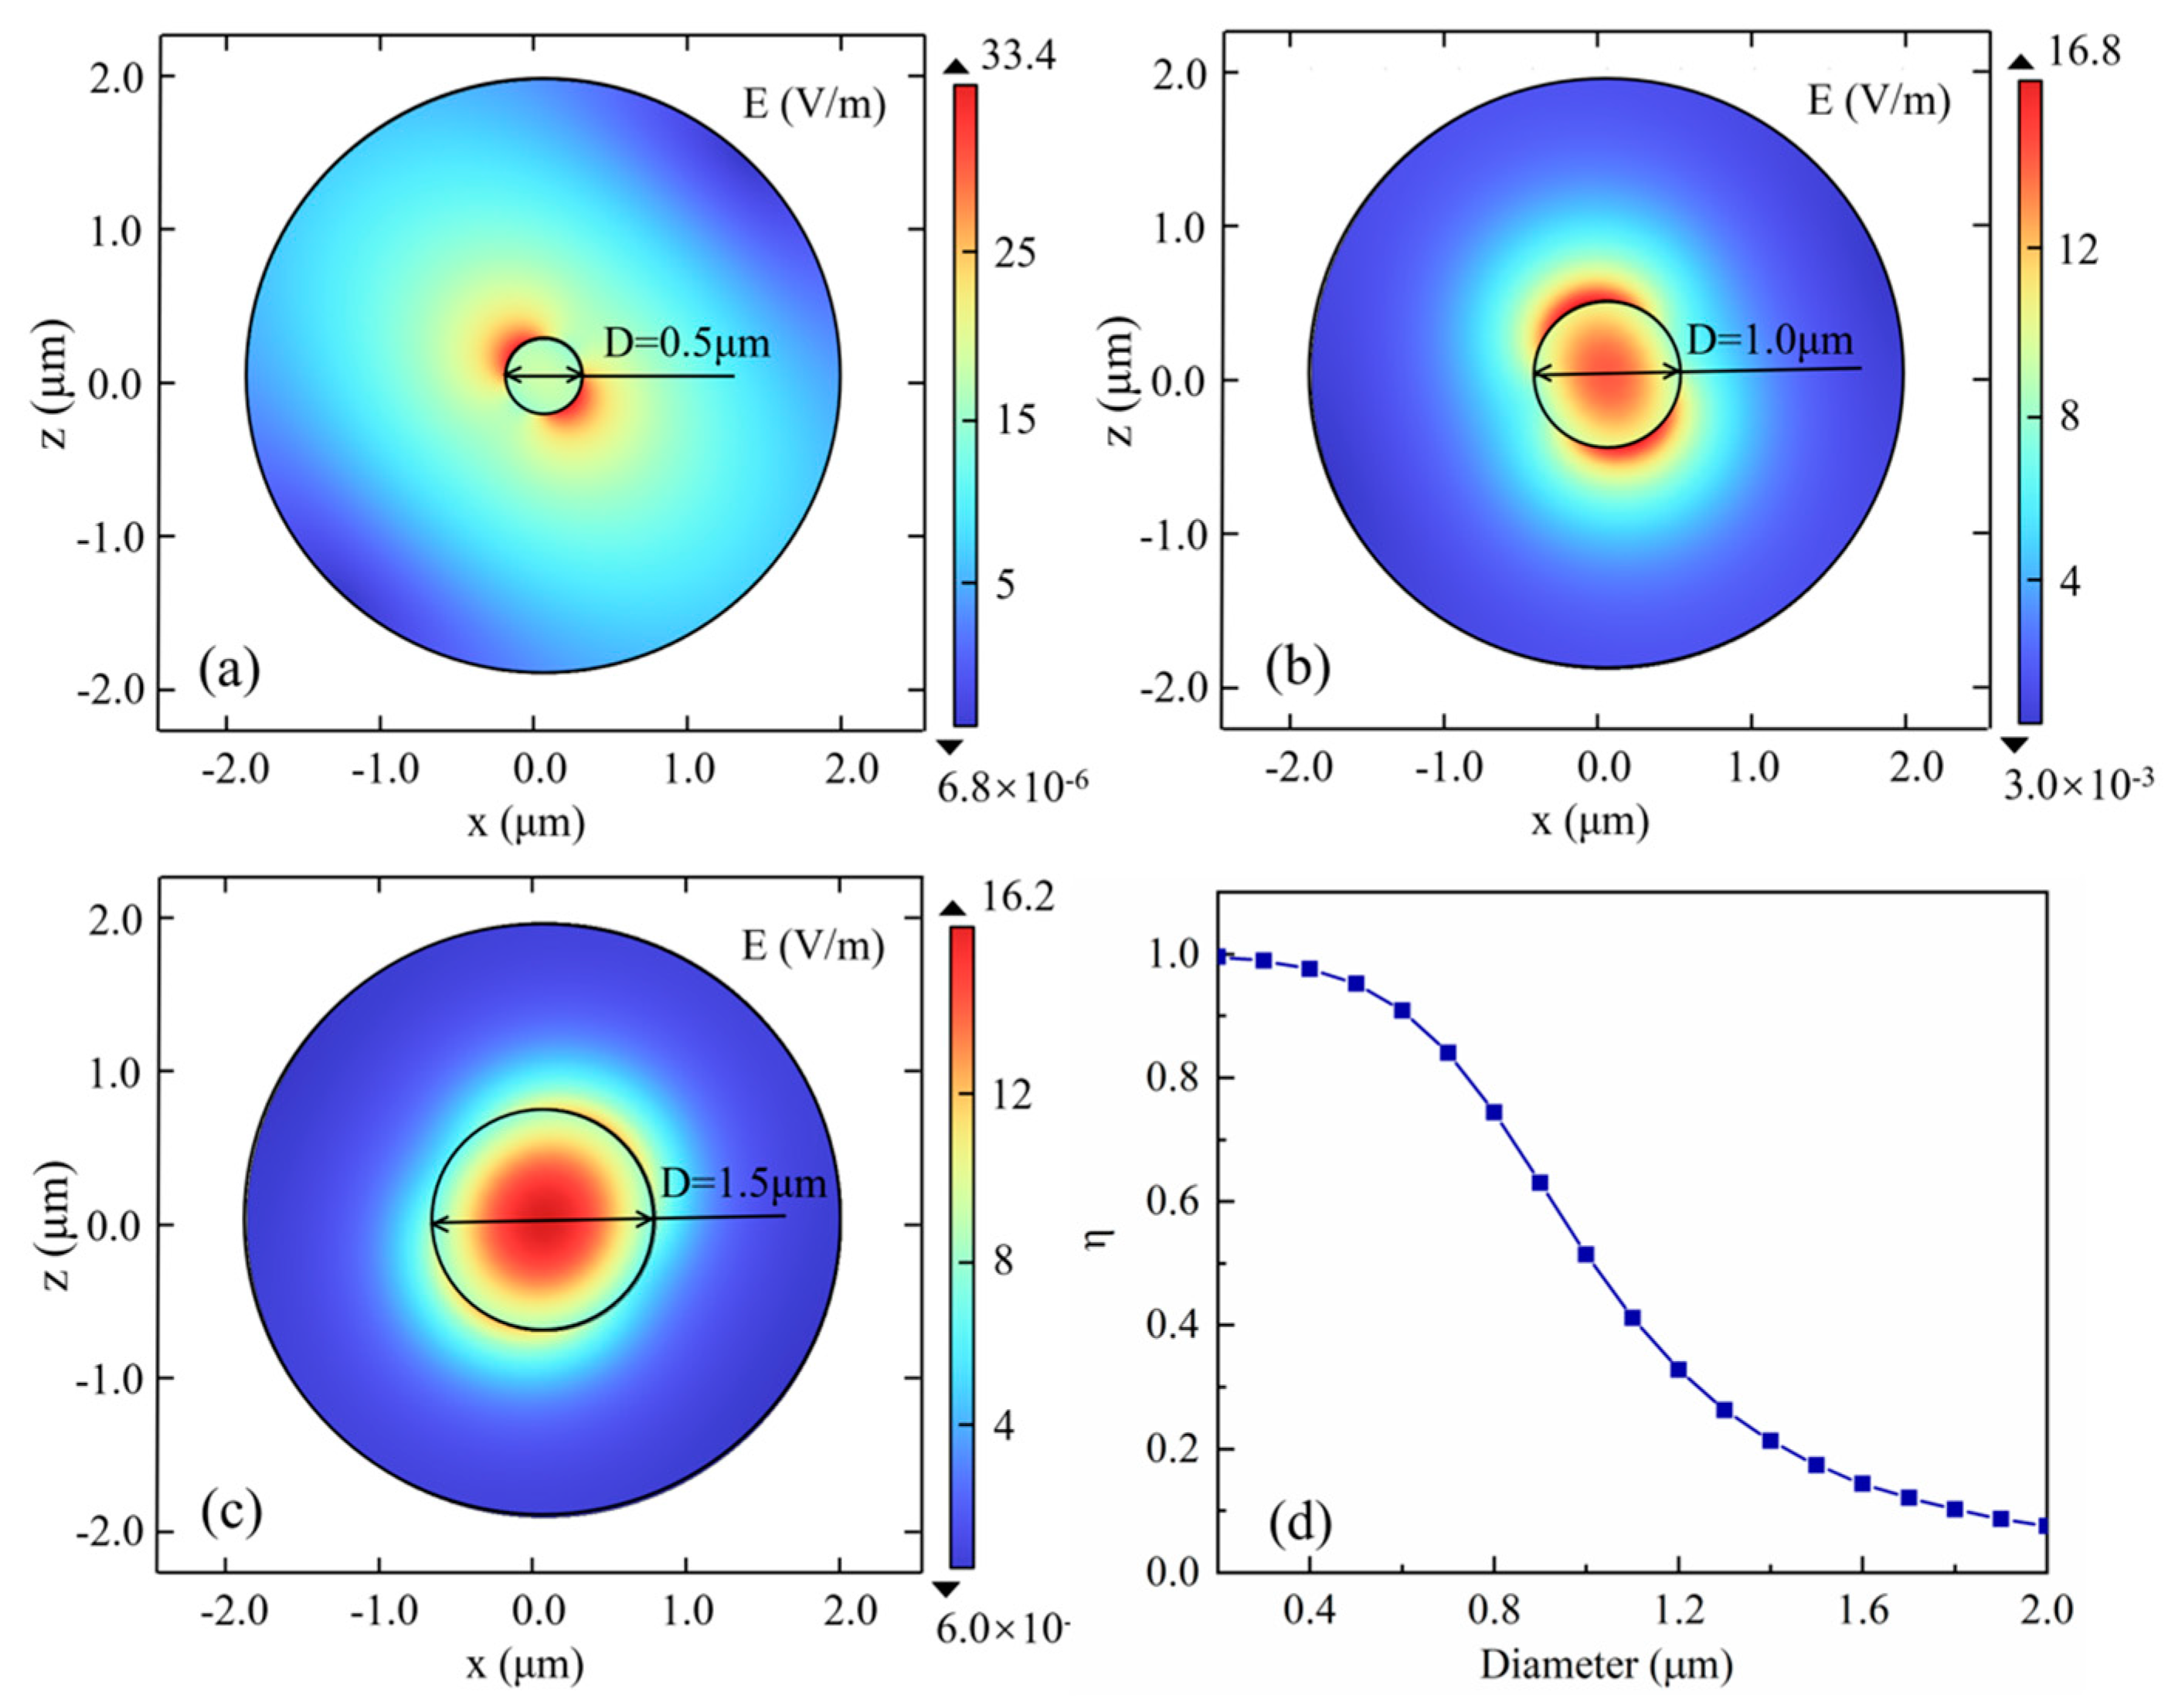
Figure 4.
(a) the optical micro-nano fiber drawing machine; (b) the frame of hydrogen and oxygen; Schematic diagram of different areas (c-f) of micro-nano fiber
Figure 4.
(a) the optical micro-nano fiber drawing machine; (b) the frame of hydrogen and oxygen; Schematic diagram of different areas (c-f) of micro-nano fiber
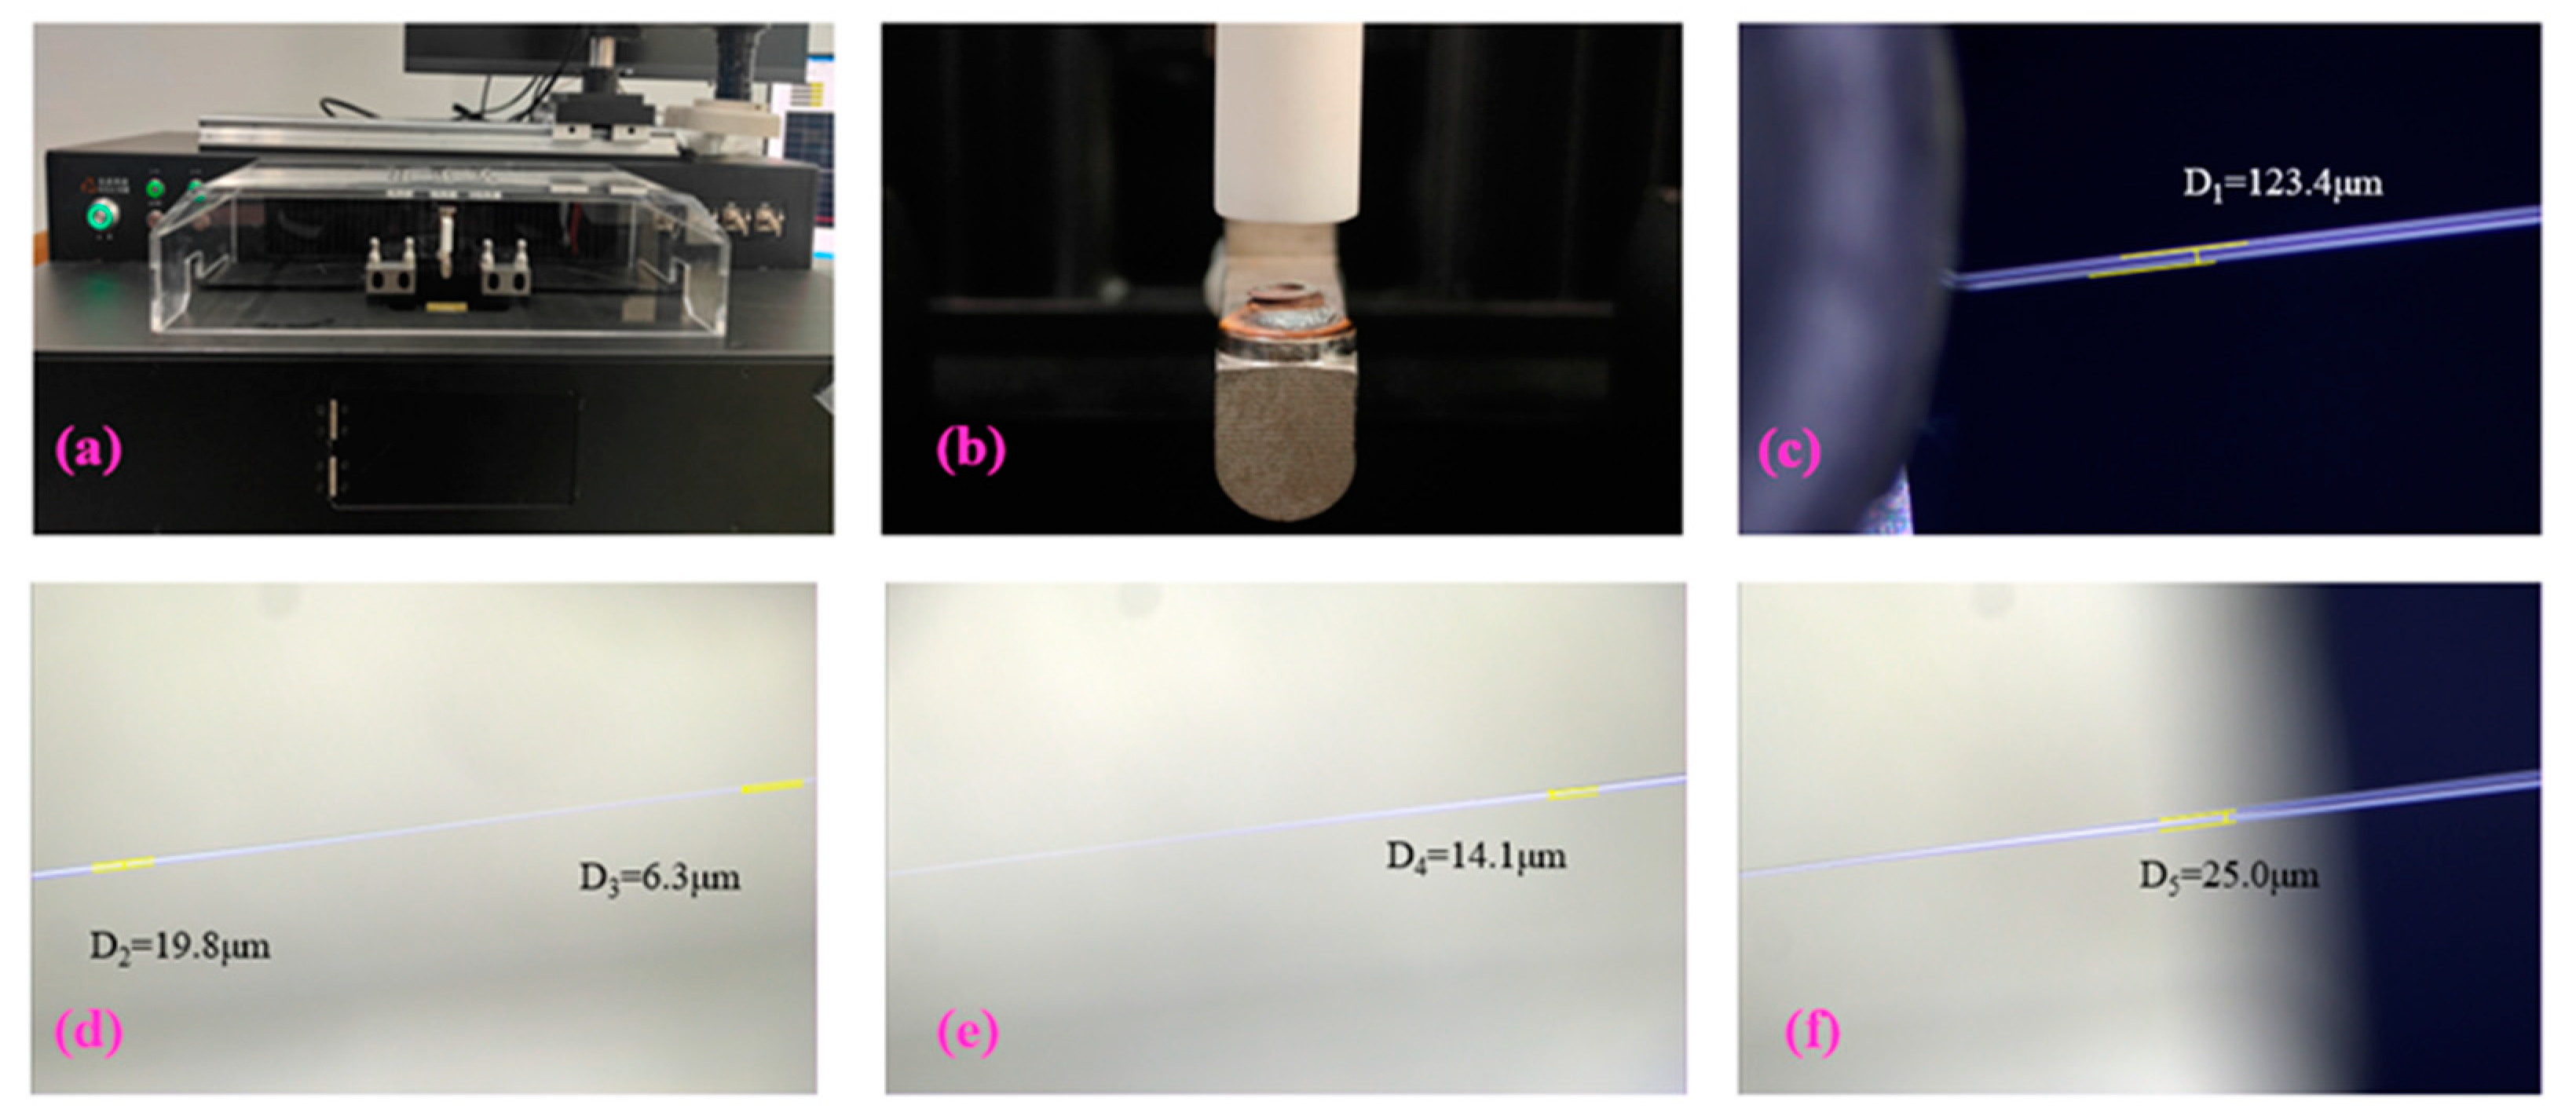
Figure 5.
Schematic diagram of changes in taper length and diameter of micro-nano fiber
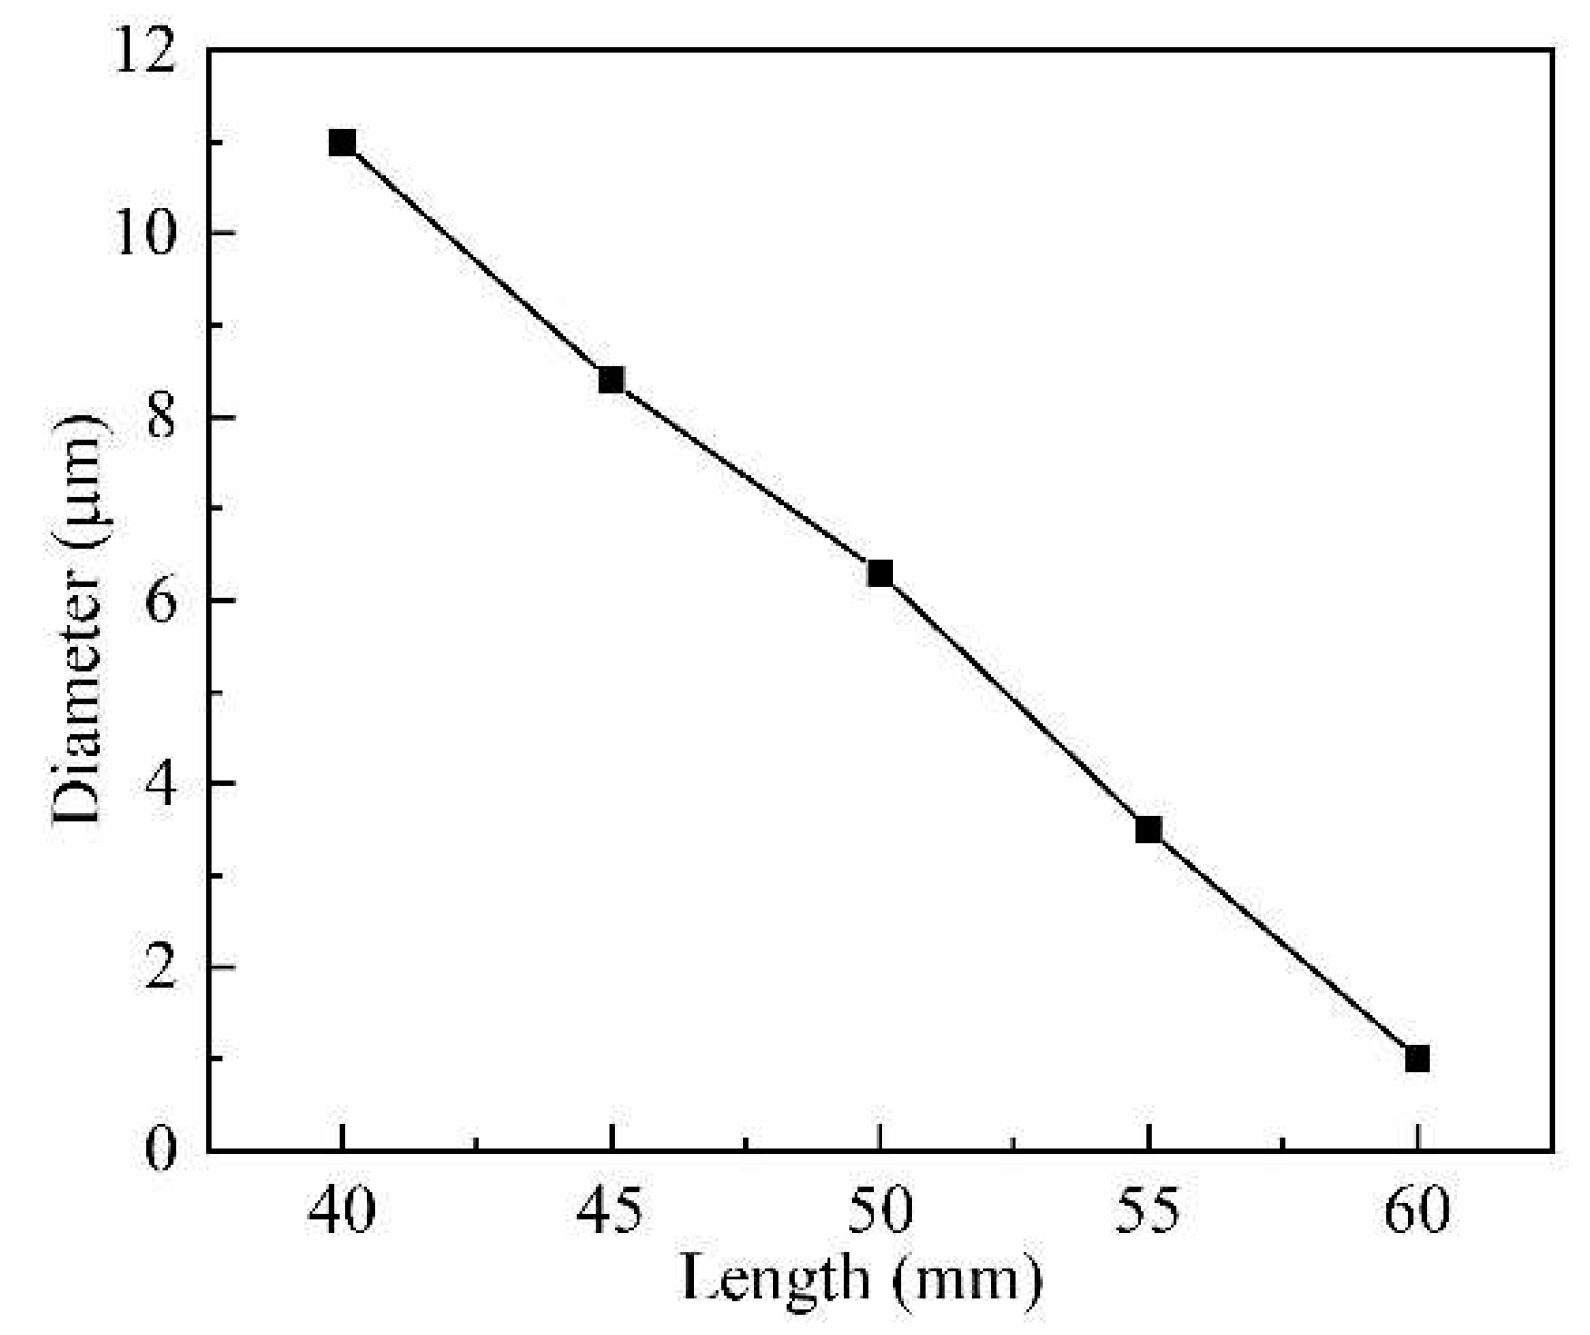
Figure 6.
Schematic diagrams of (a) main-flow method and (b) side-flow method, and optical fiber sensor-equipped breathing tube drawings.
Figure 6.
Schematic diagrams of (a) main-flow method and (b) side-flow method, and optical fiber sensor-equipped breathing tube drawings.
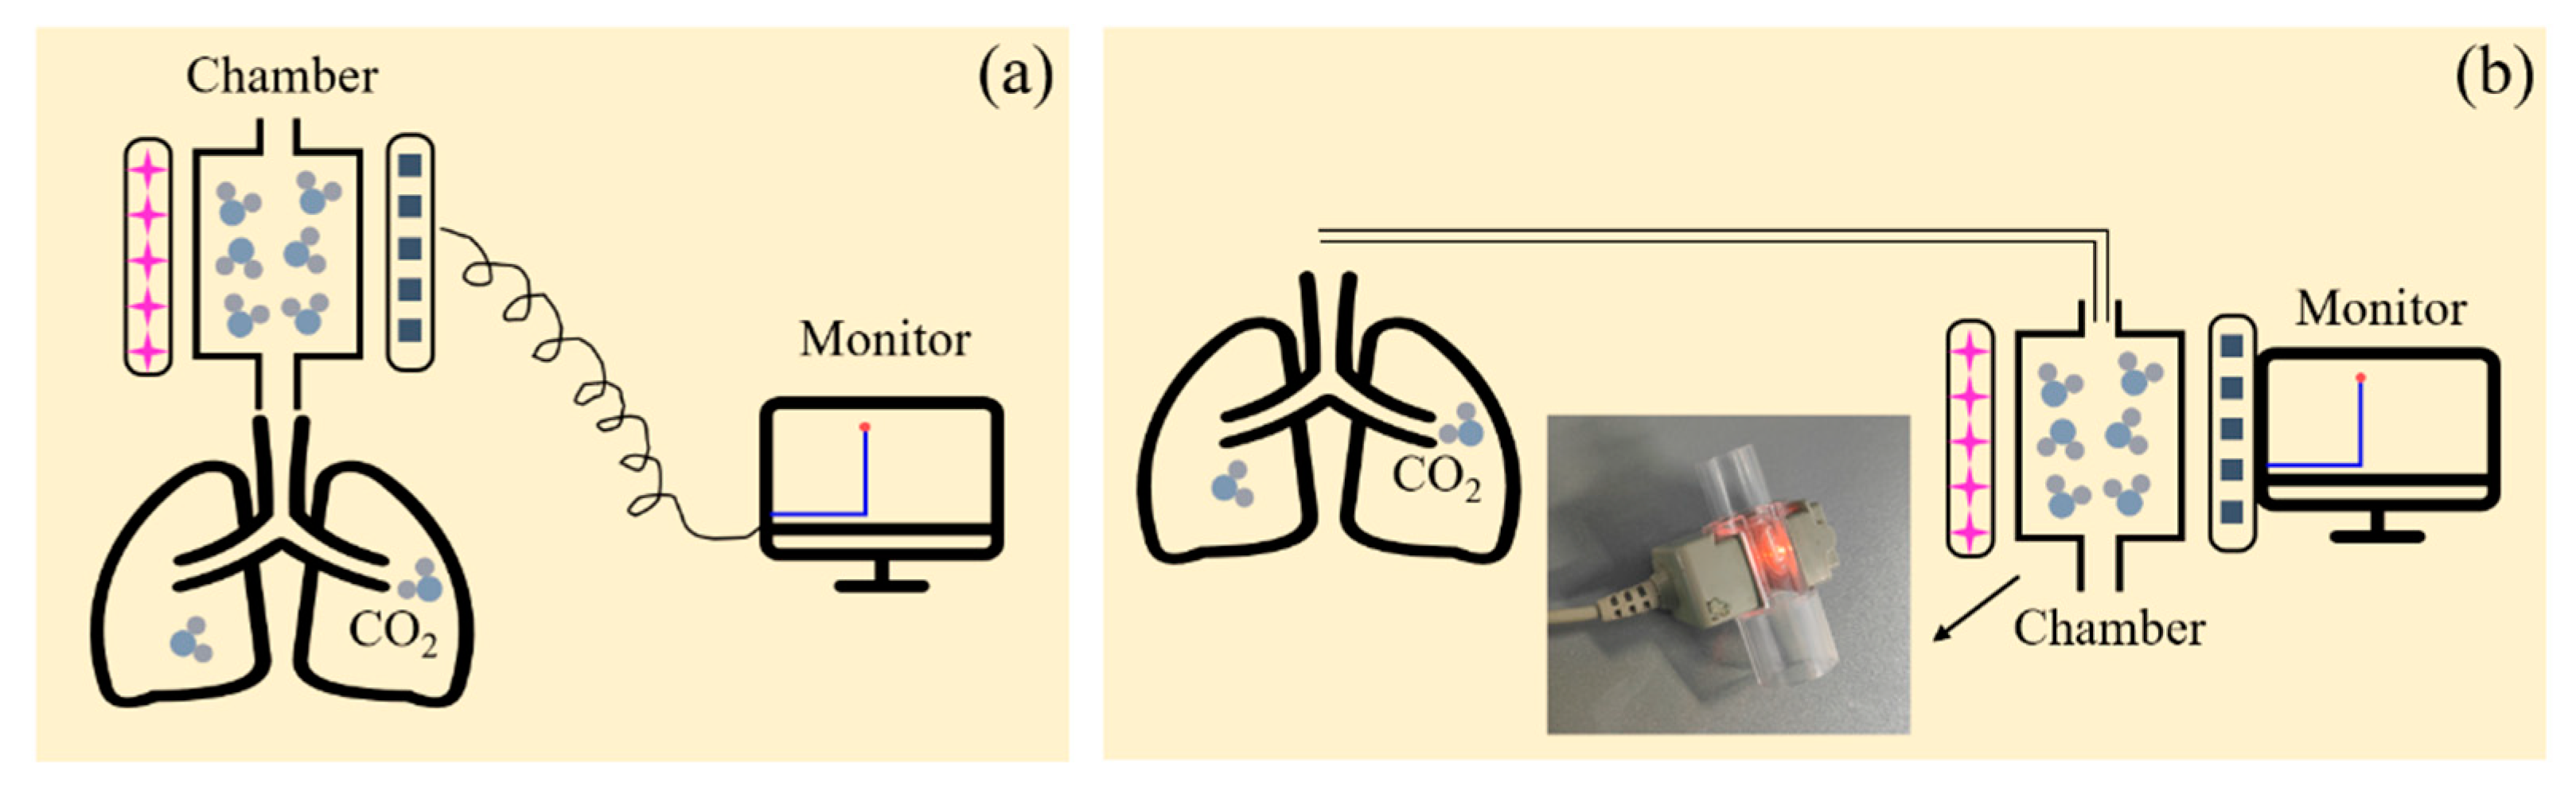
Figure 7.
Schematic diagram of micro-nano fiber optic sensor
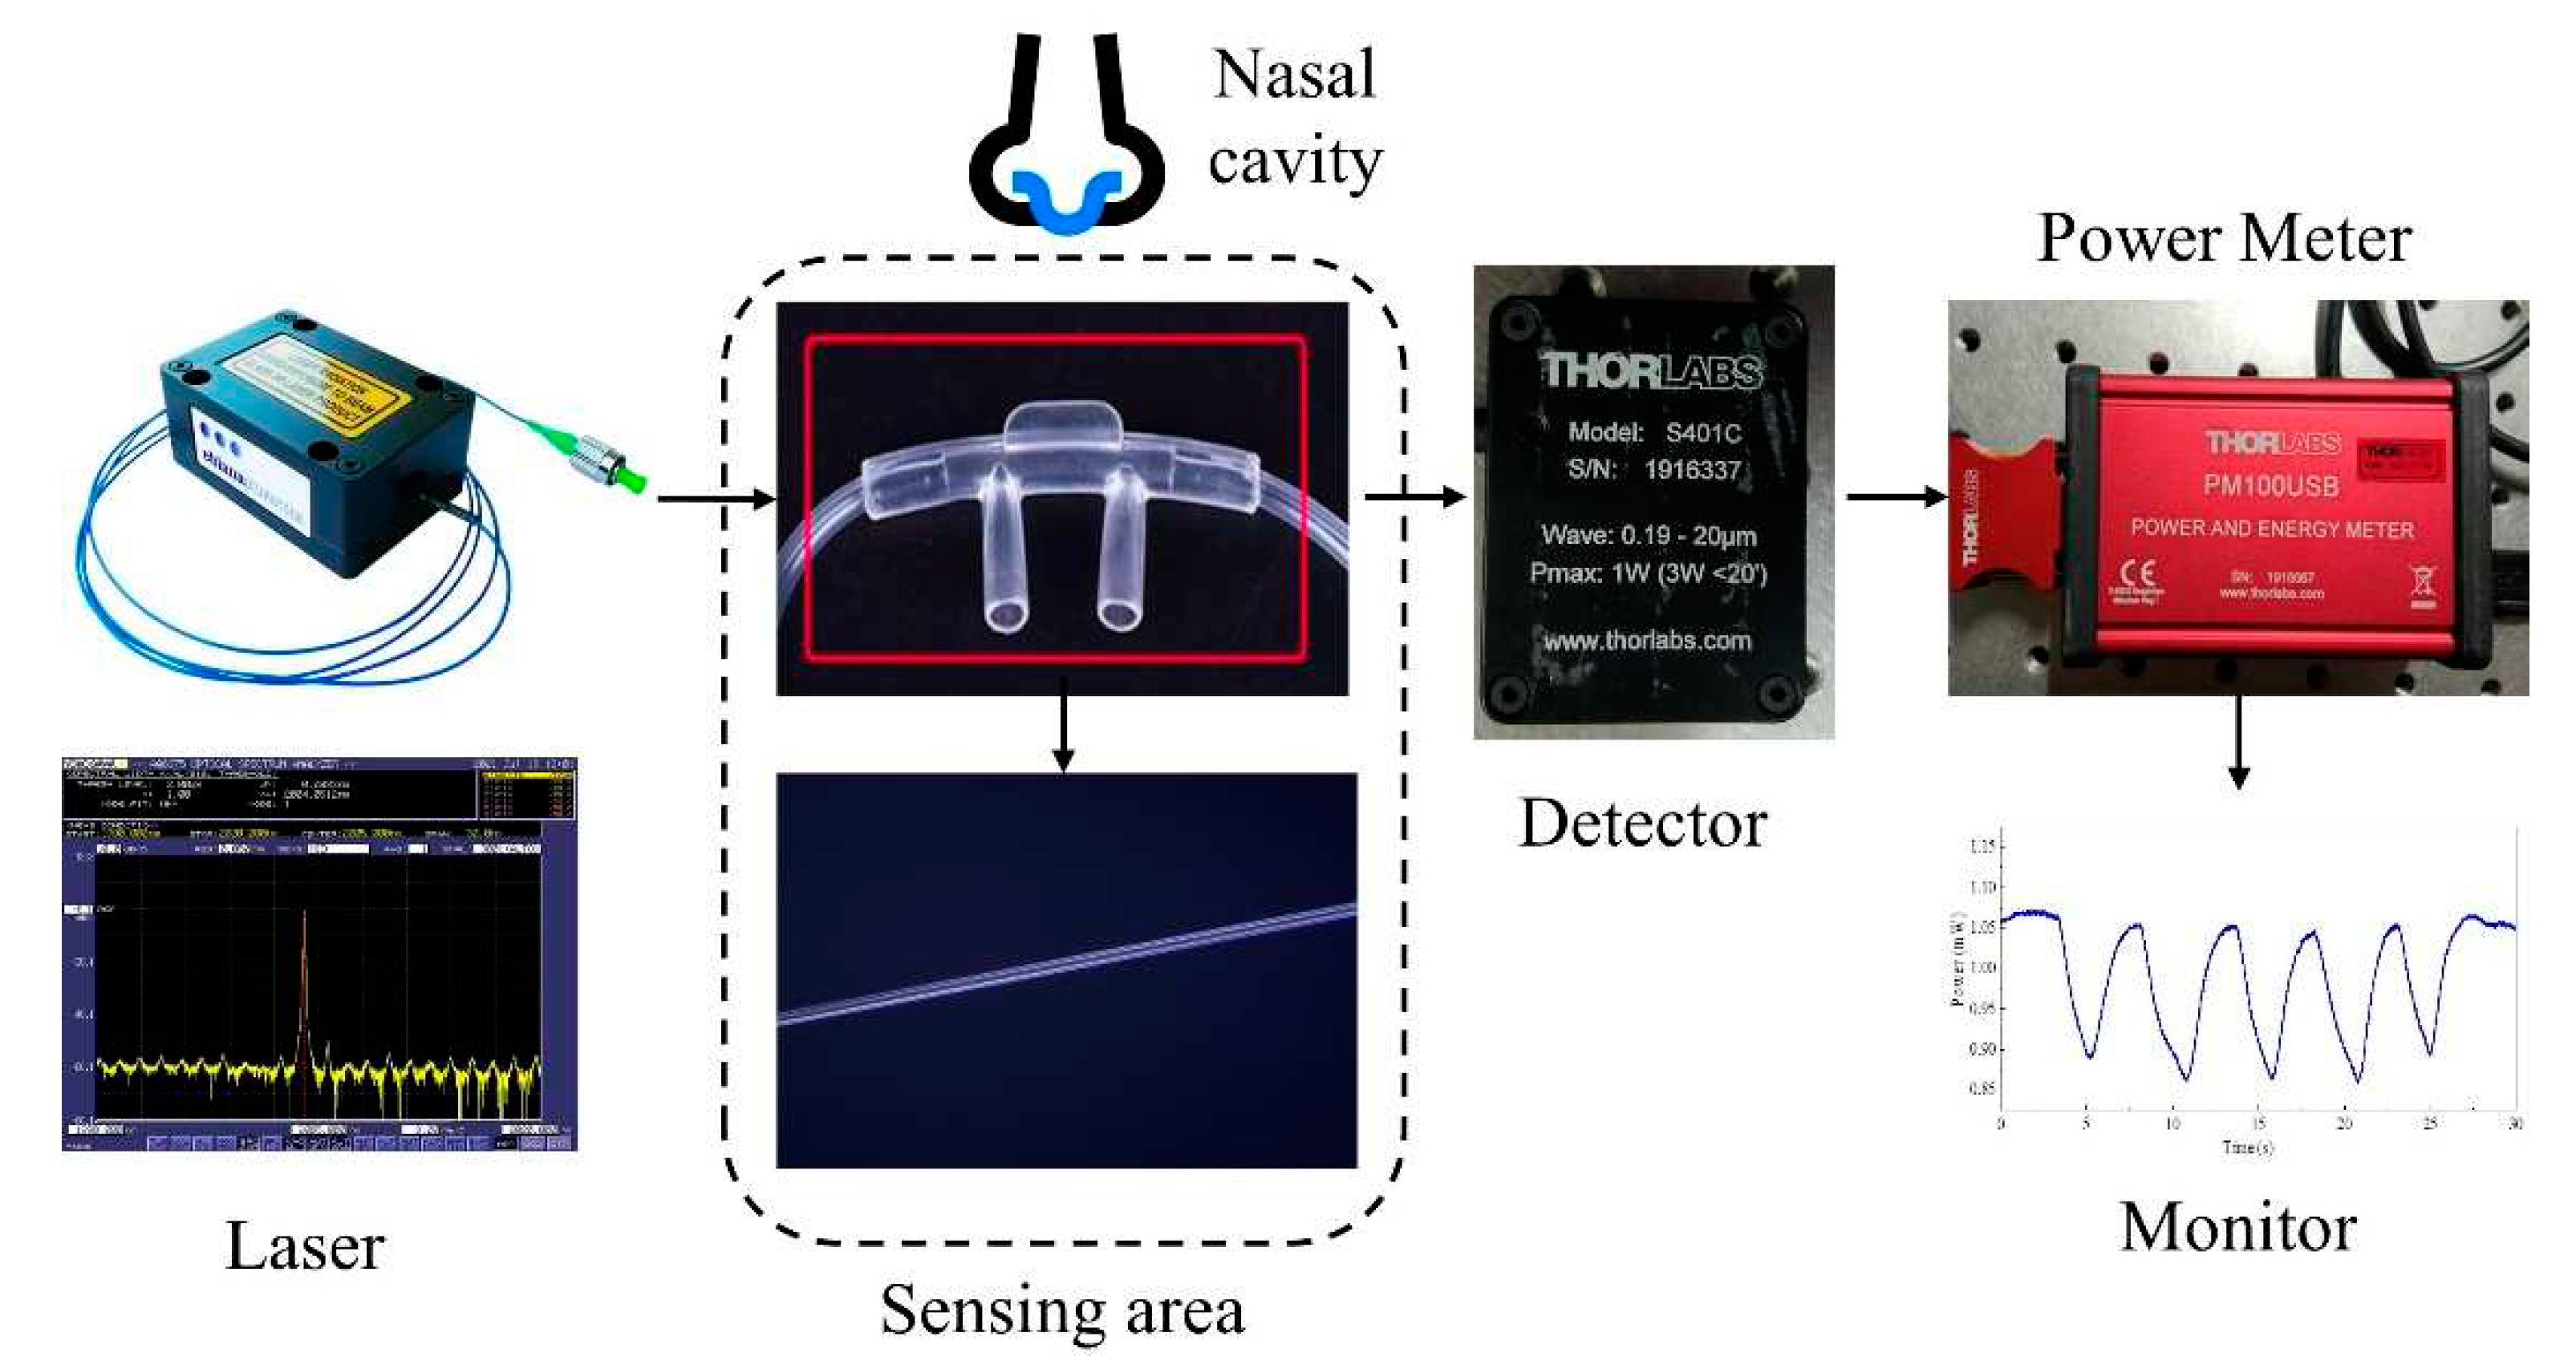
Figure 8.
Variation of power at different stages: (a) initial monitoring of respiration; (b) end of respiratory cycle monitoring
Figure 8.
Variation of power at different stages: (a) initial monitoring of respiration; (b) end of respiratory cycle monitoring
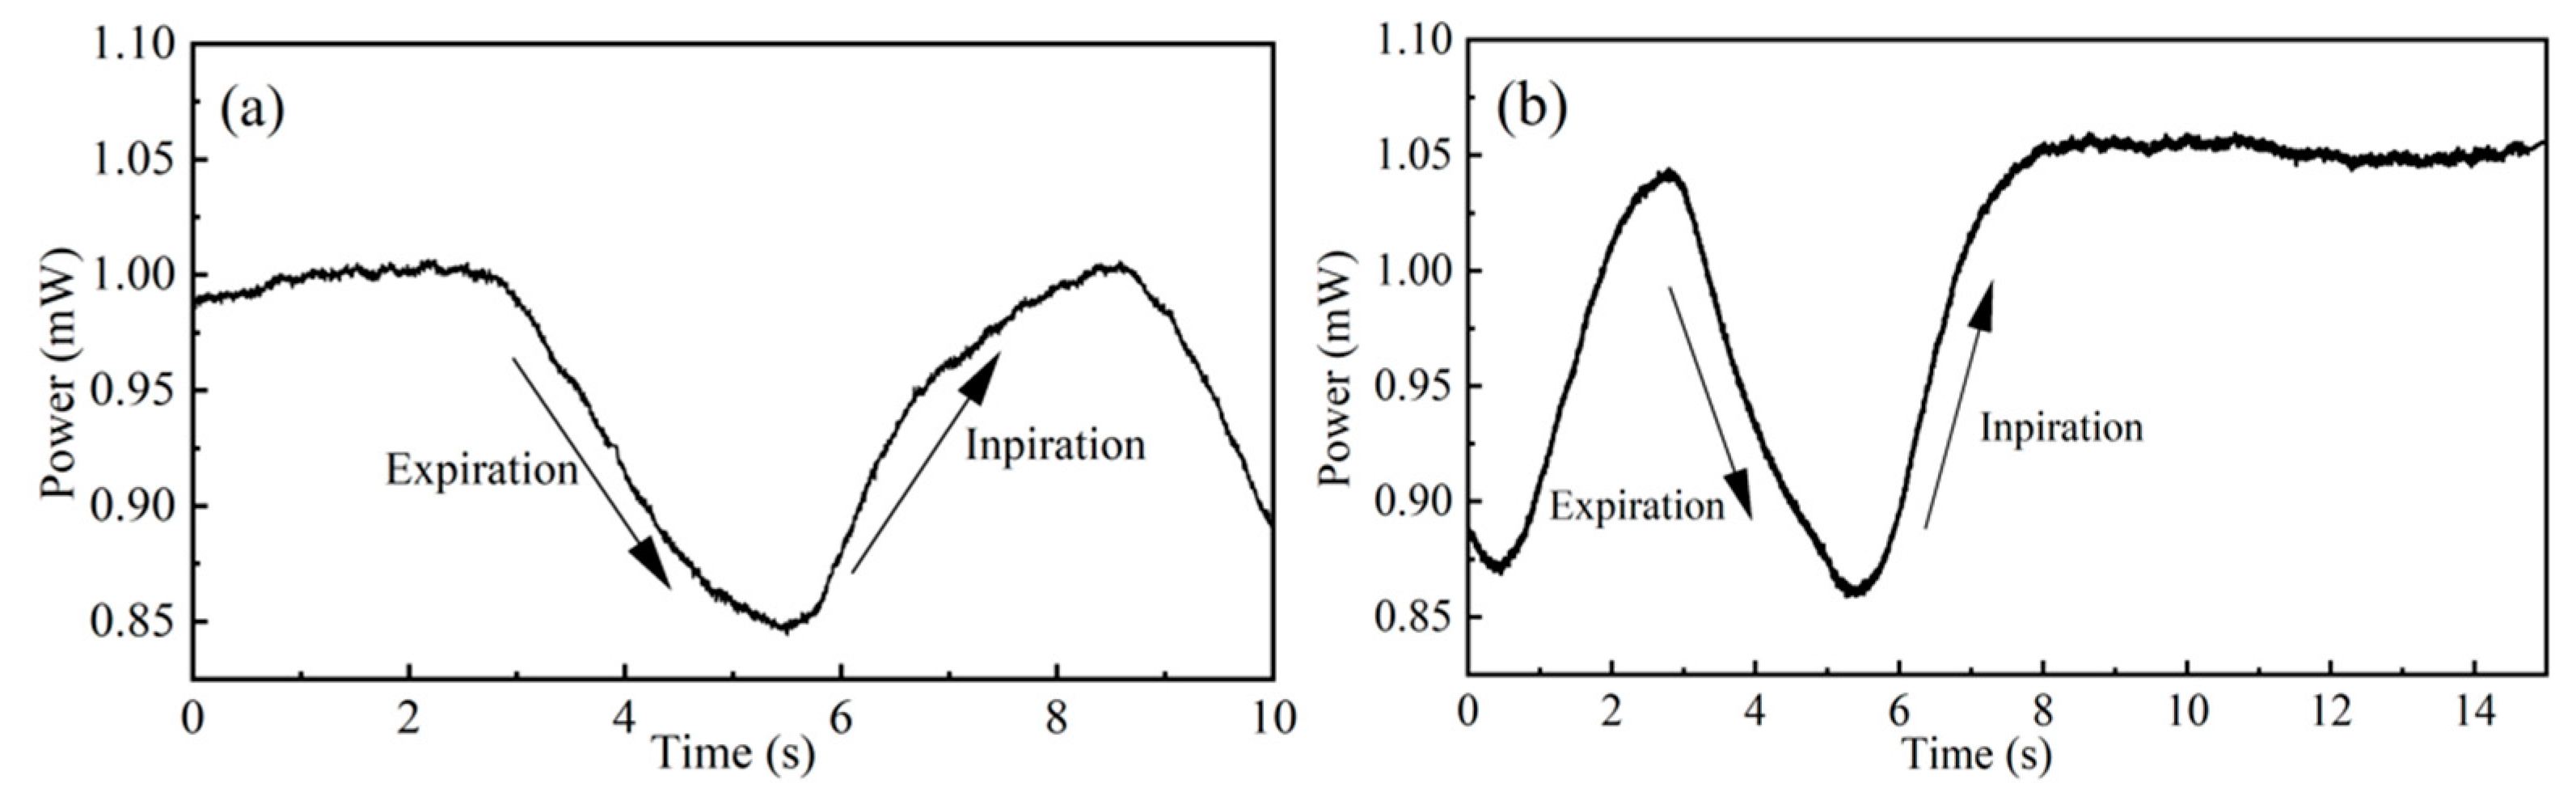
Figure 9.
Variations of optical power with different optical fiber diameters
Disclaimer/Publisher’s Note: The statements, opinions and data contained in all publications are solely those of the individual author(s) and contributor(s) and not of MDPI and/or the editor(s). MDPI and/or the editor(s) disclaim responsibility for any injury to people or property resulting from any ideas, methods, instructions or products referred to in the content. |
© 2023 by the authors. Licensee MDPI, Basel, Switzerland. This article is an open access article distributed under the terms and conditions of the Creative Commons Attribution (CC BY) license (http://creativecommons.org/licenses/by/4.0/).
Copyright: This open access article is published under a Creative Commons CC BY 4.0 license, which permit the free download, distribution, and reuse, provided that the author and preprint are cited in any reuse.


