Submitted:
02 August 2023
Posted:
03 August 2023
You are already at the latest version
Abstract
Transitioning to clean cooking fuels is not only part of achieving SDG7, but also makes a significant contribution to mitigating climate change by reducing carbon emissions. The paper contradicts the conventional wisdom that electricity is too expensive to cook with. The paper explores the energy required to cook dishes using different technologies and fuels by analysing data from Cooking Diaries and Controlled Cooking tests conducted under the MECS programme. Electric pressure cookers (EPCs) use least energy when compared with electric hotplates, and a detailed description of how the EPC works explains why this should be. The paper draws out distinctions between African and Asian dishes, notably the impact of energy intensive dishes prepared mostly in Africa. Standard efficiency based approaches to comparing the performance of stoves are not appropriate to modern electric cooking devices so an alternative approach based on specific energy consumptions is proposed e.g. charcoal stoves use 15 times as much energy as EPCs to cook African dishes. Energy ratios provide a basis for estimating carbon emission reductions associated with transitioning to modern cooking fuels. Historical costs show that the cost of cooking with an EPC can be only 20% of the cost of cooking with charcoal, which highlights the potential for modern, energy efficient electric cooking devices to defy the conventional wisdom of the energy ladder.
Keywords:
cooking
; modern energy
; electric pressure cooker
; induction
; energy transition
; low and middle income countries
1. Introduction
The role of clean cooking in just energy transitions is reflected in Target 7.1.2 of SDG7 (access to clean fuels for cooking). A recently published policy brief predicts that the most recent figure of 2.3 billion people lacking access to clean cooking will only fall to 1.9 billion by 2030 unless fundamentally new approaches are adopted [1]. A key feature of this would be accelerating access to modern fuels and technologies while reducing reliance on biomass fuels. Figures highlight stark geographical differences; progress over the last decade has been achieved mostly by countries in Asia, notably India, China, and Indonesia, whereas almost all countries with the lowest access rates are to be found in Africa.
Much of the early work on clean cooking focused on improved biomass cookstoves, driving improvements in combustion efficiency as a means to reducing household energy burdens. However, more recent work on modern cooking highlighted a dearth of literature on what and how people actually cook [2]. It was only in 2008 that Cowan studied the energy used to cook a range of foods using different fuels [3].
In the absence of data, conventional wisdom suggested that cooking with electricity was not a feasible option for a number of reasons; mostly that it is too expensive, but also because of quality of power supply and grid issues [4]. However, electric cooking is becoming increasingly viable as an option because of impressive increases in electrification rates over recent years coupled with the advent of high efficiency electric cooking devices and escalating prices of traditional fuels. Furthermore, data has shown that cooking with electricity can be cost competitive with traditional fuels in many countries and, in some instances, can be considerably cheaper. Perhaps the most authoritative study is ESMAP’s 2020 paper [5], which uses five case studies to compare not only fuel costs but also the cost of cooking appliances, and uses a discounted cash flow analysis to compare levelized costs of cooking with different technologies.
The contribution that cooking with biomass fuels makes to global GreenHouse Gas emissions is now recognised as substantial, accounting for approximately 2% of global emissions [6]. Accordingly, policy makers are increasingly concerned to understand the energy used by traditional cooking fuels and devices, and how that compares to the energy used by modern cooking fuels and devices. This interest is driven by the need to characterise the greenhouse gas emission impacts of transitions in cooking within national plans for decarbonisation (and hence their nationally determined contributions (NDCs)) and also for calculations that are required to claim carbon credits and other impact benefits.
The paper fills a gap in the literature by providing empirical evidence from multiple countries of ‘real world’ cooking energy requirements using a range of technologies and fuels, and a number of electric cooking technologies in particular. The data is drawn from a number of studies carried out by the FCDO funded Modern Energy Cooking Services (MECS) programme in a number of countries across Africa and South East Asia. The paper then develops the concept of an energy ratio, representing the energy used by a traditional fuel divided by that needed by a modern device. It also presents a comparison of cooking energy costs based on historical price data.
2. Background
In order to make progress on Target 7.1.2 of Sustainable Development Goal 7 (“Proportion of population with primary reliance on clean fuels and technology”), households will need to transition from polluting to clean cooking fuels. Many studies have explored factors linked to this transition. Factors highlighted in a number of example studies suggest a number of categories [7,8,9]:
- Demographics: income; level of education; gender of household head; urban/rural; lack of awareness
- Household structure: household size; number of meals cooked; type of food cooked; owned or rented; type of dwelling
- Fuels and technologies: fuel prices; price of stove; availability of fuel and stoves; fuel price fluctuations
Of these, income is consistently identified as a key factor that is linked to the adoption of cleaner cooking fuels. It is not surprising, therefore, to find that many studies generally support the idea of the energy ladder, which asserts that as people become better off they transition from cheaper, inefficient and polluting technologies towards more costly and efficient technologies [10].
One characteristic of these types of studies is that they tend to be based on an analysis of data from living standards surveys so they focus on household demographics. Other studies consider the affordability of fuel and technology combinations and take into account a broader view of more detailed factors. Gill-Wiehl et al [11] provide a comprehensive overview of different approaches to assessing affordability, including:
- The balance between cost of cooking and overall household expenditure.
- Expressing the cost of cooking as a proportion of monthly expenditure.
- Considering both the cost of fuel and the capital cost of the stove, along with implications of each on household finances.
- The impact of liquidity constraints on fuel and stove purchasing behaviours.
The ESMAP study [5] makes the point that some households may well be spending more on cooking fuels than might be regarded as “affordable”. In which case it is of more value to compare the cost of cooking with different fuels in order to identify lower cost alternatives. Studies that compare the cost of cooking consider not only the cost of the fuel but also the upfront cost of stove and any associated equipment. Levelised cost of cooking studies show that, for all fuels, the daily cost of fuel is the dominant component [12], but capital cost can nevertheless be a significant addition, and the upfront cost can present a substantial barrier. Capital costs are higher for modern energy appliances and present a more substantial challenge.
Cost comparison studies comprise two constituents: the energy needed to cook using different stoves and fuels, and the price of each fuel. Any assumptions or study data are of limited applicability because both of these aspects are subject to large variations. Energy consumption varies hugely between dishes; some dishes such as beans are energy intensive whilst others such as ramen are not. A quick look at some of the MECS cookbooks shows differences in the energy needed to cook different dishes (https://mecs.org.uk/ecookbooks/ accessed on 22 June 2023). Fuel prices depend on location, e.g. charcoal prices are higher in the city than in the countryside where the charcoal is produced; electricity tariffs charged in some countries (e.g. Ethiopia, Zimbabwe) are an order of magnitude lower than in others (e.g. Kenya and Rwanda) (https://www.statista.com/statistics/1277594/household-electricity-prices-in-africa-by-country/ accessed on 22 June 2023). Fuel prices tend to be lower when fuel is purchased in larger quantities. Fuel prices may be volatile, but will inevitably rise; prices of modern fuels (electricity, LPG, kerosene) are generally set periodically by regulators and will remain stable between price reviews. Unregulated or poorly regulated fuels such as charcoal and firewood tend to exhibit greater price volatility.
Early studies comparing the cost of cooking with different fuels often assert that modern fuels, and electricity in particular, tend to be more expensive than traditional fuels. Nerini et al concluded that in Kenya, cooking with wood in an improved cookstove (ICS) was the cheapest option and that higher tier stoves were most costly [13]. Jeuland and Pattanayak proposed that the most attractive fuel transition options were from wood burning stoves to kerosene or LPG, and from traditional charcoal stove to charcoal ICS [14]. Toman and Bluff take Jeuland and Pattanayak’s findings and point out that better thermal performance (efficiency) means that LPG and kerosene can be cheaper than biomass fuels [15]. The paper also provides a useful description of a range of practical considerations that compete with fuel and technology costs when households make cooking fuel choices.
Given the difficulties and potential expense of measuring real world cooking energy consumption, these studies tend to be based on modelling. Electric cooking tends to be modelled using assumptions of efficiency based on inefficient resistive coil hotplates. Nerini et al assume conservation of ‘useful energy’ into the pot: “the value of final energy per meal is independent from the used stove-fuel combination”. These assumptions inherent in earlier modelling need to be revisited in the light of the advent of modern, energy efficient electric cooking devices, such as induction hobs, air fryers, and electric pressure cookers (EPCs). EPCs, for example, minimise cooking energy consumption due to three factors – insulation, automation, and pressurisation [5]. These devices are discussed further in this paper.
The cost of cooking with this new generation of cooking appliances can be lower than estimates found in previous studies. For example, modelling of urban, grid connected households paying high prices for charcoal shows that monthly costs of a clean fuel stack of electricity and LPG can be half that of cooking with charcoal [5]. Note that this is not a criticism of earlier studies given that these types of devices have only recently reached mainstream markets. Both the EPC and air fryer were launched less than 15 years ago (the EPC in 2009 (https://www.nytimes.com/2017/01/31/dining/instant-pot-electric-pressure-cooker-recipes.html; accessed 22 June 2023) and the air fryer in 2010) and they only really arrived in developed country markets less than 10 years ago (the EPC in 2015) and air fryers in 2017 (https://www.nytimes.com/2022/01/25/dining/air-fryer.html; accessed 22 June 2023). Therefore, it is only recently that they have begun to appear in developing country markets [16].
3. Methods
Over the course of the MECS program, different types of studies have generated data on both energy consumption and costs of cooking associated with a range of fuels and devices. To date, this data has been presented in reports on individual, country specific studies. In this paper, we pool together as much field data as possible from previous MECS studies to create a more robust (larger) dataset and explore what can be learned about the relative costs of cooking using different fuels.
The collated dataset contains 700 data points for foods cooked using a range of electrical appliances, and over 180 data points of foods cooking using traditional fuels (wood, charcoal and LPG). Most studies have generated data from households with different numbers of people, and some of the controlled cooking studies have used different portion sizes (e.g., meals for 4 or 6). Therefore, the analysis here is based on specific energy consumption (SEC) figures measured in terms of MJ/person/event.
Distinguishing between meals and dishes cooked can be tricky. We refer to cooking or heating ‘events’ rather than meals because in most studies, a heating event can cover either a meal (breakfast, lunch, dinner) or another heating purpose, such as heating water for bathing. A single heating event record could cover multiple purposes, e.g., food could be prepared for both breakfast and lunch (two purposes). Then a single heating event, for a single purpose such as preparing a dinner, could include several dishes and/or heating water as part of that meal. Of the 600 electric cooking data points involving a single device only, 97% involve cooking only a single dish, as do 72% of the data points for traditional fuels.
Data has been gathered from the following types of studies across a range of countries (see Table 1);
-
Cooking Diaries – a small number of cooks (e.g., 20) are typically asked to cook as normal using a mix of traditional fuels for a couple of weeks (baseline phase) and then to swap to using electric cooking appliances to cook as much of their menu as possible during a transition phase. During the study, cooks record all the dishes cooked, and measure the energy used; a more detailed description can be found in the Cooking Diaries 3.0 Protocols document [17]. Cooking diaries studies have been conducted as part of a number of MECS research activities:
- a)
- Understanding consumer behaviour carried out by collaborating partners;
- b)
- The Electric Cooking Outreach (ECO) Challenge Fund – one of the challenge fund themes was to investigate whether efficient electric cooking appliances fitted the cooking culture and electricity supply context of a given country. Many of the projects commissioned included some kind of cooking diaries exercise.
- c)
- All electric cooking studies – a series of studies was commissioned to explore the viability of cooking an entire menu with a range of electric cooking devices.
- Controlled Cooking Tests – a small number of typical dishes are cooked by the same cook but using different fuels and appliances. Tests are repeated multiple times for each dish. The energy, cost and time data presented in the MECS cookbooks is drawn from controlled cooking tests.

Table 1.
Sources of data on cooking energy (and costs).
| Cooking Diaries | Controlled cooking tests | |||
| Cooking Diaries | ECO Project | 100% eCook | ||
| Africa | ||||
| Ethiopia | ✓ | |||
| Kenya | ✓ | ✓ | ✓ | |
| Rwanda | ✓ | |||
| Tanzania | ✓ | ✓ | ✓ | |
| Uganda | ✓ | ✓ | ✓ | |
| Zambia | ✓ | ✓ | ✓ | |
| Asia | ||||
| Bangladesh | ✓ | ✓ | ||
| Cambodia | ✓ | ✓ | ||
| India | ✓ | |||
| Myanmar | ✓ | ✓ | ||
| Nepal | ✓ | ✓ | ✓ | |
Both the Controlled Cooking test and Cooking Diaries methodologies are designed to generate data that is closer to ‘real world’ cooking practices than laboratory testing of devices, such as the water boiling test. The Controlled Cooking Test described above is a recognised methodology (https://pciaonline.org/files/CCT_Version_2.0_0.pdf; accessed 31 July 2023) in which testers define the cooking process for a typical, commonly cooked dish, measuring the energy required to prepare the dish using different technologies and fuels. The focus is on repeatability. However, the methodology acknowledges that different results will be obtained when cooking different dishes. The Kitchen Performance Test (KPT) methodology (https://cleancooking.org/binary-data/DOCUMENT/file/000/000/604-1.pdf; accessed 31 July 2023) employs local people cooking in their own kitchens as part of their daily routines and measures fuel consumption under typical conditions. Daily records of the number of people cooked for and fuel measurements are taken over a short period of oat least three days. The methodology acknowledges that it is difficult to control sources of errors and that intervention stoves may be stacked with traditional stoves. The cooking Diaries methodology takes the household cooking approach one step further by recording the number of people cooked for and fuel consumption at the meal level, as well as recording individual dishes prepared. There are advantages and disadvantages of each of these approaches.
For the purposes of comparing devices, this study has focused on median values of energy and cost as a closer measure of ‘typical’ cooking practice. This is because mean values can be influenced by outliers, such as poorly tended stoves, and the lady who cooked 30 chickens for a church gathering. Having said that, the paper highlights the influence of energy intensive meals that are cooked regularly, if not frequently. The influence of outliers is reduced with larger datasets, so the rationale for using median values may diminish in future studies with improved datasets.
4. Results
This section may be divided by subheadings. It should provide a concise and precise description of the experimental results, their interpretation, as well as the experimental conclusions that can be drawn.
4.1. Electric cooking devices tested
When cooking a single dish with electricity, an EPC was the most commonly used device, given that the purpose of most Cooking Diaries and Controlled Cooking Tests studies was to understand the compatibility of EPCs with cooking practices and menus. More recently, a series of all electric cooking studies generated data on a wider mix of electric devices (see Table 2).
Teams from Myanmar and Bangladesh carried out tests covering the widest variety of different cooking devices (see Table 3). Other electric cooking devices that were tested, but not included in Table 3 because there were too few records, are air fryer, electric grill, roti maker, water heating thermopots.
4.2. Comparing electric cooking devices
4.2.1. Specific energy consumption and variance
Specific energy consumption figures have been calculated for all single dishes cooked in a range of electric devices. Average figures in Table 4 show that, among cooking devices, EPCs use least energy. However, the figures in Table 4 may be misleading because of the different mix of dishes cooked in different devices. For example, the local Ethiopian hotplates are a crude, locally manufactured device that is used mostly for heating water (including tea, milk, coffee); these records have not been included in the remaining analysis with data on hotplates, which have been used to cook a wide range of dishes (see Table 5).
Figure 1 illustrates how EPCs are more economical than hotplates, with median consumption values of 0.067 and 0.094 kWh/person/event respectively (0.24 and 0.34 MJ/person/event). The outlier in the EPC data is chicken biryani cooked in Kenya and the hotplate data includes records of energy intensive bean stews from Kenya, Uganda and Zambia. The induction data also includes a few records relating to bean based dishes, which have high consumption figures. Although these are referred to as outliers, they are energy intensive dishes that are commonly cooked, so they have been included in the analysis.
4.2.2. CCT data only
The cooking diaries studies are a good way of generating ‘real world’ data, in which ordinary cooks prepare everyday food in their home environment. The downside is that you can’t control how they cook, what recipes they use, and they are free to use devices inappropriately (e.g. cooking for too long, not controlling the power level, leaving the lid off). It can be argued that comparing results from controlled cooking tests is more reliable. The results in Figure 2 show similar results when compared with figures for all single dishes in Figure 1. Note that results for EPCs, induction hobs and rice cookers correspond closely between the two figures, but results for hotplates and infrared hobs are substantially different. The median consumption for dishes cooked on a hotplate is higher at 0.113 kWh/person/event, compared with 0.088 kWh/person/event for all records. This is because the CCT data includes several energy intensive bean dishes, mostly from Kenya. On the other hand, the median consumption for dishes cooked on an infrared hob is lower at 0.073 kWh/person/event, compared with 0.105 kWh/person/event for all records. Many infrared hob records generated by the All Electric cooking studies were relatively energy intensive; it is not clear why this should be, given that they were used to cook a range of dishes.
4.2.3. Categorising ecook devices
More meaningful results can be achieved by selecting a subset of only those dishes that were cooked in several devices (Table 5). Average specific energy consumption figures have been calculated for each device cooking only this restricted set of common dishes (Table 6). N.B. curry cookers and slow cookers have been combined because they are similar devices. The consumption of slow cookers is twice that of curry cookers, but curry cookers were used to prepare curries, vegetables and noodles, whereas slow cookers were used to prepare soups and rice, so it is asserted that the difference in energy consumption is due to the types of dish prepared rather than technical differences in the devices used.
Comparing the median energy consumption figures illustrated in Figure 3 highlights a number of characteristics of electric cooking devices:
- Despite being insulated, Curry and slow cookers use the most energy; this is because they are typically in operation for long periods of time, during which even reduced rates of radiation and convection result in substantial energy losses;
- Infrared hobs do not appear to offer any improvements over hotplates.
- Induction hobs, on the other hand, do use less energy than hotplates, due to the coupling of the energy source with the bottom of the pan, which eliminates losses from any hot surface not in contact with the pan. The electric frying pan offers the same benefit, because energy from the heating element is transferred directly to the pan, and indeed figures for the two devices are similar.
- The rice cooker uses still less energy because not only is heat transferred directly to the pot, but it also benefits from insulation and automation. Note that this data is based on using rice cookers to cook a wide range of dishes, not just rice (see Table 5).
- The EPC combines direct heating, insulation, and automation with cooking at pressure, resulting in further improvements in energy consumption.
Based on median energy consumption figures for cooking only the most commonly prepared dishes, the following classification of devices is proposed:
- Inefficient devices: curry cookers and slow cookers
- Hot surface hobs: hotplates and infrared hobs
- Direct heating devices: induction hobs, electric frying pans and rice cookers
- Pressurised cooking: EPC
This classification of devices (Table 7) shows that, compared with hotplates:
- Direct heating devices save approximately 20%
- EPCs save over 40%.
There is a case to be made for putting rice cookers in a class of their own because of their insulation and automated control characteristics but, given the modest difference in results, they have been grouped together with the other direct heating devices. Note that the number of data points for several of these devices are low, so it should be possible to draw more nuanced distinctions between devices as more data becomes available. A comparison of Table 7 with the equivalent table in an earlier working paper [18] illustrates the impact of gaining additional data points.
Table 7.
Energy consumption relative to hotplate (based on median values).
| Device | Energy used expressed as proportion of energy used by Hotplate (%) |
| Long cook | |
| Curry/slow cooker | 107% |
| Thermal hobs | |
| Hotplate | 100% |
| Infrared | 105% |
| Direct heating devices | |
| Induction | 79% |
| Rice cooker | 75% |
| Frying pan | 83% |
| Pressurised device | |
| EPC | 56% |
4.3. Regional differences and frequency distributions
It has been pointed out that African bean stews are particularly energy intensive and tend to pull up mean specific energy consumption values. The Zambia Kitchen Laboratory Test report does point out that cooking 500g of beans can usually feed a family for two meals, so it is perhaps unfair to include the consumption figures in this analysis, but they have been included for the purposes of comparison. Figure 1 includes a number of bean stews tested on hotplates in Uganda and Zambia, all of which tended to use relatively high amounts of electricity. While the mix of foods cooked in EPCs will be different to the precise mix of foods cooked using hotplates, it does include similar stews, yet the interquartile range is tighter.
Given differences in diet and cooking style between Africa and Asia, we might expect to see regional differences in energy consumption. And indeed, it can be seen in Figure 4 that African dishes use more energy when cooked using EPCs. African dishes used half as much energy again as Asian dishes – 0.073 and 0.050 kWh/person/event respectively (medians). This trend is less clear when comparing hotplates and induction hobs in Africa with Asia. Comparing mean values indicates that African dishes require more energy, but this is not reflected in the median values (summarised in Table 8). This is explained by looking at the distributions for different devices. Distributions for EPCs in Africa and Asia and hotplates in Asia are positively skewed, but only modestly (z-scores of skewness are 3.4, 3.9, and 2.2 respectively). In comparison, distributions for hotplates and induction hobs in Africa are more highly skewed (z-scores of skewness are 8.0 and 7.2 respectively), which explains why the means are so much greater than the median values. These highly skewed distributions reflect the occasional preparation of energy intensive dishes in African menus, such as bean based dishes, that lead to a long tail of high energy data points.
Why is the distribution of African dishes cooked in EPCs not skewed in the same way? This is a consequence of the way an EPC works. Most of the energy consumed is used in bringing the contents up to pressure. Once at pressure, automated control adds small amounts of energy to make up for heat lost during the cooking period. These losses are minimised because of the shortened cooking period, and the insulating effect of the air gap between the pot and the external casing. Therefore, differences in the period of time spent cooking at pressure make relatively little difference to the total energy consumption.
4.4. Traditional Fuels and energy ratios
When looking at traditional fuels, Figure 6 confirms that when cooking with both charcoal and LPG, African dishes use more energy. Note that the y-axis scale in Figure 5 is an order of magnitude greater than the scale in Figure 5.
The energy used to cook using ‘traditional’ fuels can be compared with the energy used when cooking with a number of electric devices (EPCs, hotplates, induction and infrared hobs; see Table 9). These energy ratios reflect the differences in cooking practices between African and Asian countries. Energy ratios are higher in Africa: cooking with charcoal uses 15 times the energy used by an EPC and approximately ten times the energy used by a hotplate; cooking with LPG uses four times the energy used by an EPC. Across Asian countries, cooking with charcoal uses 11 times the energy used by an EPC and approximately six times the energy used by a hotplate; cooking with LPG uses four times the energy used by an EPC.
In this table, the regional differences in energy ratios are mainly due to the lower energy requirement for cooking with traditional fuels in Asia (Figure 5); aside from EPCs, the median values of energy required to cook with electric devices is similar across the two continents, as discussed in Section 4.3.
4.5. Costs of cooking
But what about relative costs of cooking? Ascertaining the cost of cooking with traditional fuels is notoriously difficult because everybody pays a different price, depending on location, season, what quantities they buy fuel in etc. For example, a case study from rural communities in Tanzania estimated that some people paid twice the price for charcoal if they bought it in small measures [19]; a detailed study of charcoal prices in Zambia shows a similar trend2. Therefore, for the purposes of this study, data from cooking diaries studies, using multiple participants, has been omitted. Instead, only data from controlled tests has been included. Each study used fuel prices prevailing in the study country at the time of the study (see Table 11)3.
Figure 6 indicates that across all dishes captured, the costs are lowest when cooking with an EPC. Median values presented in Table 10 show that, overall, the cost of cooking with an EPC is 27% of the cost of using LPG, and 20% of the cost of using charcoal. These cost figures are based on the fuel prices given in Table 11. Note the large range in electricity prices, from the lifeline tariff in Zambia to the near full cost recovery tariff charged in Uganda, so the distribution of costs presented in the figure reflect a range of fuel prices and electricity tariffs as well as variation in the amount of energy used.
Table 10.
Per capita costs of cooking with different fuels - medians (controlled tests, single dishes only).
Table 10.
Per capita costs of cooking with different fuels - medians (controlled tests, single dishes only).
| Fuel | N | Per capita cost (USD/person/dish) |
| EPC | 88 | 0.0042 |
| Firewood | 15 | 0.0087 |
| Charcoal | 17 | 0.0206 |
| LPG | 33 | 0.0153 |
Table 11.
Fuel prices used in the studies.
| Country | Electricity tariff (USD/kWh) |
Firewood price (USD/kg) |
Charcoal price (USD/kg) |
LPG price (USD/kg) |
| Zambia | 0.033 | - | 0.294 | 1.047 |
| India | 0.067 | 0.933 | ||
| Bangladesh | 0.067 | - | - | 0.969 |
| Myanmar | 0.069 | 0.083 | 0.340 | 1.263 |
| Nepal | 0.083, 0.077 | 0.053 | - | 0.857 |
| Tanzania | 0.152, 0.151 | |||
| Kenya | 0.209 | |||
| Uganda | 0.215 | - | 0.286 | 2.714 |
5. Discussion
5.1. The physics of cooking
How does the efficiency of an electric pressure cooker compare with a simple hotplate? This is a question that is often asked, which is not surprising because most assessments of energy savings from improved stoves are based on comparing thermal conversion efficiencies of improved and traditional stoves.
A recent study using a cheap single spiral coil hotplate concluded that it would boil water at an efficiency of approximately 50% [20]. If we assume a more conservative efficiency of 60% for a more advanced hotplate, a conservation of useful energy approach based on the energy ratios achieved across Asian dishes prepared indicates that the efficiency of the EPC would be over 110%. This is clearly nonsense.
This exercise illustrates the impact of cooking in a different way. EPCs are a good example, but there are others, such as microwaves. If cooking is done in a pot with a lid (at atmospheric pressure), then a given dish will require a fixed amount of energy to cook, irrespective of how that energy is sourced – the ‘useful’ energy that needs to be transferred into the pot to cook its contents appropriately remains constant. By contrast, when food is cooked at pressure in an EPC, it requires less energy input to the pot and its contents to cook.
A pressure cooker is effectively an insulated pan and lid, in which the rate of steam escape is minimised / controlled. If steam is not allowed to escape, then the pressure inside the pan increases. The change from a liquid phase to a gaseous phase occurs when the vapor pressure of the liquid is equal to the ambient pressure exerted on the liquid. So as pressure increases in the pan, water molecules in the fluids in the pan need additional heat to gain the speed necessary to evaporate, i.e., the temperature of the pan’s contents continues to increase until the water has sufficient energy to evaporate at a boiling point that is higher than 100oC. An electric pressure cooker might operate at around 1 atmosphere (100kPa) pressure above ambient, which leads to a boiling point of around 112oC. Sensors detect when operating pressure has been reached and then switch off (or modulate down) the heat input, maintaining the contents just at the boiling point. A key feature is that when the lid is sealed and the release vale is closed, steam generation is negligible.
Cooking involves raising the temperature of food until chemical reactions take place; those reactions usually happen faster at higher temperatures, and the higher temperatures also allows the heat to penetrate throughout the food more quickly. So the higher pressure in an EPC means the food cooks at a higher temperature and therefore more quickly. This translates to the EPC delivering a different ‘cooking service’: the same food, but cooked in a shorter time.
Compared with conventional cooking, additional heat is needed to raise the pan and its contents to the higher temperature. Additionally, once at the operating pressure (and hence at the elevated boiling point), the heat loss from the device will be higher than if it were operating at 100oC, as loss is proportional to temperature difference. However, the rate of heat loss is reduced much more than this by the low thermal transmittance (U-value) of the appliance construction, due to the insulation around the pan. Furthermore, if the food cooks, for example, in half the time, then the heat loss itself is further reduced, as losses are sustained over a shorter time.
The water boiling test (https://cleancooking.org/binary-data/DOCUMENT/file/000/000/399-1.pdf; accessed 13th April 2022) is commonly used as a means of assessing the thermal conversion efficiency of cooking appliances. This measures the energy required to bring a pan of water to the boil and then to simmer it for 45 minutes. The efficiency is calculated by comparing the measured energy use with the ‘useful’ energy needed to raise the pan and water to boiling point (calculated from the physics of its mass and density) plus the energy needed to evaporate the water that is lost during the test (calculated from the physics of that evaporation). This methodology is particularly inappropriate to reflect the performance of a pressurised cooking device because EPC cooking times are shorter than for unpressurised devices, yet the WBT specifies a standard simmering duration (45 minutes); this long test results in an unfairly high electricity use for the EPC, artificially reducing the measured efficiency. Furthermore, the WBT protocol includes the latent energy of water evaporated as part of the stove ‘output’ but an EPC has very low water evaporation by design, so this also suggests that the WBT does not reflect the operation of an EPC.
As noted, the EPC is delivering a different cooking service to traditional stoves, and thus it is not appropriate to seek to compare efficiencies. Therefore, asking about the efficiency of an EPC, if using standard efficiency measurements, is the wrong question. We should be asking about the specific energy required to cook a specified dish (or meal) when using different fuels and devices. This is what the energy ratios presented in Table 9 are based on, and it is argued that because they are based on real cooking studies, they are a more meaningful means of estimating energy savings from transitioning from traditional to modern cooking technologies and fuels.
5.2. Data needs for carbon credits
A significant source of the funding needed to scale clean cooking will be via carbon and other impact markets, which are structured with results-based payments delivered upon achievement of emission savings [21]. The methodologies used to calculate the payments are based on measurements of fuel use for cooking by a sample of households in the baseline and measurement again with the new stove, plus surveys of reported usage, with reductions in emissions related to efficiency improvement and/or fuel switch.
Some Modern Energy Cooking solutions are already being deployed with Internet-of-Things (IOT) technology allowing data collection for time and energy used. These are typically implemented to support Pay-As-You-Go business models. However, they can also deliver accurate data on the energy used for cooking, avoiding the uncertainties inherent in usage surveys. The MECS programme collaborated with Climate Care (now Climate Impact Partners) and Gold Standard to develop a methodology to calculate carbon credits for MEC devices, based on metering or other measurement of actual energy use for cooking (https://globalgoals.goldstandard.org/431_ee_ics_methodology-for-metered-measured-energy-cooking-devices; accessed 13 April 2022). The aim of the new methodology is to produce more accurate measurement of emission reductions and thus create carbon credits with higher integrity, but also to make the carbon credit project process simpler and less expensive by reducing the amount of survey work required.
The first version of the new methodology was based on comparison of the efficiencies of the baseline and project devices in delivering a certain about of cooking. However, as this paper shows, simple efficiency values cannot represent the energy performance advantages of MEC devices. A revision of the methodology was developed to allow calculations based instead on the specific energy consumption of the baseline and project stoves, with the carbon emission savings thus dependent on the energy ratio developed earlier.
SEC values reported in an earlier working paper version of this research was adopted by Gold Standard as suggested default values for use in the methodology. High quality data on energy use for cooking are thus essential to support the expansion of this important element in scaling clean cooking.
6. Conclusions
6.1. Modern Energy efficient devices and the energy ladder
The costs of dishes cooked in controlled cooking studies show that it is cheaper to cook with an EPC than any of the traditional fuels (firewood, charcoal, or LPG). Based on aggregated data from multiple countries and the range of fuel prices found in each country at the time of the studies, the cost of cooking with an EPC is 27% of the cost of using LPG, and 20% of the cost of using charcoal. This demonstrates that highly efficient electric cooking devices can offer substantial cost savings.
The new generation of efficient electric cooking appliances, such as EPCs, use much less energy than traditional electric appliances such as hotplates. The analysis suggests three categories of electric cooking devices. Resistive element hotplates and infrared hobs both use electricity to provide a hot surface onto which a pan is placed and use similar amounts of energy. A second category of energy efficient devices employs direct transfer of electrical heat to a pan, which may be insulated, as with rice cookers. When compared with resistive element hotplates, these direct heating devices (induction, electric frying pan and rice cooker) can save around 20%. EPCs are in a category of their own, due to the combination of insulation, automation and cooking under pressure, meaning they can save over 40% compared to a hotplate.
The data on the energy and cost performance presented in the paper show how this new generation of energy efficient electric cooking devices effectively violates the premise of the energy ladder theory. It shows that, while higher tier fuels such as LPG and ethanol may be more expensive than biomass fuels, this is no longer necessarily the case for cooking with electricity. On the contrary, in many instances it is cheaper than cooking with traditional fuels.
6.2. Performance assessment and energy ratios
When cooking under pressure, EPCs require less ‘useful’ energy to cook (according to the standard definitions of that), so it is not meaningful to compare efficiency figures with other cooking appliances. Neither is it appropriate to use current standard tests to assess the relative efficiency of EPCs. While an ‘efficiency’ for each device is an attractive concept, it relies on having a clear definition of the useful energy that is provided: for the water boiling test this is about change in temperature and then change in state of the water, which is physically easy to define and measure/calculate, but is not appropriate for comparisons between some devices. However, a better definition of the useful energy to use in an efficiency test is not obvious. Specific energy use, and the energy ratios that come from comparing those for different fuel and stove types may be a more realistic means of assessing relative performance. These energy ratios show that cooking with charcoal uses approximately 15 times as much energy as an EPC, and approximately ten times the energy used by a hotplate (based on African countries).
The range of energy used is much less when cooking dishes in an EPC, because energy losses are reduced. The sealed lid means no steam escapes during cooking, and the insulated pot means heat losses are minimal. Therefore, the duration of cooking time has much less impact on total energy consumption than for conventional cooking appliances.
6.3. For further investigation
Energy planners, policy makers, and utilities tend to think in terms of daily or even seasonal demand, so further analysis is needed to relate the individual dish level data presented in this paper to daily demand. Again, this can be done using the cooking diaries studies, which generated data on the number of dishes prepared as part of a given meal, and the number of meals prepared in a day.
The paper highlights how sensitive this kind of analysis is to the style and mix of dishes cooked on different devices. It draws out distinctions between dishes cooked in African and Asian countries; African dishes require more energy than Asian dishes. It highlights the impact of energy intensive dishes such as bean stews, more common in African diets. It recognises that different devices are preferred for cooking certain dishes. All of these pose challenges for assessing the relative performance of devices. The paper presents a methodology for overcoming these challenges by collating the weight of data on actual cooking practices that is available from multiple countries. It is recognised that the dataset remains limited, and there is a need for actors in the clean cooking sector to generate more data from more countries.
Author Contributions
Conceptualization, N.S. and M.L.; methodology, N.S. and M.L.; formal analysis, N.S. and W.C.; data curation, N.S. and W.C.; writing—original draft preparation, N.S. and M.L.; writing—review and editing, N.S.; visualization, W.C.; supervision, N.S. All authors have read and agreed to the published version of the manuscript..
Funding
This research was funded by UK Aid, FCDO (GB-GOV-1-300123). The APC was funded by UK Aid, FCDO.
Data Availability Statement
The data presented in this study are available on request from the corresponding author.
Acknowledgments
The authors acknowledge the work of partners in conducting the various studies that generated the data used. We also thank the many cooks who generously participated in some of these studies.
Conflicts of Interest
The authors declare no conflict of interest. The funders had no role in the design of the study; in the collection, analyses, or interpretation of data; in the writing of the manuscript; or in the decision to publish the results.
| 1 | In these box and whisker charts, the 1st, 2nd (median) and 3rd quartiles are represented by the 3 lines of the box; the mean is represented by the cross; the whiskers represent maximum and minimum values not categorised as outliers (values greater than the 3rd quartile + 1.5 times the interquartile range (IQR), or less than the 1st quartile - 1.5 times the IQR). |
| 2 | |
| 3 | More than one price represents different prices used in multiple studies. |
References
- UNDESA. Ensuring Universal Energy Access and Advancing Just, Inclusive and Equitable Energy Transitions. 2023.
- Leach M, Leary J, Scott N, et al. eCook Modelling, 2019. Available online: https://www.mecs.org.uk/.
- Cowan, B. Alleviation of Poverty through the Provision of Local Energy Services. 2008; 1–116.
- Batchelor, S.; Brown, E.; Scott, N.; Leary, J. Two Birds, One Stone—Reframing Cooking Energy Policies in Africa and Asia. Energies 2019, 12, 1591. [Google Scholar] [CrossRef]
- ESMAP. Cooking with Electricity: A Cost Perspective. World Bank Gr.
- Robert Bailis, Drigo R, Ghilardi A, et al. No Title. Nat Clim Chang.
- Bofah, R.O.; Appiah-Konadu, P.; Ngwu, F.N. Transition to cleaner cooking energy in Ghana. Clean Energy 2022, 6, 957–966. [Google Scholar] [CrossRef]
- Paudel, D.; Jeuland, M.; Lohani, S.P. Cooking-energy transition in Nepal: trend review. Clean Energy 2021, 5, 1–9. [Google Scholar] [CrossRef]
- Benka-Coker, M.L.; Tadele, W.; Milano, A.; Getaneh, D.; Stokes, H. A case study of the ethanol CleanCook stove intervention and potential scale-up in Ethiopia. Energy Sustain. Dev. 2018, 46, 53–64. [Google Scholar] [CrossRef] [PubMed]
- Masera, O.R.; Saatkamp, B.D.; Kammen, D.M. From Linear Fuel Switching to Multiple Cooking Strategies: A Critique and Alternative to the Energy Ladder Model. World Dev. 2000, 28, 2083–2103. [Google Scholar] [CrossRef]
- Gill-Wiehl, A.; Ray, I.; Kammen, D. Is clean cooking affordable? A review. Renew Sustain Energy Rev 2021, 151, 111537. [Google Scholar] [CrossRef]
- USAID Alternatives to Charcoal (A2C). Cost of Cooking Study. 2022.
- Nerini, F.F.; Ray, C.; Boulkaid, Y. The cost of cooking a meal. The case of Nyeri County, Kenya. Environ. Res. Lett. 2017, 12, 065007. [Google Scholar] [CrossRef]
- Jeuland, M.A.; Pattanayak, S.K. Benefits and Costs of Improved Cookstoves: Assessing the Implications of Variability in Health, Forest and Climate Impacts. PLOS ONE 2012, 7, e30338. [Google Scholar] [CrossRef] [PubMed]
- Toman, M.; Bluffstone, R. Challenges in Assessing the Costs of Household Cooking Energy in Lower-Income Countries. 2017. [Google Scholar] [CrossRef]
- Rousseau N, Scott N. Observations and statistics regarding MECS target markets for Electric Cooking Devices. 2021.
- Leary J, Batchelor S, Scott N. Cooking Diaries 3.0 Protocols. 2019.
- Nigel Scott, Matthew Leach. Comparing energy consumption and costs - from cooking across the MECS programme, 2023. Available online: https://mecs.org.uk/wp-content/uploads/2022/04/Comparing-energy-consumption-and-costs-–-from-cooking-across-the-MECS-programme.pdf.
- Inston R, Scott N. Costs of cooking with different fuels : a case study from mini-grids in Tanzania. 2022.
- Wollele, M.B. ; Debre Markos University Quantifying Energy Losses on Electric Cooking Stove. Int. J. Eng. Res. 2020, 9, 753–756. [Google Scholar] [CrossRef]
- Galt H, Mikolajczyk S, Long I, et al. the Role of Voluntary Carbon Markets in Clean Cooking. Climate Focus and the Modern Energy Cooking Services programme, 2023. Available online: www.mecs.org.uk.
Figure 1.
Specific energy consumption - electric appliances (single dishes only) 1.
Figure 1.
Specific energy consumption - electric appliances (single dishes only) 1.
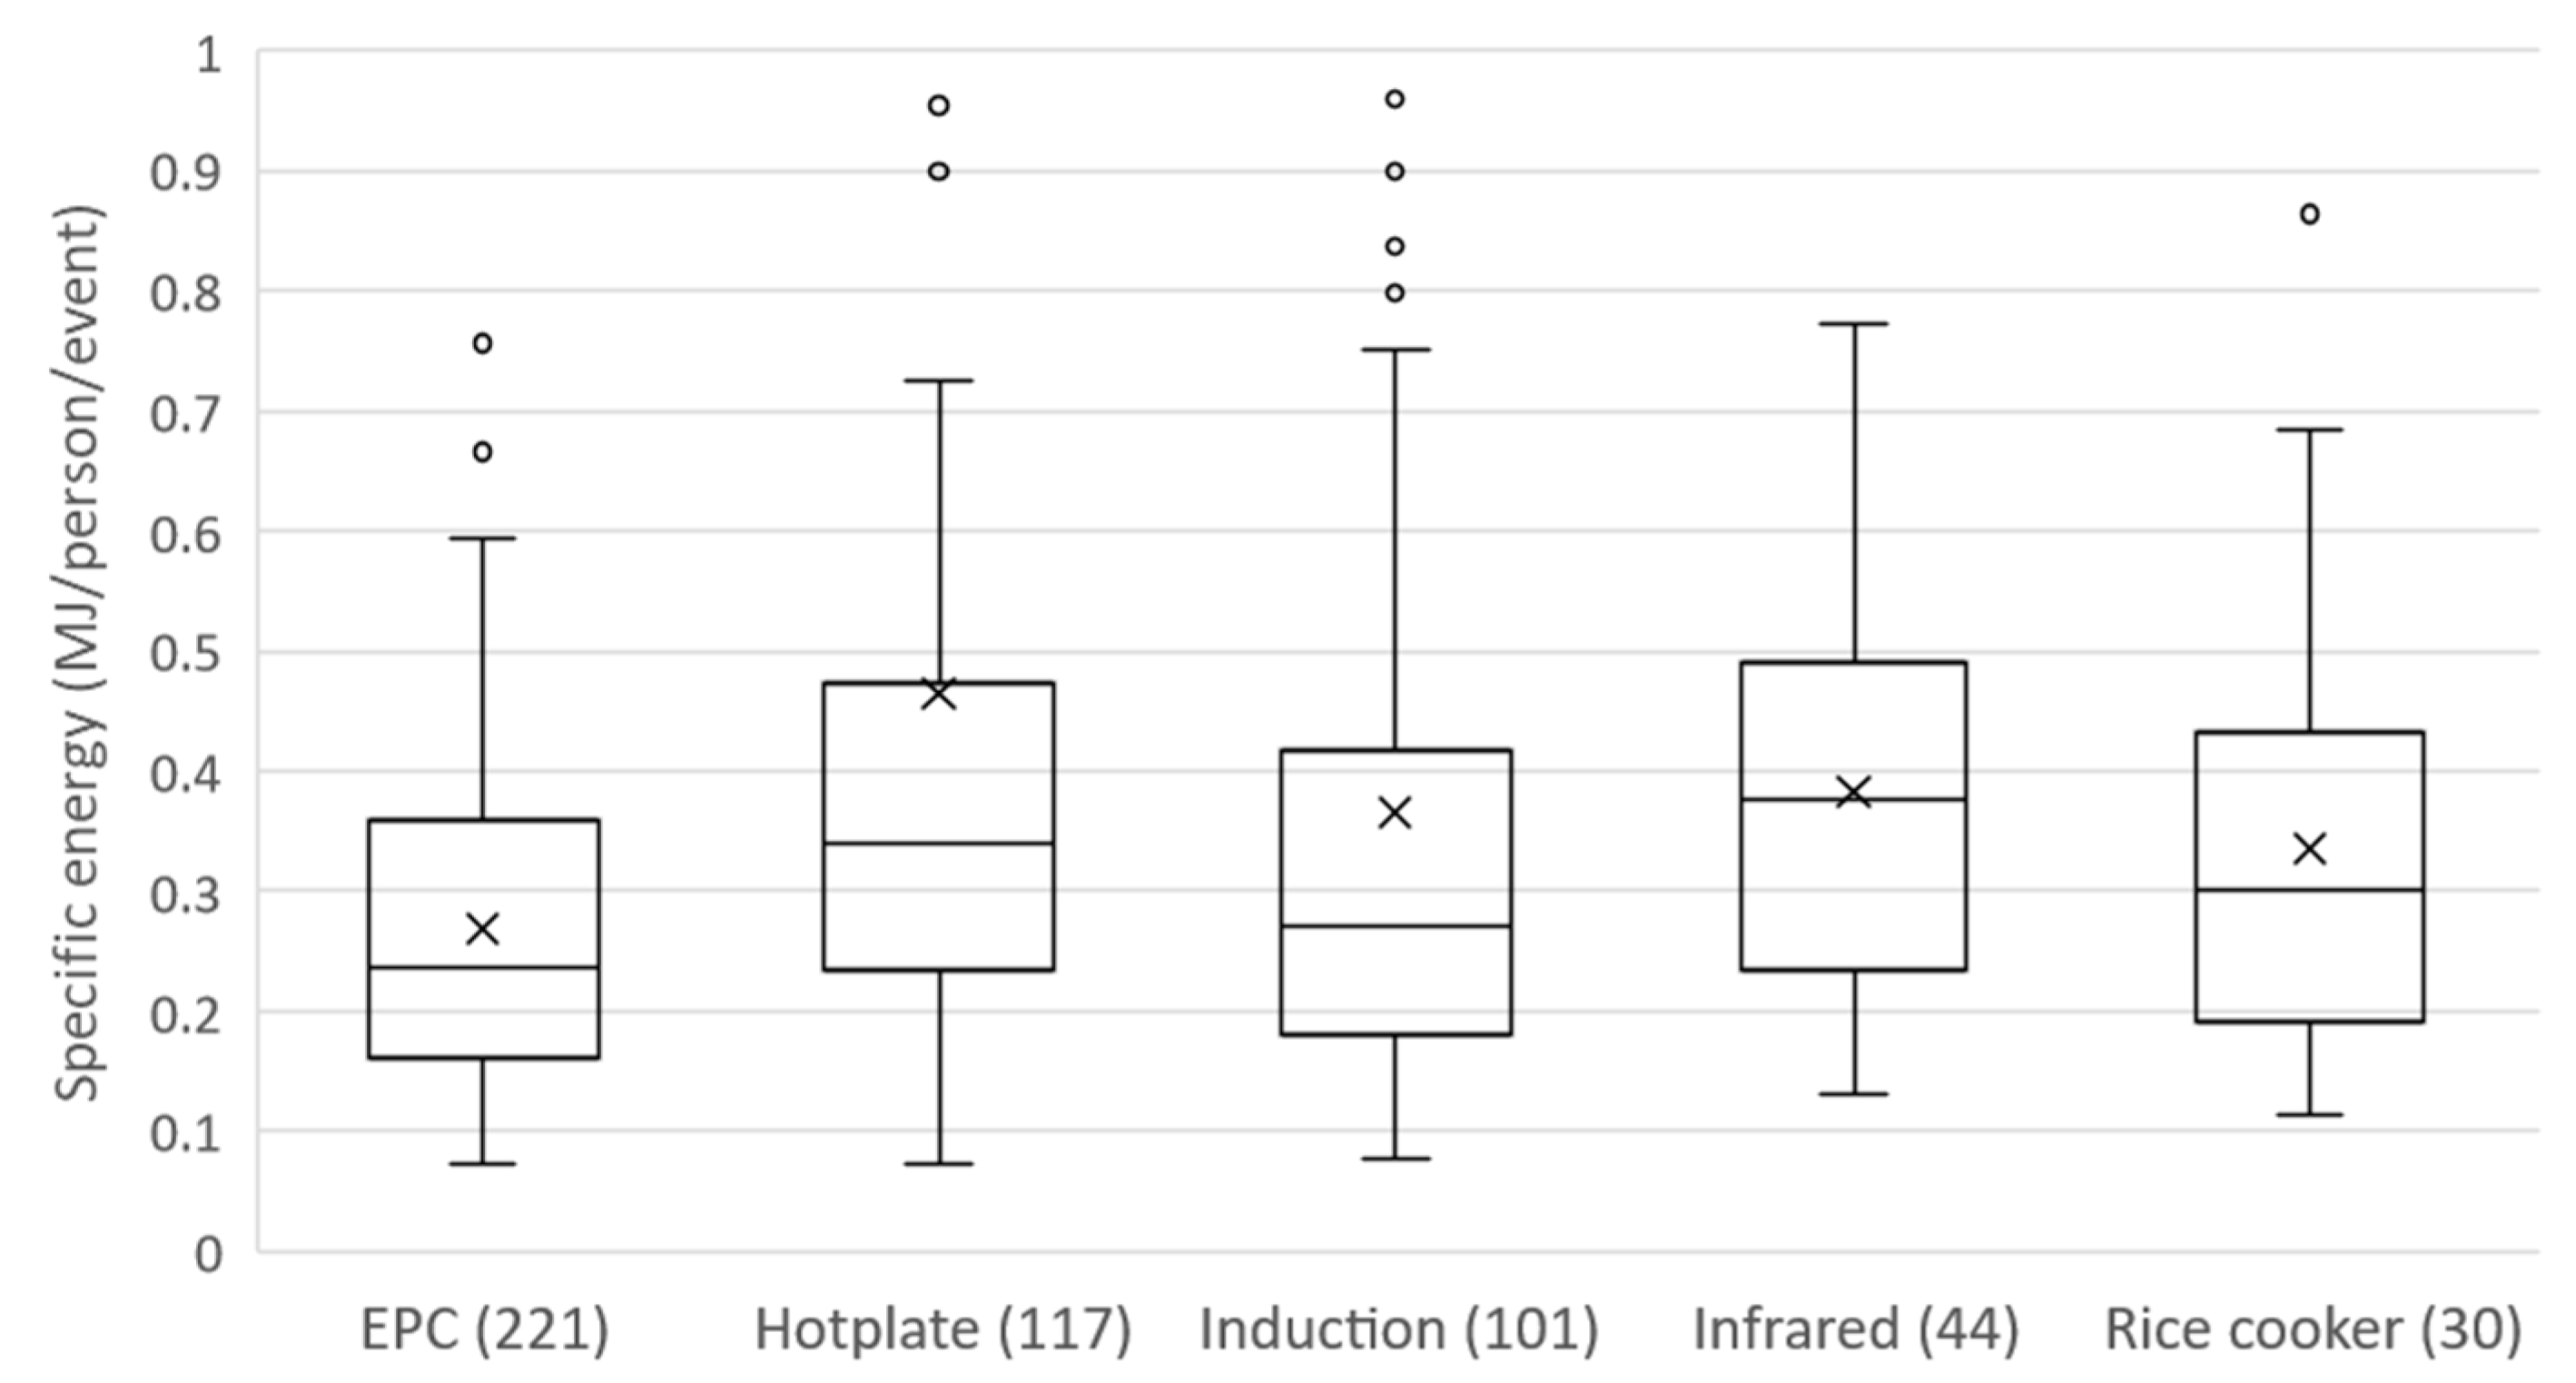
Figure 2.
Specific energy consumption from controlled tests - electric appliances (single dishes from CCTs only).
Figure 2.
Specific energy consumption from controlled tests - electric appliances (single dishes from CCTs only).
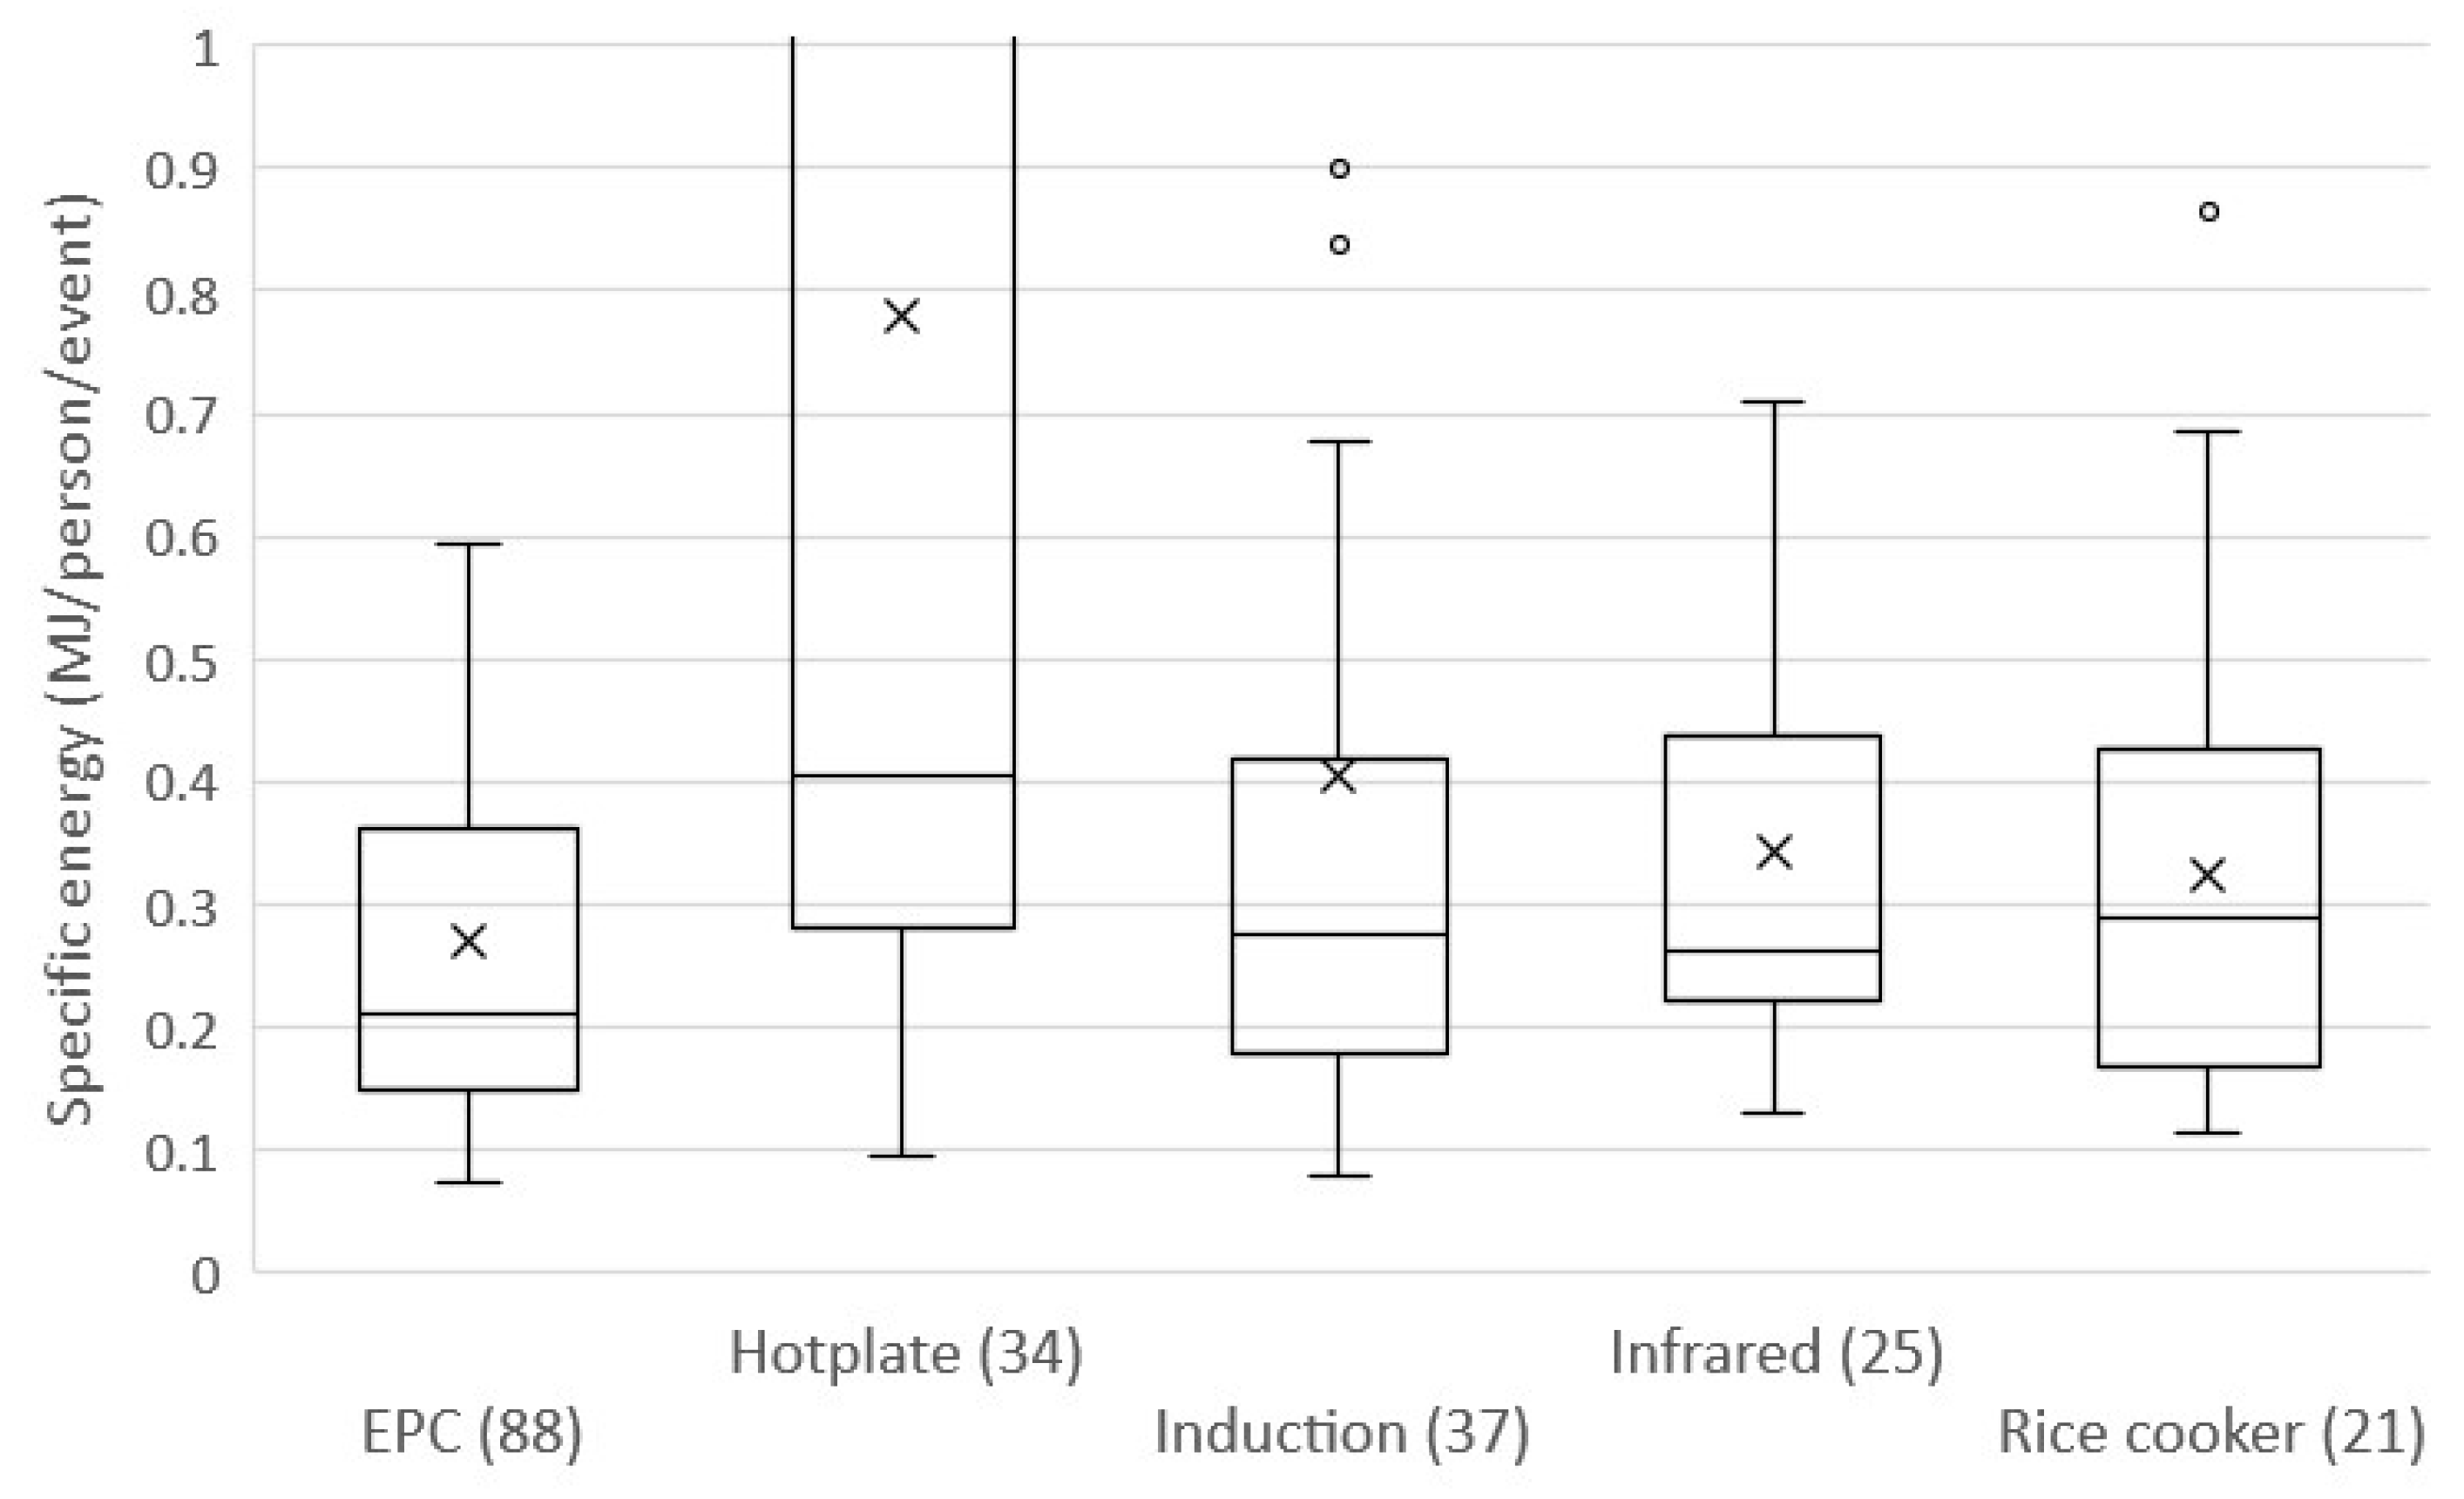
Figure 3.
Median specific energy consumption for main electric cooking devices (n >= 5).
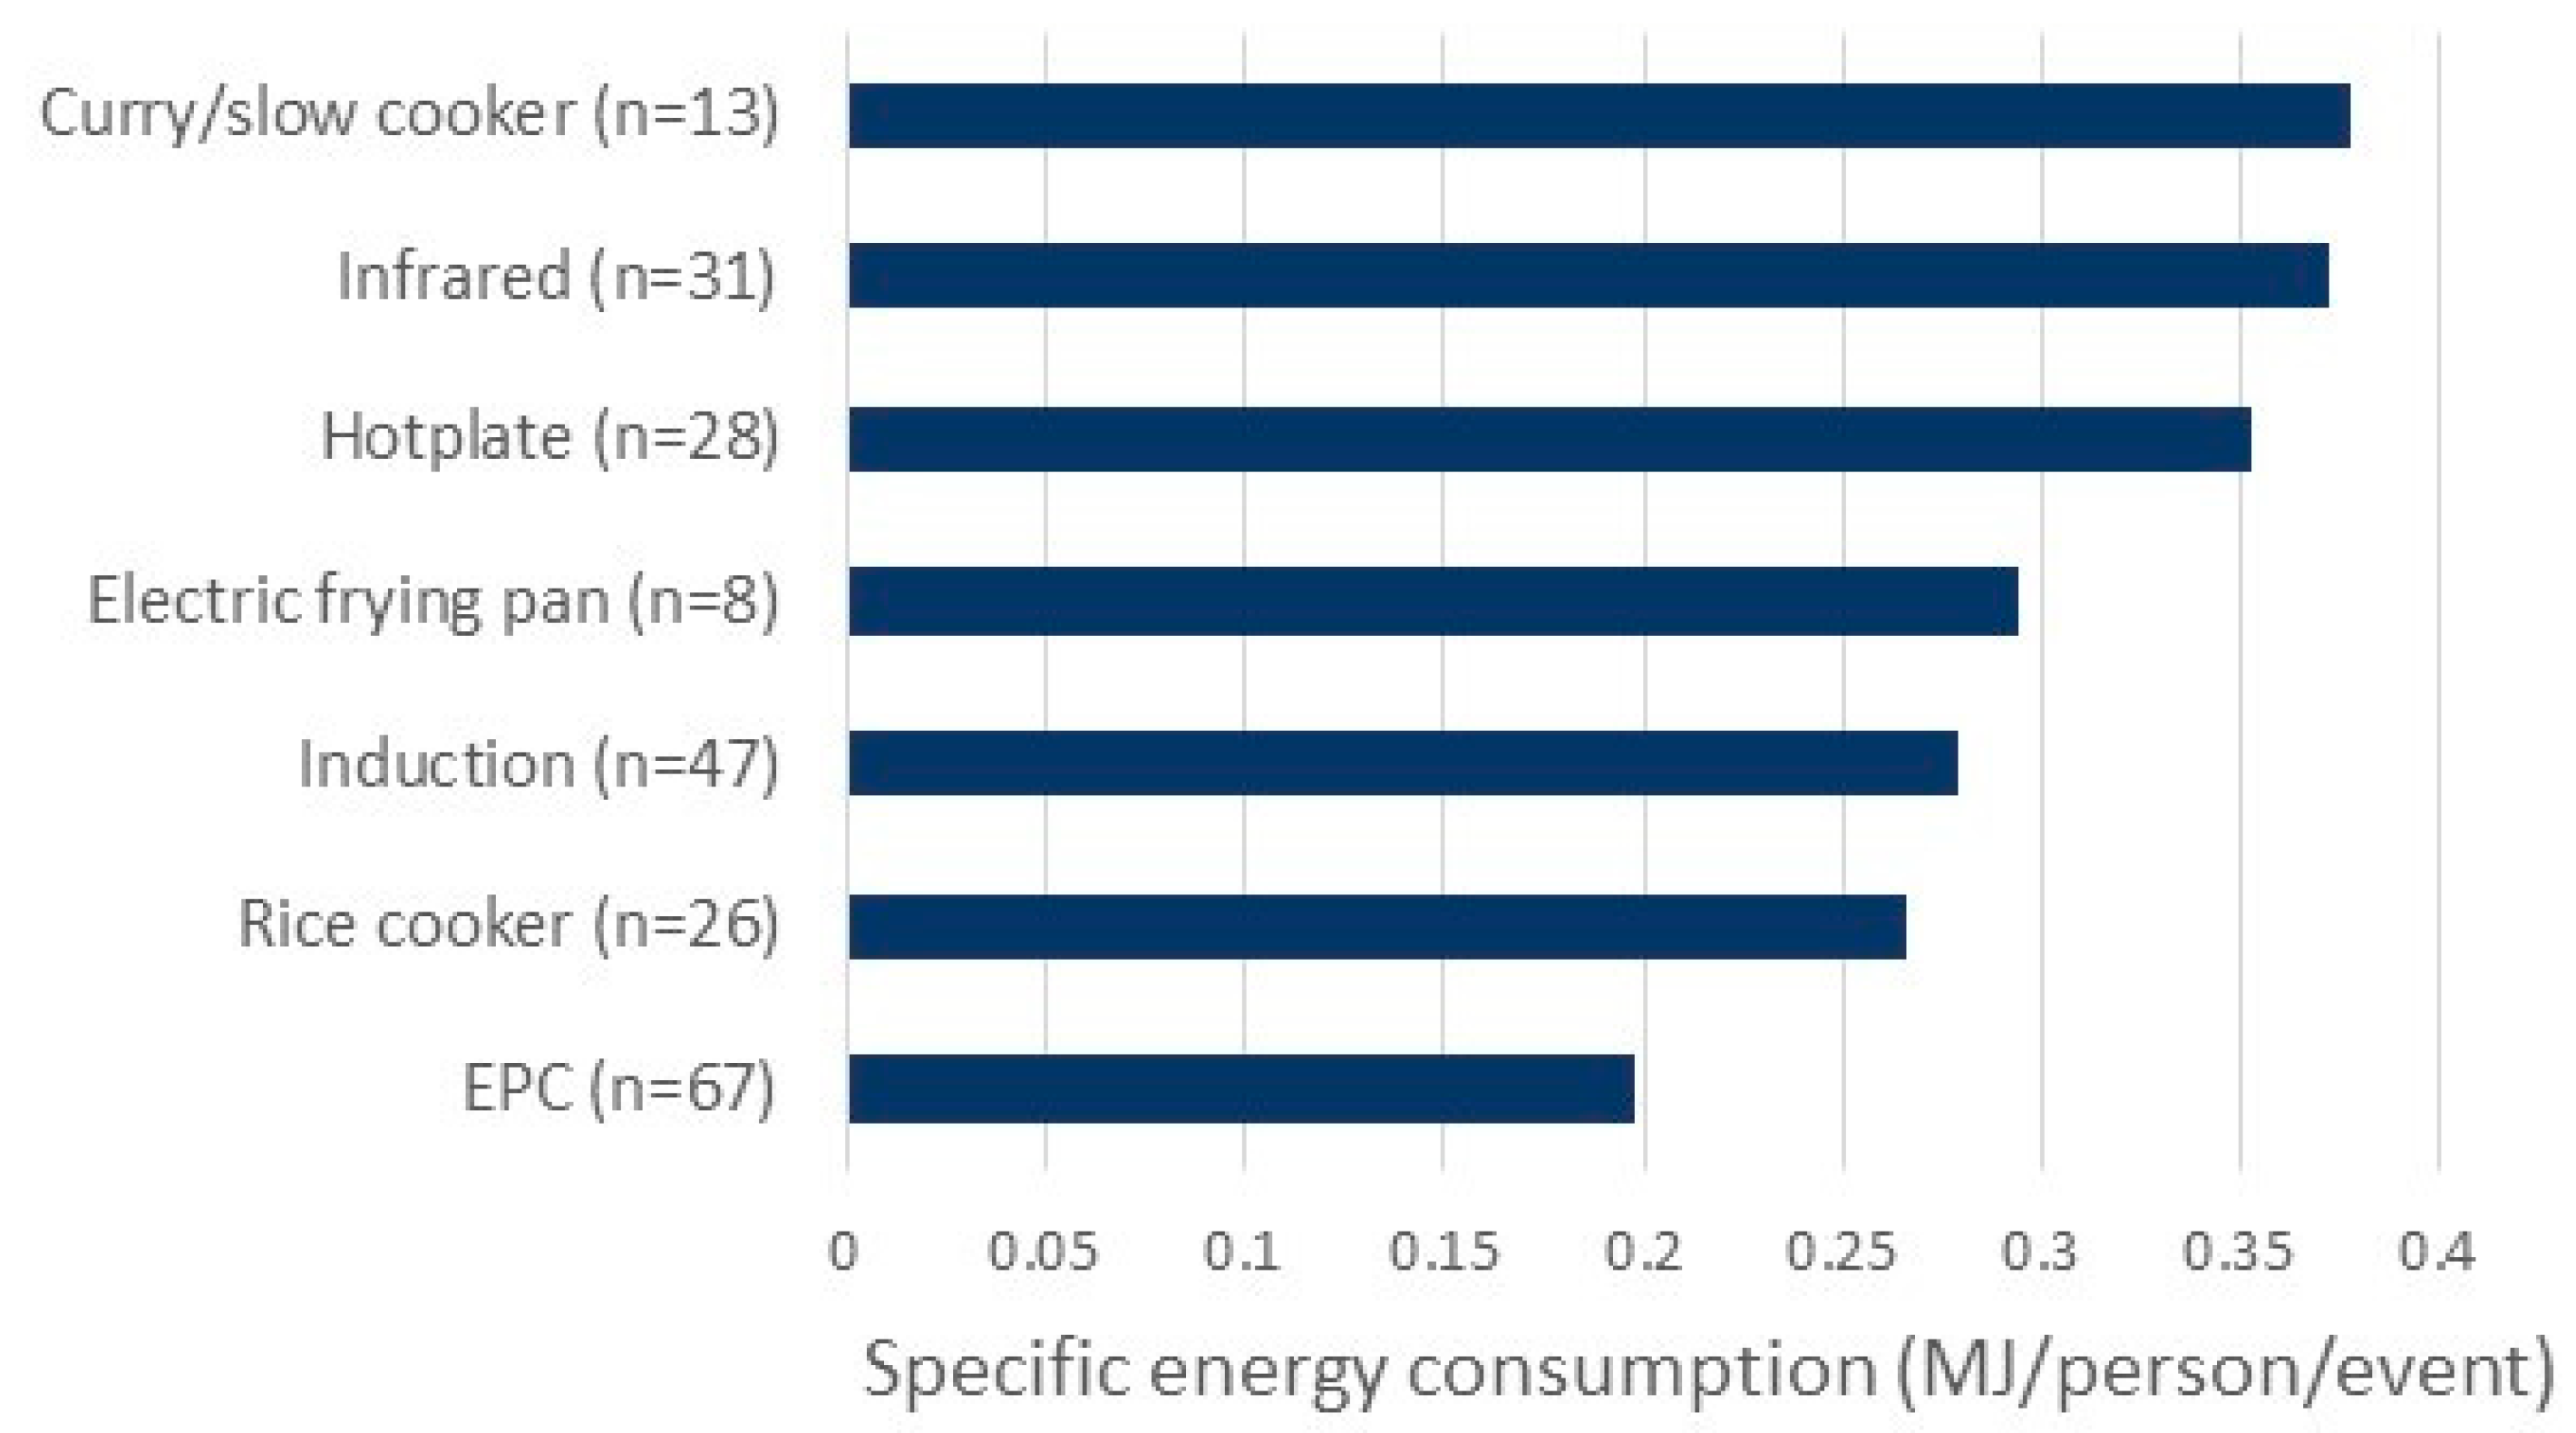
Figure 4.
Specific energy consumption - electric appliances by continent (single dishes only).
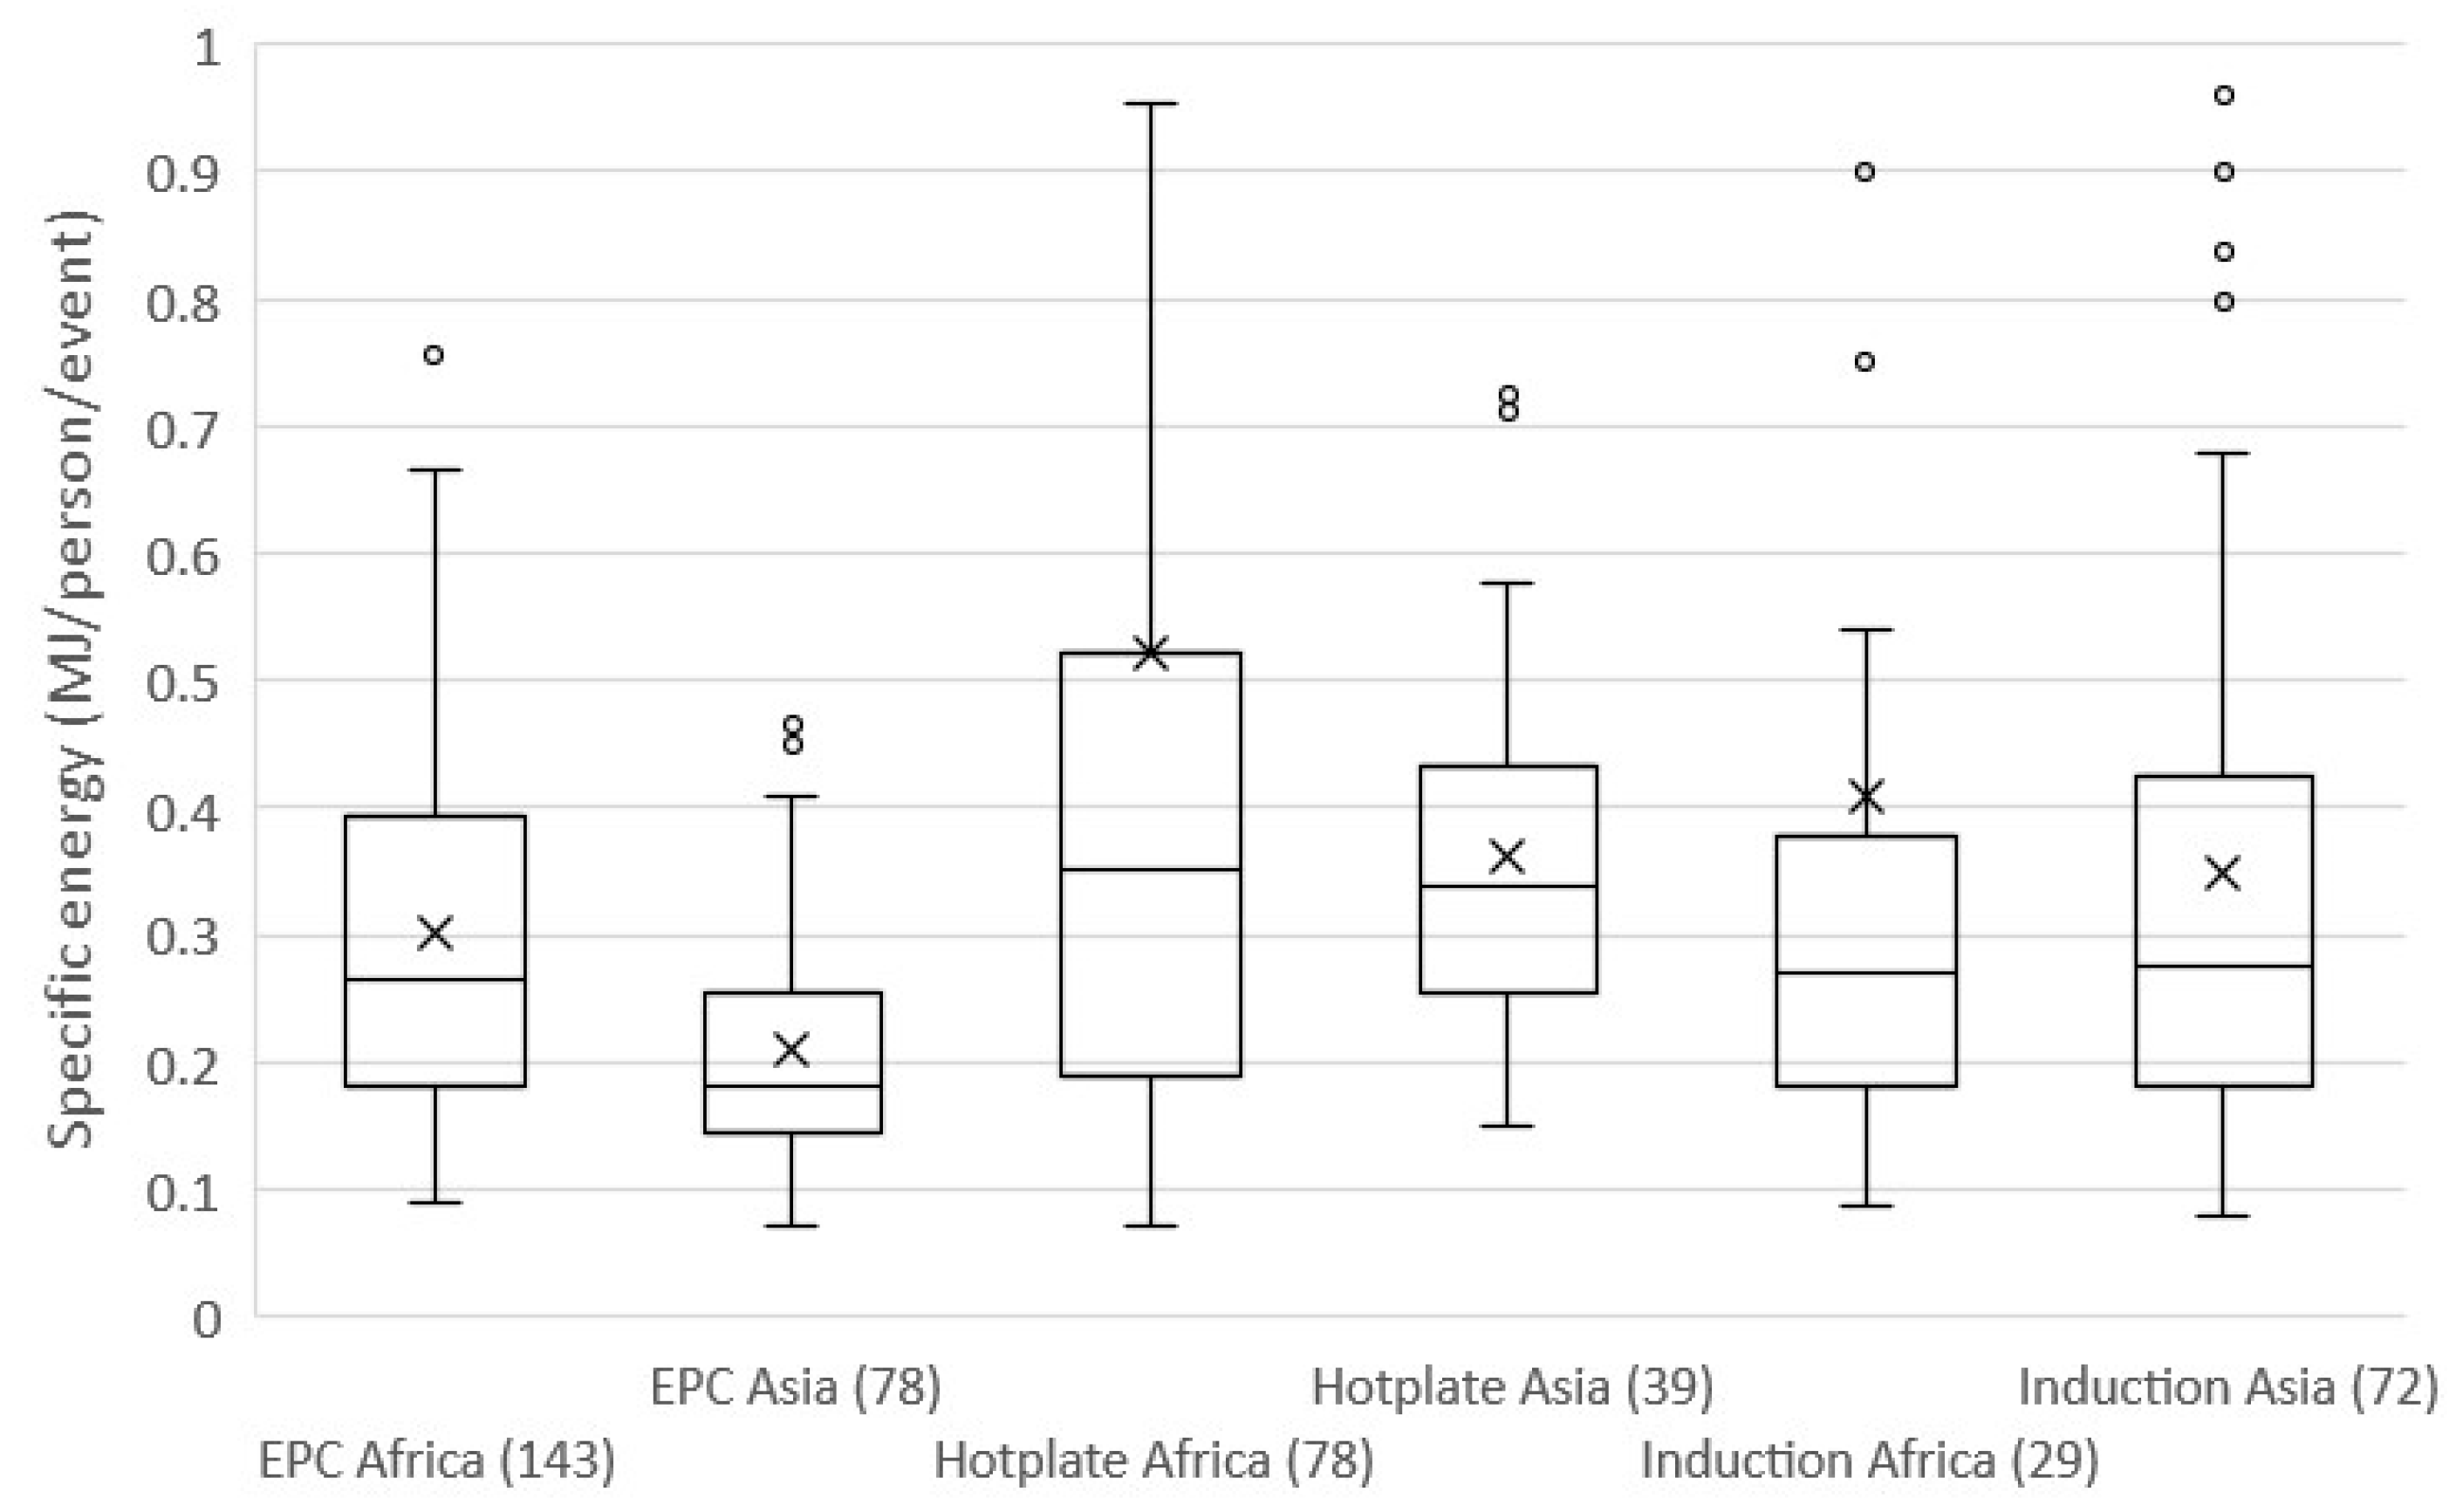
Figure 5.
Specific energy consumption – traditional fuels by continent (single dishes only).
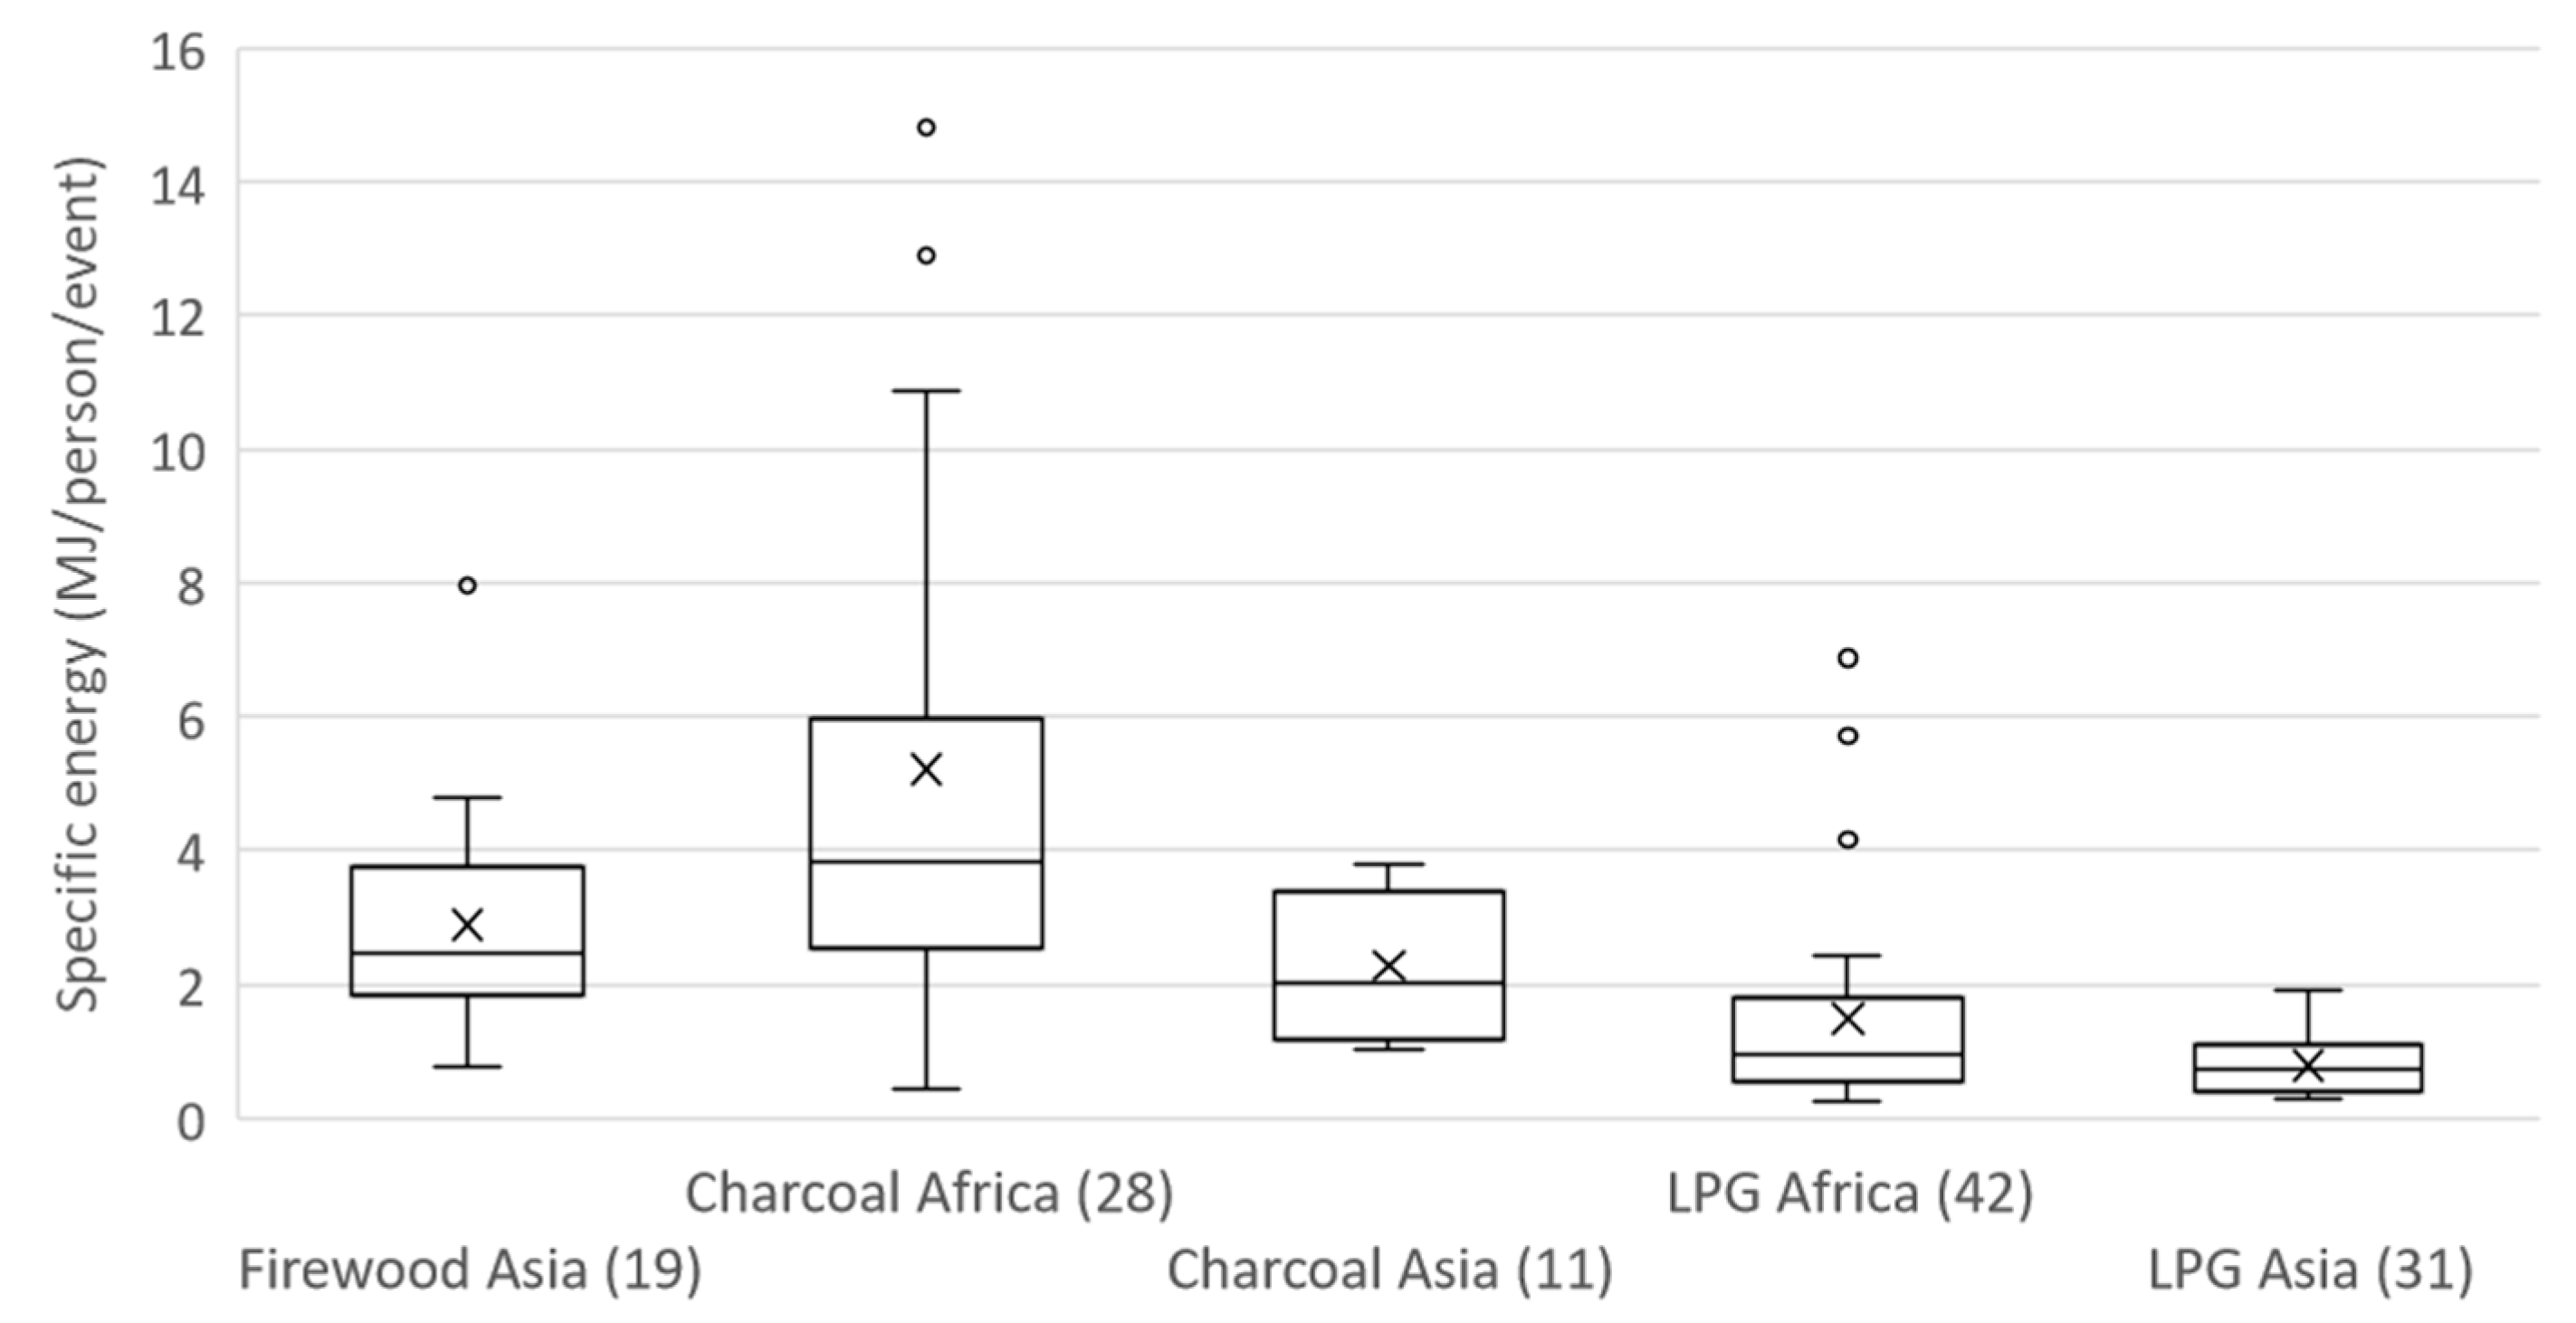
Figure 6.
Per capita cost of cooking using different fuels (controlled tests, single dishes only).
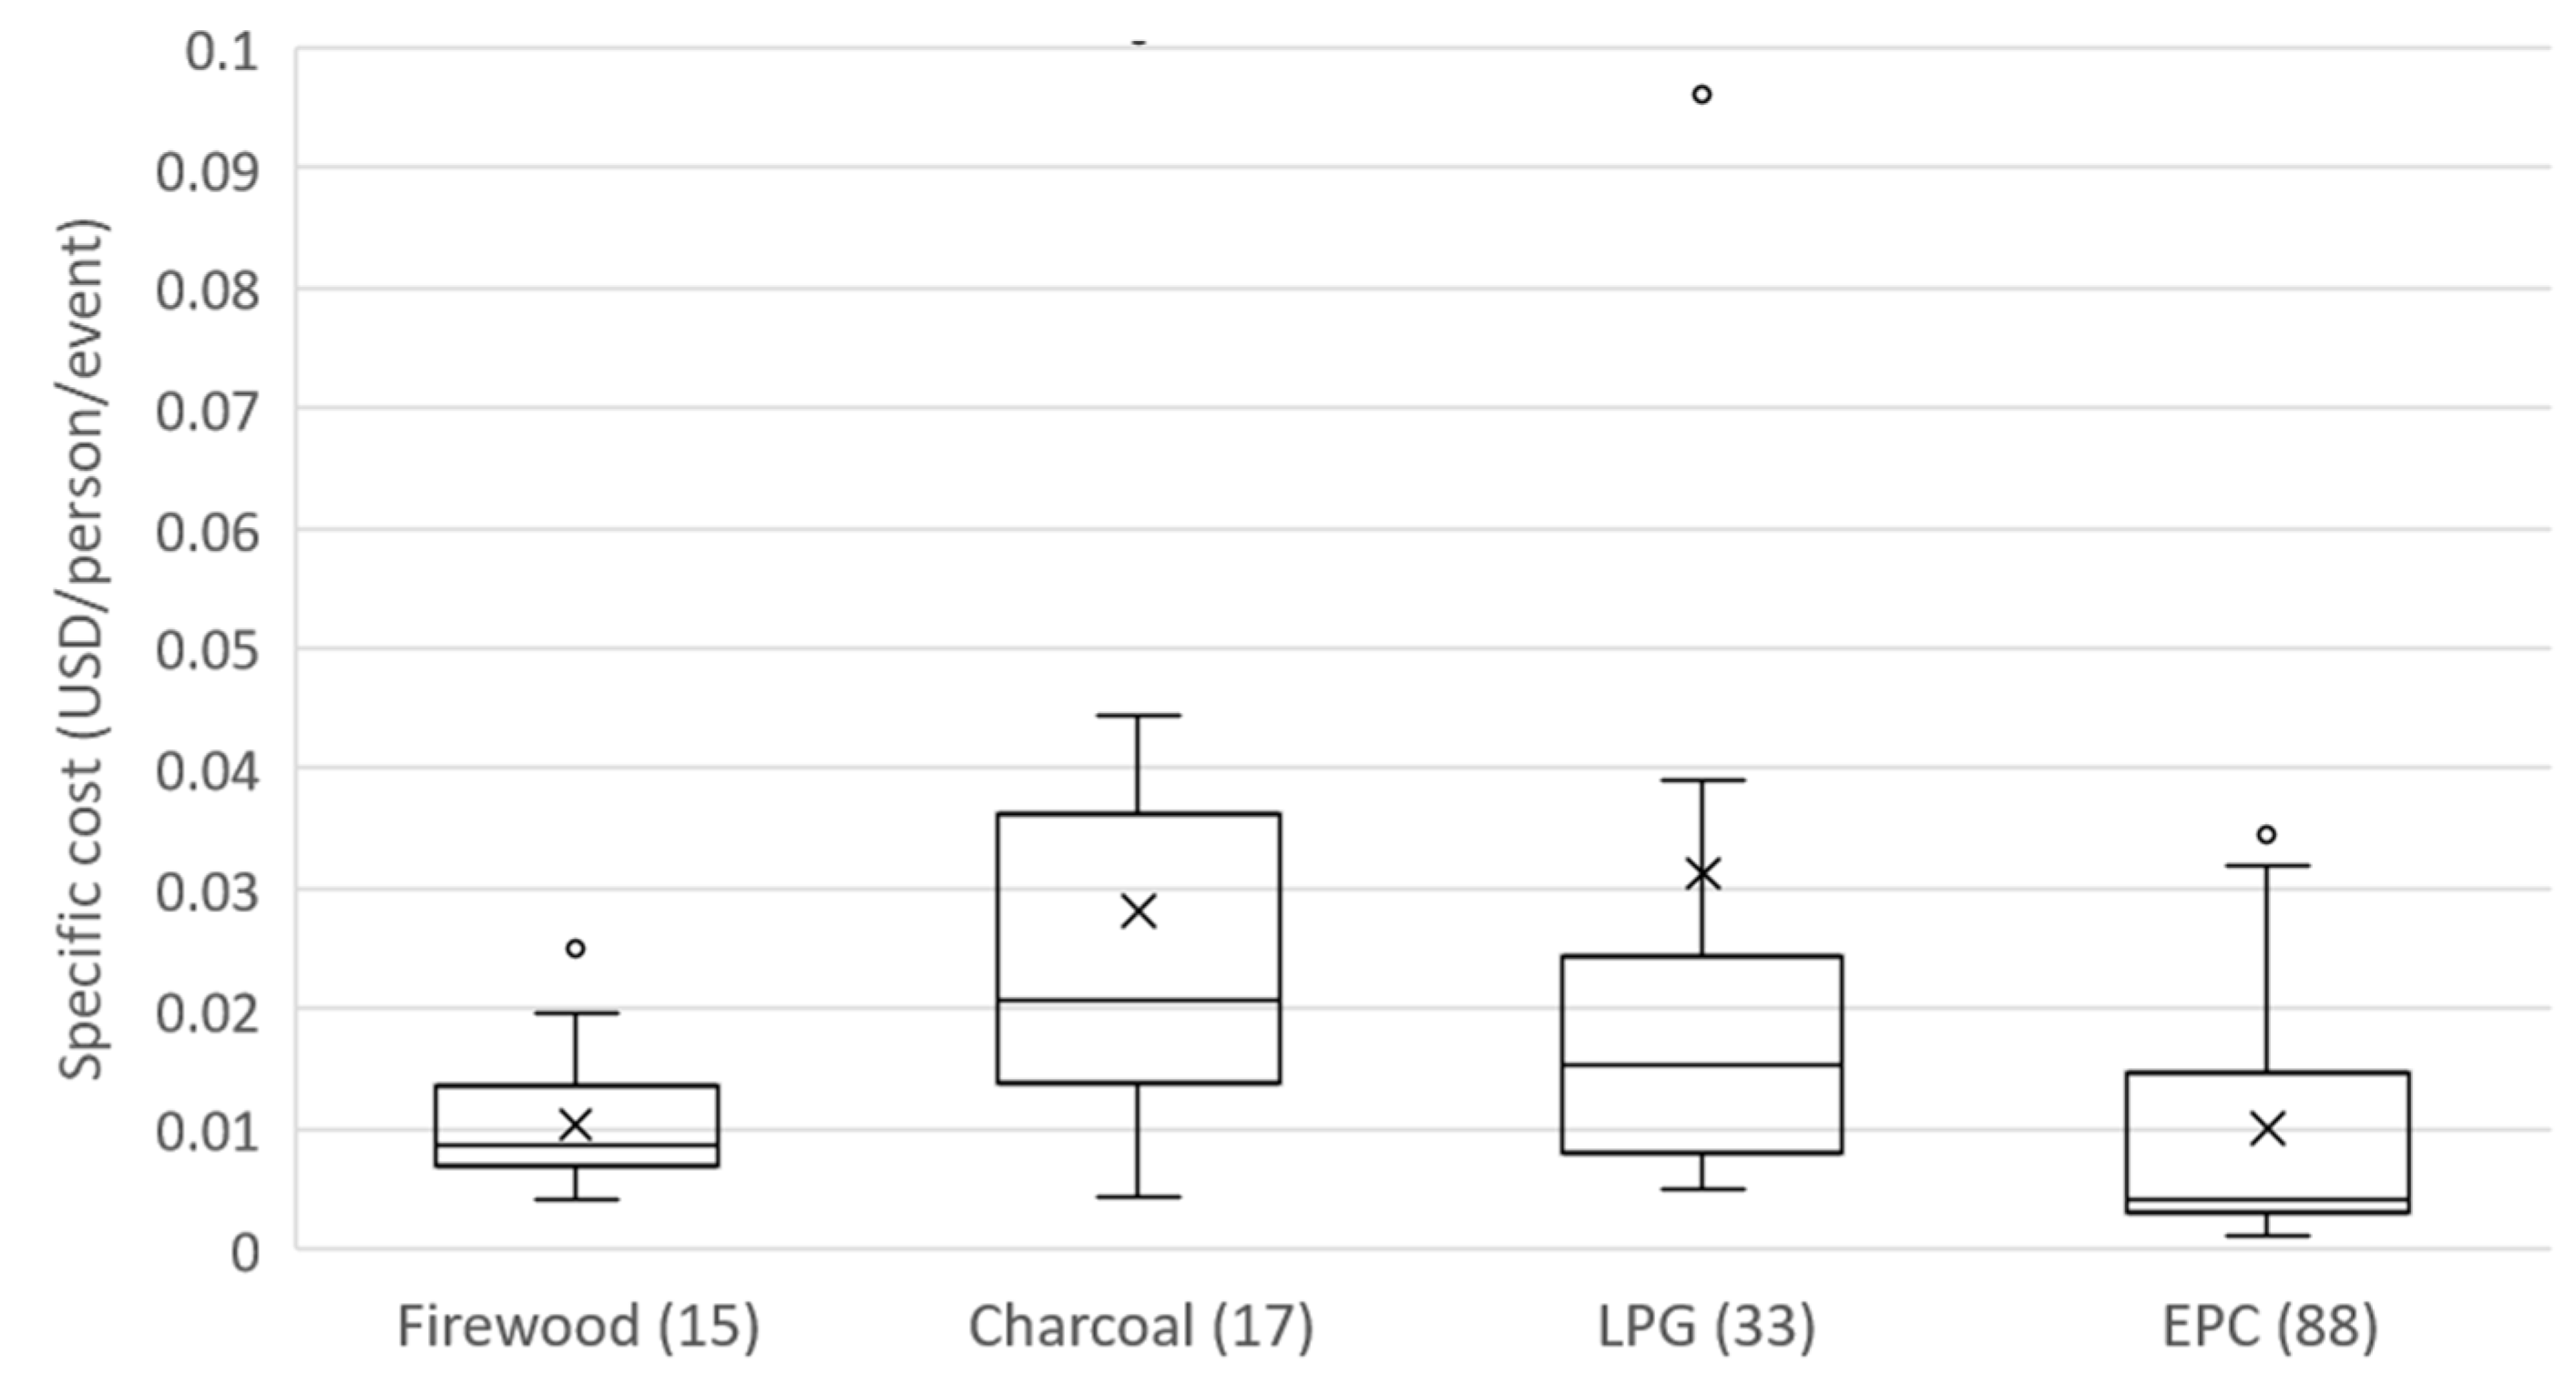
Table 2.
electric cooking devices tested (single dishes only) (Number of records).
| Source | Total | ||||
| Cooking Diaries | Controlled cooking tests | ||||
| Cooking Diaries | ECO Project | 100% eCook | |||
| EPC | 31 | 9 | 97 | 84 | 221 |
| Hotplate | 83 | 34 | 117 | ||
| Induction | 4 | 64 | 33 | 101 | |
| Infrared | 4 | 19 | 21 | 44 | |
| Rice cooker | 9 | 21 | 30 | ||
| Hotplate (local) | 20 | 20 | |||
| Kettle | 14 | 1 | 15 | ||
| Curry cooker | 9 | 9 | |||
| Electric frying pan | 8 | 8 | |||
| Slow cooker | 6 | 6 | |||
| Electric Grill/Griddle | 3 | 3 | |||
| Air fryer | 2 | 2 | |||
| Electric Jug | 1 | 1 | |||
| Roti maker | 1 | 1 | |||
| Thermopot | 1 | 1 | |||
| Water dispenser | 1 | 1 | |||
| Total | 31 | 17 | 314 | 218 | 580 |
Table 3.
Electric cooking devices tested in each country (single dishes) (number of records) (total n >= 5).
Table 3.
Electric cooking devices tested in each country (single dishes) (number of records) (total n >= 5).
| Bangladesh | Cambodia | Ethiopia | India | Kenya | Myanmar | Nepal | Rwanda | Tanzania | Uganda | Zambia | Total | |
| EPC | 8 | 10 | 13 | 27 | 23 | 8 | 25 | 10 | 40 | 46 | 11 | 221 |
| Hotplate | 27 | 5 | 50 | 12 | 7 | 6 | 5 | 5 | 117 | |||
| Induction | 23 | 2 | 8 | 39 | 5 | 7 | 17 | 101 | ||||
| Infrared | 10 | 8 | 18 | 6 | 2 | 44 | ||||||
| Hotplate (local) | 20 | 20 | ||||||||||
| Rice cooker | 13 | 1 | 19 | 8 | 1 | 6 | 1 | 30 | ||||
| Kettle | 2 | 4 | 1 | 1 | 1 | 3 | 3 | 15 | ||||
| Curry cooker | 9 | 9 | ||||||||||
| Frying pan | 8 | 8 | ||||||||||
| Slow cooker | 6 | 6 | ||||||||||
| Total | 92 | 20 | 103 | 29 | 35 | 54 | 84 | 16 | 57 | 63 | 37 | 571 |
Table 4.
Specific energy consumption to cook single dishes in different devices (MJ/person/event).
| DEVICE CATEGORY | Mean | Median | N | Std. Deviation |
| EPC | 0.27 | 0.24 | 221 | 0.17 |
| Hotplate | 0.46 | 0.34 | 117 | 0.45 |
| Induction | 0.37 | 0.27 | 101 | 0.32 |
| Infrared | 0.38 | 0.38 | 44 | 0.17 |
| Rice cooker | 0.34 | 0.30 | 30 | 0.18 |
| Hotplate (local) | 0.28 | 0.24 | 20 | 0.17 |
| Kettle | 0.22 | 0.18 | 15 | 0.20 |
| Curry cooker | 0.24 | 0.26 | 9 | 0.08 |
| Electric frying pan | 0.30 | 0.29 | 8 | 0.17 |
| Slow cooker | 0.66 | 0.58 | 6 | 0.24 |
Table 5.
Dishes cooked in different devices (dishes commonly cooked in multiple devices) (number of records).
Table 5.
Dishes cooked in different devices (dishes commonly cooked in multiple devices) (number of records).
| Curry cooker | Frying pan | EPC | Hotplate | Induction | Infrared | Rice cooker | Slow cooker | Total | |
| Bean Soup | 1 | 1 | 1 | 1 | 1 | 1 | 1 | 7 | |
| Beans | 8 | 3 | 1 | 1 | 13 | ||||
| Beef | 2 | 2 | 1 | 5 | |||||
| Beef curry | 1 | 1 | 1 | 1 | 1 | 1 | 6 | ||
| chicken | 1 | 1 | 3 | 2 | 7 | ||||
| Chicken Bechalor Soup | 1 | 1 | 1 | 1 | 1 | 1 | 6 | ||
| Chicken curry | 1 | 2 | 1 | 2 | 1 | 1 | 8 | ||
| Chicken stew | 4 | 1 | 5 | ||||||
| Chickpea dal | 1 | 1 | 1 | 1 | 1 | 1 | 6 | ||
| Dal | 1 | 3 | 1 | 3 | 3 | 1 | 12 | ||
| Eggs | 4 | 1 | 3 | 3 | 11 | ||||
| Fish curry | 1 | 1 | 1 | 1 | 1 | 1 | 6 | ||
| Green tea | 1 | 1 | 1 | 1 | 1 | 1 | 1 | 7 | |
| Leafy Soup | 1 | 1 | 1 | 1 | 1 | 1 | 1 | 7 | |
| meat | 3 | 1 | 4 | 2 | 10 | ||||
| Mixed vegetables | 1 | 1 | 1 | 1 | 1 | 1 | 6 | ||
| Mohinga | 1 | 1 | 1 | 1 | 1 | 1 | 1 | 7 | |
| Noodles | 1 | 1 | 2 | 1 | 1 | 6 | |||
| Porridge | 6 | 3 | 2 | 11 | |||||
| Rice | 1 | 17 | 4 | 8 | 5 | 9 | 1 | 45 | |
| Sauteed Vegetables | 1 | 1 | 1 | 1 | 1 | 1 | 6 | ||
| Tea/coffee/cocoa | 2 | 1 | 2 | 5 | |||||
| Tempura | 1 | 1 | 1 | 1 | 1 | 5 | |||
| Ugali | 4 | 2 | 1 | 1 | 8 | ||||
| Vegetables | 1 | 2 | 2 | 5 | |||||
| Total | 7 | 8 | 65 | 28 | 45 | 31 | 25 | 6 | 220 |
* includes devices where n >= 5 (when cooking these dishes).
Table 6.
Specific energy consumption to cook dishes commonly cooked across multiple devices (MJ/person/event)*.
Table 6.
Specific energy consumption to cook dishes commonly cooked across multiple devices (MJ/person/event)*.
| Electric cooking device | Mean | Median | N | Std. Deviation |
| Curry/slow cooker | 0.452 | 0.378 | 13 | 0.259 |
| Electric frying pan | 0.304 | 0.294 | 8 | 0.168 |
| EPC | 0.234 | 0.198 | 67 | 0.118 |
| Hotplate | 0.375 | 0.353 | 28 | 0.150 |
| Induction | 0.395 | 0.279 | 47 | 0.370 |
| Infrared | 0.378 | 0.372 | 31 | 0.175 |
| Rice cooker | 0.295 | 0.266 | 26 | 0.140 |
| Total | 220 |
* devices where n >= 5.
Table 8.
Specific energy consumption - electric appliances by continent (single dishes only).
| N | Median | ||
| MJ/person/event | kWh/person/event | ||
| Africa | |||
| EPC | 143 | 0.264 | 0.073 |
| Hotplate | 78 | 0.352 | 0.098 |
| Induction | 29 | 0.270 | 0.075 |
| Infrared | 8 | 0.381 | 0.106 |
| Asia | |||
| EPC | 78 | 0.180 | 0.050 |
| Hotplate | 39 | 0.339 | 0.094 |
| Induction | 72 | 0.277 | 0.077 |
| Infrared | 36 | 0.373 | 0.104 |
Table 9.
Energy ratios - traditional fuels / electric devices (single dishes).
| Africa | Asia | |||||
| Firewood | Charcoal | LPG | Firewood | Charcoal | LPG | |
| Energy consumption, median (MJ/person/event) | ||||||
| Traditional | 3.82 | 0.94 | 2.48 | 2.02 | 0.73 | |
| Electric devices | ||||||
| EPC | 0.26 | 0.18 | ||||
| Hotplate | 0.35 | 0.34 | ||||
| Induction | 0.27 | 0.28 | ||||
| Infrared | 0.38 | 0.37 | ||||
| Energy ratios (Traditional energy/eCook energy) | ||||||
| EPC | 14.5 | 3.6 | 13.8 | 11.2 | 4.1 | |
| Hotplate | 10.9 | 2.7 | 7.3 | 6.0 | 2.2 | |
| Induction | 14.1 | 3.5 | 9.0 | 7.3 | 2.6 | |
| Infrared | 10.0 | 2.5 | 6.7 | 5.4 | 2.0 | |
Disclaimer/Publisher’s Note: The statements, opinions and data contained in all publications are solely those of the individual author(s) and contributor(s) and not of MDPI and/or the editor(s). MDPI and/or the editor(s) disclaim responsibility for any injury to people or property resulting from any ideas, methods, instructions or products referred to in the content. |
© 2023 by the authors. Licensee MDPI, Basel, Switzerland. This article is an open access article distributed under the terms and conditions of the Creative Commons Attribution (CC BY) license (http://creativecommons.org/licenses/by/4.0/).
Copyright: This open access article is published under a Creative Commons CC BY 4.0 license, which permit the free download, distribution, and reuse, provided that the author and preprint are cited in any reuse.


