Submitted:
02 August 2023
Posted:
03 August 2023
You are already at the latest version
Abstract
Keywords:
1. Introduction
2. Materials and Methods
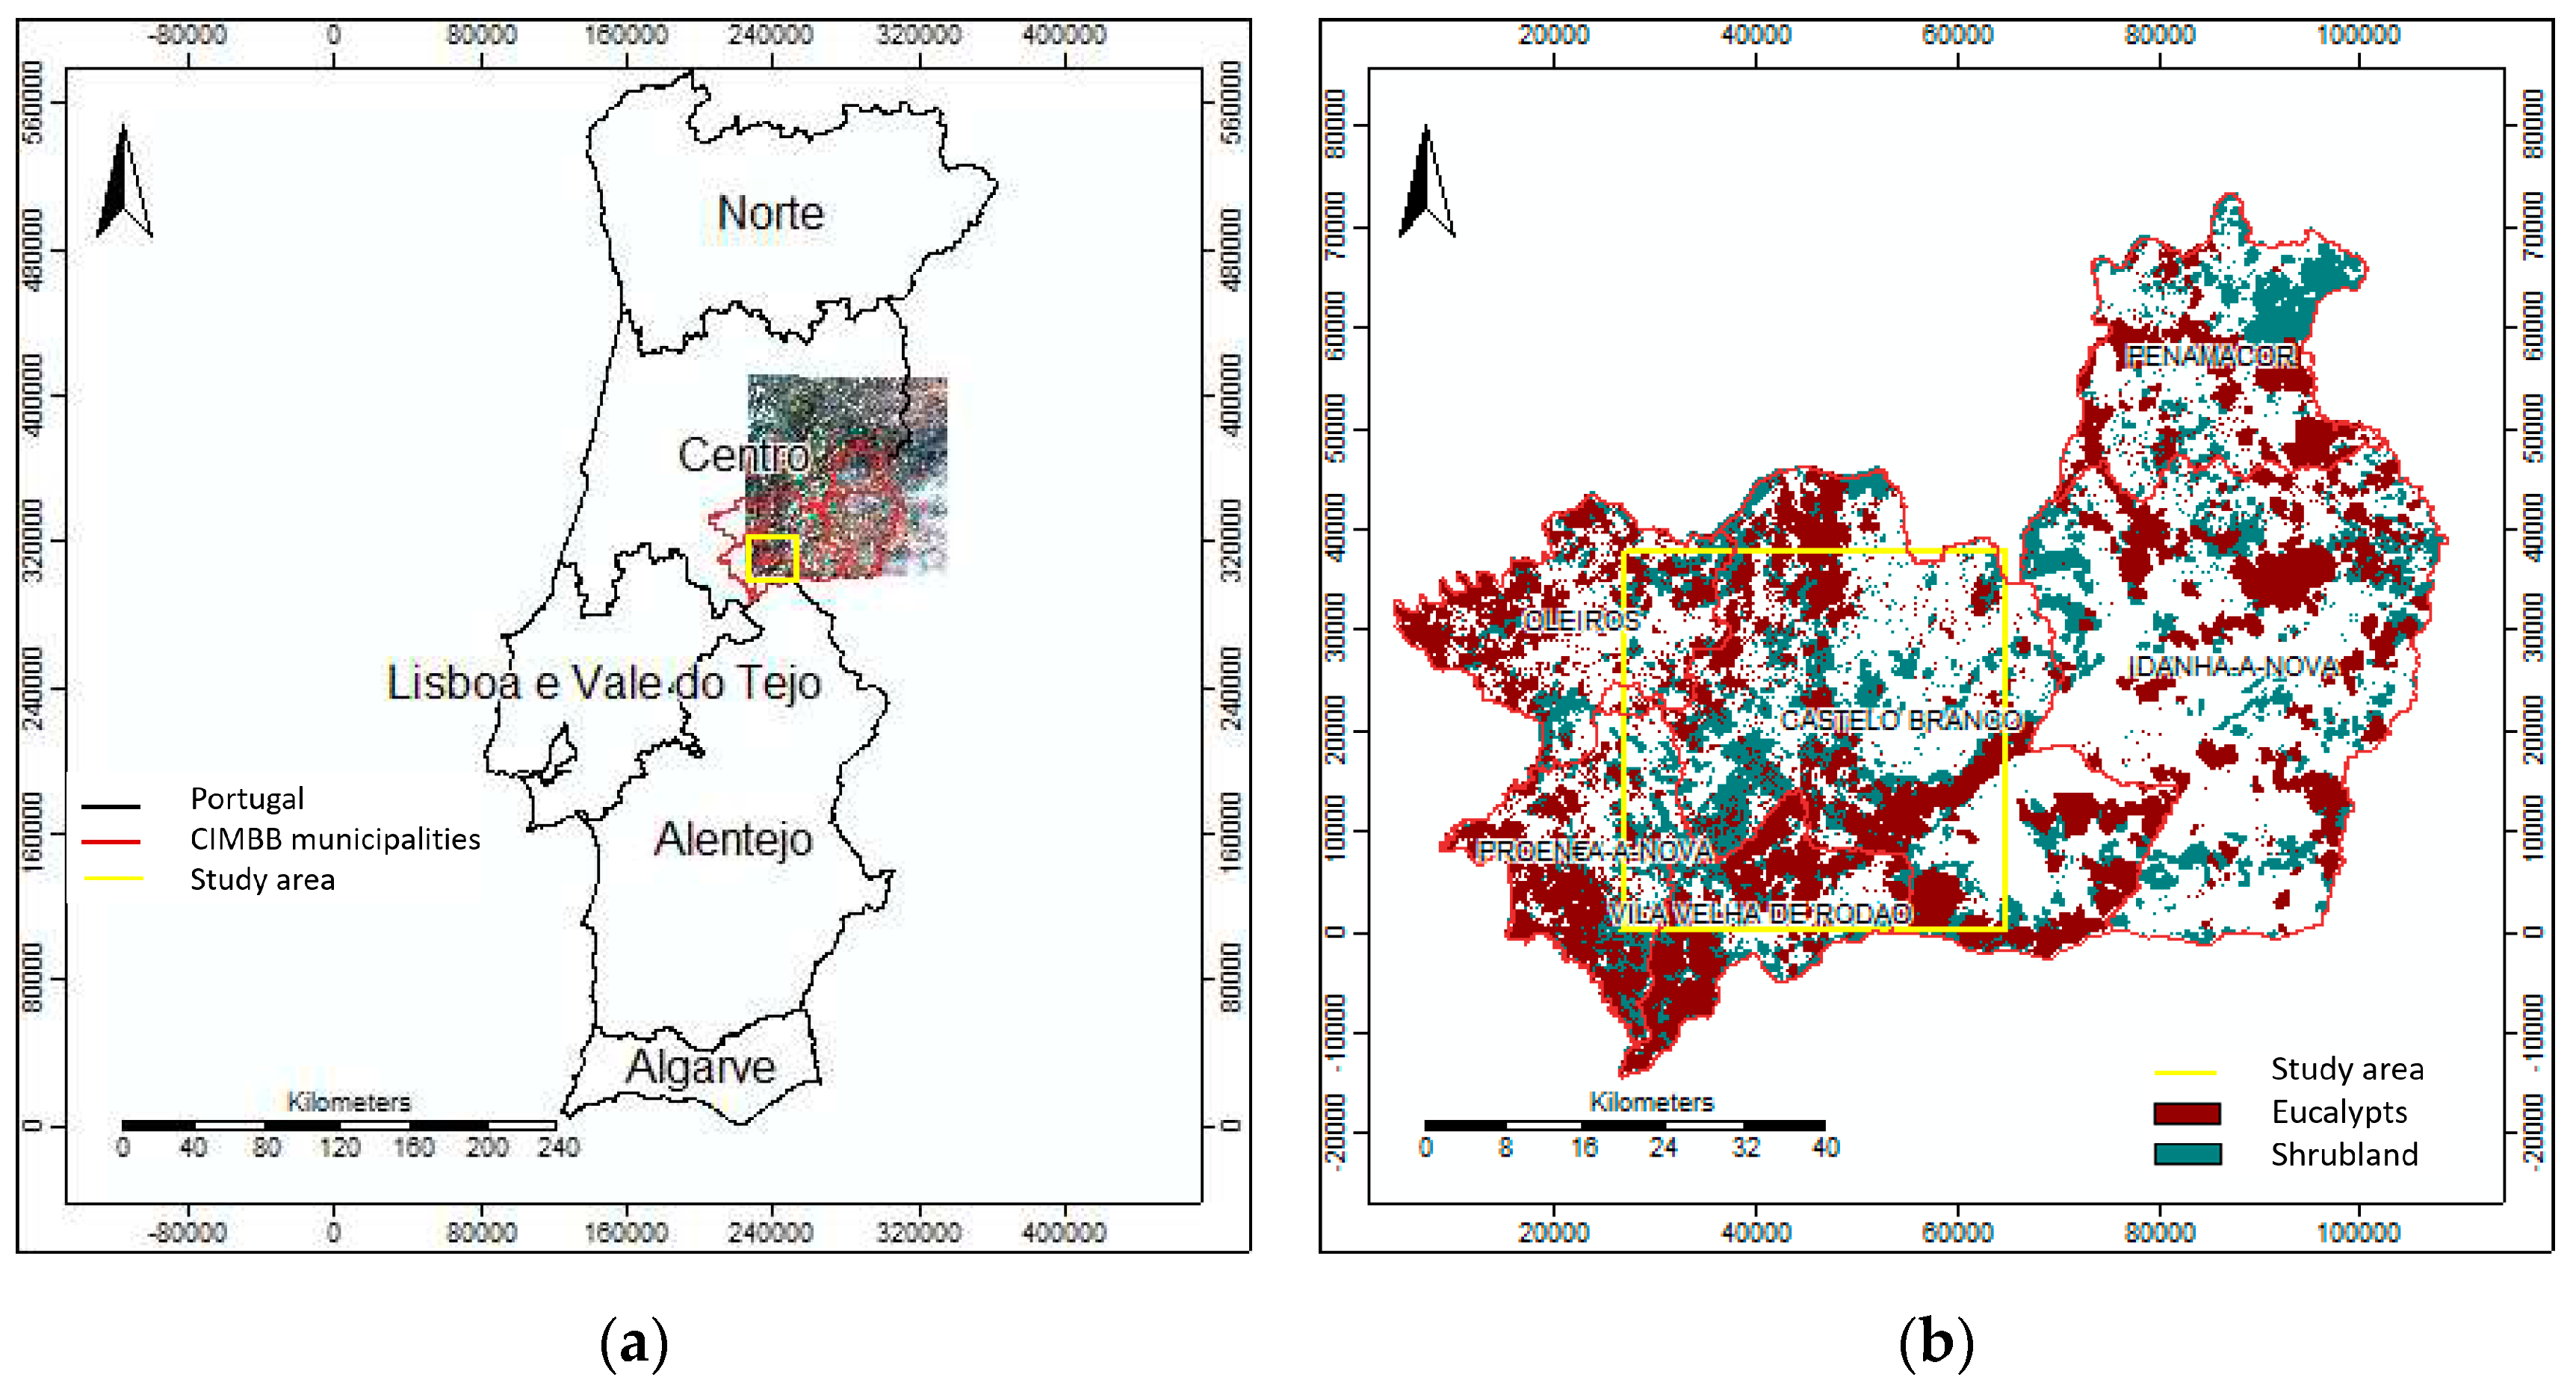
2.1. Study area
2.2. Data
2.2.1. Land Cover and Land Use data (COS 2018)
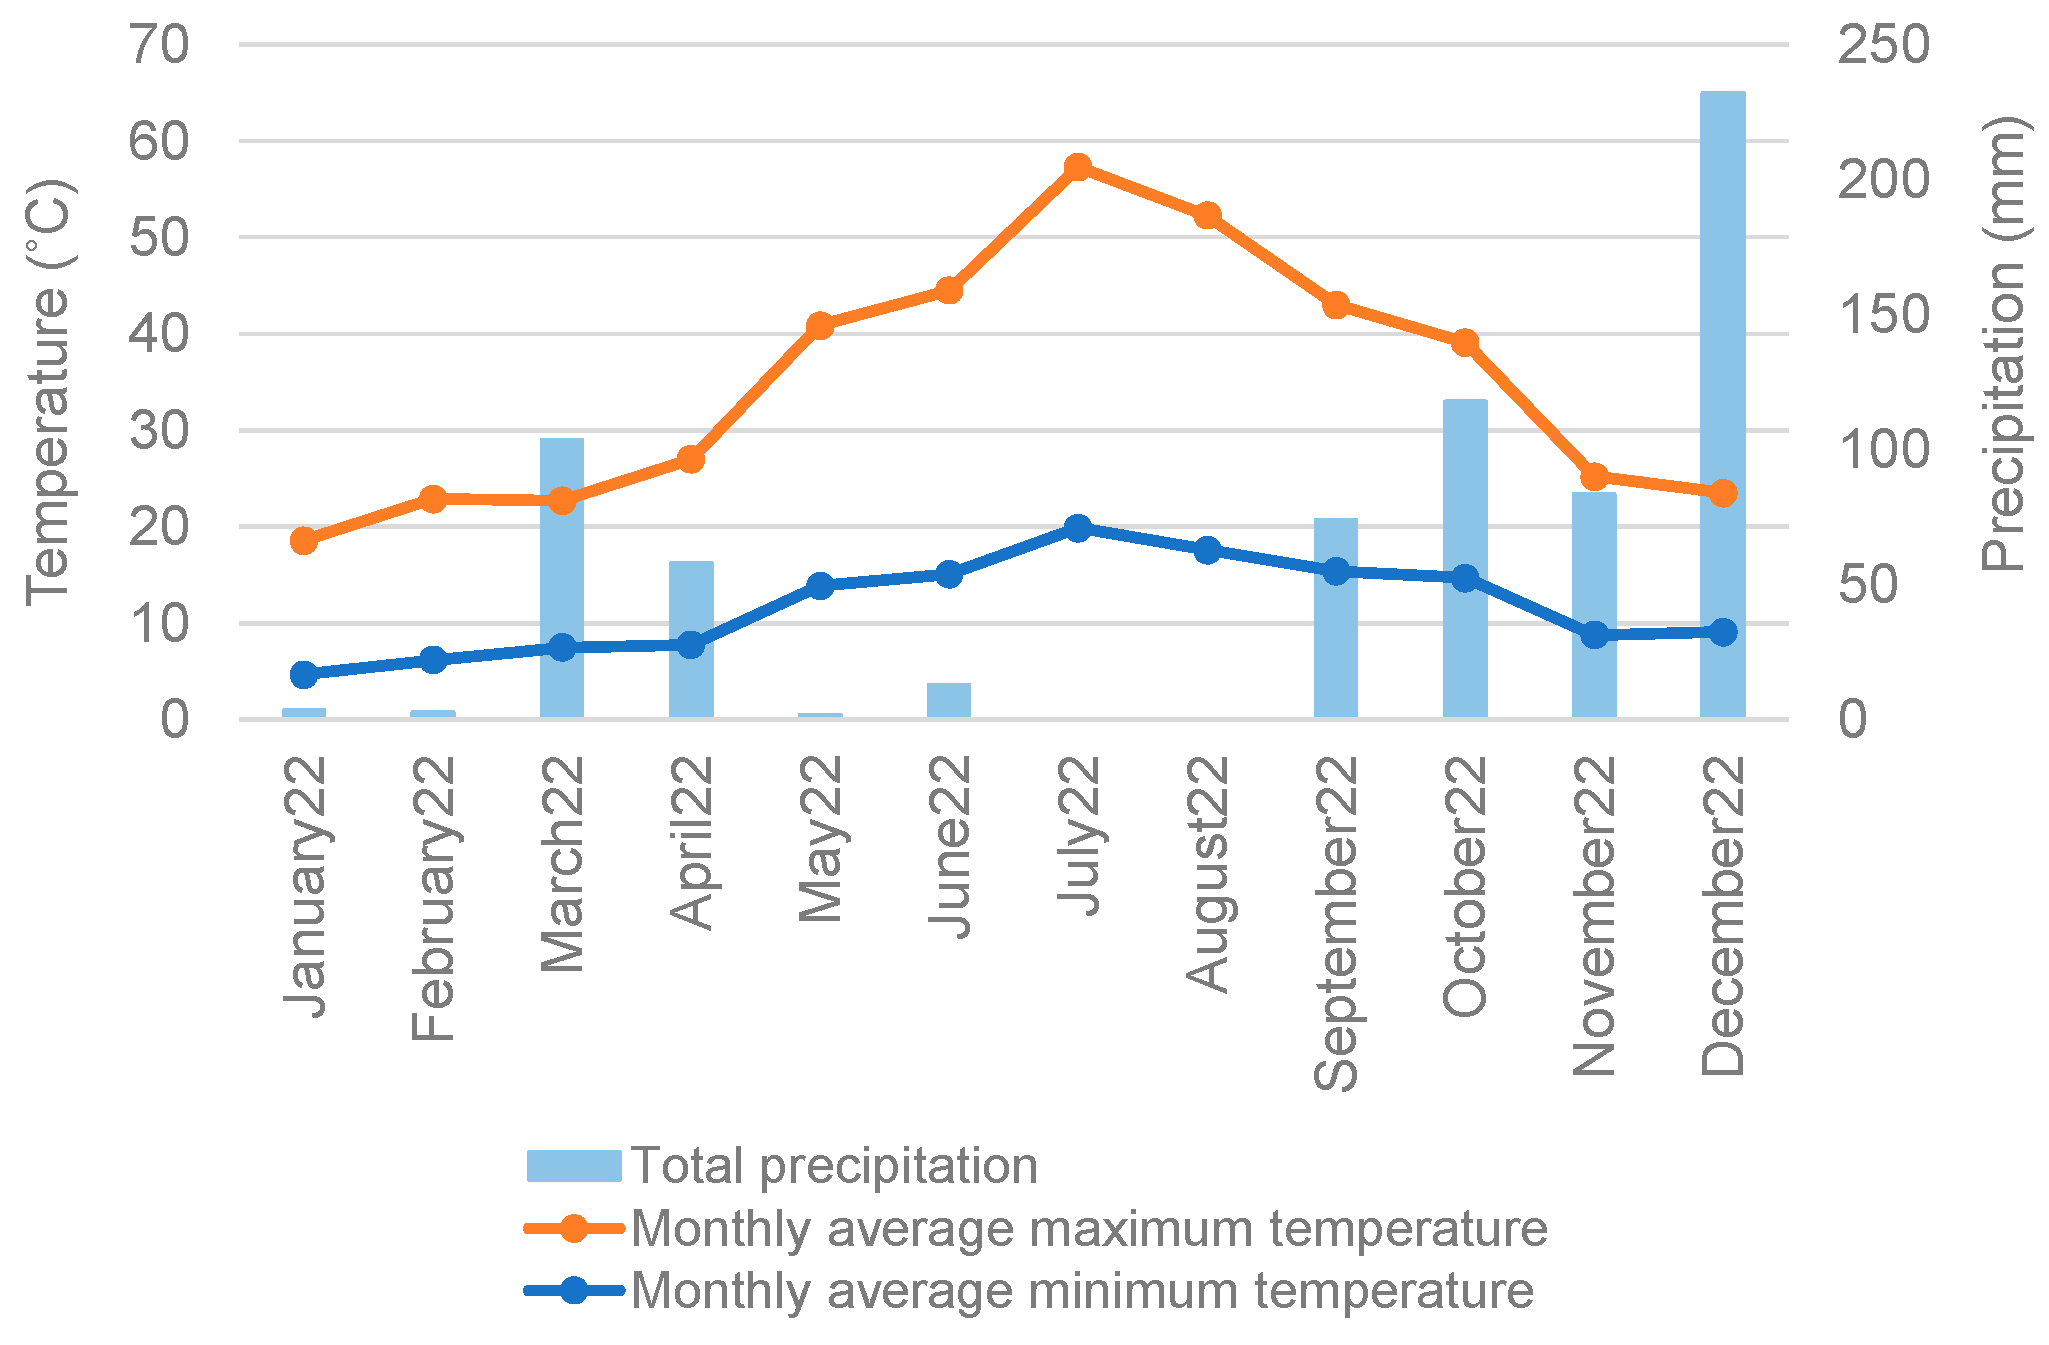
2.2.2. Climatological data—local station (2022)
2.2.3. Remote sensing data—Sentinel2A imagery
2.3. Methods
2.3.1. Sentinel2A imagery—vegetation index NDVI
2.3.2. Field sample plots—AGB
2.3.3. AGB maps production and validation
3. Results
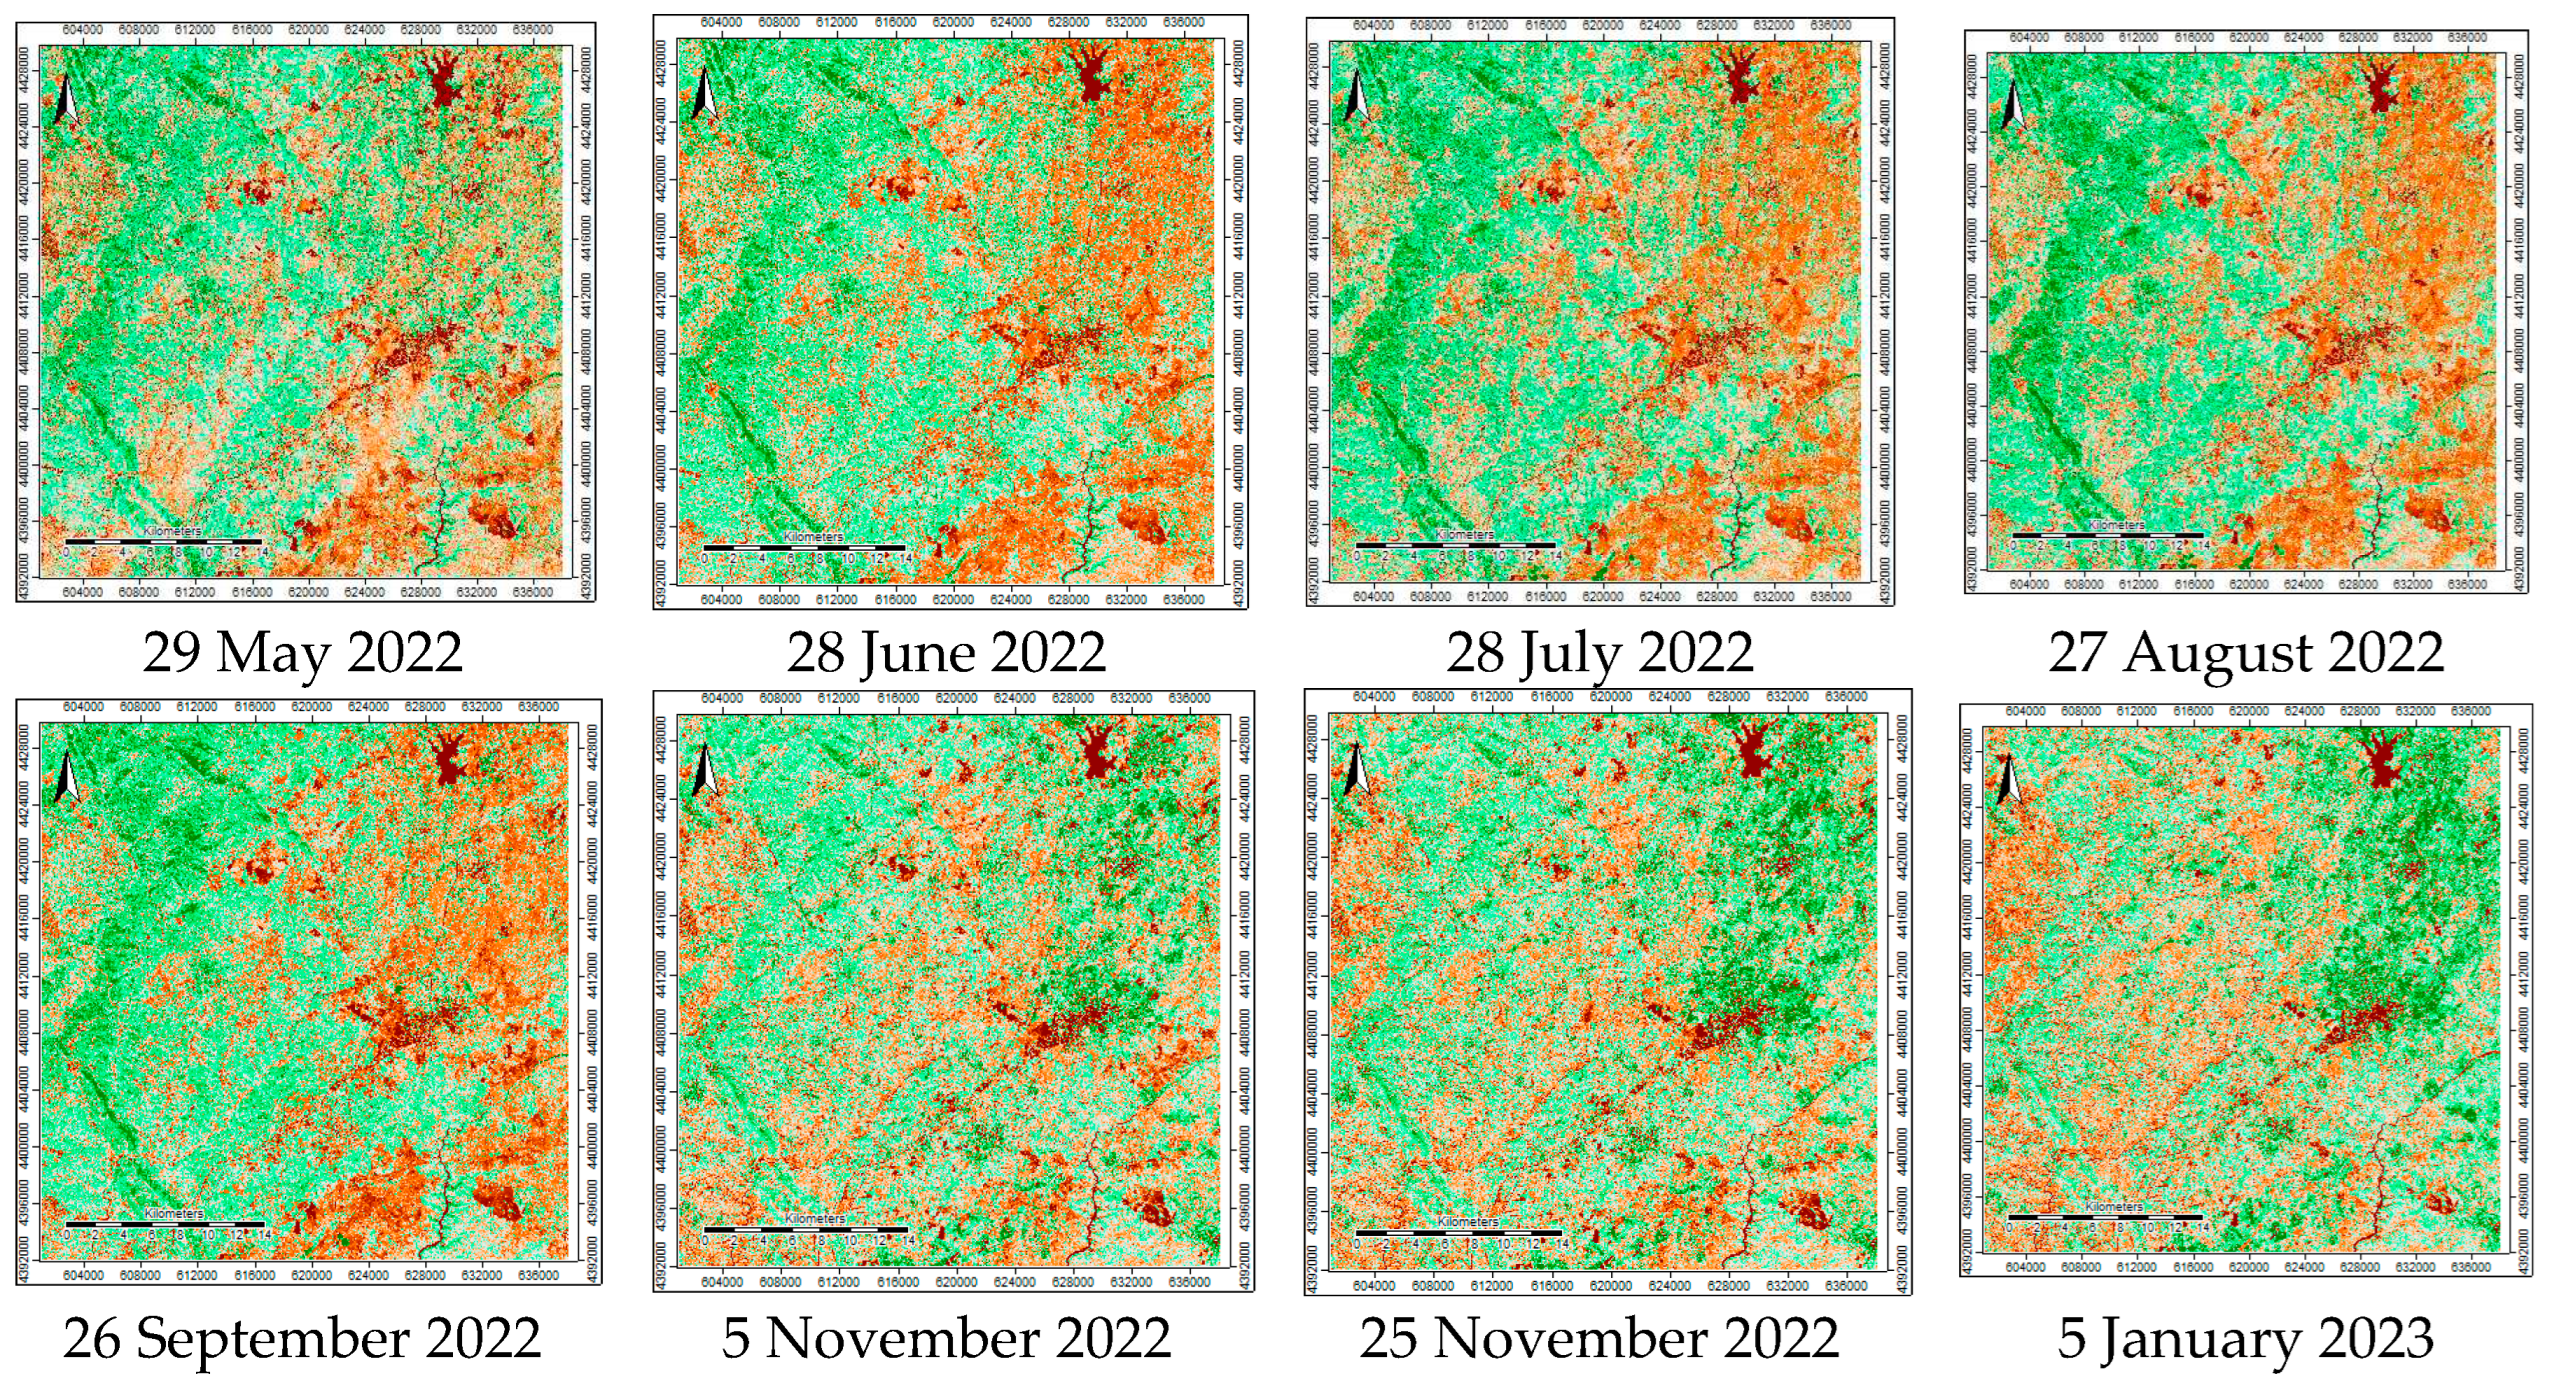
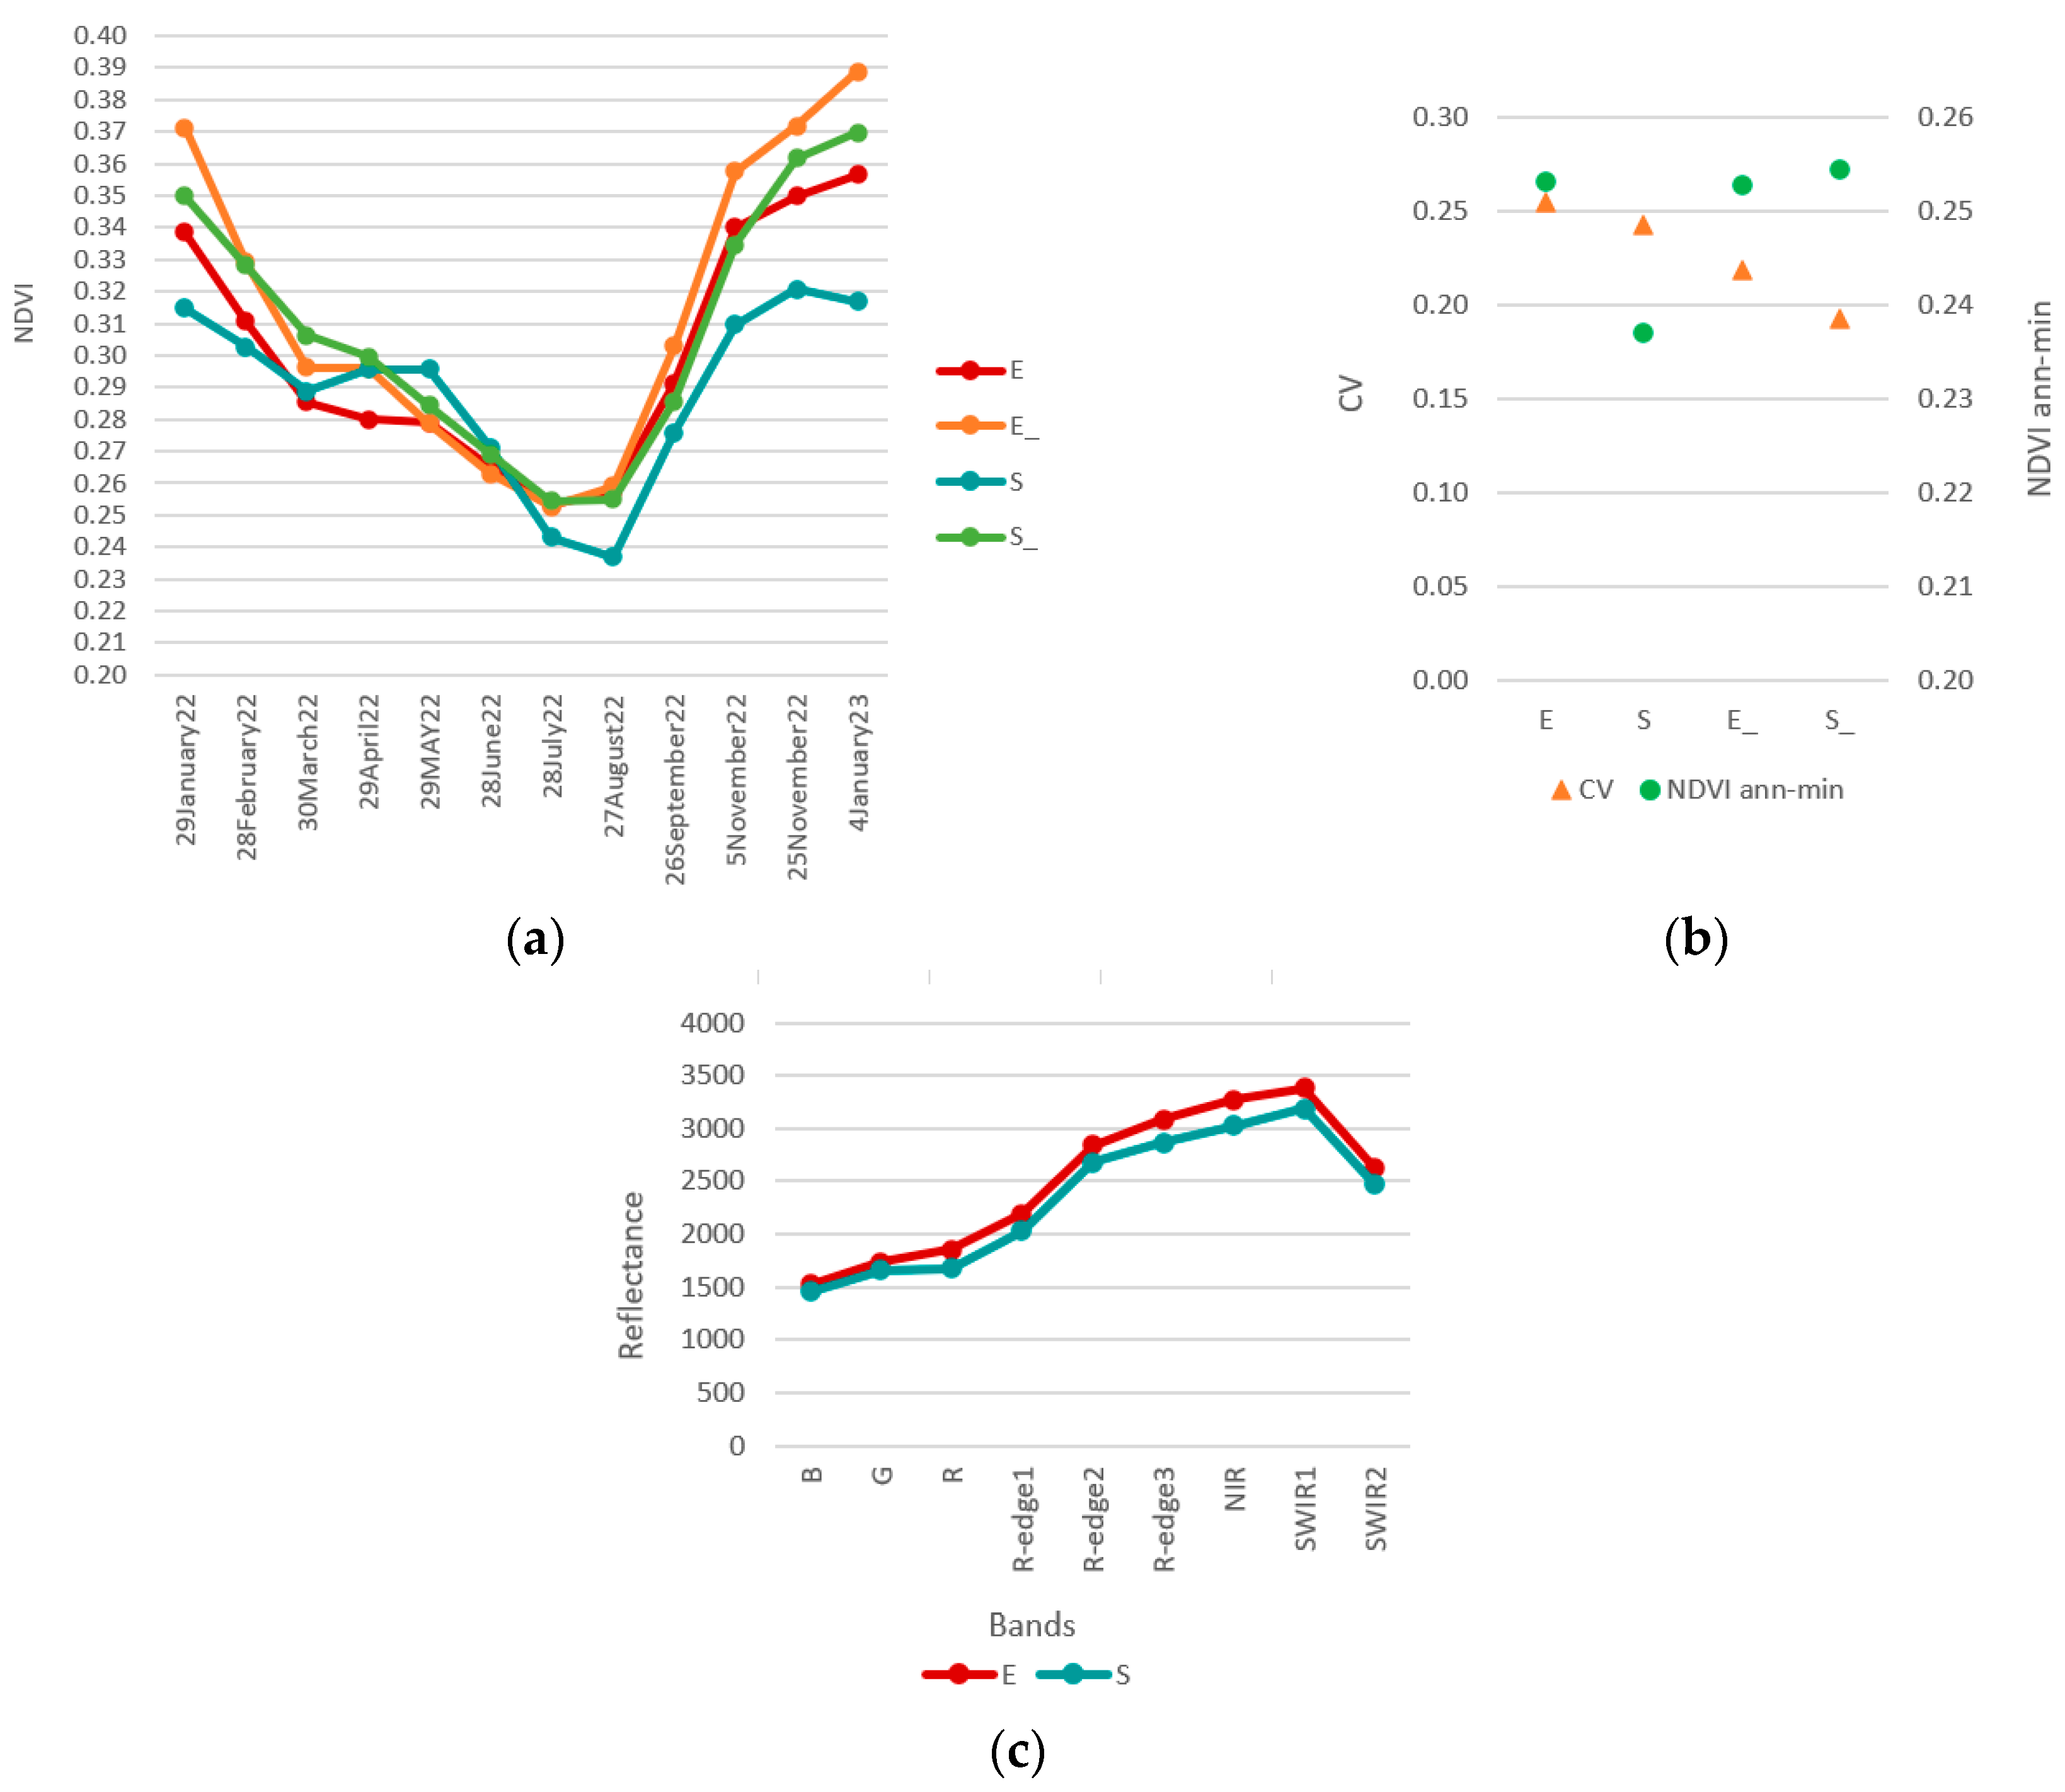
3.1. NDVI annual curve (2022)
| NDVI | Eucalypts areas (n = 197) | Shrubland areas (n = 227) | Eucalypts areas (n = 30) | Shrubland areas (n = 30) | |||||||||||||||
|---|---|---|---|---|---|---|---|---|---|---|---|---|---|---|---|---|---|---|---|
| Date | Min. | Max. | Mean | SD | Min. | Max. | Mean | SD | Min. | Max. | Mean | SD | Min. | Max. | Mean | SD | |||
| 29Jan22 | 0.098 | 0.517 | 0.339 | 0.082 | 0.131 | 0.488 | 0.315 | 0.065 | 0.186 | 0.507 | 0.371 | 0.067 | 0.253 | 0.442 | 0.350 | 0.052 | |||
| 28Feb22 | 0.072 | 0.459 | 0.311 | 0.077 | 0.103 | 0.479 | 0.303 | 0.061 | 0.090 | 0.435 | 0.329 | 0.075 | 0.230 | 0.412 | 0.328 | 0.045 | |||
| 30Mar22 | 0.069 | 0.433 | 0.285 | 0.062 | 0.066 | 0.425 | 0.289 | 0.053 | 0.033 | 0.403 | 0.296 | 0.074 | 0.207 | 0.366 | 0.306 | 0.036 | |||
| 29Apr22 | 0.086 | 0.478 | 0.280 | 0.059 | 0.116 | 0.440 | 0.296 | 0.051 | 0.197 | 0.443 | 0.296 | 0.057 | 0.213 | 0.385 | 0.299 | 0.040 | |||
| 29May22 | 0.061 | 0.531 | 0.279 | 0.079 | 0.103 | 0.546 | 0.296 | 0.080 | 0.158 | 0.408 | 0.279 | 0.061 | 0.172 | 0.409 | 0.284 | 0.061 | |||
| 28Jun22 | 0.061 | 0.478 | 0.265 | 0.075 | 0.091 | 0.500 | 0.271 | 0.080 | 0.141 | 0.372 | 0.263 | 0.060 | 0.119 | 0.372 | 0.269 | 0.066 | |||
| 28Jul22 | 0.043 | 0.446 | 0.253 | 0.079 | 0.063 | 0.492 | 0.243 | 0.082 | 0.115 | 0.391 | 0.253 | 0.068 | 0.103 | 0.364 | 0.254 | 0.070 | |||
| 27Aug22 | 0.062 | 0.447 | 0.257 | 0.075 | 0.075 | 0.476 | 0.237 | 0.074 | 0.133 | 0.383 | 0.259 | 0.064 | 0.114 | 0.364 | 0.255 | 0.067 | |||
| 26Sep22 | 0.066 | 0.467 | 0.291 | 0.082 | 0.071 | 0.491 | 0.276 | 0.080 | 0.148 | 0.417 | 0.303 | 0.072 | 0.120 | 0.390 | 0.286 | 0.077 | |||
| 5Nov22 | 0.082 | 0.495 | 0.340 | 0.083 | 0.128 | 0.482 | 0.310 | 0.068 | 0.151 | 0.455 | 0.358 | 0.079 | 0.214 | 0.424 | 0.335 | 0.066 | |||
| 25Nov22 | 0.097 | 0.511 | 0.350 | 0.077 | 0.133 | 0.479 | 0.321 | 0.067 | 0.170 | 0.508 | 0.372 | 0.073 | 0.262 | 0.482 | 0.362 | 0.059 | |||
| 4Jan23 | 0.100 | 0.521 | 0.357 | 0.079 | 0.134 | 0.516 | 0.317 | 0.069 | 0.260 | 0.529 | 0.389 | 0.060 | 0.285 | 0.481 | 0.370 | 0.054 | |||
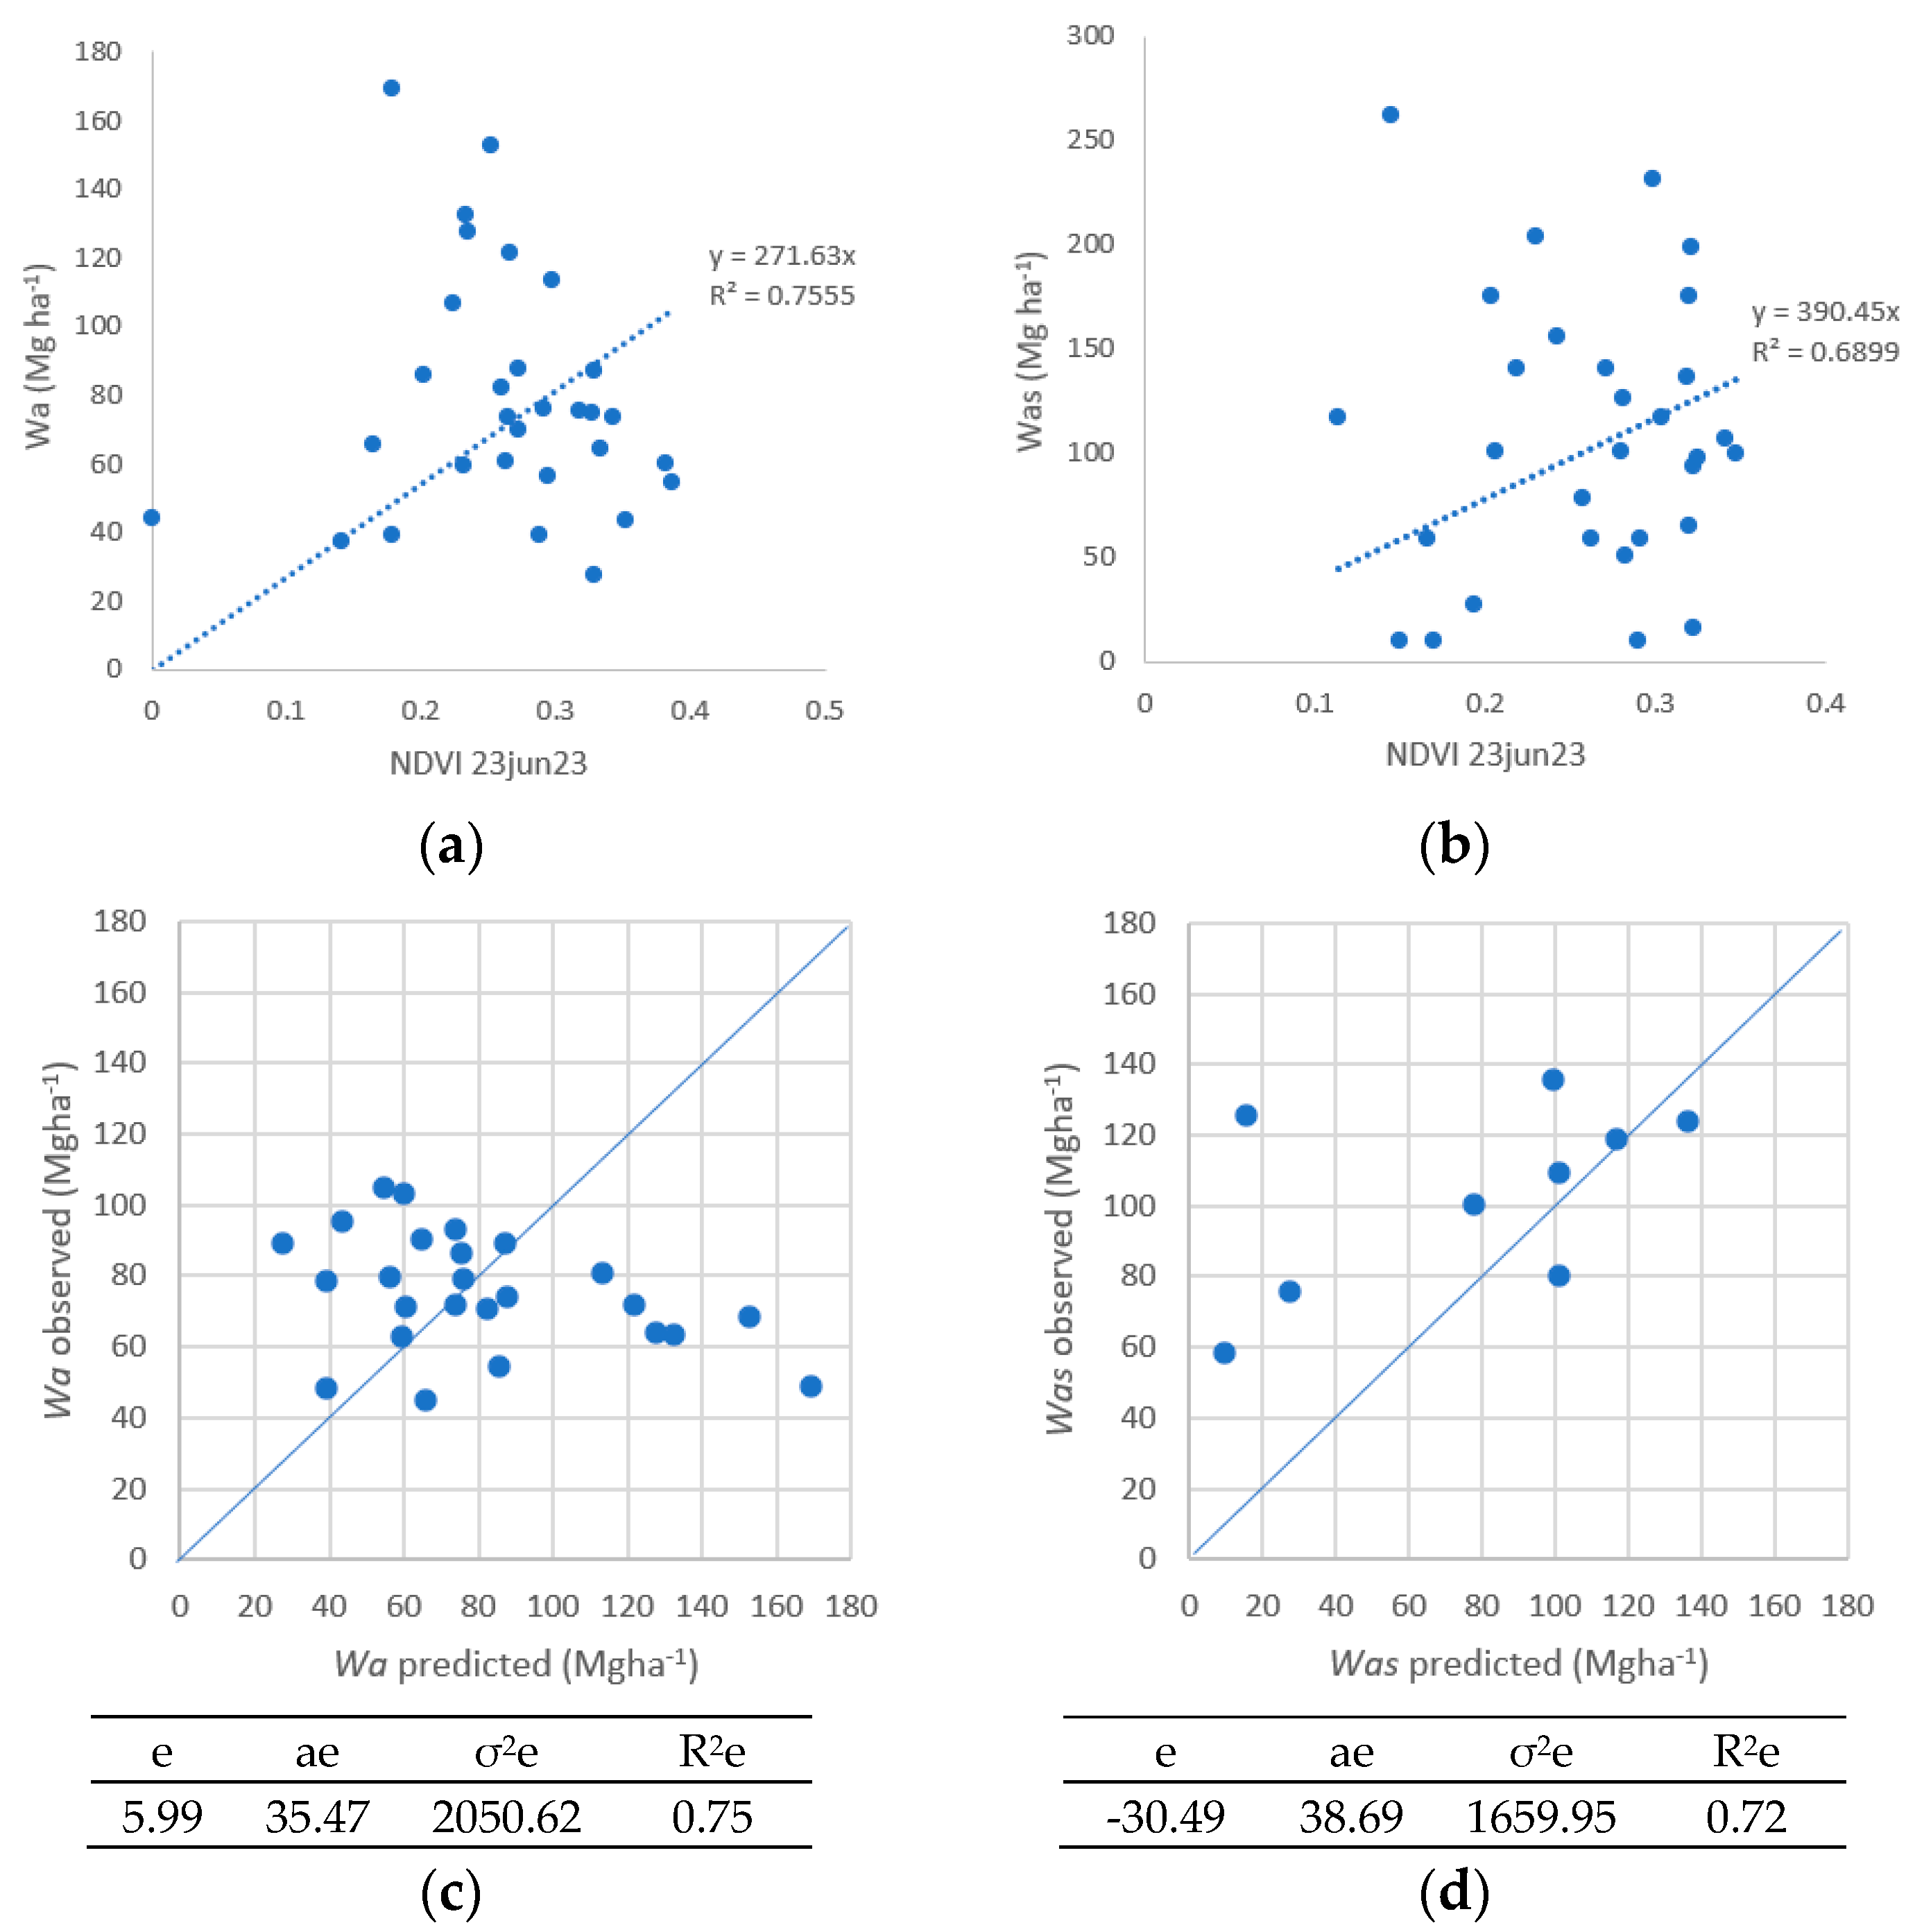
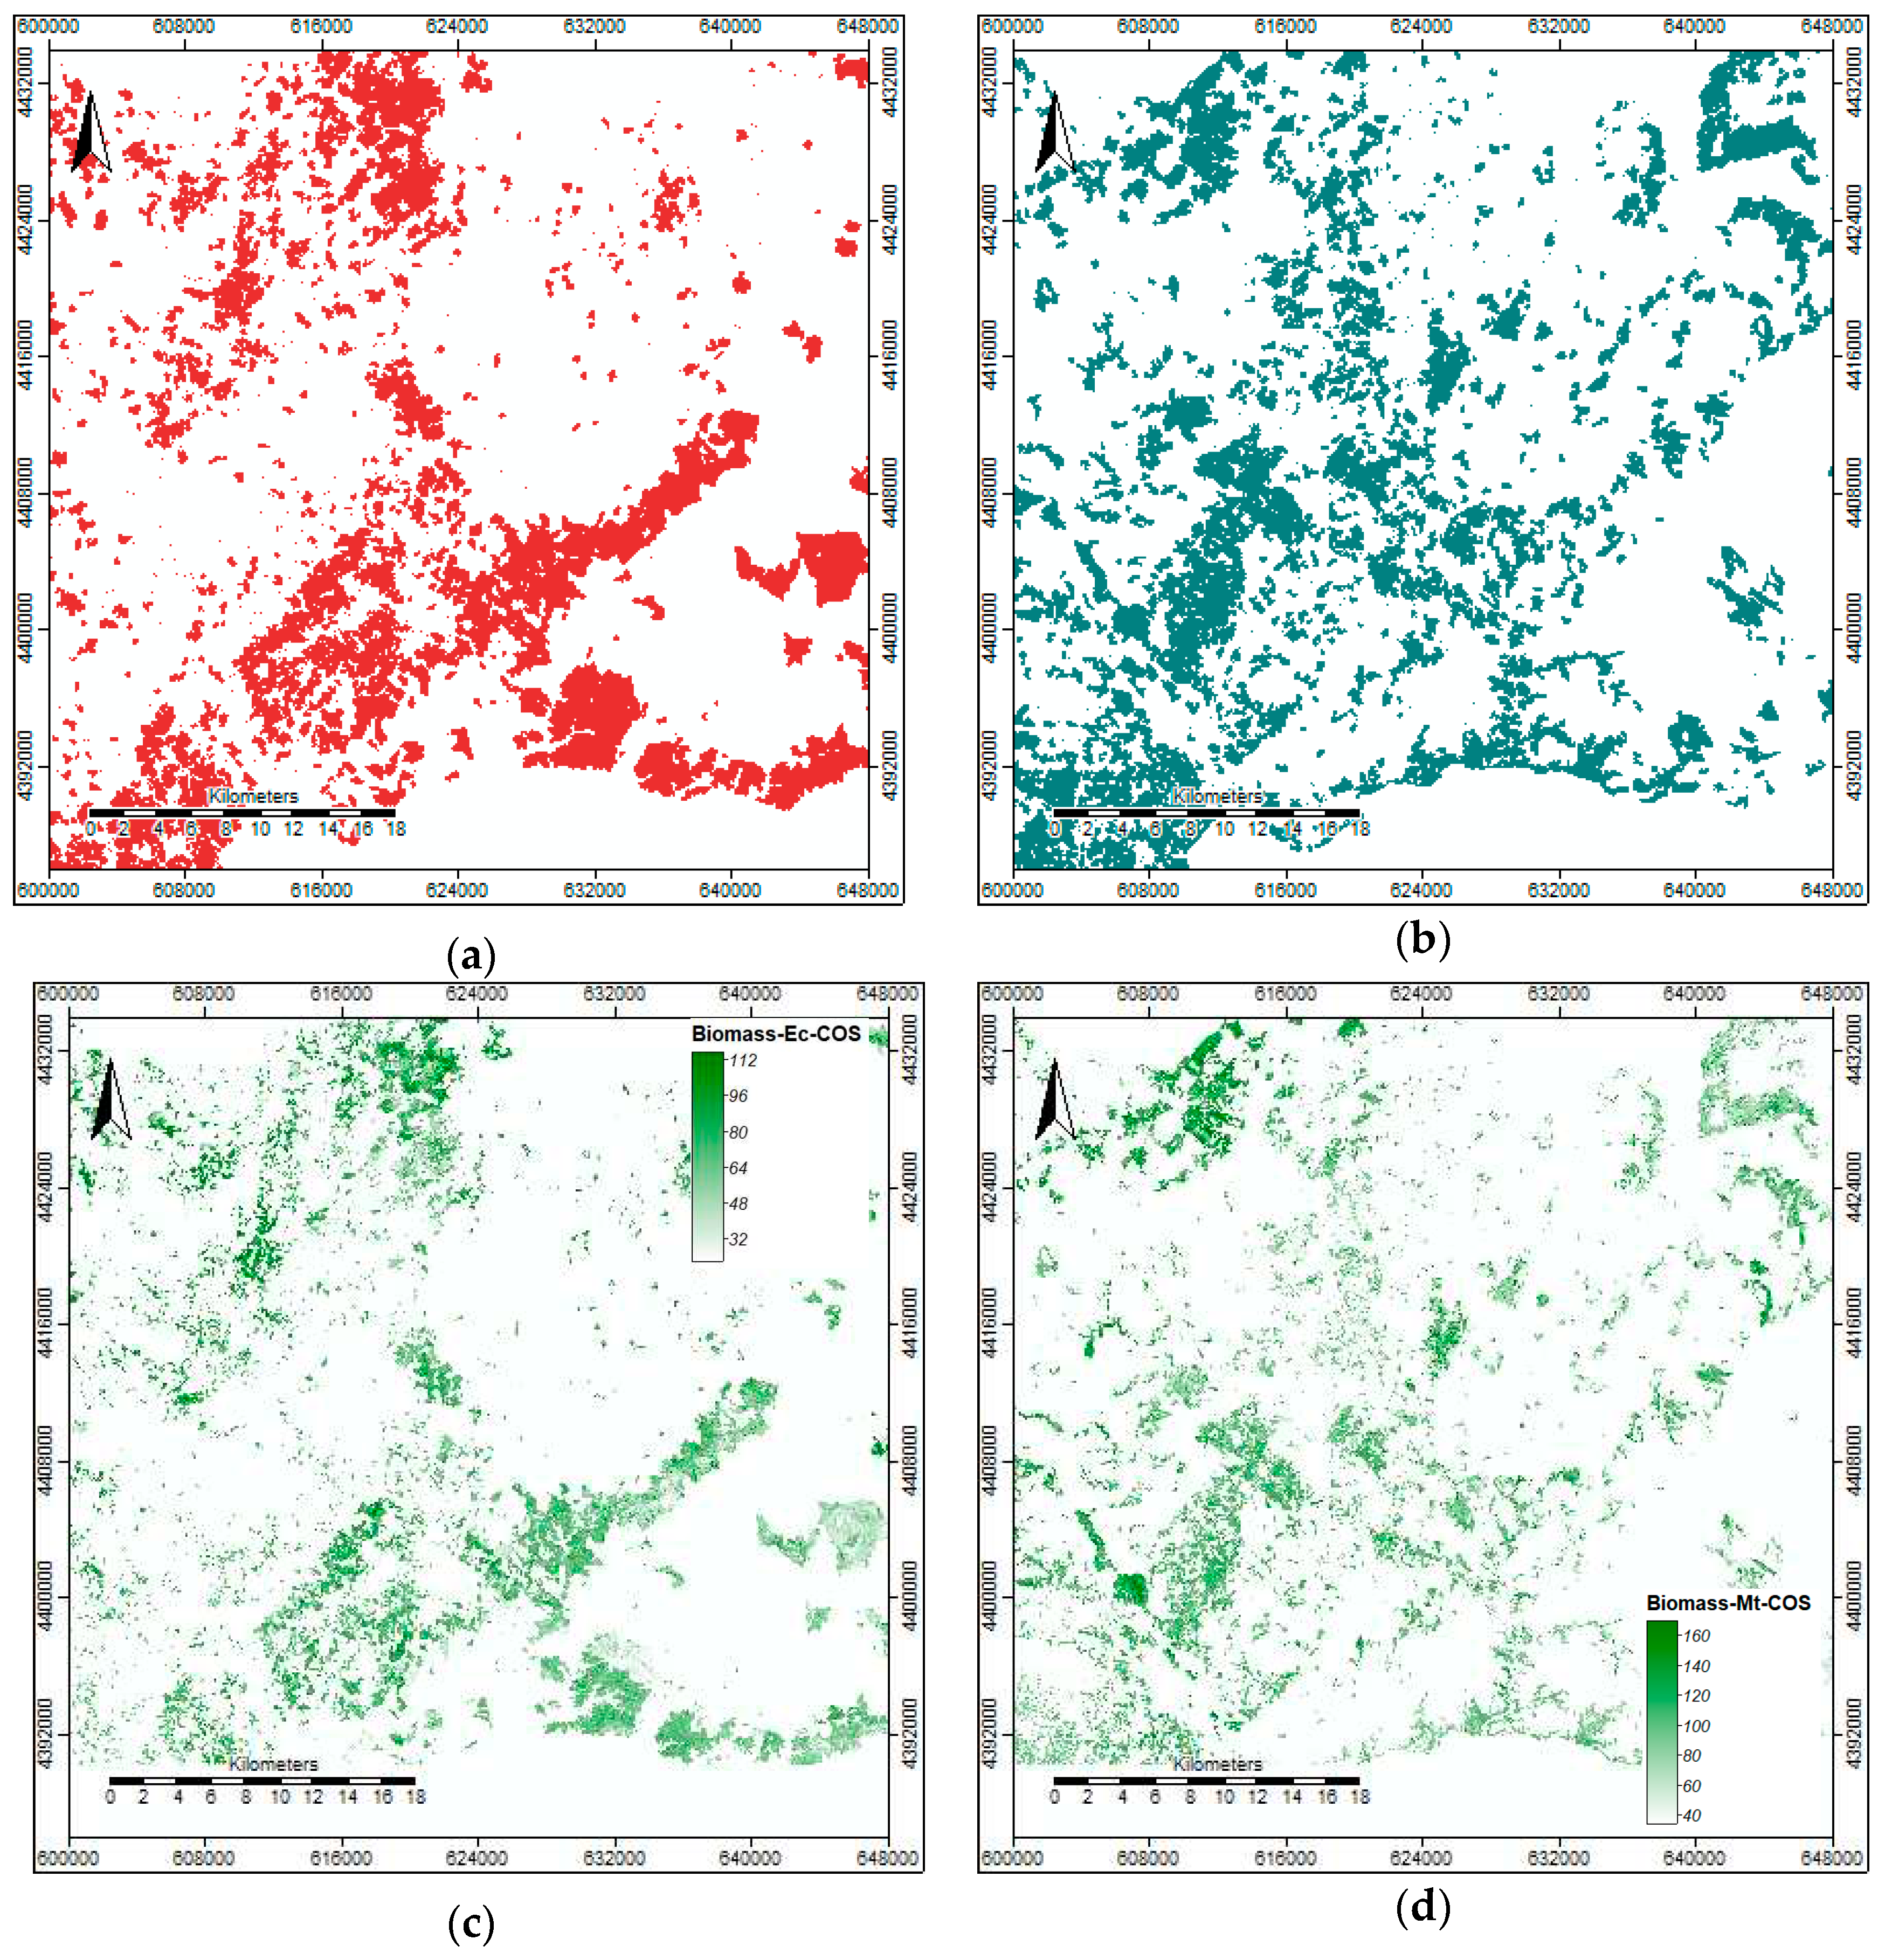
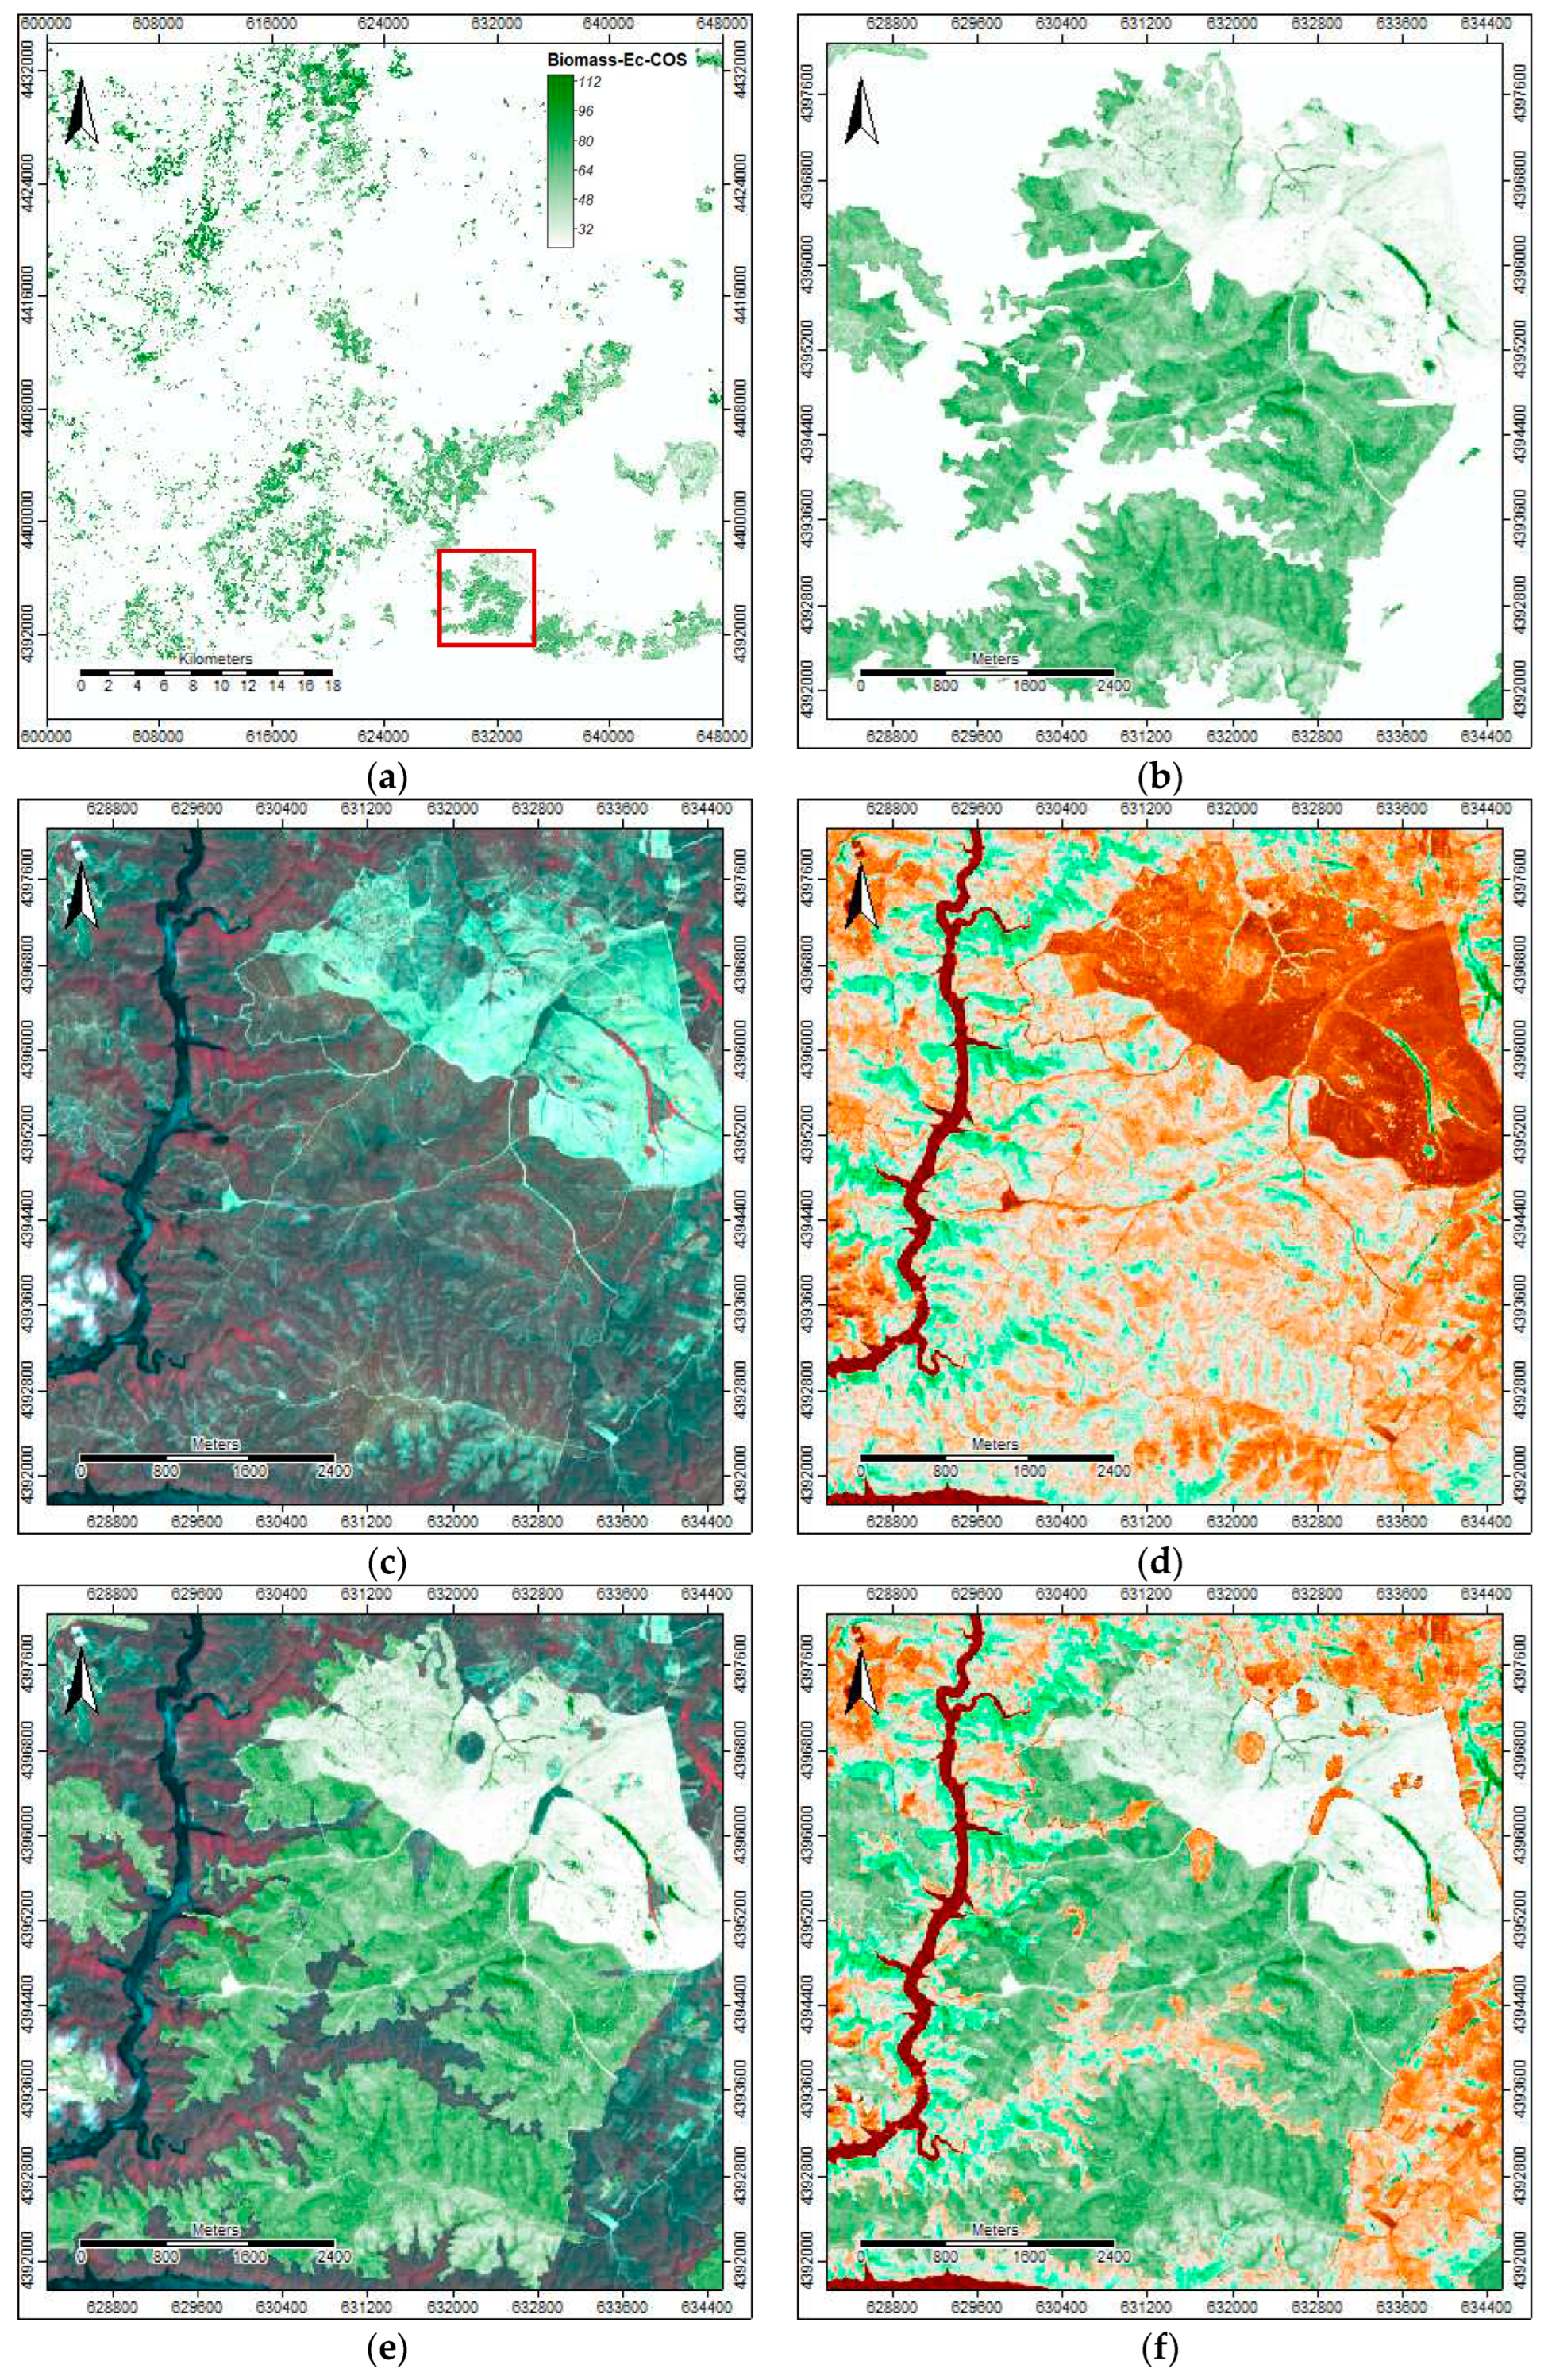
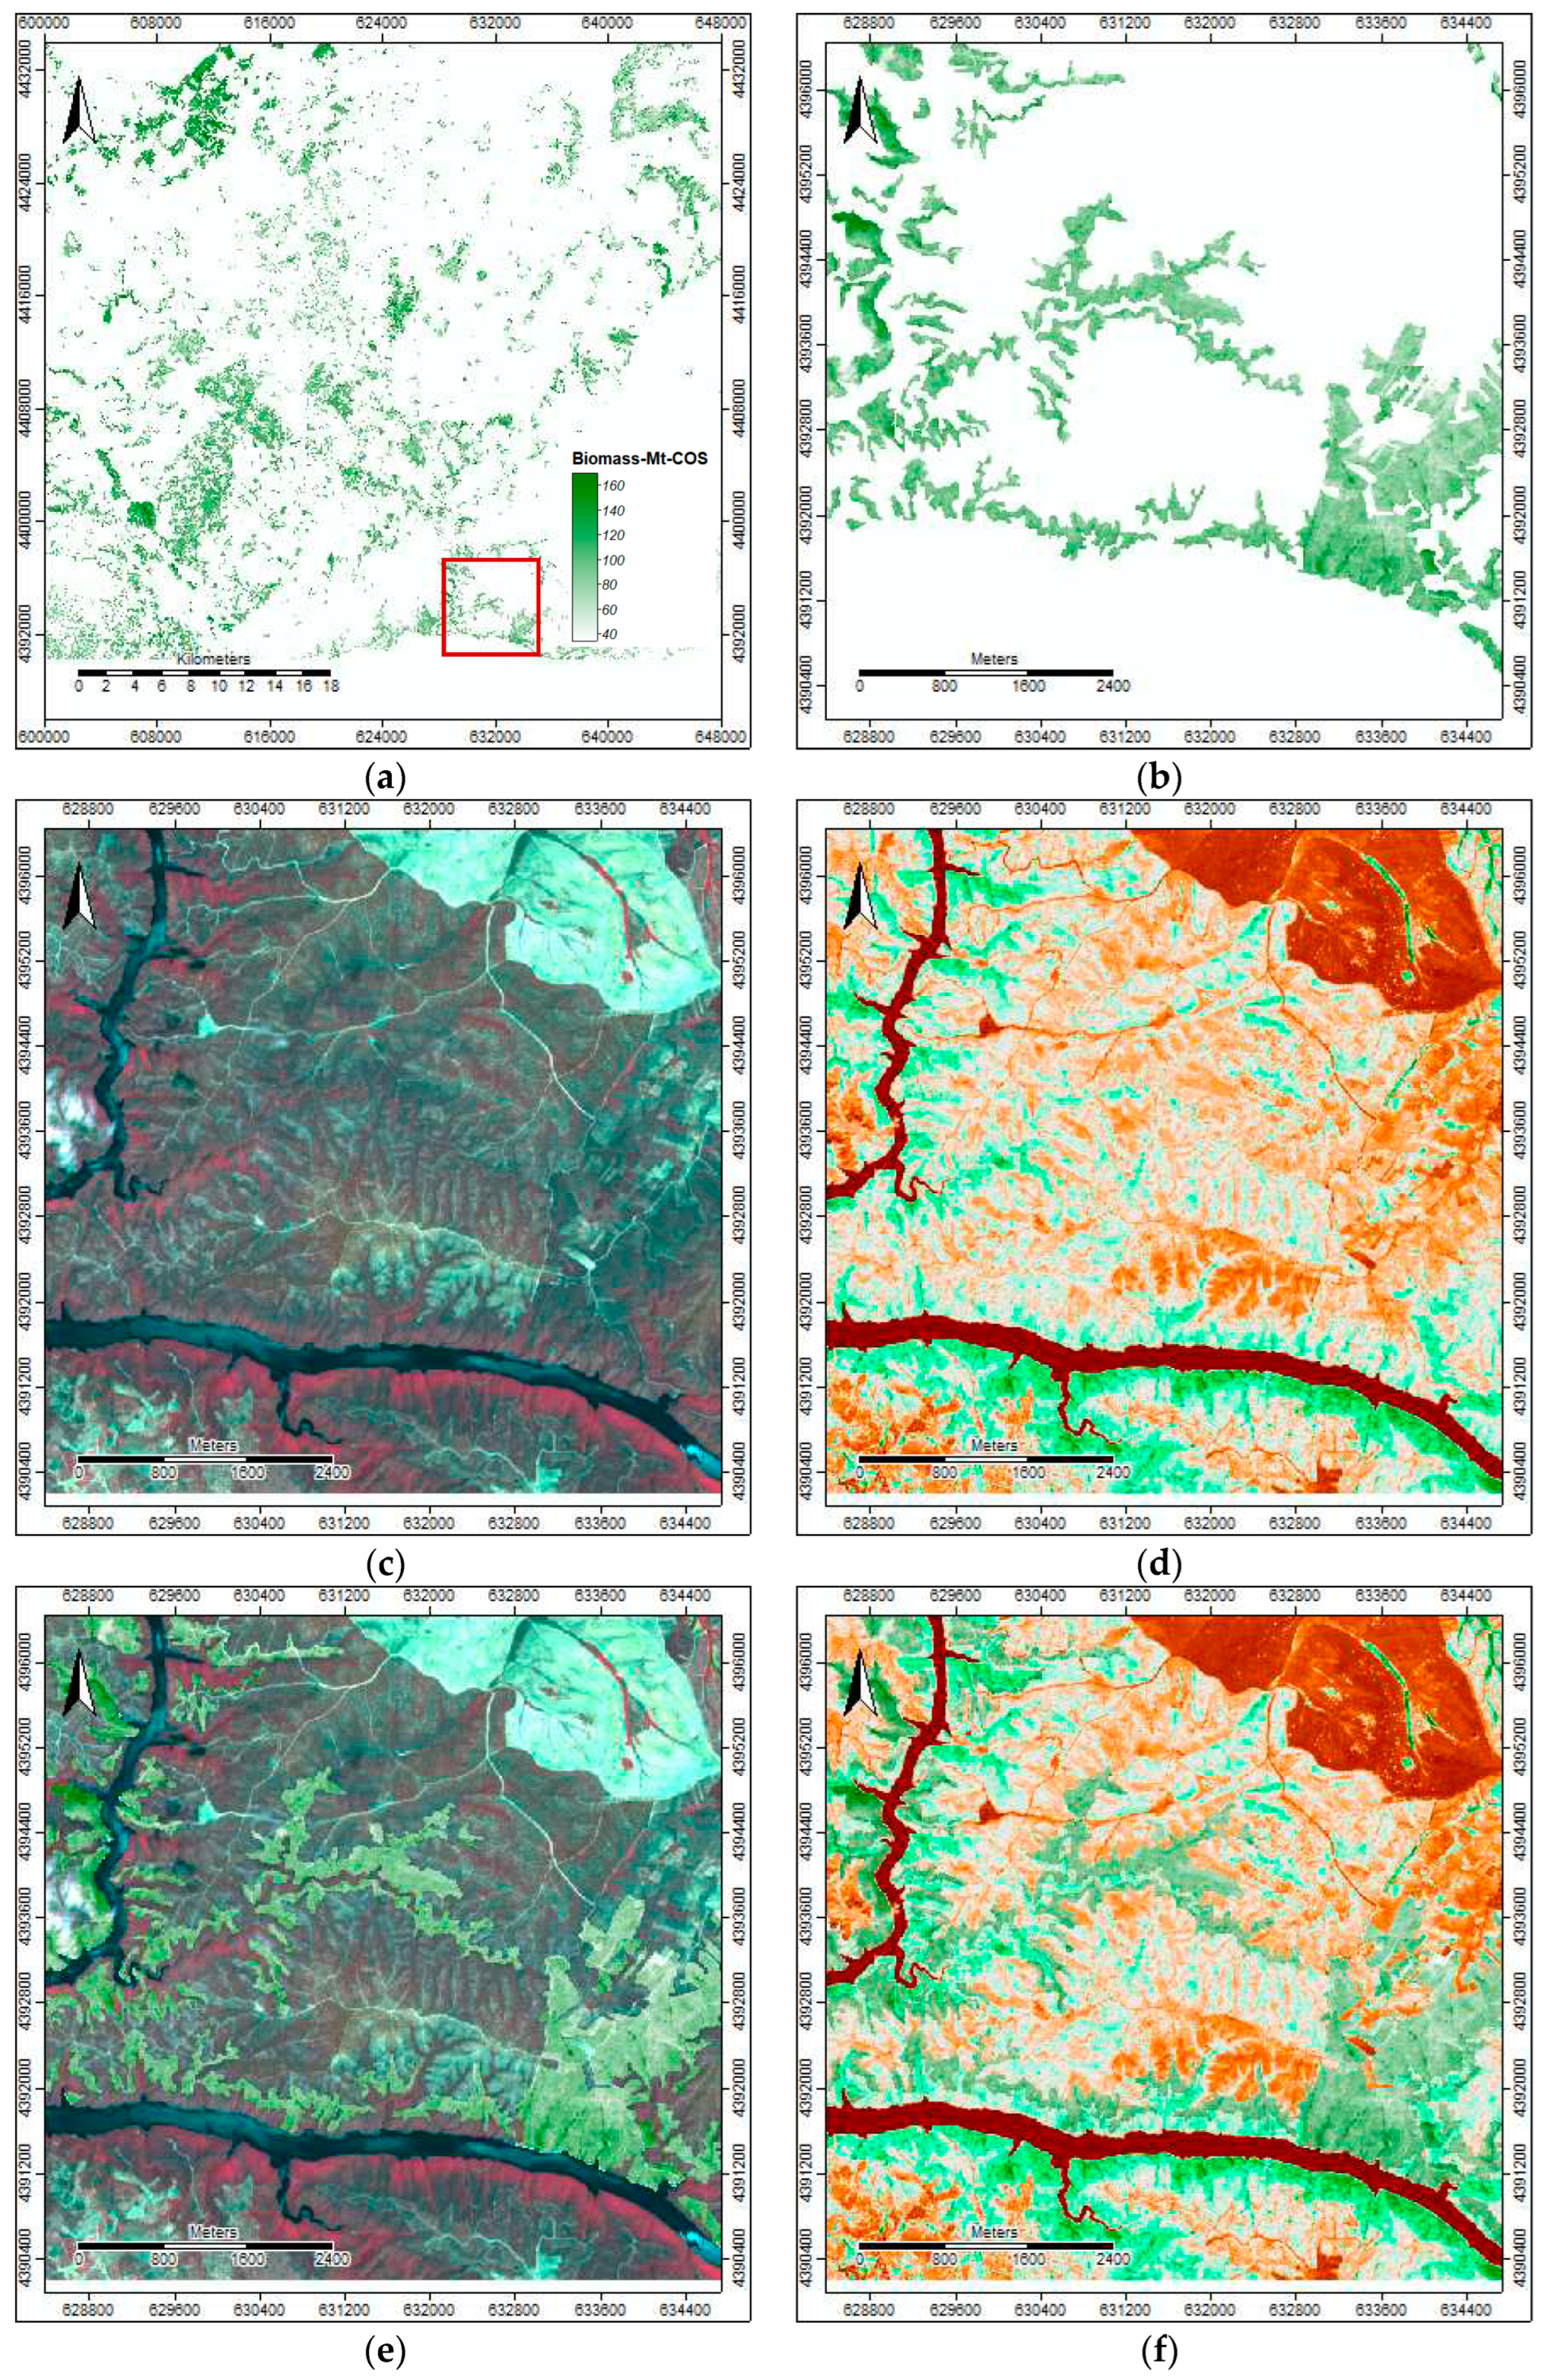
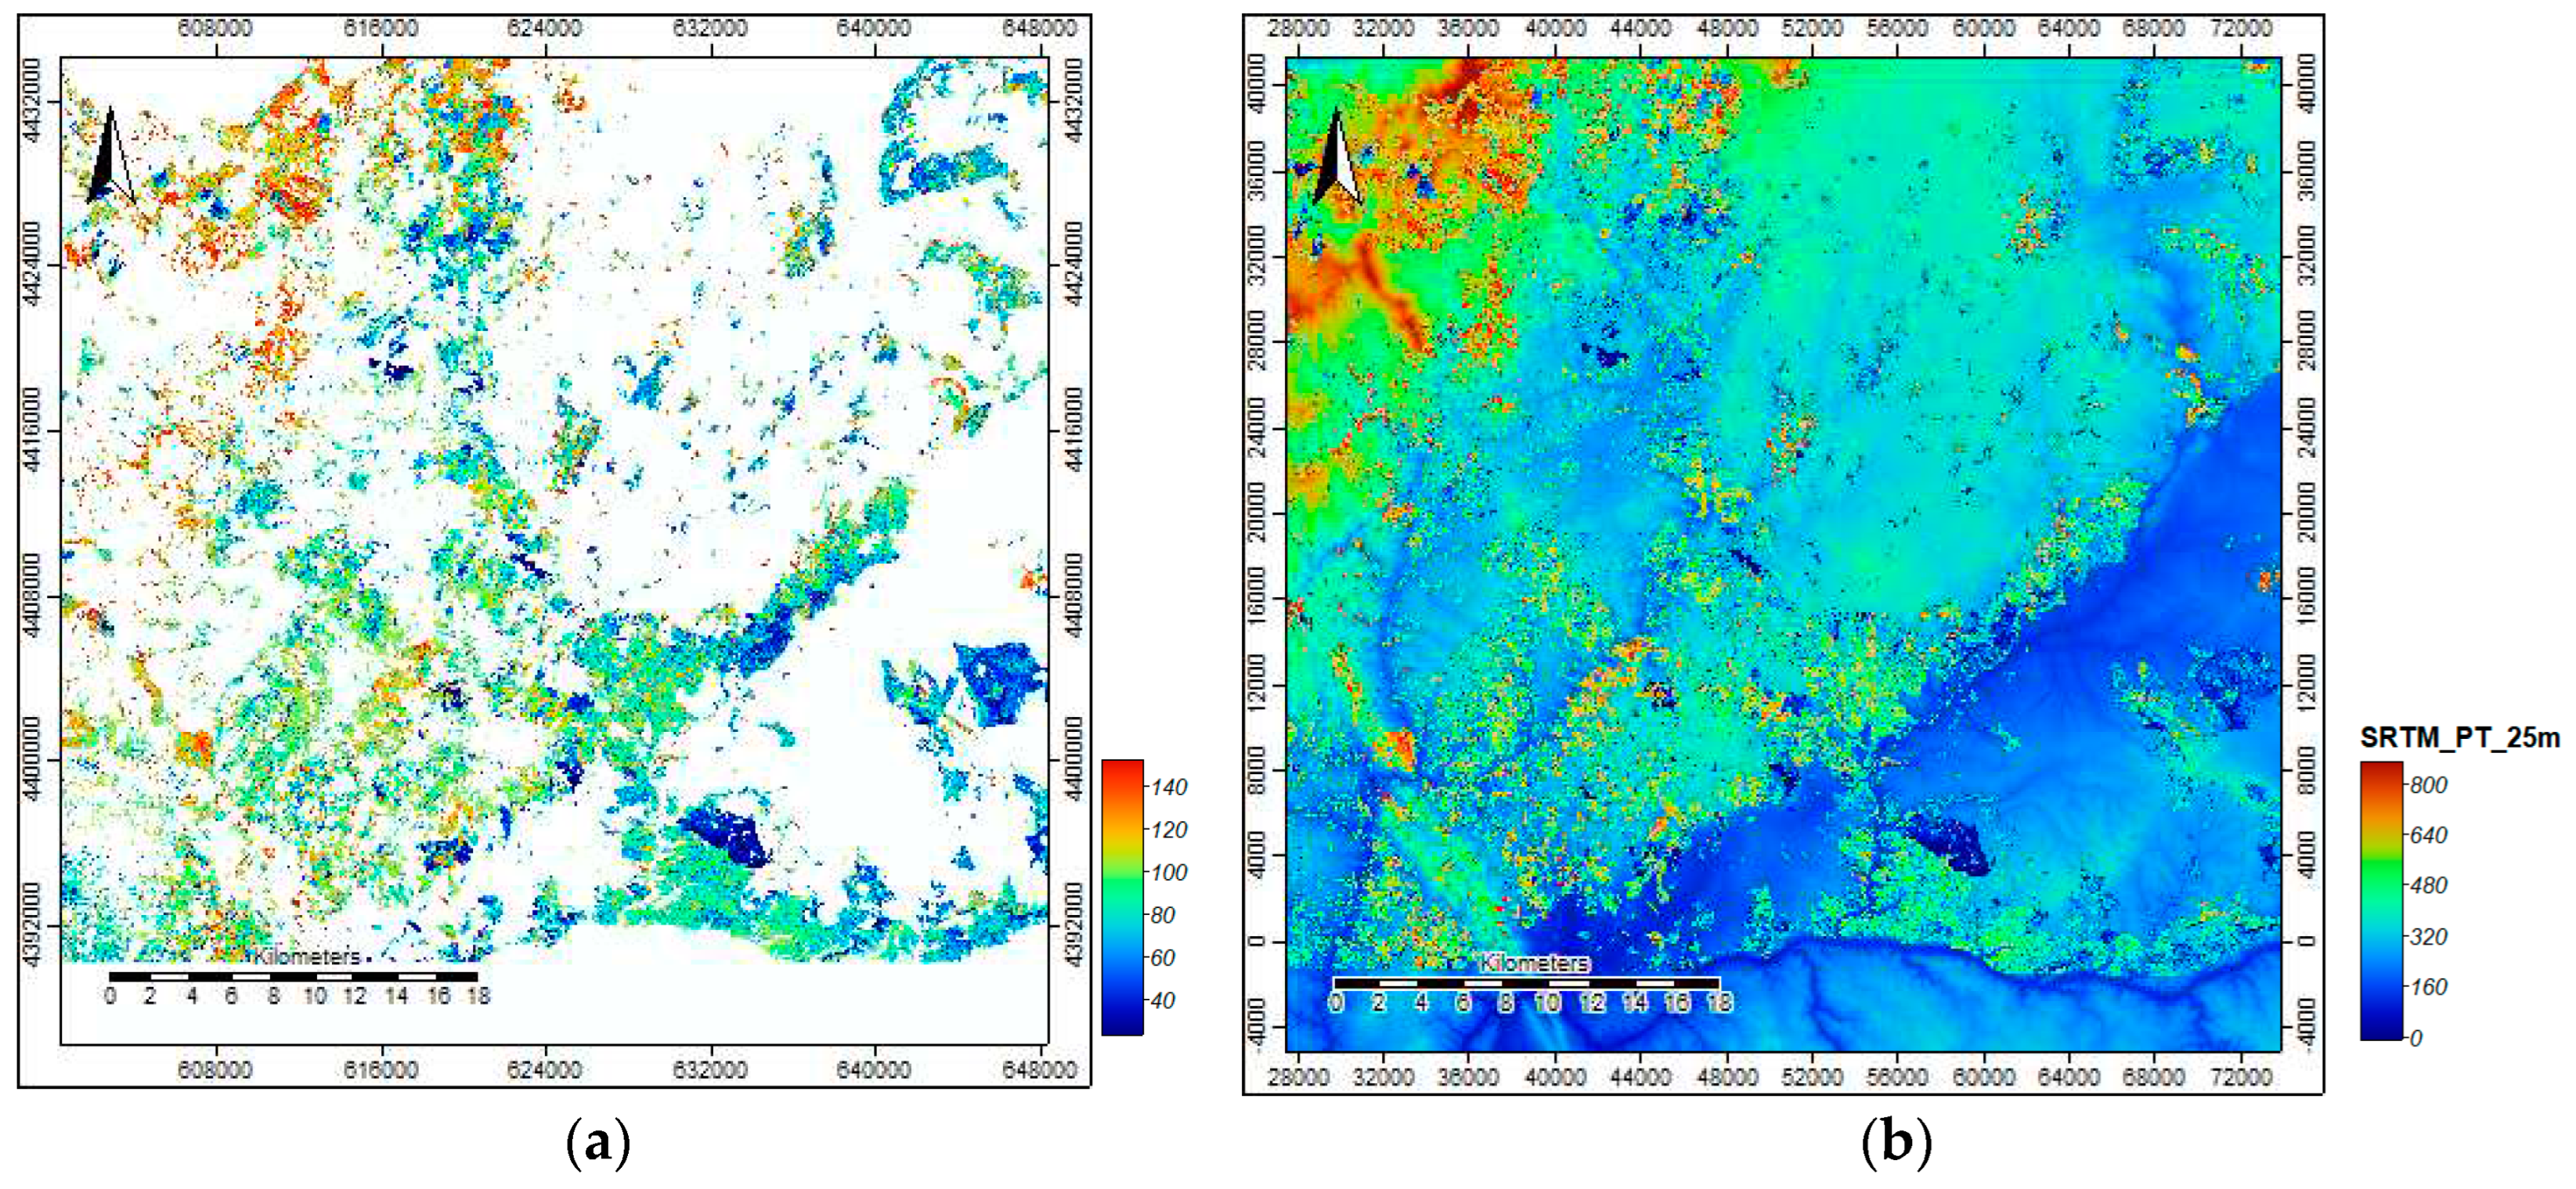
3.2. AGB maps production and validation
| AGB | Min. | Max. | Mean | SD | |
|---|---|---|---|---|---|
| Eucalypts areas | Wa (Mg ha−1) | 16.31 | 141.82 | 78.76 | 15.85 |
| Shrubland areas | Was (Mg ha−1) | 26.66 | 197.21 | 102.00 | 23.48 |
4. Discussion
5. Conclusions
Author Contributions
Funding
Data Availability Statement
Acknowledgments
Conflicts of Interest
Appendix A

References
- Avitabile, V.; Herold, M.; Henry, M.; Schmullius, C. Mapping biomass with remote sensing: A comparison of methods for the case study of Uganda. Carbon Balance Manag. 2011, 6, 7. [Google Scholar] [CrossRef]
- Motlagh, M.G.; Kafaky, S.B.; Mataji, A.; Akhavan, R. Estimating and mapping forest biomass using regression models and Spot-6 images (case study: Hyrcanian forests of north of Iran). Environ. Monit. Assess. 2018, 190. [Google Scholar] [CrossRef] [PubMed]
- Thakur, T.K.; Swamy, S.L.; Bijalwan, A.; Dobriyal, M.J.R. Assessment of biomass and net primary productivity of a dry tropical forest using geospatial technology. J. For. Res. 2019, 30, 157–170. [Google Scholar] [CrossRef]
- Massey, R.; Berner, L.T.; Foster, A.C.; Goetz, S.J.; Vepakomma, U. Remote sensing tools for monitoring forests and tracking their dynamics BT—Boreal forests in the face of climate change: Sustainable management; Girona, M.M., Morin, H., Gauthier, S., Bergeron, Y., Eds.; Springer International Publishing: Cham, 2023; pp. 637–655. ISBN 978-3-031-15988-6. [Google Scholar]
- Thuy, H.L.T.; Tan, M.T.; Van, T.T.T.; Bien, L.B.; Ha, N.M.; Nhung, N.T. Using sentinel image data and plot survey for the assessment of biomass and carbon stock in coastal forests of Thai Binh Province, Vietnam. Appl. Ecol. Environ. Res. 2020, 18, 7499–7514. [Google Scholar] [CrossRef]
- Araza, A.; Herold, M.; de Bruin, S.; Ciais, P.; Gibbs, D.A.; Harris, N.; Santoro, M.; Wigneron, J.P.; Yang, H.; Málaga, N.; et al. Past decade above-ground biomass change comparisons from four multi-temporal global maps. Int. J. Appl. Earth Obs. Geoinf. 2023, 118, 103274. [Google Scholar] [CrossRef]
- Zhang, Y.; Liang, S.; Yang, L. A review of regional and global gridded forest biomass datasets. Remote Sens. 2019, 11, 2744. [Google Scholar] [CrossRef]
- Ferreira, S.; Monteiro, E.; Brito, P.; Vilarinho, C. Biomass resources in Portugal: Current status and prospects. Renew. Sustain. Energy Rev. 2017, 78, 1221–1235. [Google Scholar] [CrossRef]
- Kumar, L.; Sinha, P.; Taylor, S.; Alqurashi, A.F. Review of the use of remote sensing for biomass estimation to support renewable energy generation. J. Appl. Remote Sens. 2015, 9, 097696. [Google Scholar] [CrossRef]
- Ónodi, G.; Kertész, M.; Kovács-Láng, E.; Ódor, P.; Botta-Dukát, Z.; Lhotsky, B.; Barabás, S.; Mojzes, A.; Kröel-Dulay, G. Estimating aboveground herbaceous plant biomass via proxies: The confounding effects of sampling year and precipitation. Ecol. Indic. 2017, 79, 355–360. [Google Scholar] [CrossRef]
- Forkel, M.; Carvalhais, N.; Verbesselt, J.; Mahecha, M.D.; Neigh, C.S.R.; Reichstein, M. Trend change detection in NDVI time series: Effects of inter-annual variability and methodology. Remote Sens. 2013, 5, 2113–2144. [Google Scholar] [CrossRef]
- Berra, E.F.; Fontana, D.C.; Kuplich, T.M. Tree age as adjustment factor to NDVI. Rev. Árvore 2017, 41. [Google Scholar] [CrossRef]
- Gizachew, B.; Solberg, S.; Næsset, E.; Gobakken, T.; Bollandsås, O.M.; Breidenbach, J.; Zahabu, E.; Mauya, E.W. Mapping and estimating the total living biomass and carbon in low-biomass woodlands using Landsat 8 CDR data. Carbon Balance Manag. 2016, 11. [Google Scholar] [CrossRef] [PubMed]
- Santos, L.H.O.; Ramirez, G.M.; Roque, M.W.; Chaves e Carvalho, M.P.d.L.; Ruiz Diaz, L.M.G.; Chaves e Carvalho, S.P. Correlação entre uniformidade e NDVI em povoamentos de Tectona grandis L. f. BIOFIX Sci. J. 2019, 4, 130. [Google Scholar] [CrossRef]
- ICNF. 6o Inventário Florestal Nacional—IFN6. 2015. Relatório final; Instituto da Conservação da Natureza e das Florestas: Lisboa, Portugal, 2019; Available online: https://www.icnf.pt/api/file/doc/c8cc40b3b7ec8541 (accessed on 25 May 2023).
- Águas, A.; Ferreira, A.; Maia, P.; Fernandes, P.M.; Roxo, L.; Keizer, J.; Silva, J.S.; Rego, F.C.; Moreira, F. Natural establishment of Eucalyptus globulus Labill. in burnt stands in Portugal. For. Ecol. Manage. 2014, 323. [Google Scholar] [CrossRef]
- Turnbull, J.W. Eucalypt plantations. New For. 1999, 17, 37–52. [Google Scholar] [CrossRef]
- Alegria, C.; Pedro, N.; do Carmo Horta, M.; Roque, N.; Fernandez, P. Ecological envelope maps and stand production of eucalyptus plantations and naturally regenerated maritime pine stands in the central inland of Portugal. For. Ecol. Manage. 2019, 432, 327–344. [Google Scholar] [CrossRef]
- FAO Group reports. Group reports. Group I: Bio-physical and environmental impacts of eucalyptus plantations. In Regional Expert Consultation on Eucalyptus; White, K., Ball, J., Kashio, M., Eds.; FAO Regional Office for Asia and the Pacific: Bankok, 1993; Volume I. [Google Scholar]
- Davidson, J. Ecological aspects of eucalyptus plantations. 1993, I, 1–20. [Google Scholar]
- Fernandes, P.M. Combining forest structure data and fuel modelling to classify fire hazard in Portugal. Ann. For. Sci. 2009, 66, 415. [Google Scholar] [CrossRef]
- Silva, J.; Moreira, F.; Vaz, P.; Catry, F.; Ferreira, P. Assessing the relative fire proneness of different forest types in Portugal. Plant Biosyst. 2009, 143, 597–608. [Google Scholar] [CrossRef]
- Fernandes, P.M.; Luz, A.; Loureiro, C. Changes in wildfire severity from maritime pine woodland to contiguous forest types in the mountains of northwestern Portugal. For. Ecol. Manage. 2010, 260, 883–892. [Google Scholar] [CrossRef]
- Gil, A.; Yu, Q.; Lobo, A.; Lourenço, P.; Silva, L.; Calado, H.; Jaume, T. Assessing the effectiveness of high resolution satellite imagery for vegetation mapping in small islands protected areas. 2011, 1663–1667. [Google Scholar]
- AFN. Plano Municipal de Defesa da Floresta contra Incêndios (PMDFCI)—Guia Técnico; 2012. [Google Scholar]
- DGT Carta Administrativa Oficial de Portugal. Available online: https:/www.dgterritorio.gov.pt/search/dgt?keys=CAOP.
- DGT. Carta de uso e ocupação do solo. Registo nacional de dados geográficos. SNIG. Direção-Geral do Território. Lisboa. Portugal. Available online: https://snig.dgterritorio.gov.pt/rndg/srv/search?keyword=Carta%20de%20ocupa%C3%A7%C3%A3o%20do%20solo (accessed on 13 September 2022).
- DGT. Especificações técnicas da carta de uso e ocupação do solo de Portugal Continental para 2018. Relatório técnico; Direção-Geral do Território: Lisboa, Portugal, 2018. Available online: https://www.dgterritorio.gov.pt/sites/default/files/documentos-publicos/2019-12-26-11-47-32-0__ET-COS-2018_v1.pdf (accessed on 13 September 2022).
- IPMA. Boletins Climatológicos de Portugal Continental. Instituto Português do Mar e da Atmosfera. Available online: https://www.ipma.pt/pt/publicacoes/boletins.jsp?cmbDep=cli&cmbTema=pcl&idDep=cli&idTema=pcl&curAno=-1 (accessed on 23 June 2023).
- Navarro, G.; Caballero, I.; Silva, G.; Parra, P.-C.; Vázquez, Á.; Caldeira, R. Evaluation of forest fire on Madeira Island using Sentinel-2A MSI imagery. Int. J. Appl. Earth Obs. Geoinf. 2017, 58, 97–106. [Google Scholar] [CrossRef]
- Llorens, R.; Sobrino, J.A.; Fernández, C.; Fernández-Alonso, J.M.; Vega, J.A. A methodology to estimate forest fires burned areas and burn severity degrees using Sentinel-2 data. Application to the October 2017 fires in the Iberian Peninsula. Int. J. Appl. Earth Obs. Geoinf. 2021, 95, 102243. [Google Scholar] [CrossRef]
- EOS NDVI FAQ: All you need to know about index. Available online: https://eos.com/blog/ndvi-faq-all-you-need-to-know-about-ndvi/ (accessed on 13 September 2022).
- Yang, Y.; Wu, T.; Wang, S.; Li, J.; Muhanmmad, F. The NDVI-CV method for mapping evergreen trees in complex urban areas using reconstructed landsat 8 time-series data. Forests 2019, 10, 139. [Google Scholar] [CrossRef]
- Tomé, M.; Barreiro, S.; Paulo, J.A.; Faias, S.P. Selecção de equações para estimação de variáveis da árvore em inventários florestais a realizar em Portugal; Publicações FORCHANGE PT 9/2007; Universidade Técnica de Lisboa, Instituto Superior de Agronomia, Centro de Estudos Florestais: Lisboa, Portugal, 2007; Available online: https://www.isa.ulisboa.pt/cef/forchange/fctools/sites/default/files/pub/docs/equacoes-if_em_portugal.pdf (accessed on 23 May 2023).
- Viana, H.; Aranha, J.; Lopes, D.; Cohen, W.B. Estimation of crown biomass of Pinus pinaster stands and shrubland above-ground biomass using forest inventory data, remotely sensed imagery and spatial prediction models. Ecol. Modell. 2012, 226, 22–35. [Google Scholar] [CrossRef]
- Huang, S.; Yang, Y.; Wang, Y. A critical look at procedures for validating growth and yield models. In Modelling forest systems; Amaro, A., Reed, D., Soares, P., Eds.; CAB international: Wallingford, UK, 2003; pp. 271–293. [Google Scholar]
- NASA JPL. NASA Shuttle Radar Topography Mission Global 1 arc second [Data set].
- Lillesand, T.; Kiefer, R. Remote Sensing and Image Interpretation; Sons, J.W., Ed.; New York, Chichester, Brisbane, Toronto, Singapore, 1994. [Google Scholar]
- Alegria, C. Vegetation monitoring and post-fire recovery: A case study in the Centre Inland of Portugal. Sustainability 2022, 14, 12698. [Google Scholar] [CrossRef]
- Chapungu, L.; Nhamo, L.; Gatti, R.C. Estimating biomass of savanna grasslands as a proxy of carbon stock using multispectral remote sensing. Remote Sens. Appl. Soc. Environ. 2020, 17, 100275. [Google Scholar] [CrossRef]
- Aranha, J.; Enes, T.; Calvão, A.; Viana, H. Shrub biomass estimates in former burnt areas using sentinel 2 images processing and classification. Forests 2020, 11, 555. [Google Scholar] [CrossRef]
| Band | Name | Central wavelength (nm) |
Spatial resolution (m) |
|---|---|---|---|
| 1 | Coastal aerosol | 443 | 60 |
| 2 | Blue | 490 | 10 and 20 |
| 3 | Green | 560 | 10 and 20 |
| 4 | Red | 665 | 10 and 20 |
| 5 | Red-edge 1 | 705 | 20 |
| 6 | Red-edge 2 | 740 | 20 |
| 7 | Red-edge 3 | 783 | 20 |
| 8 | NIR | 842 | 10 |
| 8a | NIR narrow | 865 | 20 |
| 9 | Water vapour | 945 | 60 |
| 10 | Cirrus | 1375 | 60 |
| 11 | SWIR 1 | 1610 | 20 |
| 12 | SWIR 2 | 2190 | 20 |
| Year | Date of acquisition | |||||||||||
|---|---|---|---|---|---|---|---|---|---|---|---|---|
| Jan | Feb | Mar | Apr | May | Jun | Jul | Aug | Sep | Oct | Nov | Dec | |
| 2022 | 29 | 28 | 30 | 29 | 29 | 28 | 28 | 27 | 26 | 5 and 25 | ||
| 2023 | 4 | 3, 13 and 23 | ||||||||||
| Acronym | Spectral bands | Formula | Equation |
|---|---|---|---|
| NDVI | R—red band NIR—near infrared band |
| Variable | Equation |
| Eucalypts | |
| Stem under bark | If hdom ≤ 10.71 If hdom > 10.71 |
| Bark | If hdom ≤ 18.2691 If hdom > 18.2691 |
| Branches | |
| Leaves | |
| Aboveground | |
| Shrubland | |
| Aboveground |
| Variables | Min. | Max. | Mean | SD | |
|---|---|---|---|---|---|
| Eucalypts field sample plots (n = 30) | |||||
| Number of trees per ha | N (trees ha−1) | 800 | 4500 | 1923 | 799 |
| Mean diameter | dg (cm) | 3.5 | 20.6 | 9.1 | 3.2 |
| Mean height | h (m) | 6.6 | 19.2 | 12.6 | 3.3 |
| Dominant diameter | ddom (cm) | 6.0 | 26.6 | 14.1 | 4.8 |
| Dominant height | hdom (m) | 10.0 | 25.0 | 16.5 | 4.5 |
| Aboveground biomass | Wa (Mg ha−1) | 27.7 | 169.0 | 78.7 | 35.0 |
| Shrubland field sample plots (n = 30) | |||||
| Ground cover | GC (%) | 10.0 | 90.0 | 43.0 | 20.9 |
| Shrub average height | hs (m) | 50.0 | 180.0 | 117.7 | 36.5 |
| Aboveground biomass | Was (Mg ha−1) | 9.7 | 262.6 | 107.3 | 66.7 |
| NDVI | Eucalypts field sample plots (n = 30) | Shrubland field sample plots (n = 30) | ||||||||
|---|---|---|---|---|---|---|---|---|---|---|
| Date | Min. | Max. | Mean | SD | Min. | Max. | Mean | SD | ||
| 3Jun23 | 0.000 | 0.344 | 0.192 | 0.098 | 0.043 | 0.369 | 0.219 | 0.101 | ||
| 13Jun23 | 0.000 | 0.437 | 0.243 | 0.110 | 0.006 | 0.372 | 0.227 | 0.105 | ||
| 23Jun23 | 0.000 | 0.386 | 0.264 | 0.079 | 0.114 | 0.348 | 0.260 | 0.065 | ||
Disclaimer/Publisher’s Note: The statements, opinions and data contained in all publications are solely those of the individual author(s) and contributor(s) and not of MDPI and/or the editor(s). MDPI and/or the editor(s) disclaim responsibility for any injury to people or property resulting from any ideas, methods, instructions or products referred to in the content. |
© 2023 by the authors. Licensee MDPI, Basel, Switzerland. This article is an open access article distributed under the terms and conditions of the Creative Commons Attribution (CC BY) license (http://creativecommons.org/licenses/by/4.0/).


