1. Introduction
Recently, in the work [
1] we have proposed a new double-nozzle technique for its use in-gas-jet laser resonance ionization spectroscopy. The operation of this original technique we explored by means of computer experiments, which were consisted in detailed gas dynamic simulations of the buffer gas flow (inside the gas stopping cell, double-nozzle and supersonic argon gas jet) and atom-trajectory Monte Carlo simulations. The results of these computer simulations presented and discussed in [
1]. In addition, the work [
1] presents and discuss results of similar computer simulations for JetRIS project (see, e.g., [
2,
3]) that is under development at GSI and which is a typical representative of the conventional in-gas-jet technique that is in use or under development nowadays.
In total, the calculation results presented in [1} show that the proposed double-nozzle technique has many advantages compared with the one used in the JetRIS setup for future high-resolution laser spectroscopic study of heaviest elements.
The detailed description of the double-nozzle technique as well as the conventional in-gas-jet technique readers can easily find elsewhere, for example, in [
1] and many links within it.
Shortly, the both experimental techniques for the laser resonance ionization spectroscopy (the proposed double-nozzle and convention one-nozzle techniques) consists in the following.
The ions of interest after their thermal evaporation as neutral atoms from the hot filament placed inside the gas stopping cell in front of the nozzle are transported by the buffer gas flow through the converging-diverging nozzle (or through the double-nozzle device, as it is in case of new technique proposed in [
1]) into the gas-jet chamber.
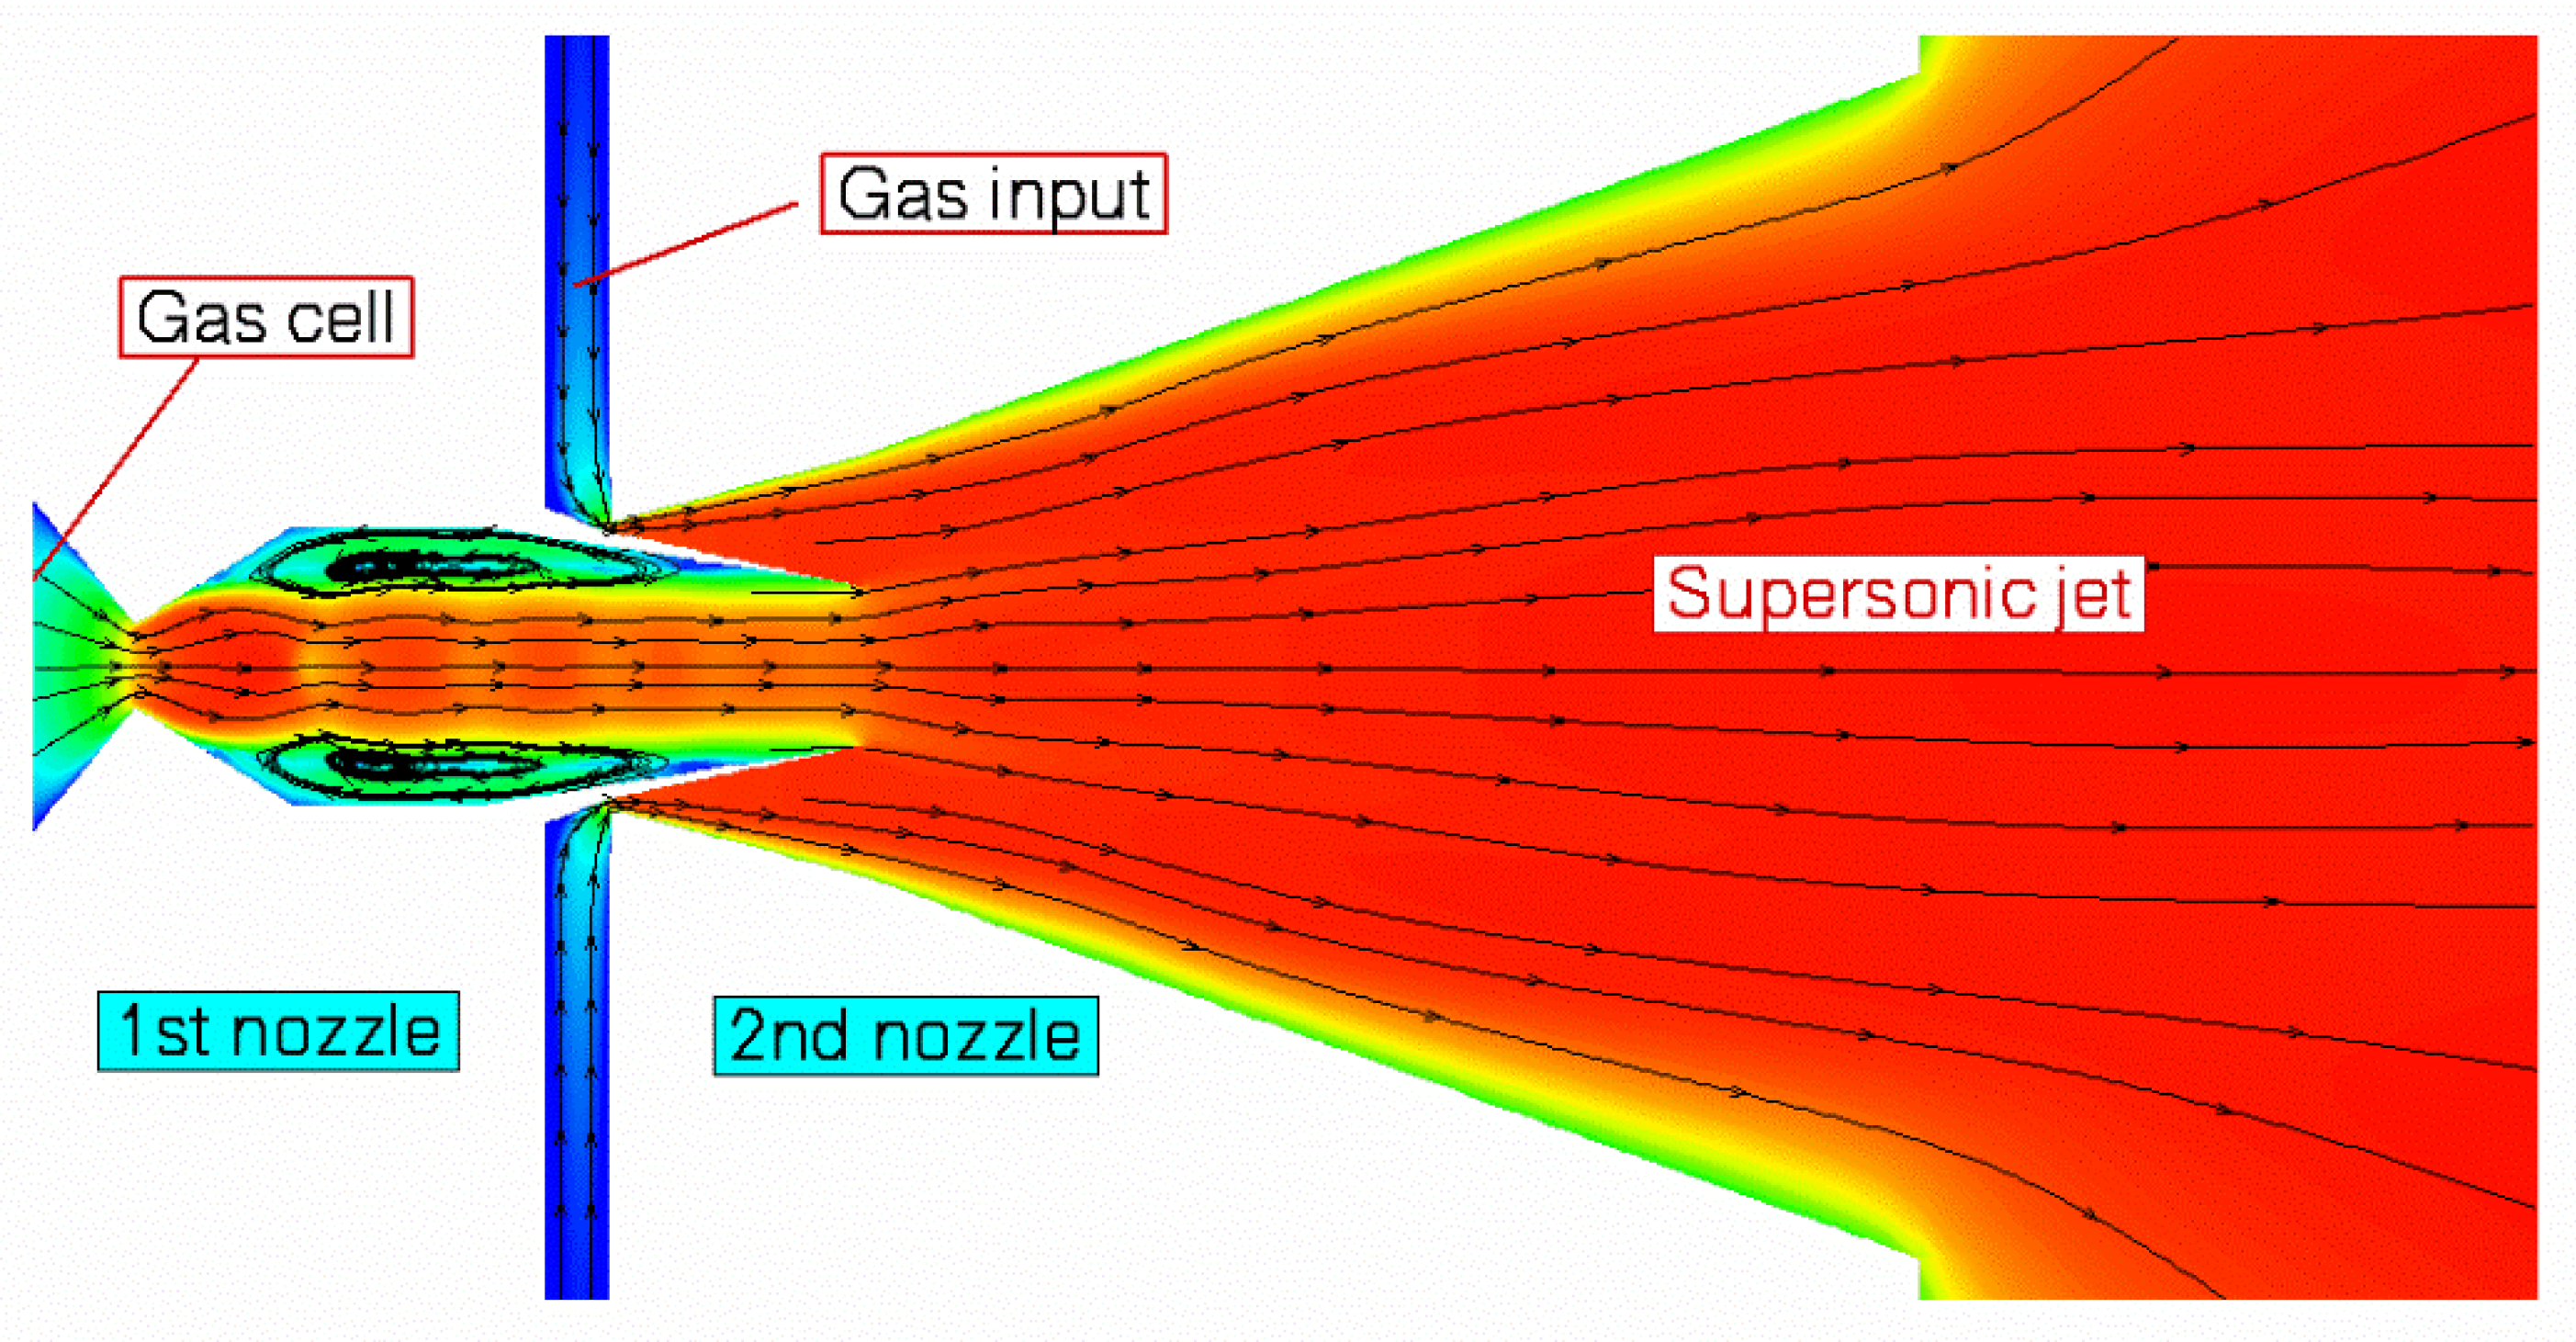
Schematic view of the double-nozzle design combined with results of the gas dynamic simulation for argon velocity flow field shown in
Figure 1 for illustration.
Two lasers in cross-beam geometry perform the excitation and ionization of the extracted into the gas-jet chamber neutral atomic beam. (In all Monte Carlo simulations in this article, we will use nobelium-254, as a representative of the heavy atoms extracted from the gas cell via argon gas flow). One laser beam (we will refer to as a Laser-1) directed along the axis upstream of the gas jet direction excites atoms of interest, and the second one (we will refer to as Laser-2) directed perpendicular to the gas jet ionizes these excited atoms. The ionized by the Laser-2 atoms are transported by the gas jet through the gas-jet chamber to the entrance of the bent RFQ (e.g., S-shaped [
4] or bend 90 degrees [
2,
3,
4]) placed on the axis downstream at 50-70 mm distance from the nozzle exit.
E.g., the description of the segmented 90° bent RFQ ion guide one can find in the section 9.1 of the detailed and of good quality work [
4]. This bent RFQ placed in the gas-jet chamber, which 3D schematic view shown in Figure 17a [
4], allows for the Laser-1 beam up to 8 mm in diameter to be inserted through the RFQ segments into the region of laser ionization.
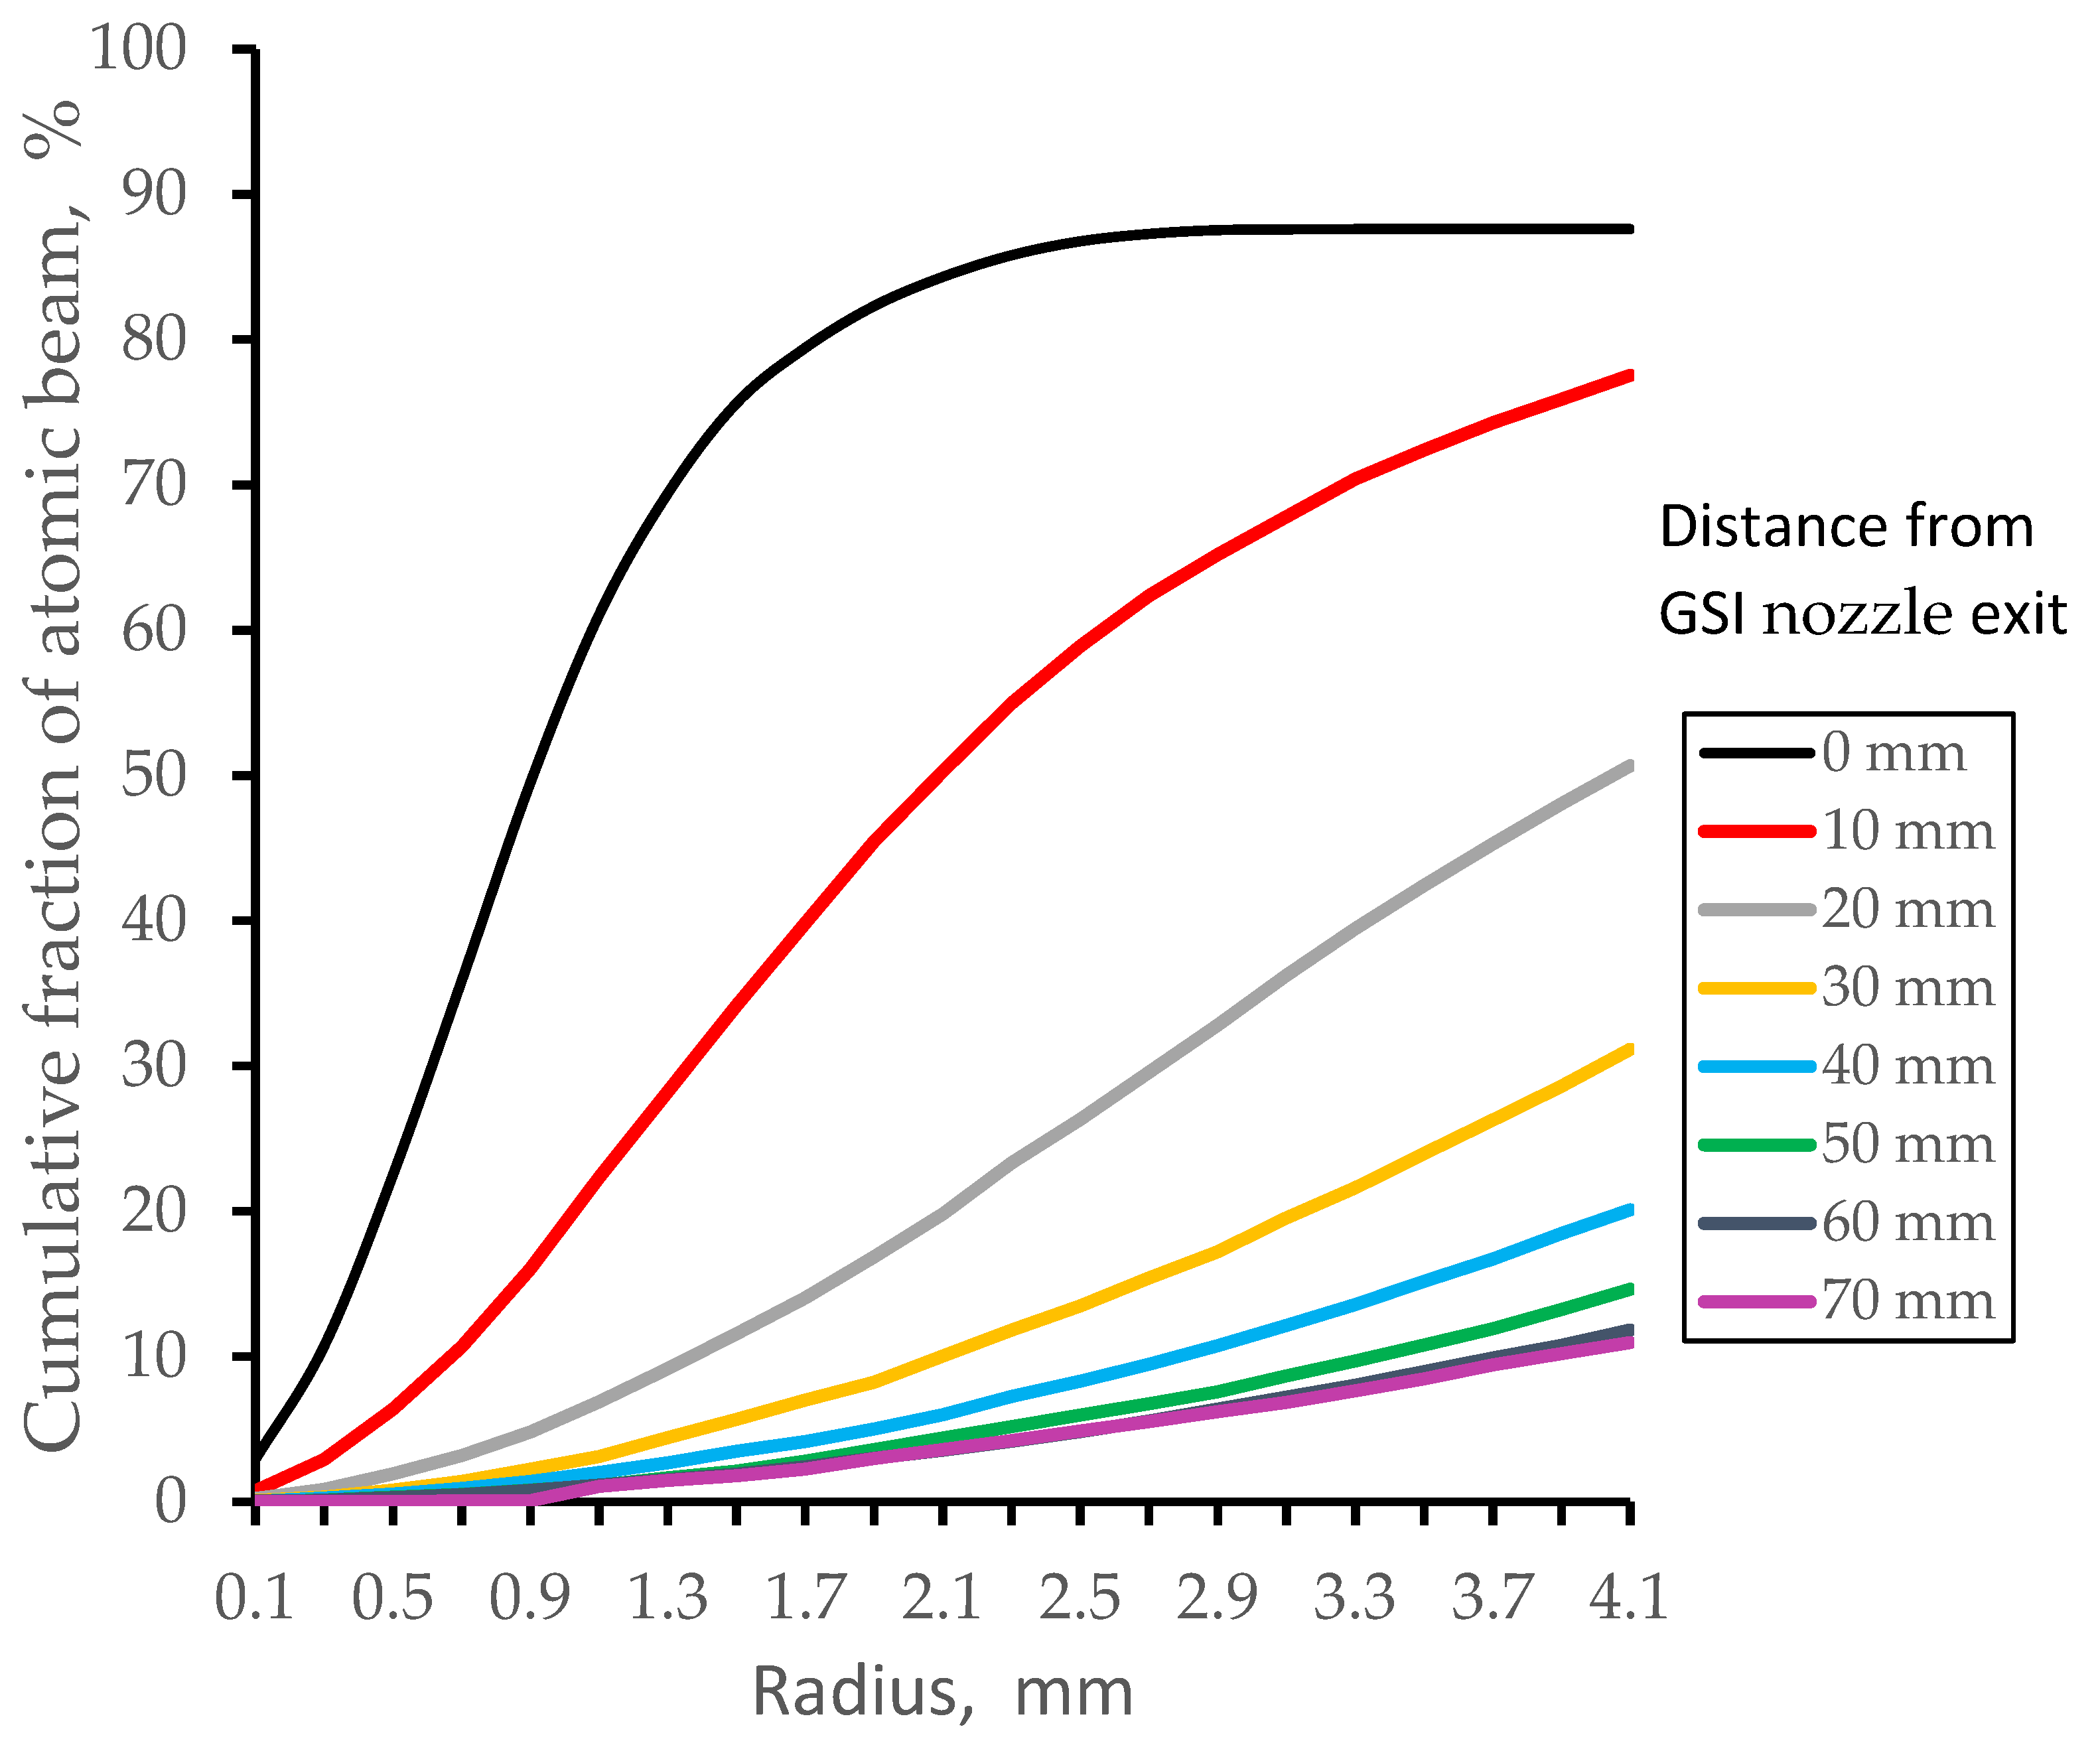
Results of our simulations (Gas dynamic + Monte Carlo) for cumulative fractions of nobelium-254 atomic beam inside the region of 8 mm in diameter (Laser -1 beam diameter) presented in
Figure 2 for different downstream distances from the GSI nozzle (In this article, we will use the same definitions as the work [
1], e.g., “GSI nozzle” and “double-nozzle”). It corresponds to the JetRIS setup operation at the stagnation gas cell pressure P
cell = 100 mbar and pumping capacity of the turbo molecular pump of 1300 l/s.
To be sure, that the Laser-2 pulsed beam having repetition rate of 10 kHz will ionize all nobelium atoms in a free supersonic jet, the length of the ionization zone has to be not less than 55–60 mm [
2,
3,
4].
Due to the argon supersonic jet expansion (one can see it in
Figure 4 of Ref. [
1]), only nobelium atoms which are inside the axial region of 8 mm in diameter can be excited by this Laser-1. After the data of
Figure 2 averaging along the ionization region of 60 mm in length, one get that only 41.9% of the total atomic beam can be ionized in the two-steps laser resonance ionization process. Notice, the diffusion atomic beam losses inside the nozzle have automatically included here, as well.
In the case of the double-nozzle technique proposed in [
1], the corresponding fraction of nobelium atomic beam that can be excited with the use of Laser-1 beam of 8 mm in diameter is 49.0 %. It corresponds to results of Monte Carlo simulations presented in
Figure 9 below.
Unfortunately, we could not find in literature quantitate data nether on the focusing efficiency of laser-ionized heavy atom beams into the curved RFQ, nether on the transmission efficiencies of these ions, first through this curved RFQ and then through the extraction RFQ placed behind the curved RFQ in the vacuum chamber (see Figure 17b in Ref. [
4]).
This work is devoted to the further development of the double-nozzle technique [
1]. To do so, we suggest replacing the conventional bent RFQ in the gas-jet chamber by a simple RF-only funnel placed on the axis of the gas-jet chamber at 70 mm distance downstream the 2nd nozzle exit. In addition, we recommend replacing the conventional extraction RFQ (e.g., see
Figure 3 in Ref. [
4]) by an original compact and simple cylindrical RF- buncher. It will allow for the fast and highly efficient ion beam extraction into vacuum and its bunching.
The idea of the RF-only funnel for ion beam extraction into vacuum we have suggested for the first time in 2001 [
5]. Later it has been further developed and experimentally tested at Stanford University [
6,
7], ETH, Zürich [
8,
9], Technical University, Darmstadt [
10].
The original, very compact and effective RF-buncher we have proposed and numerically investigated for the first time in [
11,
12].
A detailed description of the RF-only funnel and RF-buncher technique readers can find in our recent review [
13].
In
Section 3 and
Section 4, we present results of detailed computer simulations for the full version of the double-nozzle technique, which includes the ion beam extraction using of RF-only funnel and RF-buncher. For this purpose, we used the same software that we have used in our work [
1].
Section 5 describes the numerical investigations of the possible using the GSI nozzle combined with RF-only funnel and RF-buncher in the JetRIS project at GSI.
2. General description and main design parameters
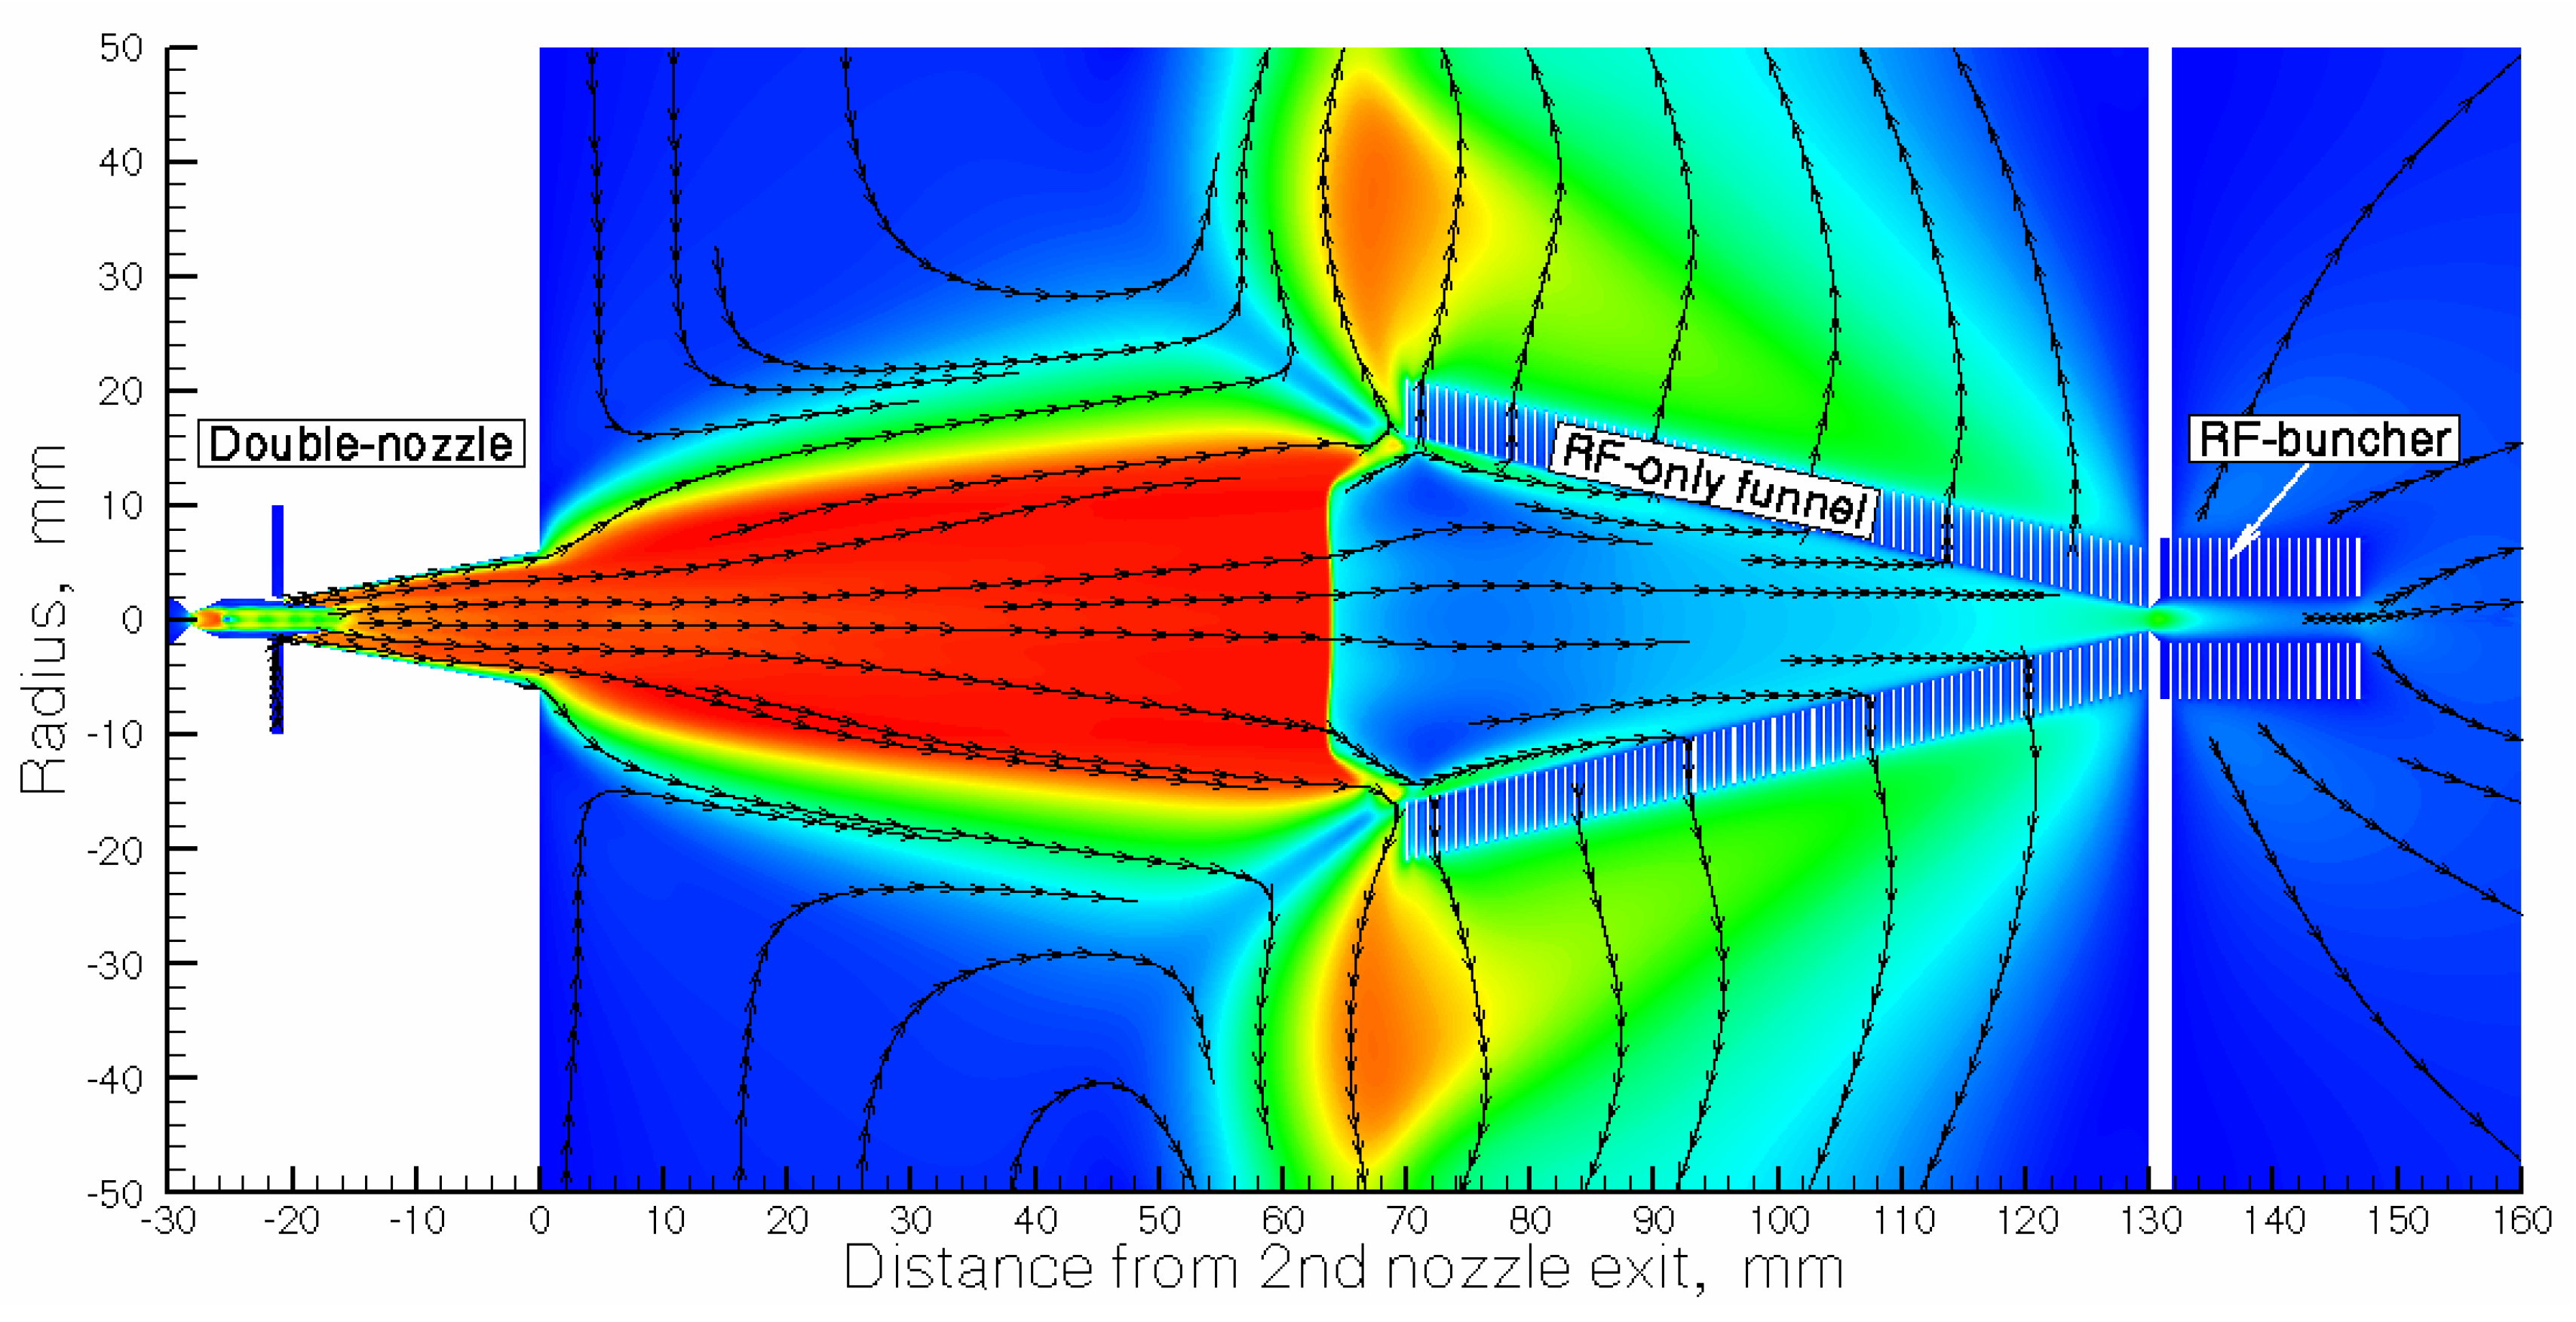
Schematic view of the full version of double-nozzle technique shown in
Figure 3. We skip a detailed description of the design of the double nozzle shown above in
Figure 1 because its exact geometry listed in
Table 1 of Ref. [
1].
The RF-only funnel and the RF-buncher installed at the jet axis have the length of 60 mm and 16 mm, correspondingly. The distance between the exit of the 2nd nozzle and the funnel entrance is 70 mm. Stainless steel funnel electrodes of 0.2 mm thickness have a shape of rings with decreasing diameters in direction to the funnel exit, but all ring-electrodes have the same width of 5 mm (it is the difference between outer and inner ring's radius). Electrodes of the RF-buncher are similar to electrodes of the RF-only funnel, but have the cylindrical geometry, when all electrodes have a constant inner diameter of 4 mm.
Each ring-electrode has two supporting legs of about 3 ÷ 6 mm width for their assembling into the funnel and buncher stacks on the supporting rods. The assembly of electrodes into the funnel and buncher can be done similarly as it is described in detail in [
10], in particular, shown there in the photographs of
Figure 4.
Main design parameters of the RF-only funnel and RF-buncher listed in
Table 1.
Table 1.
Main design parameters of the RF-only funnel and RF-buncher.
Table 1.
Main design parameters of the RF-only funnel and RF-buncher.
| |
Rf-only funnel |
RF-buncher |
| Entrance aperture diameter (mm) |
32 |
4 |
| Exit aperture diameter (mm) |
2 |
4 |
| Electrode thickness (mm) |
0.2 |
0,2 |
| Inter-electrode spacing (mm) |
0.6 |
0.6 |
| Number of electrodes |
75 |
20 |
Taking into account that the exit aperture of the RF-only funnel has a diameter of 2 mm, the Laser-1 beam inserted through this aperture into the gas-jet chamber must have some small divergence in order to cover the nobelium atoms inside the supersonic jet in the region of their ionization. It can be realized by optics, when the Laser-1 beam has focus at about 2 mm distance downstream the RF-buncher exit and then diverge and pass through the RF-buncher and RF-only funnel with a half-divergence angle of 3.2°. In this case, the Laser-1 beam will have the diameter of 12 mm at 40 mm downstream distance from the 2nd nozzle exit. The results of Monte Carlo simulations presented below in the
Section 3 definitely show that this Laser-1 beam geometry suits well for excitation of nobelium atomic beam in the supersonic jet.
The extracted from the RF-buncher into vacuum of 10
-3 – 10
-4 mbar pulsed ion beam having low transverse and longitudinal emittance can be easily 90° bent by the use of a standard Quadrupole deflector, e.g., as it shown in the
Figure 1 in Ref. [
6].
4. Results of Monte Carlo trajectory simulations
Results of simulations for the atomic beam radius (90% level) for different distances from the 2nd nozzle exit and for 8 calculation variants listed in
Table 3.
As an illustration of the data in the
Table 3,
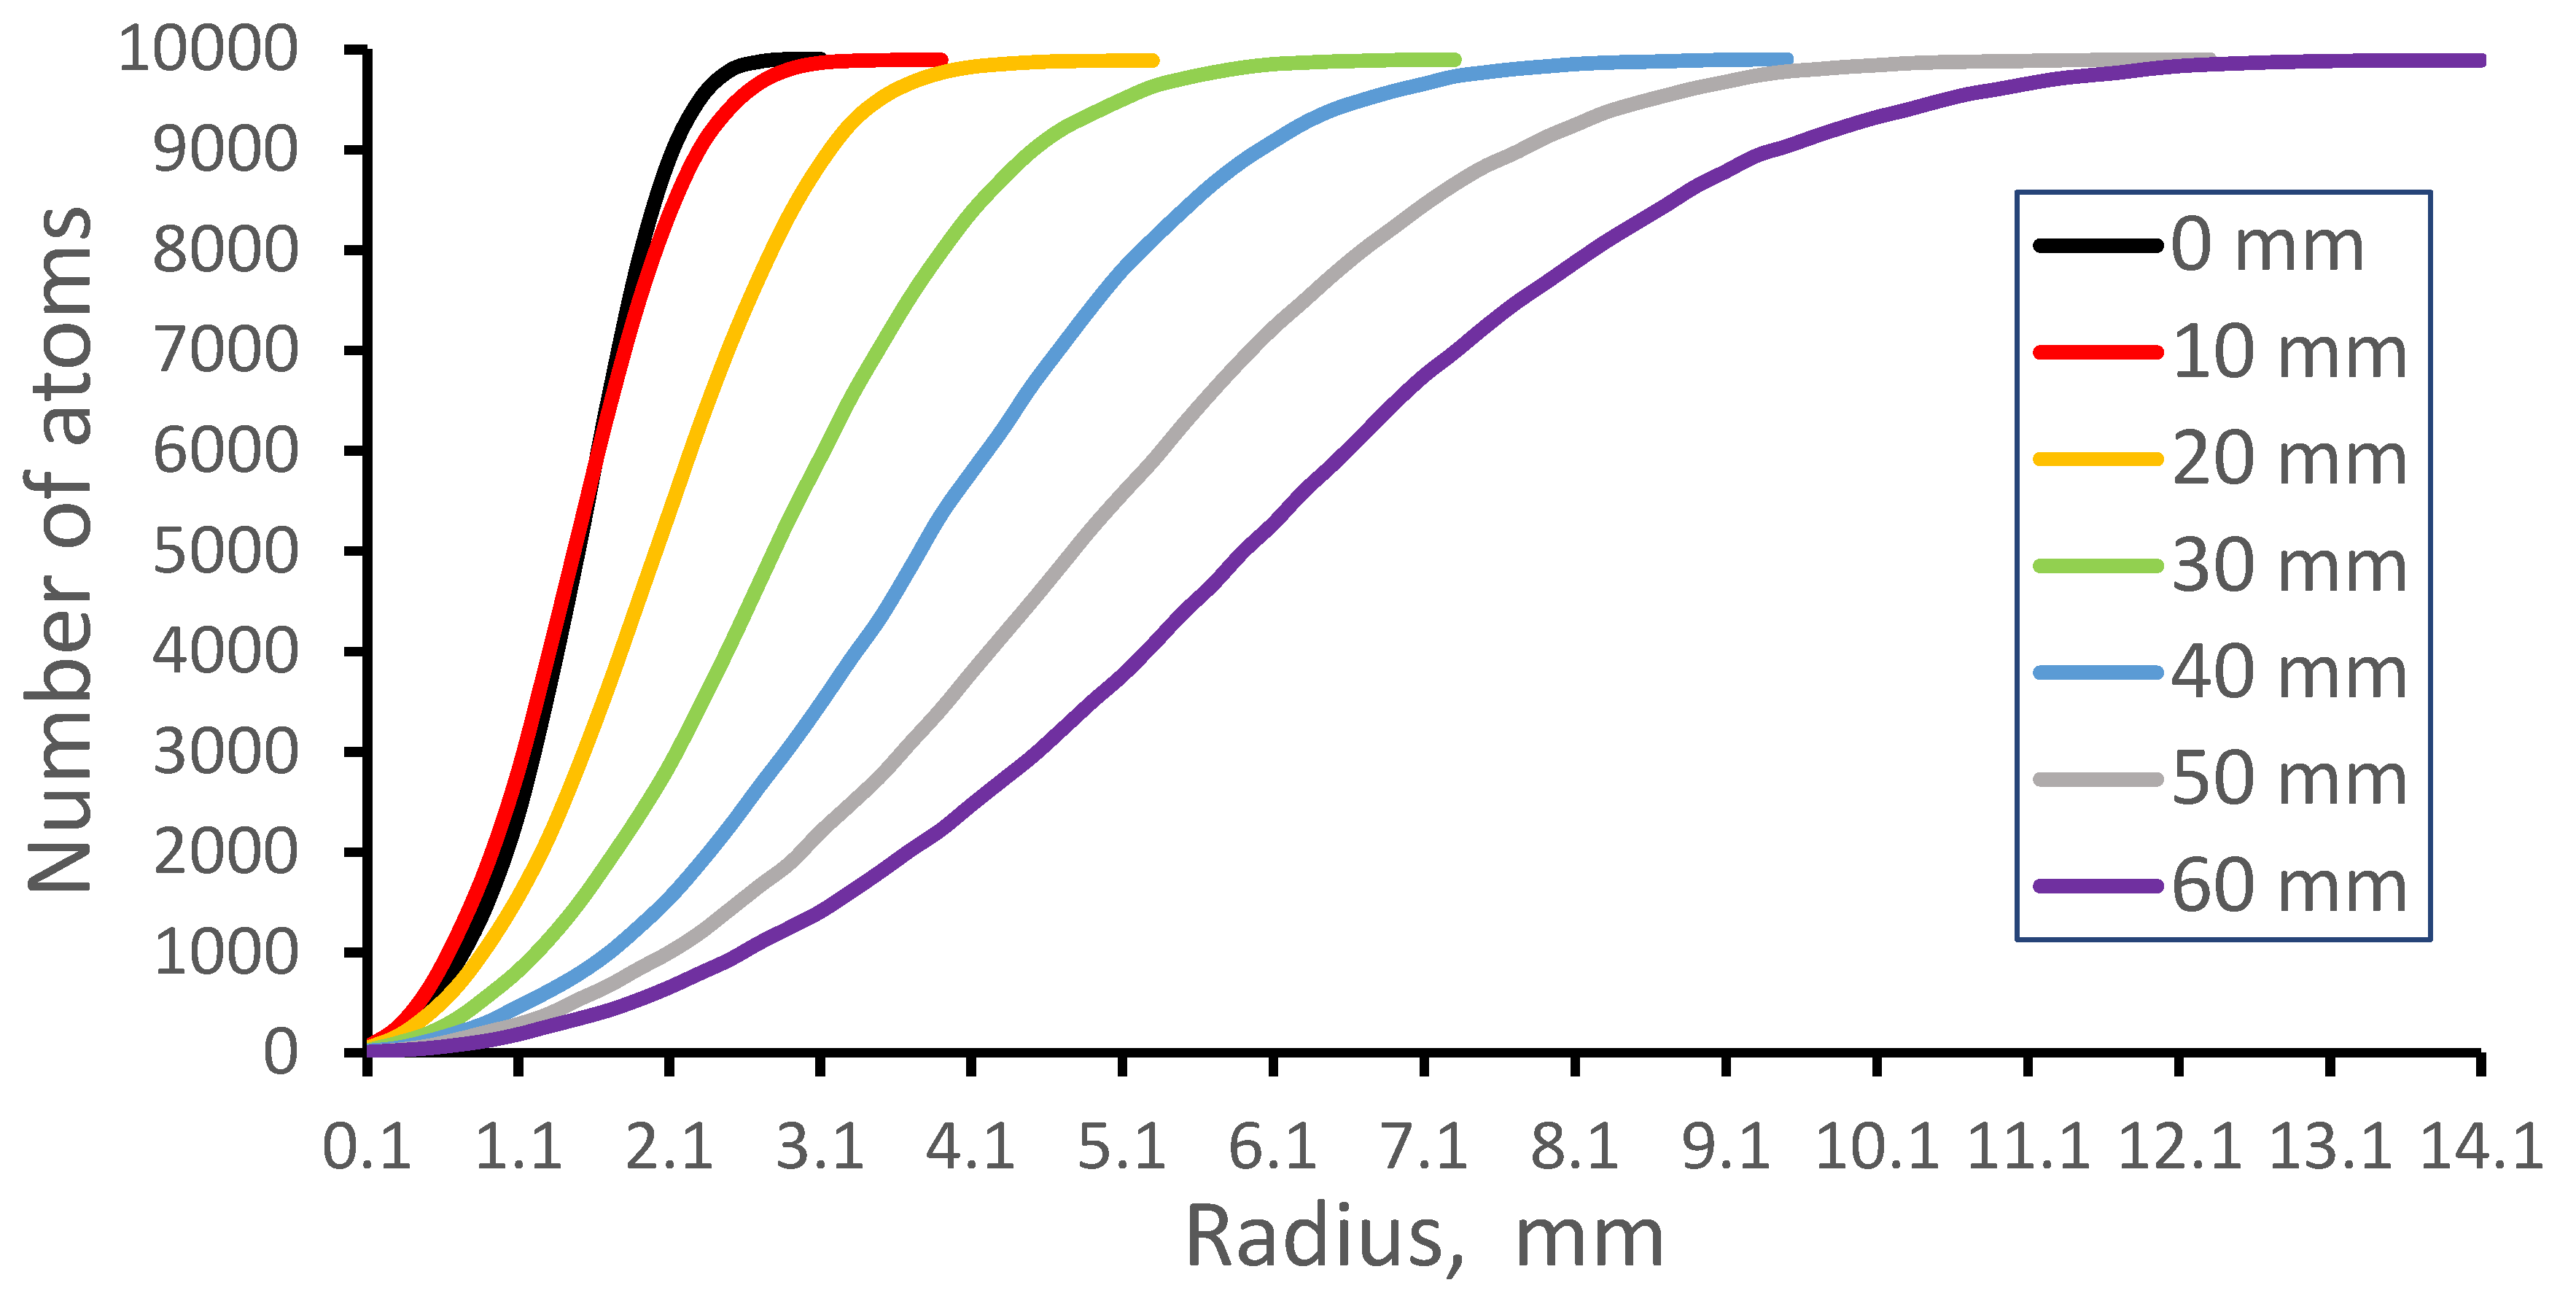
Figure 9 shows calculated cumulative radial distributions of the nobelium-254 atomic beam at different downstream distances from the 2nd nozzle exit for the calculation variant #7.
The diverging Laser-1 beam has a radius of 6 mm at 40 mm distance from the 2nd nozzle exit. Therefore, by using the data in
Figure 9 we conclude that the Laser-1 beam overlaps 87.3 % of all atoms extracted from the gas stopping cell by the gas flow and, as a result, they can be ionized in the process of two-step resonance laser ionization.
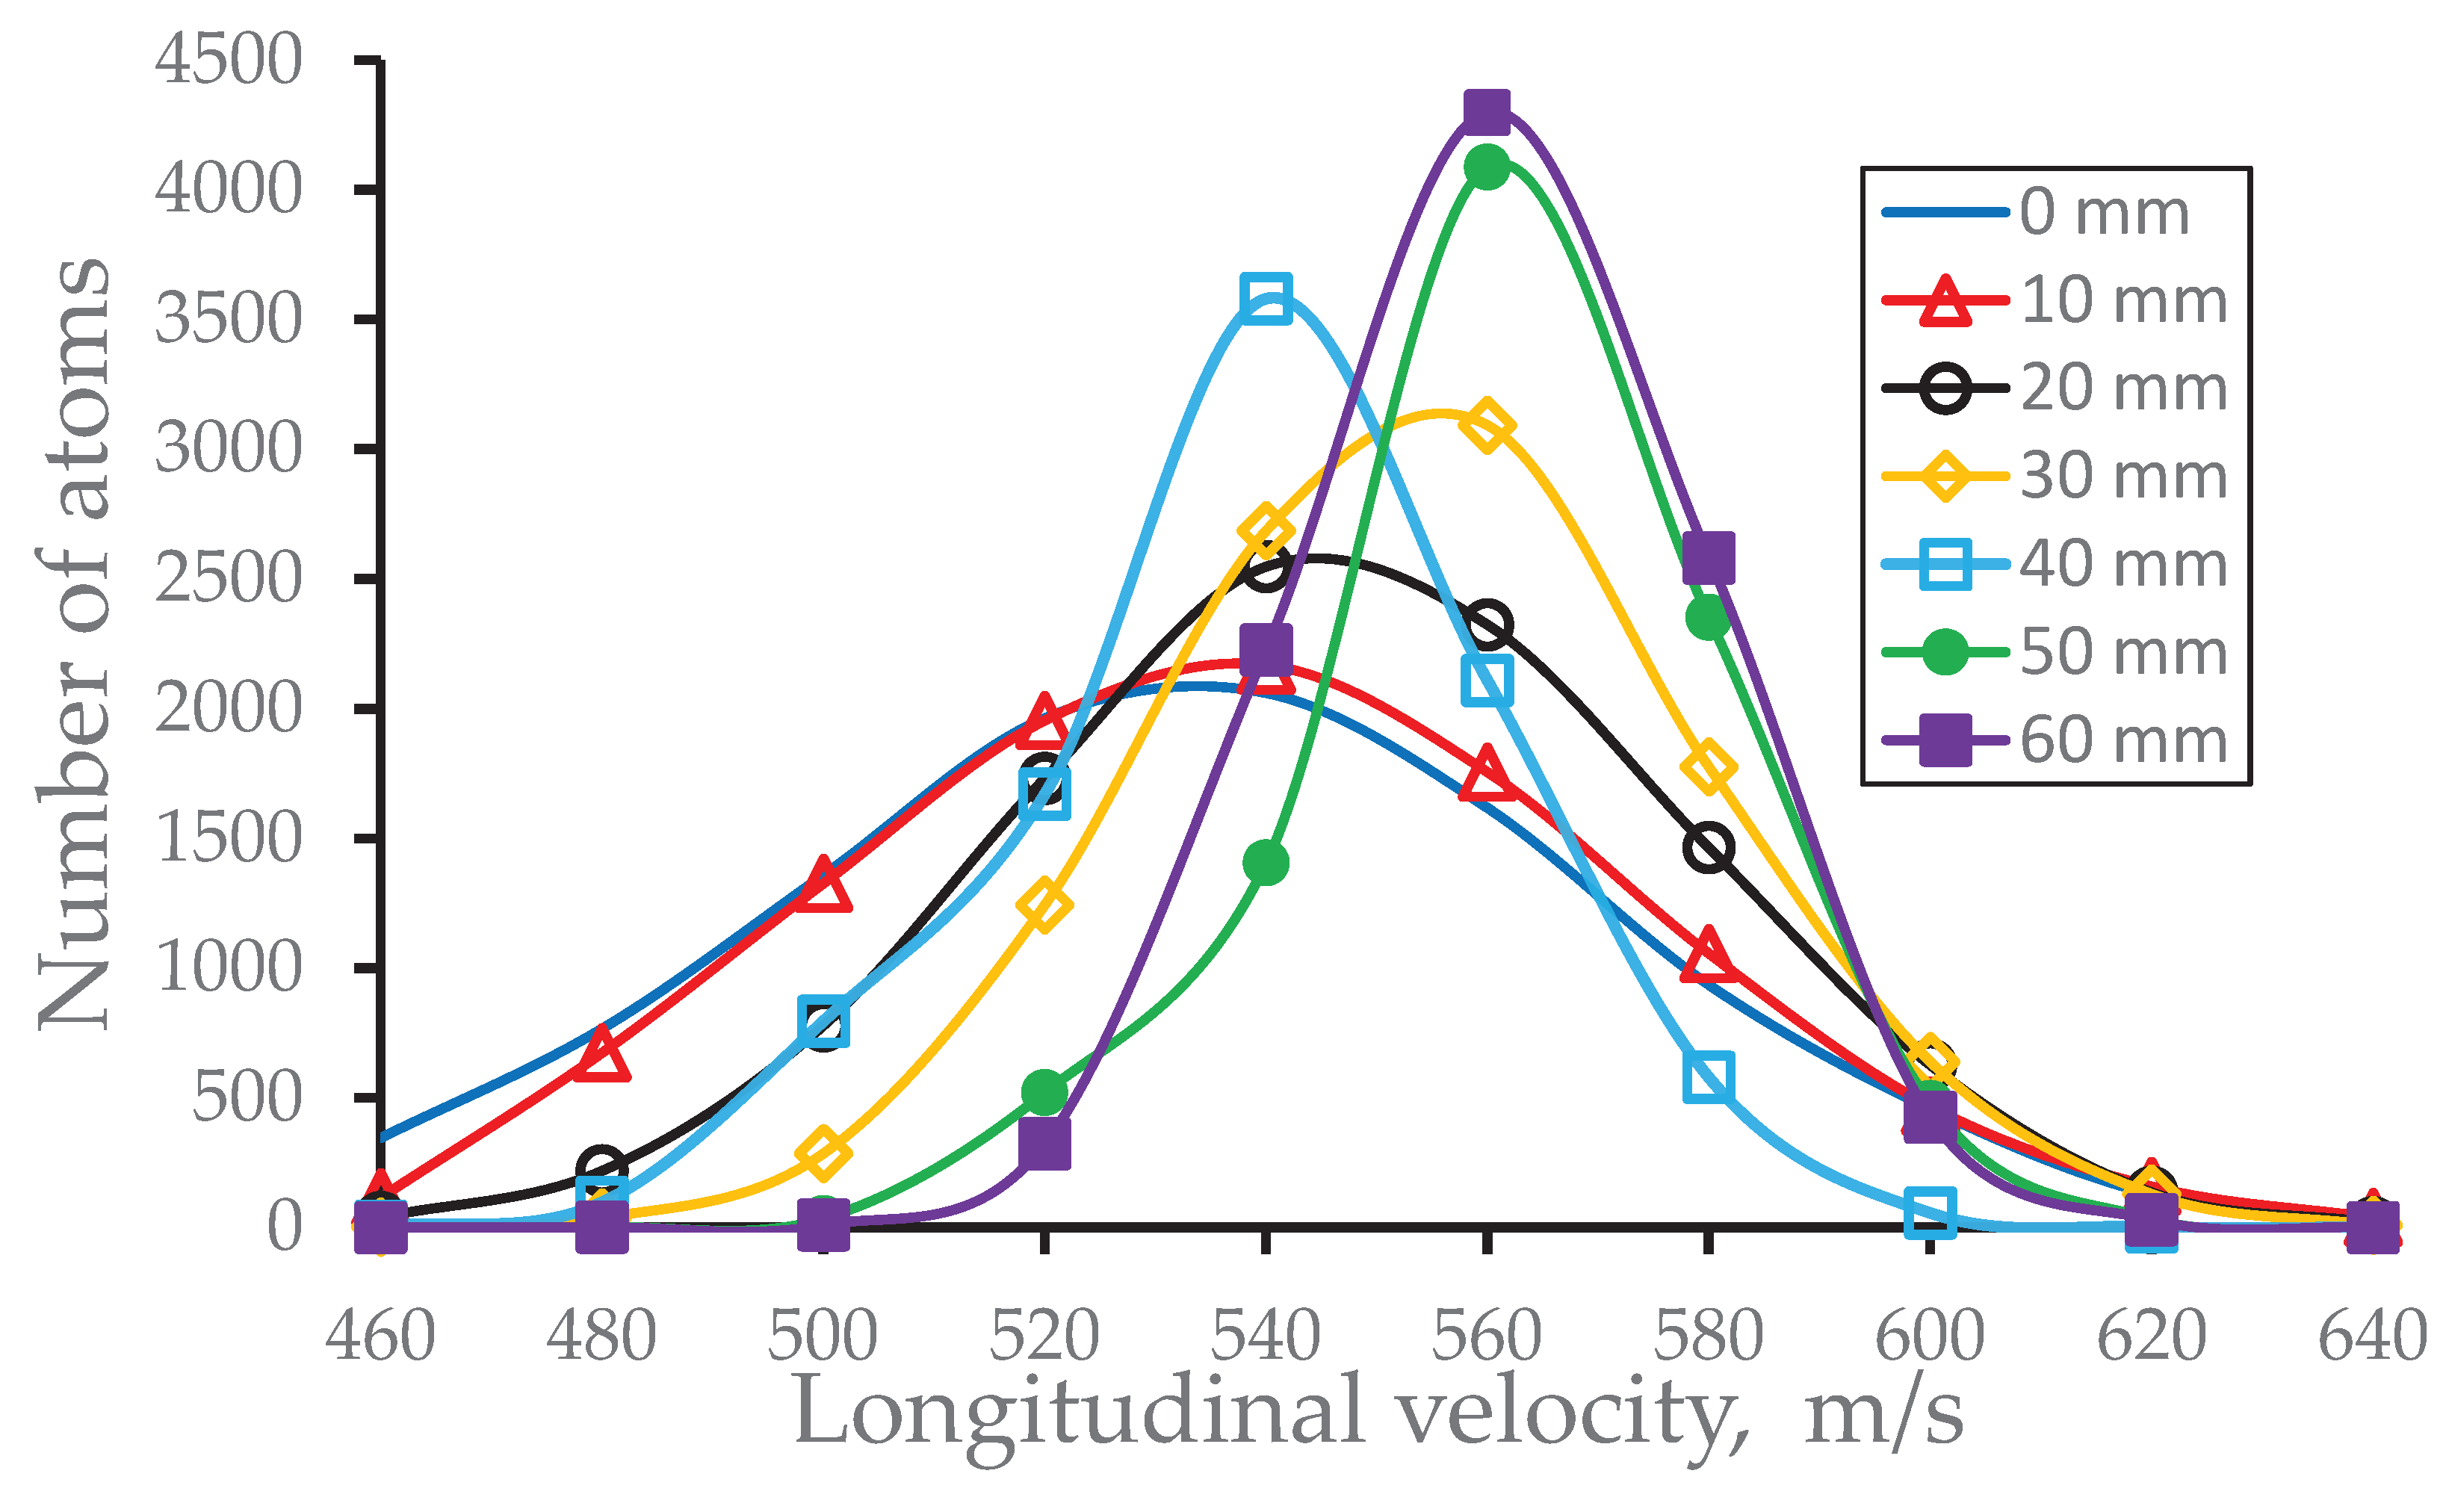
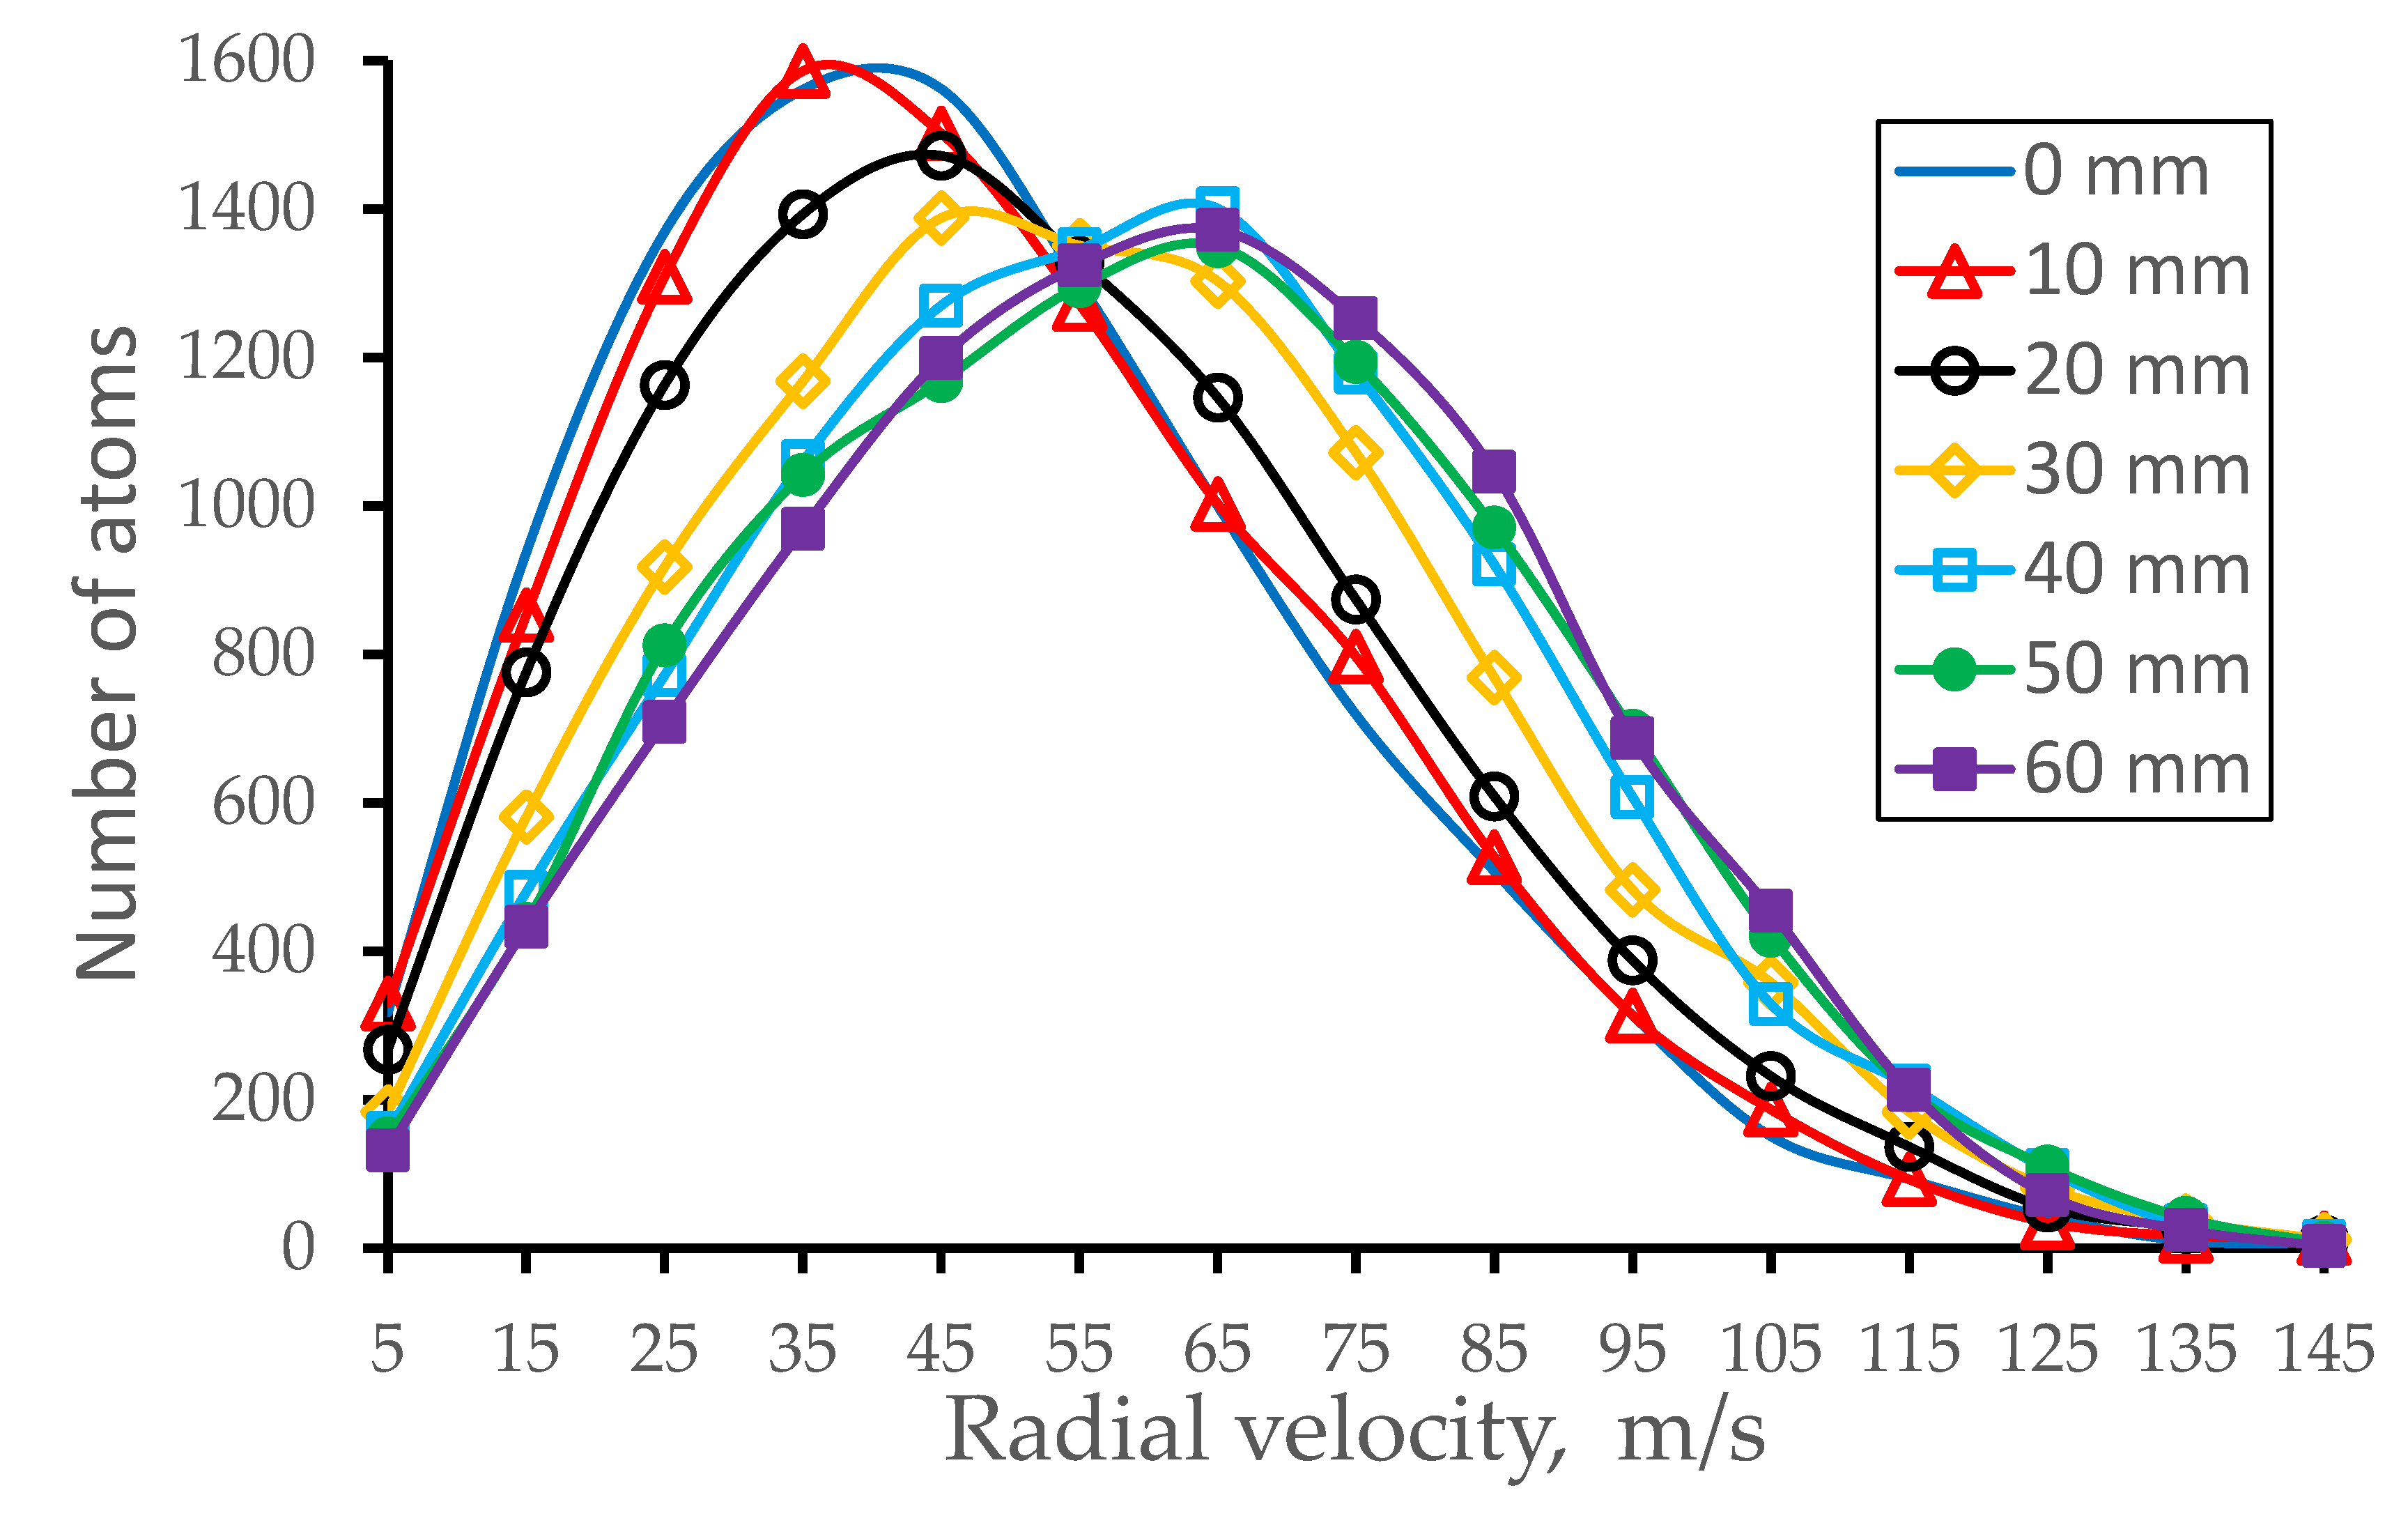
Results of Monte Carlo simulations for atomic beam longitudinal and radial velocity spreads (FWHM) as a function of the distance downstream from the 2nd nozzle exit are listed in
Table 4 and
Table 5, correspondingly. As an illustration of the data in
Table 4 and
Table 5,
Figure 10 and
Figure 11 show calculated longitudinal and radial velocity distributions of the nobelium-254 atomic beam for the calculation variant #7.
Table 6 presents results of Monte Carlo simulations for atomic beam time of flight (µsec) starting from the gas cell nozzle throat as a function of the downstream distance from the 2nd nozzle exit for 8 calculation variants. It is clear that the length of the ionization zone of 60 mm is enough to ionize all excited by the Laser-1 nobelium atoms by the pulsed Laser-2 beam having the repetition rate of 10 kHz and enough size of diameter.
The RF frequency and voltages applied to the RF-only funnel and RF-buncher electrodes, which we used in Monte Carlo simulations, listed in
Table 7.
E.g. the calculated capacitance ot this RF-only funnel is equal to 0.235 nF that corresponds to a capacitive reactance of 135 Ώ at operating frequency of 5 MHz.
Main calculated characteristics of the extracted pulsed nobelium ion beam listed in
Table 8 and
Table 9.
We would like to emphasize that the values of total ion beam extraction efficiency into vacuum in
Table 8 include the both diffusion losses of atoms inside the double-nozzle and ions losses inside the RF-only funnel. The transmission efficiency of ions through the RF-buncher is close to 100% for all calculation variants. In other words, the total ion beam extraction efficiencies here are the ratio of the number of extracted into vacuum nobelium ions, obtained as a result of two-stage resonant laser ionization, to the number of neutral nobelium atoms extracted by the gas flow from the gas cell.
5. Perspectives of the using the RF-only funnel and RF-buncher for the JetRIS project at GSI
To check an efficiency of the possible using the described above RF-only funnel and RF-buncher in the JetRIS project with the GSI nozzle, we performed gas dynamic and Monte Carlo simulations, which are similar to presented above for the double-nozzle technique.
The design parameters and operation conditions of RF-only funnel and RF-buncher used in these simulations are the same as listed in
Table 1 and
Table 7, correspondingly.
5.1. Results of gas dynamic simulations
Results of gas dynamic simulations for the GSI nozzle at two gas cell stagnation pressures listed in
Table 10.
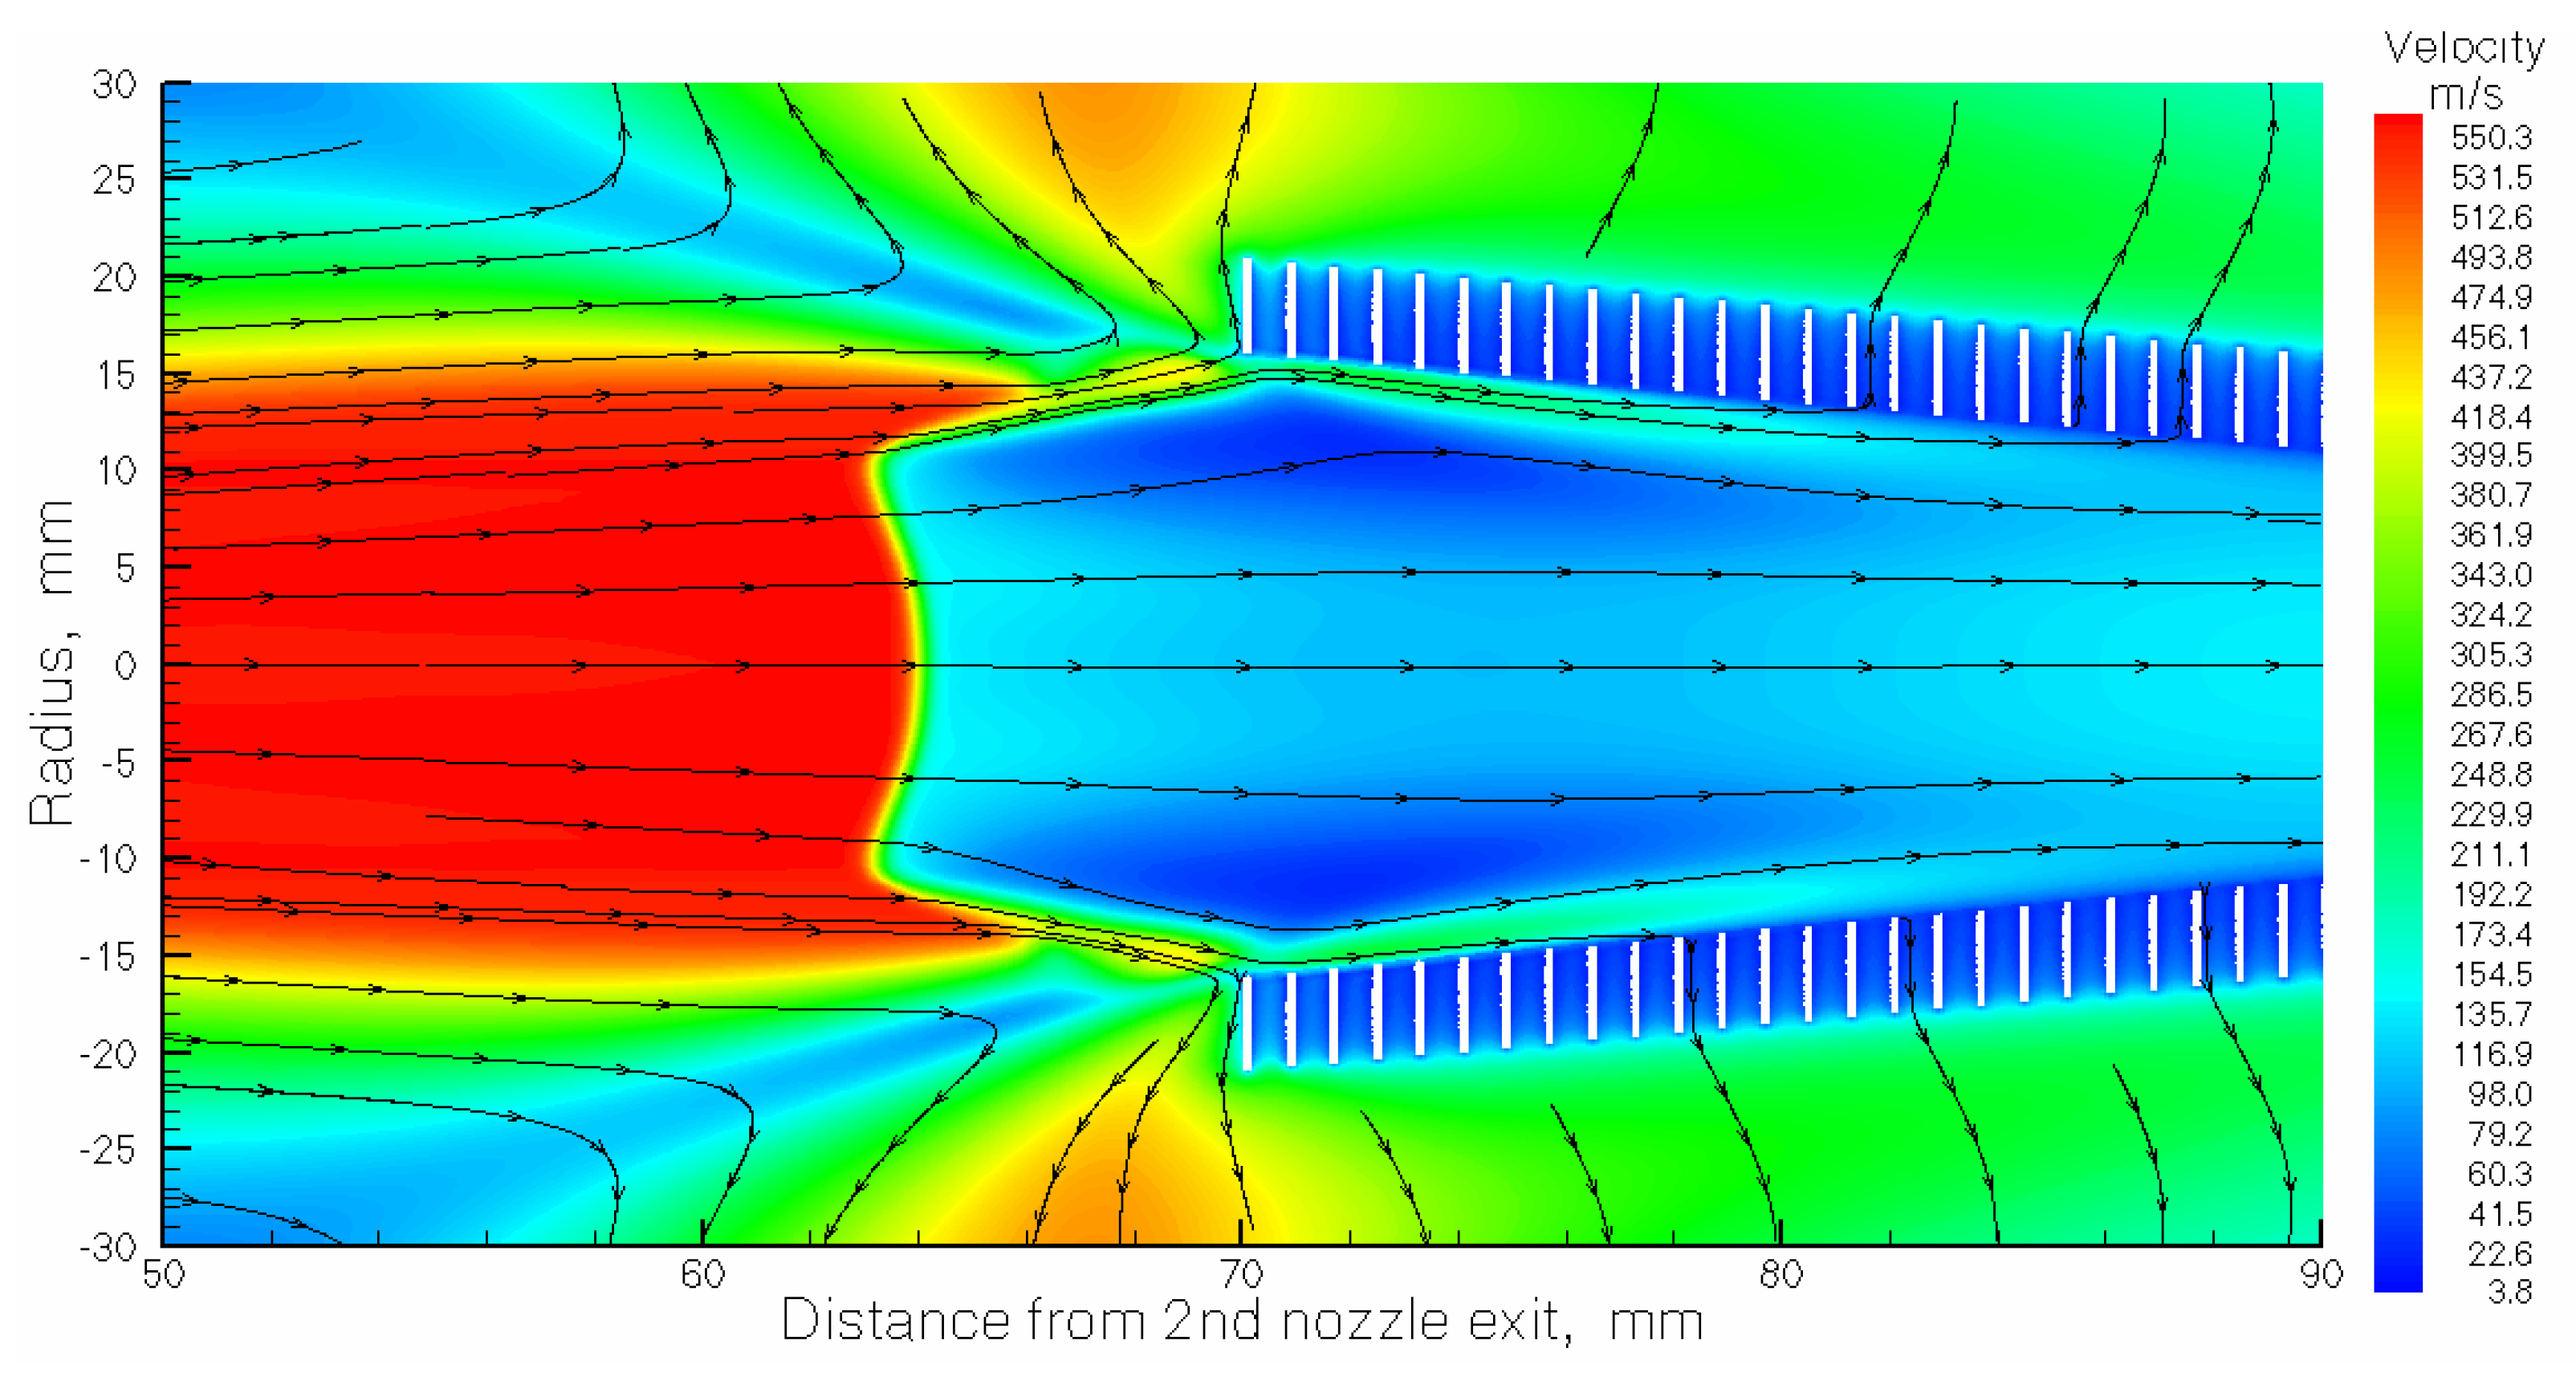
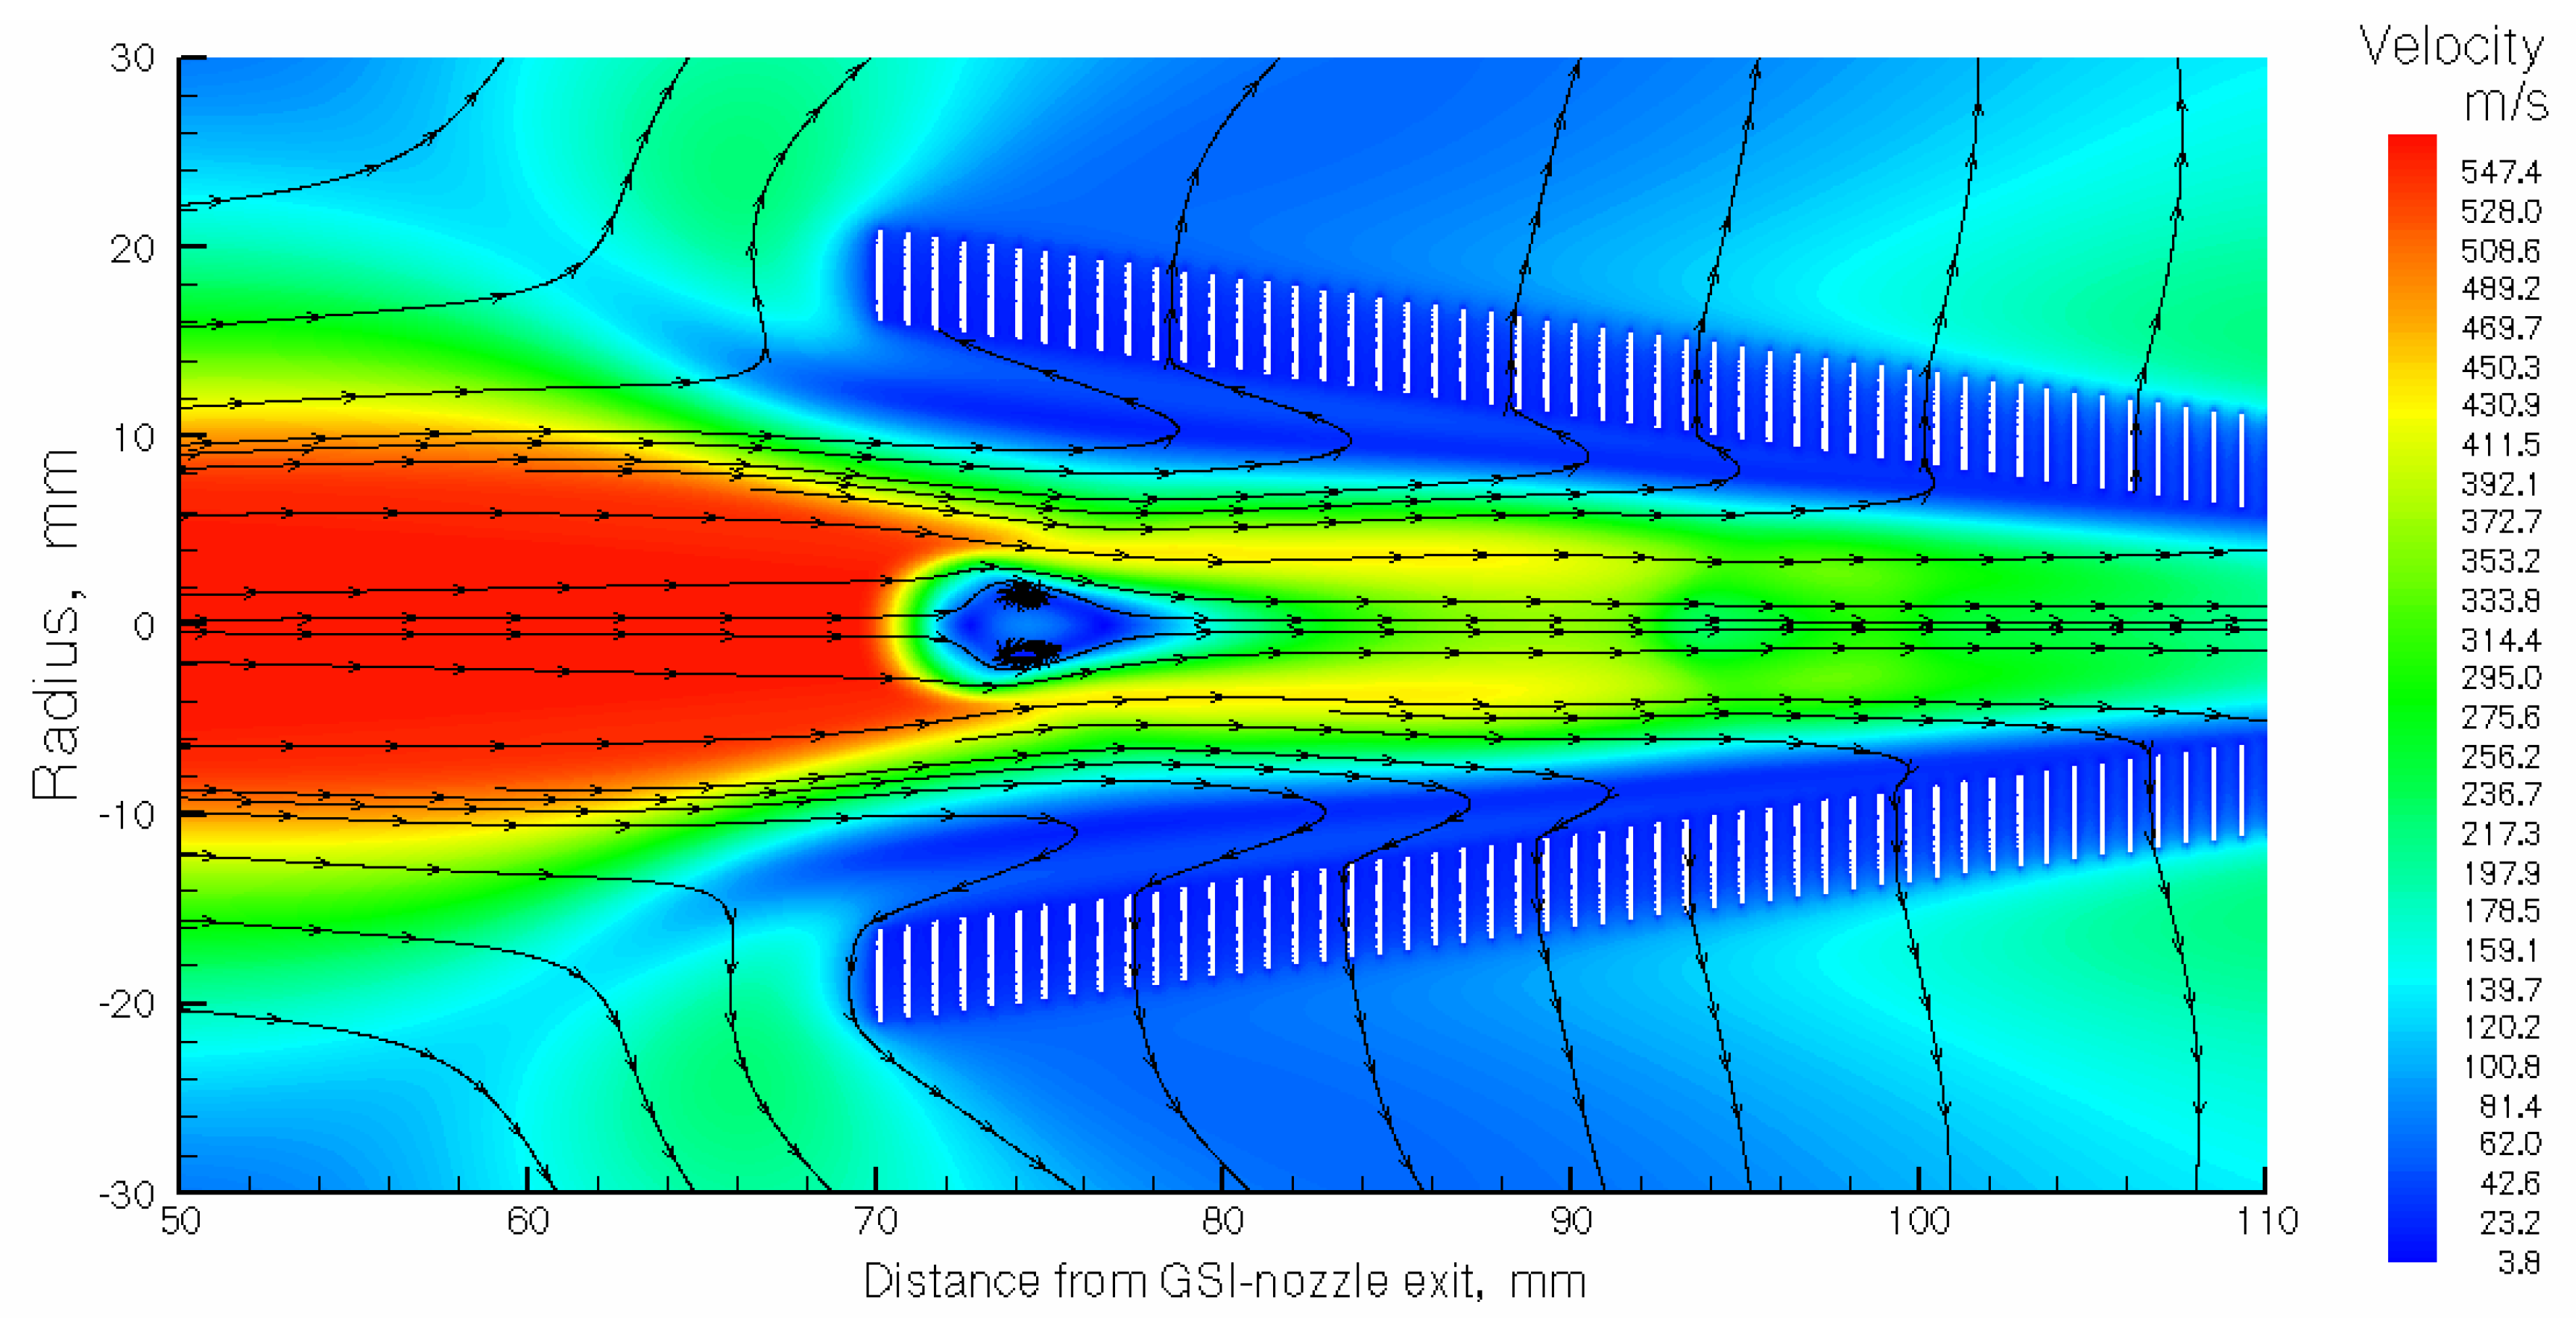
Figure 12 shows the result of gas dynamic simulation for the gas velocity flow field in the region of the RF-only funnel entrance for boundary conditions listed in
Table 10 for the stagnation gas pressure Pcell = 300 mbar. This figure demonstrates a clear difference in detailed structure of the supersonic jet flowing out of the GSI nozzle compared to that one for the case of the double-nozzle operation shown in
Figure 8 for the calculation variant #7 (see
Table 2).
5.2. Results of Monte Carlo simulations
Table 11 and 12 present results of Monte Carlo simulations for nobelium-254 atomic beam parameters for different downstream distances from the GSI nozzle exit.
Table 11.
Results of simulations for nobelium-254 atomic beam parameters for different downstream distances from the GSI nozzle exit. Stagnation pressure Pcell = 200 mbar, background pressure Pbg = 0.0179 mbar, the nozzle temperature T0 =296 K. Number of calculated ions is 10000 for each distance.
Table 11.
Results of simulations for nobelium-254 atomic beam parameters for different downstream distances from the GSI nozzle exit. Stagnation pressure Pcell = 200 mbar, background pressure Pbg = 0.0179 mbar, the nozzle temperature T0 =296 K. Number of calculated ions is 10000 for each distance.
| Distance from GSI nozzle exit (mm) |
0 |
10 |
20 |
30 |
40 |
50 |
60 |
| Beam radius (90%) (mm) |
1.68 |
3.8 |
6.68 |
9.27 |
11.06 |
12.4 |
13.12 |
| Longitudinal velocity spread (FWHM) (m/s) |
91.2 |
59.0 |
43.3 |
40.2 |
40.6 |
44.1 |
56.0 |
| Radial velocity spread (FWHM) (m/s) |
65.1 |
99.8 |
99.2 |
85.0 |
58.0 |
51.0 |
59.4 |
| Time of flight (µs) |
44 |
60 |
80 |
96 |
116 |
132 |
152 |
Table 12.
Results of simulations for nobelium-254 atomic beam parameters for different downstream distances from the GSI nozzle exit. Stagnation pressure Pcell = 300 mbar, background pressure Pbg = 0.0268 mbar, the nozzle temperature T0 =296 K. Number of calculated ions is 10000 for each distance.
Table 12.
Results of simulations for nobelium-254 atomic beam parameters for different downstream distances from the GSI nozzle exit. Stagnation pressure Pcell = 300 mbar, background pressure Pbg = 0.0268 mbar, the nozzle temperature T0 =296 K. Number of calculated ions is 10000 for each distance.
| Distance from GSI nozzle exit (mm) |
0 |
10 |
20 |
30 |
40 |
50 |
60 |
| Beam radius (90%) (mm) |
1.67 |
3.6 |
6.1 |
8.4 |
10.3 |
11.8 |
11.8 |
| Longitudinal velocity spread (FWHM) (m/s) |
84.3 |
55.1 |
51.4 |
47.8 |
38.1 |
40.0 |
43,6 |
| Radial velocity spread (FWHM) (m/s) |
56.9 |
95,9 |
97.2 |
80.5 |
71.3 |
50.7 |
44.0 |
| Time of flight (µs) |
44 |
60 |
80 |
96 |
116 |
132 |
152 |
Table 13 presents results of Monte Carlo simulations for total nobelium-254 ion beam extraction efficiencies into vacuum for different stagnation gas cell pressures P
cell.
Important note. If participants of the JetRIS project will decide, if they do ever, experimentally test the functionality of the described RF-only funnel and RF-buncher installed into their present setup with GSI nozzle, they should not be surprised, if at Pcell = 100 mbar they would not see any ions extracted from RF-buncher into vacuum.
The point is that at this stagnation pressure in the gas cell, the supersonic free jet is not powerful enough, and the viscous subsonic gas flow transporting ions is almost completely "killed"(or strongly decelerated) inside the RF-only funnel. Thus, most of the ions are lost, the gas flow rate into the RF-buncher turns out to be less than 0.01 mbar l/s, and this is insufficient for efficient ion beam bunching. We made the simulations for this pressure (Pcell = 100 mbar) as well, but we have decided not include these results in the article.
6. Discussion and Outlook
In
Section 2 of the article, we present the description of the suggested here full version of the double-nozzle technique, which schematic view shown in
Figure 3. Main design parameters of the RF-only funnel and RF-buncher listed in
Table 1. The compact RF-only funnel of 60 mm length and RF-buncher of 16 mm length have a simple design, can be easily manufactured and installed on the axis of the gas-jet chamber at 70 mm downstream distance from the exit of the double-nozzle.
Results of the gas dynamic simulations for 8 combinations of gas stagnation pressures in the gas cell (Pcell) and in the double-nozzle (Pnoz) presented in
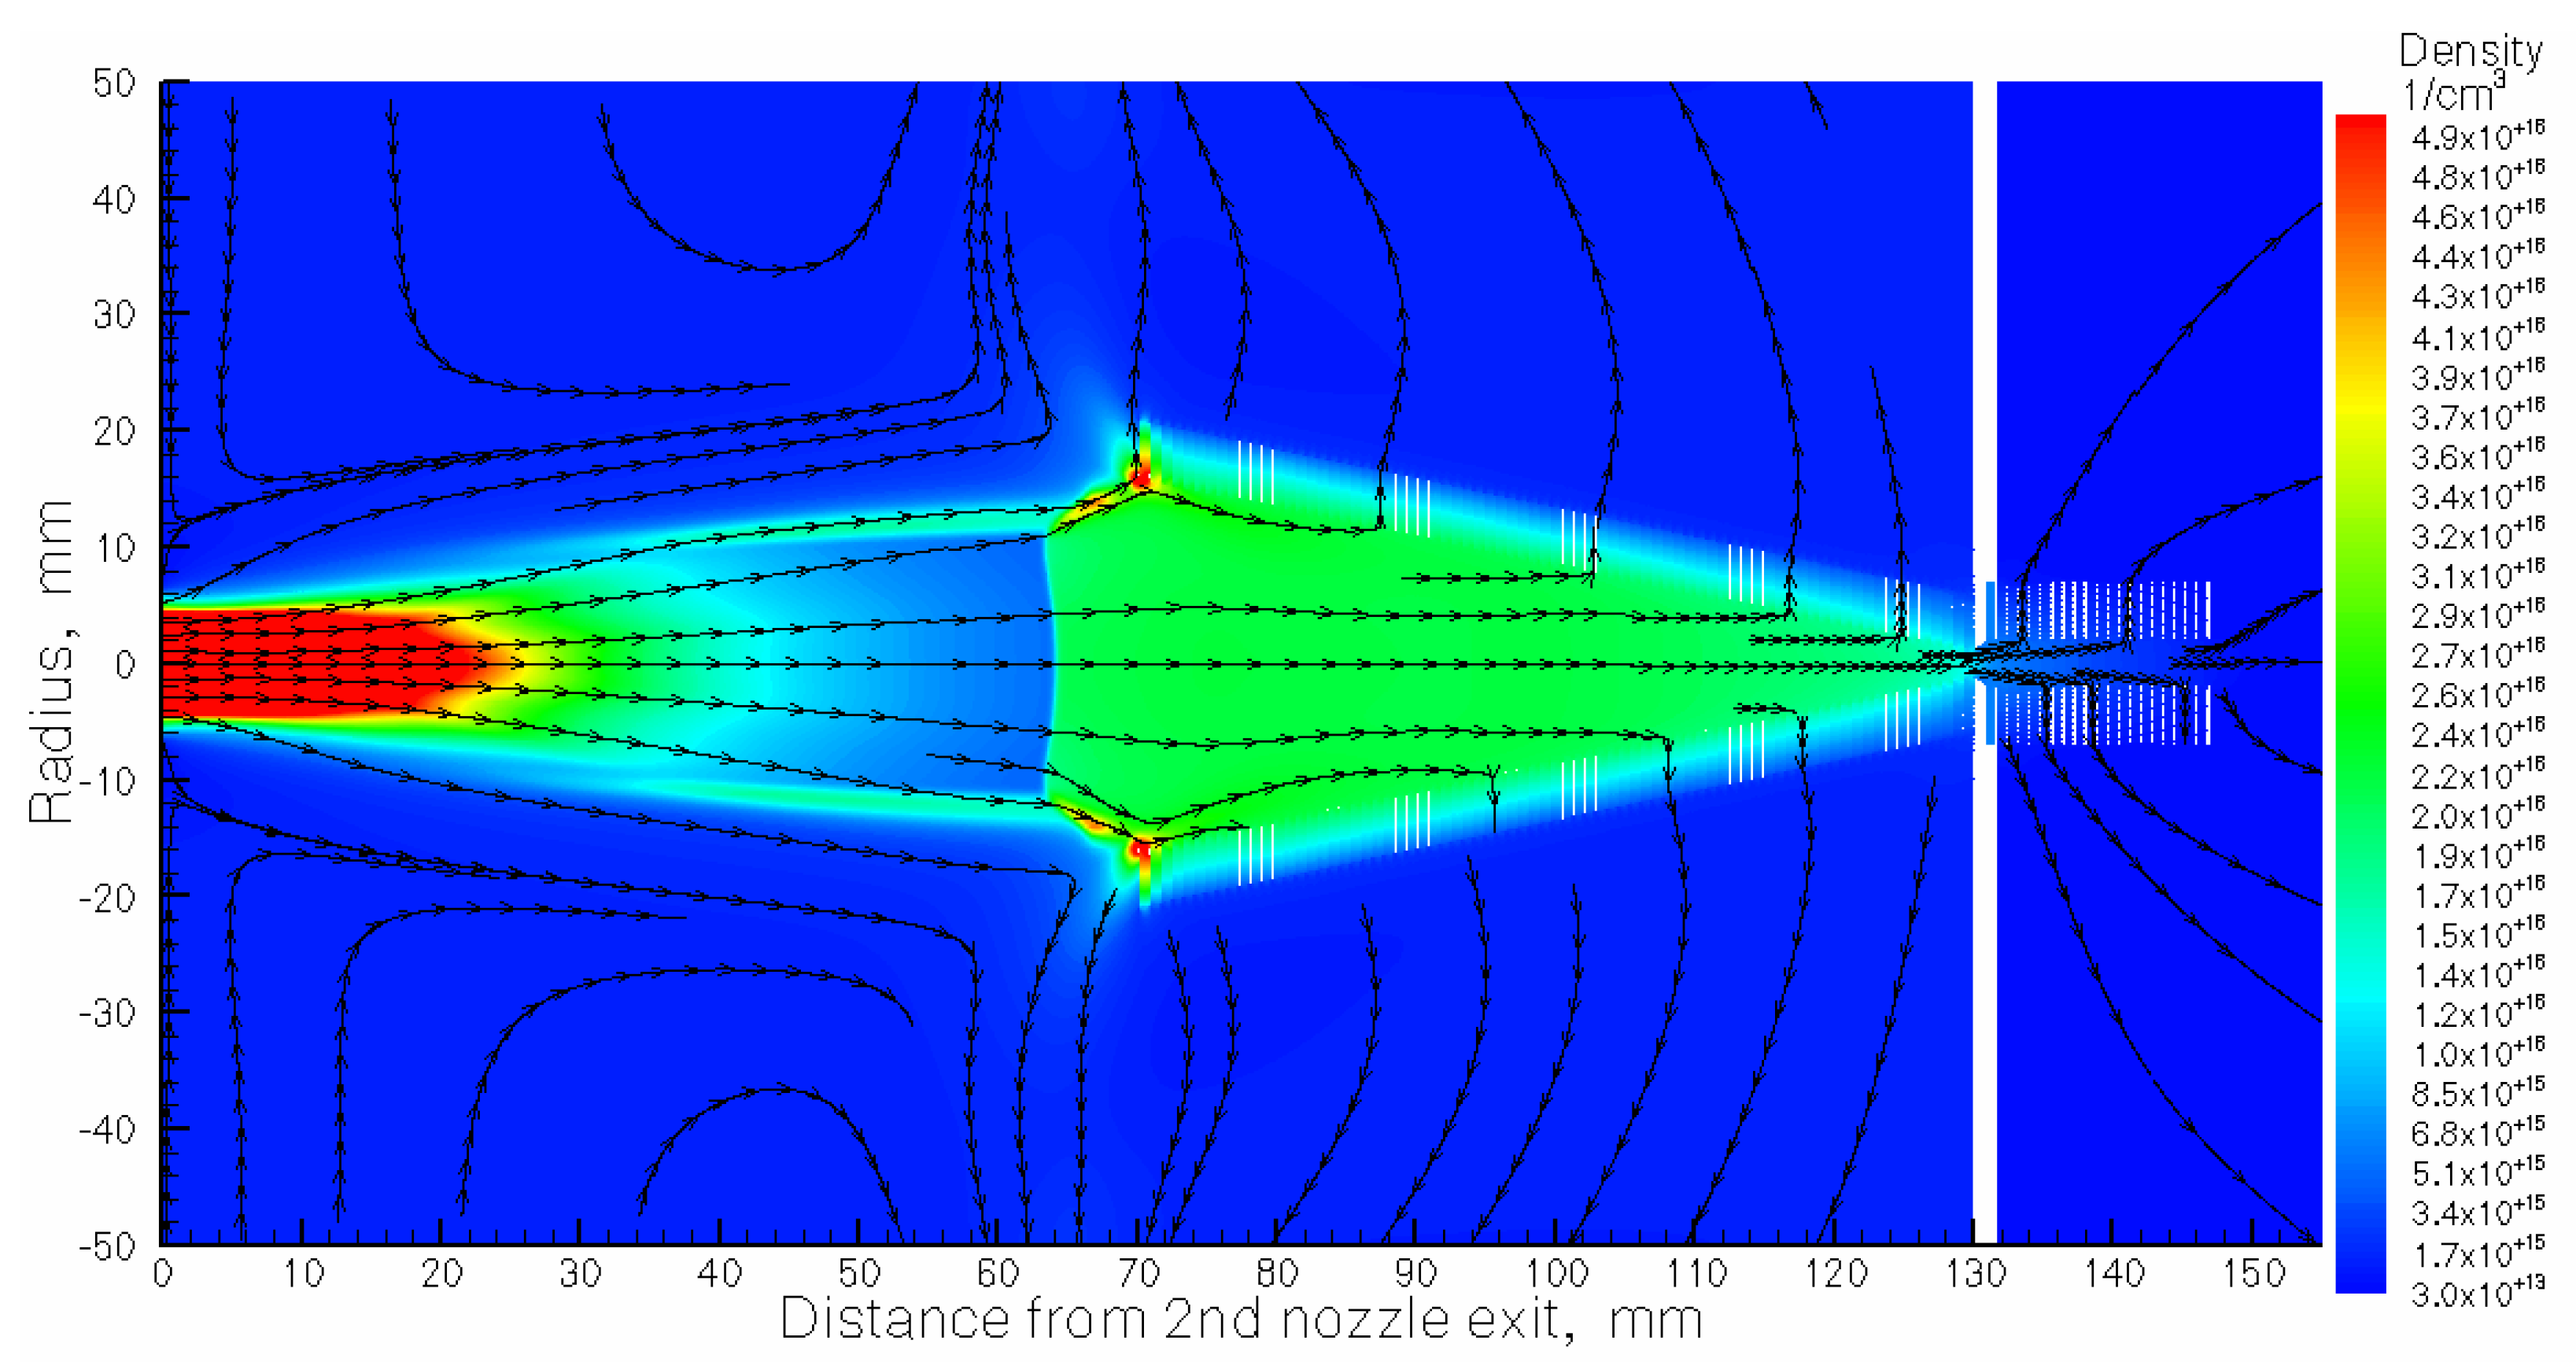
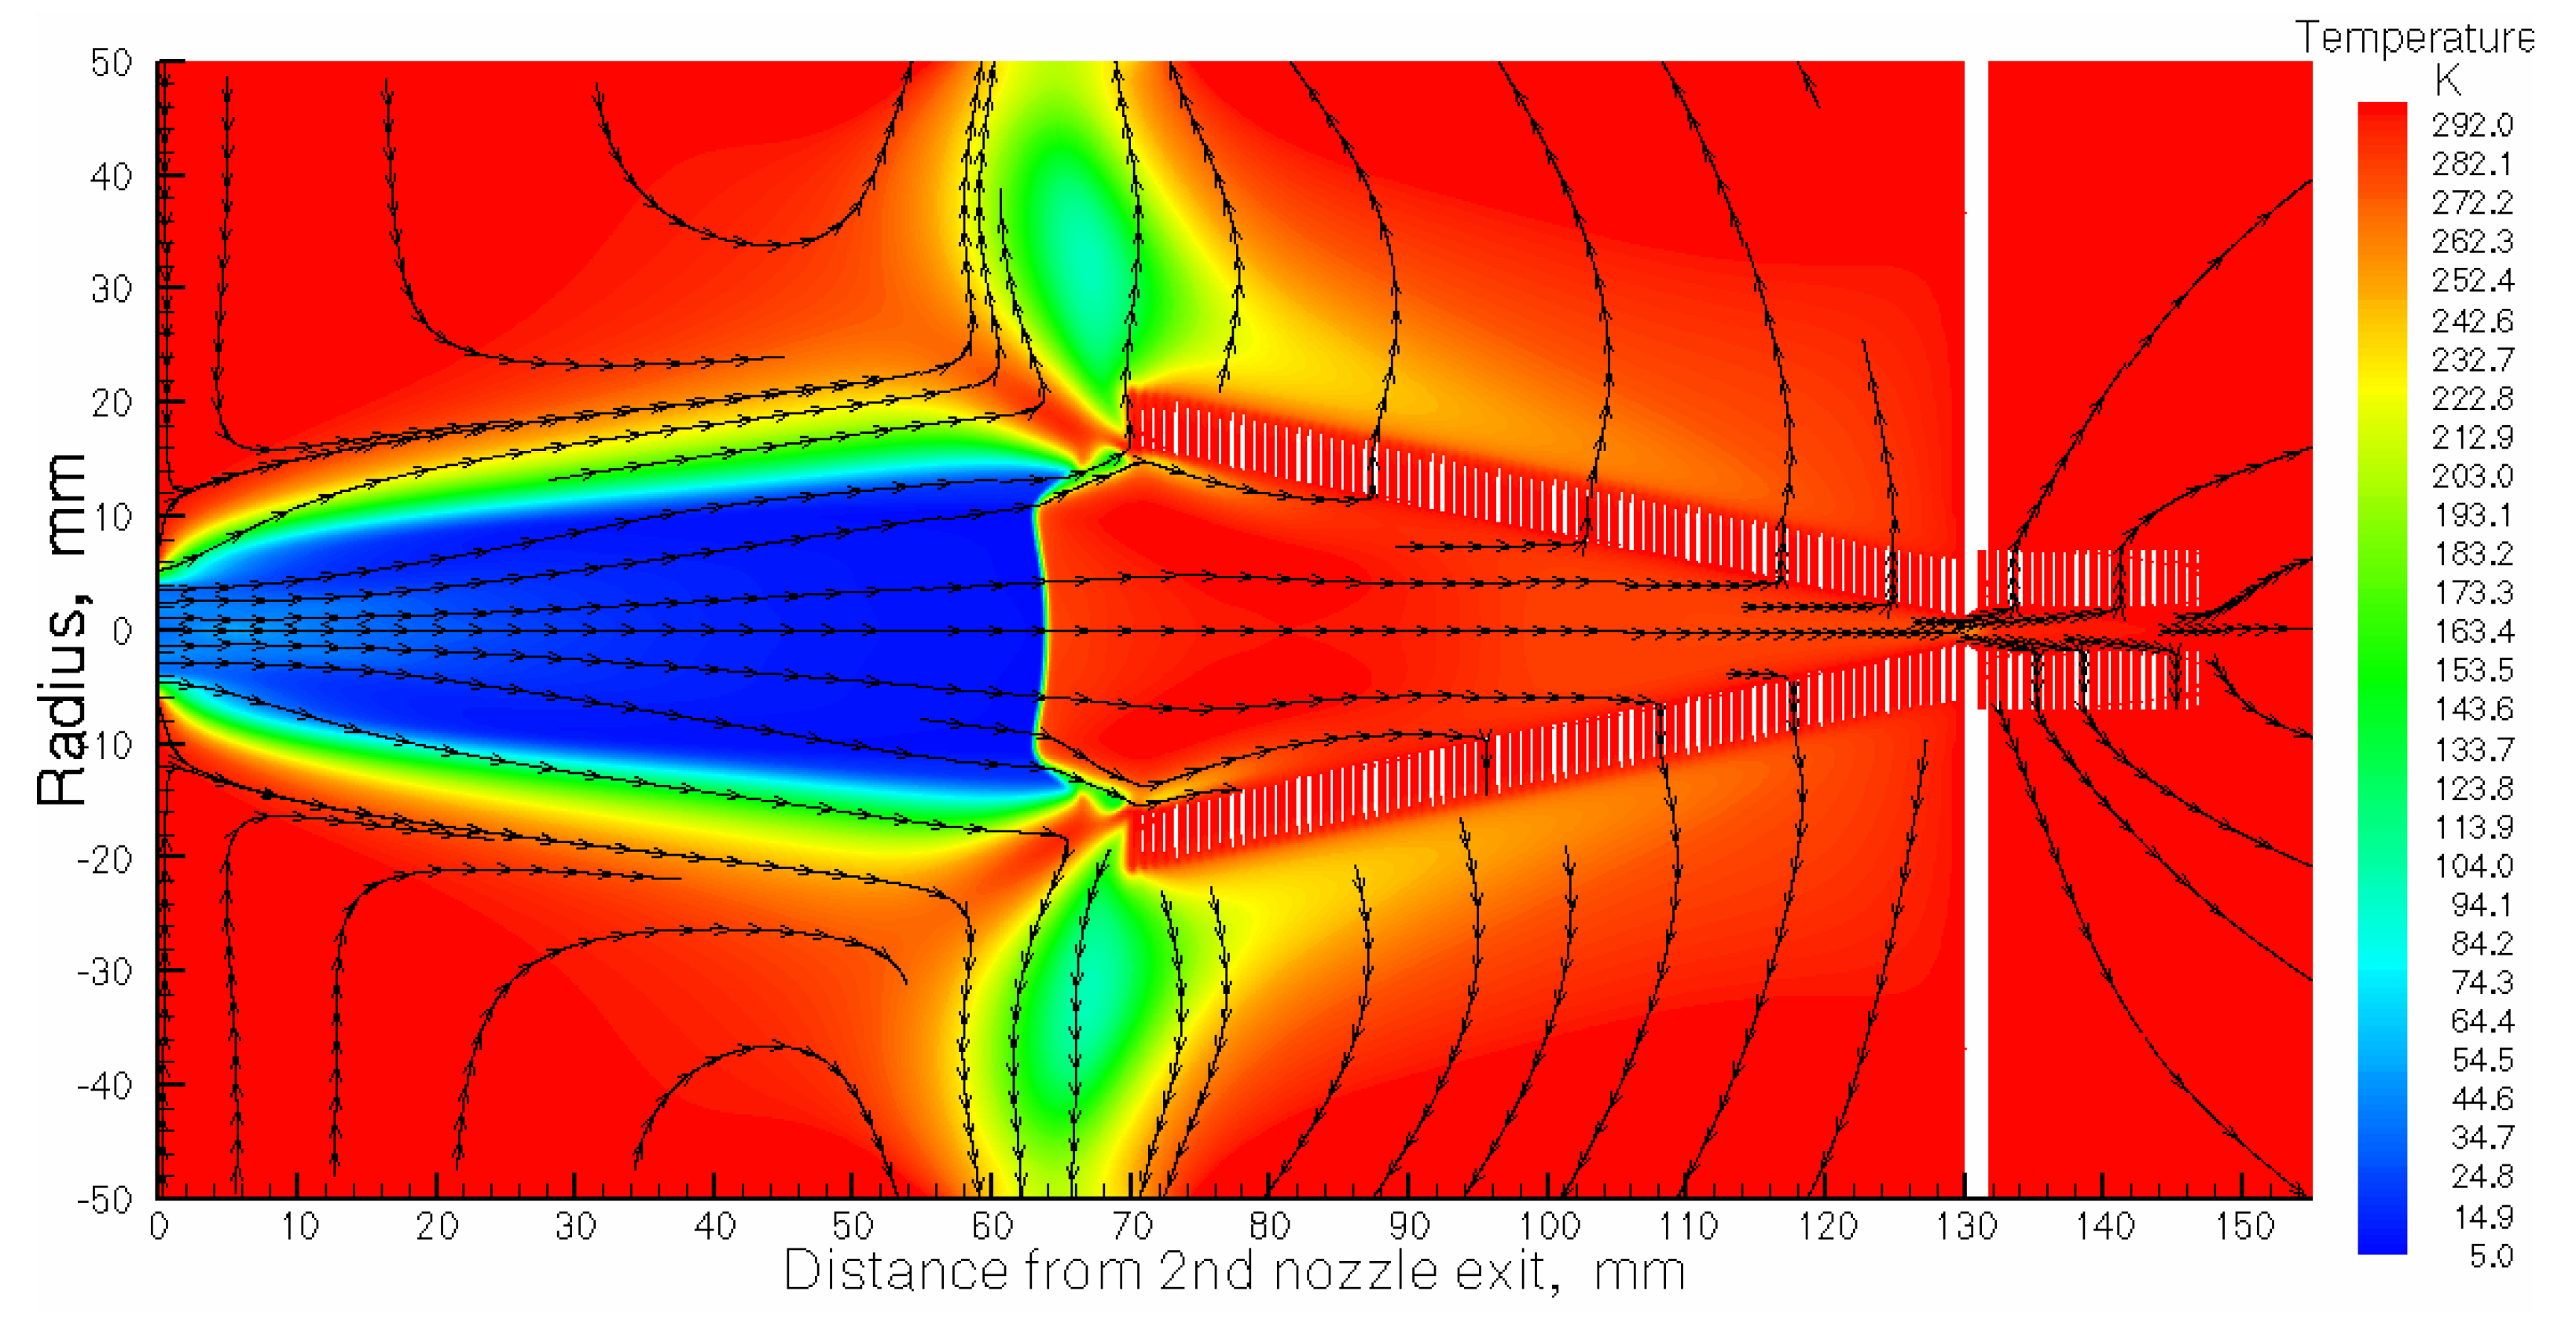
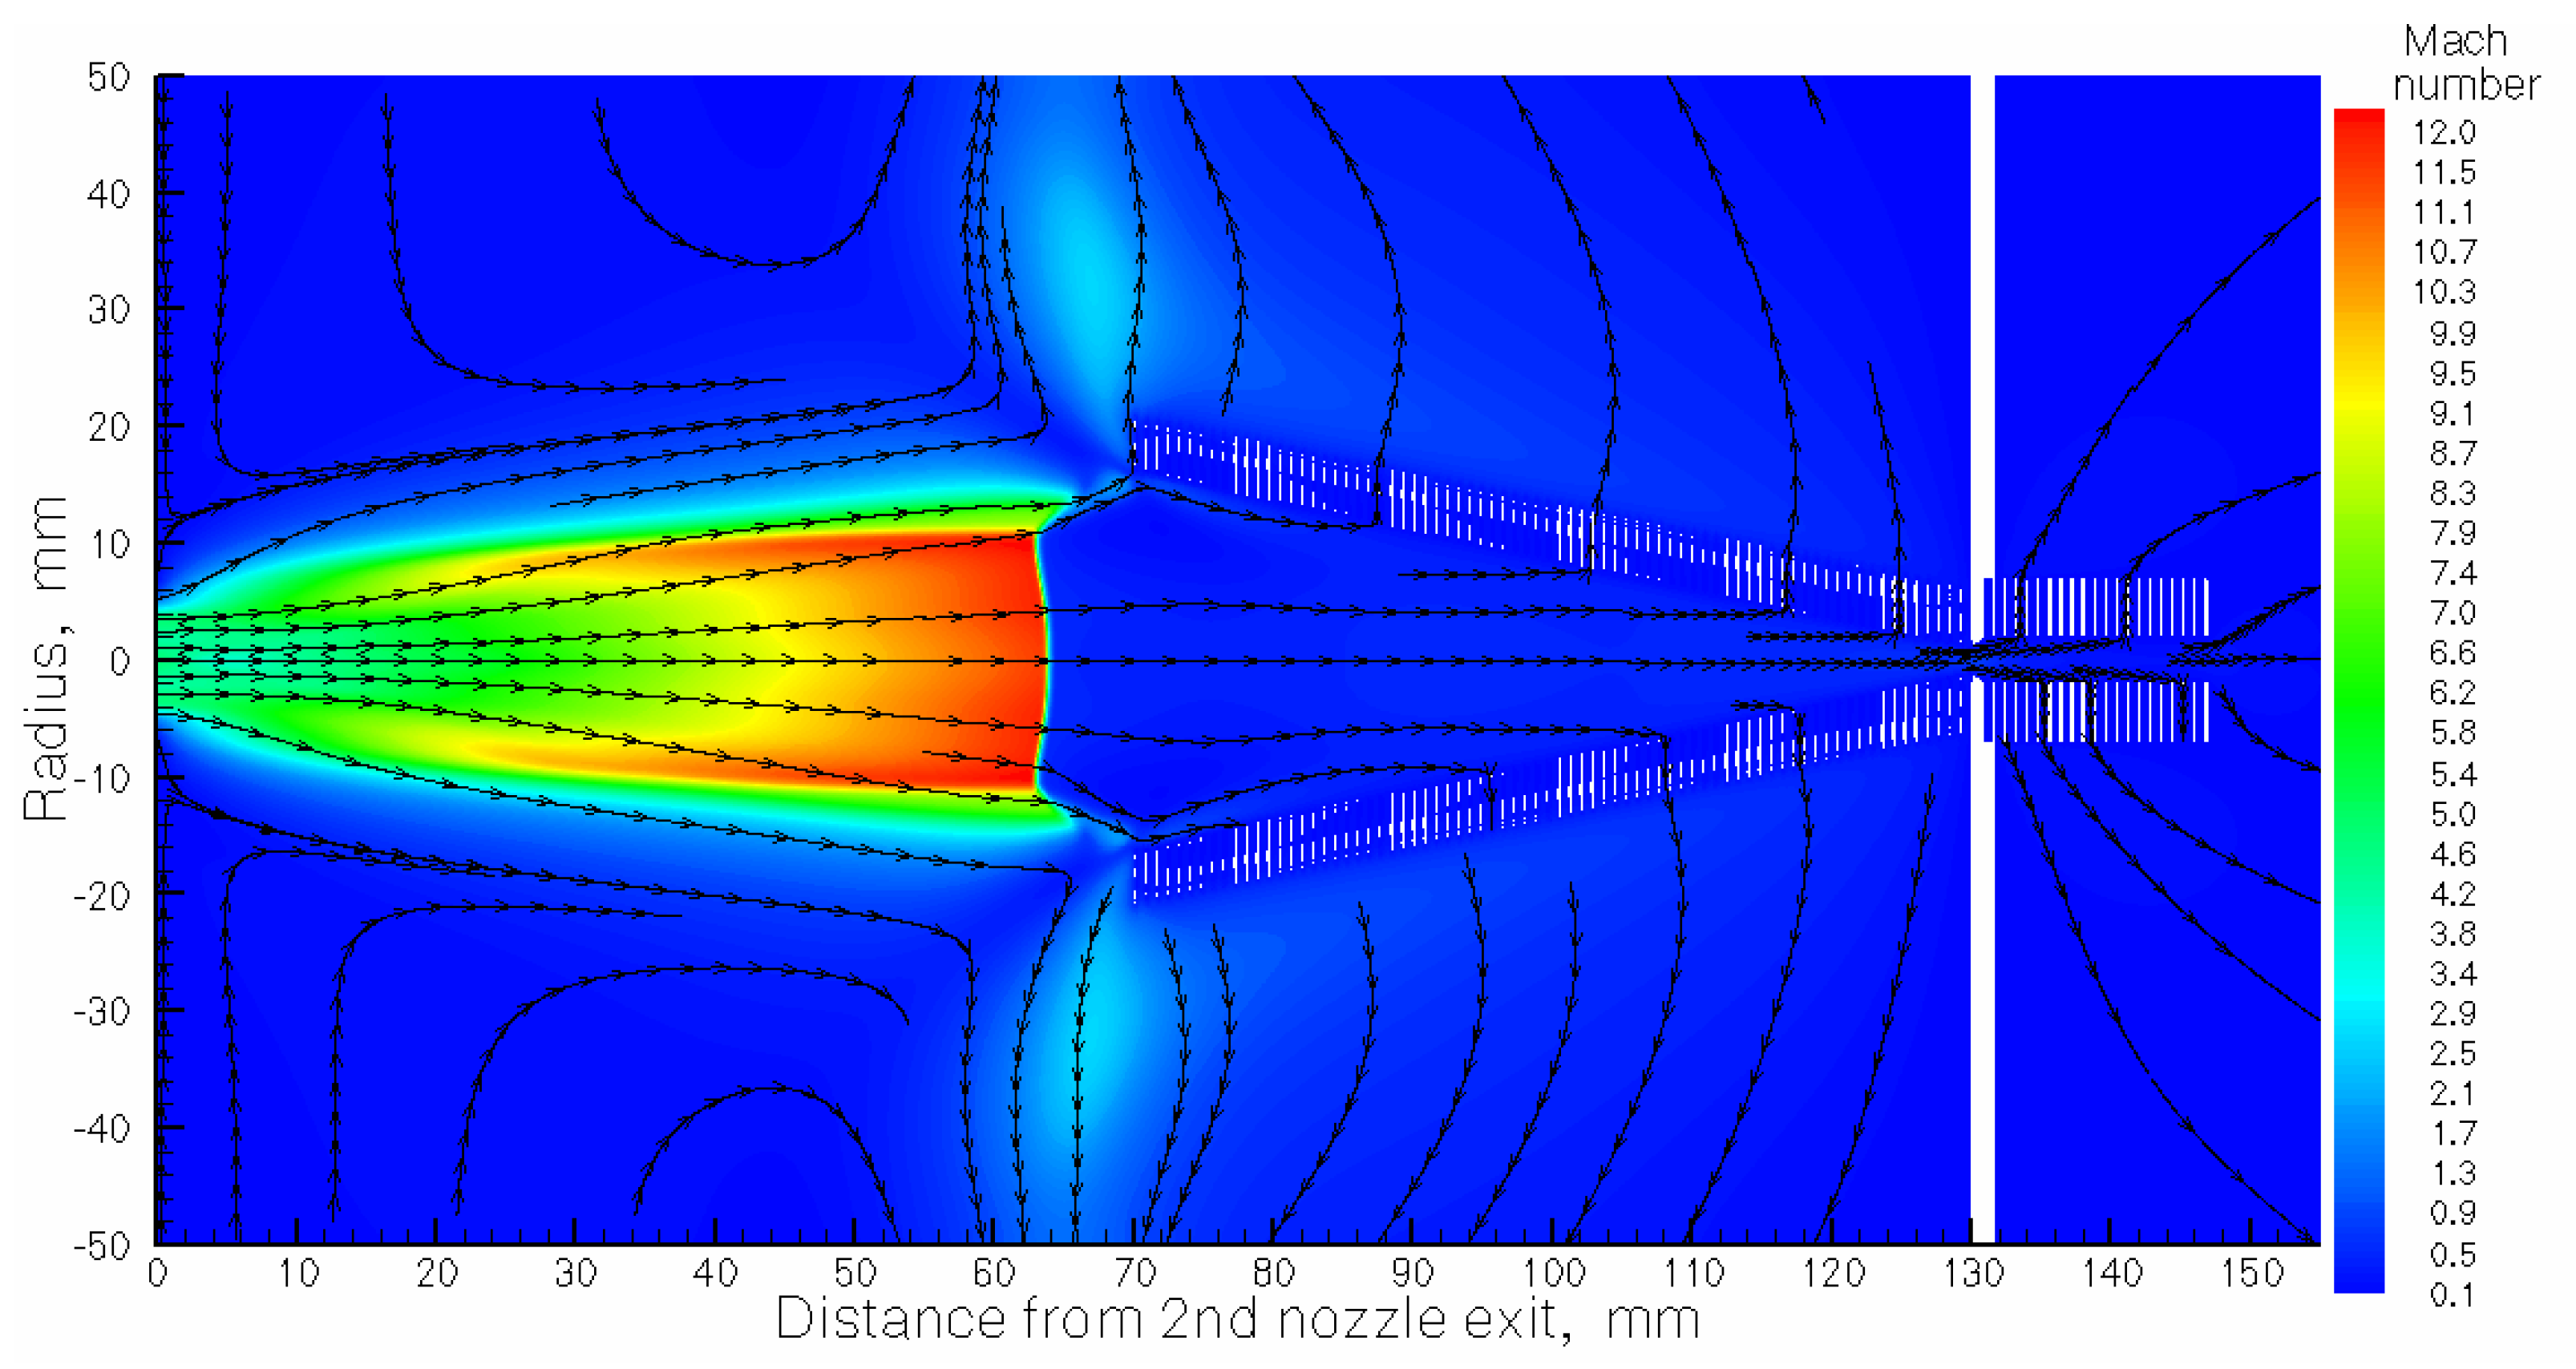
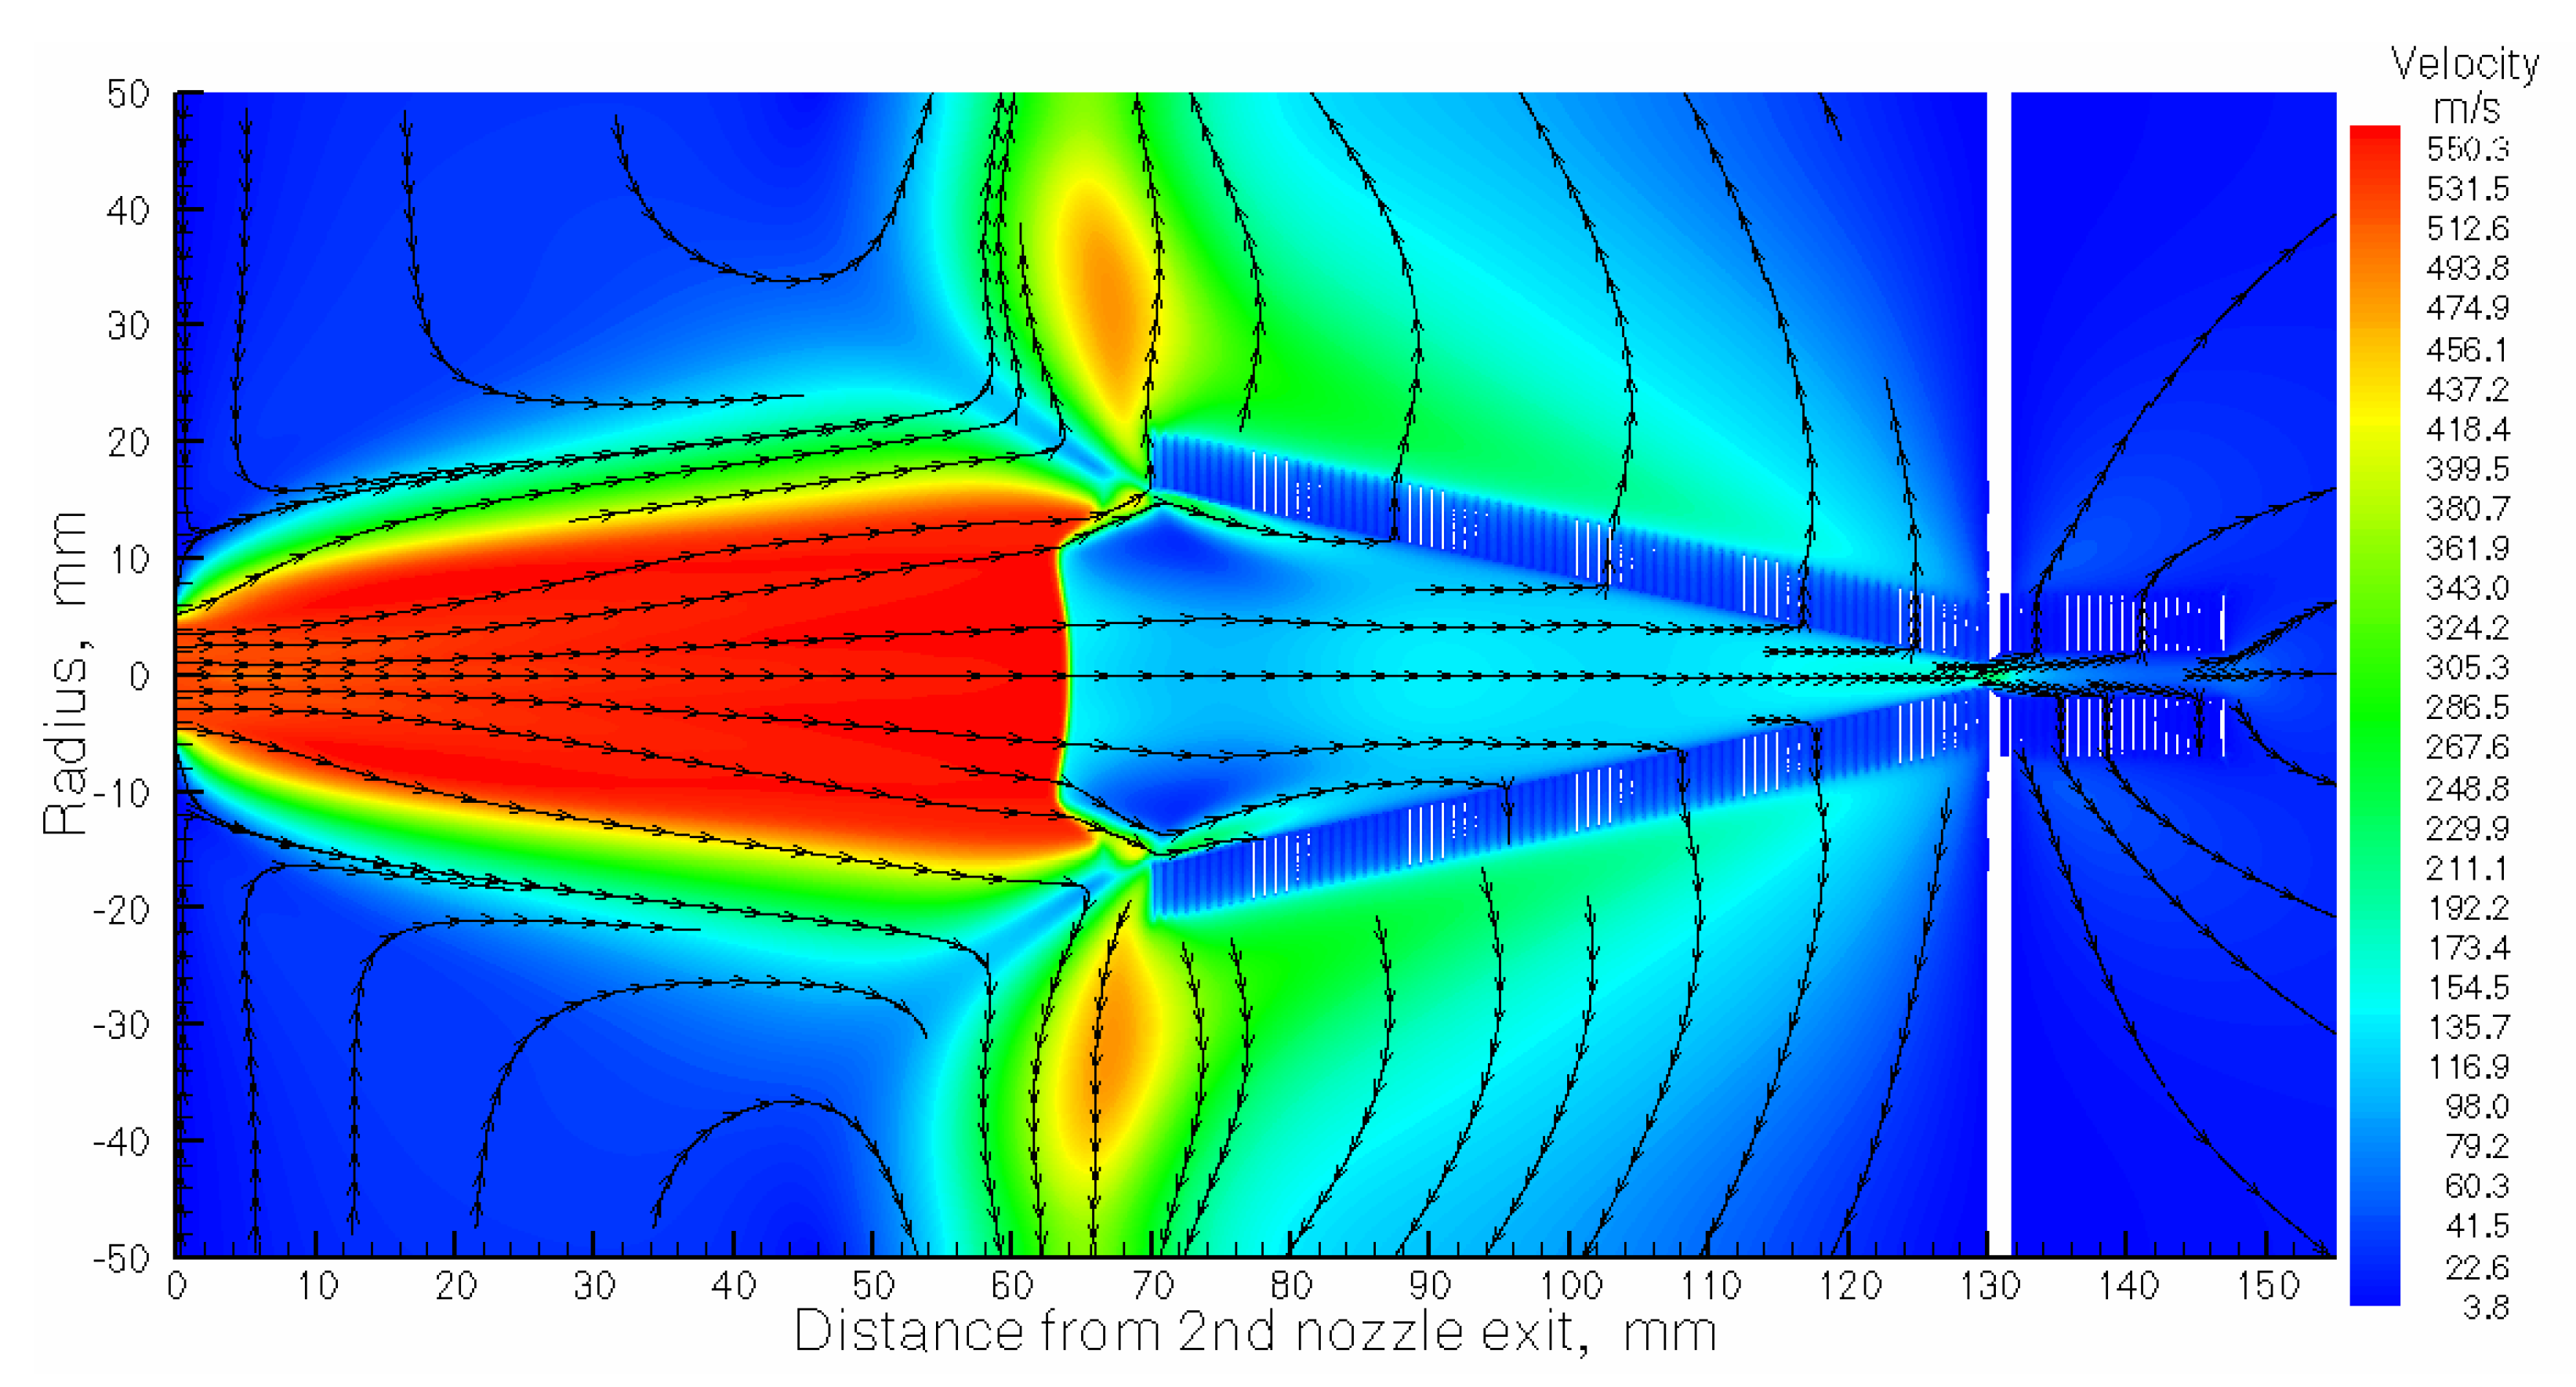
Section 3. The graphic description of the supersonic and subsonic gas flow structure (flow fields of gas density, temperature, Mach number and velocity) shown for the calculation variant #7 (see
Table 2) in
Figure 4,
Figure 5,
Figure 6,
Figure 7 and
Figure 8. Here one can clear see in the jet a direct shock wave having about 20 mm in diameter, that appears in front of the RF-only funnel due to a strong interaction of the supersonic gas jet with this funnel. The supersonic gas jet passing through this direct shockwave are converted into subsonic gas flow, and it helps a lot to dramatically decrease the gas load into the vacuum chamber with the RF-buncher (for details, see Qvac values in
Table 2).
Results of many Monte Carlo simulations presented in
Section 4 in form of tables and graphics. In particularly, the values of total ion beam extraction efficiency into vacuum listed in
Table 8 for all 8 calculation variants. Main parameters of the extracted bunched nobelium ion beam, including values of longitudinal and normalized transverse emittance, for 8 calculation variants one can find in
Table 9.
In order to find out how effective the use of the RF-only funnel and RF-buncher can be even in case of their use for conventional technology of in-gas-jet laser resonance spectroscopy (e.g., in the setup of the JetRIS project at GSI) we made similar gas dynamic + Monte Carlo simulations. These results presented in
Section 5 for the GSI nozzle operation at Pcell values of 200 mbar and 300 mbar and at the pumping speed of 1300 l/s.
There is an impressive difference between gas flow structure shown in
Figure 12 and that one shown in
Figure 7 for the double-nozzle technique (variant #7 in
Table 2).
It is also interesting to note that the gas flow rate through funnel exit into vacuum is Q
vac = 0.05 mbar l/s for the case of P
cell = 200 mbar (see
Table 10) in a factor of 5.4 less than this value for the case of P
cell = 300 mbar. At first glance, this looks great, because with such a small gas load into the vacuum chamber, where the RF-buncher is located, it is enough to use a vacuum pump with a capacity of 100 l/s to maintain a vacuum in this chamber at a level of 5 × 10
−4 mbar. On the other hand, the total efficiency of ion beam extraction into vacuum at P
cell = 200 mbar turns out to be only 16.8% (see it in
Table 13), which is 2.1 times less than this value for the case of P
cell = 300 mbar. That is why the variant of P
cell = 300 mbar is, in our opinion, more preferable for experiments with radioactive elements. E.g., the authors of the work [
2], who write in the abstract of their article, share the same opinion: “In view of the low production rates of the heaviest elements, a high total efficiency is a crucial requirement for any experimental setup to be used in on-line experiments”.
In this respect, our double-nozzle technique also has great advantages over the conventional in-gas-get laser resonance ionization technique [
2,
3,
4], even when they both use the RF-only funnel and RF-buncher. This assertion is confirmed by the results of our presented above calculations, because the total extraction efficiency of the nobedium-254 ions into vacuum is 81.2% (see variant # 7 in
Table 8), which is 2.3 times higher than that one for the Pcell = 300 mbar variant in
Table 13.
By the way, there are no in the literature quantitative data (which are even a little bit similar to that one’s presented in
Table 8,
Table 9,
Table 11,
Table 12 and
Table 13) about characteristics of heavy ion beams extracted into vacuum after two-steps laser resonance ionization of their neutral atoms in the supersonic gas jet. At least, we do not know about it.
Figure 1.
Schematic view of the double-nozzle design combined with the gas dynamic simulation results for argon velocity flow field. Black arrowed lines show the gas flow directions. For details, of the design see
Table 1 in [
1].
Figure 1.
Schematic view of the double-nozzle design combined with the gas dynamic simulation results for argon velocity flow field. Black arrowed lines show the gas flow directions. For details, of the design see
Table 1 in [
1].
Figure 2.
Simulation results for cumulative fractions of nobelium-254 atomic beam inside the diameter of 8 mm (it is the Laser-1 beam diameter) for different downstream distances from the GSI nozzle exit. Stagnation gas cell pressure Pcell = 100 mbar, pumping capacity of the turbo molecular pump for the gas-jet chamber is 1300 l/s.
Figure 3.
Schematic view of the full version of double-nozzle technique combined with the gas dynamic simulation results for argon velocity flow field. The stagnation gas cell pressure Pcell = 300 mbar, gas input (stagnation) pressure Pnoz = 200 mbar, background pressure in the gas-jet chamber Pbg = 5.1 × 10⁻² mbar for the pumping capacity of 1300 l/s. The temperature of the gas cell and nozzles is 296 K. Black arrowed lines show the gas flow direction.
Figure 4.
Result of the gas dynamic simulation for argon density flow field. The stagnation gas cell pressure Pcell = 300 mbar, gas input (stagnation) pressure Pnoz = 200 mbar, background presses in the gas-jet chamber Pbg = 5.1 × 10⁻² mbar for the pumping capacity of 1300 l/s. The temperature of the gas cell and nozzles is 296 K. Black arrowed lines show the gas flow direction.
Figure 5.
Result of the gas dynamic simulation for argon temperature flow field. The stagnation gas cell pressure Pcell = 300 mbar, gas input (stagnation) pressure Pnoz = 200 mbar, background presses in the gas-jet chamber Pbg = 5.1 × 10⁻² mbar for the pumping capacity of 1300 l/s. The temperature of the gas cell and nozzles is 296 K. Black arrowed lines show the gas flow direction.
Figure 6.
Result of the gas dynamic simulation for argon Mach number flow field. The stagnation gas cell pressure Pcell = 300 mbar, gas input (stagnation) pressure Pnoz = 200 mbar, background presses in the gas-jet chamber Pbg = 5.1 × 10⁻² mbar for the pumping capacity of 1300 l/s. The temperature of the gas cell and nozzles is 296 K. Black arrowed lines show the gas flow direction.
Figure 7.
Result of the gas dynamic simulation for argon velocity flow field. The stagnation gas cell pressure Pcell = 300 mbar, gas input (stagnation) pressure Pnoz = 200 mbar, background presses in the gas-jet chamber Pbg = 5.1 × 10⁻² mbar for the pumping capacity of 1300 l/s. The temperature of the gas cell and nozzles is 296 K. Black arrowed lines show the gas flow direction.
Figure 8.
Result of the gas dynamic simulation for argon velocity flow field in the region of the RF-only funnel entrance. It is a part of
Figure 7, shown in close up view.
Figure 8.
Result of the gas dynamic simulation for argon velocity flow field in the region of the RF-only funnel entrance. It is a part of
Figure 7, shown in close up view.
Figure 9.
Results of Monte-Carlo trajectory simulations for cumulative radial distributions of the nobelium-254 atomic beam at different downstream distances from the 2nd nozzle exit for the calculation variant #7. The number of calculated atoms is 10,000 for each distance.
Figure 9.
Results of Monte-Carlo trajectory simulations for cumulative radial distributions of the nobelium-254 atomic beam at different downstream distances from the 2nd nozzle exit for the calculation variant #7. The number of calculated atoms is 10,000 for each distance.
Figure 10.
Results of Monte-Carlo trajectory simulations for atomic beam longitudinal velocity distributions for different distances from the 2nd nozzle exit for the calculation variant #7. The data averaged in the radial plane for the total beam. Number of calculated atoms is 10,000 for each distance.
Figure 11.
Results of Monte-Carlo trajectory simulations for atomic beam radial velocity distributions for different distances from the 2nd nozzle exit for the calculation variant #7. The data averaged in the radial plane for the total beam. Number of calculated atoms is 10,000 for each distance.
Figure 11.
Results of Monte-Carlo trajectory simulations for atomic beam radial velocity distributions for different distances from the 2nd nozzle exit for the calculation variant #7. The data averaged in the radial plane for the total beam. Number of calculated atoms is 10,000 for each distance.
Figure 12.
Results of the gas dynamic simulation for argon velocity flow field in the region of the RF-only funnel entrance for the GSI nozzle operating at Pcell = 300 mbar and pumping capacity in the gas-jet chamber of 1300 l/s.
Figure 12.
Results of the gas dynamic simulation for argon velocity flow field in the region of the RF-only funnel entrance for the GSI nozzle operating at Pcell = 300 mbar and pumping capacity in the gas-jet chamber of 1300 l/s.
Table 2.
Results of gas dynamic simulations for the gas flow rates through the nozzles at pumping capacity of the gas-jet chamber of 1300 l/s.
Table 2.
Results of gas dynamic simulations for the gas flow rates through the nozzles at pumping capacity of the gas-jet chamber of 1300 l/s.
| Calculation variant |
#1 |
#2 |
#3 |
#4 |
#5 |
#6 |
#7 |
#8 |
| Stagnation pressure Pcell (mbar) |
100 |
100 |
200 |
200 |
200 |
300 |
300 |
300 |
| Stagnation pressure Pnoz (mbar) |
200 |
300 |
100 |
200 |
300 |
100 |
200 |
300 |
| Background pressure in gas-jet chamber Pbg (mbar) |
0,033 |
0,045 |
0,03 |
0,042 |
0,054 |
0,039 |
0,051 |
0,063 |
| Total gas flow rate Qtot (mbar l/s) |
42.8 |
58.4 |
38.8 |
54.4 |
70 |
50.4 |
66 |
81.6 |
| Gas flow rate through funnel exit into vacuum Qvac (mbar l/s) |
0.154 |
0.435 |
0.053 |
0.172 |
0.538 |
0.11 |
0.245 |
0.432 |
| Flow rate ratio Qtot / Qvac
|
278 |
134 |
732 |
316 |
112 |
458 |
269 |
189 |
Table 3.
Results of Monte Carlo simulations for the atomic beam radius (90% level) at different downstream distances from the 2nd nozzle exit for 8 calculation variants. Number of calculated atoms is 10,000 for each variant.
Table 3.
Results of Monte Carlo simulations for the atomic beam radius (90% level) at different downstream distances from the 2nd nozzle exit for 8 calculation variants. Number of calculated atoms is 10,000 for each variant.
| Calculation variant |
#1 |
#2 |
#3 |
#4 |
#5 |
#6 |
#7 |
#8 |
| 0 mm |
2.0 |
2.0 |
2.14 |
2.17 |
2.08 |
2.2 |
2.2 |
2,23 |
| 10 mm |
2.25 |
2.35 |
2.6 |
2.36 |
2.29 |
2.62 |
2.36 |
2.33 |
| 20 mm |
2.84 |
4.35 |
3.91 |
3.1 |
2.74 |
4.09 |
3.22 |
2.89 |
| 30 mm |
3.83 |
4.95 |
5.6 |
4.36 |
3.69 |
5.99 |
4.54 |
3.98 |
| 40 mm |
5.1 |
6.6 |
7.6 |
5.69 |
4.84 |
7.99 |
6.02 |
5.26 |
| 50 mm |
6.4 |
8.15 |
9.5 |
7.32 |
6.07 |
9.98 |
7.7 |
6.57 |
| 60 mm |
7.8 |
10.5 |
11.4 |
8.78 |
7.32 |
11.8 |
9.35 |
7.96 |
Table 4.
Results of Monte Carlo trajectory simulations for atomic beam longitudinal velocity spread (FWHM) in [m/s] as a function of the downstream distance from the 2nd nozzle exit for different calculation variants. The data averaged in the radial plane for the total beam. Number of calculated atoms is 10,000 for each calculation variant.
| Calculation variant |
#1 |
#2 |
#3 |
#4 |
#5 |
#6 |
#7 |
#8 |
| 0 mm |
97.6 |
95.7 |
94.5 |
90.8 |
91.2 |
93.6 |
95.0 |
86.1 |
| 10 mm |
88.7 |
89.4 |
78.0 |
87.3 |
87.6 |
90.4 |
85.0 |
81.2 |
| 20 mm |
60.1 |
65.0 |
65.5 |
73.4 |
77.6 |
66.5 |
71.4 |
73.7 |
| 30 mm |
64.0 |
59.9 |
56.6 |
62.9 |
64.4 |
54.2 |
57.1 |
63.7 |
| 40 mm |
55.0 |
50.8 |
52.4 |
54.5 |
54.2 |
47.2 |
51.1 |
59.4 |
| 50 mm |
50.7 |
47.7 |
44.6 |
47.0 |
48.5 |
43.5 |
45.0 |
45.5 |
| 60 mm |
46.8 |
47.8 |
43.2 |
41.6 |
44.6 |
41.3 |
43.4 |
42.6 |
Table 5.
Results of Monte Carlo trajectory simulations for atomic beam radial velocity spread (FWHM) in [m/s] as a function of the downstream distance from the 2nd nozzle exit for different calculation variants. The data averaged in the radial plane for the total beam diameter. Number of calculated atoms is 10,000 for each calculation variant.
| Calculation variant |
#1 |
#2 |
#3 |
#4 |
#5 |
#6 |
#7 |
#8 |
| 0 mm |
63.7 |
45.2 |
52.5 |
61.5 |
63.2 |
64.6 |
59.3 |
53.5 |
| 10 mm |
70.9 |
49.1 |
72.4 |
60.7 |
57.2 |
69.1 |
68.1 |
58.6 |
| 20 mm |
59.4 |
53.2 |
72.2 |
65.1 |
61.1 |
78.3 |
64.0 |
60.9 |
| 30 mm |
62.3 |
57.3 |
86.0 |
67.7 |
61.2 |
83.3 |
64.5 |
62.0 |
| 40 mm |
69.3 |
55.5 |
78.0 |
71.2 |
64.2 |
69.4 |
66.3 |
63.3 |
| 50 mm |
66.3 |
55.2 |
81.6 |
67.9 |
64.9 |
70.6 |
60.0 |
62.6 |
| 60 mm |
67.0 |
52.3 |
82.7 |
73.3 |
63.0 |
71.0 |
56.2 |
64.6 |
Table 6.
Results of Monte Carlo trajectory simulations for the atomic beam time of flight in [µsec] starting from the gas cell nozzle throat as a function of the downstream distance from the 2nd nozzle exit for 8 calculation variants. The data averaged in the radial plane for the total beam diameter. Number of calculated atoms is 10000 for each calculation variant.
| Calculation variant |
#1 |
#2 |
#3 |
#4 |
#5 |
#6 |
#7 |
#8 |
| 0 mm |
68 |
68 |
64 |
64 |
64 |
63 |
63 |
63 |
| 10 mm |
88 |
88 |
86 |
84 |
84 |
82 |
82 |
82 |
| 20 mm |
108 |
108 |
104 |
103 |
102 |
101 |
101 |
101 |
| 30 mm |
125 |
124 |
124 |
121 |
121 |
120 |
120 |
120 |
| 40 mm |
144 |
142 |
142 |
140 |
140 |
138 |
138 |
138 |
| 50 mm |
162 |
162 |
162 |
158 |
157 |
157 |
155 |
155 |
| 60 mm |
180 |
180 |
180 |
176 |
176 |
175 |
174 |
174 |
Table 7.
RF frequency and RF amplitude (peak-to-peak) applied to the extraction RF-only funnel and RF-buncher. Extraction DC field = – 10 V/cm.
Table 7.
RF frequency and RF amplitude (peak-to-peak) applied to the extraction RF-only funnel and RF-buncher. Extraction DC field = – 10 V/cm.
| |
RF-only funnel |
RF-buncher |
| RF-amplitude [Vpp] |
100 |
100 |
| RF-frequency [MHz] |
5 |
5 |
| Rf-funnel-RFbuncher DC bias |
- |
-0.8 V |
| DC potential gradient |
- |
-0.08 V |
Table 8.
Results of Monte Carlo simulations for fraction of ions in nobelium-254 beam at RF-only funnel entrance and total ion beam extraction efficiency into vacuum for 8 calculation variants. The number of calculated ions is 10,000 for each variant.
Table 8.
Results of Monte Carlo simulations for fraction of ions in nobelium-254 beam at RF-only funnel entrance and total ion beam extraction efficiency into vacuum for 8 calculation variants. The number of calculated ions is 10,000 for each variant.
| Calculation variant |
#1 |
#2 |
#3 |
#4 |
#5 |
#6 |
#7 |
#8 |
| Fraction of ions in nobelium beam at RF-only funnel entrance (%) |
89.6 |
82.3 |
76.9 |
85.7 |
91.0 |
74.9 |
83.5 |
88.2 |
| Total ion beam extraction efficiency into vacuum (%) |
69.7 |
52.6 |
46.8 |
79.5 |
89.0 |
66.1 |
81.2 |
87.4 |
Table 9.
Results of Monte Carlo trajectory simulations for main parameters of the extracted pulsed nobelium ion beam for 8 calculation variants. Number of calculated ions is 10000 for each variant.
Table 9.
Results of Monte Carlo trajectory simulations for main parameters of the extracted pulsed nobelium ion beam for 8 calculation variants. Number of calculated ions is 10000 for each variant.
| Calculation variant |
#1 |
#2 |
#3 |
#4 |
#5 |
#6 |
#7 |
#8 |
| Longitudinal (90%) energy spread (eV) |
0.29 |
1.1 |
0.43 |
0.42 |
0.62 |
0.46 |
0.45 |
0.59 |
| Bunch time (90%) width (µs) |
9 |
9 |
9 |
9 |
9 |
9 |
9 |
9.4 |
| Longitudinal emittance (90%) (eV µs) |
2.6 |
9.9 |
3.8 |
3.8 |
5.6 |
4.1 |
4.0 |
5.6 |
| Beam radius (90%) (mm) |
1.85 |
1.93 |
1.90 |
1.88 |
1.88 |
1.90 |
1.92 |
1.95 |
| Transverse (90%) energy spread (eV) |
0.12 |
0.21 |
0.18 |
0.18 |
0.17 |
0.23 |
0.16 |
0.17 |
| Normalized transverse emittance (90%) (π∙mm∙mrad ∙[eV]1/2) |
224 |
156.1 |
292 |
289 |
309.8 |
321 |
336 |
310 |
Table 10.
Results of gas dynamic simulations for the gas flow rates through the GSI nozzle at pumping capacity of the gas-jet chamber of 1300 l/s.
Table 10.
Results of gas dynamic simulations for the gas flow rates through the GSI nozzle at pumping capacity of the gas-jet chamber of 1300 l/s.
| Stagnation pressure Pcell |
200 mbar |
300 mbar |
| Background pressure in gas-jet chamber Pbg (mbar) |
0,0178 |
0,0267 |
| Total gas flow rate Qtot (mbar l/s) |
23.2 |
34.8 |
| Gas flow rate through funnel exit into vacuum Qvac (mbar l/s) |
0.05 |
0.271 |
| Flow rate ratio Qtot / Qvac |
464 |
128 |
Table 13.
Results of Monte Carlo simulations for total nobelium-254 ion beam extraction efficiencies for different stagnation gas pressures Pcell. The number of calculated ions is 10,000 for each variant.
Table 13.
Results of Monte Carlo simulations for total nobelium-254 ion beam extraction efficiencies for different stagnation gas pressures Pcell. The number of calculated ions is 10,000 for each variant.
| Stagnation pressure Pcell |
200 mbar |
300 mbar |
| Fraction of ions in nobelium beam at FR-only funnel entrance (%) |
64.2 |
64.9 |
| Total ion beam extraction efficiency into vacuum (%) |
16.8 |
35.4 |
