Submitted:
01 August 2023
Posted:
01 August 2023
You are already at the latest version
Abstract
This study investigated the intersecting influence of socioeconomic status and cooking behavior on dietary habits using nationwide Japanese data. The study measured the frequency of balanced meals and breakfast intake as indicators of healthy eating habits and used subjective economic status, subjective spare time, and cooking behavior as the independent variables. It employed multivariate logistic regression analyses to elucidate the relationships among these variables. The results demonstrated that even among economically poor or time-constrained individuals, those preparing meals from ingredients were more likely to eat balanced meals and breakfast than those relying on commercial food or rarely cooking. This finding suggested that cooking behavior can mitigate disparity in healthful eating due to socioeconomic conditions. The study added new insights into the impact of combining socioeconomic status and cooking behavior on dietary habits, which highlights the potential of promoting cooking behaviors, such as teaching cooking skills, as a strategy for reducing socioeconomic dietary disparities.
Keywords:
health disparity
; diet
; cooking
; breakfast intake
; balanced meal intake
; cross-sectional study
; Japan
; adult
1. Introduction
The World Health Organization defines the social determinants of health as “the non-medical factors that influence health outcomes.” Moreover, “in countries at all levels of income, health and illness follow a social gradient: the lower the socioeconomic position, the worse the health” [1]. Typical factors are economic ones such as income. A number of empirical studies, such as a meta-analysis of multilevel studies, demonstrate that economic inequality is related to mortality and self-rated health [2]. In addition, a review article explores the causal relationship between income inequality and health [3].
Economic inequality is linked to negative impacts on health through unhealthy behaviors such as unhealthy dietary habits [4]. Individuals with better socioeconomic status tend to consume a diet rich in whole grains, vegetables, fruits, lean meat, and seafood, whereas those with lower socioeconomic status tend to consume a diet high in refined grains, potatoes, fatty meats, and fried food [5]. Additionally, individuals with lower socioeconomic status are more likely to be obese [6]. One contributing factor is the tendency to consume low-cost, time-efficient food high in energy density and low in nutrient density [5,6,7]. In Japan, the National Health and Nutrition Survey and various previous studies report that such dietary disparities due to economic status exist [8,9,10,11,12,13,14,15,16]. Thus, strategies for addressing this dilemma are required.
Another social factor related to dietary habits is time availability. For example, it is known that the earlier people get up in the morning and have more time to spare, the more frequently they consume breakfast [17]. In addition, busyness and lack of time are the most common reasons for failing to acquire healthy eating habits [18]. In the behavioral economics field, the lack of money and lack of time are discussed under the same concept of scarcity [19]. When money and time are in a state of scarcity, people focus on them and neglect other aspects of living [19]. Eating healthy is no exception. Therefore, strategies for correcting the dietary disparity caused by economic factors as well as by the amount of time available are also important.
Cooking is a promising strategy for reducing dietary disparity. Previous studies suggest that individuals who cook and prepare regular meals more frequently exhibit healthier diets [20,21,22,23,24,25,26,27]. In general, cooking for oneself allows one to prepare a well-balanced meal at a lower cost than eating out or eating processed foods. Thus, a common expectation is that even individuals under poor economic circumstances would be more likely to eat a well-balanced meal by cooking. In addition, those who lack sufficient time will likely eat out or eat processed food instead of cooking, but they may eat healthier meals by making prioritizing cooking in their use of time. However, no studies examine whether or not cooking mitigates dietary disparity through economic or time status.
The current study explores the intersectional influence of socioeconomic status and cooking behaviors on the establishment of healthful dietary patterns. It advances the proposition that the act of cooking may function as an intervention for attenuating nutritional disparity across socioeconomic divisions.
2. Materials and Methods
2.1. Study design and data
This study is cross-sectional in nature. Data were derived from The Survey of Attitude Toward Shokuiku (Food and Nutrition Education) for 2020 by the Ministry of Agriculture, Forestry and Fisheries of the Social Science Japan Data Archive, Center for Social Research and Data Archive [28,29]. This survey is conducted annually to ascertain current public attitudes toward nutrition education and to serve as reference for future promotional measures for food and nutrition education. In 2020, it was conducted in December on those aged 20 years and older in Japan. It used a stratified two-stage random sampling method to reach 5,000 people out of which 2,395 (47.9%) valid responses were received [28]. This study used 2,288 (45.8%) responses without missing values for the required variables.
This study was conducted using anonymous information from a previously completed survey and according to the ethical guidelines for life science and medical research involving human subjects in Japan [30].
2.2. Variables
2.2.1. Dependent Variables
As the dependent variables, the study used the frequencies of balanced meal intake and breakfast intake as healthy dietary habits.
The frequency of balanced meal intake was measured using the question “How many days per week do you eat a meal that includes a complete set of staple, main, and side dishes at least twice a day?” The item was rated using the following choices: nearly every day, 4–5 times/week, 2–3 times/week, and little or nothing. The following examples were given for each category of dishes: staple (e.g., rice, bread, and noodles), main (e.g., meat, fish, eggs, and soy products), and side (e.g., a small bowl or plate of vegetables, mushrooms, potatoes, and seaweeds) [28]. Previous studies demonstrated that adherence to the Japanese dietary guideline, which includes the concept of staple, main, and side dishes, reduces mortality rates [31,32]. In the Basic Plan for the Promotion of Food and Nutritional Education in Japan, increasing the number of people who eat meals with a complete set of staple, main, and side dishes at least twice a day was set as one of the goals [33]. Therefore, the categories almost every day and not every day (ref.) were used for analyses.
Frequency of breakfast intake was assessed using the following question: “Do you usually eat breakfast?” [28]. Responses were categorized using four choices, namely, nearly every day, 4–5 days/week, 2–3 days/week, and little or nothing [28]. Several meta-analyses reported that skipping breakfast is associated with the risk of obesity, type-two diabetes, and heart disease [34,35,36,37,38,39]. In the Basic Plan for the Promotion of Food and Nutritional Education in Japan, increasing the number of people who eat breakfast every day is set as one of the goals [33]. Therefore, the study used the categories nearly every day and not every day (ref.) for analyses.
2.2.2. Independent Variables
The study used the intersectional variables of subjective economic status, subjective spare time, and cooking behavior as the independent variables.
For subjective economic status, the participants were asked about their current economic situation [28]. Responses were categorized using five choices, namely, good, somewhat good, fair, somewhat poor, and poor [28]. Previous studies found a correlation between subjective economic status and household income [11]. Furthermore, they found that subjective economic status is more strongly associated with dietary habits than household income [11]. Therefore, using subjective economic status as an indicator of economic status is appropriate. Responses were categorized into good (good and somewhat good), fair, and poor (poor and somewhat poor) for analyses.
The participants used five choices to rate subjective spare time, namely, somewhat much, neither, somewhat less, and less [28]. Although subjective spare time was not tested for criterion-related validity, previous studies confirmed a significant inverse association with household food waste [40]. In addition, previous studies reported an association between lack of time and unhealthy eating habits [41,42]. Responses were categorized into much (much and somewhat much), neither, and less (less and somewhat less) for analyses.
Cooking behavior was rated using the question, “Do you prepare your daily meals by yourself?” with the following options: I prepare most of my meals from ingredients (almost cook), I prepare meals by incorporating some commercial foods (partially cook), I prepare meals by using commercial foods for most things (do not cook), and I do not prepare meals by myself (do not prepare) [28]. Notably, an annotation was added to the question “Preparing meals includes not only cooking but also warming and serving meals. It does not include just buying a lunch box. Commercial foods include frozen foods, retort-pouch foods, and other foods that can be prepared as is or simply heated” [28].
In terms of cooking behavior and subjective economic status, the variables were combined to assess these intersectional influences: for each of the four categories of cooking behavior divided by the three categories of economic status, the study identified 12 categories of variables and used for analyses. The same was true for cooking behavior and subjective spare time.
2.2.3. Other Variables
This study used the following characteristics as covariates in multivariate analysis: gender (men, women), age (20–39, 40–59, 60–79, and 80 or more years), employment status (employed, self or family employed, and other), living region (city and town/village), agricultural experience (with and without), self-rated health (good, fair, and poor), and attitude toward healthy diet (with and without).
2.3. Analysis
The study first described the characteristics according to cooking behavior and conducted Chi-square tests. It then presented detailed proportions of each dependent variable according to subjective economic status, subjective spare time, and cooking behavior and, once again, perfomed Chi-square tests. Subsequently, it presented the proportions of each dependent variable for each of the 12 categories that were created by the combination of cooking behavior with subjective economic status or subjective spare time. Finally, the study examined the relationships between each dependent variable and these 12 categories using univariate and multivariate logistic regression analyses that were adjusted for characteristics. In the logistic regression analyses, the study defined the reference categories as individuals whose cooking behavior was almost cook and whose economic situation was good or had much spare time. Lastly, it calculated odds ratios (OR) and 95% confidence interval (95% CI) for each category.
Analyses were conducted using IBM SPSS Statistics for Windows, version 28.0 (IBM Japan, Ltd., Tokyo, Japan), and Microsoft Excel 2019 (Microsoft Japan Co., Ltd., Tokyo, Japan) was used to create the figures. Significance level was set to 5% (two-tailed test).
3. Results
3.1. Characteristics of the Participants
Table 1 presents the characteristics of the participants for each cooking behavior. The result of the Chi-square test, gender, age, employment status, agricultural experience, self-rated health, attitude toward healthy diet, subjective economic status, and subjective spare time were significantly related to cooking behavior.
3.2. Dietary Habits According to Subjective Economic Status, Subjective Spare Time, and Cooking Behavior
Table 2 presents the proportions of individuals eating balanced meals and breakfast, which are categorized according to subjective economic status, subjective spare time, and cooking behavior. The better the subjective economic status and the more the spare time available, the more frequently the individuals ate balanced meals and breakfast. In terms of cooking behavior, the frequency of eating a balanced meal was higher for the almost cook group, while the frequency of eating breakfast was higher for the almost cook and partially ' groups. All results from the chi-square test were significant.
3.3. Intersectional Influence of Socioeconomic Status and Cooking Behaviors on Dietary Habits
Figure 1 depicts the descriptive statistics for dietary habits according to combinations of cooking behavior and socioeconomic status (see Table A1 for detailed data on Figure 1). Additionally, Table 3 presents the results of logistic regression analyses.
In the relationship between cooking behavior combined with economic status and the frequency of eating balanced meals, among individuals categorized under almost cook, those with good economic status ate more balanced meals daily than those with poor economic status (according to the adjusted model; OR: 1.555). However, when compared to those under the almost cook category with a poor economic status, those under the partially cook category with poor or fair economic status were significantly less likely to eat balanced meals daily (adjusted model; OR: poor: 0.500, fair: 0.511). In addition, those under the partially cook category with a good economic status demonstrated a comparable likelihood to those who almost cook with a poor economic status in eating balanced meals daily. Furthermore, when compared to those under the almost cook category with a poor economic status, those under all economic status categories and under the do not cook category were significantly less likely to eat balanced meals daily (adjusted model; OR: poor: 0.214, fair: 0.136, good: 0.332). The study found no significant difference in the frequency of the consumption of balanced meals between the almost cook category with a poor economic status and all economic statuses under the do not prepare category.
In the relationship between cooking behavior combined with spare time and the frequency of eating balanced meals, the study found no significant difference in the frequency of eating balanced meals according to subjective spare time among those categorized as almost cook. When compared to those under the almost cook category with less spare time, those under all categories of subjective spare time and under the partially cook and do not cook categories were significantly less likely to eat balanced meals daily (adjusted model; OR: partially cook [less]: 0.378, [neither]: 0.432, [much]: 0.403; do not cook [less]: 0.163, [neither]: 0.148, [much]: 0.159). Compared with those under the almost cook category with less spare time, individuals under the do not prepare category with less spare time were significantly less likely to eat balanced meals daily (adjusted model; OR: 0.564). However, the study observed no significant differences when comparing these individuals with those under the do not prepare category with neither and much spare time.
In the relationship between cooking behavior combined with economic status and the frequency of eating breakfast, individuals under the almost cook and partially cook categories with good socioeconomic status ate breakfast more frequently (adjusted model; OR: almost cook: 1.930, partially cook: 1.868) compared with those under the almost cook category with poor economic status. Compared to those under the almost cook category with poor economic status, those under the do not cook category with good economic status were significantly less likely to eat breakfast (adjusted model; OR: 0.450). Individuals under the do not cook category with poor and fair economic status were nonsignificant; however, they were less likely to eat breakfast than those under the almost cook category with poor economic status. Furthermore, the study noted no significant differences when comparing these individuals with those under the do not prepare category with fair and good economic status. Those under the do not prepare category with poor economic status was nonsignificant; however, they were less likely to eat breakfast than those under the almost cook category with poor economic status.
In the relationship between cooking behavior combined with spare time and the frequency of eating breakfast, the study observed no significant differences in the frequency of eating breakfast among all categories of subjective spare time and under the almost cook and partially cook categories. When compared with those under the almost cook category with less spare time, individuals under all spare time categories and the do not cook category were significantly less likely to eat breakfast (adjusted model; OR: less: 0.456, neither: 0.379, much: 0.477). Compared with those under the almost cook category with less spare time, individuals under the do not prepare category with less spare time were significantly less likely to eat breakfast (adjusted model; OR: 0.437). However, the study found no significant differences when comparing these individuals with those under the do not prepare category with neither and much spare time.
4. Discussion
This study examined the intersectional influence of socioeconomic status and cooking behavior on dietary habits using data from a Japanese nationwide survey. The result indicated that individuals who prepared most meals from ingredients, even if they were economically poor or had little time to spare, were more likely to eat balanced meals than those who prepared their meals partially from commercial foods or rarely cooked. In addition, those who prepared the majority of meals from ingredients even if they were economically poor or had little time to spare were more likely to eat breakfast than those who rarely cooked. In summary, cooking behavior tended to partially mitigate the disparity in healthful eating habits due to economic status and spare time. Previous studies suggested positive associations between socioeconomic status, such as economic status and spare time, and dietary habits [5,6,7,8,9,10,11,12,13,14,15,16,17,18,19,40,41,42]. Additionally, they illustrated that cooking behaviors can lead to healthful eating habits [20,21,22,23,24,25,26,27]. However, no studies to date reported on the intersectional influence of socioeconomic status and cooking behavior on dietary habits. Thus, the current study provided important evidence for the possibility of positioning the promotion of cooking behaviors as a promising strategy for improving disparities in healthy eating habits due to socioeconomic status.
One method for encouraging cooking behaviors is improving one’s cooking skills, such that individuals can utilize readily available, inexpensive items or leftovers from previous meals to prepare relatively balanced dishes even under economically challenging circumstances. Additionally, possessing cooking skills can expedite meal preparation, which, thereby, increases the likelihood of cooking even for those with time constraints. In fact, previous studies pointed to a positive relationship between cooking skills and healthy eating habits, nutritional status, and even social health. [21,43,44,45]. These studies also revealed that high levels of cooking skills are associated with high frequencies of cooking [44,45]. However, whether or not improved cooking skills can help mitigate dietary disparities related to socioeconomic status remained unclear. These issues require a detailed examination in the future.
Furthermore, the study observed unique differences by outcome. When breakfast intake was used as the outcome, no difference existed in the percentage of eating breakfast daily between those who can almost cook and partially cook. However, when balanced meal intake was used as the outcome, a smaller percentage ate a balanced meal daily in the partially cook than the almost cook group. One implication from this result is that although partial cooking with commercial food is sufficient for simply eating breakfast, cooking most of the meal from basic ingredients is important from the perspective of a balanced diet. In addition, respondents who answered do not prepare include not only those who eat out or use take-out but also those whose family prepares meals at home. Therefore, interpreting the do not prepare responses is difficult and should be done with caution. Additional precise verification is required in the future.
Limitation
This study has several limitations. First, it was based on a sample of 2,288 responses out of 5,000 targeted individual with a relatively low response rate (45.8%). Thus, inherent bias may exist in the data due to the underrepresentation of those who did not respond. Then, it utilized a cross-sectional design; in other words, it was conducted at a single point in time. This type of design can identify correlations but cannot establish causality. It also heavily relied on self-reported data, which may be subject to recall or social desirability bias. For this reason, verifying this aspect using objective and subjective indicators would be desirable for future research.
Finally, the survey was conducted in Japan; thus, the findings may not be generalizable to other cultural or ethnic groups. Similar verification is desirable in diverse countries and regions apart from Japan. A more detailed verification is needed in the future due to the abovementioned limitations of this brief report.
5. Conclusions
This study revealed that individuals who frequently cooked from scratch despite the low economic status or limited spare time exhibited healthier eating habits by consuming more balanced meals and eating breakfast regularly. These findings suggested that promoting cooking behavior and teaching cooking skills could help mitigate disparities in healthy eating habits due to socioeconomic differences given a new perspective on public health intervention.
Funding
D.M. was funded by JSPS KAKENHI; grant number JP21K13503.
Institutional Review Board Statement
Not applicable. This study was exempt from applying the ethical guidelines for life science and medical research involving human subjects in Japan, because anonymous information was derived from a survey conducted prior to the study.
Informed Consent Statement
Not applicable.
Data Availability Statement
It is available by applying to the Social Science Japan Data Archive, Center for Social Research and Data Archive, which is affiliated with the Institute of Social Sciences, University of Tokyo.
Acknowledgments
Data for this secondary analysis, “The Survey of Attitude toward Shokuiku 2020,” were provided by the Social Science Japan Data Archive, Center for Social Research and Data Archives, Institute of Social Science, University of Tokyo.
Conflicts of Interest
The author declares no conflict of interest.
Appendix A

Table A1.
Detailed data in Figure 1.
Table A1.
Detailed data in Figure 1.
| Eating balanced meals | Eating breakfast | ||||||||
| Not every day | Nearly every day | Not every day | Nearly every day | ||||||
| n | % | n | % | n | % | n | % | ||
| 1444 | 844 | 423 | 1865 | ||||||
| Cooking behavior | Economic status | ||||||||
| Almost cook | Poor | 87 | 57.2 | 65 | 42.8 | 28 | 18.4 | 124 | 81.6 |
| Fair | 111 | 51.4 | 105 | 48.6 | 29 | 13.4 | 187 | 86.6 | |
| Good | 128 | 41.4 | 181 | 58.6 | 28 | 9.1 | 281 | 90.9 | |
| Partially cook | Poor | 205 | 76.2 | 64 | 23.8 | 64 | 23.8 | 205 | 76.2 |
| Fair | 238 | 73.0 | 88 | 27.0 | 52 | 16.0 | 274 | 84.0 | |
| Good | 231 | 61.3 | 146 | 38.7 | 42 | 11.1 | 335 | 88.9 | |
| Do not cook | Poor | 74 | 92.5 | 6 | 7.5 | 29 | 36.3 | 51 | 63.8 |
| Fair | 47 | 94.0 | 3 | 6.0 | 18 | 36.0 | 32 | 64.0 | |
| Good | 53 | 84.1 | 10 | 15.9 | 27 | 42.9 | 36 | 57.1 | |
| Do not prepare | Poor | 85 | 65.4 | 45 | 34.6 | 45 | 34.6 | 85 | 65.4 |
| Fair | 80 | 59.3 | 55 | 40.7 | 28 | 20.7 | 107 | 79.3 | |
| Good | 105 | 58.0 | 76 | 42.0 | 33 | 18.2 | 148 | 81.8 | |
| Spare time | |||||||||
| Almost cook | Less | 75 | 49.7 | 76 | 50.3 | 24 | 15.9 | 127 | 84.1 |
| Neither | 76 | 50.7 | 74 | 49.3 | 22 | 14.7 | 128 | 85.3 | |
| Much | 175 | 46.5 | 201 | 53.5 | 39 | 10.4 | 337 | 89.6 | |
| Partially cook | Less | 214 | 75.6 | 69 | 24.4 | 63 | 22.3 | 220 | 77.7 |
| Neither | 149 | 70.6 | 62 | 29.4 | 41 | 19.4 | 170 | 80.6 | |
| Much | 311 | 65.1 | 167 | 34.9 | 54 | 11.3 | 424 | 88.7 | |
| Do not cook | Less | 56 | 91.8 | 5 | 8.2 | 26 | 42.6 | 35 | 57.4 |
| Neither | 43 | 91.5 | 4 | 8.5 | 20 | 42.6 | 27 | 57.4 | |
| Much | 75 | 88.2 | 10 | 11.8 | 28 | 32.9 | 57 | 67.1 | |
| Do not prepare | Less | 90 | 72.0 | 35 | 28.0 | 50 | 40.0 | 75 | 60.0 |
| Neither | 69 | 65.7 | 36 | 34.3 | 22 | 21.0 | 83 | 79.0 | |
| Much | 111 | 51.4 | 105 | 48.6 | 34 | 15.7 | 182 | 84.3 | |
References
- World Health Organization. Social determinants of health. Available online: https://www.who.int/health-topics/social-determinants-of-health#tab=tab_1 (accessed on 24 July 2023).
- Kondo, N.; Sembajwe, G.; Kawachi, I.; van Dam, R.M.; Subramanian, S.V.; Yamagata, Z. Income inequality, mortality, and self-rated health: meta-analysis of multilevel studies. BMJ 2009, 339, b4471. [Google Scholar] [CrossRef] [PubMed]
- Pickett, K.E.; Wilkinson, R.G. Income inequality and health: a causal review. Soc Sci Med 2015, 128, 316–326. [Google Scholar] [CrossRef] [PubMed]
- Kondo, N. Socioeconomic disparities and health: impacts and pathways. J Epidemiol 2012, 22, 2–6. [Google Scholar] [CrossRef] [PubMed]
- Darmon, N.; Drewnowski, A. Does social class predict diet quality? Am J Clin Nutr 2008, 87, 1107–1117. [Google Scholar] [CrossRef] [PubMed]
- Drewnowski, A.; Specter, S.E. Poverty and obesity: the role of energy density and energy costs. Am J Clin Nutr 2004, 79, 6–16. [Google Scholar] [CrossRef]
- Darmon, N.; Drewnowski, A. Contribution of food prices and diet cost to socioeconomic disparities in diet quality and health: a systematic review and analysis. Nutr Rev 2015, 73, 643–660. [Google Scholar] [CrossRef]
- Nishi, N.; Horikawa, C.; Murayama, N. Characteristics of food group intake by household income in the National health and nutrition survey, Japan. Asia Pac J Clin Nutr 2017, 26, 156–159. [Google Scholar] [CrossRef]
- Machida, D. Trends in health inequalities by household income in Japan in the 2010s. Jxiv 2022, 48. [Google Scholar] [CrossRef]
- Fukuda, Y.; Hiyoshi, A. High quality nutrient intake is associated with higher household expenditures by Japanese adults. BioSci Trends 2012, 6, 176–182. [Google Scholar] [CrossRef]
- Hayashi, F.; Takemi, Y.; Murayama, N. The association between economic status and diet-related attitudes and behaviors, as well as diet-related quality of life in adults. Eiyougakuzashi 2015, 73, 51–61. [Google Scholar] [CrossRef]
- Sugisawa, H.; Nomura, T.; Tomonaga, M. Psychosocial mediators between socioeconomic status and dietary habits among Japanese older adults. J Nutr Health Aging 2015, 19, 130–136. [Google Scholar] [CrossRef] [PubMed]
- Nakamura, S.; Inayama, T.; Hata, K.; Matsushita, M.; Takahashi, M.; Harada, K.; Arao, T. Association of household income and education with eating behaviors in Japanese adults: a cross-sectional study. BMC Public Health 2016, 16, 61. [Google Scholar] [CrossRef] [PubMed]
- Nagahata, T.; Nakamura, M.; Ojima, T.; Kondo, I.; Ninomiya, T.; Yoshita, K.; Arai, Y.; Ohkubo, T.; Murakami, K.; Nishi, N.; et al. Relationships among food group intakes, household expenditure, and education attainment in a General Japanese population: nippon DATA2010. J Epidemiol 2018, 28, S23–S28. [Google Scholar] [CrossRef]
- Sakurai, M.; Nakagawa, H.; Kadota, A.; Yoshita, K.; Nakamura, Y.; Okuda, N.; Nishi, N.; Miyamoto, Y.; Arima, H.; Ohkubo, T.; et al. Macronutrient intake and socioeconomic status: Nippon DATA2010. J Epidemiol 2018, 28, S17–S22. [Google Scholar] [CrossRef] [PubMed]
- Kurotani, K.; Ishikawa-Takata, K.; Takimoto, H. Diet quality of Japanese adults with respect to age, sex, and income level in the National health and nutrition survey, Japan. Public Health Nutr 2020, 23, 821–832. [Google Scholar] [CrossRef]
- Ministry of Agriculture, Forestry and Fisheries. Results of survey on dietary habits of the younger generation. Available online: https://www.maff.go.jp/j/syokuiku/websurvey/attach/pdf/websurvey-2.pdf (accessed on 24 July 2023). (In Japanese).
- Ministry of Health, Labour and Welfare. National health and nutrition survey 2019 summary of results. Available online: https://www.mhlw.go.jp/content/10900000/000687163.pdf (accessed on 24 July 2023). (In Japanese).
- Mullainathan, S.; Shafir, E. Scarcity: Why Having Too Little Means so Much; Times Books: New York, 2013; pp. 19–66. [Google Scholar]
- Clifford Astbury, C.; Penney, T.L.; Adams, J. Comparison of individuals with low versus high consumption of home-prepared food in a group with universally high dietary quality: A cross-sectional analysis of the UK National diet & nutrition survey (2008–2016). Int J Behav Nutr Phys Act 2019, 16, 9. [Google Scholar] [CrossRef]
- Lam, M.C.L.; Adams, J. Association between home food preparation skills and behaviour, and consumption of ultra-processed foods: cross-sectional analysis of the UK National diet and nutrition survey (2008–2009). Int J Behav Nutr Phys Act 2017, 14, 68. [Google Scholar] [CrossRef]
- Goffe, L.; Rushton, S.; White, M.; Adamson, A.; Adams, J. Relationship between mean daily energy intake and frequency of consumption of out-of-home meals in the UK National diet and nutrition survey. Int J Behav Nutr Phys Act 2017, 14, 131. [Google Scholar] [CrossRef]
- Hanson, A.J.; Kattelmann, K.K.; McCormack, L.A.; Zhou, W.; Brown, O.N.; Horacek, T.M.; Shelnutt, K.P.; Kidd, T.; Opoku-Acheampong, A.; Franzen-Castle, L.D.; Olfert, M.D.; Colby, S.E. Cooking and meal planning as predictors of fruit and vegetable intake and BMI in first-year college students. Int J Environ Res Public Health 2019, 16, 2462. [Google Scholar] [CrossRef]
- Wolfson, J.A.; Leung, C.W.; Richardson, C.R. More frequent cooking at home is associated with higher healthy eating index-2015 score. Public Health Nutr 2020, 23, 2384–2394. [Google Scholar] [CrossRef]
- Kitano, N.; Ganeko, N.; Kawakami, I.; Ikegami, Y.; Numata, K.; Nakashima, N.; Etoh, H. A present state of attitudes to cooking in university students, and changes on the attitudes and the skills through a cooking class. J Integr Study Diet Habits 2012, 22, 308–314. [Google Scholar] [CrossRef]
- Nakade, M.; Kibayashi, E.; Morooka, A. The relationship between eating behavior and a Japanese well-balanced diet among young adults aged 20–39 years. Nippon Eiyo Shokuryo Gakkaishi 2021, 74, 265–271. [Google Scholar] [CrossRef]
- Machida, D.; Sugiura, Y. Relationships among local agricultural product purchases, self-cooked meal consumption, and healthy eating habits: A cross-sectional study in a town in Gunma, Japan. Healthcare (Basel) 2022, 10, 1510. [Google Scholar] [CrossRef] [PubMed]
- Ministry of Agriculture, Forestry and Fisheries. The survey of attitude toward Shokuiku (food and nutrition education). 2020. Available online: https://www.maff.go.jp/j/syokuiku/ishiki/r03/index.html (accessed on 24 July 2023). (In Japanese).
- Social science Japan data archive, center for social research and data archives, institute of social science, University of Tokyo. The Survey of Attitude toward Shokuiku (food and nutrition education). 2020. Available online: https://ssjda.iss.u-tokyo.ac.jp/Direct/gaiyo.php?eid=1433 (accessed on 24 July 2023). (In Japanese).
- Ministry of Education, Culture, Sports, Science and Technology; Ministry of Health, Labour and Welfare; Ministry of Economy, Trade and Industry. The ethical guidelines for life science and medical research involving human subjects in Japan. Available online: https://www.mhlw.go.jp/content/000909926.pdf (accessed on 24 July 2023). (In Japanese).
- Kurotani, K.; Akter, S.; Kashino, I.; Goto, A.; Mizoue, T.; Noda, M.; Sasazuki, S.; Sawada, N.; Tsugane, S. Japan Public HealthCenter based Prospective Study Group Quality of diet and mortality among Japanese men and women: Japan Public HealthCenter based prospective study. BMJ 2016, 352, i1209. [Google Scholar] [CrossRef]
- Oba, S.; Nagata, C.; Nakamura, K.; Fujii, K.; Kawachi, T.; Takatsuka, N.; Shimizu, H. Diet based on the Japanese food guide spinning top and subsequent mortality among men and women in a general Japanese population. J Am Diet Assoc 2009, 109, 1540–1547. [Google Scholar] [CrossRef]
- Ministry of Agriculture, Forestry and Fisheries. The 4th basic plan for the promotion of food and nutritional education in Japan. Available online: https://www.maff.go.jp/j/press/syouan/hyoji/attach/pdf/210331_35-4.pdf (accessed on 24 March 2023). (In Japanese).
- Horikawa, C.; Kodama, S.; Yachi, Y.; Heianza, Y.; Hirasawa, R.; Ibe, Y.; Saito, K.; Shimano, H.; Yamada, N.; Sone, H. Skipping breakfast and prevalence of overweight and obesity in Asian and Pacific regions: a meta-analysis. Prev Med 2011, 53, 260–267. [Google Scholar] [CrossRef]
- Ma, X.; Chen, Q.; Pu, Y.; Guo, M.; Jiang, Z.; Huang, W.; Long, Y.; Xu, Y. Skipping breakfast is associated with overweight and obesity: A systematic review and meta-analysis. Obes Res Clin Pract 2020, 14, 1–8. [Google Scholar] [CrossRef]
- Wicherski, J.; Schlesinger, S.; Fischer, F. Association between breakfast skipping and body weight-A systematic review and meta-analysis of observational longitudinal studies. Nutrients 2021, 13, 272. [Google Scholar] [CrossRef]
- Bi, H.; Gan, Y.; Yang, C.; Chen, Y.; Tong, X.; Lu, Z. Breakfast skipping and the risk of type 2 diabetes: a meta-analysis of observational studies. Public Health Nutr 2015, 18, 3013–3019. [Google Scholar] [CrossRef]
- Ballon, A.; Neuenschwander, M.; Schlesinger, S. Breakfast skipping is associated with increased risk of type 2 diabetes among adults: A systematic review and meta-analysis of prospective cohort studies. J Nutr 2019, 149, 106–113. [Google Scholar] [CrossRef]
- Takagi, H.; Hari, Y.; Nakashima, K.; Kuno, T.; Ando, T.; ALICE (All-Literature Investigation of Cardiovascular Evidence) Group. Meta-analysis of relation of skipping breakfast with heart disease. Am J Cardiol 2019, 124, 978–986. [Google Scholar] [CrossRef]
- Nakamura, K.; Kojima, D.; Ando, M. What reduces household food waste in Japan? Nation-Wide and region-specific contributing factors in urban and rural areas. Sustainability 2022, 14, 3174. [Google Scholar] [CrossRef]
- Jabs, J.; Devine, C.M. Time scarcity and food choices: an overview. Appetite 2006, 47, 196–204. [Google Scholar] [CrossRef] [PubMed]
- Escoto, K.H.; Laska, M.N.; Larson, N.; Neumark-Sztainer, D.; Hannan, P.J. Work hours and perceived time barriers to healthful eating among young adults. Am J Health Behav 2012, 36, 786–796. [Google Scholar] [CrossRef] [PubMed]
- Tani, Y.; Fujiwara, T.; Kondo, K. Associations of cooking skill with social relationships and social Capital among older men and women in Japan: results from the JAGES. Int J Environ Res Public Health 2023, 20, 4633. [Google Scholar] [CrossRef] [PubMed]
- Tani, Y.; Isumi, A.; Doi, S.; Fujiwara, T. Associations of caregiver cooking skills with child dietary behaviors and weight status: results from the A-CHILD study. Nutrients 2021, 13, 4549. [Google Scholar] [CrossRef]
- Tani, Y.; Fujiwara, T.; Kondo, K. Cooking skills related to potential benefits for dietary behaviors and weight status among older Japanese men and women: a cross-sectional study from the JAGES. Int J Behav Nutr Phys Act 2020, 17, 82. [Google Scholar] [CrossRef]
Figure 1.
Dietary habits according to combinations of cooking behavior and socioeconomic status. Upper: Combination of cooking behavior and economic status; lower: combination of cooking behavior and spare time; left: percentage of individuals eating balanced meals twice per day; right: percentage of individuals eating breakfast; cooking (cooking behavior): alco (almost cook), paco (partially cook), dnco (do not cook), dnpr (do not prepare); economic status: po (poor), fa (fair), go (good); spare time: le (less), ne (neither), mu (much); (see Table A1 for detailed data on Figure 1).
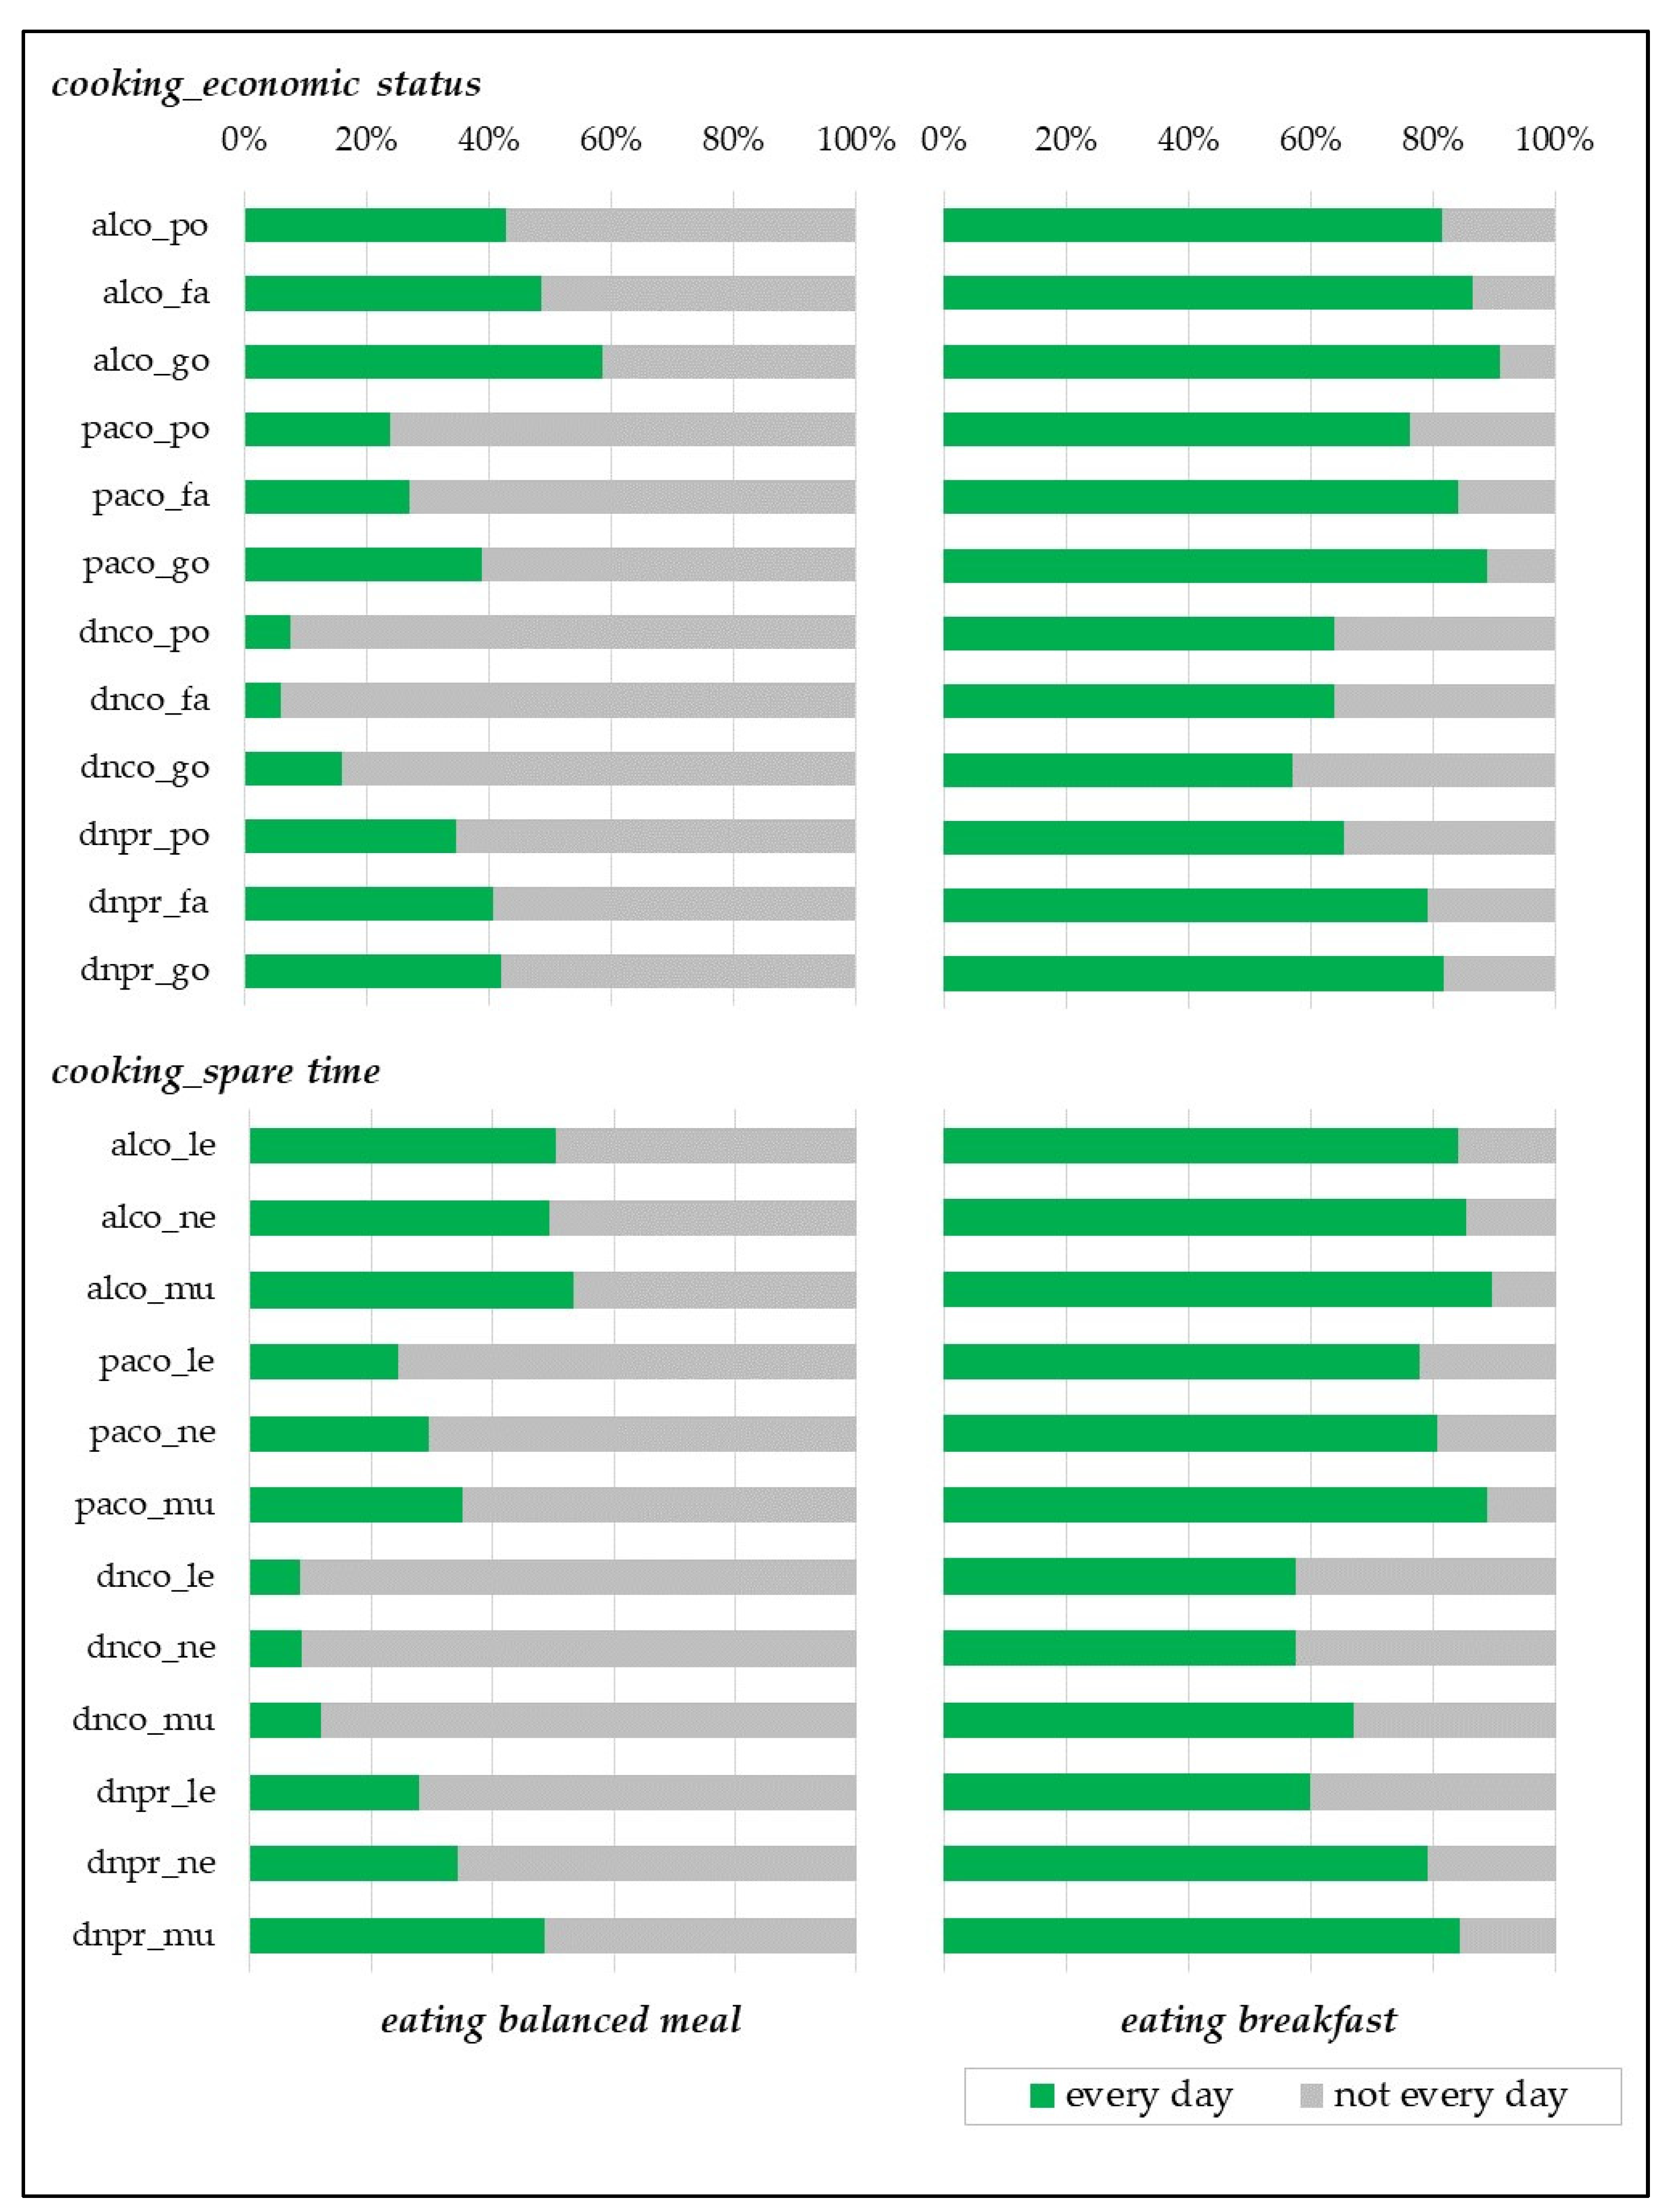
Table 1.
Characteristics of the participants.
| Cooking behavior | |||||||||
| Almost cook | Partially cook | Do not cook | Do not prepare | ||||||
| n | % | n | % | n | % | n | % | p | |
| 677 | 972 | 193 | 446 | ||||||
| Gender | |||||||||
| Men | 136 | 20.1 | 339 | 34.9 | 134 | 69.4 | 373 | 83.6 | <0.001 |
| Women | 541 | 79.9 | 633 | 65.1 | 59 | 30.6 | 73 | 16.4 | |
| Age (years) | |||||||||
| 20 to 39 | 111 | 16.4 | 172 | 17.7 | 58 | 30.1 | 94 | 21.1 | <0.001 |
| 40 to 59 | 202 | 29.8 | 372 | 38.3 | 72 | 37.3 | 144 | 32.3 | |
| 60 to 79 | 314 | 46.4 | 372 | 38.3 | 52 | 26.9 | 172 | 38.6 | |
| 80 or more | 50 | 7.4 | 56 | 5.8 | 11 | 5.7 | 36 | 8.1 | |
| Employment status | |||||||||
| Employed | 267 | 39.4 | 482 | 49.6 | 124 | 64.2 | 268 | 60.1 | <0.001 |
| Self- or family employed | 82 | 12.1 | 103 | 10.6 | 16 | 8.3 | 58 | 13.0 | |
| Other | 328 | 48.4 | 387 | 39.8 | 53 | 27.5 | 120 | 26.9 | |
| Living region | |||||||||
| City | 479 | 70.8 | 653 | 67.2 | 142 | 73.6 | 299 | 67.0 | 0.166 |
| Town/village | 198 | 29.2 | 319 | 32.8 | 51 | 26.4 | 147 | 33.0 | |
| Agricultural experience | |||||||||
| Without | 196 | 29.0 | 328 | 33.7 | 91 | 47.2 | 154 | 34.5 | <0.001 |
| With | 481 | 71.0 | 644 | 66.3 | 102 | 52.8 | 292 | 65.5 | |
| Self-rated health | |||||||||
| Good | 450 | 66.5 | 569 | 58.5 | 73 | 37.8 | 231 | 51.8 | <0.001 |
| Fair | 124 | 18.3 | 240 | 24.7 | 66 | 34.2 | 120 | 26.9 | |
| Poor | 103 | 15.2 | 163 | 16.8 | 54 | 28.0 | 95 | 21.3 | |
| Attitude toward healthy diet | |||||||||
| Without | 56 | 8.3 | 213 | 21.9 | 109 | 56.5 | 166 | 37.2 | <0.001 |
| With | 621 | 91.7 | 759 | 78.1 | 84 | 43.5 | 280 | 62.8 | |
| Subjective socioeconomic status | |||||||||
| Poor | 152 | 22.5 | 269 | 27.7 | 80 | 41.5 | 130 | 29.1 | <0.001 |
| Fair | 216 | 31.9 | 326 | 33.5 | 50 | 25.9 | 135 | 30.3 | |
| Good | 309 | 45.6 | 377 | 38.8 | 63 | 32.6 | 181 | 40.6 | |
| Subjective spare time | |||||||||
| Less | 151 | 22.3 | 283 | 29.1 | 61 | 31.6 | 125 | 28.0 | 0.018 |
| Neither | 150 | 22.2 | 211 | 21.7 | 47 | 24.4 | 105 | 23.5 | |
| Much | 376 | 55.5 | 478 | 49.2 | 85 | 44.0 | 216 | 48.4 | |
| p: chi-square test | |||||||||
Table 2.
Dietary habits according to subjective economic status, subjective spare time, and cooking behavior.
Table 2.
Dietary habits according to subjective economic status, subjective spare time, and cooking behavior.
| Eating balanced meals | Eating breakfast | ||||||||
| Not every day | Nearly every day | Not every day | Nearly every day | ||||||
| n | % | n | % | n | % | n | % | ||
| 1444 | 844 | 423 | 1865 | ||||||
| Subjective socioeconomic status | |||||||||
| Poor | 451 | 71.5 | 180 | 28.5 | 166 | 26.3 | 465 | 73.7 | |
| Fair | 476 | 65.5 | 251 | 34.5 | 127 | 17.5 | 600 | 82.5 | |
| Good | 517 | 55.6 | 413 | 44.4 | 130 | 14.0 | 800 | 86.0 | |
| p < 0.001 | p < 0.001 | ||||||||
| Subjective spare time | |||||||||
| Less | 435 | 70.2 | 185 | 29.8 | 163 | 26.3 | 457 | 73.7 | |
| Neither | 337 | 65.7 | 176 | 34.3 | 105 | 20.5 | 408 | 79.5 | |
| Much | 672 | 58.2 | 483 | 41.8 | 155 | 13.4 | 1000 | 86.6 | |
| p < 0.001 | p < 0.001 | ||||||||
| Cooking behavior | |||||||||
| Almost cook | 326 | 48.2 | 351 | 51.8 | 85 | 12.6 | 592 | 87.4 | |
| Partially cook | 674 | 69.3 | 298 | 30.7 | 158 | 16.3 | 814 | 83.7 | |
| Do not cook | 174 | 90.2 | 19 | 9.8 | 74 | 38.3 | 119 | 61.7 | |
| Do not prepare | 270 | 60.5 | 176 | 39.5 | 106 | 23.8 | 340 | 76.2 | |
| p < 0.001 | p < 0.001 | ||||||||
| p: Chi-square test | |||||||||
Table 3.
Relationship between dietary habits and combinations of cooking behavior and socioeconomic status: Logistic regression analyses.
Table 3.
Relationship between dietary habits and combinations of cooking behavior and socioeconomic status: Logistic regression analyses.
| Crude model | Adjusted model | |||||||
| OR | 95% CI | p | OR | 95% CI | p | |||
| Eating balanced meals | ||||||||
| Cooking behavior | Economic status | |||||||
| Almost cook | Poor | 1 | Reference | 1 | Reference | |||
| Fair | 1.266 | (0.833, 1.922) | 0.268 | 1.074 | (0.695, 1.657) | 0.748 | ||
| Good | 1.893 | (1.277, 2.803) | 0.001 | 1.555 | (1.029, 2.348) | 0.036 | ||
| Partially cook | Poor | 0.418 | (0.272, 0.640) | <0.001 | 0.500 | (0.320, 0.780) | 0.002 | |
| Fair | 0.495 | (0.330, 0.741) | 0.001 | 0.511 | (0.335, 0.779) | 0.002 | ||
| Good | 0.846 | (0.577, 1.239) | 0.391 | 0.777 | (0.519, 1.162) | 0.220 | ||
| Do not cook | Poor | 0.109 | (0.044, 0.264) | <0.001 | 0.214 | (0.084, 0.538) | 0.001 | |
| Fair | 0.085 | (0.025, 0.286) | <0.001 | 0.136 | (0.039, 0.469) | 0.002 | ||
| Good | 0.253 | (0.119, 0.533) | <0.001 | 0.332 | (0.151, 0.729) | 0.006 | ||
| Do not prepare | Poor | 0.709 | (0.436, 1.149) | 0.163 | 1.073 | (0.633, 1.816) | 0.793 | |
| Fair | 0.920 | (0.574, 1.472) | 0.729 | 1.212 | (0.721, 2.038) | 0.467 | ||
| Good | 0.969 | (0.626, 1.498) | 0.887 | 1.071 | (0.663, 1.728) | 0.780 | ||
| Cooking behavior | Spare time | |||||||
| Almost cook | Less | 1 | Reference | 1 | Reference | |||
| Neither | 0.961 | (0.611, 1.509) | 0.863 | 0.795 | (0.496, 1.273) | 0.341 | ||
| Much | 1.133 | (0.776, 1.654) | 0.516 | 0.776 | (0.517, 1.164) | 0.221 | ||
| Partially cook | Less | 0.318 | (0.209, 0.483) | <0.001 | 0.378 | (0.244, 0.584) | <0.001 | |
| Neither | 0.411 | (0.265, 0.634) | <0.001 | 0.432 | (0.273, 0.682) | <0.001 | ||
| Much | 0.530 | (0.365, 0.767) | 0.001 | 0.403 | (0.270, 0.599) | <0.001 | ||
| Do not cook | Less | 0.088 | (0.033, 0.232) | <0.001 | 0.163 | (0.059, 0.441) | <0.001 | |
| Neither | 0.092 | (0.031, 0.268) | <0.001 | 0.148 | (0.048, 0.445) | 0.001 | ||
| Much | 0.132 | (0.063, 0.273) | <0.001 | 0.159 | (0.073, 0.343) | <0.001 | ||
| Do not prepare | Less | 0.384 | (0.231, 0.635) | <0.001 | 0.564 | (0.327, 0.972) | 0.039 | |
| Neither | 0.515 | (0.307, 0.860) | 0.011 | 0.677 | (0.387, 1.181) | 0.169 | ||
| Much | 0.933 | (0.615, 1.414) | 0.746 | 0.890 | (0.557, 1.421) | 0.627 | ||
| Eating breakfast | ||||||||
| Cooking behavior | Economic status | |||||||
| Almost cook | Poor | 1 | Reference | 1 | Reference | |||
| Fair | 1.456 | (0.826, 2.566) | 0.194 | 1.175 | (0.646, 2.134) | 0.597 | ||
| Good | 2.266 | (1.288, 3.986) | 0.005 | 1.930 | (1.063, 3.501) | 0.031 | ||
| Partially cook | Poor | 0.723 | (0.440, 1.188) | 0.201 | 0.896 | (0.528, 1.517) | 0.683 | |
| Fair | 1.190 | (0.717, 1.973) | 0.501 | 1.331 | (0.777, 2.277) | 0.297 | ||
| Good | 1.801 | (1.070, 3.031) | 0.027 | 1.868 | (1.075, 3.242) | 0.026 | ||
| Do not cook | Poor | 0.397 | (0.215, 0.733) | 0.003 | 0.775 | (0.395, 1.518) | 0.457 | |
| Fair | 0.401 | (0.197, 0.815) | 0.012 | 0.765 | (0.354, 1.651) | 0.496 | ||
| Good | 0.301 | (0.157, 0.574) | <0.001 | 0.450 | (0.222, 0.908) | 0.026 | ||
| Do not prepare | Poor | 0.427 | (0.246, 0.736) | 0.002 | 0.665 | (0.364, 1.215) | 0.185 | |
| Fair | 0.863 | (0.481, 1.547) | 0.621 | 1.225 | (0.644, 2.331) | 0.536 | ||
| Good | 1.013 | (0.580, 1.768) | 0.965 | 1.208 | (0.656, 2.223) | 0.544 | ||
| Cooking behavior | Spare time | |||||||
| Almost cook | Less | 1 | Reference | 1 | Reference | |||
| Neither | 1.099 | (0.586, 2.061) | 0.767 | 0.818 | (0.424, 1.576) | 0.549 | ||
| Much | 1.633 | (0.944, 2.824) | 0.079 | 0.949 | (0.531, 1.697) | 0.861 | ||
| Partially cook | Less | 0.660 | (0.392, 1.108) | 0.116 | 0.835 | (0.486, 1.434) | 0.514 | |
| Neither | 0.784 | (0.450, 1.363) | 0.388 | 0.818 | (0.456, 1.465) | 0.500 | ||
| Much | 1.484 | (0.882, 2.496) | 0.137 | 0.986 | (0.568, 1.711) | 0.961 | ||
| Do not cook | Less | 0.254 | (0.130, 0.496) | <0.001 | 0.456 | (0.222, 0.932) | 0.032 | |
| Neither | 0.255 | (0.123, 0.526) | <0.001 | 0.379 | (0.173, 0.829) | 0.015 | ||
| Much | 0.385 | (0.205, 0.721) | 0.003 | 0.477 | (0.241, 0.943) | 0.034 | ||
| Do not prepare | Less | 0.283 | (0.161, 0.498) | <0.001 | 0.437 | (0.237, 0.803) | 0.008 | |
| Neither | 0.713 | (0.375, 1.353) | 0.301 | 0.969 | (0.485, 1.934) | 0.928 | ||
| Much | 1.012 | (0.572, 1.787) | 0.968 | 0.805 | (0.430, 1.504) | 0.497 | ||
| OR: odds ratios; 95% CI: 95% confidence intervals (lower limits, upper limits) Adjusted models: gender, age, employment status, living region, agricultural experience, self-rated health, attitude toward healthy diet. | ||||||||
Disclaimer/Publisher’s Note: The statements, opinions and data contained in all publications are solely those of the individual author(s) and contributor(s) and not of MDPI and/or the editor(s). MDPI and/or the editor(s) disclaim responsibility for any injury to people or property resulting from any ideas, methods, instructions or products referred to in the content. |
© 2023 by the authors. Licensee MDPI, Basel, Switzerland. This article is an open access article distributed under the terms and conditions of the Creative Commons Attribution (CC BY) license (http://creativecommons.org/licenses/by/4.0/).
Copyright: This open access article is published under a Creative Commons CC BY 4.0 license, which permit the free download, distribution, and reuse, provided that the author and preprint are cited in any reuse.


