
Submitted:
31 July 2023
Posted:
01 August 2023
You are already at the latest version
Abstract
Aim was to develop a population pharmacokinetic model for methotrexate (MTX) during high-dose treatment (HDMTX) in pediatric patients with acute lymphoblastic leukemia (ALL) and non-Hodgkin’s lymphoma (NHL) and to describe the sources of variability. The study included 50 patients (1-18 years) who received 3 or 5 g/m2 of HDMTX. Nonlinear mixed effects modeling approach was applied for data analysis. Parameter estimation was performed by FOCEI, whereas stepwise covariate modeling was used to assess variability factors. The final two-compartment model incorporates the effect of body weight using allometric scaling and the influence of hemoglobin and serum creatinine on MTX clearance (CL). Population pharmacokinetic values for a typical 70 kg subject were: 11 L/h for clearance (CL), 46.5 L and 16.4 L for volume of central (V1) and peripheral compartment (V2), respectively, and 0.168 L/h for intercompartmental clearance (Q). According to the final model, MTX CL decreases with increasing serum creatinine, whereas a positive effect was captured for hemoglobin. A difference of almost 30% in MTX CL was observed among patients’ hemoglobin values reported in the study. In addition to renal function and body weight, it describes the influence of hemoglobin on CL, allowing better understanding of its contribution to HDMTX disposition.
Keywords:
NONMEM
; covariate analysis
; PopPK
; therapeutic drug monitoring
; children.
1. Introduction
High-dose methotrexate (HDMTX) is used in various protocols for the treatment of acute lymphoblastic leukemia (ALL) and different types of non-Hodgkin’s lymphoma (NHL) [1,2,3]. Generally, the therapy for these conditions includes phases of induction, consolidation, re-induction, and maintenance. Intrathecal MTX, with or without HDMTX is the standard of care for prevention of CNS disease in children with ALL and NHL during intensive cytostatic treatment and through maintenance phase. HDMTX is applied during consolidation phase, with intrathecal MTX (dosage according to age) with every HDMTX [1]. However, the risk of toxicity with high-dose treatments is still a concern in clinical practice. Supportive treatments, including the introduction of antidote, hydration, and urine alkalization, as well as close monitoring of clinical and laboratory parameters, are essential to prevent toxicity [4,5,6,7]. In addition, the high variability in MTX pharmacokinetics requires routine drug monitoring to guide leucovorin dosing [4,5]. The incomplete understanding of covariates that may delay MTX elimination limits prediction of its individual exposure and further complicates therapy optimization. Our previous work focused on the relationship between biochemical and concomitant treatment characteristics and MTX concentrations adjusted for the administered dose. Although renal function, hemoglobin level, and concomitant medications explained a substantial portion of the variability in dose-normalized MTX concentration, the results of the regression analysis are subject to some limitations that can be overcome by population modeling analysis focusing on the variability in pharmacokinetic parameters [8].
Population pharmacokinetic modeling is a valuable tool for evaluating covariates with significant influence on pharmacokinetic parameters and the extent of their influence. Moreover, it can account for both between- and within-subject variability, enabling individual tailoring of therapy [9,10]. Several categories of covariates have been described in previous MTX models, but the results are not fully consistent [4]. Renal function is a major source of variation in MTX clearance (CL), characterized as either serum creatinine (SECR) or creatinine clearance [11,12,13,14,15,16,17,18]. Glomerular filtration rate (GFR) has been reported to explain 10% of the between- subject variability of MTX CL in infants and young children with brain tumors [15], whereas in an oncology study with a mixed population, CL varied 2.1-fold over the range of estimated GFR [19]. On the other hand, in a study of pediatric ALL patients, SECR did not improve model fit, while weight was selected as the main source of variability in pharmacokinetic parameters [20]. In addition, body surface area (BSA) has been frequently used as a covariate in population models [4,11,15,17], which is expected because of its correlation with GFR and the fact that MTX dose is depends mainly on BSA. In general, body size descriptors and/or age are often utilized in pediatric studies to reflect growth and organ development [4,21,22]. On the other hand, patient sex and genetic polymorphism have been less frequently considered in population models [4,23]. Considering the known interactions of MTX with non-steroidal anti-inflammatory drugs, proton pump inhibitors, antibiotics, or dexamethasone, one would expect that concomitant therapy could explain the variability in MTX elimination [4,24]. However, interactions have been described only occasionally in final pharmacokinetic models [4,13,15], and further evaluation is needed. Liver function has also been investigated because a small fraction of the drug undergoes hepatic metabolism [13]. In one study, alanine aminotransferase (ALT) correlated with MTX CL [25], whereas in another, the influence of albumin level on CL was captured [16]. Finally, MTX distribution into red blood cells suggests a possible effect of erythrocyte parameters on its disposition. However, the influence was tested only sporadically in adults [7,25] while an evaluation in pediatric patients is not available.
Despite various population pharmacokinetic models, there is still unexplained variability in MTX elimination, even when renal function and/or size descriptors are taken into account. Moreover, the results of previous studies regarding the factors contributing to this variability are not fully consistent, especially in the pediatric population. The objective of this study was to develop a population pharmacokinetic model for HDMTX in children with ALL and NHL and to evaluate the sources of pharmacokinetic variability. Specifically, the goal was to identify and quantify the effects of covariates on HDMTX CL, and to improve understanding of the contribution of erythrocyte parameters to between-subject pharmacokinetic variability.
2. Materials and Methods
2.1. Patient population and medical chart review
The Ethics Committee of the Institute for Mother and Child Healthcare of Serbia “Dr Vukan Čupić” approved the study protocol and retrospective collection of data from medical records. Pediatric patients (≤18 years) with ALL or NHL who received HDMTX, according to the treatment protocols ALL IC-BFM 2009, AIEOP LNH-97 and ALCL 99 in the period from 2007 to 2017, were included in the retrospective research. Availability of MTX concentration, along with MTX dose and duration of infusion, was mandatory. In addition, demographic characteristics of patients such as sex, age, height, and weight, as well as hematological and biochemical analysis including erythrocyte count (ER), hemoglobin (HGB), aspartate aminotransferase (AST), ALT, total bilirubin (TBIL), and SECR were collected. Information on concomitant therapy was also recorded, including drugs mandatory per applicable protocol and any others taken during MTX treatment. In the case of missing data of laboratory parameters, the closest value within the same cycle or the median value of all cycles for that patient was used.
2.2. HDMTX administration and monitoring
MTX was administered in doses of 3 or 5 g/m2 depending on the indication and risk group of the patient [1,2]. Intravenous hydration to maintain urine outflow, 3000 mL/m2/24 h 5% glucose/0.45% NaCl aa + 90 mmol/m2/24 h 7.45% KCl and to keep pH>7, with sodium bicarbonate (NaHCO3) quantum satis, was part of patient preparation that was following HDMTX. The HDMTX infusion lasted a total of 24 h, including the initial bolus of 10% of the dose administered during the first 30 minutes and the remaining within next 23.5 h. As part of standard clinical monitoring, plasma MTX concentrations were quantified using a chemiluminescent microparticle immunoassay (Abbott Architect i2000SR) at 24 and 48 h after the start of the infusion and later if needed. Leucovorin, in the dose of 15 mg/m2, was administered 42, 48, and 54 h after the start of MTX infusion. In case of prolonged MTX elimination, additional doses of leucovorin were administered according to the specific protocol algorithm. Details of the MTX therapeutic drug monitoring protocol are given in Škorić et al. [8].
2.3. Population pharmacokinetics analysis
Pharmacokinetic analysis was performed by non-linear mixed effect modeling approach using NONMEM® software (version 7.5.0, Icon Development Solutions, Elliot City, MD, USA) [26]. Graphical representation was performed using R® program [27]. The first-order conditional estimation method with interaction (FOCEI) was applied for parameter estimation. In the first step, the base model of HDMTX pharmacokinetics was evaluated. Two-compartment model with first-order elimination, implemented in ADVAN3 TRANS4 subroutine, was used to describe the concentration-time data. Theory-based allometry was incorporated into the base model, and pharmacokinetic parameters were scaled to the average adult body weight of 70 kg [28].
Inter-individual variability (IIV) was described by exponential model (1):
where Pi is parameter value of ith individual, θpop is typical population value for parameter of interest, ηpop is normally distributed random variable with mean equal to zero and variance ω2. Additive, proportional and combination error were tested for describing residual variability (2):
where Yij is observed concentration of ith individual at jth time point, Ypredij is predicted concentration of ith individual at jth time point, εpro and εadd are normally distributed proportional and additive error terms, respectively, with mean equal to zero and variance σ2.
Pi = θpop ∙ exp(ηpop),
Yij = Ypredij ∙ (1+εpro) + εadd,
Once the base model was built, the influence of covariates on MTX CL was investigated by stepwise covariate modeling. Each covariate was tested against the base model, and the significant covariate with the highest drop in objective function value (OFV) of at least 3.84 (p<0.05, 1 degree of freedom) was included. All covariates significant to previous model were gradually included in the forward step, and yielding the full model. In the backward step, the final model was obtained by removing the nonsignificant covariates from the full model. The covariates were kept in the final model only if removal from the full model resulted in an increase in OFV of at least 6.63 (p<0.01, 1 degree of freedom). Biochemical parameters such as AST, ALT, TBIL, ER, HGB, SECR were assessed as continuous, time-varying covariates. Patients’ sex and co-therapy with drugs that may increase MTX concentration according to the Lexicomp database (INCMTX) [29] were tested categorical covariates. INCMTX covariate included cotreatment with furosemide (present in 1.48% of concentration monitoring events), levetiracetam (1.69%), ibuprofen (1.27%), ciprofloxacin (0.84%), piperacillin/tazobactam (2.95%) and aspirin (0.42%).
The model appropriateness was evaluated by diagnostic plots including the agreement between the observed and predicted MTX concentrations. In addition, we inspected uniformity of the distribution of conditional weighted residuals (CWRES) versus population predicted concentrations and time after dose [30,31]. A nonparametric bootstrap of 1,000 replicates was used to assess the precision of the final model parameter estimates [9,32]. Furthermore, the prediction- and variability-corrected visual predictive check (pvcVPC) based on 1,000 simulations was used to evaluate the predictive performance of the final model [31,33].
3. Results
Fifty patients aged 1 to 18 years with ALL (50%) and NHL (50%) were included in the study. The male sex was more prevalent with 38 children. Patients received 184 cycles of HDMTX at doses from 3 g/m2 (19% of cycles) to 5 g/m2 (81% of cycles). Demographic and biochemical characteristic features of patients at the start of HDMTX treatment are given in Table 1. Details of number of MTX concentrations per the cycle, as well as its values compared to protocol reference range for the specific time-points are given in our previous work [8]. Data for modeling included 473 MTX concentrations (Figure 1), averaging 2.57 per patient per cycle.
The two-compartment model was parameterized in terms of CL, volume of the central compartment (V1), volume of the peripheral compartment (V2) and intercompartmental clearance (Q). Theory-based allometry was incorporated into the base model, assuming a fixed exponent of 0.75 for CL and Q, and 1.0 for V1 and V2. The proportional error model was selected for the residual intraindividual variability of MTX concentration. The OFV for the base model was 334.186.
During covariate modeling, effects of sex, INCMTX, SECR, ER, HGB, ALT, AST, and TBIL on CL were tested. The introduction of SECR as a covariate resulted in a 107.905 decrease in OFV, while the inclusion of HGB resulted in an additional 13.051 units drop in OFV. The influences of both covariates were best described by exponential models. After the backward step, selected variables were retained in the final model. According to the final model, population pharmacokinetic values, scaled to standard adult weight, were 11 L/h for CL (relative standard error: 5.1%), 46.5 L for V1 (relative standard error: 6.8%), 16.4 L for V2 (relative standard error: 11.6%) and 0.168 L/h for Q (relative standard error: 9.9%). While the inter-individual coefficient of variability for CL and η-shrinkage were 27.6% and 2.1%, respectively, the residual variability was estimated to be 52.7% and ε-shrinkage 3.6%. The parameters of the final model are presented in Table 2, along with the results of bootstrap analysis based on 992 successful runs.
Hence, final MTX population model is written in equation (3).
CL = 11 ∙ (WT/70)**0.75 ∙ exp(-0.0155∙(SECR-45)) ∙ exp(-0.00404∙(HGB-106.34)).
The relationship between MTX CL and HGB value is shown in Figure 2.
Goodness of fit plots of the final model are given in Figure 3. The population and individual predicted concentrations correlated well with the observed values, while CWRES plots demonstrated that most residuals distributed between -2 and +2.
Performance of the final model evaluated by pvcVPC is given in Figure 4.
4. Discussion
The present study describes HDMTX population pharmacokinetics in pediatric patients with ALL and NHL. The development of the two-compartment model was in line with most previous population analyzes [7,11,12,15,16,19,23,34], although models with one [13] or three compartments have occasionally been reported [17]. The effect of body weight was included at the beginning of modeling process using standard allometric scaling, whereas the effect of maturation was not considered, since only 2 patients were younger than 2 years [35]. After testing the effects of the remaining covariates on CL, only the influence of SECR and HGB was included the final pharmacokinetic model in addition to body weight. To our knowledge, this is the first population model to describe the influence of HGB on HDMTX CL variability in pediatric patients. According to the final model, population pharmacokinetic values, scaled to standard adult weight, were 11 L/h for CL, 46.5 L for V1, 16.4 L for V2 and 0.168 L/h for Q. The estimated pharmacokinetic parameters, and in particular CL, were close to previous reports that used the weight scaling approach [19,34].
Impact of renal function is consistent with previous studies describing MTX CL decrease with the increase of SECR [11,12,16,18,36]. In our analysis, a change in SECR values from 45 to 90 µmol/L resulted in a MTX CL decrease for 50.2% that complies with our previous results where lower creatinine clearance was associated with higher dose normalized MTX concentration [8]. It is not surprising, since the major route of MTX elimination is via the kidneys as unchanged drug (approximately 70-90%) [13]. However, the same alteration in SECR resulted in a decrease of CL of only 5.6% in the study by Johansson et al. [18], although the patients were older (4-51 years) and had osteosarcoma. On the other hand, a model developed in adult and pediatric patients with primary central nervous system lymphoma, suggests a reduction in CL for almost 30% within the same SECR variation [11]. Moreover, MTX CL varied 2.1-fold over the range of GFR from 40 to 387 mL/min/1.73 m2 in a mixed oncology population [19]. Nevertheless, in our analysis, estimates of GFR from SECR using standard formulas were not appropriate, since equations are based on weight already included in the model.
In contrast to renal function, red blood cell parameters have not been frequently described as covariates in population pharmacokinetic models. However, well-known MTX distribution in erythrocytes, polyglutamate formation, and long half-life of the drug in these cells put hematological parameters under the spotlight. Specifically, MTX enters red blood cells by reduce folate carrier and its intracellular metabolism includes addition of glutamate groups by the activity of folylpolyglutamate synthetase. Release from cells occurs through gamma glutamyl hydrolase activity and efflux via multi-drug resistance protein and breast cancer resistance protein [37]. To our knowledge, there are only two NONMEM models of HDMTX describing the influence of hematological parameters on its pharmacokinetics in oncology patients, and both included patients aged 14 years and older [7,25]. While Dupuis et al. reported an effect of HGB on MTX volume of distribution [25], only Nader et al. described a positive influence of hematocrit on CL. It was explained by the distribution of the drug in erythrocytes and the consequent decrease in serum levels, which was reflected in a higher CL [7]. In contrast to the aforementioned model, we managed to describe a positive impact of HGB level on HDMTX CL in pediatric patients. Due to high correlation, hematocrit was not tested simultaneously. According to our model, the difference between the lowest and the highest HGB levels corresponds to a difference of almost 30% in CL and it reflects 44% change in dose normalized MTX concentration, as previously reported [8]. In the study by Nader et al. a difference in CL of 50% was found over the whole range of hematocrit values [7]. This highlights the importance of monitoring hematological parameters, not only to assess toxicity, but also to predict the effects on drug levels during HDMTX.
HDMTX protocols include the use of multiple therapeutic agents [1,3] and frequently different kind of supportive therapy is required. Therefore, these patients are at high risk of drug-drug interactions, most of which also occur at the membrane transporter level [4,24]. In our analysis, we grouped drugs according to their potential to increase MTX levels based on data in Lexicomp database [29] and excluded those involved in routine protocols and administered in every patient. Similarly to our finding, most of previous studies failed to demonstrate the influence of co-therapy [7,11,38]. Although our previous multiple regression analysis showed increase in MTX concentrations with drugs in focus [8], the results of population analysis may be more reliable due to methodological advantages [10], and covariates were treated as time-varying during the analysis. Nevertheless, a few models explained some of the variability in pharmacokinetics by including concomitant medications [4], such as dexamethasone and/or vancomycin [13,15]. However, these drugs were not tested in our model because they were either part of the preparation of patients for HDMTX or the interaction was not documented in the Lexicomp database. In addition, assessment of liver function tests as a potential covariate affecting MTX CL did not result in a significant change in OFV and therefore, was not kept in the final model. This is in accordance with most previous studies and the fact that MTX undergoes only modest hepatic metabolism [4,7,11]. The influence of sex was also not detected in our model, which is supported by the majority of previous reports [4,11,12,13,17].
Some limitations of our study should be noted. The retrospective nature of the study allowed the collection of data available only in medical records. Hence, no information on genetic polymorphism could be obtained. Moreover, the sample size was relatively small. Nevertheless, the precision of the parameters in the final model implies valuable finding, especially considering that a vulnerable group of pediatric patients was studied. Individualization of MTX exposure is challenging due to numerous factors contributing to variability, even when accounting for renal function and/or body size descriptors.
5. Conclusions
Our findings provide important observations related to remaining unexplained variability. This was the first population model describing positive impact of HGB on MTX CL in pediatric patients in addition to weight and renal function. The developed model could therefore be useful in therapy optimization during HDMTX in patients with ALL and NHL. Further studies with a larger number of patients could be useful to confirm the results.
Author Contributions
Conceptualization, M.K. and K.V.; formal analysis, M.J. and B.Š.; interpretation of results, M.K. and K.V.; data curation, B.Š.; writing—original draft preparation, M.J. and B.Š.; writing—review and editing, M.K., B.M. and K.V.; supervision, K.V. All authors have read and agreed to the published version of the manuscript.
Funding
This research was funded by the Ministry of Science, Technological Development and Innovation, Republic of Serbia through Grant Agreement with University of Belgrade - Faculty of Pharmacy No: 451-03-47/2023-01/200161.
Institutional Review Board Statement
The study was conducted in accordance with the Declaration of Helsinki, and approved by the Ethics Committee of the Institute for Mother and Child Healthcare of Serbia “Dr Vukan Čupić” (protocol code 8/27).
Informed Consent Statement
Patient consent was waived due to retrospective nature of the study, and all data were part of routine clinical care.
Data Availability Statement
Data is unavailable due to privacy or ethical restrictions.
Conflicts of Interest
The authors declare no conflict of interest.
References
- Campbell, M. ALL IC-BFM 2009 – A randomized trial of the I-BFM-SG for the management of childhood non-b acute lymphoblastic leukemia. 2009. [Google Scholar]
- Pillon, M.; Arico, M.; Mussolin, L.; Carraro, E.; Conter, V.; Sala, A.; Buffardi, S.; Garaventa, A.; D'Angelo, P.; Lo Nigro, L.; et al. Long-term results of the AIEOP LNH-97 protocol for childhood lymphoblastic lymphoma. Pediatr Blood Cancer 2015, 62, 1388–1394. [Google Scholar] [CrossRef] [PubMed]
- ALCL 99 International protocol for the treatment of childhood anaplastic large cell lymphoma. Available online: https://www.skion.nl/workspace/uploads/alcl-99.pdf. 2000. (accessed on 1 October 2022).
- Zhang, Y.; Sun, L.; Chen, X.; Zhao, L.; Wang, X.; Zhao, Z.; Mei, S. A systematic review of population pharmacokinetic models of methotrexate. Eur J Drug Metab Pharmacokinet 2022, 47, 143–164. [Google Scholar] [CrossRef] [PubMed]
- Howard, S.C.; McCormick, J.; Pui, C.H.; Buddington, R.K.; Harvey, R.D. Preventing and managing toxicities of high-dose methotrexate. The Oncologist 2016, 21, 1471–1482. [Google Scholar] [CrossRef]
- Treon, S.P.; Chabner, B.A. Concepts in use of high-dose methotrexate therapy. Clin Chem 1996, 42, 1322–1329. [Google Scholar] [CrossRef]
- Nader, A.; Zahran, N.; Alshammaa, A.; Altaweel, H.; Kassem, N.; Wilby, K.J. Population pharmacokinetics of intravenous methotrexate in patients with hematological malignancies: utilization of routine clinical monitoring parameters. Eur J Drug Metab Pharmacokinet 2017, 42, 221–228. [Google Scholar] [CrossRef] [PubMed]
- Skoric, B.; Kuzmanovic, M.; Jovanovic, M.; Miljkovic, B.; Micic, D.; Jovic, M.; Jovanovic, A.; Vucicevic, K. Methotrexate concentrations and associated variability factors in high dose therapy of children with acute lymphoblastic leukemia and non-Hodgkin lymphoma. Pediatr Hematol Oncol 2023, 1–12. [Google Scholar] [CrossRef]
- Mould, D.R.; Upton, R.N. Basic concepts in population modeling, simulation, and model-based drug development-part 2: introduction to pharmacokinetic modeling methods. CPT: PSP 2013, 2, e38. [Google Scholar] [CrossRef]
- Roganović, M.; Homšek, A.; Jovanović, M.; Topić Vučenović, V.; M., Ć.; Miljković, B.; Vučićević, K. Concept and utility of population pharmacokinetic and pharmacokinetic/pharmacodynamic models in drug development and clinical practice Arh farm 2021, 71, 336–353. [CrossRef]
- Mei, S.; Li, X.; Jiang, X.; Yu, K.; Lin, S.; Zhao, Z. Population pharmacokinetics of high-dose methotrexate in patients with primary central nervous system lymphoma. J Pharm Sci 2018, 107, 1454–1460. [Google Scholar] [CrossRef]
- Faltaos, D.W.; Hulot, J.S.; Urien, S.; Morel, V.; Kaloshi, G.; Fernandez, C.; Xuan k, H.; Leblond, V.; Lechat, P. Population pharmacokinetic study of methotrexate in patients with lymphoid malignancy. Cancer Chemother Pharmacol 2006, 58, 626–633. [Google Scholar] [CrossRef]
- Shi, Z.Y.; Liu, Y.O.; Gu, H.Y.; Xu, X.Q.; Yan, C.; Yang, X.Y.; Yan, D. Population pharmacokinetics of high-dose methotrexate in Chinese pediatric patients with medulloblastoma. Biopharm Drug Dispos 2020, 41, 101–110. [Google Scholar] [CrossRef] [PubMed]
- Fukuhara, K.; Ikawa, K.; Morikawa, N.; Kumagai, K. Population pharmacokinetics of high-dose methotrexate in Japanese adult patients with malignancies: a concurrent analysis of the serum and urine concentration data. J Clin Pharm Ther 2008, 33, 677–684. [Google Scholar] [CrossRef] [PubMed]
- Panetta, J.C.; Roberts, J.K.; Huang, J.; Lin, T.; Daryani, V.M.; Harstead, K.E.; Patel, Y.T.; Onar-Thomas, A.; Campagne, O.; Ward, D.A.; et al. Pharmacokinetic basis for dosing high-dose methotrexate in infants and young children with malignant brain tumours. Br J Clin Pharmacol 2020, 86, 362–371. [Google Scholar] [CrossRef]
- Pai, M.P.; Debacker, K.C.; Derstine, B.; Sullivan, J.; Su, G.L.; Wang, S.C. Comparison of body size, morphomics, and kidney function as covariates of high-dose methotrexate clearance in obese adults with primary central nervous system lymphoma. Pharmacother 2020, 40, 308–319. [Google Scholar] [CrossRef] [PubMed]
- Taylor, Z.L.; Mizuno, T.; Punt, N.C.; Baskaran, B.; Navarro Sainz, A.; Shuman, W.; Felicelli, N.; Vinks, A.A.; Heldrup, J.; Ramsey, L.B. MTXPK.org: a clinical decision support tool evaluating high-dose methotrexate pharmacokinetics to inform post-infusion care and use of glucarpidase. Clin Pharmacol Ther 2020, 108, 635–643. [Google Scholar] [CrossRef]
- Johansson, A.M.; Hill, N.; Perisoglou, M.; Whelan, J.; Karlsson, M.O.; Standing, J.F. A population pharmacokinetic/pharmacodynamic model of methotrexate and mucositis scores in osteosarcoma. Ther Drug Monit 2011, 33, 711–718. [Google Scholar] [CrossRef]
- Kawakatsu, S.; Nikanjam, M.; Lin, M.; Le, S.; Saunders, I.; Kuo, D.J.; Capparelli, E.V. Population pharmacokinetic analysis of high-dose methotrexate in pediatric and adult oncology patients. Cancer Chemother Pharmacol 2019, 84, 1339–1348. [Google Scholar] [CrossRef]
- Jonsson, P.; Skarby, T.; Heldrup, J.; Schroder, H.; Hoglund, P. High dose methotrexate treatment in children with acute lymphoblastic leukaemia may be optimised by a weight-based dose calculation. Pediatr Blood Cancer 2011, 57, 41–46. [Google Scholar] [CrossRef]
- Hui, K.H.; Chu, H.M.; Fong, P.S.; Cheng, W.T.F.; Lam, T.N. Population pharmacokinetic study and individual dose adjustments of high-dose methotrexate in Chinese pediatric patients with acute lymphoblastic leukemia or osteosarcoma. J Clin Pharmacol 2019, 59, 566–577. [Google Scholar] [CrossRef]
- Wright, K.D.; Panetta, J.C.; Onar-Thomas, A.; Reddick, W.E.; Patay, Z.; Qaddoumi, I.; Broniscer, A.; Robinson, G.; Boop, F.A.; Klimo, P., Jr.; et al. Delayed methotrexate excretion in infants and young children with primary central nervous system tumors and postoperative fluid collections. Cancer Chemother Pharmacol 2015, 75, 27–35. [Google Scholar] [CrossRef]
- Kotnik, B.F.; Grabnar, I.; Grabar, P.B.; Dolzan, V.; Jazbec, J. Association of genetic polymorphism in the folate metabolic pathway with methotrexate pharmacokinetics and toxicity in childhood acute lymphoblastic leukaemia and malignant lymphoma. Eur J Clin Pharmacol 2011, 67, 993–1006. [Google Scholar] [CrossRef] [PubMed]
- Leveque, D.; Santucci, R.; Gourieux, B.; Herbrecht, R. Pharmacokinetic drug-drug interactions with methotrexate in oncology. Expert Rev Clin Pharmacol 2011, 4, 743–750. [Google Scholar] [CrossRef] [PubMed]
- Dupuis, C.; Mercier, C.; Yang, C.; Monjanel-Mouterde, S.; Ciccolini, J.; Fanciullino, R.; Pourroy, B.; Deville, J.L.; Duffaud, F.; Bagarry-Liegey, D.; et al. High-dose methotrexate in adults with osteosarcoma: a population pharmacokinetics study and validation of a new limited sampling strategy. Anti-Cancer Drugs 2008, 19, 267–273. [Google Scholar] [CrossRef] [PubMed]
- Boeckmann, A.J.; Sheiner, L.B.; Beal, S.L. NONMEM Users Guides. Ellicott City, MD: Icon Development Solutions. 1989-2011.
- R Core Team. R: A Language and Environment for Statistical Computing; R Foundation for Statistical Computing: Vienna, Austria; Available online: http://www.R-project.org.
- Anderson, B.J.; Holford, N.H. Mechanism-based concepts of size and maturity in pharmacokinetics. Annu Rev Pharmacol Toxicol 2008, 48, 303–332. [Google Scholar] [CrossRef]
- Lexi-Interact®. Lexicomp Online®. Wolters Kluwer Clinical Drug Information. Available online: https://online.lexi.com/lco/action/login. (accessed on 1 October 2022).
- Hooker, A.C.; Staatz, C.E.; Karlsson, M.O. Conditional weighted residuals (CWRES): a model diagnostic for the FOCE method. Pharm Res 2007, 24, 2187–2197. [Google Scholar] [CrossRef]
- Karlsson, M.O.; Savic, R.M. Diagnosing model diagnostics. Clin Pharmacol Ther 2007, 82, 17–20. [Google Scholar] [CrossRef]
- Parke, J.; Holford, N.H.; Charles, B.G. A procedure for generating bootstrap samples for the validation of nonlinear mixed-effects population models. Comput Methods Programs Biomed 1999, 59, 19–29. [Google Scholar] [CrossRef]
- Bergstrand, M.; Hooker, A.C.; Wallin, J.E.; Karlsson, M.O. Prediction-corrected visual predictive checks for diagnosing nonlinear mixed-effects models. AAPS J 2011, 13, 143–151. [Google Scholar] [CrossRef]
- Beechinor, R.J.; Thompson, P.A.; Hwang, M.F.; Vargo, R.C.; Bomgaars, L.R.; Gerhart, J.G.; Dreyer, Z.E.; Gonzalez, D. The population pharmacokinetics of high-dose methotrexate in infants with acute lymphoblastic leukemia highlight the need for bedside individualized dose adjustment: a report from the children's oncology group. Clin Pharmacokinet 2019, 58, 899–910. [Google Scholar] [CrossRef]
- Jovanović, M.; Vučićević, K. Pediatric pharmacokinetic considerations and implications for drug dosing. Arh farm 2020, 72, 340–352. [Google Scholar] [CrossRef]
- Ruhs, H.; Becker, A.; Drescher, A.; Panetta, J.C.; Pui, C.H.; Relling, M.V.; Jaehde, U. Population PK/PD model of homocysteine concentrations after high-dose methotrexate treatment in patients with acute lymphoblastic leukemia. PloS One 2012, 7, e46015. [Google Scholar] [CrossRef] [PubMed]
- de Beaumais, T.A.; Jacqz-Aigrain, E. Intracellular disposition of methotrexate in acute lymphoblastic leukemia in children. Curr Drug Metab 2012, 13, 822–834. [Google Scholar] [CrossRef] [PubMed]
- Min, Y.; Qiang, F.; Peng, L.; Zhu, Z. High dose methotrexate population pharmacokinetics and Bayesian estimation in patients with lymphoid malignancy. Biopharm Drug Dispos 2009, 30, 437–447. [Google Scholar] [CrossRef] [PubMed]
Figure 1.
Observed methotrexate (MTX) concentrations vs. time after the start of infusion (A), and for the first 48 h after the start of infusion (B).
Figure 1.
Observed methotrexate (MTX) concentrations vs. time after the start of infusion (A), and for the first 48 h after the start of infusion (B).
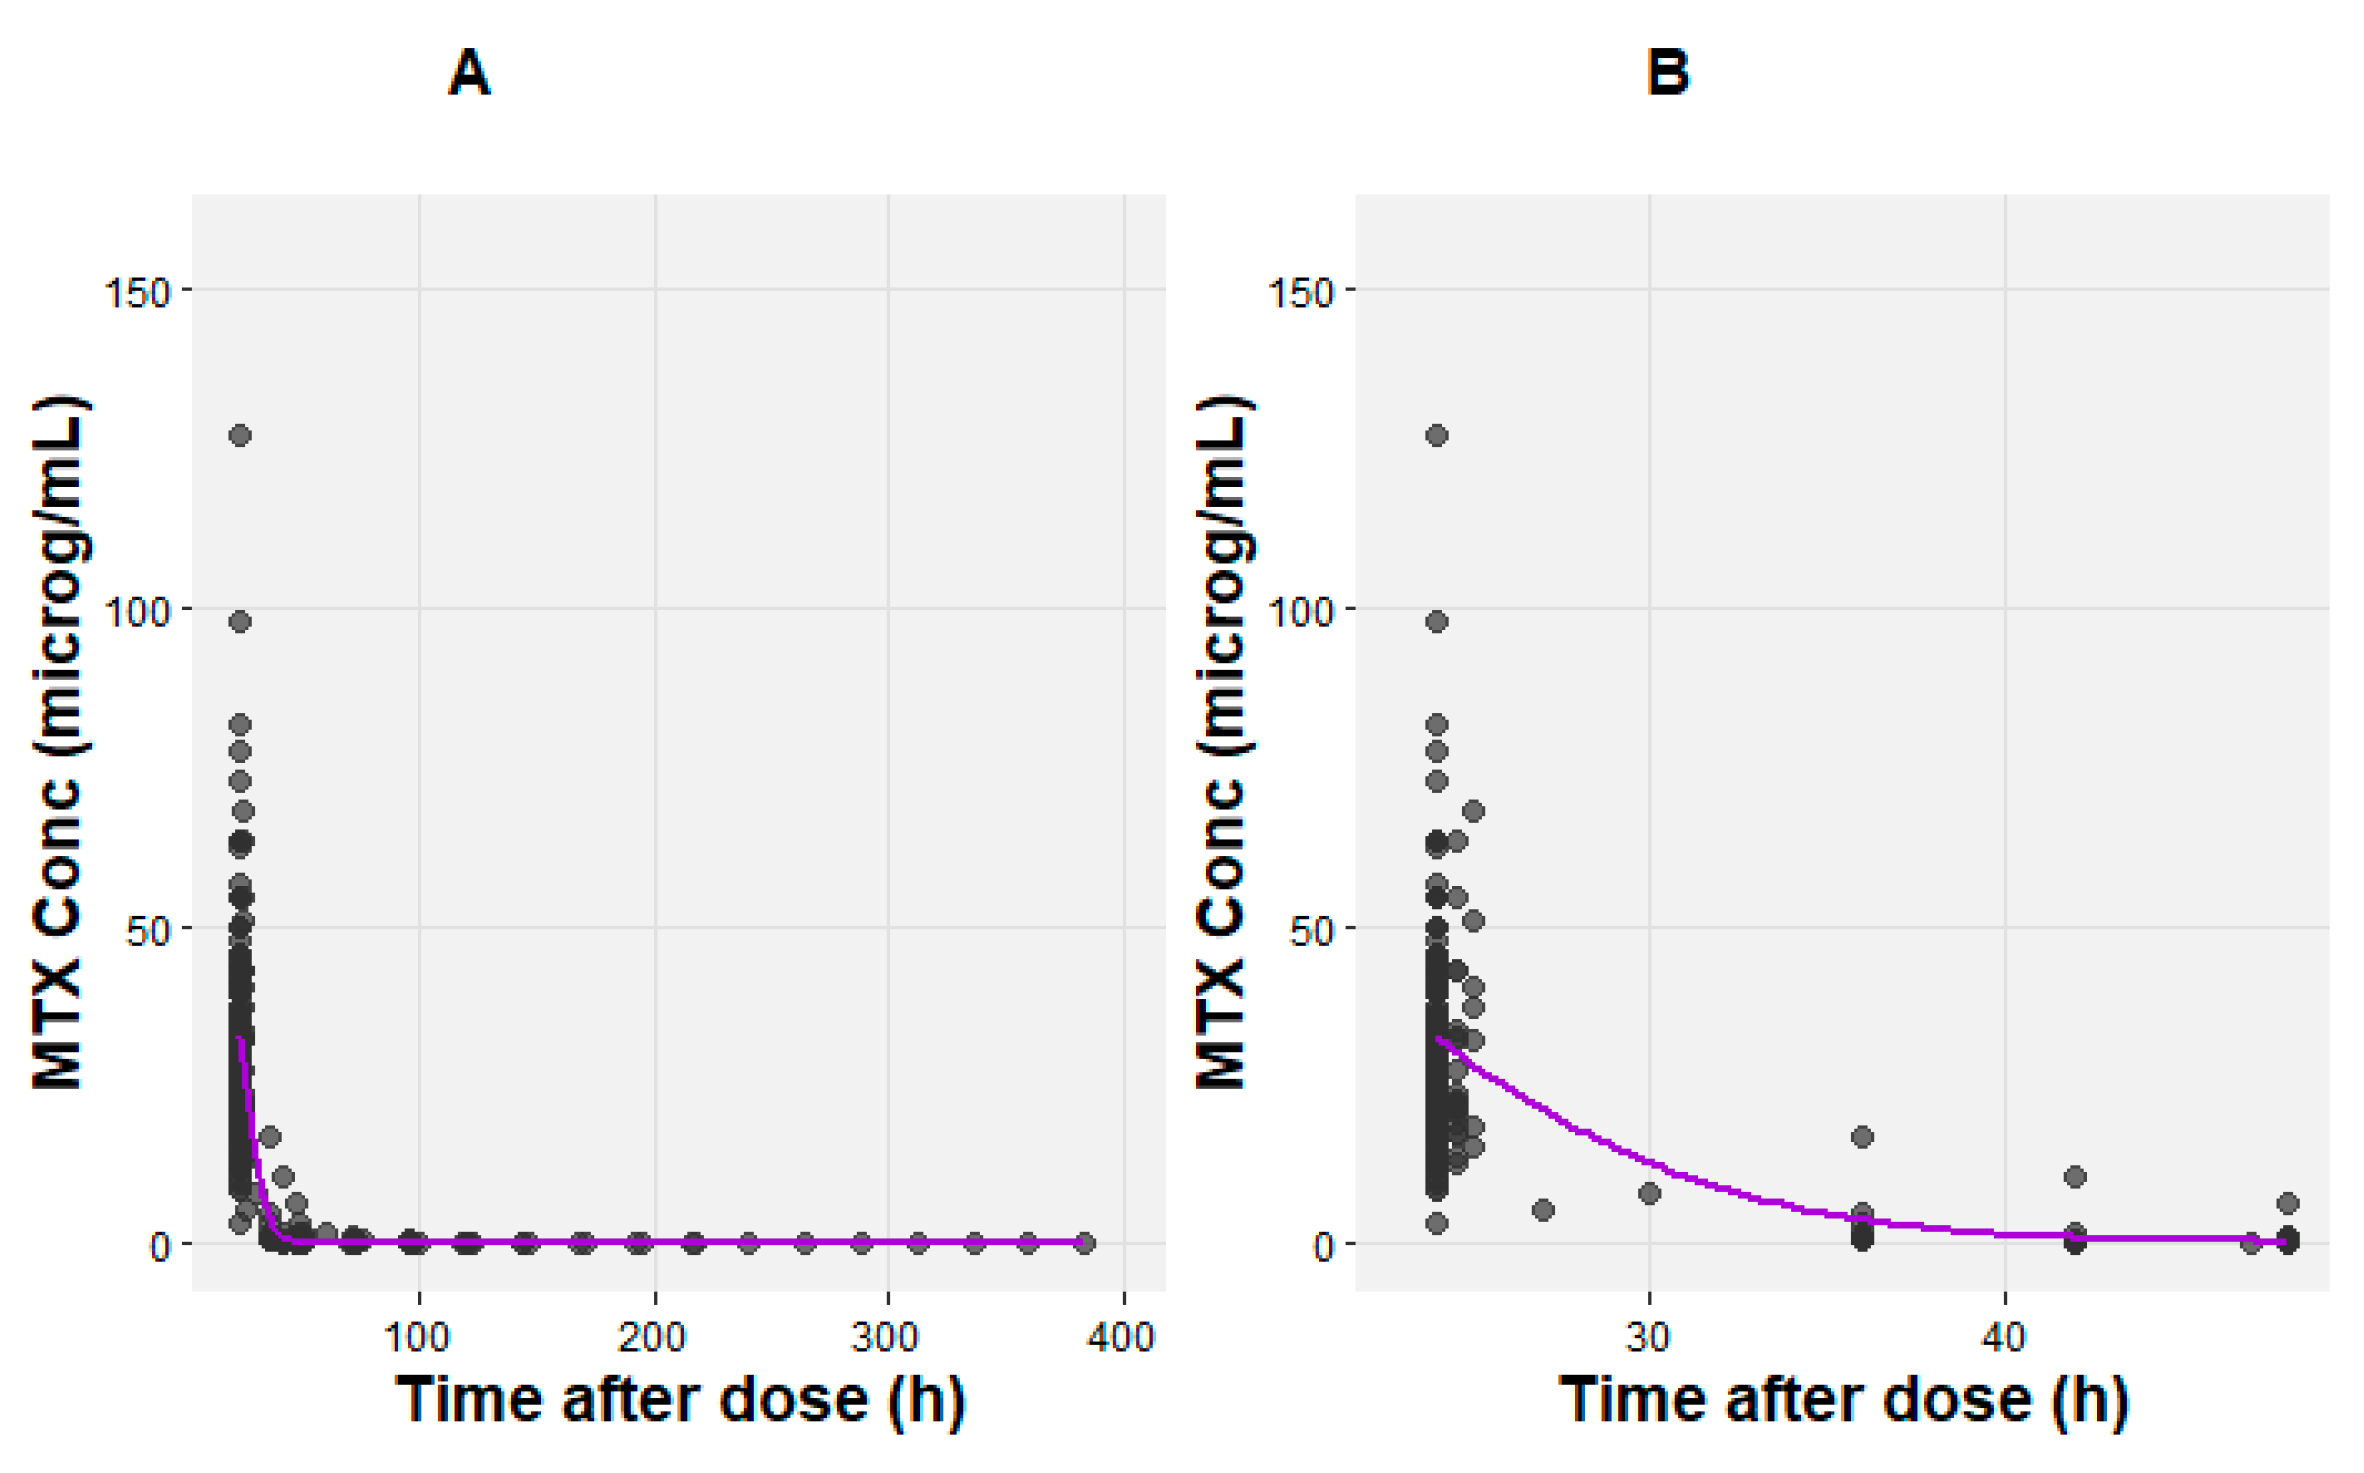
Figure 2.
Methotrexate (MTX) clearance (CL) vs. hemoglobin. The purple line represents LOESS curve.
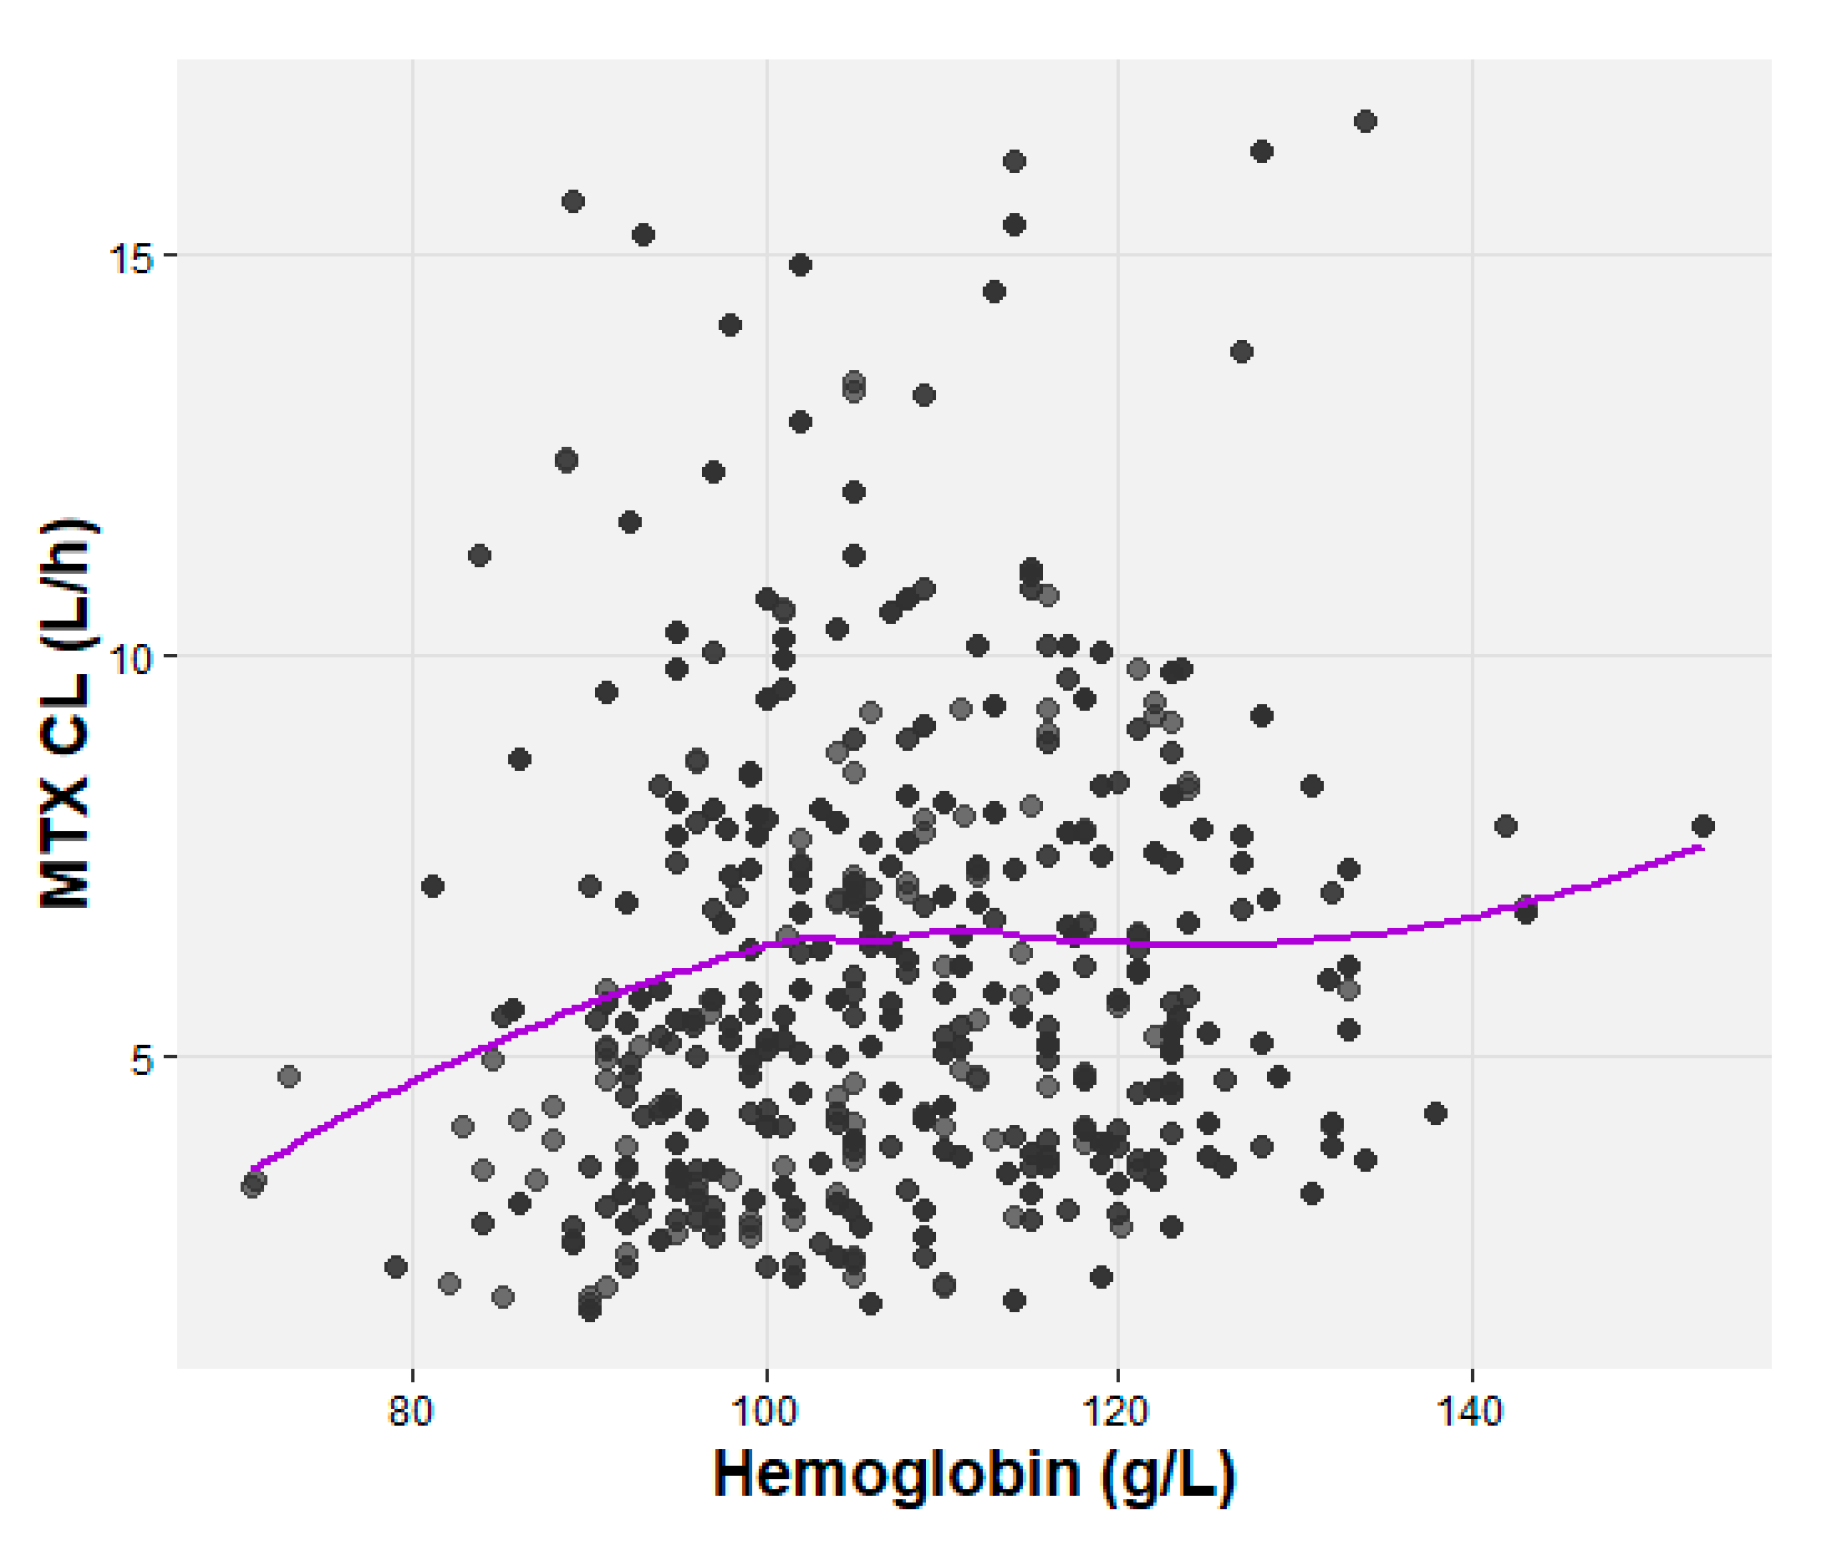
Figure 3.
Diagnostic plots of the final methotrexate (MTX) model. Line of identity (grey), regression line (purple). (A) The observed concentrations (DV) vs. individual predicted concentrations (IPRED), and (B) population predicted concentrations (PRED), (C) Conditional weighted residuals (CWRES) vs. time after dose, and (D) population predicted concentrations (PRED).
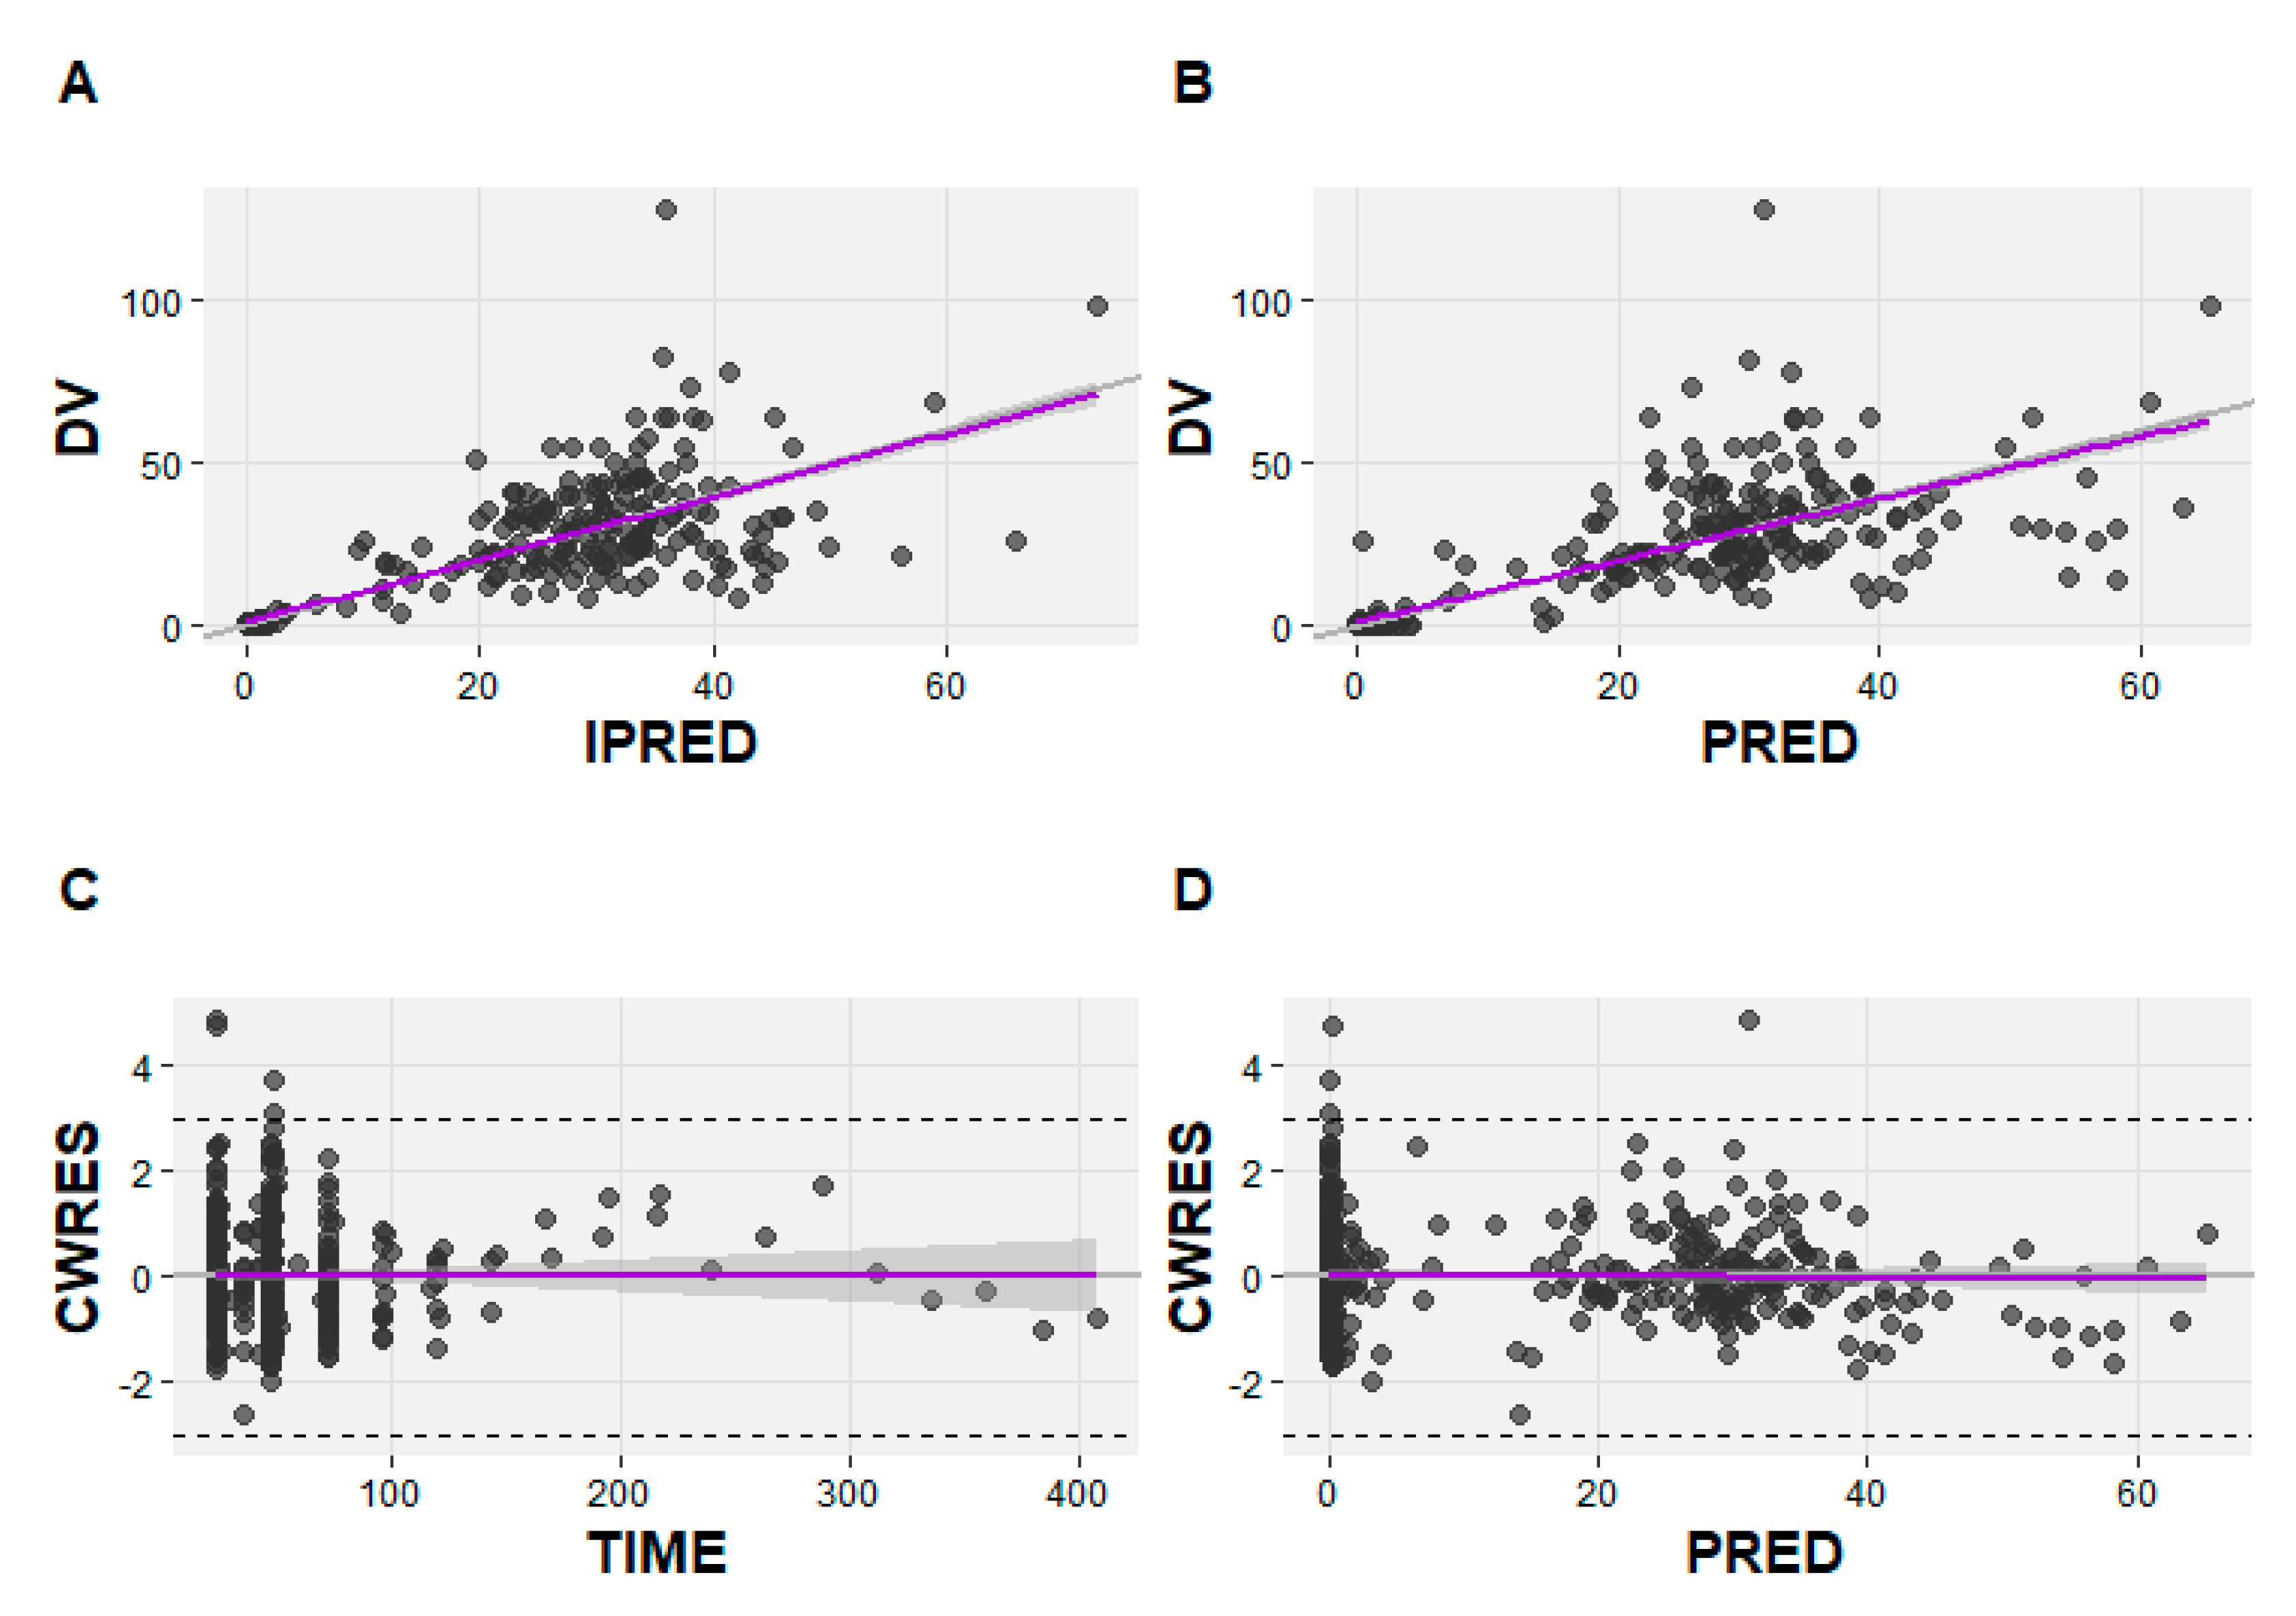
Figure 4.
Final model prediction- and variability-corrected visual predictive check (pvcVPC) of the first 48 h after the start of infusion. Solid and dashed lines represent the median, 5th and 95th percentiles of the simulated data.
Figure 4.
Final model prediction- and variability-corrected visual predictive check (pvcVPC) of the first 48 h after the start of infusion. Solid and dashed lines represent the median, 5th and 95th percentiles of the simulated data.
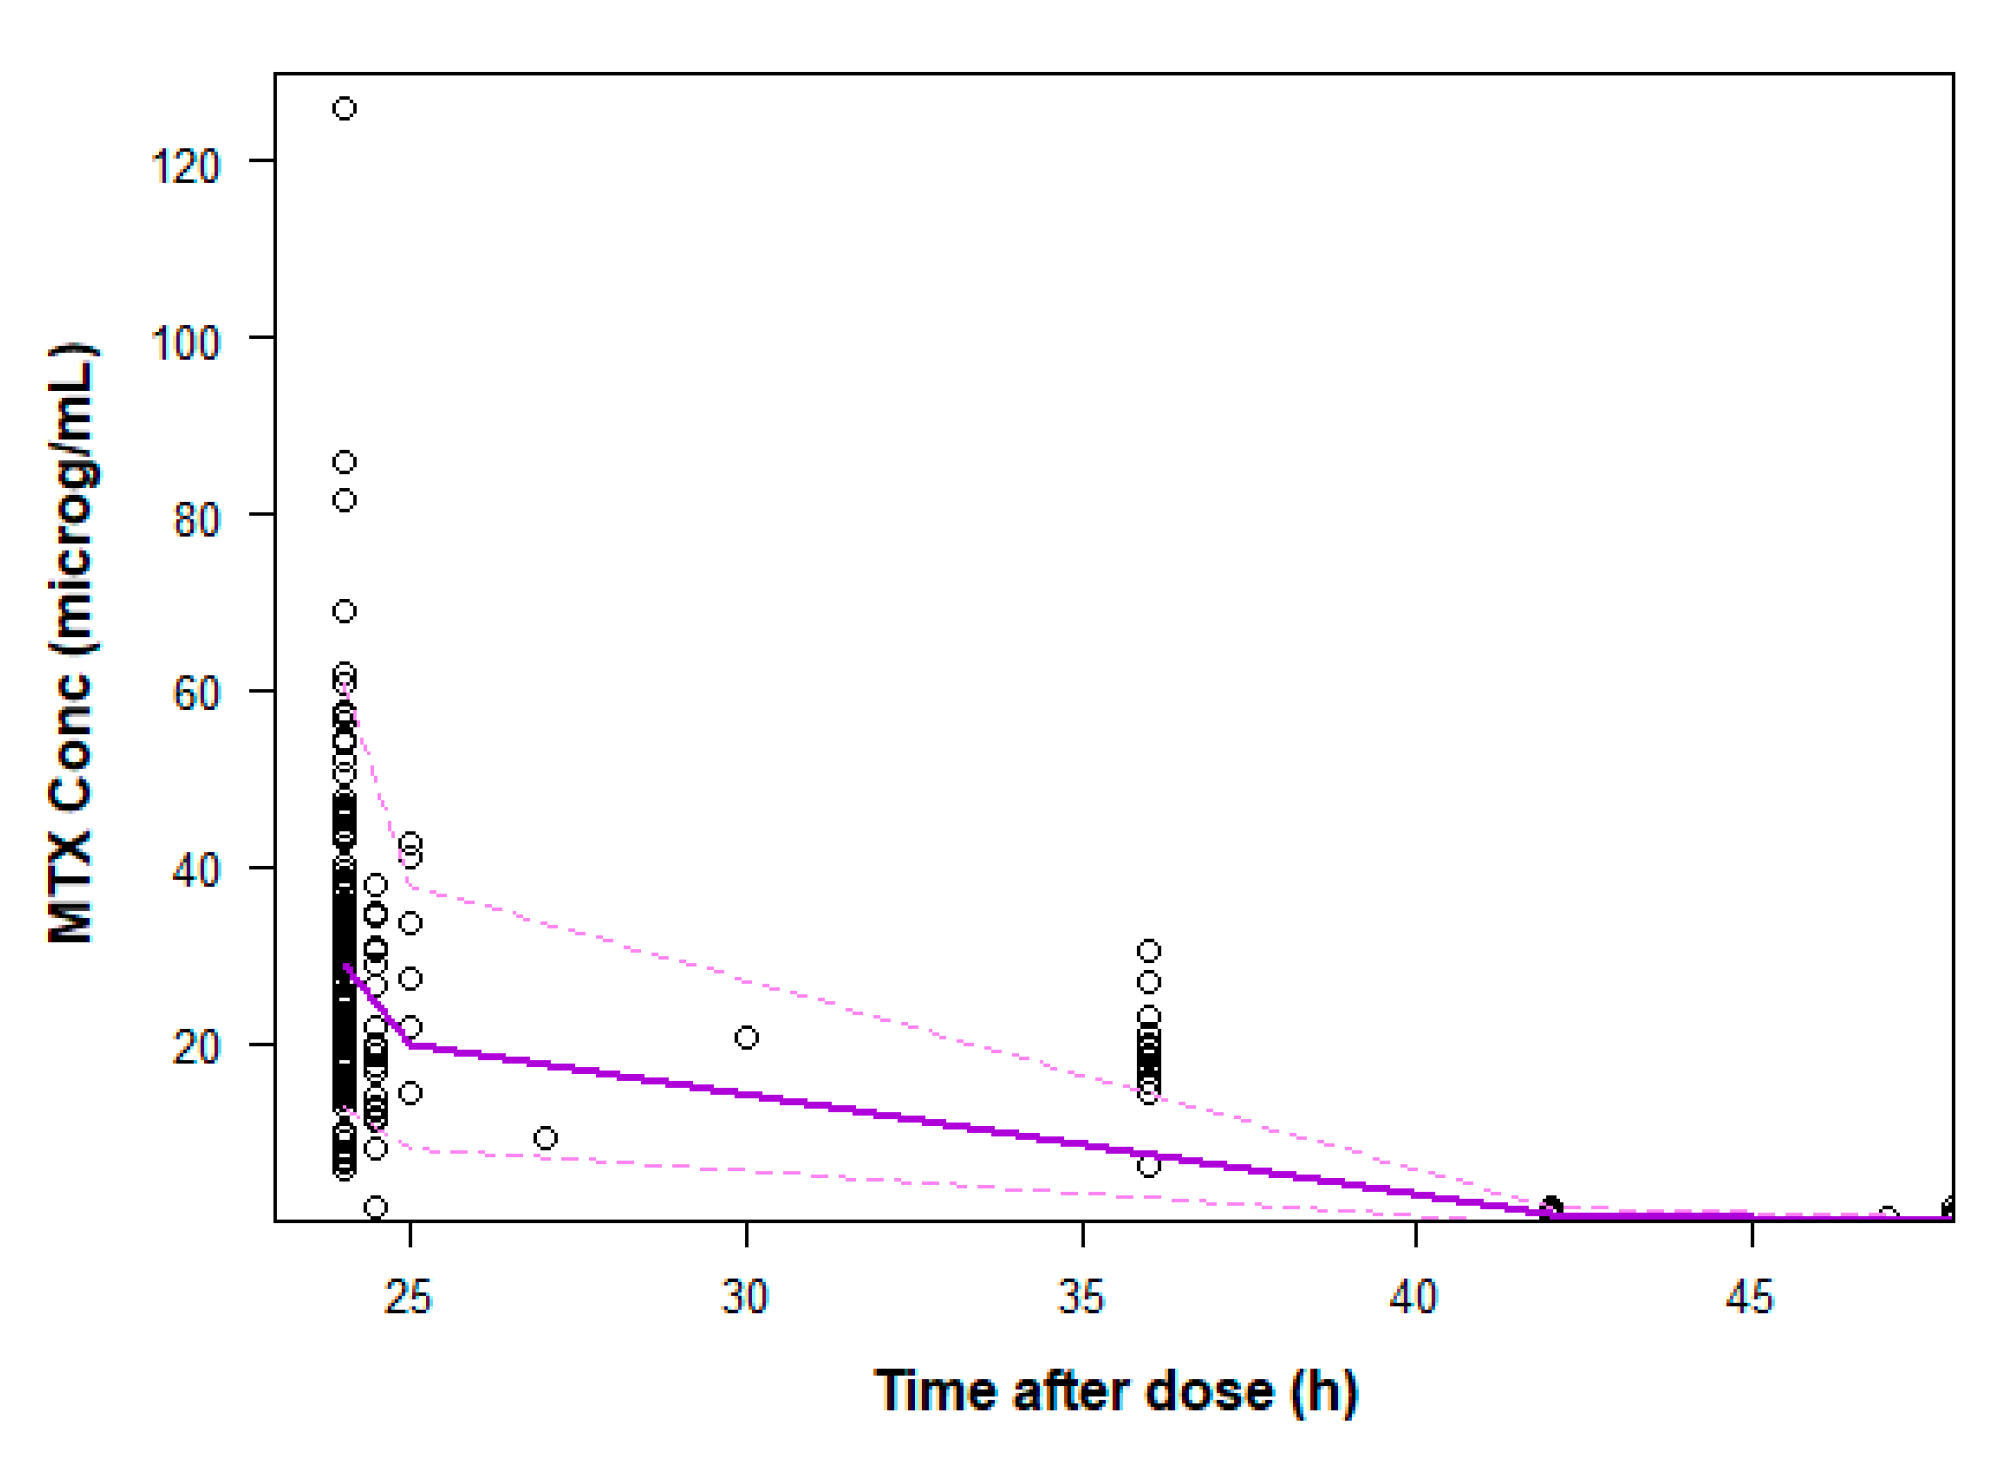

Table 1.
Demographic, biochemical and therapy characteristics of patients at the start of high-dose methotrexate (HDMTX) treatment.
Table 1.
Demographic, biochemical and therapy characteristics of patients at the start of high-dose methotrexate (HDMTX) treatment.
| Characteristic (units) | ALL (n=25) | NHL (n=25) |
|---|---|---|
| Mean ± SD (range) | ||
| Age (years) | 8.58 ± 5.27 (1 – 18) | 10.04 ± 3.74 (4 – 18) |
| BSA (m2) | 1.089 ± 0.41 (0.49 – 1.73) | 1.23 ± 0.41 (0.61 – 2.22) |
| Body weight (kg) | 33.03 ± 16.97 (10.3 – 60.1) | 39.27 ± 20.62 (13.9 – 91) |
| BMI (kg/m2) | 17.33 ± 2.56 (12.83 – 23.09) | 17.89 ± 3.88 (11.72 – 27.93) |
| SECR (μmol/L) | 46.42 ± 16.62 (14 – 100) | 51.12 ± 13.44 (31 – 75) |
| ALT (U/L) | 37.48 ± 29.74 (10 – 119) | 51.31 ± 35.86 (11 – 129) |
| AST (U/L) | 33.35 ± 20.48 (11 – 114) | 38.37 ± 34.16 (10 – 158) |
| Total bilirubin (μmol/L) | 9.98 ± 7.12 (3.1 – 29.5) | 10.15 ± 4.72 (3 – 21) |
| Erythrocyte (1012/L) | 3.63 ± 0.44 (2.71 – 4.72) | 4.37 ± 0.68 (3.06 – 5.63) |
| Hemoglobin (g/L) | 106.66 ± 12.90 (81 – 132) | 115.80 ± 16.26 (92 – 153) |
| Hematocrit, HCT (%) | 30.56 ± 3.98 (23.7 – 39.7) | 33.98 ± 5.00 (26.35 – 46.20) |
ALL - acute lymphoblastic leukemia; NHL - non-Hodgkin’s lymphoma; SD - standard deviation; BSA - body surface area; BMI – body mass index; SECR - serum creatinine; ALT- alanine aminotransferase; AST - aspartate aminotransferase.
Table 2.
Pharmacokinetic parameters of the final MTX model and bootstrap results.
| Original dataset | Bootstrap datasets | ||
|---|---|---|---|
| Parameter | Estimated value | Median | 95% CI |
| θCL (L/h/70 kg) | 11 | 10.96 | 10.02 - 12.12 |
| θV1 (L/70 kg) | 46.5 | 46.00 | 39.00 - 52.94 |
| θV2 (L/70 kg) | 16.4 | 15.98 | 6.535 - 20.51 |
| θQ (L/h/70 kg) | 0.168 | 0.164 | 0.124 - 0.201 |
| θSECR | -0.0155 | -0.0156 | -0.0196 - 0.00872 |
| θHGB | 0.00404 | 0.00394 | 0.000461 - 0.00827 |
| IIVCL (CV%) | 27.6% | 26.3% | 18.1 - 35.3 |
| Proportional error | 0.527 | 0.521 | 0.455 - 0.592 |
CI - confidence interval; CV - coefficient of variation; IIVCL - interindividual variability of CL; θCL - typical value for clearance (CL); θV1 - typical value for the volume of central compartment (V1); θV2 - typical value for the volume of the peripheral compartment (V2); θQ - typical value for intercompartmental clearance (Q); θSECR - influence of serum creatinine (SECR) on CL; θHGB - influence of hemoglobin (HGB) on CL; WT - body weight.
Disclaimer/Publisher’s Note: The statements, opinions and data contained in all publications are solely those of the individual author(s) and contributor(s) and not of MDPI and/or the editor(s). MDPI and/or the editor(s) disclaim responsibility for any injury to people or property resulting from any ideas, methods, instructions or products referred to in the content. |
© 2023 by the authors. Licensee MDPI, Basel, Switzerland. This article is an open access article distributed under the terms and conditions of the Creative Commons Attribution (CC BY) license (http://creativecommons.org/licenses/by/4.0/).
Copyright: This open access article is published under a Creative Commons CC BY 4.0 license, which permit the free download, distribution, and reuse, provided that the author and preprint are cited in any reuse.


