Submitted:
26 July 2023
Posted:
28 July 2023
You are already at the latest version
Abstract
The objectives of this research were to determine 1) the energy contents of broken rice in dairy cows by animal calorimetry and 2) the effects of various levels of broken rice in diets on dairy cow performance. Four multiparous Holstein-Friesian crossbred cows at 70 ± 31 (mean ± SD) days in milk were assigned according to a 4 × 4 Latin square design with four periods. The four treatments included a diet substitution with broken rice on a 0, 12, 24, and 36% dry matter basis in the basal ration. Indirect calorimetry with a ventilated head box respiration system was used to determine energy metabolism. The substitution of broken rice in the diet did not affect dry matter intake, milk yield, milk composition, feed efficiency or energy balance (p > 0.05). Increasing broken rice substitution in the diet resulted in a linear increase in enteric methane energy losses and digestibility of dry matter, organic matter, and fiber (p < 0.05), whereas the digestibility of crude protein and ether extract decreased (p < 0.05). The metabolizable energy requirement for maintenance was 504 kJ/kg metabolic body weight, and the efficiency of metabolizable energy used for lactation was 0.76. The estimated net energy value of broken rice for lactation was 8.68 MJ/kg. Our results indicated that increasing the proportion of broken rice in the diet up to 36% had no adverse effect on feed intake and production performance in dairy cows.
Keywords:
dairy cow
; broken rice
; indirect calorimetry
; energy
1. Introduction
The evaluation of innovative feed ingredients is essential for the long-term improvement of livestock productivity. The most common method to determine the energy values of individual feedstuffs is open-circuit whole animal respiration chambers, in which heat production is indirectly measured using respiratory gas exchange and methane emission [1]. Determining the energy value of diet feedstuffs will allow for a more accurate diet formulation for lactating dairy cows [1–3]. Recently, Foth et al. [2] determined that the energy content of reduced-fat dried distiller grains with soluble metabolizable energy (ME) was 14.3 MJ/kg, and the net energy for lactation was 8.5 MJ/kg. In addition, Wei et al. [4] estimated that the ME and net energy values of rice straw were 6.76 and 3.42 MJ/kg, respectively, and those of wheat straw were 6.43 and 3.28 MJ/kg for beef cattle using the regression method by indirect calorimetry.
Rice (Oryza sativa L.; non-sticky; long-grained variety) is the seed of an annual plant in the Gramineae family that is one of the world's most widely planted grain crops, with 510.8 million tons produced in the world [5]. Rice byproducts, including rice straw, rice husks, rice bran, rice germ and broken rice, are abundant agricultural products produced by the rice industry, and the percentage of their production is determined by the milling rate and type of rice [6]. Broken rice has dry matter (DM) of 86.9% to 93.6%, ash, crude protein, ether extract, neutral detergent fiber, acid detergent fiber and starch within the ranges of 0.4% to 5.0%, 3.1% to 10.2%, 0.5% to 2.2%, 0.8% to 9.3%, and 0.6% to 2.5% of DM, respectively [7–13]. The gross energy ranges from 14.7 to 15.6 MJ/kg [11–13] and ME 7.9 to 12.7 MJ/kg [7,9,10,12]. Broken rice has great potential to be used as an energy feed source for dairy cattle production, especially in ensuring the quantity of produce and its year-round availability in Thailand [7,9,10]. Kotupan and Sommart [7] showed improved intake and digestibility, total volatile fatty acids, propionate concentration, marbling score, and carcass characteristics when replacing 32% of cassava chips with broken rice in the final phase of fattening beef cattle. A recent study showed that replacing 20% of corn grains with rice grains in the feed did not adversely affect rumen fermentation or growth performance in Hanwoo steers [14]. Miyaji et al. [15,16] reported that replacing corn with short grain type (Oryza japonica), brown rice has little effect on dry matter intake, milk yield and composition, and ruminal pH while improving dietary nitrogen utilization when cows were fed diets that contained 30.9% to 31.2% rice grain. Miyaji et al. [17] found that replacing steam-flaked corn with steam-flaked brown rice (30.9%) did not alter milk yield, but increased milk fat production. Scheibler et al. [18] replaced corn with rice at 0%, 33%, 63.67%, and 100% in dairy cow diets and had no negative effect on animal health, feed intake, digestibility, milk production, or composition. To our knowledge, the use of long-grain broken rice in the diets of dairy cows is limited. Also, in the research on broken rice as lactating dairy cow feed, information on the net energy values of lactating cows is lacking. Determination of the energy value of lactation of broken rice will allow for the more precise energy requirement formulation of diets for dairy cows feeding systems.
Therefore, the objectives of the present study were to determine 1) the energy contents of broken rice in dairy cows by animal calorimetry and 2) the effects of various levels of broken rice in diets on dairy cow performance.
2. Materials and Methods
2.1. Animals, Experimental Design and Diets
The experimental procedures were reviewed and approved by the Animal Ethics Committee of Khon Kaen University, based on the Ethics of Animal Experimentation of the National Research Council of Thailand (Record No. IACC-KKU-10/63, Reference No. 660201.2.11/17).
Four multiparous Holstein-Friesian crossbred lactating dairy cows (88.6% HF), non-pregnant, with a mean initial body weight (mean ± SD) of 438 ± 16 kg, milk production of 16.9 ± 3.5 kg/d, and 70 ± 31 days in milk at the beginning of the experiment, were used in this study. Cows had continuous access to concrete feed bunks and automatic water troughs. Cows were milked in pen twice daily at 06:30 am and 15:30 pm and fed fermented total mixed rations ad libitum twice daily at 08:00 and 16:00 h.
The experimental design was a 4 × 4 Latin square design, in which each cow was randomly assigned to 1 of 4 dietary treatments that alternated over four periods. Each experimental period lasted for 21 days, beginning with 14 days of adaptation, and followed by daily measurements of milk, feces, urine, and respiratory gas exchange from day 17 through 21 (5 days). Throughout the experiment, cows were housed individually in adjacent holding pens (2.5 m × 4.5 m) with free access to feed and clean drinking water.
The four dietary treatments (Table 1) included one basal diet (0% DM of broken rice) and three test diets. For the three test diets, rice straw, cassava pulp, wet brewery waste, rice bran, palm kernel cake, and soybean meal in the basal diet were substituted by broken rice at the ratios of 12%, 24%, and 36% DM, respectively (Table 1). The substitution and regression methods were used to determine the metabolizable and net energy value of diets, according to Wei et al. [4]. Substitution and regression methods are required for evaluating the energy content of individual feedstuffs, and a regression method is based on multiple-point substitution. Therefore, this study involves different rations of broken substitution into basal diets.
Fermented total mixed ration preparation, ingredients (Table 1) mixed in a horizontal mixer with a 5,000 kg capacity (Celikel TMR feed mixer, 108 Agriculture Machine and Equipment Co., Ltd, Lop Buri, Thailand). Approximately 2,000 kg of each batch of the treatment mixture was mixed, 35 kg packed per bag in high-density polyethylene bags (25 in width x 44 in-length, Kwankhawpanich, Nakhon Ratchasima, Thailand), vacuum compressed (Hitachi 1600 W model CV-930F, Hitachi Consumer Products Co., Ltd., Prachinburi, Thailand), covered with a polypropylene woven bag (23 in width x 37 in length, Thailand), and stored at ambient temperature (26 to 39 °C) until feeding.
2.2. Feed Intake and Digestibility
The dairy cows were weighed and recorded at 07:30 on the first and last day of each experimental period to determine their dry matter intake as a percentage of body weight and metabolic body weight. Throughout the feeding period, the feed offered, and the feed refused for each animal were weighed and recorded, and the individual daily feed intake was calculated as the difference between the amount of feed offered and feed refused.
The total collection technique was conducted in an indoor digestion trial pen (165x375 cm) installed with a head cage respiratory gas system (width 105 cm x depth 80 cm x height 173 cm) for each animal over 5 consecutive days using Suzuki et al. method [19]. The animals have relocated to a digestion trial pen on days 17 to 21 of each experimental period phase. Feces and urine amounts were measured daily. The excreted feces were immediately collected using pans placed behind the animal and weighed daily, and fecal samples were taken for digestion analysis. A tube urine cup collected the total urine volume in plastic tanks containing 6 normal hydrochloric acid to maintain the pH below 3.0. Feces (1 kg) and urine (120 mL) were recorded and sampled daily in the morning for 5 days and stored at 4 °C. After the metabolic data collection period was completed, 1 kg daily aliquot samples of offered feed, refusals, and excreted feces and 120 mL of excreted urine were well mixed and then stored at -18 °C until analysis.
2.3. Animal Calorimetry
During the digestion trial, the oxygen consumption (O2), carbon dioxide (CO2), and methane (CH4) production of each animal were measured using a head cage respiratory gas measurement chamber system [19]. The system consisted of a digestion trial pen, a head cage, a gas sampling and analysis unit, and a data acquisition and processing unit. A head cage is installed in front of the digestion trial pen and designed to be airtight, except for an air-inlet adjustable collar. Cows kept their heads in the hood section and had access to feed trays and automatic water for the day. Cows can lie down on rubber mate floor. A flow meter (NFHY-R-O-U, Nippon Flow Cell, Tokyo, Japan) was used to measure the respiration chamber's flow rate and total air volume flow. The temperature and humidity of outflowing air were recorded electronically (ESPEC MIC CORP, Japan, model RS-12). The oxygen concentration in the inflow and outflow lines was measured using a dual-chamber paramagnetic oxygen analyzer (4100 Gas Purity Analyzer, Servomex Group, East Sussex, UK). Carbon dioxide and methane were also measured using an infrared gas analyzer (IR200 Infrared Gas Analyzer, Yokogawa Electric Co., Tokyo, Japan). The gas analyzers were calibrated every day against certified gases (Takachiho Chemical Industrial Co., Tokyo, JP); reference gases included two oxygen concentrations (19.0% and 20.6%), 1.89% carbon dioxide, and 1960 ppm methane. Calorimetric system recovery tests (98% to 104%) were conducted using the carbon dioxide injection method, by which a weighed amount of carbon dioxide gas was released into the system. The respiratory gas exchange measurements were taken at intervals of 7.5 min for 23.30 hours per day from the initial day at 08:00 am to 07:30 am the next day to determine energy partitioning and consumption over the last three days of the respiration collection period. Ambient temperature and relative humidity were not conditioned; their average was 27.7°C (23.3 to 36.6°C) and 82.7% (41.0 to 99.0), respectively. The metabolizable energy intake was calculated by deducting the urine and methane energy outputs from the digestible energy (DE) intake. Heat production was estimated according to the Brouwer method [20], and the energy balance was calculated [20].
2.4. Sample Collection and Chemical Analysis
Feed samples were collected each period to determine the nutritive value and fermentation quality. The DM content of feeds and feces was analyzed in a fan forced oven at 105 °C, reaching a constant weight. Each subsample (800 g wet weight) was dried in an oven at 60 °C for 72 h and then ground to pass through a 1-mm screen. Then, feeds and feces were analyzed using the Association of Official Analytical Chemists (AOAC) methods [21] for DM, ash, crude protein (CP), and ether extract (EE) determination (method numbers 967.03, 942.05, 984.13, and 920.39, respectively). The neutral detergent fiber (NDF) and acid detergent fiber (ADF) contents were analyzed using a fiber analyzer (ANKOM 200/220, ANKOM Technology, Macedon, NY, USA), NDF treated with thermostable alpha-amylase, and sodium sulfite [22]. The non-fiber carbohydrate (NFC) content was calculated according to the equation NFC (%) = 100 − (%CP + %NDF + %EE + %Ash). The gross energy content was determined using a bomb calorimeter (IKA C2000 Basic, IKA-Werke, Staufen, Germany).
To measure the fermentation quality of the silage, a 20 g fresh sample was blended with 180 mL of distilled water and stored in a refrigerator at 4 °C for 24 h. Thereafter, the extracts were passed through a nylon filter funnel. The silage juice was used to determine pH, ammonia nitrogen (NH3-N), lactic acid, and volatile fatty acid (VFA) concentrations. The pH was measured immediately with a bench pH meter (Eutech pH 700, Eutech Instruments Pte Ltd., Ayer Rajah Crescent, Singapore). Lactic acid and volatile fatty acid concentrations were analyzed using gas chromatography (GC2014, Shimadzu, Tokyo, Japan) [23].
The milk yield was recorded daily during the morning (06:30 h) and afternoon (15:30 h) milking, and milk samples were collected for 5 consecutive days from day 17 to 21 of each period. One aliquot (110 mL) was refrigerated at 4 °C and sent to the Veterinary Research and Development Center, Upper Northeastern Region (Khon Kaen, Thailand) to determine the milk fat, protein, solid not fat (SNF), and lactose concentrations using MilkoScan™ 7RM (Foss Electric, Denmark) and somatic cell count using the Milk Analyzer Fossomatic™ 7 DC (Fossomatic DC, Denmark). The second aliquot was frozen at -20 °C for gross energy measurement using a bomb calorimeter (IKA C2000 Basic, IKA-Werke, Staufen, Germany).
2.5. Calculation
Fat and protein-corrected milk (FPCM, kg/day) was calculated according to Gerber et al. [24] as in Equation (1):
FPCM = (0.337 + 0.116 × fat% + 0.06 × protein%) × milk yield (kg/day)
Energy-corrected milk (ECM, kg/day) was calculated according to Cabezas-Garcia et al. [25] as in Equation (2):
ECM = (milk yield (kg/day) × milk energy (MJ/kg))/3.1
Milk energy (MJ/kg) was calculated according to Cabezas-Garcia et al. [25] units for fat, protein, and lactose in milk are g/kg, as in Equation (3):
Milk energy = (0.0384 × fat) + (0.0223 × protein) + (0.0199 × lactose) − 0.108
Heat production (HP, kJ/day) was calculated according to Brower [20] as in Equation (4):
using volumes of O2 consumption (L/day), CO2 production (L/day), CH4 production (L/day), and urinary nitrogen (UN) excretion (g/day). Methane energy (kJ/day) was calculated [26] as CH4 = 39.54 kJ/L × CH4 (L/day). Energy balance (EB; kJ/kg BW0.75) was calculated using Equation (5).
HP = 16.18 × O2 + 5.02 × CO2 − 5.99 × UN − 2.17 × CH4,
EB = ME intake − HP − Milk energy
The efficiency of ME use for lactation (kl) was calculated according to a previous report [2,27] using Equation (6).
where El(0) is the milk energy output (El) adjusted to zero energy balance (MJ/day) and calculated from Equations (7) and (8). ME intake was calculated as follows: ME intake = gross energy intake − fecal energy − urinary energy − methane energy. MEm is the ME requirement for maintenance (MJ/day).
kl = El(0)/ (ME intake − MEm)
EB > 0, El(0) = El + 0.95 × EB
EB < 0, El(0) = El − 0.84 × EB
The DE, ME and NEL values of the test ingredients were calculated by the substitution method, as described by Wei et al. [4] in Equation (9).
where Eti is the energy value of the test ingredient, Etd (MJ/kg DM) is the energy value of the test diet, Ebd (MJ/kg DM) is the energy value of the basal diet, and Pti is the test ingredient substitution ratio in the basal diet.
Eti (MJ/kg DM) = [Etd − (1 − Pti) × Ebd]/Pti
Alternatively, the DE, ME and NEL values in test ingredients can be estimated by the regression of the test ingredient-associated energy intake (MJ/day) against kilograms of the test ingredient substitution amount intake (kg/day), with the slope of the regression equation representing the energy concentration in MJ/kg DM. The product of Eti at each level of test ingredient broken rice substitution rate energy concentration (MJ/kg) and kilograms of broken rice intake (0.12, 0.24, or 0.36 kg) is the broken rice-associated DE, ME, or NEL intake in kilocalories [4].
2.6. Statistical Analysis
Regression equations to estimate the energy value of broken rice were generated using the REG procedure of SAS [29]. The dependent variables in the prediction equation were broken rice-associated energy intake, and the independent variable was testing ingredient intake.
The experimental data were analyzed using the general linear model (GLM) of SAS version 9.0 for a 4 × 4 Latin square design using the following statistical model:
Yijk = μ + ρi + γj + τk+ εijk,
where Yijk is a dependent variable, μ is the mean for all observations, ρi is the fixed effect of period (i = 1 to 4), γj is the fixed effect of cow (j = 1 to 4), τk is the fixed effect of dietary treatment (k = 1 to 4), and εijk is the residual error. Within treatments, linear, quadratic, and cubic contrasts were evaluated using contrast statements in SAS to determine the effect of increasing proportions of broken rice in the diet. The effects of dietary treatment were also compared using Duncan’s new multiple-range test, and differences were considered significant at p < 0.05.
3. Results
Fifteen of a possible 16 energy balances were completed. During the data collection of period 3, one cow became ill and was removed from total digestibility and respiratory gas collections.
3.1. Diet Composition
The chemical composition, fermentation quality of broken rice, and diets are presented in Table 2. All the dietary treatments were low in pH, VFA, and NH3-N but had high lactic acid content, indicating that all the diets were good-quality silages.
3.2. Feed Intake and Digestibility
Increasing the substitution of broken rice in the diets resulted (Table 3) in a linear decrease (p < 0.01) in CP intake, EE intake, NDF intake, and ADF intake. In contrast, the intake of NFC increased linearly (p = 0.02). The amounts of DM and organic matter (OM) intake were not affected (p > 0.05).
Apparent nutrient digestibility is shown in Table 4. It was observed that as broken rice substitution in the basal diet increased from 0 to 36% DM in the dietary treatment, the apparent digestibility of DM, OM, and NDF increased linearly (p < 0.05). In contrast, the digestibility of CP and EE decreased linearly (p < 0.05). The digestibility of ADF and NFC was unaffected by dietary treatment (p > 0.05).
3.3. Milk yield and Milk Composition
The substitution of broken rice in the dietary treatment did not affect the milk yield (kg/day), fat and protein-corrected milk, energy-corrected milk, or milk protein (p > 0.05), but there was a linear decrease in fat yield (p < 0.05). The composition of milk protein, fat, lactose, SNF, milk energy, and somatic cell count were not affected by the proportion of broken rice (p > 0.05). The feed efficiency was unaffected by the dietary treatments (p > 0.05) (Table 5).
3.4. Respiratory Gas and Energy Partitioning
The results of oxygen consumption, carbon dioxide production, and enteric methane emission analysis in lactating dairy cows fed broken rice substituted into the basal diet are presented in Table 6. Oxygen consumption, carbon dioxide production and respiratory quotient were not affected (p > 0.05) by dietary treatment.
The results regarding the effects of substituting broken rice in the basal diet on energy partitioning and energy intake, energy content, and energy utilization are shown in Table 6. Methane energy lost increased cubically (p < 0.05), while energy lost as feces and urine and energy balance were unaffected by treatment. In addition, milk energy, El(0), energy intake, and energy content were unaffected by the proportion of broken rice in the diet (p > 0.05).
The efficiency of energy utilization in terms of DE/GE, ME/GE, and ME/DE ratios was unaffected (p > 0.05) by the increasing level of broken rice substitution in the diet.
3.5. Energy Requirement for Maintenance and Efficiency of ME Utilization for Lactation
Estimations of the maintenance energy requirements of lactating dairy cows, determined by linear regressions of milk energy output adjusted to zero energy balance (El(0), kJ/kg BW0.75) against ME intake (kJ/kg BW0.75), are presented in Figure 1. Regression (El(0) = 0.756 x ME intake – 504.3) was highly significant (p < 0.001), and the R2 value was 0.75. The MEm of Holstein-Friesian crossbred dairy cows in this experiment was 667 kJ/kg BW0.75, and the efficiency of ME utilization for lactation was 75.6%. The net energy requirement for maintenance (NEm), as derived, was 504.3 kJ/kg BW0.75.
3.6. Energy Values of Broken Rice for Lactation by Substitution and Regression Methods
The regression of broken rice-associated energy intake (Y, MJ/day) against the broken rice substitution amount (X, kg/day) is shown in Table 7. The regression equation for the DE was Y = 13.13X + 0.02 (R2 = 0.98, RMSE = 0.25, p < 0.0001, n = 15), the ME was Y = 11.87X + 1.91 (R2 = 0.96, RMSE = 0.31, p < 0.0001 n = 15), and it was determined that the broken rice has an energy value for lactation of 13.13 MJ DE/kg DM and 11.87 MJ ME/kg DM. In addition, the NEL regression equation was Y = 8.68X + 1.18 (R2 = 0.85, RMSE = 0.50, p < 0.0001, n = 15), and the net energy value for broken rice was determined to be 8.7 MJ NEL/kg DM.
The DE, ME and NEL values (Table 8) of broken rice derived based on a single substitution ratio were similar between the substitution and regression methods (p > 0.05). The energy values of broken rice for lactation, estimated by the substitution method, were 13.06 MJ DM/kg DM, 11.81 MJ ME/kg DM and 8.61 MJ NEL/kg DM, respectively.
4. Discussion
4.1. Nutrient Intake, Digestibility and Milk Production
Feed intake is a limiting factor determining the nutrient and energy supply required for animal maintenance and productivity. Tropical feeding systems often rely on low-quality feed sources deficient in digestible nutrients and energy intake. It is generally low milk-producing cow herds in Thailand and other tropical developing countries. In Thailand, the average milk yield is approximately 12 kg/day. The limitations are heat stress and quality feed supplies. Increasing the available nutrient supplies enables animals to improve derive milk production from carbohydrates, proteins, and fats. In the present study, the proportion of broken rice substitution in the basal diet increased, and the content of non-fiber carbohydrates increased, whereas the contents of CP, NDF, ADF, and EE decreased. The fermentation qualities were characterized by low pH (< 3.9) and high lactic acid content after seven days of ensiling, indicating that all the diets were good-quality silages, like a previous report by Kotupan and Sommart [7], Wang and Nishino [30] and Kongphitee et al. [31]. The level of broken rice substitution in the basal diet of dairy cows had no effect on DM and OM intake, which is consistent with the findings of Kotupan and Sommart [7], who reported in fattened beef cattle. Our data indicate that non-fiber carbohydrate intake substantially improved, suggesting a greater increase in total nutrients and energy supply to the lactating dairy cows when broken rice was included in the diet. Similarly, Miyaji et al. [15] fed lactating cows 0%, 15.6% and 31.2% steam-flaked brown rice as a dietary DM in place of steam-flaked corn and observed no differences in DM intake or milk production among the treatments.
In the present study, there was no difference in milk yield among the dietary treatments, which can be attributed to the similarity in dry matter intake. Our data indicate that neither milk protein, lactose and SNF yield nor milk composition of protein, fat, lactose and SNF were not affected by dietary treatments with an increasing broken rice level in the diet. Similarly, Miyaji et al. [15,16] reported that replacing corn with brown rice did not affect milk yield. In contrast, Miyaji et al. [32] reported that the milk yield decreased when substituting brown rice for corn in diets with a high proportion of grain (> 40% of DM) had adverse effects on lactating cow productivity. In this study, milk fat yield was affected by dietary treatments and decreased in response to increased levels of broken rice. In contrast, Miyaji et al. [15,16,32] found that substituting brown rice for corn did not affect milk fat concentrations. Kendall et al. [33] indicated that higher NDF intake increased milk fat production in dairy cows. The results of this study indicated that milk fat yield depression might be caused by low fat or fiber intake and estimated digestibility, affected by rumen fermentation end products such as reduced acetate production as a precursor of milk fatty acid synthesis. Thus, depressing de novo fatty acid synthesis in the mammary gland [17,34].
4.2. Energy Partition, Efficiency of Metabolizable Energy Utilization
There was no difference among dietary treatments in respiratory gas, energy partitioning, energy intake, energy content and energy utilization, and accepted methane energy loss was significantly higher when broken rice was substituted in the diets. Enteric methane is a natural byproduct of the microbial fermentation of carbohydrates and, to a slightly lesser degree, amino acids in the rumen and hindgut. In the present study, a significant increase in daily enteric methane energy losses (kJ/kgBW0.75) indicates that DM, OM, NDF digestibility improved, thus greater rumen fermentation end-product when substituting broken rice in the basal diet. The OM substrates are fermented in the rumen, producing volatile fatty acids and metabolic hydrogens, which combine with CO2 by rumen methanogen synthesis to produce methane. Our result indicated that absolute enteric methane emission energy loss (kJ/kgBW0.75) increased without alteration on methane yield (L/kg DM intake; data do not show) and methane intensity (L/kg Fat-and protein-corrected milk; data do not show), suggesting the greater rumen fermentation of digestible non-fiber carbohydrates and fiber when including broken rice in the dairy cow diet. In this study, daily methane emissions (258.7 to 303.6 L/d) were within the range previously reported by Suzuki et al. [19] and Kongphitee et al. [31] of beef cattle in the tropics, ranging from 329 to 360 L/d. Using broken rice in the diets of dairy cows would be an acceptable trade-off in reducing global enteric methane emission efforts.
Estimating maintenance energy requirements was achieved through regression of the milk energy output adjusted to zero energy retention against the ME intake (Figure 1). This study's analysis of the pooled data determined the MEm requirement of 667 kJ/kg BW0.75 for Holstein-Friesian crossbred dairy cows. These values of MEm were higher than those reported by Olivera et al. [35] using a linear mixed regression of data from 23 studies involving 83 treatment means for Bos taurus × Bos indicus crossbreds (558 kJ/kg BW0.75). However, the MEm in this study was lower than the values suggested for Holstein and Jersey-Holstein crossbred dairy cows (710 and 670 kJ/kg BW0.75, respectively) by Xue et al. [36] and the value of 688 kJ/kg BW0.75 for lactating Holstein-Friesian (n = 823) reported by Dong et al. [37]. The variability in energy requirements for maintenance was primarily attributed to the animal breed, physiological state, feed intake, and environmental condition [35–39]. The efficiency of metabolizable energy utilization for lactation value in this study was 0.76, which agreed with 0.76 reported by Foth et al. [2] and 0.76 reported by Judy et al. [40]. More recent estimates of kl have varied widely from 0.50 to 0.81, with the majority ranging between 0.60 and 0.65 [39]. Agnew and Yan [41] and Dong et al. [37] reported that dietary and animal factors have little effect on kl values when accounting for both milk energy output and body tissue energy retention.
4.3. Estimation of the Net Energy Value of Broken Rice for Lactation by Substitution Compared with Regression Methods
With the energy estimated for individual feedstuffs, the substitution method was used to resolve the limitations of the direct method by feeding the test feedstuff in combination with a suitable basal diet of known dietary energy value [4]. The substitution ratio of the test feed is directly related to the accuracy of feedstuff evaluation when conducting comparisons using the regression method, which is based on multiple-point substitution, and regression-derived energy utilization is more robust than single-point substitution [4]. The regression method has recently been used to evaluate the energy available to ruminants. By the regression method, Wei et al. [4] determined the ME and NE values of rice straw and wheat straw for beef cattle. The net energy for lactation of broken rice in animal calorimetry has not been reported. In this study, the estimated ME and NEL values for the broken rice determined using the substitution method averaged 11.8 and 8.6 MJ/kg of DM, respectively, like the ME and NEL values of 11.9 and 8.7 MJ/kg of DM, when determined using the regression method, respectively. These estimates of ME were 6.3% (12.7 MJ/kg of DM) lower than those reported for broken rice in in vitro by Kotupan and Sommart [7] but 15 to 33% higher than those reported for ruminants using an in vitro technique by Chumpawadee et al. [9] and Nitipot and Sommart [10] (7.9 and 10.1 MJ/kg of DM, respectively). Our data suggested that in vitro had a greater variation in the estimation of net energy for lactation in dairy cows when compared with in vivo method. The limitation of animal calorimetry to determine net energy for lactation remained because in vivo experiments require whole animal metabolism studies and respiratory gas measurements; they are time-consuming and costly and require many feed samples.
Although a 4x4 Latin square design accounted for cow and period effects and allowed for measurements of animal responses to changes in dietary treatment, however, the short time (21 d) of the periods and the limited number of animals per treatment are limitations of this study. In particular, the dairy cattle production performance results need to be confirmed in the long-term feeding trial and a greater number of animals. The limitation of this experiment was also due to the increase in the broken rice levels in the basal diets by a single-point substitution or multiple-point substitution method required for evaluating the energy content of individual feedstuffs. The substitution method [4] involves different substitution rates of a test feed (broken rice) into each energy feed source in the basal diets. Therefore, the results on animal performances are not only because of the broken rice increase but also of diet composition change.
5. Conclusion
A study utilizing tropical lactating dairy cows was conducted to determine the effects of increased inclusion of broken rice on nutrient and energy utilization and the net energy value of broken rice for lactation. The results indicate that increased inclusion of broken rice at concentrations up to 36% in the dairy diet did not affect dry matter intake, milk yield and composition, feed efficiency or energy balance. Using the indirect calorimetry method, the net energy value of broken rice for lactation was 8.68 MJ/kg. The energy values of broken rice derived based on a single substitution ratio were similar between the substitution and regression methods. Long-term feeding experiments or on-farm research is needed for the future development of dairy cattle-fed broken rice-based diets feeding systems.
Funding
This research was funded by the National Research Council of Thailand and the Thailand Research Fund and through the Royal Golden Jubilee Ph.D. Scholarship Program (Grant No. PHD/0145/2560).
Author contributions
Conceptualization and study design, T.G. and K.S.; animal sampling and laboratory work, T.G., K.K., B.B., and K.K.; data analysis and drafting of the manuscript, T.G., K.K., B.B., and K.S.; revision and correction of the manuscript, T.G., and K.S. All authors contributed, reviewed, and approved the final manuscript. The published manuscript has been read and accepted by all authors.
Institutional Review Board Statement
All animal-related procedures were reviewed and approved by the Animal Ethics Committee of Khon Kaen University and are based on the Ethics of Animal Experimentation of the National Research Council of Thailand (Record No. IACC-KKU-10/63, Reference No. 660201.2.11/17).
Informed Consent Statement
Not applicable.
Data Availability Statement
Not applicable.
Acknowledgments
We thank the Royal Golden Jubilee Ph.D. Program (RGJ-Ph.D. Program), Department of Animal Sciences, Agricultural Faculty, Khon Kaen University for permitting their research facilities, and the Japan International Research Center for Agricultural Science (JIRCAS) for the infrastructure and laboratory facilities.
Conflicts of Interest
The authors declare no conflict of interest related to this study.
References
- Moe, P.W; Tyell, H.F.; Hooven, N.W. Physical form and energy value of corn grain. J. Dairy Sci. 1973, 56, 1298–1304. [CrossRef]
- Foth, A.J.; Brown-Brandl, T.; Hanford, K.J.; Miller, P.S.; Garcia Gomez, G.; Kononoff, P.J. Energy content of reduced-fat dried distillers grains with solubles for lactating dairy cows. J. Dairy Sci. 2015, 98, 7142–7152. [CrossRef]
- Tine, M.A.; McLeod, K.R.; Erdman, R.A.; Baldwin, R.L. Effects of brown midrib corn silage on the energy balance of dairy cattle. J. Dairy Sci. 2001, 84, 885–895. [CrossRef]
- Wei, M.; Cui, Z.H.; Li, J.W.; Yan, P.S. Estimation of metabolisable energy and net energy of rice straw and wheat straw for beef cattle by indirect calorimetry. Arch. Anim. Nutr. 2018, 72, 275-289. [CrossRef]
- United States Department of Agriculture (USDA). Rice Outlook: Available online: https://downloads.usda.library.cornell.edu/usda esmis/files/dn39x152w/6q183m76f/x059d9866/rcs-21k.pdf. (accessed on 21 December 2021).
- Esa, N. M.; Tan, B. L.; Loh, S. P. By-products of rice processing: an overview of health benefits and applications. J. Rice. Res. 2013, 1, 1–11. [CrossRef]
- Kotupan K.; Sommart, K. Broken rice in a fermented total mixed ration improves carcass and marbling quality in fattened beef cattle. Anim Biosci. 2021, 34, 1331-1341. [CrossRef]
- Chen, X.; Yang, H.; Xu, L.; Wan, X.; Wang, Z. Effect of replacing dietary corn with broken rice on goose growth performance, body size and bare skin color. Animals 2020, 10, 1330. [CrossRef]
- Chumpawadee, S.; Sommart, K.; Vongpralub, T.; Pattarajinda, V. Nutritional evaluation of energy feed sources for ruminant using in vitro gas production technique. Kasetsart J. - Nat. Sci. 2006, 40, 430–435.
- Nitipot, P.; Sommart, K. Nutritive value evaluation of roughages and non- forage fiber sources using in vitro gas production technique. Khon Kaen Agric. J. 2007, 35, 397–409.
- Zhang, Y.C.; Luo, M.; Fang, X.Y.; Zhang, F.Q.; Cao, M.H. Energy value of rice, broken rice, and rice bran for broiler chickens by the regression method. Poult. Sci. 2021, 100, 100972. [CrossRef]
- Working Committee of Thai Feeding Standard for Ruminant (WTSR). Nutrient Requirements of Dairy Cattle in Thailand. 1st ed.; Khon Kaen University Press: Khon Kaen, Thailand, 2021.
- Cruz, C.R.D.; Kamarudin, M.S; Saad, C.R.; Ramezani-fard, E. Effects of extruder die temperature on the physical properties of extruded fish pellets containing taro and broken rice starch. Anim. Feed Sci. Technol. 2015, 199, 137–145. [CrossRef]
- Yang, S.; Kim, B.; Kim, H.; Moon, J.; Yoo, D.; Baek, Y.C.; Lee, S.; Seo, J. Replacement of corn with rice grains did not alter growth performance and rumen fermentation in growing Hanwoo steers. Asian-Australas J. Anim. Sci. 2020, 33, 230-235. [CrossRef]
- Miyaji, M.; Matsuyama, H.; Hosoda, K.; Nonaka, K. Effect of replacing corn with brown rice grain in a total mixed ration silage on milk production, ruminal fermentation and nitrogen balance in lactating dairy cows. Anim. Sci. J. 2012, 83,585-593. [CrossRef]
- Miyaji, M.; Matsuyama, H.; Hosoda, K.; Nonaka, K. Milk production, nutrient digestibility and nitrogen balance in lactating cows fed total mixed ration silages containing steam-flaked brown rice as substitute for steam-flaked corn, and wet food by-products. Anim. Sci. J. 2013, 84, 483–488. [CrossRef]
- Miyaji, M.; Haga, S.; Matsuyama, H.; Hosoda, K. Effect of feeding brown rice instead of corn on lactation performance and blood metabolites in periparturient dairy cows. Anim. Feed Sci. Technol. 2016, 219, 234–240. [CrossRef]
- Scheibler, R.B.; Schafhäuser, J.; Rizzo, F.A.; Nörnberg, J.L.; Vargas, D.P.; Silva, J.L.S.; Fluck, A.C.; Fioreze, V.I. Replacement of corn grain by brown rice grain in dairy cow rations : Nutritional and productive effects. Anim. Feed Sci. Technol. 2015, 208, 214–219. [CrossRef]
- Suzuki, T.; Phaowphaisal, I.; Pholsen, P.; Narmsilee, R.; Indramanee, S.; Nitipot, P.; Chaokaur, A.; Sommart, K.; Khotprom, N.; Panichpol, V.; Nishida, T. In vivo nutritive value of Pangola grass (Digitaria eriantha) hay by a novel indirect calorimeter with a ventilated hood in Thailand. Japan Agric. Res. Q. 2008, 42, 123–129. [CrossRef]
- Brouwer, E. Report of subcommittee on constants and factors. In energy metabolism of farm animals, 3rd.; Blaxter, K.L., Eds.; EAAP Academic Press: London, UK, 1965, pp. 441-443.
- Association of Official Analytical Chemists (AOAC). Official Methods of Analysis. 16th ed.; Association of Official Analysis Chem-ists: Washington, DC, U.S.A., 1995.
- Mertens, D. R. Gravimetric determination of amylase-treated neutral detergent fiber in feeds with refluxing in beakers or cruci-bles: collaborative study. J. AOAC Int. 2002, 85, 1217-1240.
- Porter, M.G.; Murray, R.S. The volatility of components of grass silage on oven drying and the inter-relationship between dry-matter content estimated by different analytical methods. Grass Forage Sci. 2001, 56, 405–411. [CrossRef]
- Gerber, P.; Vellinga, T.; Opio, C.; Steinfeld, H. Productivity gains and greenhouse gas emissions intensity in dairy systems. Livest. Sci. 2011, 139, 100-108. [CrossRef]
- Cabezas-Garcia, E.H.; Gordon, A.W.; Mulligan, F.J.; Ferris, C.P. Revisiting the Relationships between Fat-to-Protein Ratio in Milk and Energy Balance in Dairy Cows of Different Parities, and at Different Stages of Lactation. Animals 2021, 11, 3256. [CrossRef]
- Blaxter, K. L.; Clapperton, J.L. Prediction of the amount of methane produced by ruminants. Br. J. Nutr. 1965, 19, 511–522. [CrossRef]
- Moe, P.W.; Flatt, W.P.; Tyrell, H.F. Net energy value of feeds for lactation. J. Dairy Sci. 1972, 55, 945-958. [CrossRef]
- Agricultural and Food Research Council (AFRC). Energy and protein requirements of ruminants; CAB International: Wallingford, UK, 1993.
- SAS, 2002. SAS/STAT User’s Guide; Version 9.0; SAS Inst. Inc.: Cary, NC, USA, 2002.
- Wang, C.; Nishino,N. Effects of storage temperature and ensiling period on fermentation products, aerobic stability and microbial communities of total mixed ration silage. J. Appl. Microbiol. 2013, 114, 1687–1695. [CrossRef]
- Kongphitee, K.; Sommart, K.; Phonbumrung, T.; Gunha T.; Suzuki, T. Feed intake, digestibility and energy partitioning in beef cattle fed diets with cassava pulp instead of rice straw. Asian-Australas. J. Anim. Sci. 2018, 31, 1431-41. [CrossRef]
- Miyaji, M.; Matsuyama, H.; Hosoda, K. Effect of substituting brown rice for corn on lactation and digestion in dairy cows fed diets with a high proportion of grain. J. Dairy Sci. 2014, 97, 952–960. [CrossRef]
- Kendall, C.; Leonardi, C.; Hoffman, P.C.; Combs, D.K. Intake and milk production of cows fed diets that differed in dietary neutral detergent fiber and neutral detergent fiber digestibility. J. Dairy Sci. 2009, 92, 313–323. [CrossRef]
- Griinari, J.M.; Dwyer, D.A.; McGuire,M.A.; Bauman, D.E.; Palmquist, D.L.; Nurmela, K.V.V. Trans-Octadecenoic acids and milk fat depression in lactating dairy cows. J. Dairy Sci. 1998, 81, 1251–1261. [CrossRef]
- Oliveira, A.S. Meta-analysis of feeding trials to estimate energy requirements of dairy cows under tropical condition. Anim. Feed Sci. Technol. 2015, 210, 94–103. [CrossRef]
- Xue, B.; Yan, T.; Ferris, C.F.; Mayne, C.S. Milk production and energy efficiency of Holstein and Jersey-Holstein crossbred dairy cows offered diets containing grass silage. J. Dairy Sci. 2011, 94, 1455–1464. [CrossRef]
- Dong, L.F.; Ferris, C.P.; McDowell, D.A.; Yan, T. Effects of diet forage proportion on maintenance energy requirement and the efficiency of metabolizable energy use for lactation by lactating dairy cows. J. Dairy Sci. 2015, 98, 8846–8855. [CrossRef]
- McDonald, P.; Edwards, R.A; Greenhalgh, J.F.D.; Morgan, C.A.; Sinclair, L.A.; Wilkinson, R.G. Animal and Nutrition. 7th ed.; Prentice Hall, New York, NY, 2011.
- National Research Council (NRC). Nutrient requirement of dairy cattle. 7th ed.; National Academic Press: Washington, DC, USA, 2001.
- Judy, J. V.; Bachman, G.C.; Brown-Brandl, T.M.; Fernando, S.C.; Hales, K.E.; Miller, P.S.; Stowell, R.R.; Kononoff, P.J. Energy balance and diurnal variation in methane production as affected by feeding frequency in Jersey cows in late lactation. J. Dairy Sci. 2018, 101, 10899–10910. [CrossRef]
- Agnew, R.E.; Yan, T.; Murphy, J.J; Ferris, C.P.; Gordon, F.J. Development of maintenance energy requirement and energetic efficiency for lactation from production data of dairy cows. Livest. Prod. Sci. 2003, 82, 151–162. [CrossRef]
Figure 1.
Linear regressions of milk energy output adjusted to zero energy balance (El(0), kJ/kg BW0.75) against ME intake (kJ/kg BW0.75) for lactating dairy cows fed fermented total mixed ration diet with different proportions of broken rice.
Figure 1.
Linear regressions of milk energy output adjusted to zero energy balance (El(0), kJ/kg BW0.75) against ME intake (kJ/kg BW0.75) for lactating dairy cows fed fermented total mixed ration diet with different proportions of broken rice.
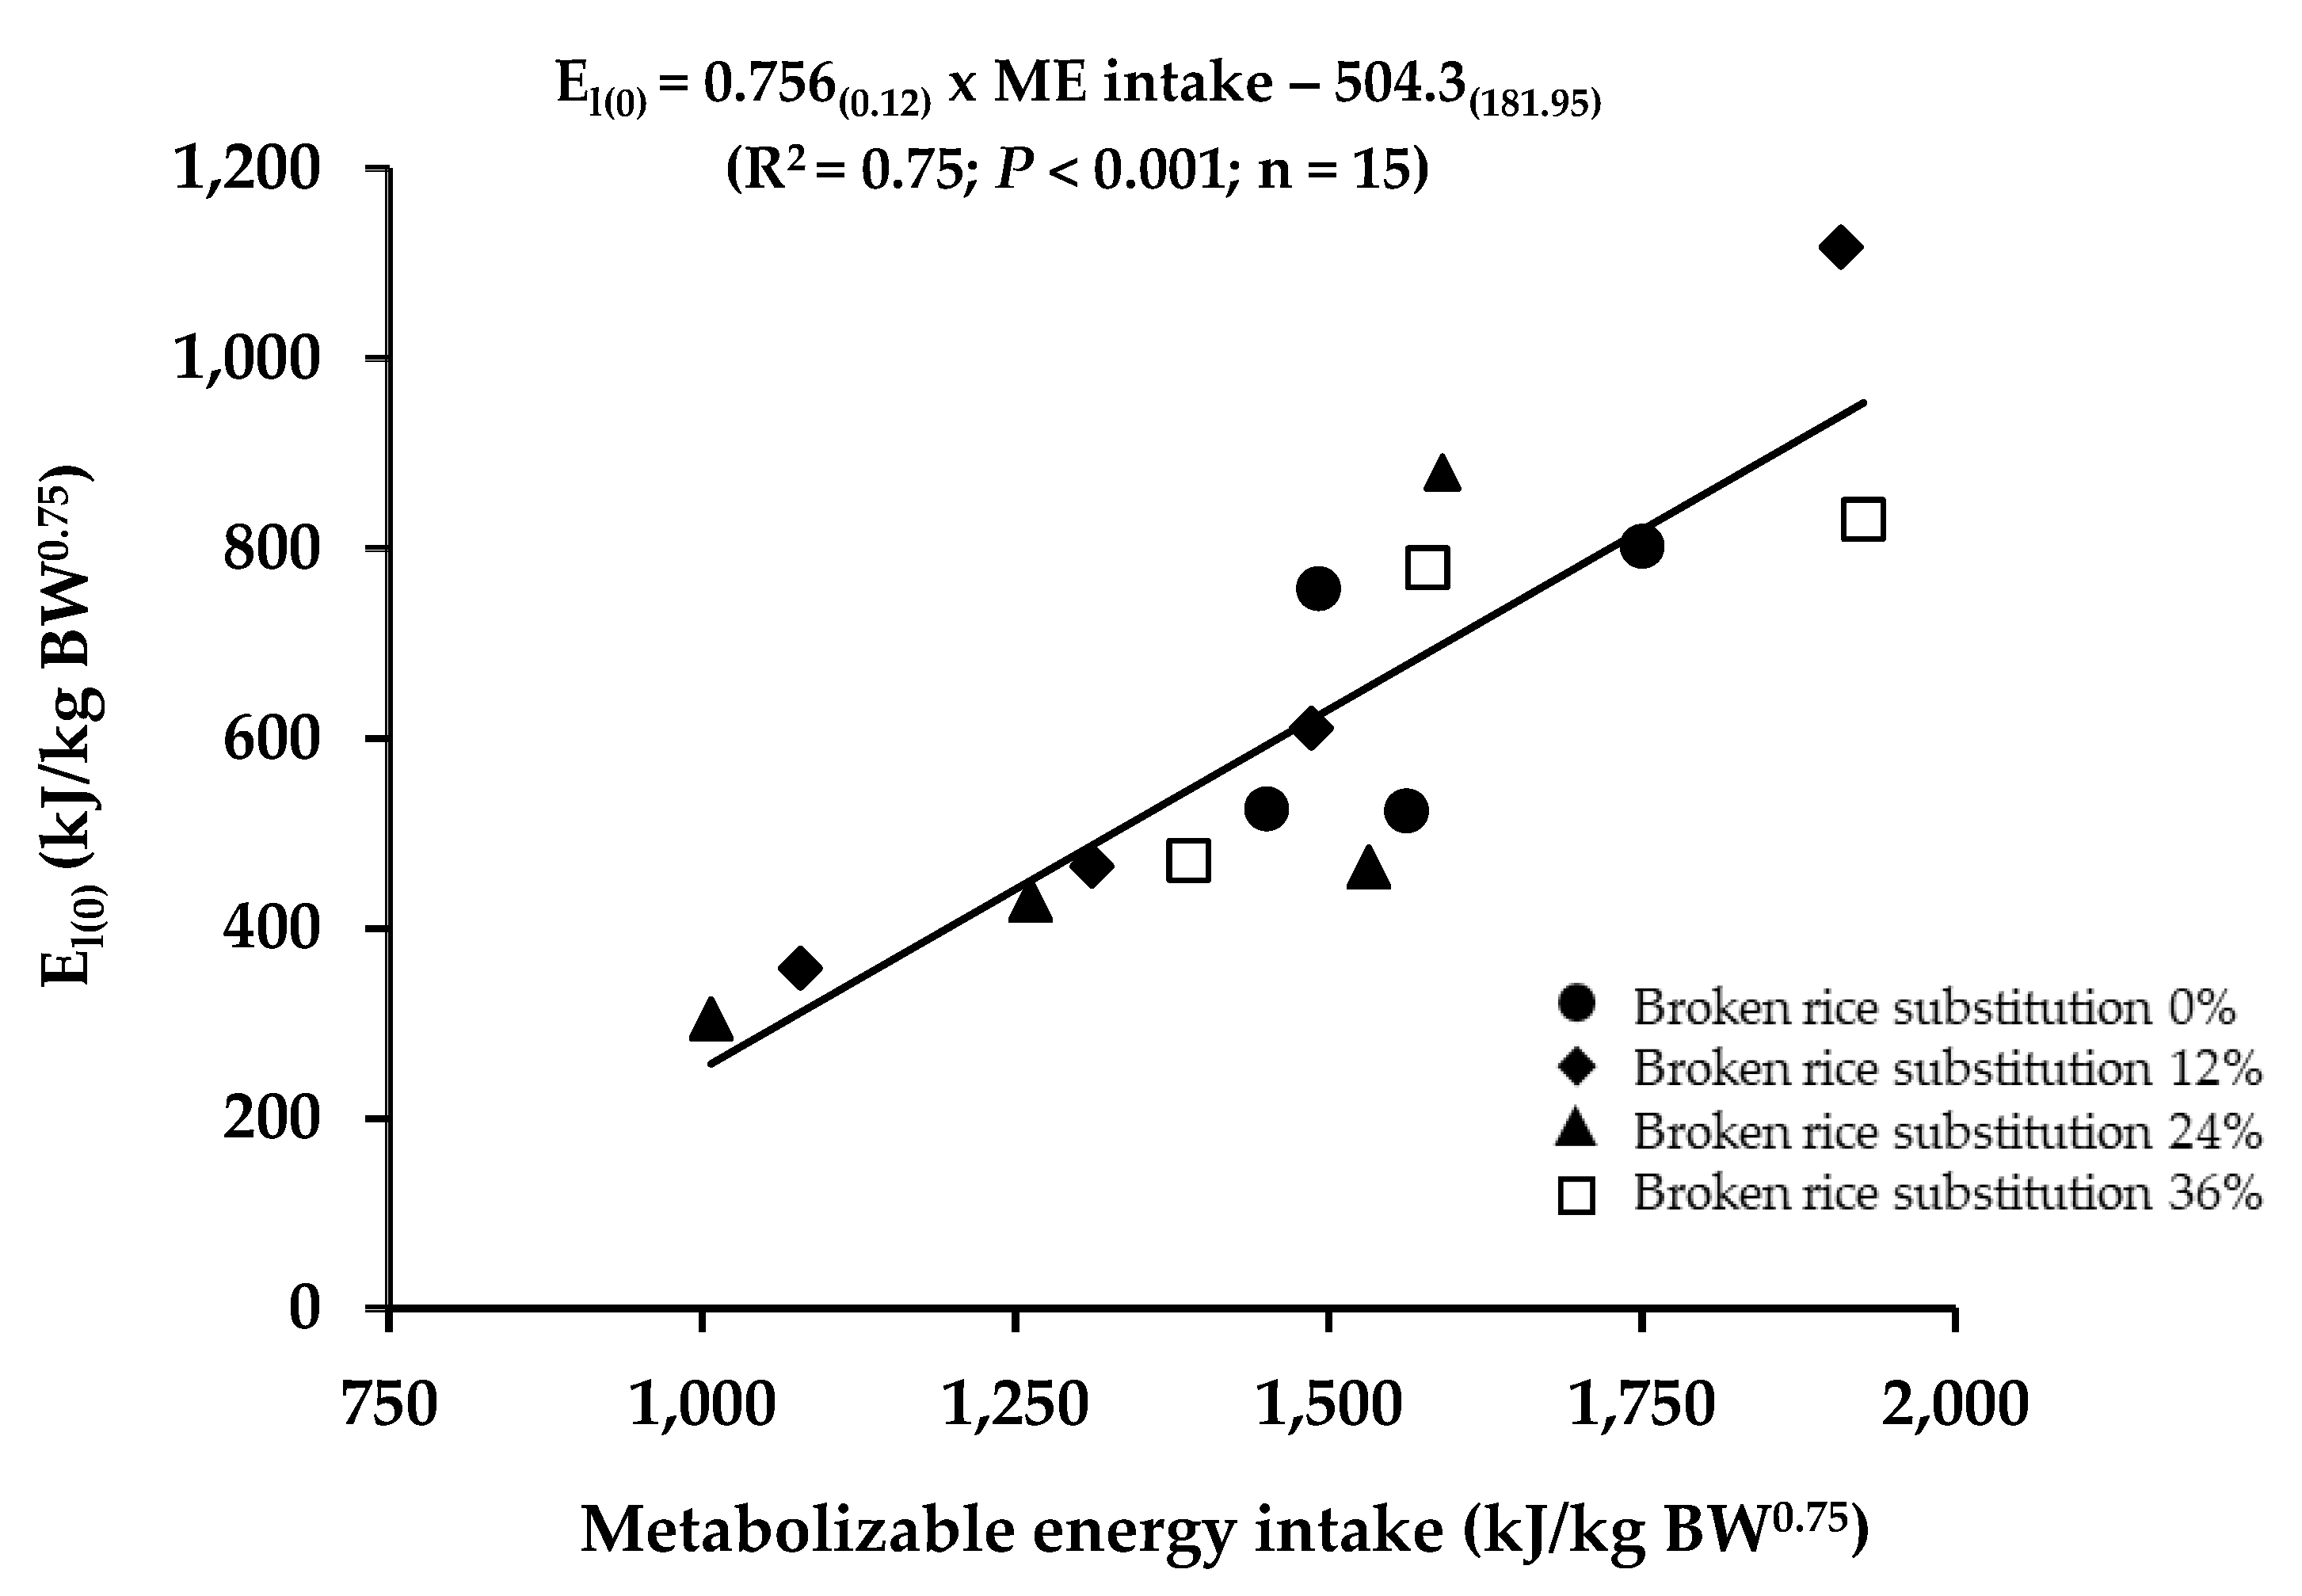

Table 1.
Ingredients and feed costs of the four broken rice substitution dietary treatments.
| Broken rice substitution ratio | ||||
|---|---|---|---|---|
| Items1 | Basal diet (0) | 12 | 24 | 36 |
| Ingredients, % of DM | ||||
| Rice straw | 15.0 | 13.2 | 11.4 | 9.6 |
| Broken rice* | 0.0 | 11.8 | 23.5 | 35.3 |
| Cassava pulp | 30.0 | 26.4 | 22.8 | 19.2 |
| Wet brewery waste | 15.0 | 13.2 | 11.4 | 9.6 |
| Rice bran | 11.0 | 9.7 | 8.4 | 7.0 |
| Palm kernel cake | 12.0 | 10.5 | 9.1 | 7.7 |
| Soybean meal | 15.0 | 13.2 | 11.4 | 9.6 |
| Urea | 0.5 | 0.5 | 0.5 | 0.5 |
| Mineral2 | 1.0 | 1.0 | 1.0 | 1.0 |
| Premix3 | 0.5 | 0.5 | 0.5 | 0.5 |
| Total | 100.0 | 100.0 | 100.0 | 100.0 |
| Feed cost (TBH/kg FM) | 3.64 | 4.43 | 4.79 | 5.47 |
* Cost 12.33 Thai Bath (TBH)/kg FM. 1DM = dry matter, FM = fresh matter. 2Minerals containing 93.72 g/kg Ca, 46.86 g/kg P, 107.78 g/kg Na, 18.56 g/kg S, 8.24 g/kg Mn, 7.49 g/kg Zn, 3.37 g/kg Mg, 1.17 g/kg Cu, 0.15 g/kg Co, 0.01 g/kg K, 0.04 g/kg I, and 0.02 g/kg Se (Mineral #0106410029, Dairy Farming Promotion Organization of Thailand (D.P.O.), Saraburi, Thailand). 3Mineral and vitamin premix containing 5,000,000 IU/kg vitamin A, 1,000,000 IU/kg vitamin D3, 10,000 IU/kg vitamin E, 25 g/kg Fe, 4 g/kg Cu, 20 g/kg Mn, 0.13 g of Co, 15 g/kg Zn, 0.75 g/kg I, 0.38 g/kg Se, 0.20 g/kg feed preservative, and 0.88 g/kg feed additive (Golden Mix S # 0104610040, DFC Advanced Co. Ltd., Khon Kaen, Thailand).
Table 2.
The chemical composition and fermentation quality of broken rice and the four broken rice substitution dietary treatments.
Table 2.
The chemical composition and fermentation quality of broken rice and the four broken rice substitution dietary treatments.
| Broken rice substitution (%) | |||||
|---|---|---|---|---|---|
| Items1 | Broken rice | 0 | 12 | 24 | 36 |
| Chemical composition | |||||
| Dry matter, % | 88.9 | 32.7 | 34.0 | 36.1 | 40.8 |
| Organic matter, %DM | 99.2 | 93.6 | 94.5 | 95.1 | 95.4 |
| Crude protein, %DM | 7.4 | 18.5 | 16.7 | 15.5 | 14.5 |
| Neutral detergent fiber, %DM | 6.4 | 45.8 | 42.2 | 41.3 | 33.7 |
| Acid detergent fiber, %DM | 1.2 | 23.5 | 23.2 | 20.5 | 17.1 |
| Ether extract, %DM | 1.3 | 5.9 | 5.3 | 5.1 | 4.5 |
| Non-fiber carbohydrate, %DM | 84.9 | 23.5 | 30.3 | 33.1 | 42.7 |
| Fermentation quality | |||||
| pH | 3.9 | 3.8 | 3.8 | 3.8 | |
| Lactic acid, g/kg of DM | 27.4 | 65.5 | 66.4 | 64.0 | |
| Acetic acid, g/kg of DM | 22.9 | 12.9 | 9.7 | 10.2 | |
| Propionic acid, g/kg of DM | 1.9 | 0.8 | 0.7 | 0.8 | |
| Butyric acid, g/kg of DM | 0.3 | 0.4 | 0.3 | 0.3 | |
| Valeric acid, g/kg of DM | 0.2 | 0.1 | 0.3 | 0.1 | |
| Ammonia nitrogen, g/kg of N | 18.2 | 18.6 | 18.5 | 22.1 | |
1 DM = dry matter, non-fiber carbohydrate calculated as 100 − (%NDF + %CP + %EE + %ash), N = nitrogen.
Table 3.
Daily feed and nutrient intake in lactating dairy cows (n = 4 per treatment) fed a fermented total mixed ration at different levels of broken rice substitution.
Table 3.
Daily feed and nutrient intake in lactating dairy cows (n = 4 per treatment) fed a fermented total mixed ration at different levels of broken rice substitution.
| Broken rice substitution (%) | p- value3 | |||||||
|---|---|---|---|---|---|---|---|---|
| Items1 | 0 | 12 | 24 | 36 | SEM2 | L | Q | C |
| Body weight, kg | 523.9 | 479.1 | 512.8 | 487.0 | ||||
| Feed intake | ||||||||
| kg/day | 13.6 | 13.4 | 12.7 | 12.6 | 1.01 | 0.42 | 0.95 | 0.79 |
| % of BW | 2.6 | 2.8 | 2.5 | 2.6 | 0.23 | 0.75 | 0.89 | 0.42 |
| g/kg BW^0.75 | 125.3 | 130.9 | 118.7 | 122.4 | 10.0 | 0.66 | 0.92 | 0.48 |
| Nutrient intake (kg/day) | ||||||||
| Organic matter | 12.8 | 12.7 | 12.0 | 12.0 | 0.97 | 0.53 | 0.98 | 0.79 |
| Crude protein | 2.5a | 2.2ab | 2.0b | 1.8b | 0.15 | 0.01 | 0.64 | 0.84 |
| Ether extract | 0.8a | 0.7ab | 0.7ab | 0.6b | 0.05 | <0.01 | 0.91 | 0.85 |
| Neutral detergent fiber | 6.2a | 5.7a | 5.2ab | 4.2b | 0.33 | <0.01 | 0.55 | 0.66 |
| Acid detergent fiber | 3.2a | 3.1ab | 2.6cb | 2.2c | 0.17 | <0.01 | 0.35 | 0.52 |
| Non-fiber carbohydrate | 3.2b | 4.1ab | 4.2ab | 5.4a | 0.45 | 0.02 | 0.74 | 0.41 |
1BW = body weight, BW0.75 = metabolic body weight. 2 SEM = standard error of the mean. 3 Probability of significant linear (L), quadratic (Q), and cubic (C) effects of broken rice levels. a-c Within a row, means without a common superscript are significantly different (p < 0.05).
Table 4.
Digestibility in lactating dairy cows (n = 4 per treatment) fed a fermented total mixed ration at different levels of broken rice substitution.
Table 4.
Digestibility in lactating dairy cows (n = 4 per treatment) fed a fermented total mixed ration at different levels of broken rice substitution.
| Broken rice substitution (%) | p- value2 | |||||||
|---|---|---|---|---|---|---|---|---|
| Digestibility, g/kg | 0 | 12 | 24 | 36 | SEM1 | L | Q | C |
| Dry matter | 595b | 648ab | 670a | 663a | 15.43 | 0.04 | 0.10 | 0.97 |
| Organic matter | 628b | 678ab | 695a | 690a | 15.07 | 0.06 | 0.11 | 0.94 |
| Crude protein | 670a | 683a | 646ab | 599b | 17.08 | 0.02 | 0.12 | 0.71 |
| Ether extract | 836a | 815ab | 833a | 750b | 18.65 | 0.04 | 0.15 | 0.14 |
| Neutral detergent fiber | 467b | 579ab | 596a | 606a | 30.08 | 0.02 | 0.28 | 0.45 |
| Acid detergent fiber | 354 | 403 | 383 | 293 | 41.65 | 0.54 | 0.25 | 0.92 |
| Non-fiber carbohydrate | 730 | 744 | 769 | 783 | 27.14 | 0.51 | 0.66 | 0.69 |
1SEM = standard error of the mean. 2Probability of significant linear (L), quadratic (Q), and cubic (C) effects of broken rice levels. a, b Within a row, means without a common superscript are significantly different (p < 0.05).
Table 5.
Milk yield and composition in lactating dairy cows (n = 4 per treatment) fed a fermented total mixed ration at different levels of broken rice substitution.
Table 5.
Milk yield and composition in lactating dairy cows (n = 4 per treatment) fed a fermented total mixed ration at different levels of broken rice substitution.
| Broken rice substitution (%) | p-value3 | |||||||
|---|---|---|---|---|---|---|---|---|
| Items1 | 0 | 12 | 24 | 36 | SEM2 | L | Q | C |
| Milk yield | ||||||||
| Milk yield, kg/day | 16.1 | 16.1 | 14.7 | 14.8 | 0.85 | 0.22 | 0.95 | 0.48 |
| FPCM, kg/day | 14.2 | 13.7 | 13.5 | 12.8 | 0.70 | 0.11 | 0.36 | 0.28 |
| ECM, kg/day | 14.1 | 13.6 | 13.6 | 12.7 | 0.69 | 0.12 | 0.38 | 0.28 |
| Protein, g/day | 535.6 | 545.8 | 499.1 | 513.4 | 38.30 | 0.53 | 0.97 | 0.52 |
| Fat, g/day | 478.5a | 428.5ab | 406.1ab | 362.6b | 24.50 | 0.04 | 0.11 | 0.30 |
| Lactose, g/day | 753.8 | 768.8 | 713.0 | 703.5 | 40.30 | 0.30 | 0.77 | 0.54 |
| Solid not fat, kg/day | 1.4 | 1.4 | 1.3 | 1.3 | 0.09 | 0.44 | 0.94 | 0.70 |
| Milk composition | ||||||||
| Milk protein, g/kg | 33.4 | 33.6 | 33.9 | 33.8 | 1.02 | 0.77 | 0.86 | 0.94 |
| Milk fat, g/kg | 29.6 | 28.8 | 25.9 | 27.8 | 2.08 | 0.59 | 0.26 | 0.89 |
| Milk lactose, g/kg | 46.4 | 47.1 | 47.7 | 47.3 | 0.75 | 0.37 | 0.50 | 0.79 |
| Solid not fat, g/kg | 87.8 | 87.3 | 89.8 | 89.3 | 1.28 | 0.28 | 1.00 | 0.33 |
| Milk energy, MJ/kg | 2.3 | 2.3 | 2.3 | 2.4 | 0.10 | 0.89 | 0.93 | 0.77 |
| SCC, x103 cell/mL | 92.3 | 330.7 | 252.3 | 119.5 | 52.50 | 0.81 | 0.24 | 0.33 |
| Feed efficiency | 1.1 | 1.0 | 1.0 | 1.0 | 0.07 | 0.90 | 0.48 | 0.60 |
1Fat and protein-corrected milk was calculated by Gerber et al. [24], FPCM (kg/day) = (0.337 + 0.116 × fat% + 0.06 × protein%) × milk yield (kg/day), Energy-corrected milk (ECM, kg/day) = (milk yield (kg/day) × milk energy (MJ/kg))/3.1 and milk energy (MJ/kg) = (0.0384 × fat) + (0.0223 × protein) + (0.0199 × lactose) − 0.108, as described by Cabezas-Garcia et al. [25], SCC = somatic cell count. Feed efficiency = FPCM yield (kg/day)/DMI (kg/day). 2SEM = standard error of the mean. 3Probability of significant linear (L), quadratic (Q), and cubic (C) effects of broken rice levels. a, b Within a row, means without a common superscript are significantly different (p < 0.05).
Table 6.
Daily respiratory gas (L/day), energy partition (kJ/kgBW0.75), intake (kJ/kgBW0.75), content of diet (MJ/kg of DM), and utilization in lactating dairy cows (n = 4 per treatment) fed a fermented total mixed ration at different levels of broken rice substitution.
Table 6.
Daily respiratory gas (L/day), energy partition (kJ/kgBW0.75), intake (kJ/kgBW0.75), content of diet (MJ/kg of DM), and utilization in lactating dairy cows (n = 4 per treatment) fed a fermented total mixed ration at different levels of broken rice substitution.
| Broken rice substitution (%) | p-value3 | |||||||
|---|---|---|---|---|---|---|---|---|
| Items1 | 0 | 12 | 24 | 36 | SEM2 | L | Q | C |
| Respiratory gas | ||||||||
| O2 consumption | 3,566 | 3,787 | 4,048 | 3,849 | 142.50 | 0.19 | 0.23 | 0.47 |
| CO2 production | 4,033 | 4,360 | 4,651 | 4,491 | 206.08 | 0.14 | 0.38 | 0.72 |
| CH4 emission | 258.7 | 298.0 | 275.4 | 303.6 | 17.03 | 0.18 | 0.94 | 0.18 |
| RQ | 1.1 | 1.2 | 1.2 | 1.2 | 0.01 | 0.16 | 0.71 | 0.61 |
| Energy partition | ||||||||
| Gross energy intake | 2,190 | 2,368 | 2,066 | 2,411 | 131.41 | 0.71 | 0.65 | 0.13 |
| Fecal excretion | 597.0 | 627.7 | 561.4 | 620.6 | 28.06 | 0.88 | 0.59 | 0.13 |
| Urine excretion | 55.3 | 60.1 | 56.5 | 44.7 | 5.51 | 0.26 | 0.22 | 1.00 |
| Methane emission | 92.2b | 116.0a | 100.2ab | 115.7a | 4.15 | 0.04 | 0.50 | 0.01 |
| Heat production | 692.1 | 799.5 | 811.4 | 796.0 | 53.60 | 0.29 | 0.34 | 0.79 |
| Milk energy | 287.4 | 352.3 | 319.5 | 323.0 | 19.22 | 0.48 | 0.20 | 0.19 |
| Energy balance | 466.4 | 411.9 | 416.9 | 472.0 | 106.95 | 0.76 | 0.24 | 0.28 |
| El(0) | 638.1 | 652.1 | 519.9 | 670.0 | 68.70 | 0.92 | 0.40 | 0.23 |
| Energy intake | ||||||||
| DE | 1,593 | 1,739 | 1,505 | 1,753 | 116.45 | 0.70 | 0.70 | 0.16 |
| ME | 1,446 | 1,564 | 1,348 | 1,591 | 121.87 | 0.74 | 0.65 | 0.21 |
| NEL | 1,151 | 1,178 | 1,023 | 1,185 | 72.14 | 0.89 | 0.43 | 0.19 |
| Energy content | ||||||||
| DE | 13.1 | 13.4 | 13.2 | 13.3 | 0.29 | 1.00 | 0.69 | 0.74 |
| ME | 11.9 | 12.0 | 11.8 | 12.1 | 0.40 | 1.00 | 0.98 | 0.73 |
| NEL | 9.35 | 9.04 | 8.97 | 9.10 | 0.25 | 0.48 | 0.50 | 0.93 |
| Energy utilization | ||||||||
| DE/GE | 0.72 | 0.74 | 0.73 | 0.74 | 0.13 | 0.63 | 0.85 | 0.60 |
| ME/GE | 0.65 | 0.66 | 0.65 | 0.68 | 0.20 | 0.77 | 0.83 | 0.64 |
| ME/DE | 0.90 | 0.90 | 0.89 | 0.91 | 0.01 | 1.00 | 0.51 | 0.66 |
1El(0) = milk energy output adjusted to zero energy balance, DE = digestible energy, GE = gross energy, ME = metabolizable energy, NEL = net energy for lactation. 2SEM = standard error of the mean. 3Probability of significant linear (L), quadratic (Q), and cubic (C) effects of broken rice levels. a-c Within a row, means without a common superscript are significantly different (p < 0.05).
Table 7.
Regression method used for estimating energy values in broken rice.
| Item1 | Regression equations2 | RMSE3 | R2 | p- value | Slope | Intercept | |||
|---|---|---|---|---|---|---|---|---|---|
| SEM4 | p- value | SEM | p- value | ||||||
| DE, MJ/kg DM | Y = 13.13X + 0.02 | 0.25 | 0.98 | <0.0001 | 0.49 | <0.0001 | 0.10 | 0.85 | |
| ME, MJ/kg DM | Y = 11.87X + 1.91 | 0.31 | 0.96 | <0.0001 | 0.62 | <0.0001 | 0.13 | 0.89 | |
| NEL, MJ/kg DM | Y = 8.68X + 1.18 | 0.50 | 0.85 | <0.0001 | 0.99 | <0.0001 | 0.21 | 0.95 |
1DE = digestible energy, DM = dry matter, ME = metabolizable energy, NEL = net energy for lactation. 2Y is ingredient-associated digestible energy, metabolizable energy and net energy for lactation in megajoules, X is test ingredient intake in kilograms (DM basis), the intercept is in megajoules, and the slopes are in megajoules per kilograms DM. 3RMSE = root-mean square error. 4SEM = standard error of the mean.
Table 8.
Analyzed energy values of broken rice feedstuff determined by substitution methods when compared with the regression method.
Table 8.
Analyzed energy values of broken rice feedstuff determined by substitution methods when compared with the regression method.
| Item1 | Comparative method | SEM2 | p- value | |||
|---|---|---|---|---|---|---|
| Substitution | Substitution | Substitution | Regression | |||
| 12% | 24% | 36% | ||||
| DE, MJ/kg DM | 13.15 | 13.13 | 12.82 | 13.13 | 0.63 | 0.98 |
| ME, MJ/kg DM | 11.88 | 11.87 | 11.60 | 11.87 | 0.77 | 0.99 |
| NEL, MJ/kg DM | 8.61 | 8.72 | 8.45 | 8.68 | 1.20 | 0.99 |
1DE = digestible energy, DM = dry matter, ME = metabolizable energy, NEL = net energy for lactation. 2SEM = standard error of the mean.
Disclaimer/Publisher’s Note: The statements, opinions and data contained in all publications are solely those of the individual author(s) and contributor(s) and not of MDPI and/or the editor(s). MDPI and/or the editor(s) disclaim responsibility for any injury to people or property resulting from any ideas, methods, instructions or products referred to in the content. |
© 2023 by the authors. Licensee MDPI, Basel, Switzerland. This article is an open access article distributed under the terms and conditions of the Creative Commons Attribution (CC BY) license (http://creativecommons.org/licenses/by/4.0/).
Copyright: This open access article is published under a Creative Commons CC BY 4.0 license, which permit the free download, distribution, and reuse, provided that the author and preprint are cited in any reuse.


