1. Introduction
The ionosphere is the region of the atmosphere constituted by the presence of ions and free electrons. It extends mainly between 60 km and 1000 km ([
1]), and solar radiation is its principal ionization agent ([
2]). Through Global Navigation Satellite System (GNSS) measurements, the total electron content (TEC) can be calculated. TEC is defined as the integrated electron density along the signal path from the satellite to the GNSS receiver ([
3]). This can be dynamically perturbed by external influences, such as solar activity and, geomagnetic storms, among others; and by internal influences, such as thunderstorms, earthquakes, etc. ([
4]). Regarding internal influences, thunderstorms, and convective systems can generate wave structures in the ionospheric plasma ([
3,
5,
6]). These structures, known as Atmospheric Gravity Waves (AGWs), have been related to electromagnetic pulses during thunderstorms ([
7]), and they can also be detected by GNSS measurements ([
8]). Overshooting top, lightning, or a combination of both can generate gravity waves ([
3,
9]). Transient Luminous Events (TLEs) and discharges originating in the stratiform region could be a source of these waves ([
10,
11]). AGWs can propagate vertically upwards and transfer energy and momentum to the ionosphere ([
1]). As they ascend, they can become unstable and break up, generating secondary waves ([
12]). These secondary waves on their journey modulate the ionospheric plasma in the E region ([
12]). Models of AGWs originating from thunderstorms predict variations in TEC of 7% ([
13]). In [
14], AGWs with periodicities between 25 to 30 minutes and peak-to-peak amplitudes greater than 0.3 TECU were found. In addition, waves with periodicities less than 4 minutes and peak-to-peak amplitudes around 0.1 TECU, known as Acoustic waves, were also detected. Both were observed in the central region of Argentina. Therefore, considering these investigations and continuing with the research carried out by [
14], we aim to study the ionospheric variations generated by thunderstorms that developed in central Argentina, focusing on the amplitude and periodicity of AGWs and their horizontal range with respect to the center of the storms.
The north-central region of Argentina is a zone of the world with a high frequency of severe weather reports, such as hail, flooding, tornadoes, and strong wind gusts ([
15,
16,
17]). On November 22, 2018, accumulated precipitation exceeding 200 mm was recorded in northern Argentina and Paraguay, caused by a mesoscale convective system ([
18]). Hailstones of 4 cm has also been recorded over the province of Mendoza ([
19]) and greater than 15 cm in Villa Carlos Paz, province of Córdoba, Argentina ([
20,
21]). The Remote Sensing of Electrification, Lightning, and Mesoscale/Microscale Processes with Adaptive Ground Observations (RELAMPAGO; [
22]); and the Cloud, Aerosol, and Complex Terrain Interactions (CACTI; [
23]) (RELAMPAGO-CACTI, [
24]) projects were conducted in late 2018 and mid-April 2019 in order to study the convective storms that produce these high-impact meteorological events, often along the Sierras de Córdoba and the Andes. These projects were implemented in the provinces of Córdoba and Mendoza in Argentina and western Rio Grande do Sul in Brazil. More than 200 researchers from the United States, Brazil, and Argentina participated in the RELAMPAGO-CACTI campaign. The location and timing of the RELAMPAGO - CACTI project were chosen as the ideal scenario for this study.
The paper is divided into five sections.
Section 2 describes the data used and the methodology employed.
Section 3 and
Section 4 present results and discussion, respectively. Finally,
Section 5 is devoted to the conclusions.
2. Materials and Methods
As mentioned above, solar activity plays a significant role in the ionization process of the upper atmosphere. We worked during nighttime to reduce these effects on geomagnetically quiet days, with planetary index
, [
25].
describes the average level of irregularities in the horizontal components of the Earth’s magnetic field ([
1]). Thus, during the analysis period, 00:00 UTC – 08:00 UTC (21:00 LT - 05:00 LT), two days of 2018 with
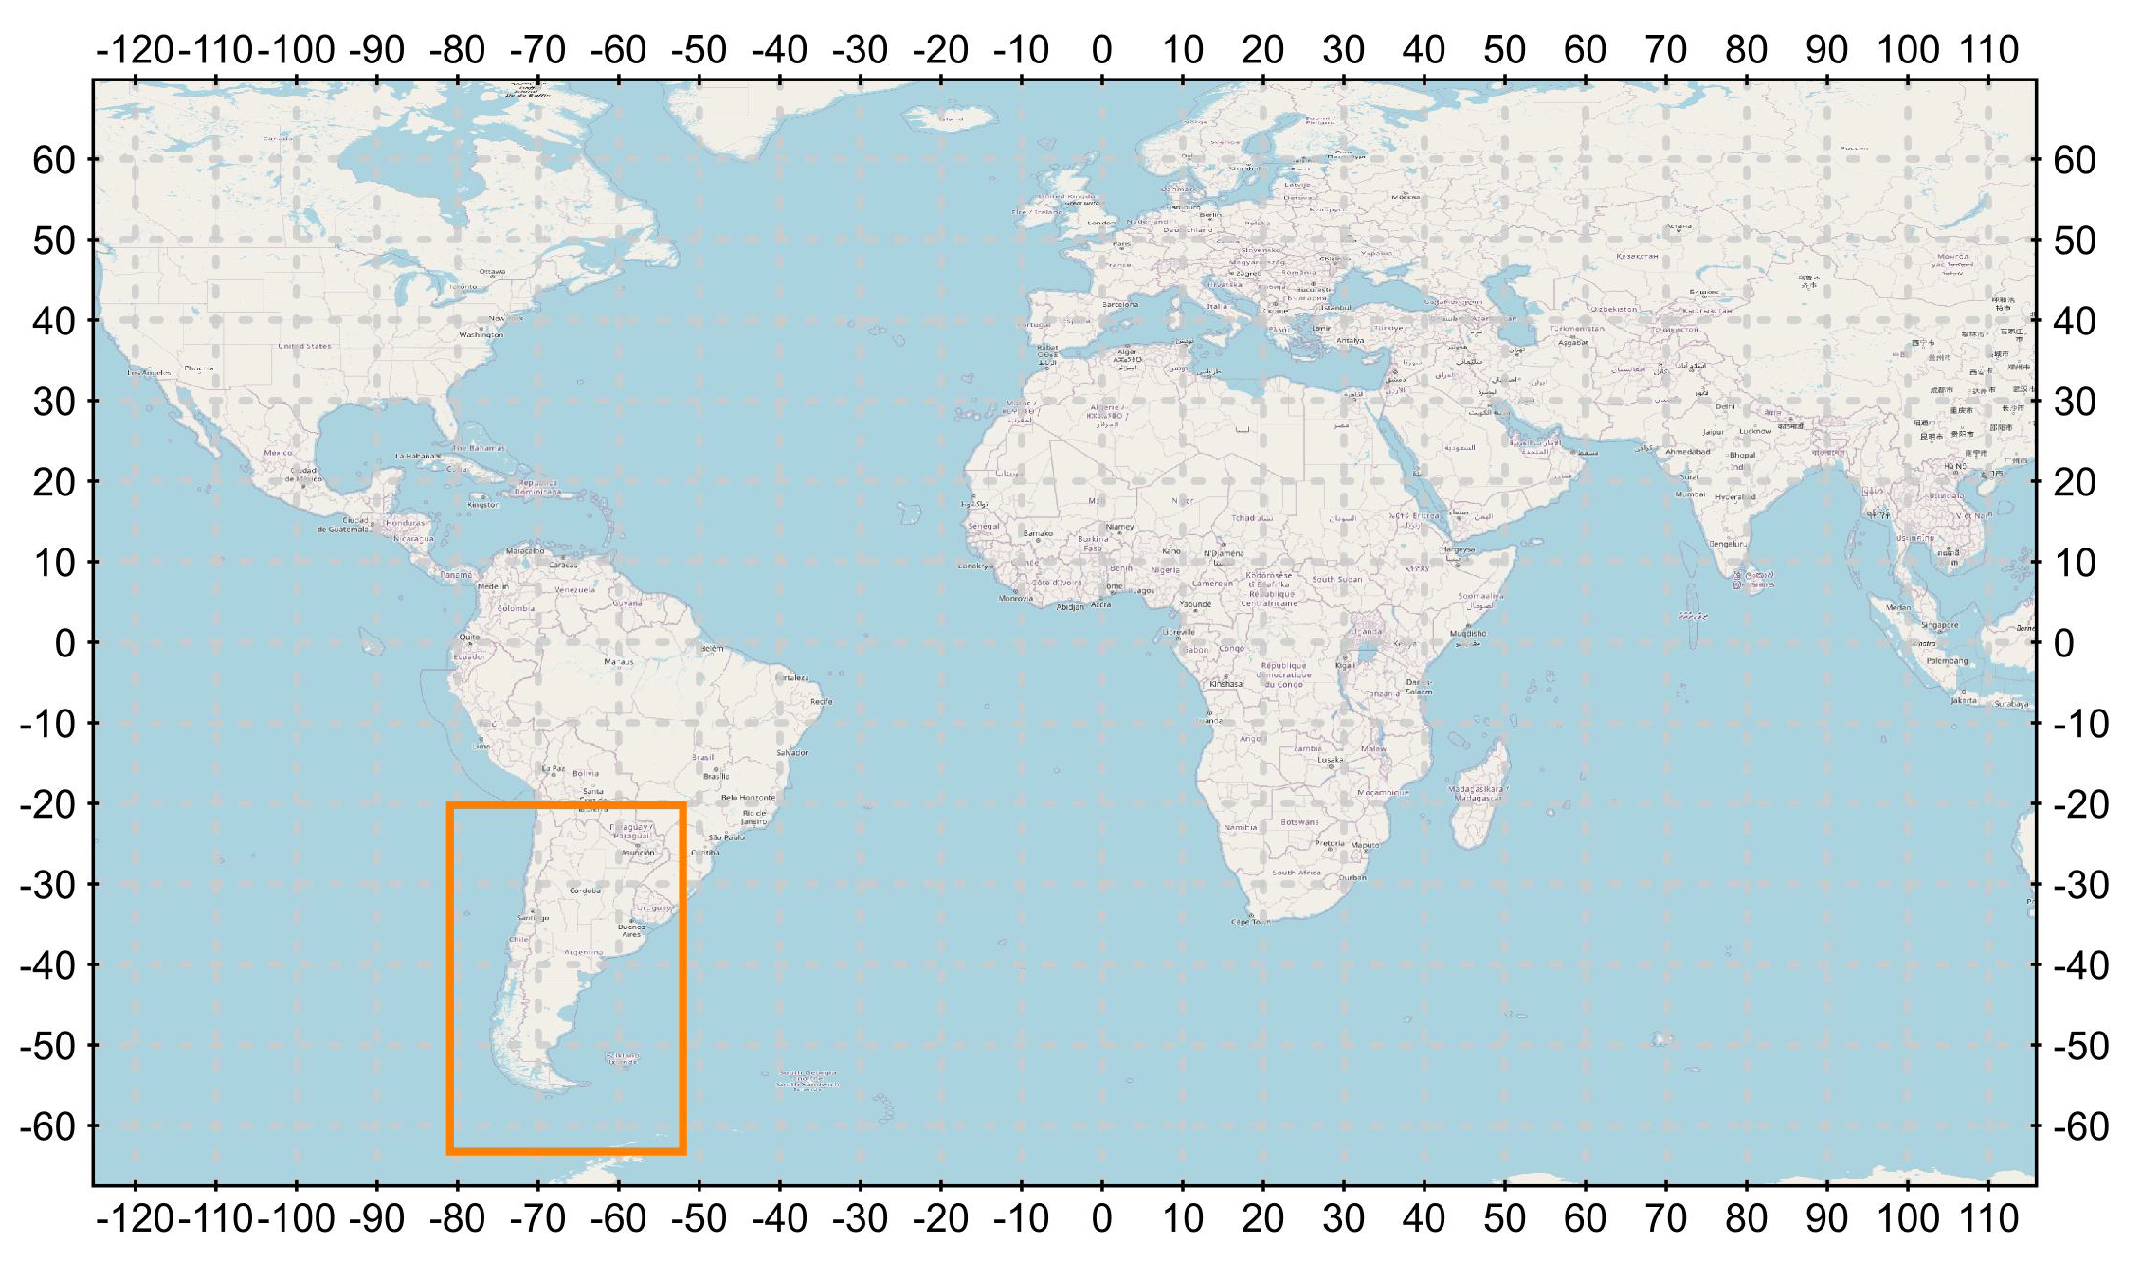
were selected. November 10, with some electrical activity detected, and September 9, without lightning. We worked in the region defined between latitudes 64°S – 21°S and longitudes 80°W – 53°W, as can be seen in
Figure 1.
The data used in this paper are:
Atmospheric Electrical Activity (AEA) data detected by the Earth Networks Total Lightning Network (ENTLN) [
26]. ENTLN uses broadband sensors with frequencies between 1 Hz - 12 MHz. ENTLN can distinguish between the type of discharge, i.e. Cloud-to-Ground (CG) and In-Cloud (IC) lightning. This network consists of more than 1800 sensors deployed in more than 100 countries ([
27]). There are 50 sensors installed in Argentina. The sensors record the electric field signals produced by lightning, which are sent to the central processor. Using the time-of-arrival (TOA) technique, the lightning is geolocated in real time ([
27]). The data obtained from this network are the type of discharge (CG or IC), the time of occurrence, the geolocation, the estimated peak current, the height of the detected IC discharge, the multiplicity of the discharges, and the number of sensors that detected the discharge. More information can be found in [
28].
Advanced Baseline Imaging (ABI) data from the GOES-R 16 series of Geostationary Operational Environmental Satellites (GOES) corresponding to channel 13, wavelength 10.3
m. The data are free and available at [
29]. Detailed information on GOES-16 and the ABI sensor can be found in [
30].
GNSS observation data from the Crustal dynamics data information system (CDDIS), [
31], and the Argentine Continuous Satellite Monitoring Network (RAMSAC, [
32]).
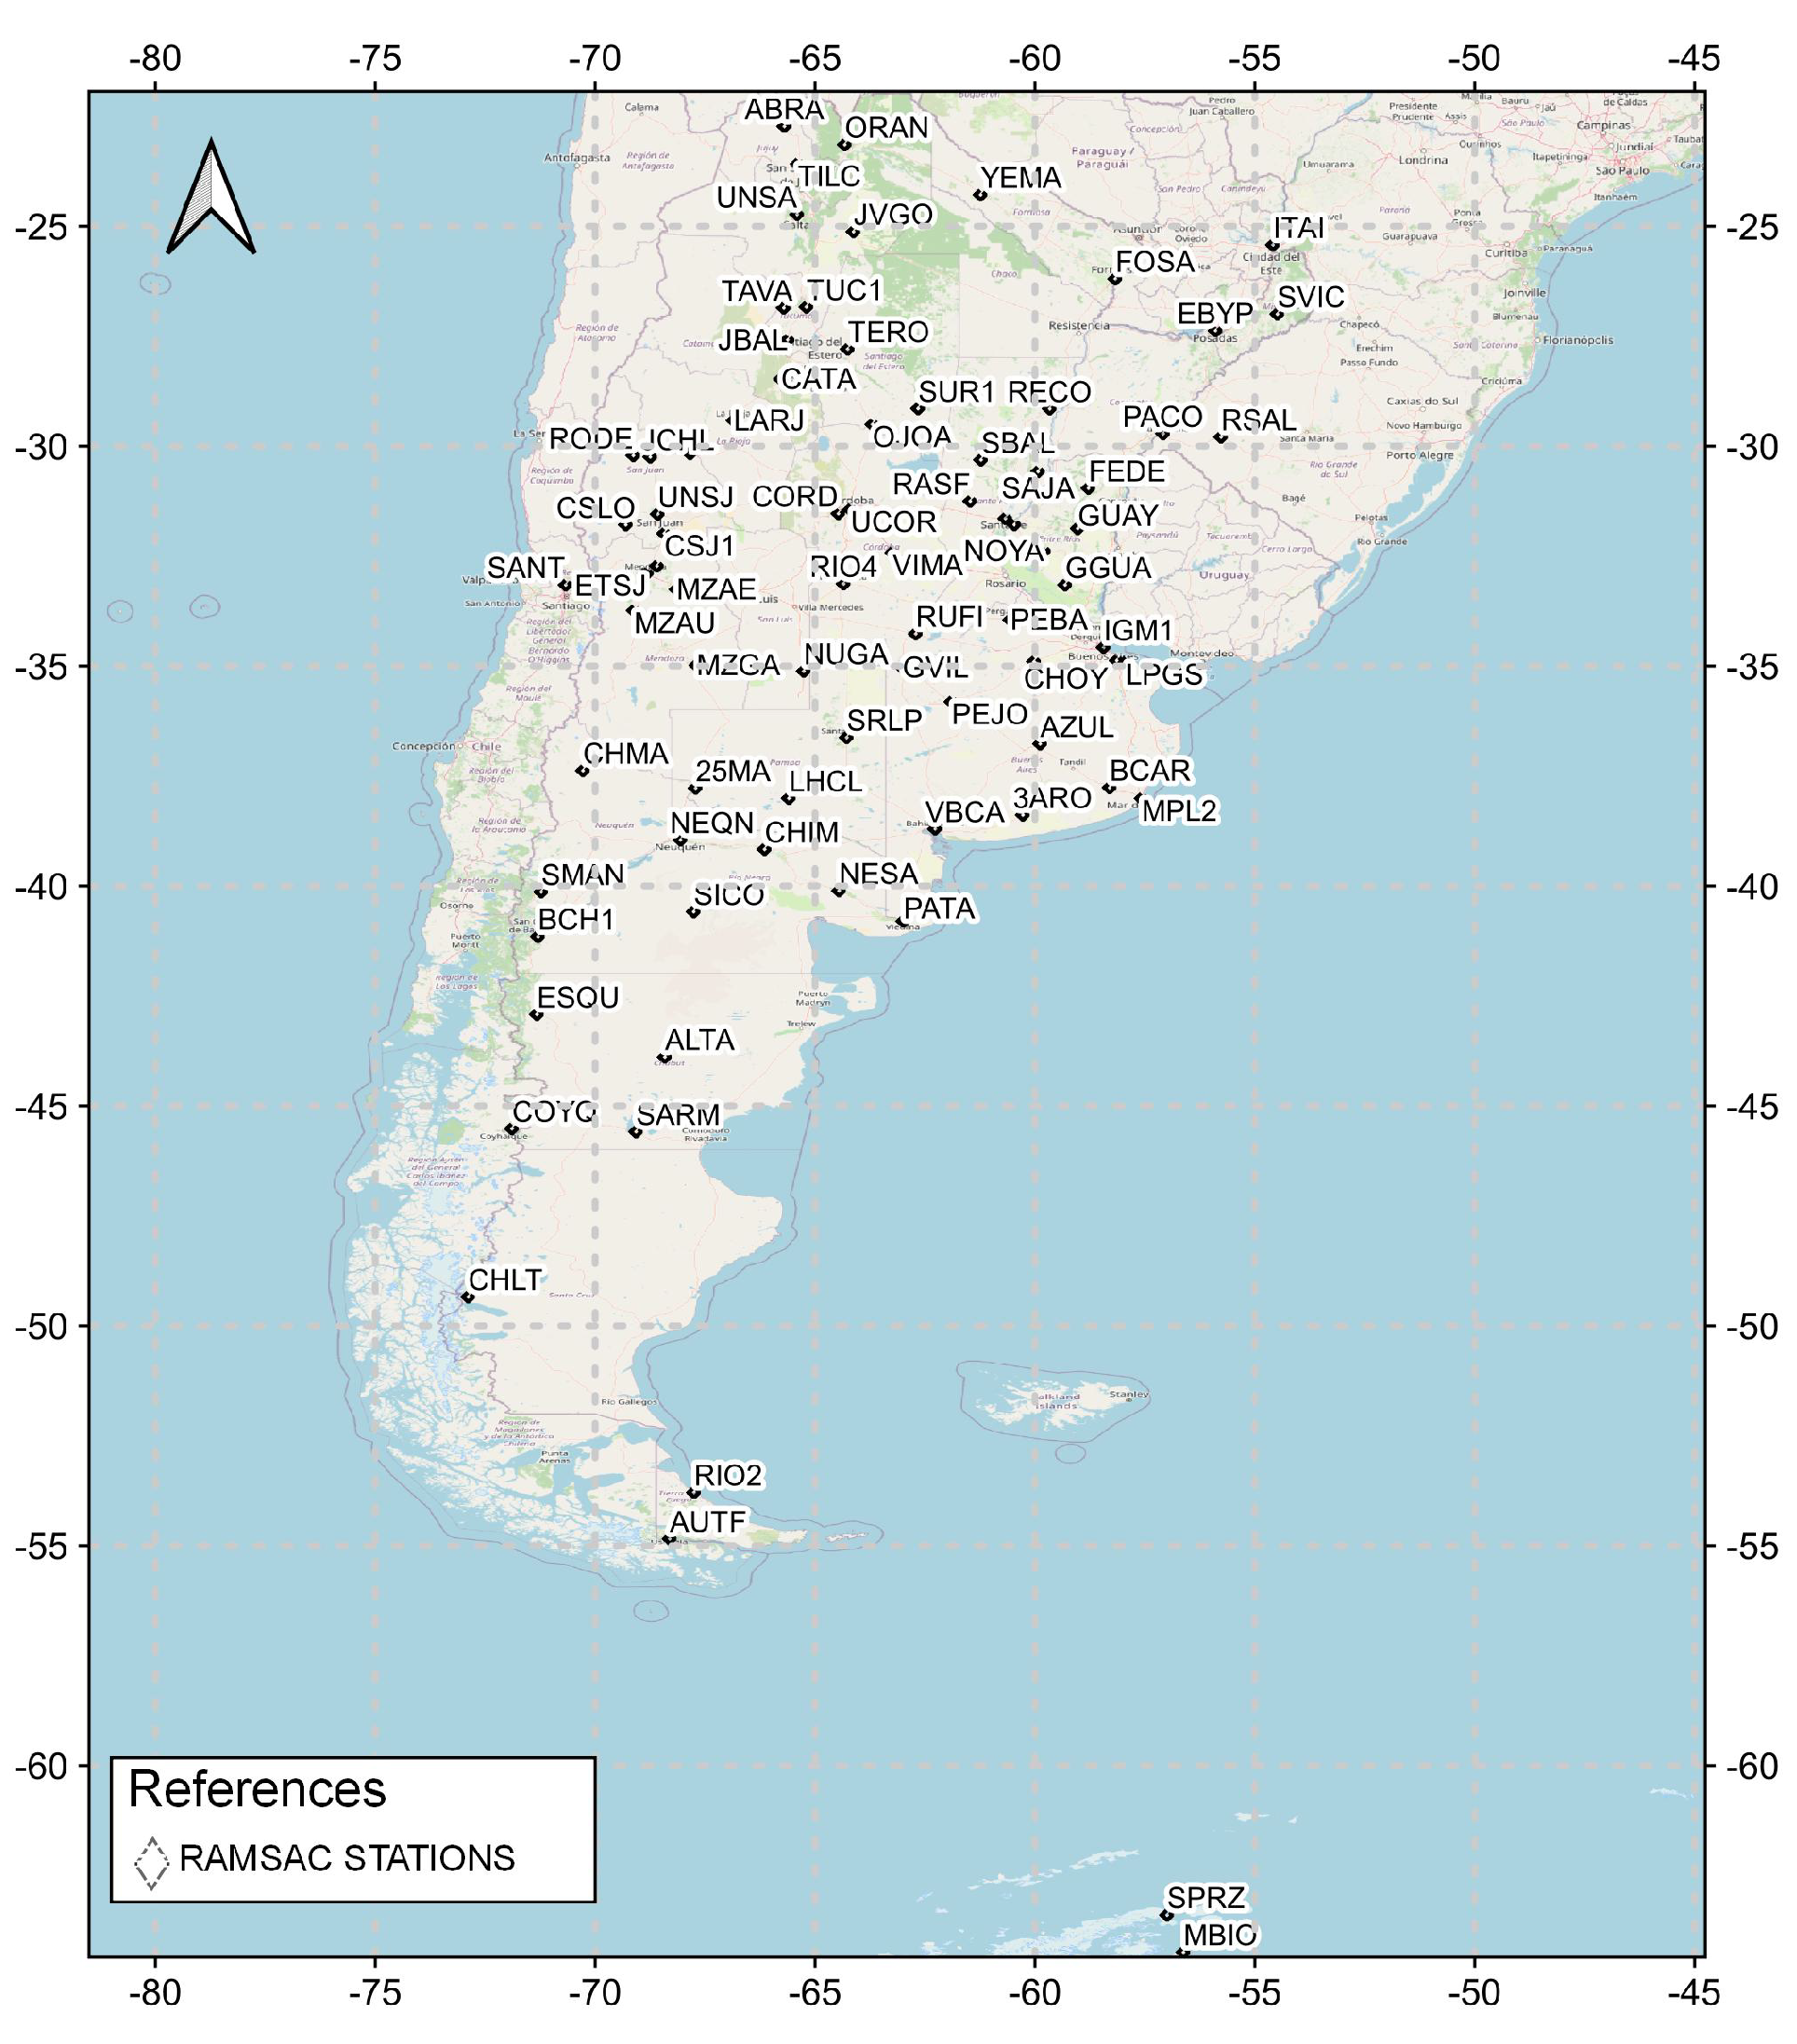
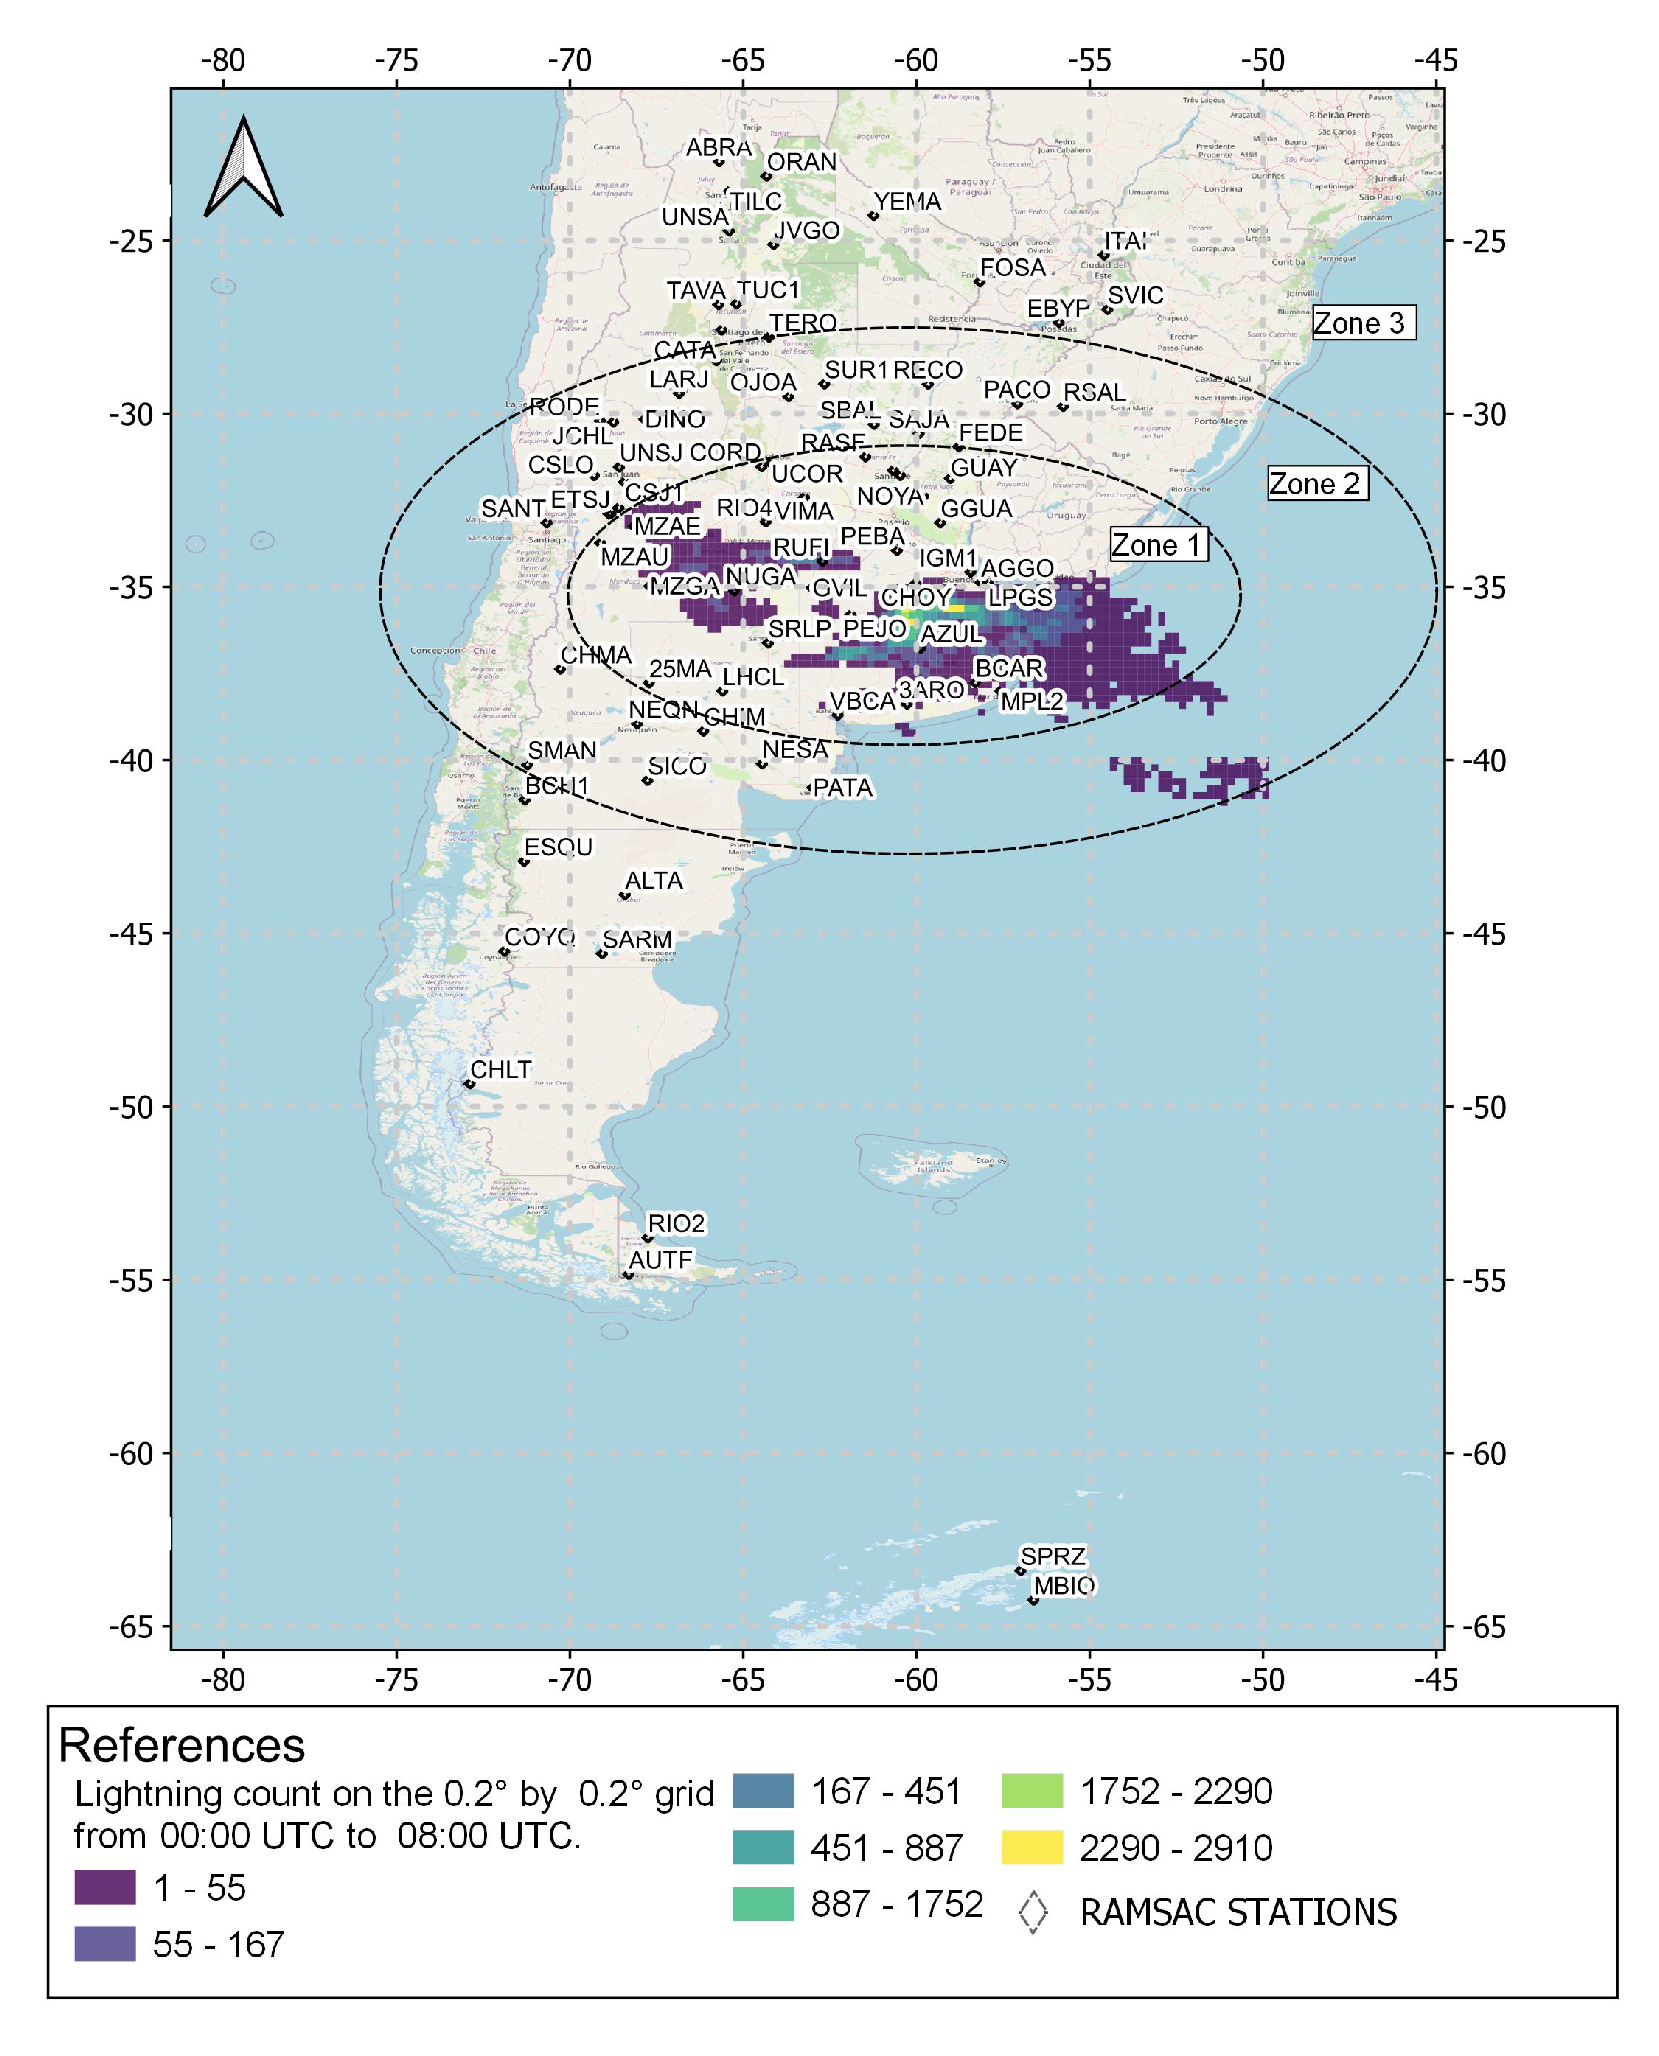
Figure 2 shows the RAMSAC Stations used in this study.
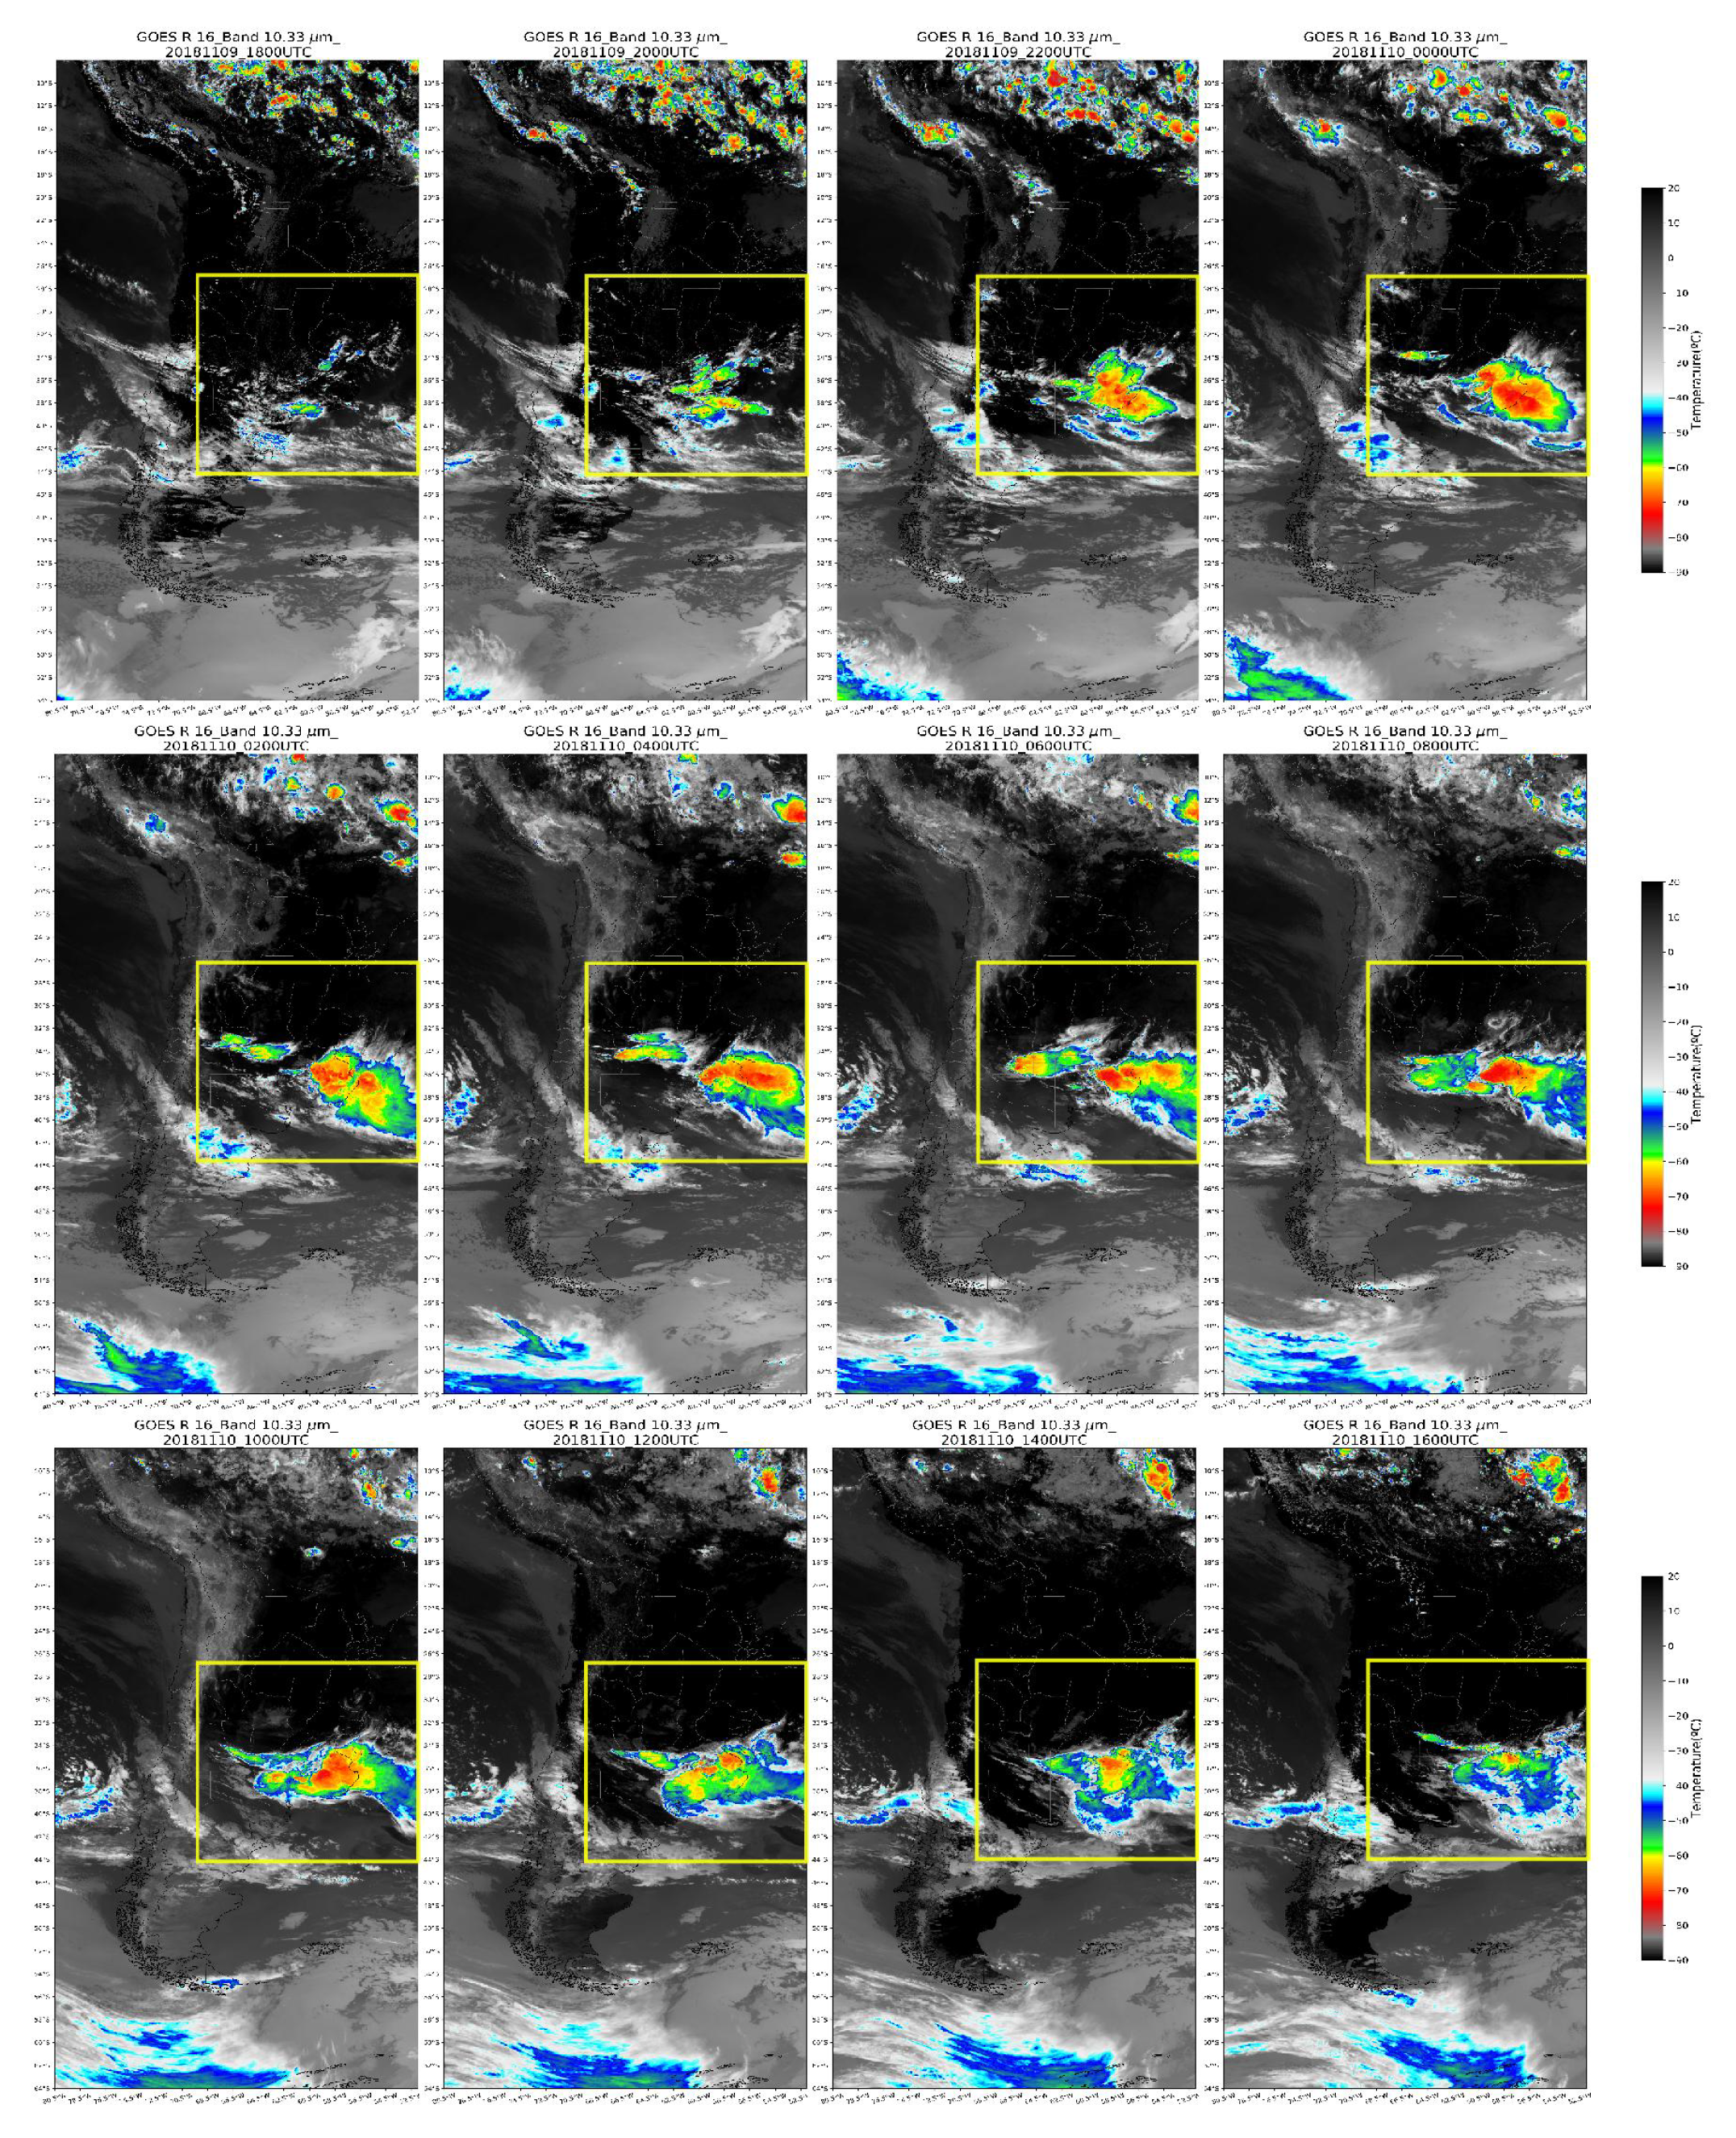
In order to analyze the ionospheric variations generated by thunderstorms, the following procedure was carried out. First, we used the cloud-top Brightness Temperature (BT), corresponding to channel 13, wavelength 10.3
m of the GOES-R 16 satellite, as a proxy for the optically thick cloud-top temperature ([
33]). Radiation at this wavelength (10.3
m) is not affected by absorption by atmospheric gases ([
34]). Using cloud-top Brightness Temperature (BT) and thunderstorm discharge data, the temporal evolution of thunderstorms on November 10, 2018, was studied. Statistical and descriptive analyzes of the lightning detected were then performed. The analyzed parameters were the peak current and the lightning count. "The lightning count is the number of lightning events that occurred" ([
35]). In addition, we classified the lightning strokes according to their type (i.e., CG and IC) and polarity (i.e., negative or positive).
The GNSS data were then preprocessed with Bernese GNSS software version 5.2 ([
36]). This software uses the models recommended by the International Earth Rotation and Reference Systems Service (IERSS) ([
37]). These models include ocean and atmospheric tidal loading corrections ([
38,
39]) and absolute phase-center corrections for satellites and receivers from IGS. The phase-code delay ionospheric observable along with the geographic latitude and the sun–fixed longitude of the ionospheric pierce point, zenith distance
, azimuth angle, and time for each satellite over each GNSS station was obtained. Subsequently, for September 9 and November 10, 2018, the Vertical Total Electron Content (VTEC) was obtained using a program developed by MAGGIA Laboratory (Meteorología espacial, Atmósfera terrestre, Geodesia, Geodinámica, desarrollo de instrumentos y Astrometría; [
40]) ([
41,
42]). The ionosphere was approximated by a single shell of infinitesimal thickness with equivalent total oblique electron content (STEC), located 450 km above the Earth’s surface. An obliquity factor,
, was used to convert STEC measurements to VTEC:
where
is the zenith distance of the oblique path at the ionospheric piercing point (IPP). For this work,
30° was used. The ionospheric code delay observable was modeled using the procedure explained in ([
41,
42]). Finally, VTEC measurements in each station were detrended using a 6th to 7th order polynomial fit ([
3]). The previous process removes the gross offset, as well as the trend value obtaining Differential Vertical Total Electron Content (DVTEC) values. The remaining variability is mainly related to the carrier phase, whose accuracy is 0.01 to 0.1 TECU [
43].
Once the DVTEC was obtained, its peak-to-peak amplitude was calculated, using the following definition:
where
and
are the maximum and minimum values of DVTEC, respectively.
Finally, the C-Morlet 1.5 wavelet transform was used to analyze the spectral amplitude and period of the DVTEC signal ([
44]).
4. Discussion
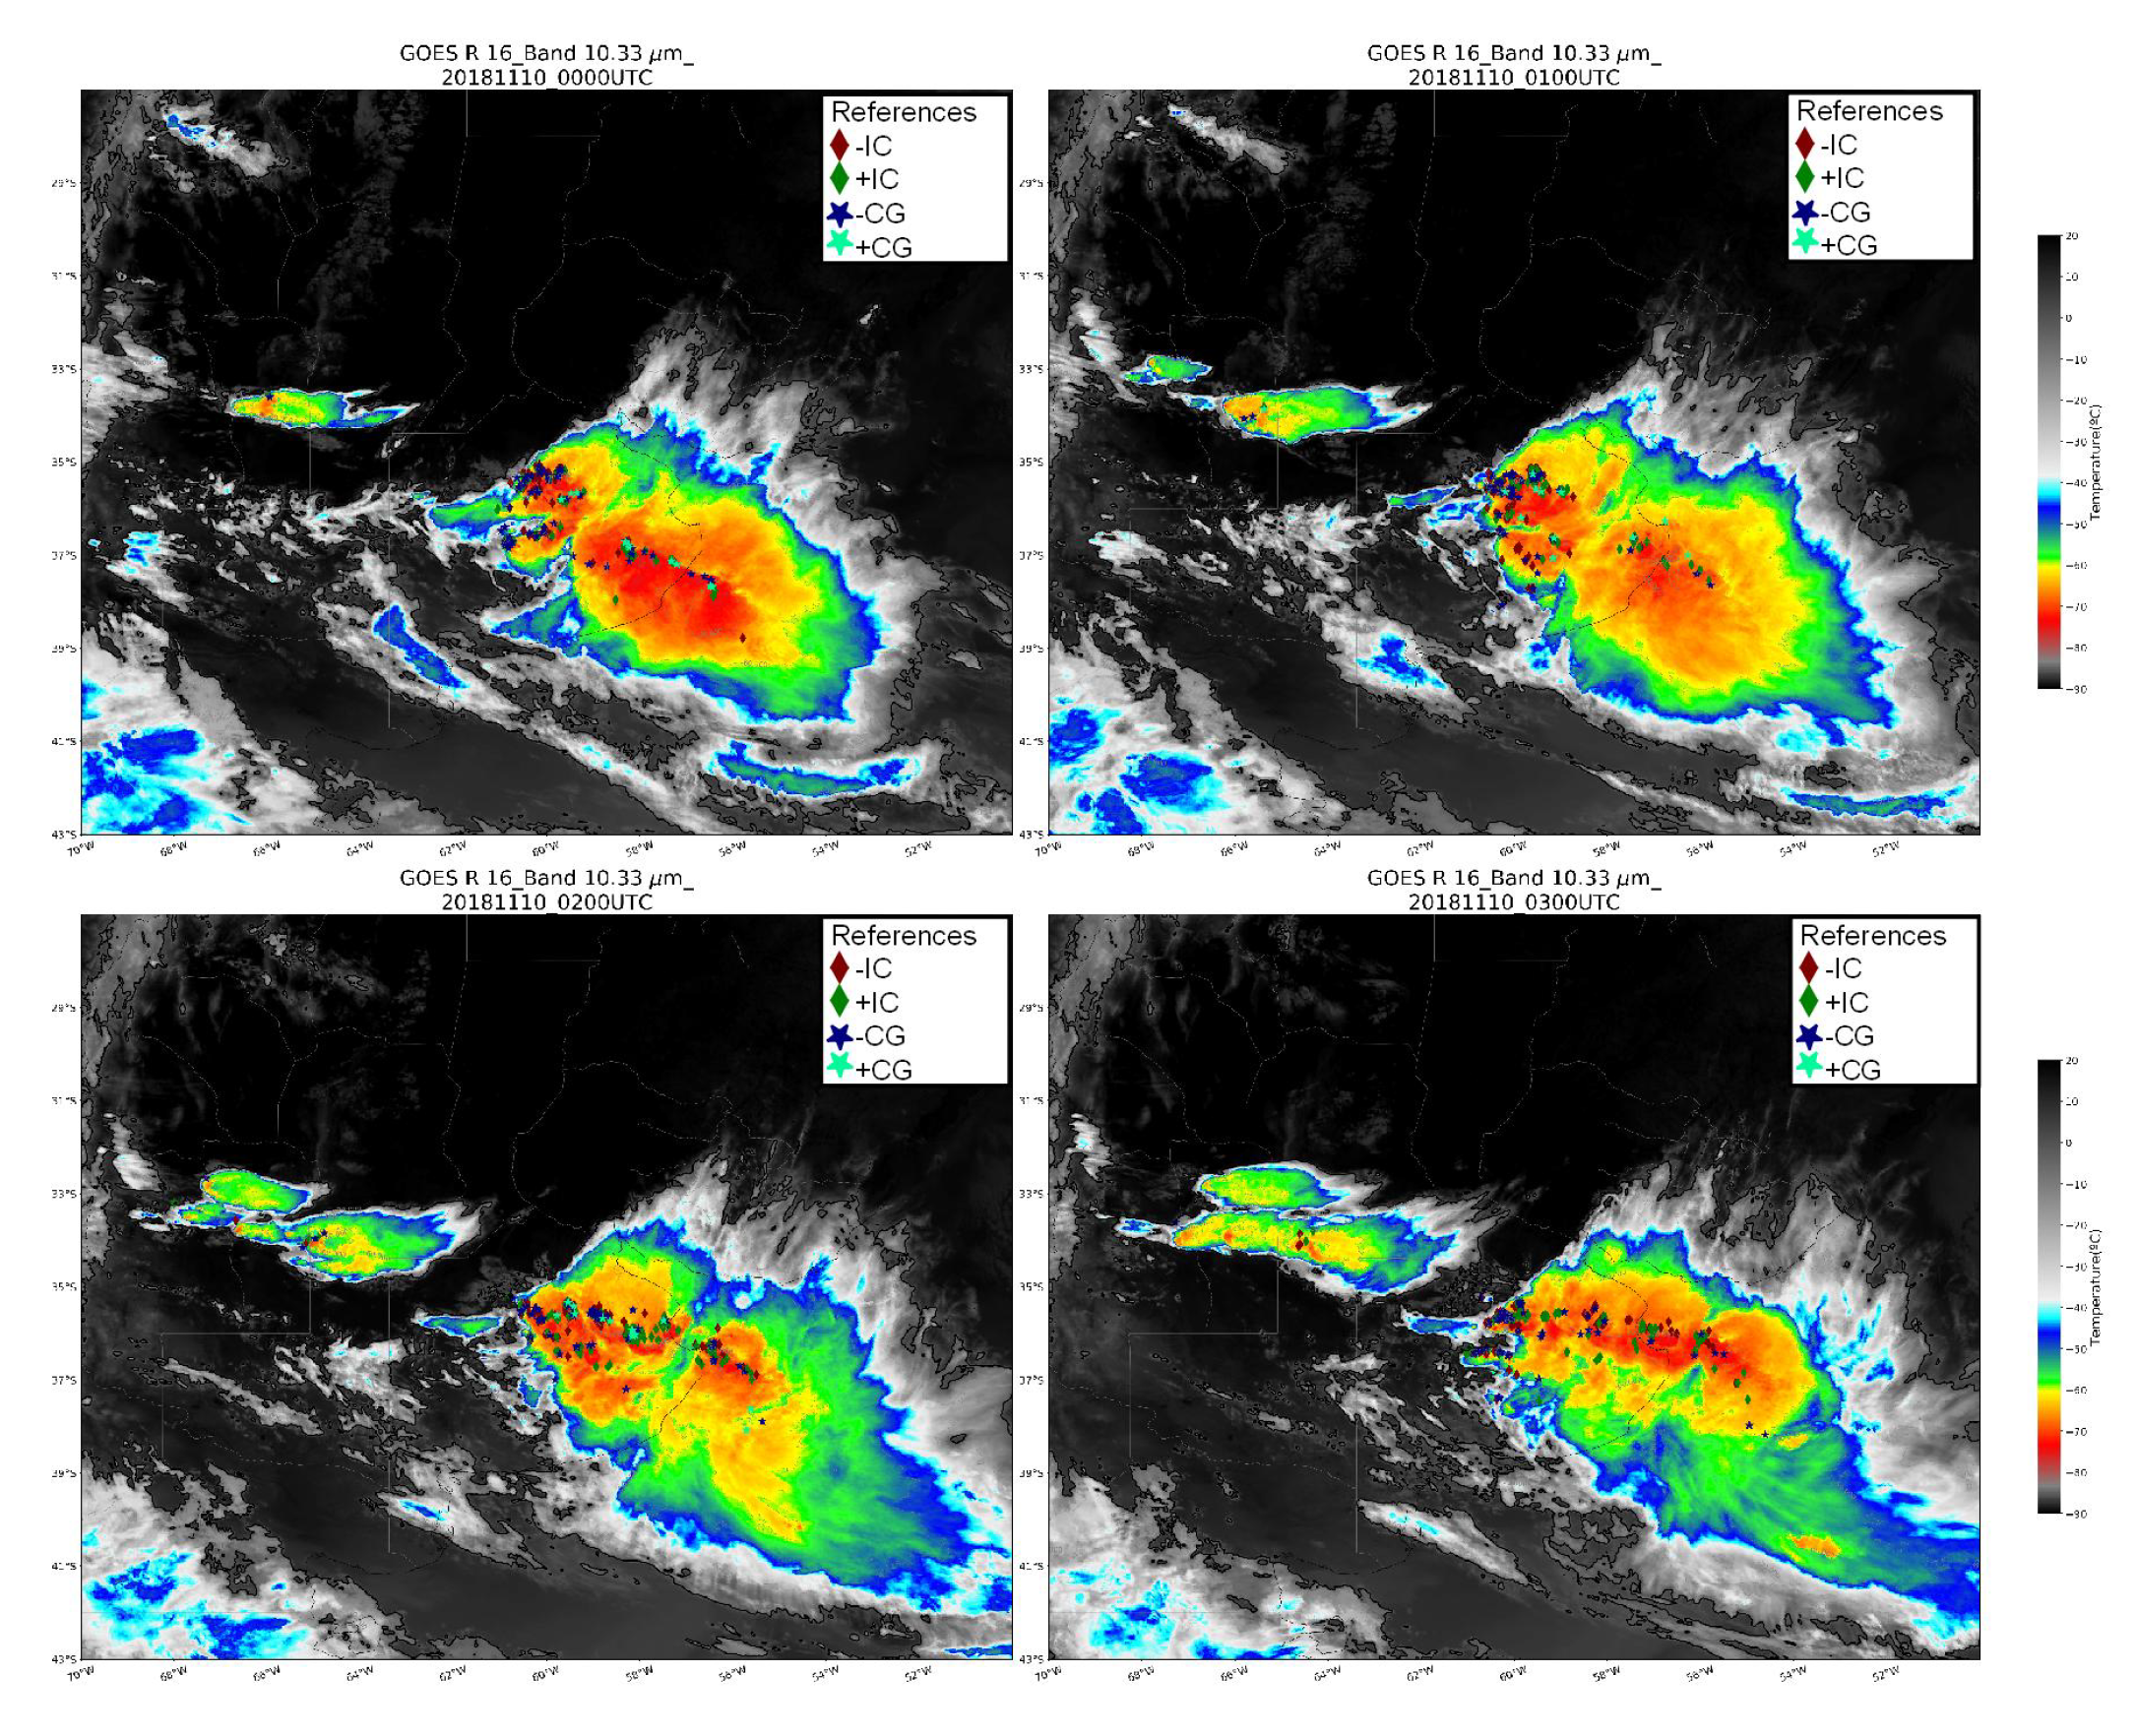
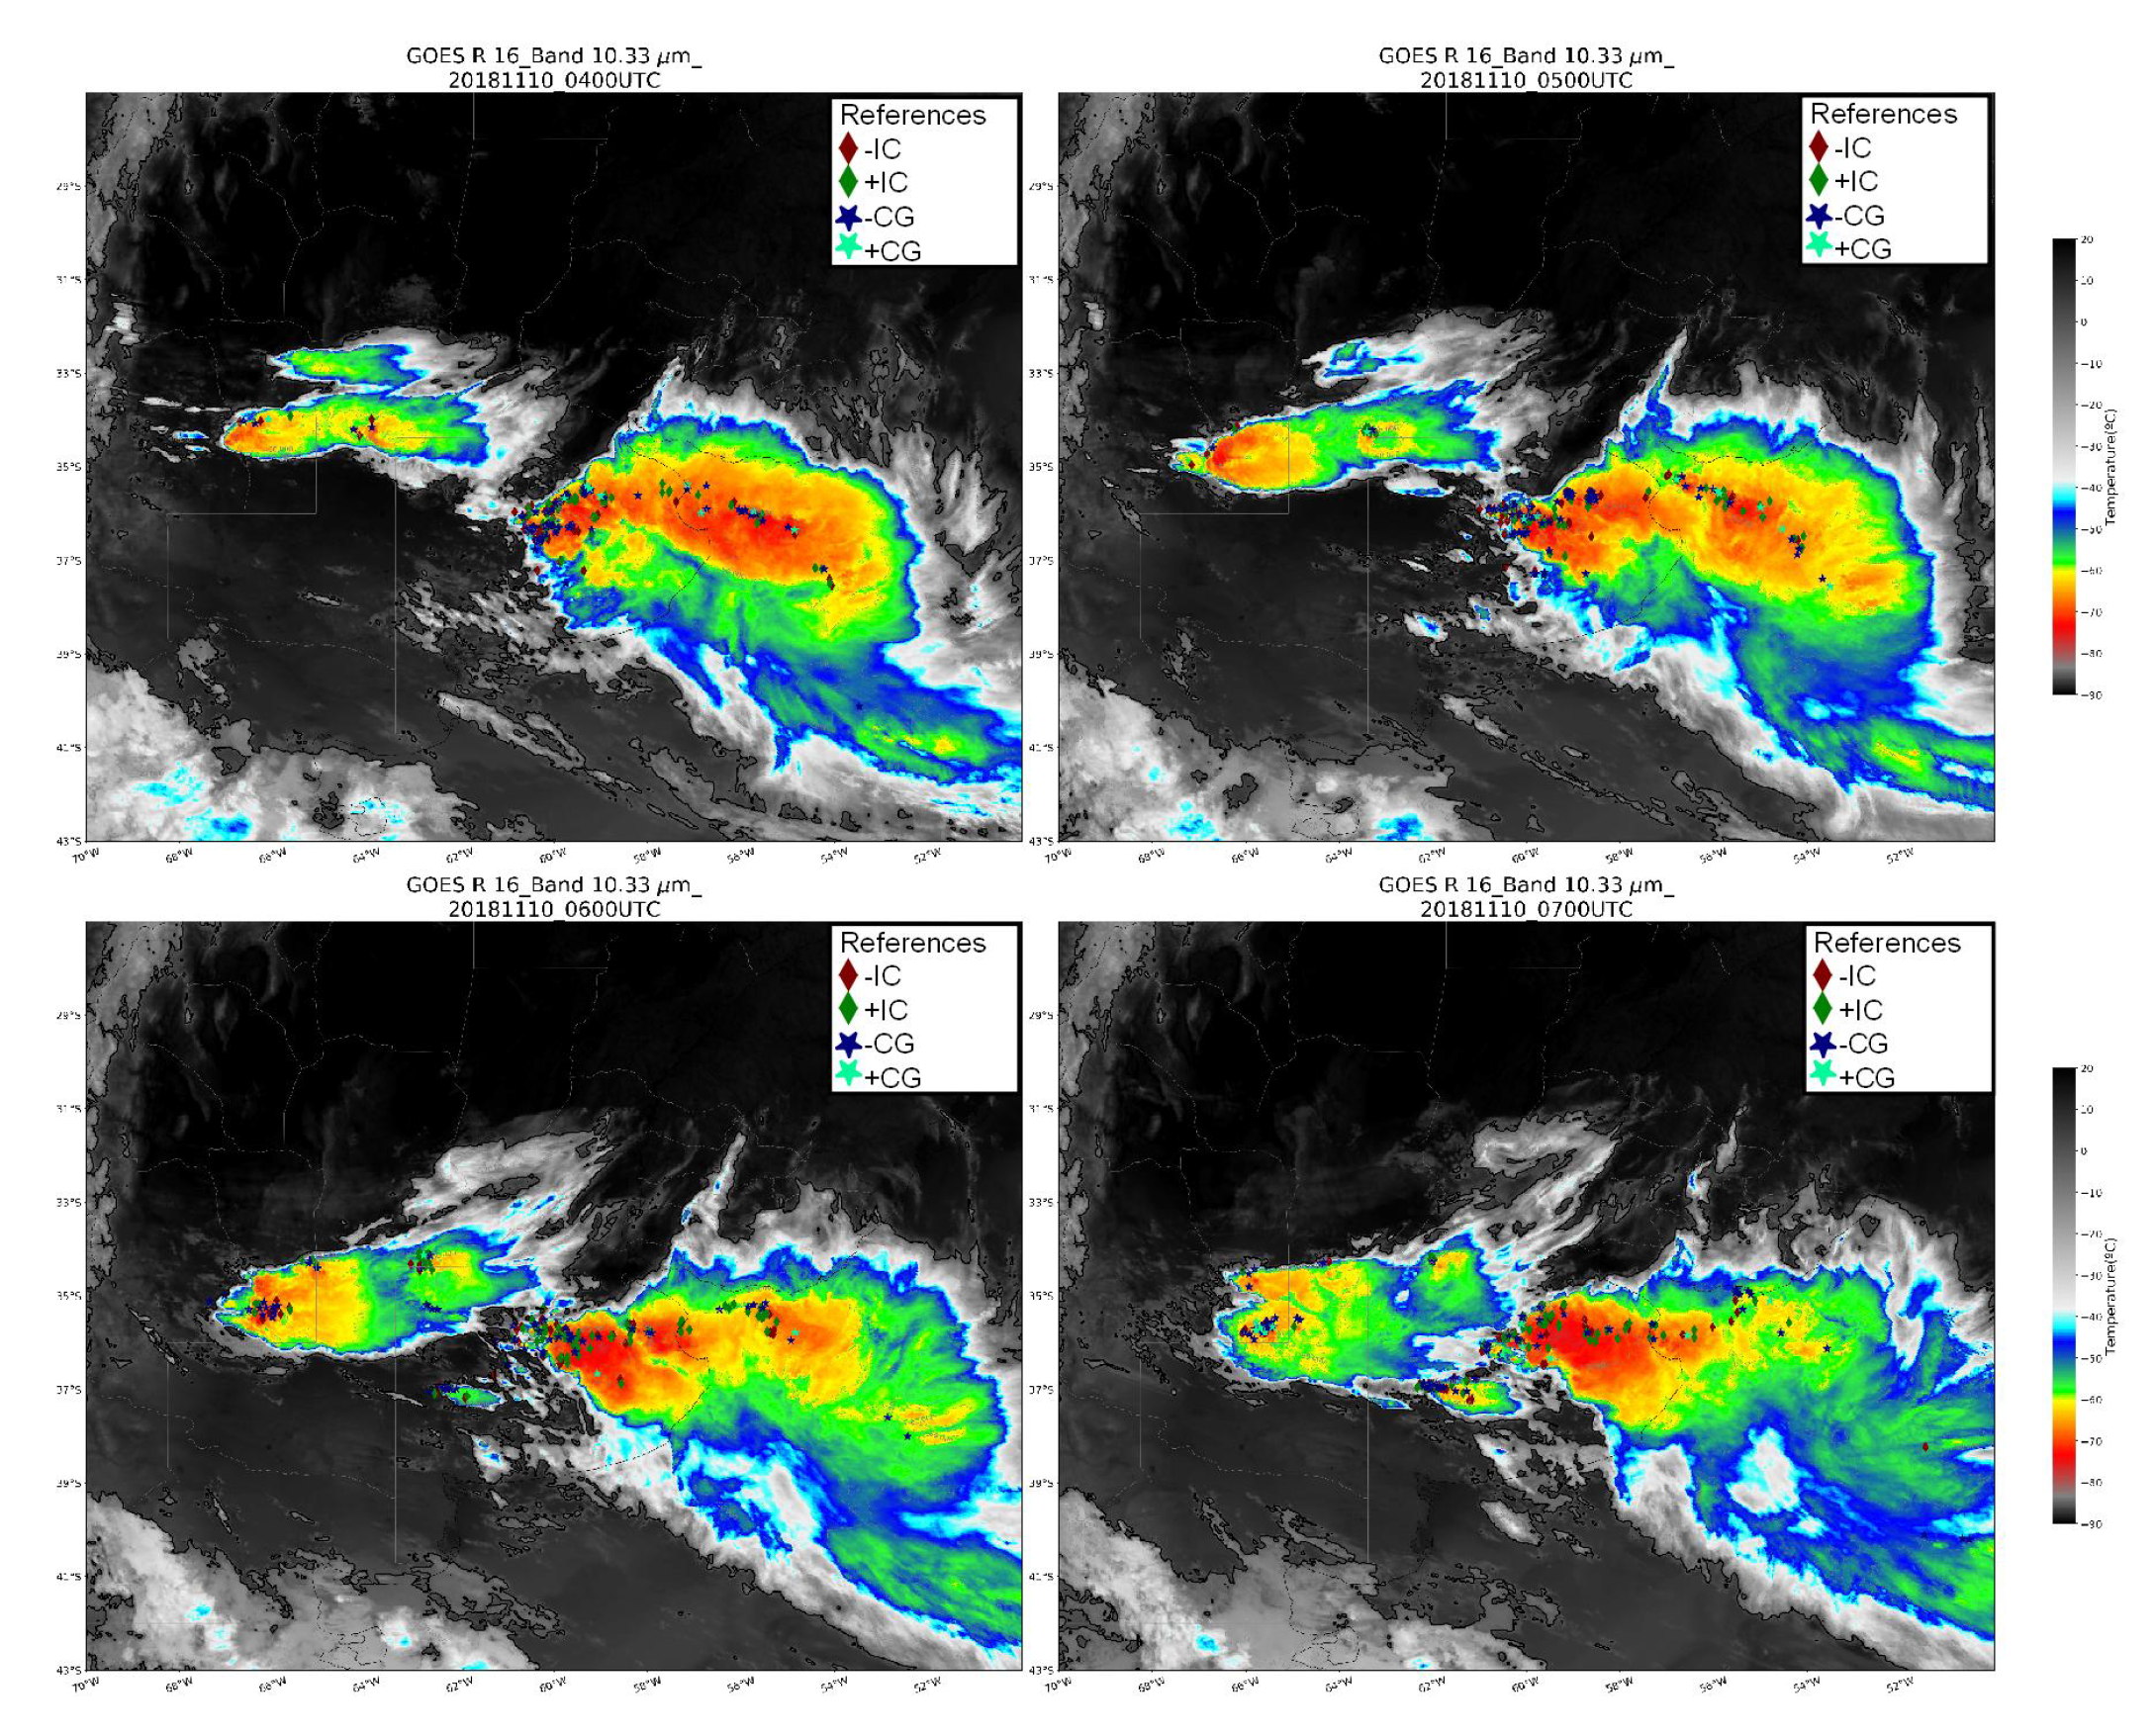
During the period between 00:00 UTC and 08:00 UTC on November 10, 2018, there were two southeastward-moving storms in Argentina. While of the storms situated in the central region of the country, was in the developing stage, the other storm, located in the southeast region of the country, was already in the mature stage. The difference in their life stages led to the observation of a greater number of discharges in the southeastern storm compared to the central storm, where lightning was found mainly at temperatures below -70°C, in the deep convective zones.
Based on the work of [
3,
5], gravity waves in TEC records from storms in the mid and low-latitude region, our analysis was divided into three periods to highlight the variability of the waves produced by the discharges. From this analysis, we found that:
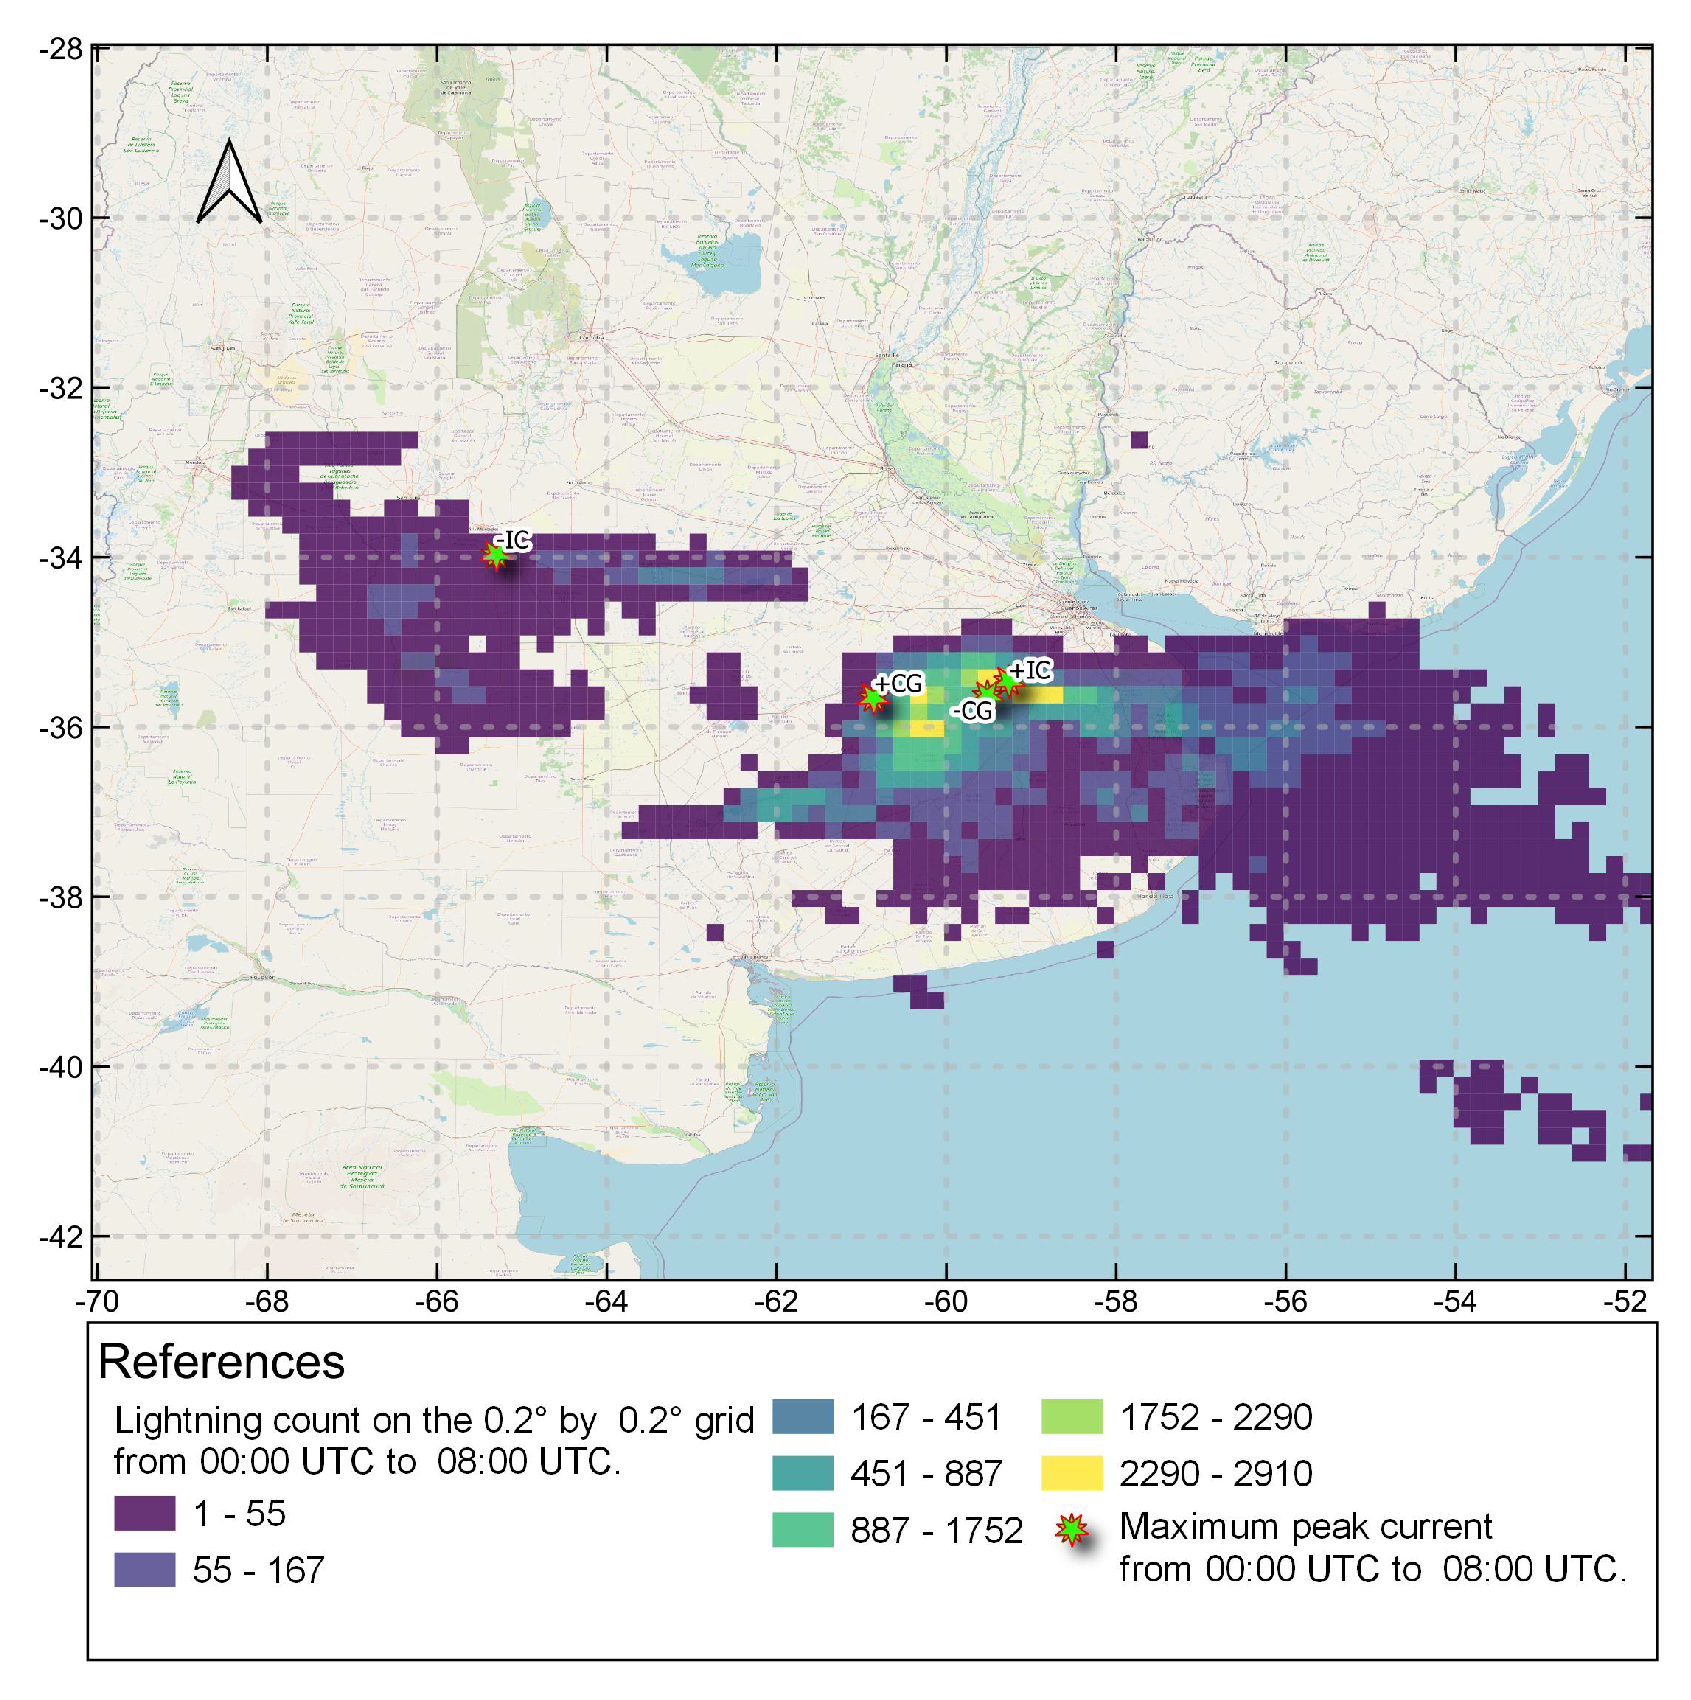
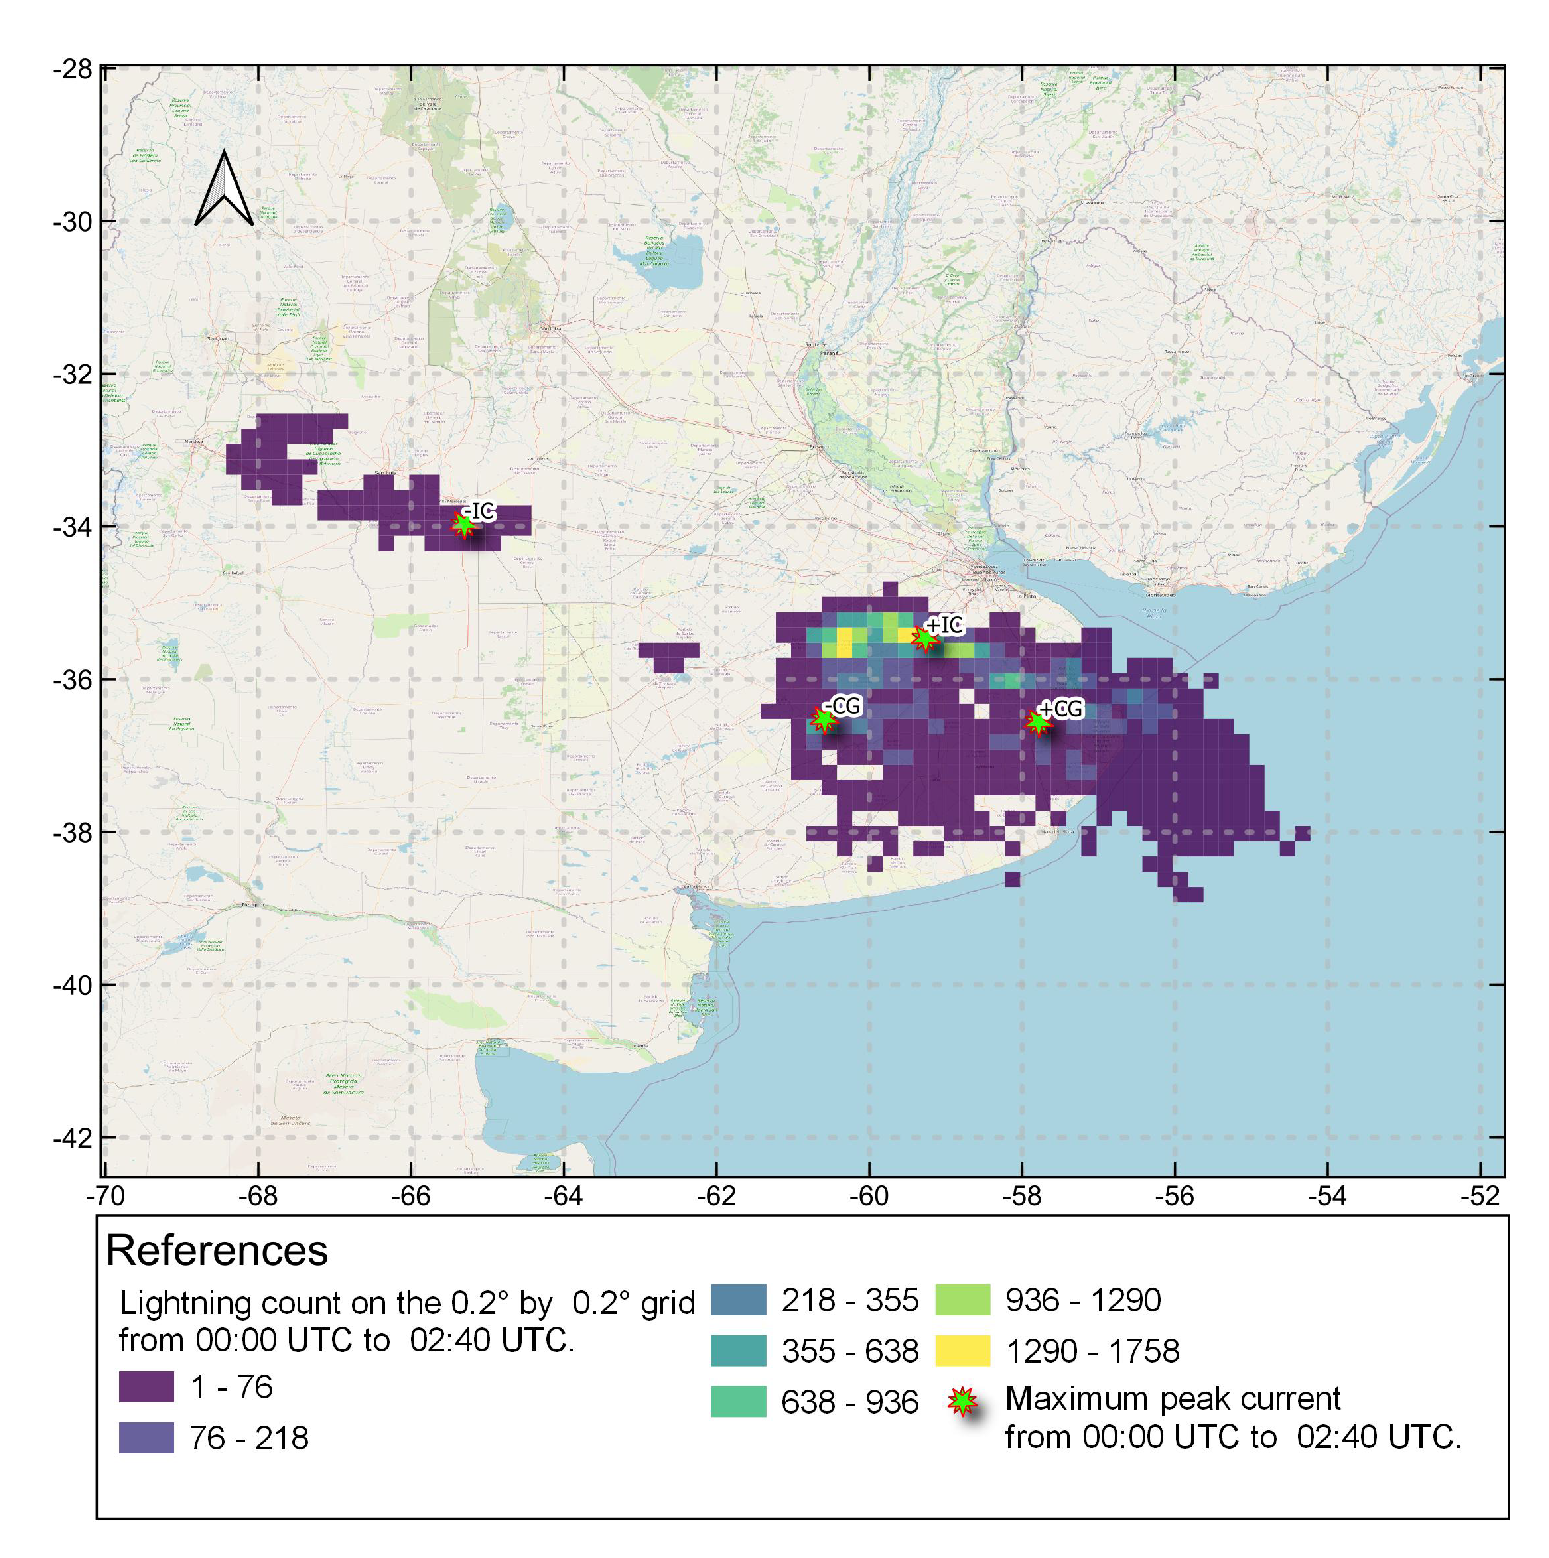
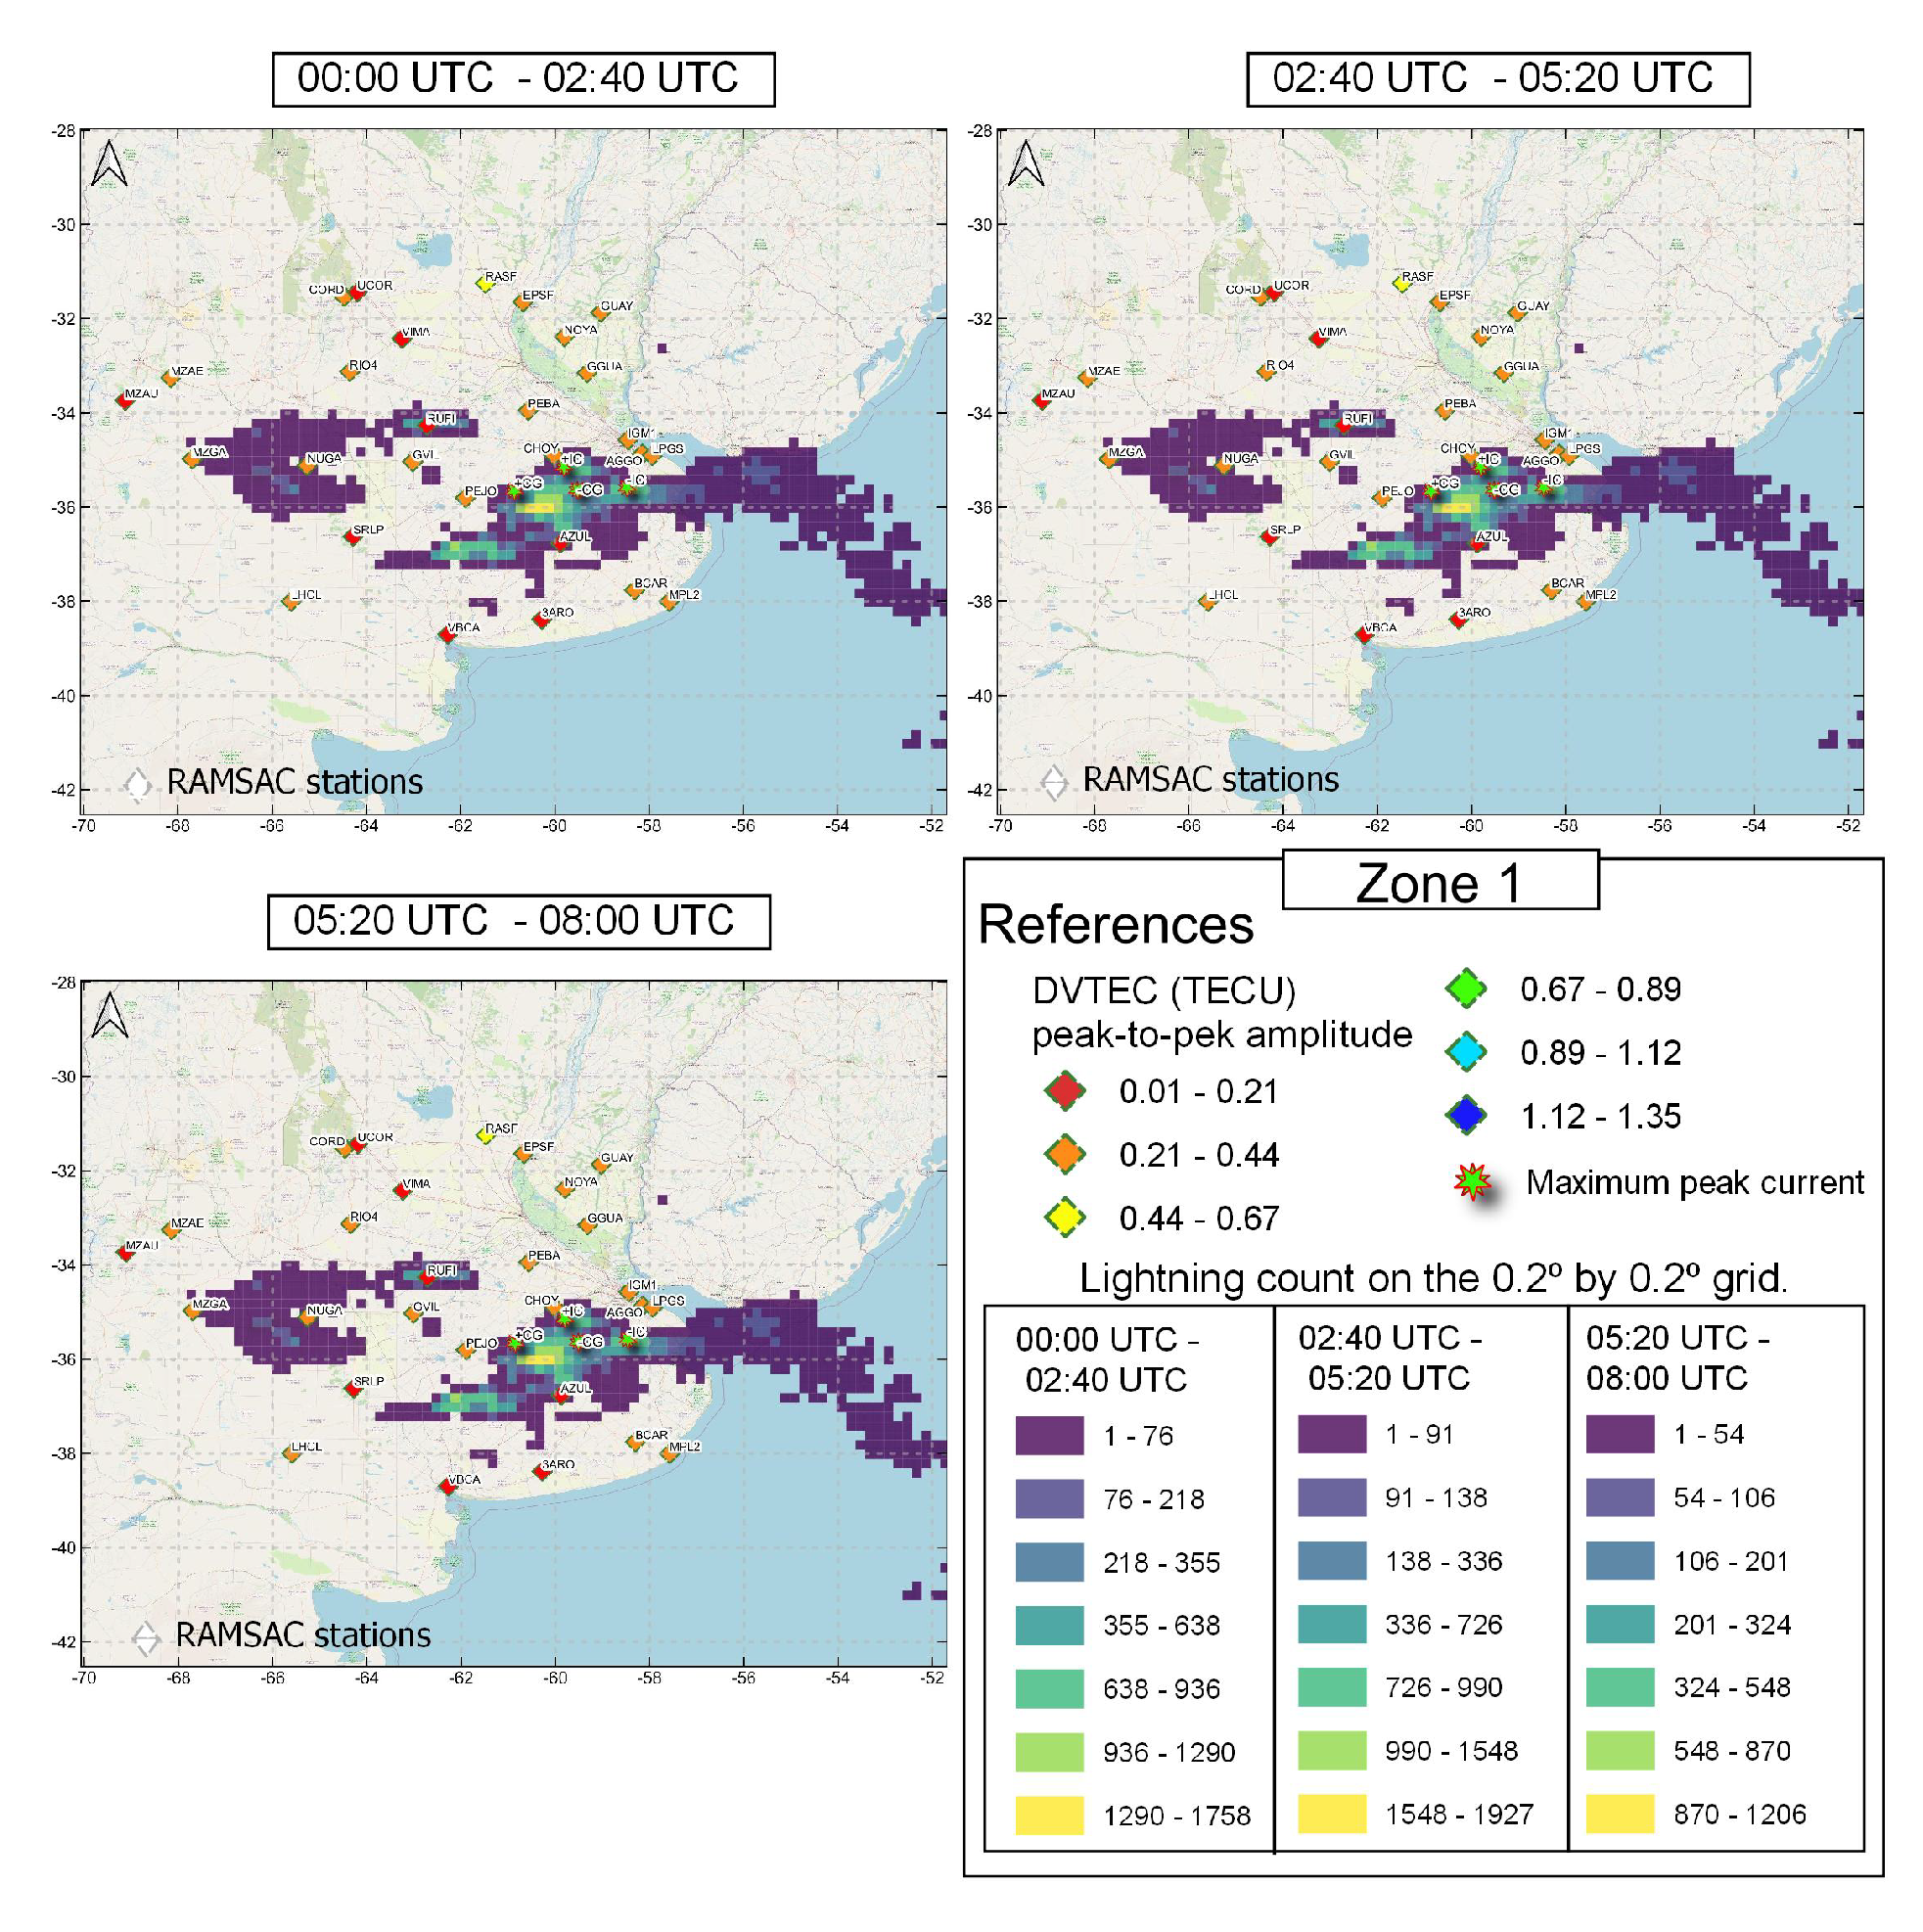
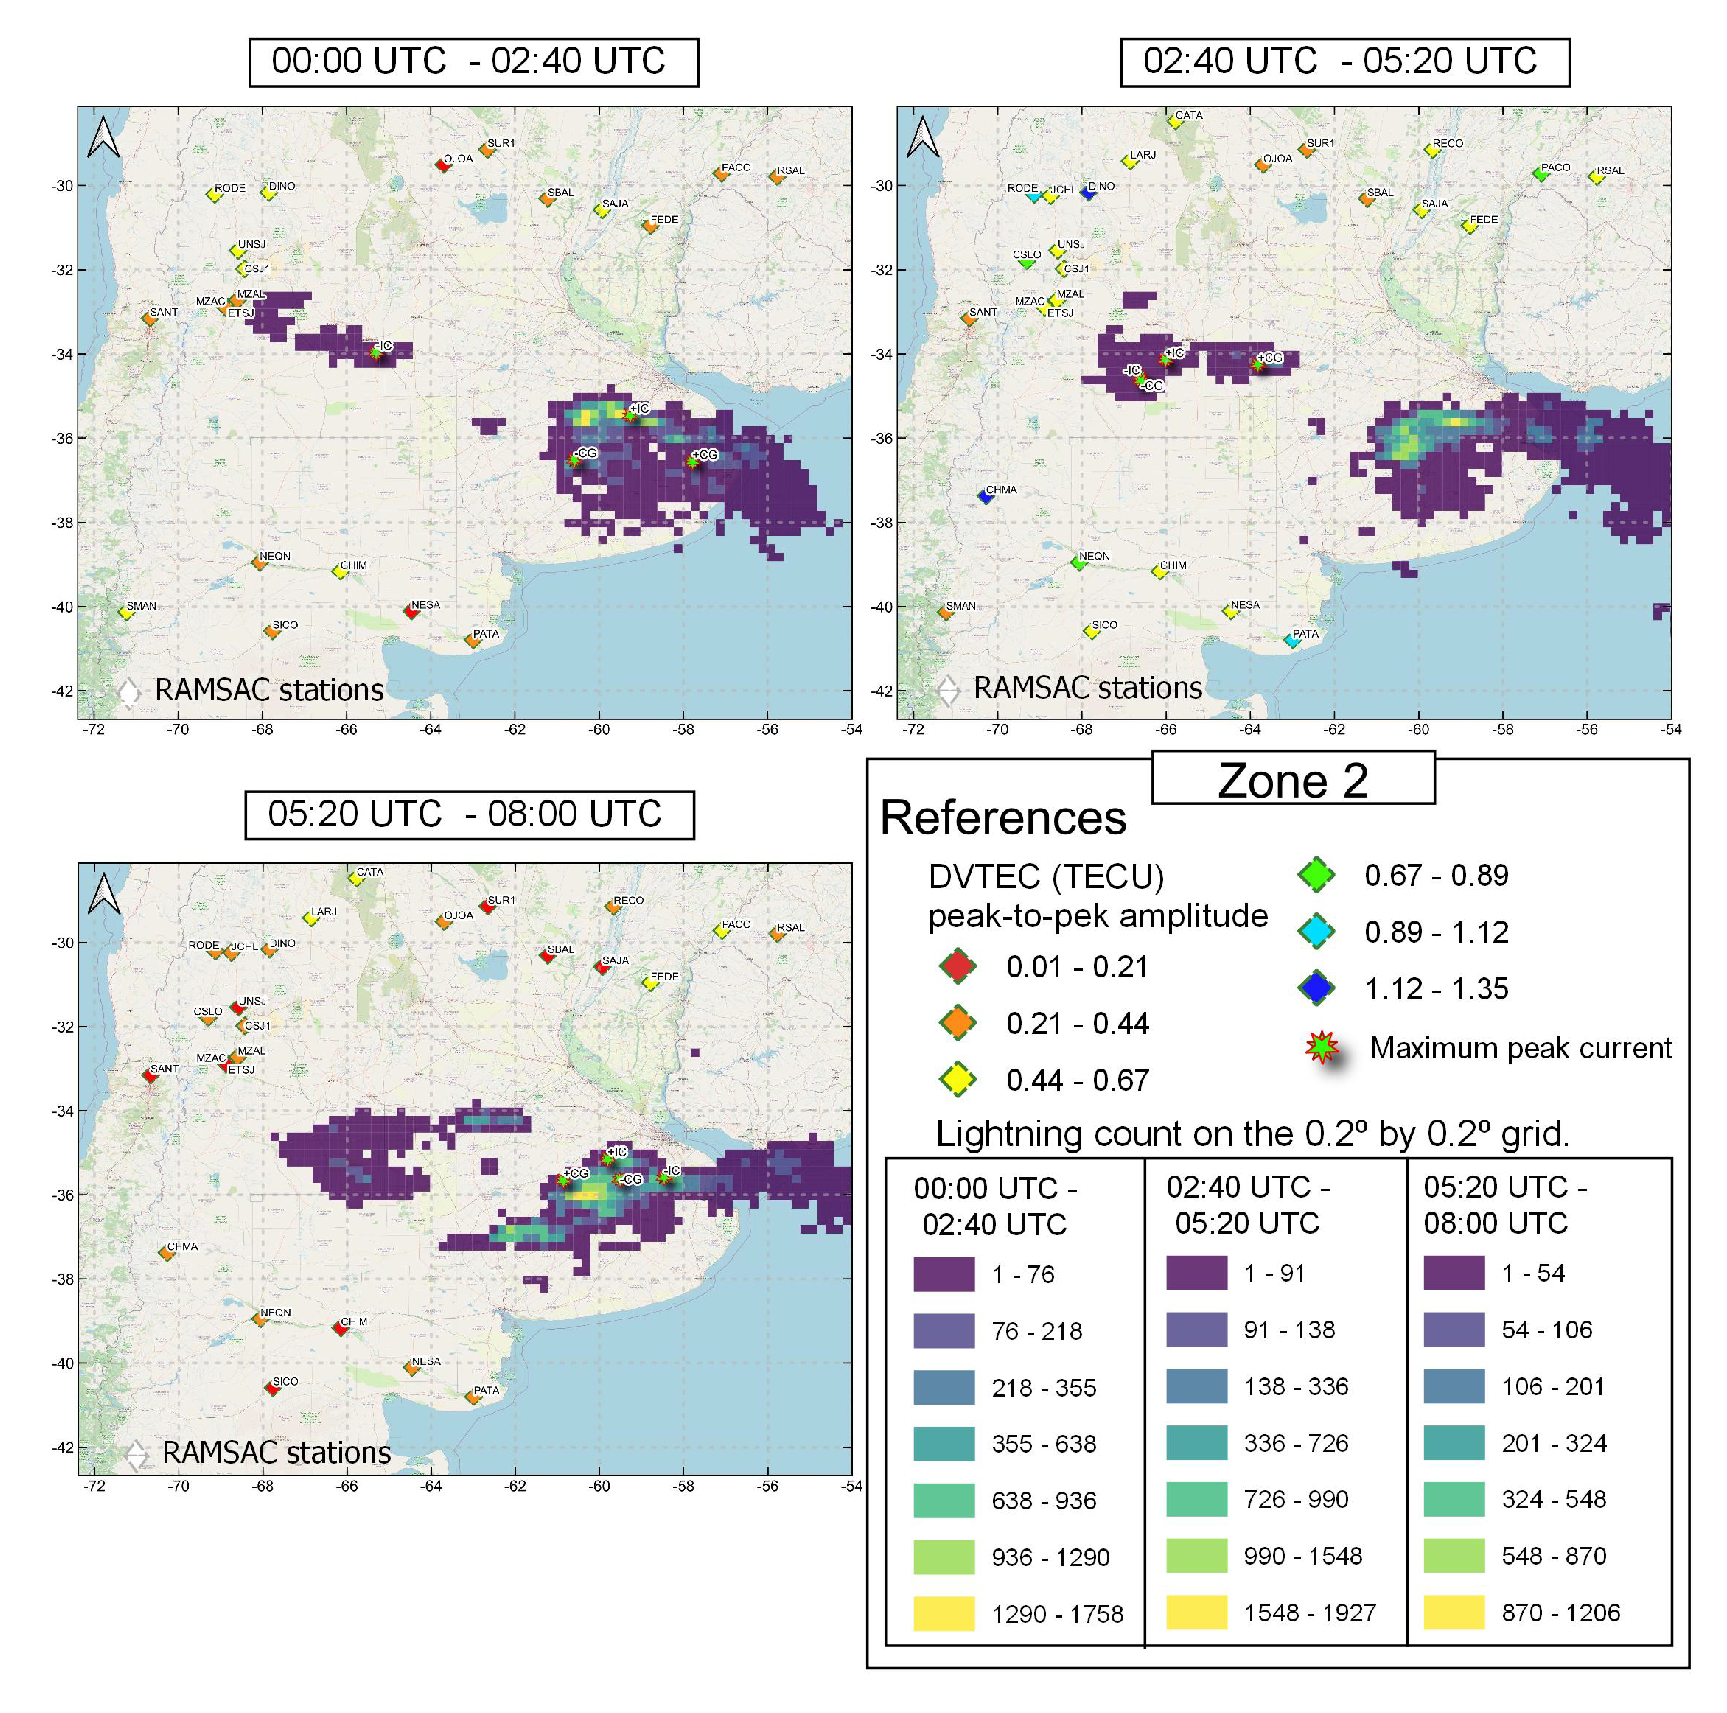
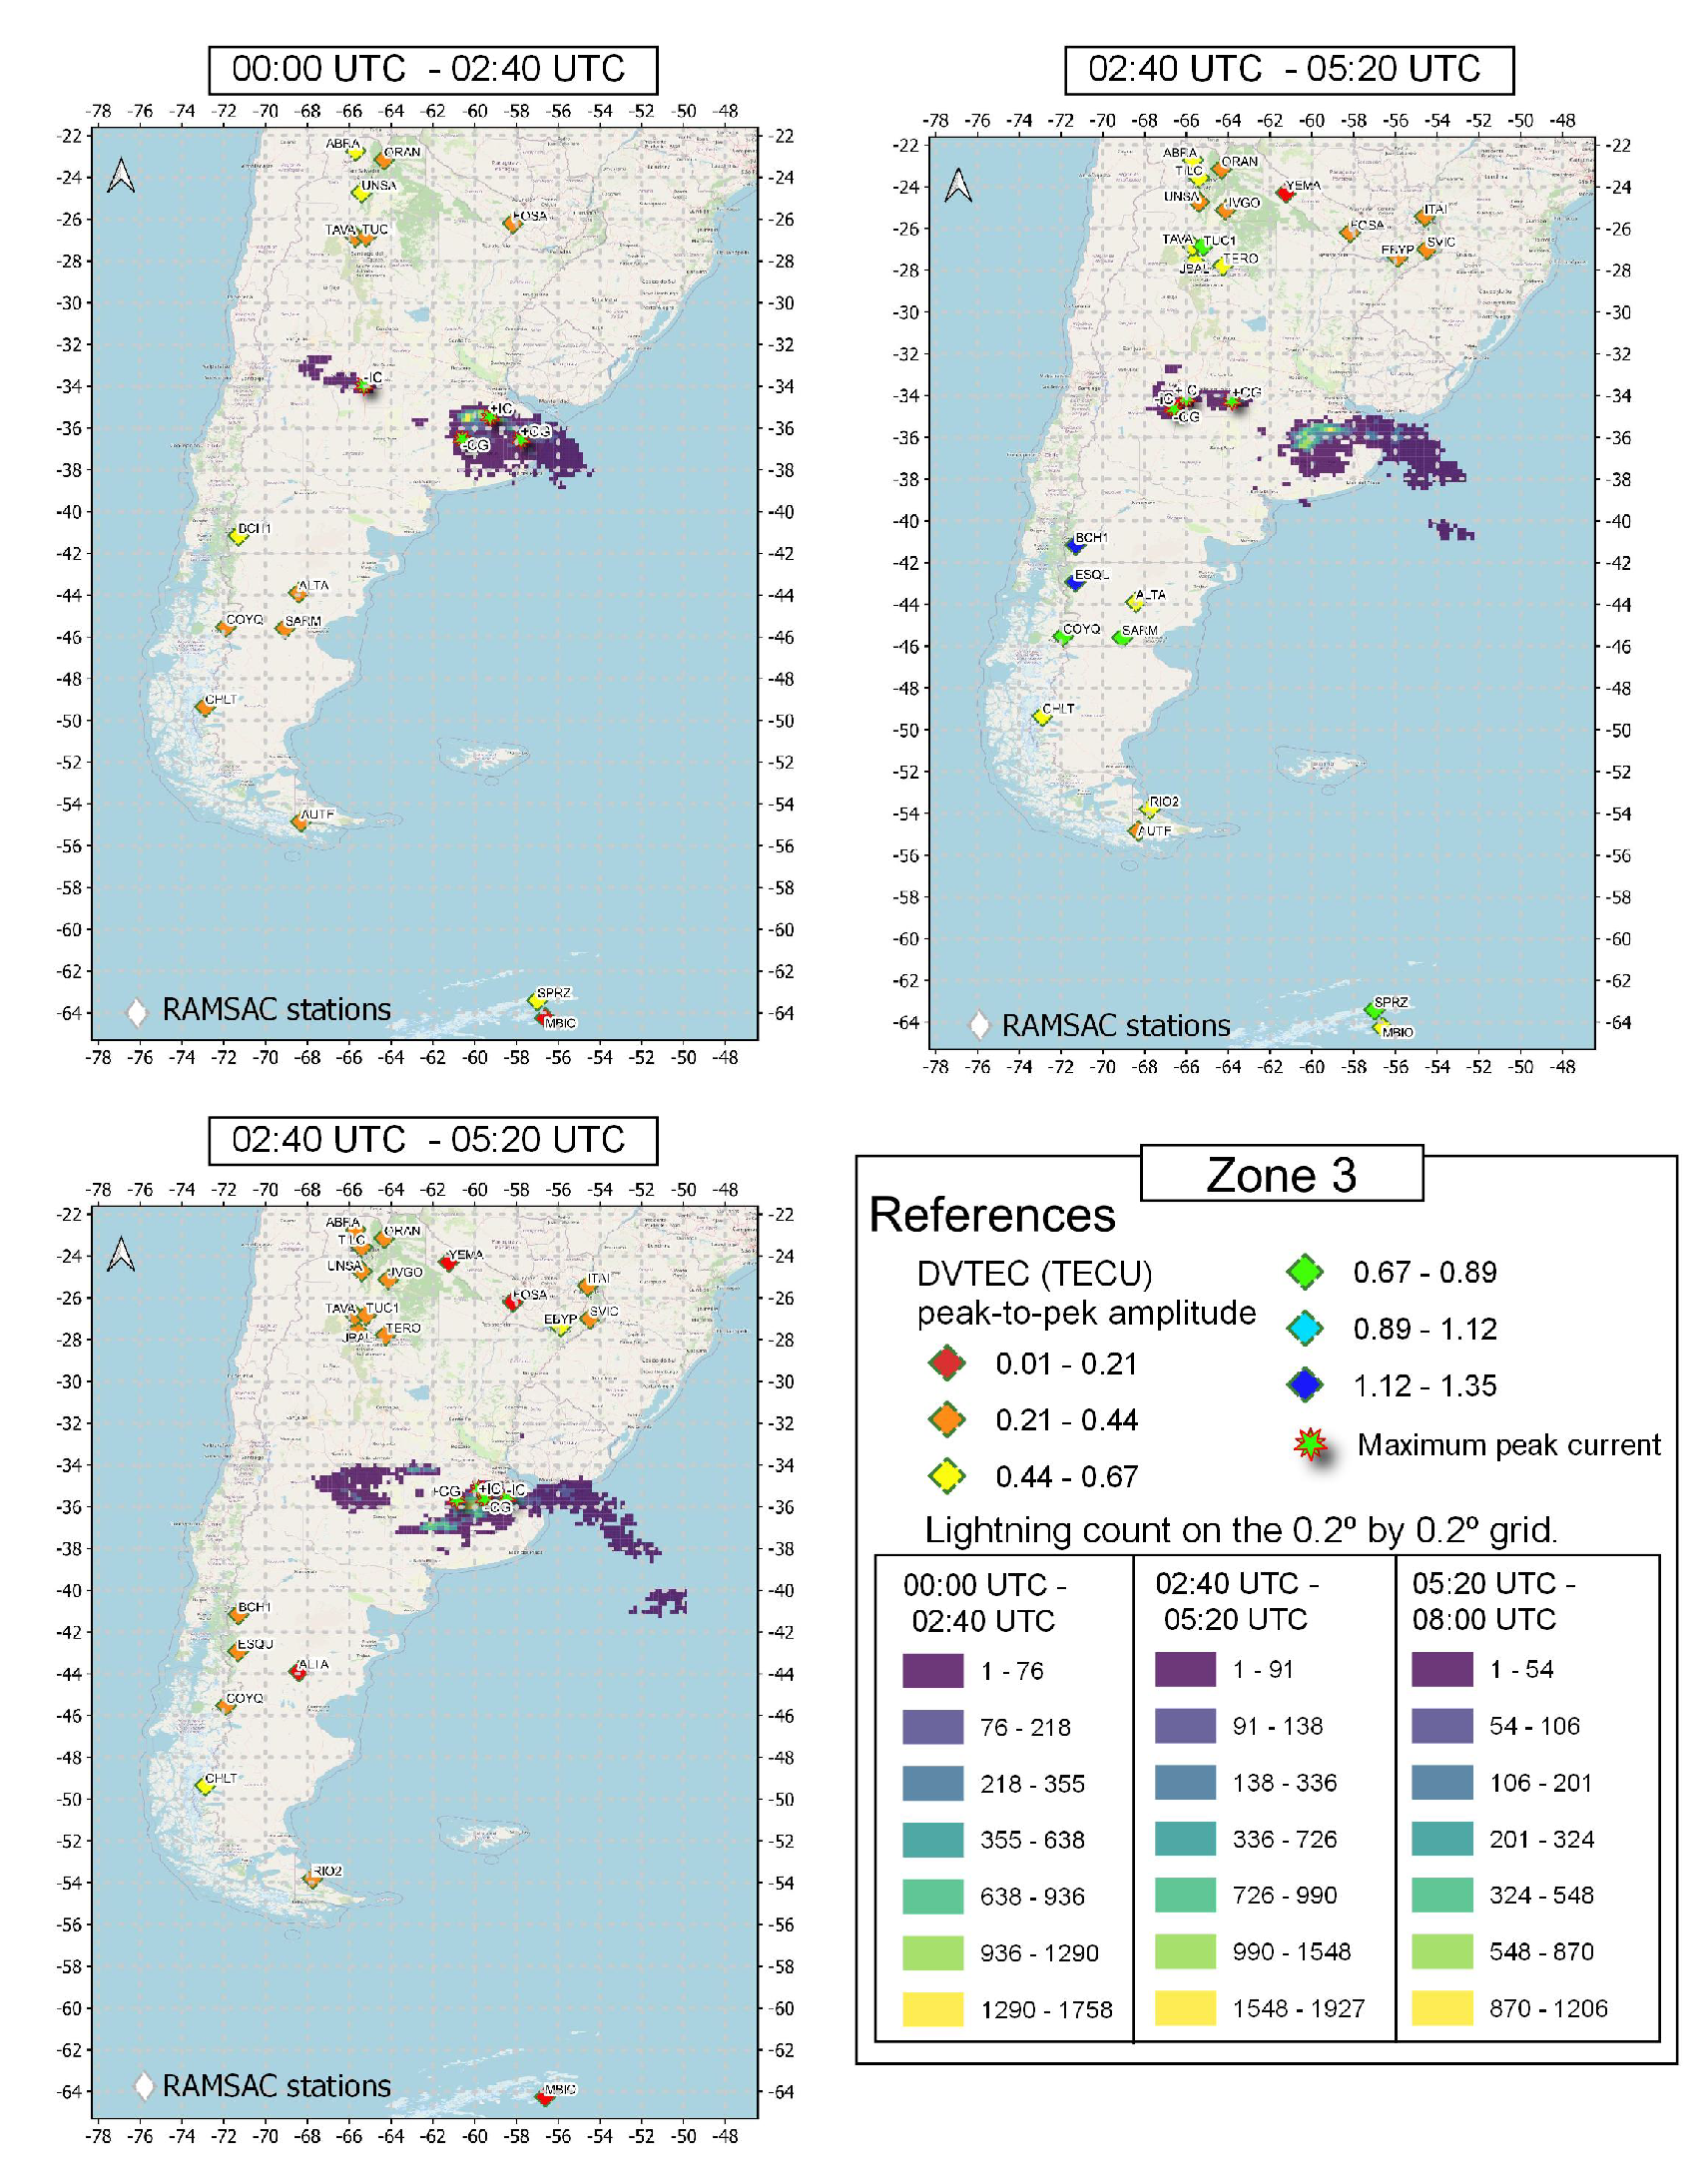
In the period between 00:00 UTC and 02:40 UTC (21:00 LT - 23:40 LT), the RAMSAC stations showed DVTEC oscillations with peak-to-peak amplitude values of up to 0.67 TECU. Earth Networks lightning detection system reported peak current maxima of -219 kA for -CG and 181 kA for +CG. These maxima were located over the southeast of the storm, near the regions with the highest lightning count. Near these regions, the AGGO, AZUL, CHOY, LPGS, and PEBA stations showed peak-to-peak DVTEC amplitudes of up to 0.44 TECU. During this period, the storms were in their growth stage.
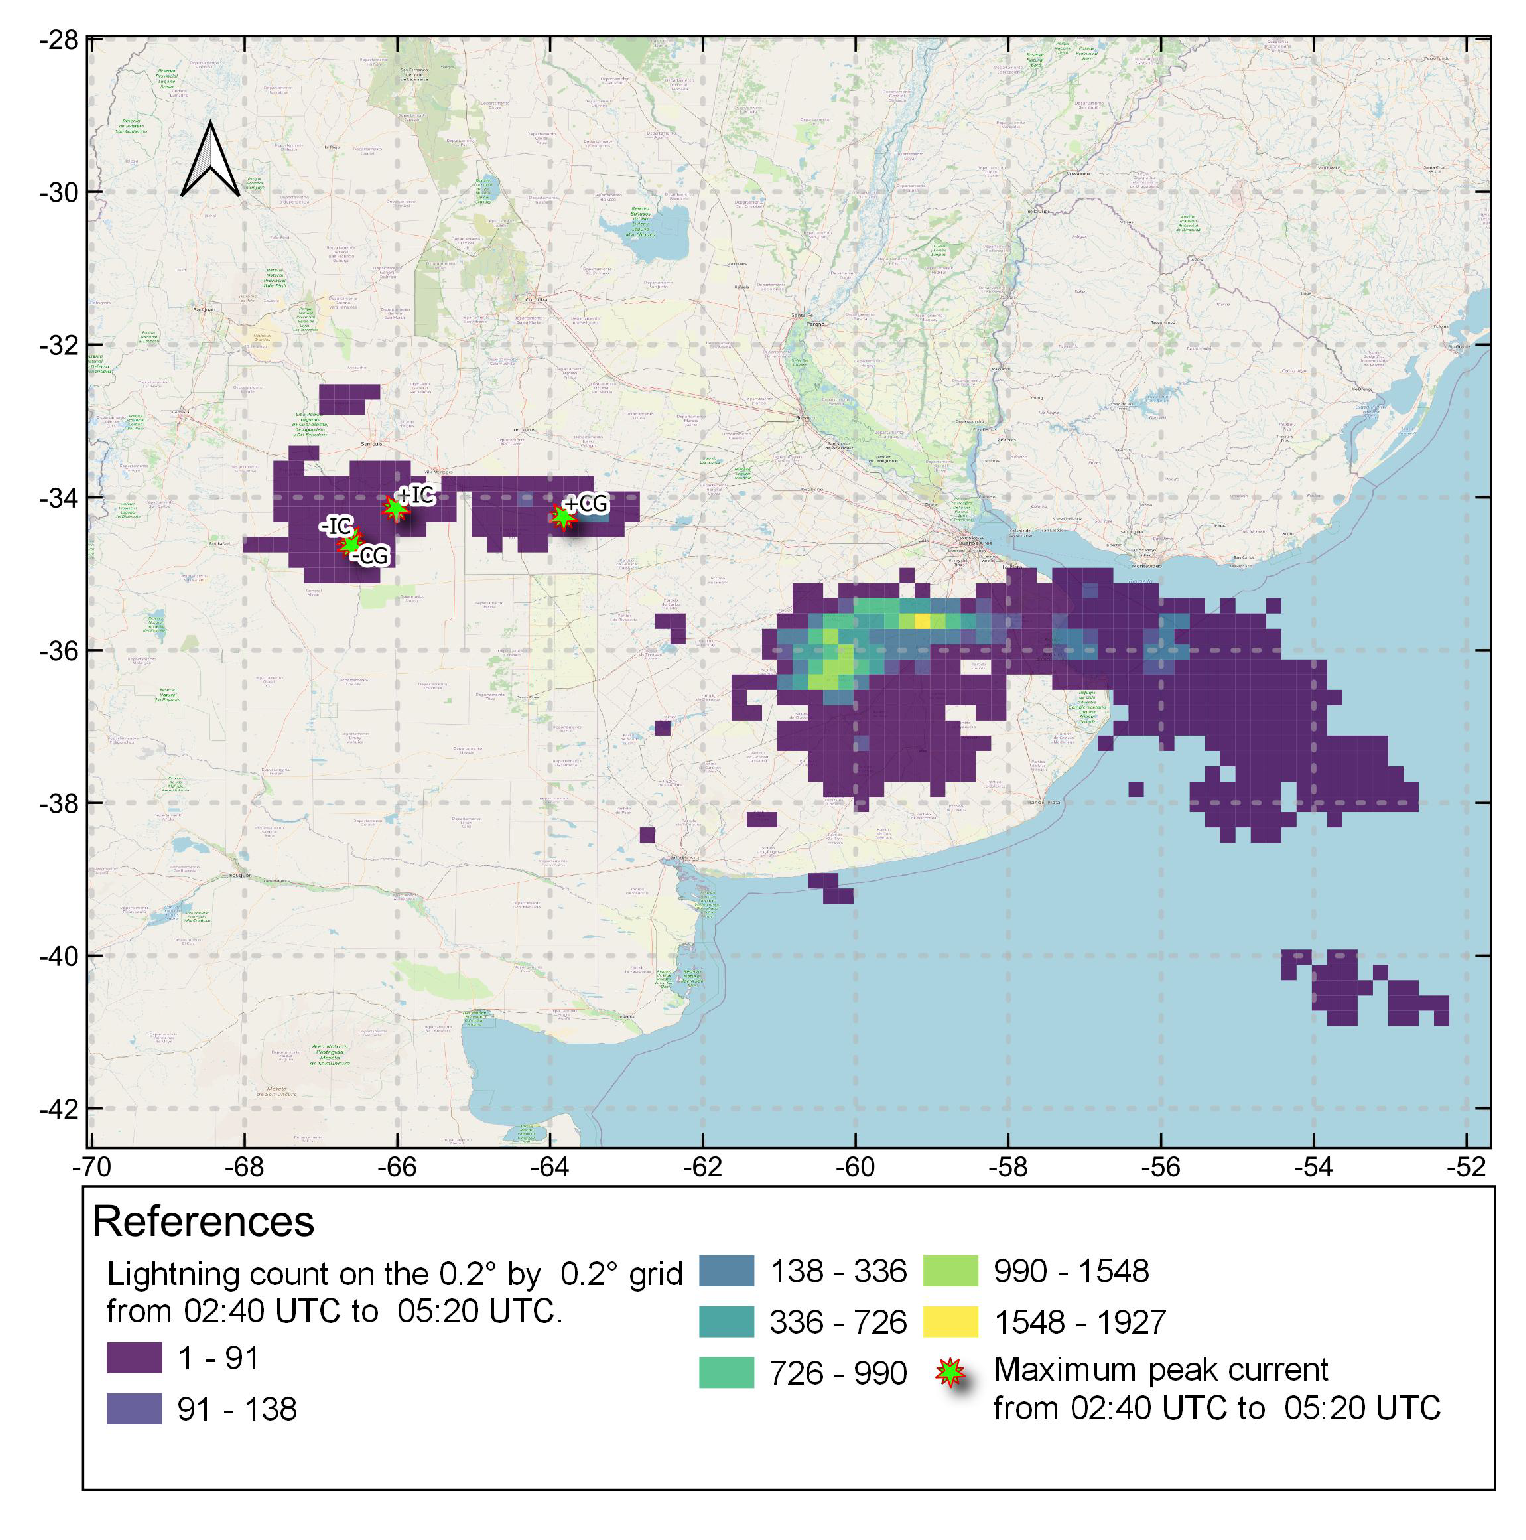
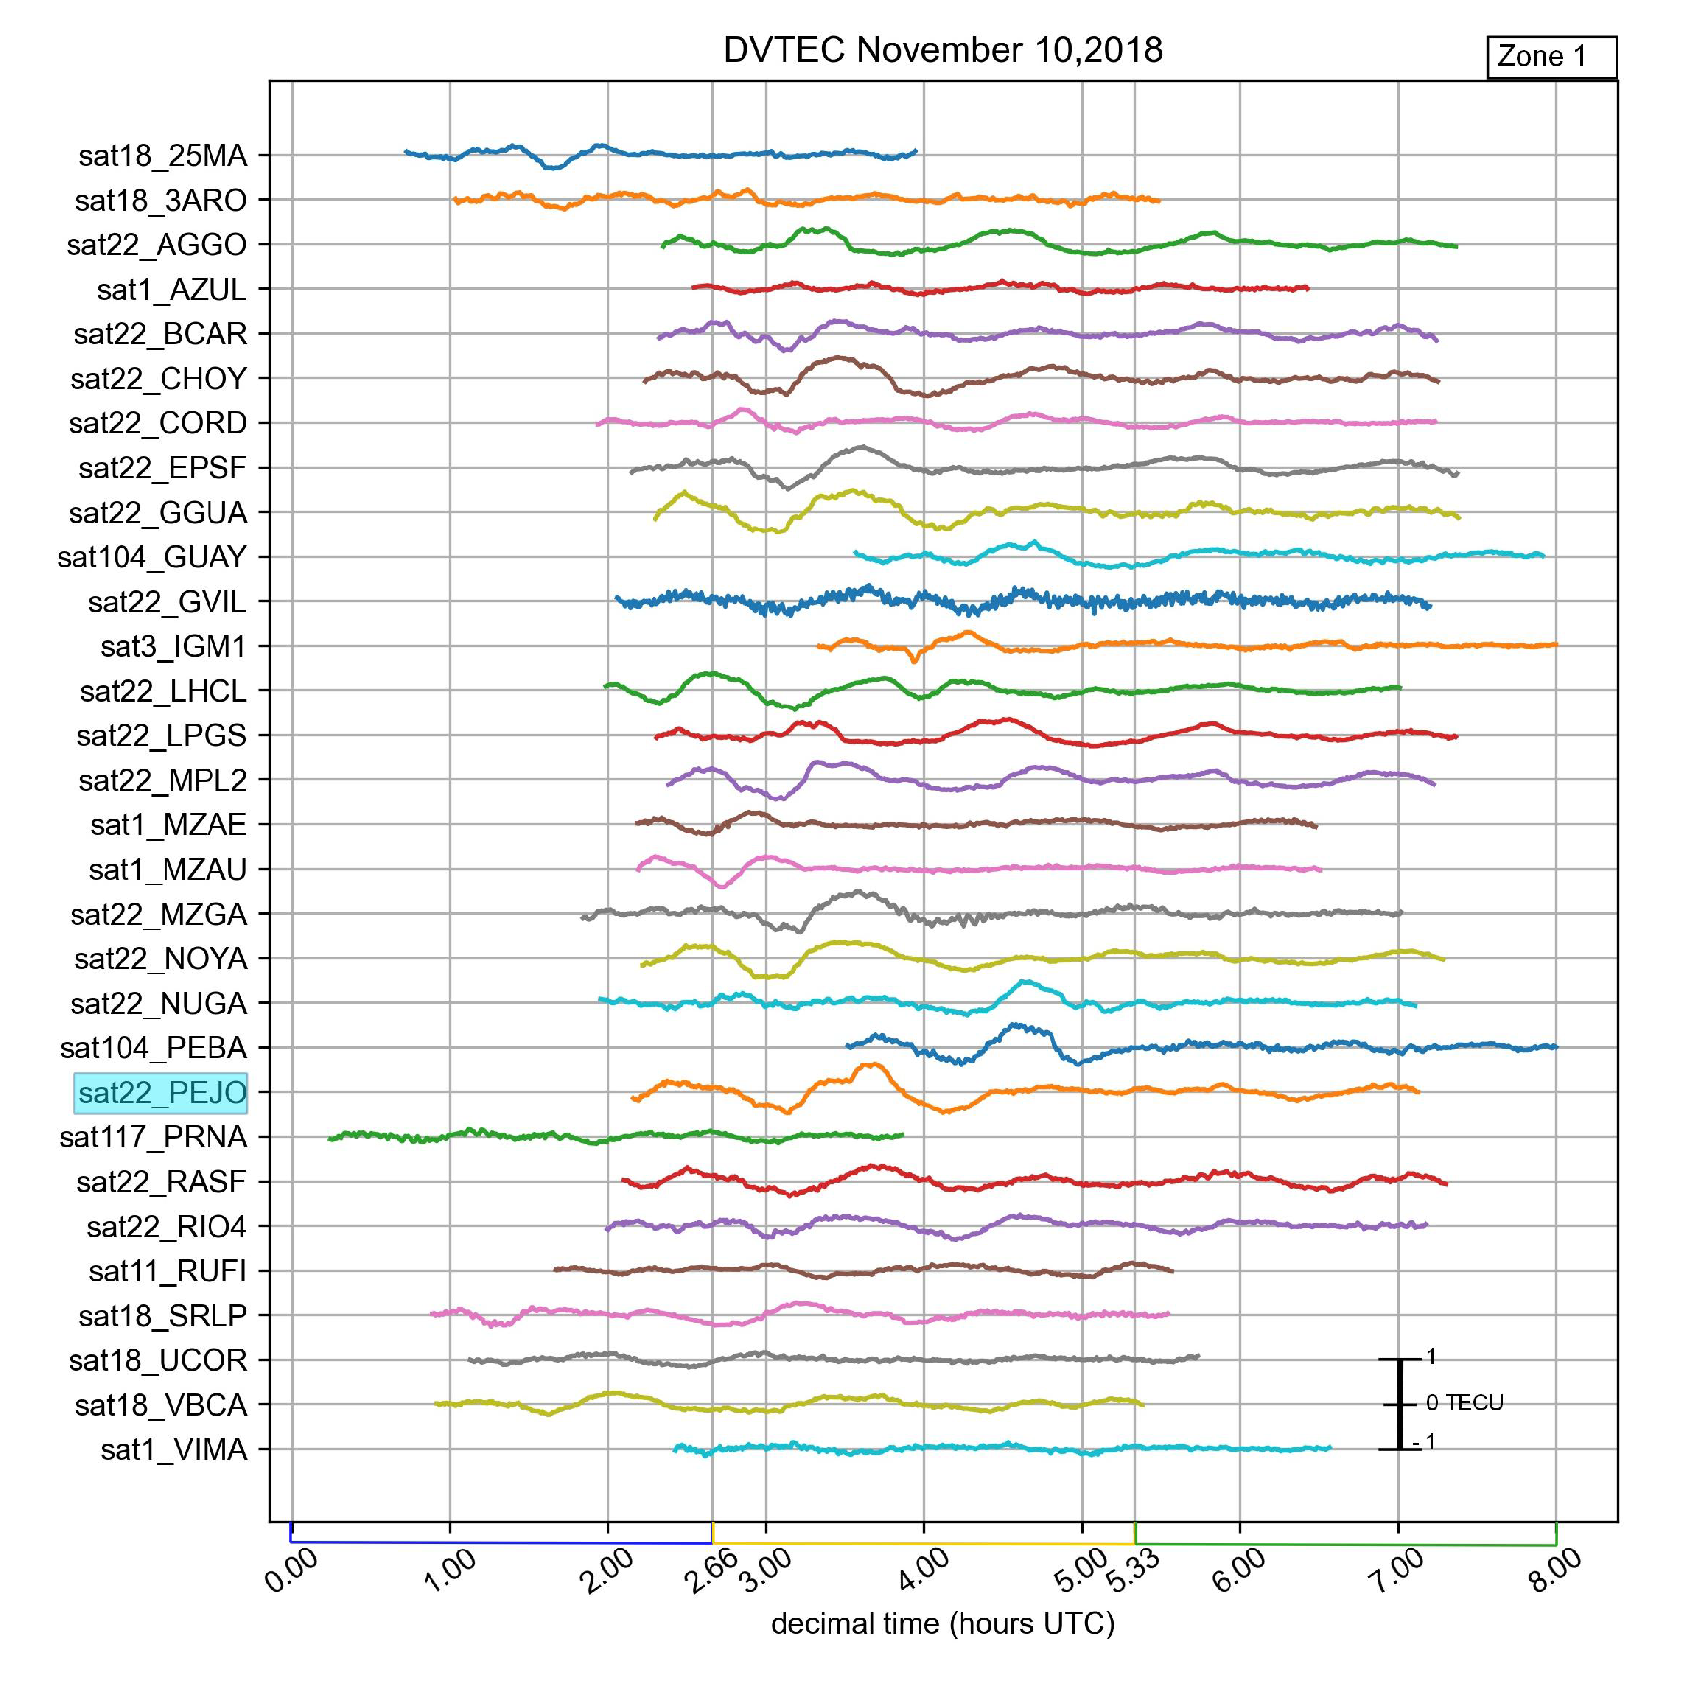
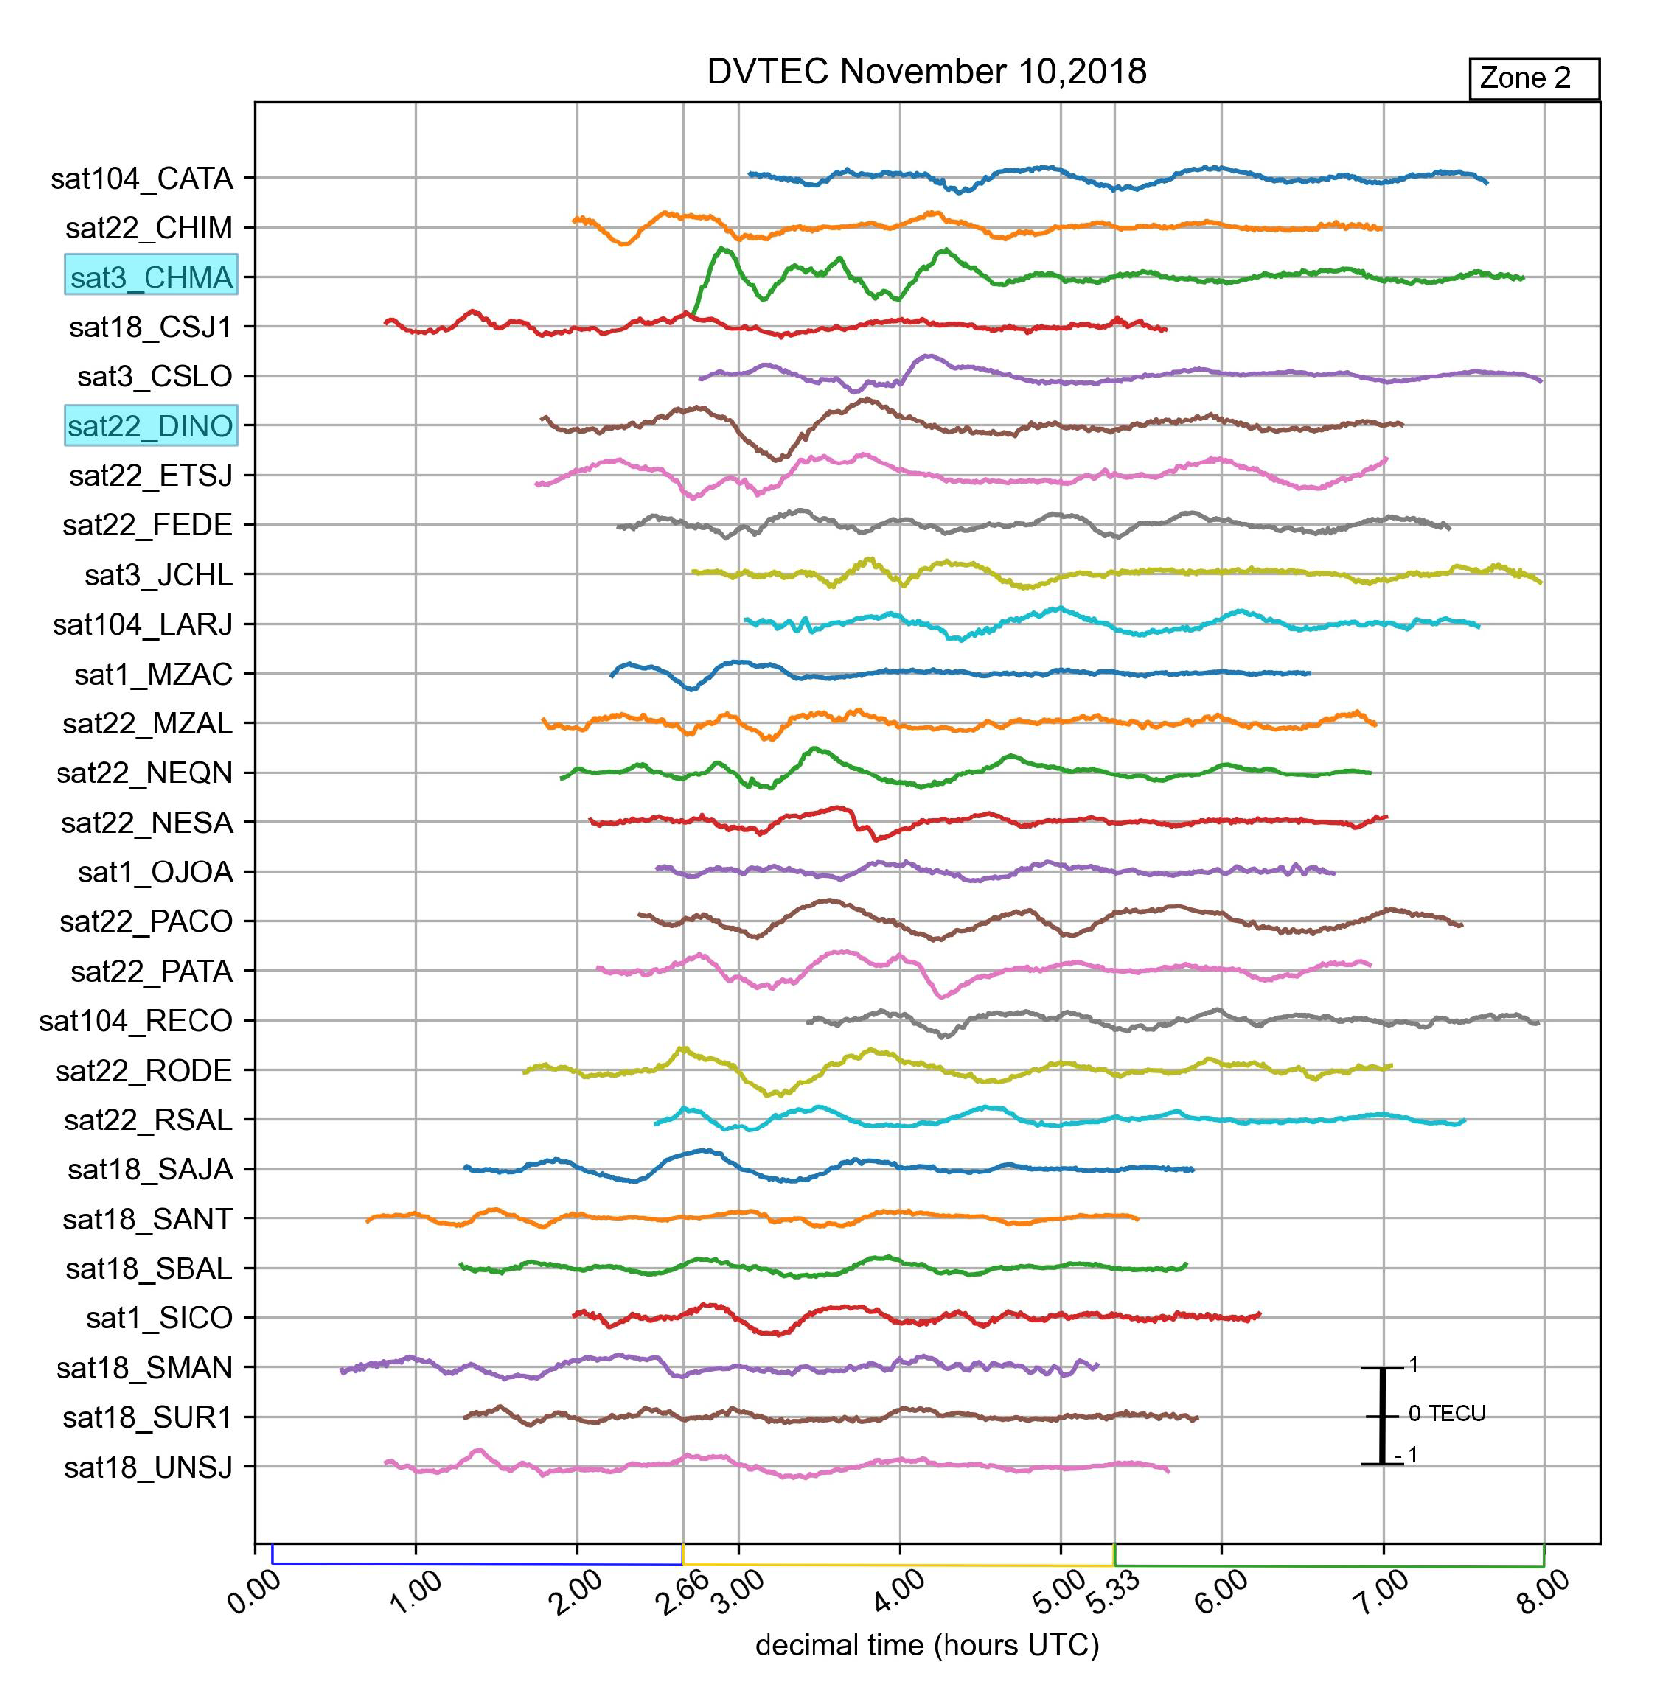
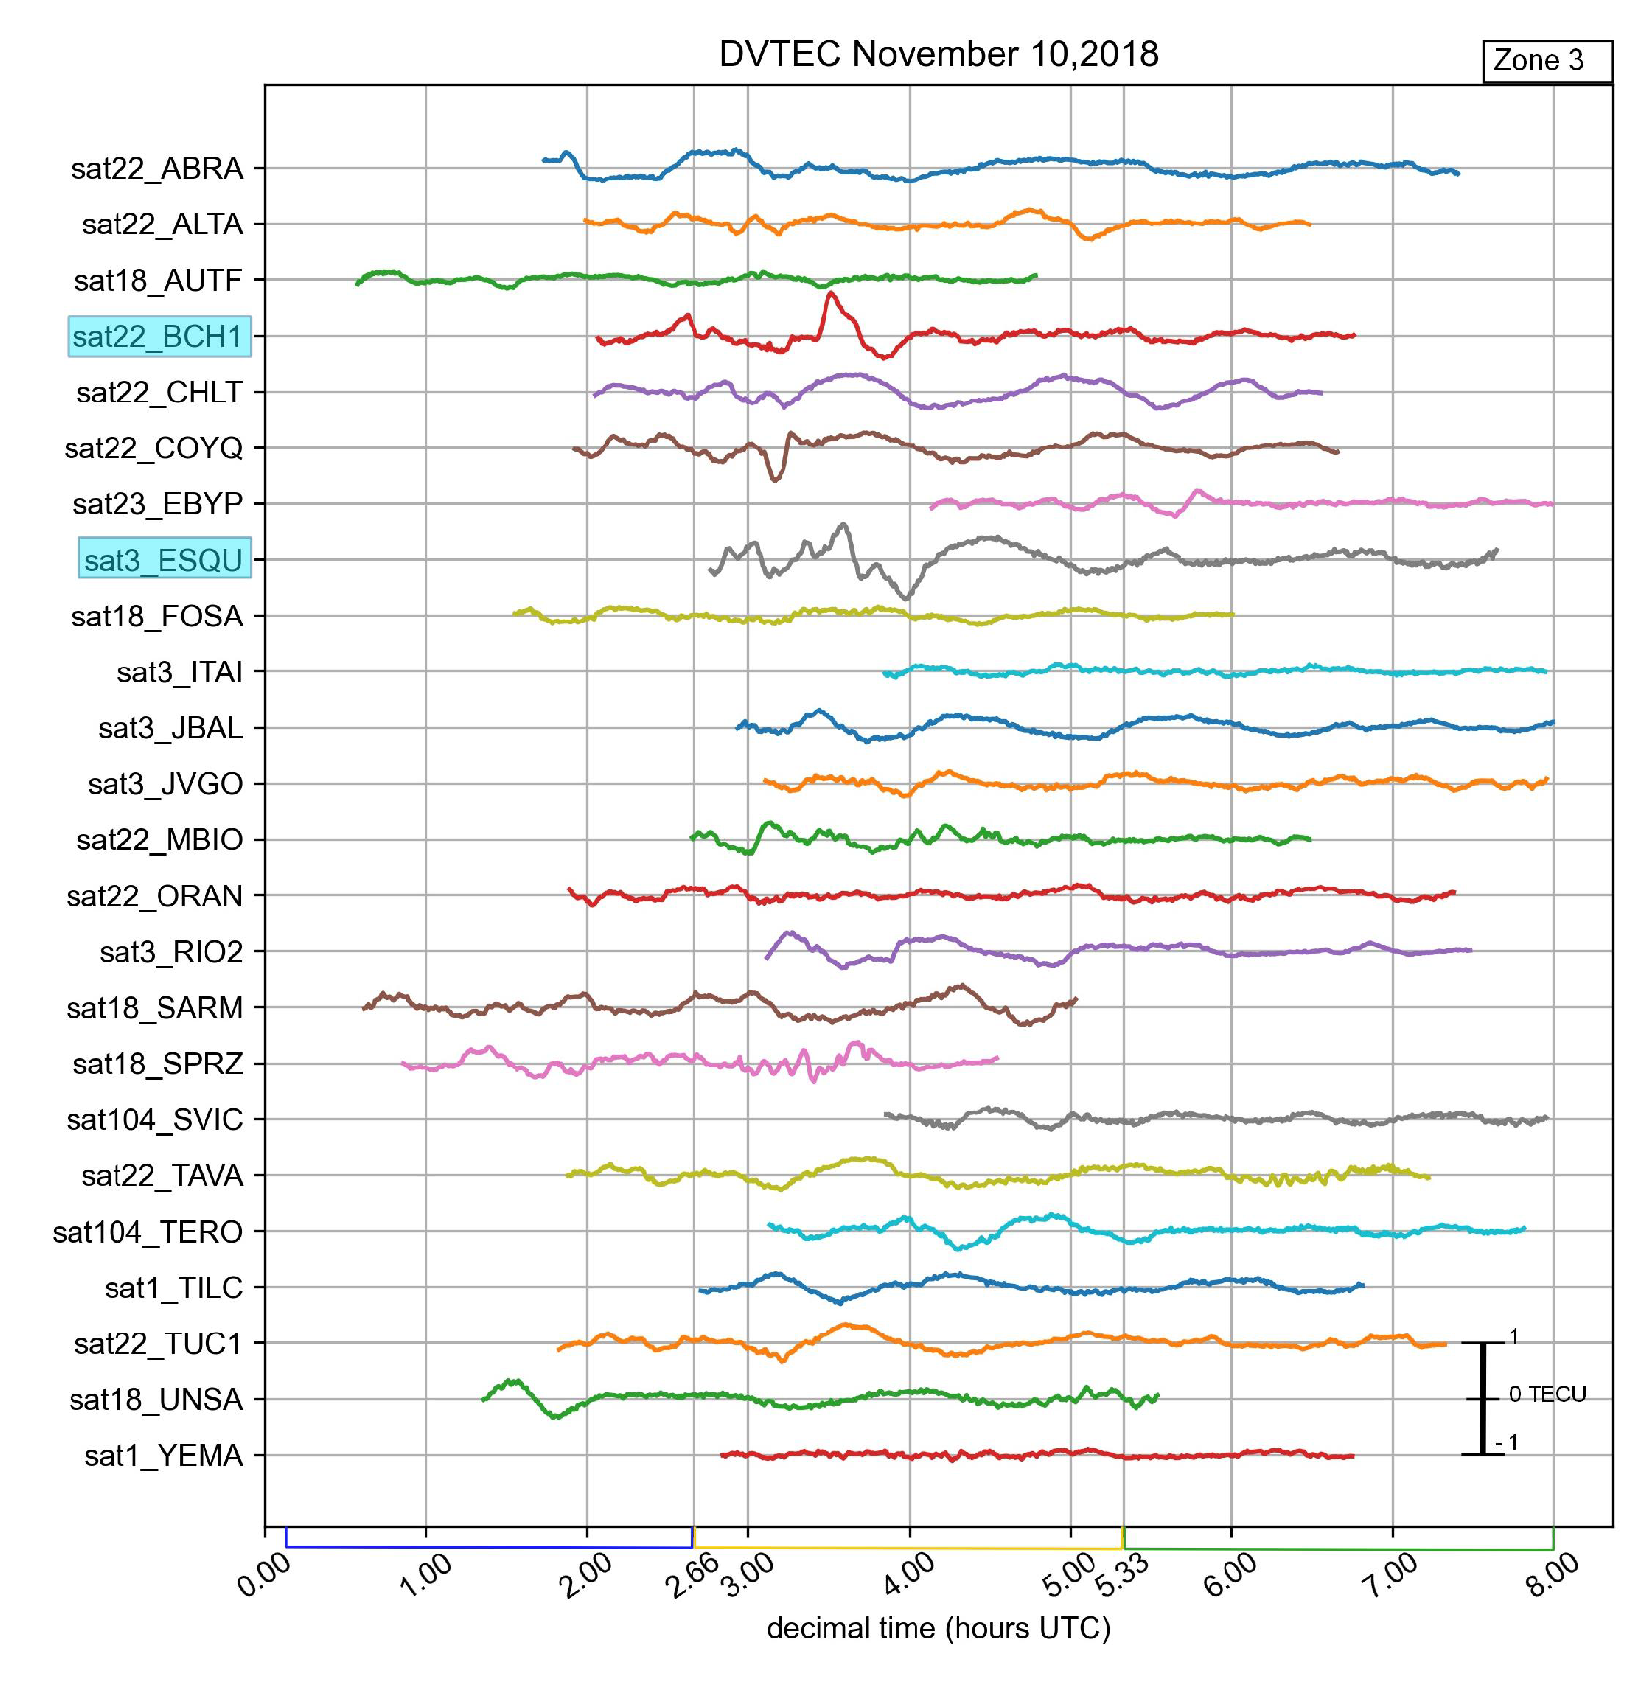
Between 02:40 UTC and 05:20 UTC (23:40 LT - 02:20 LT), RAMSAC stations showed oscillations in the DVTEC with peak-to-peak amplitude values of up to 1.35 TECU. The maximum peak currents were -214 kA for -CG and 211 kA for +CG, located above the storm located in the central region. Near the regions of maximum lightning count and maximum peak current, the AGGO, AZUL, CHOY, GVIL, MZAE, MZAU, MZGA, NUGA, RIO4, RUFI, and PEJO stations showed peak-to-peak DVTEC amplitudes of up to 1.12 TECU. During this period, the storms were in their development phase. In addition, during this time, the highest number of lightning flashes occurred and the highest peak-to-peak amplitudes were observed in the three analyzed zones.
In the period between 05:20 and 08:00 UTC (02:20 LT - 05:00 LT), RAMSAC stations showed DVTEC oscillations with peak-to-peak amplitude values of up to 0.67 TECU. In the southern region of Zone 3 (see
Figure 17), the perturbations found cannot be directly attributed to the storms analyzed, since they are located in a region where a large number of gravitational waves were produced [
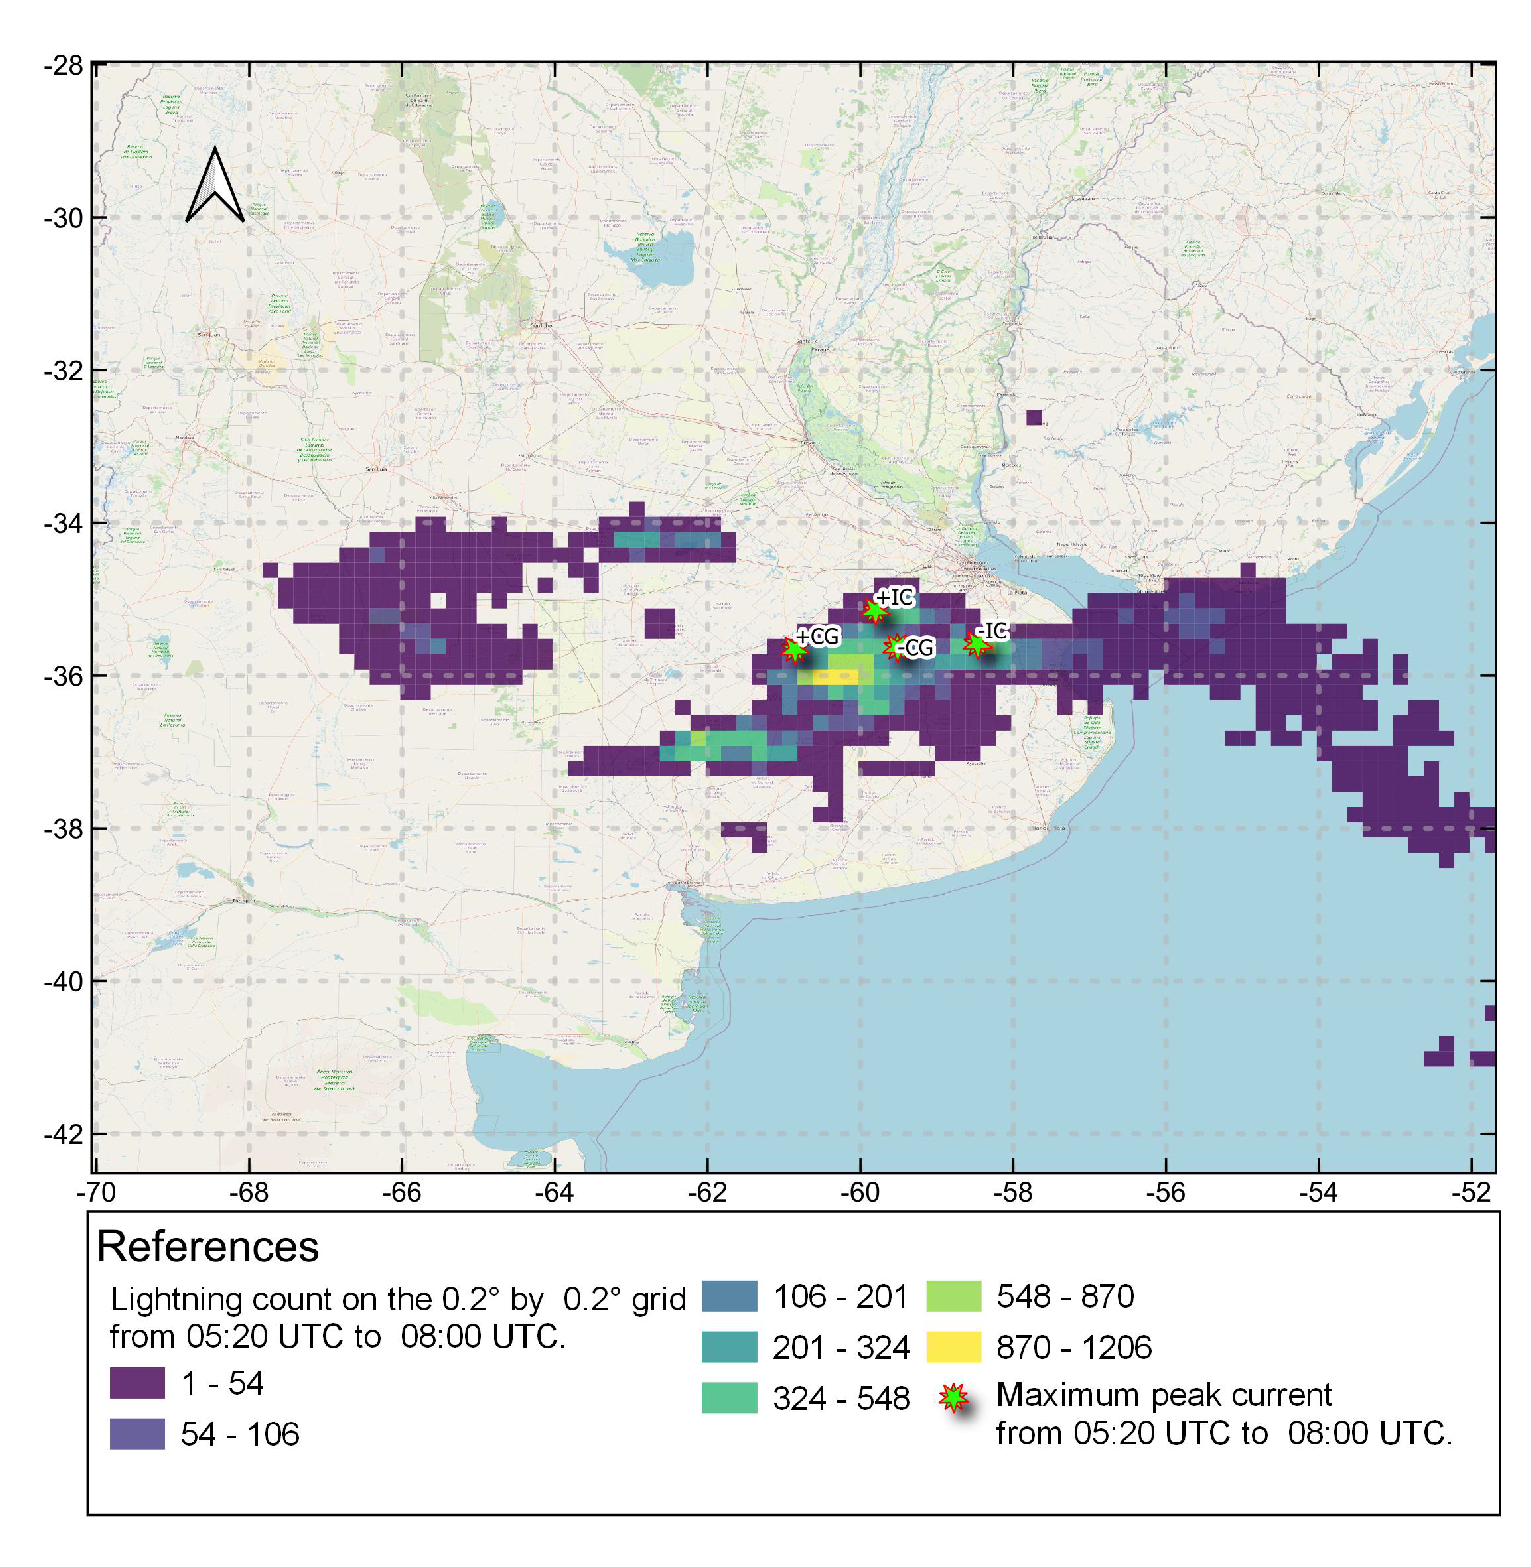
48]. Moreover, current peaks in +CG of 322 kA and -CG of -267 kA were observed in this period. These peaks were located near the regions with the highest number of lightning flashes over the storm to the southeast. During this period, the storms showed a decrease in their atmospheric electrical activity.
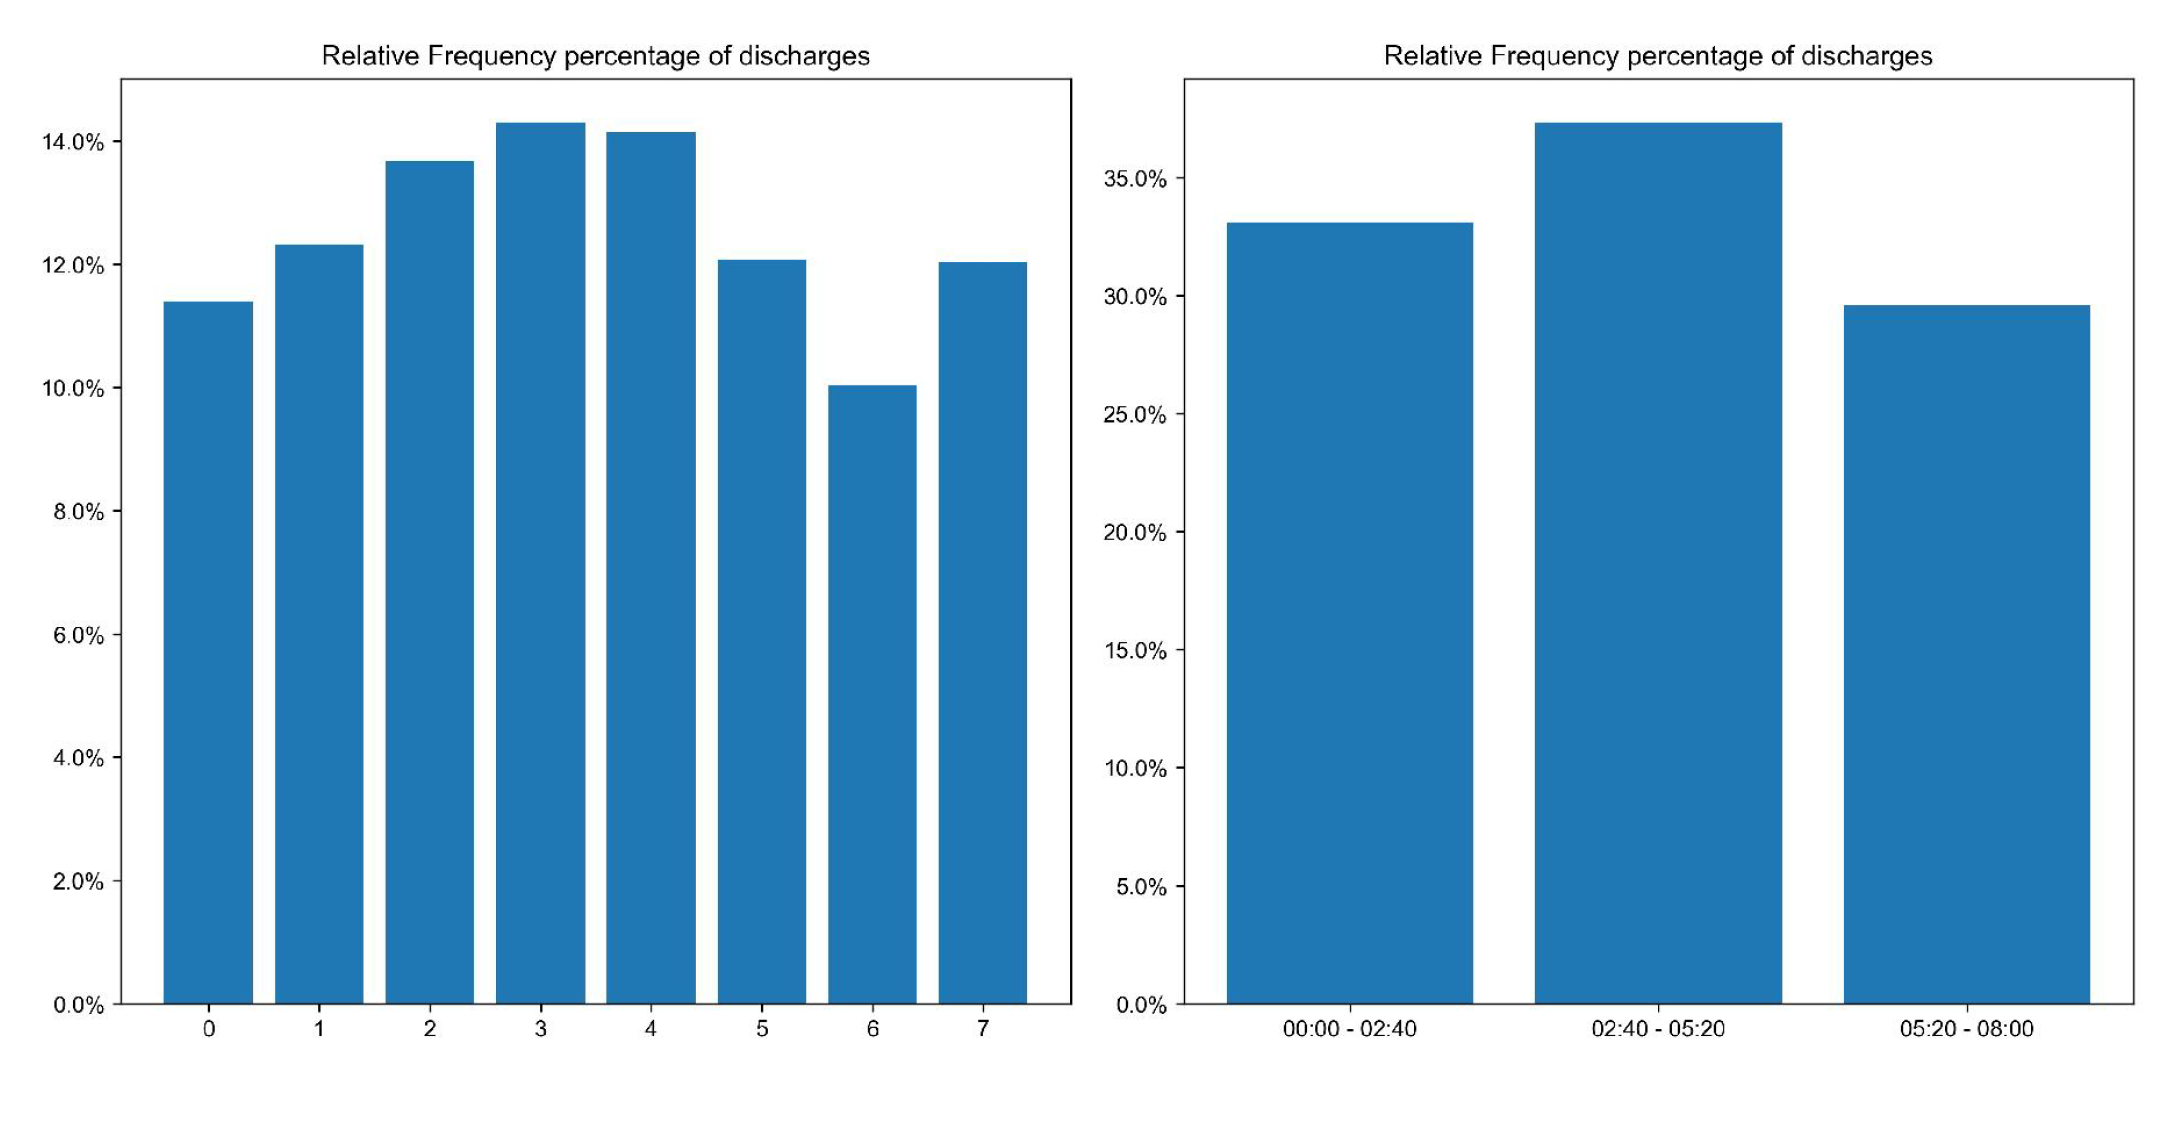
In the different time periods, we obtained waveform structures in DVTEC with peak-to-peak amplitudes between [0.01 - 1.35] TECU. We could observe that in the time interval [02:40 - 05:20] UTC where the highest lightning count occurred, the highest peak-to-peak DVTEC amplitudes were observed.
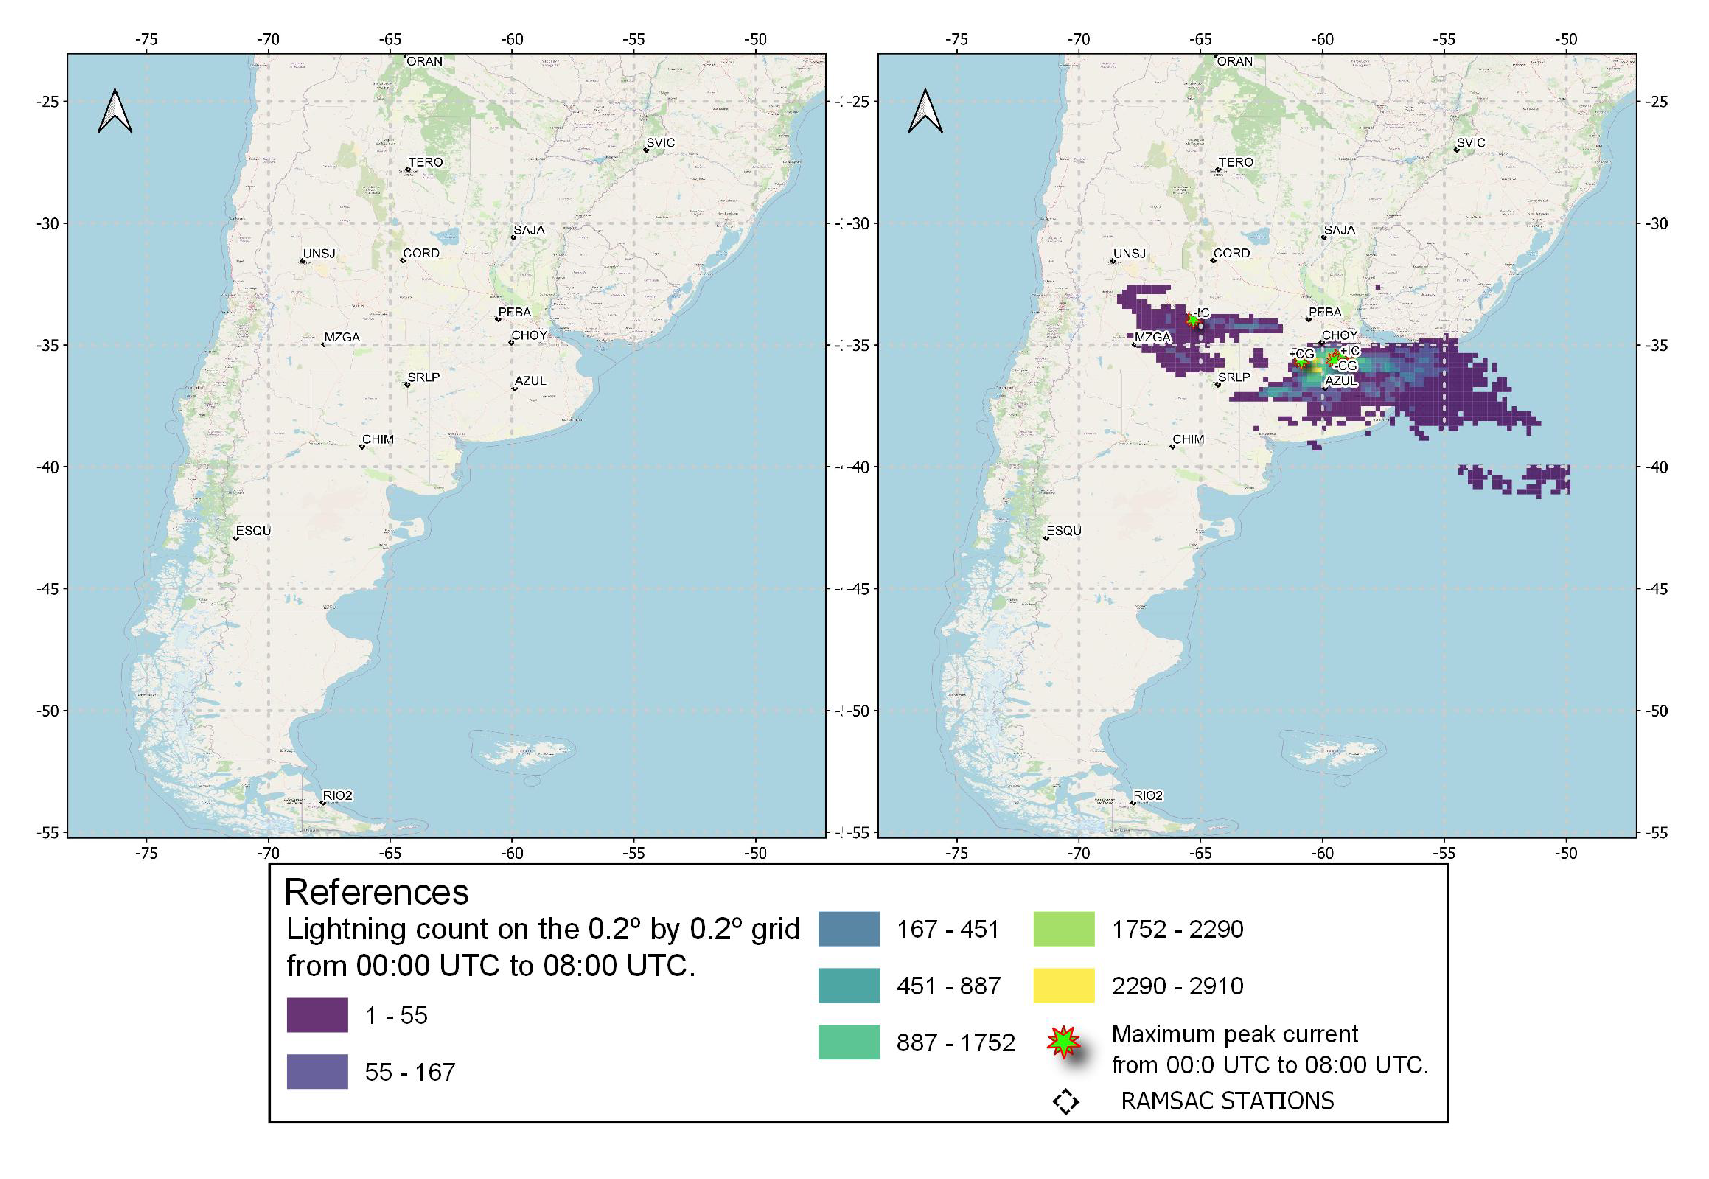
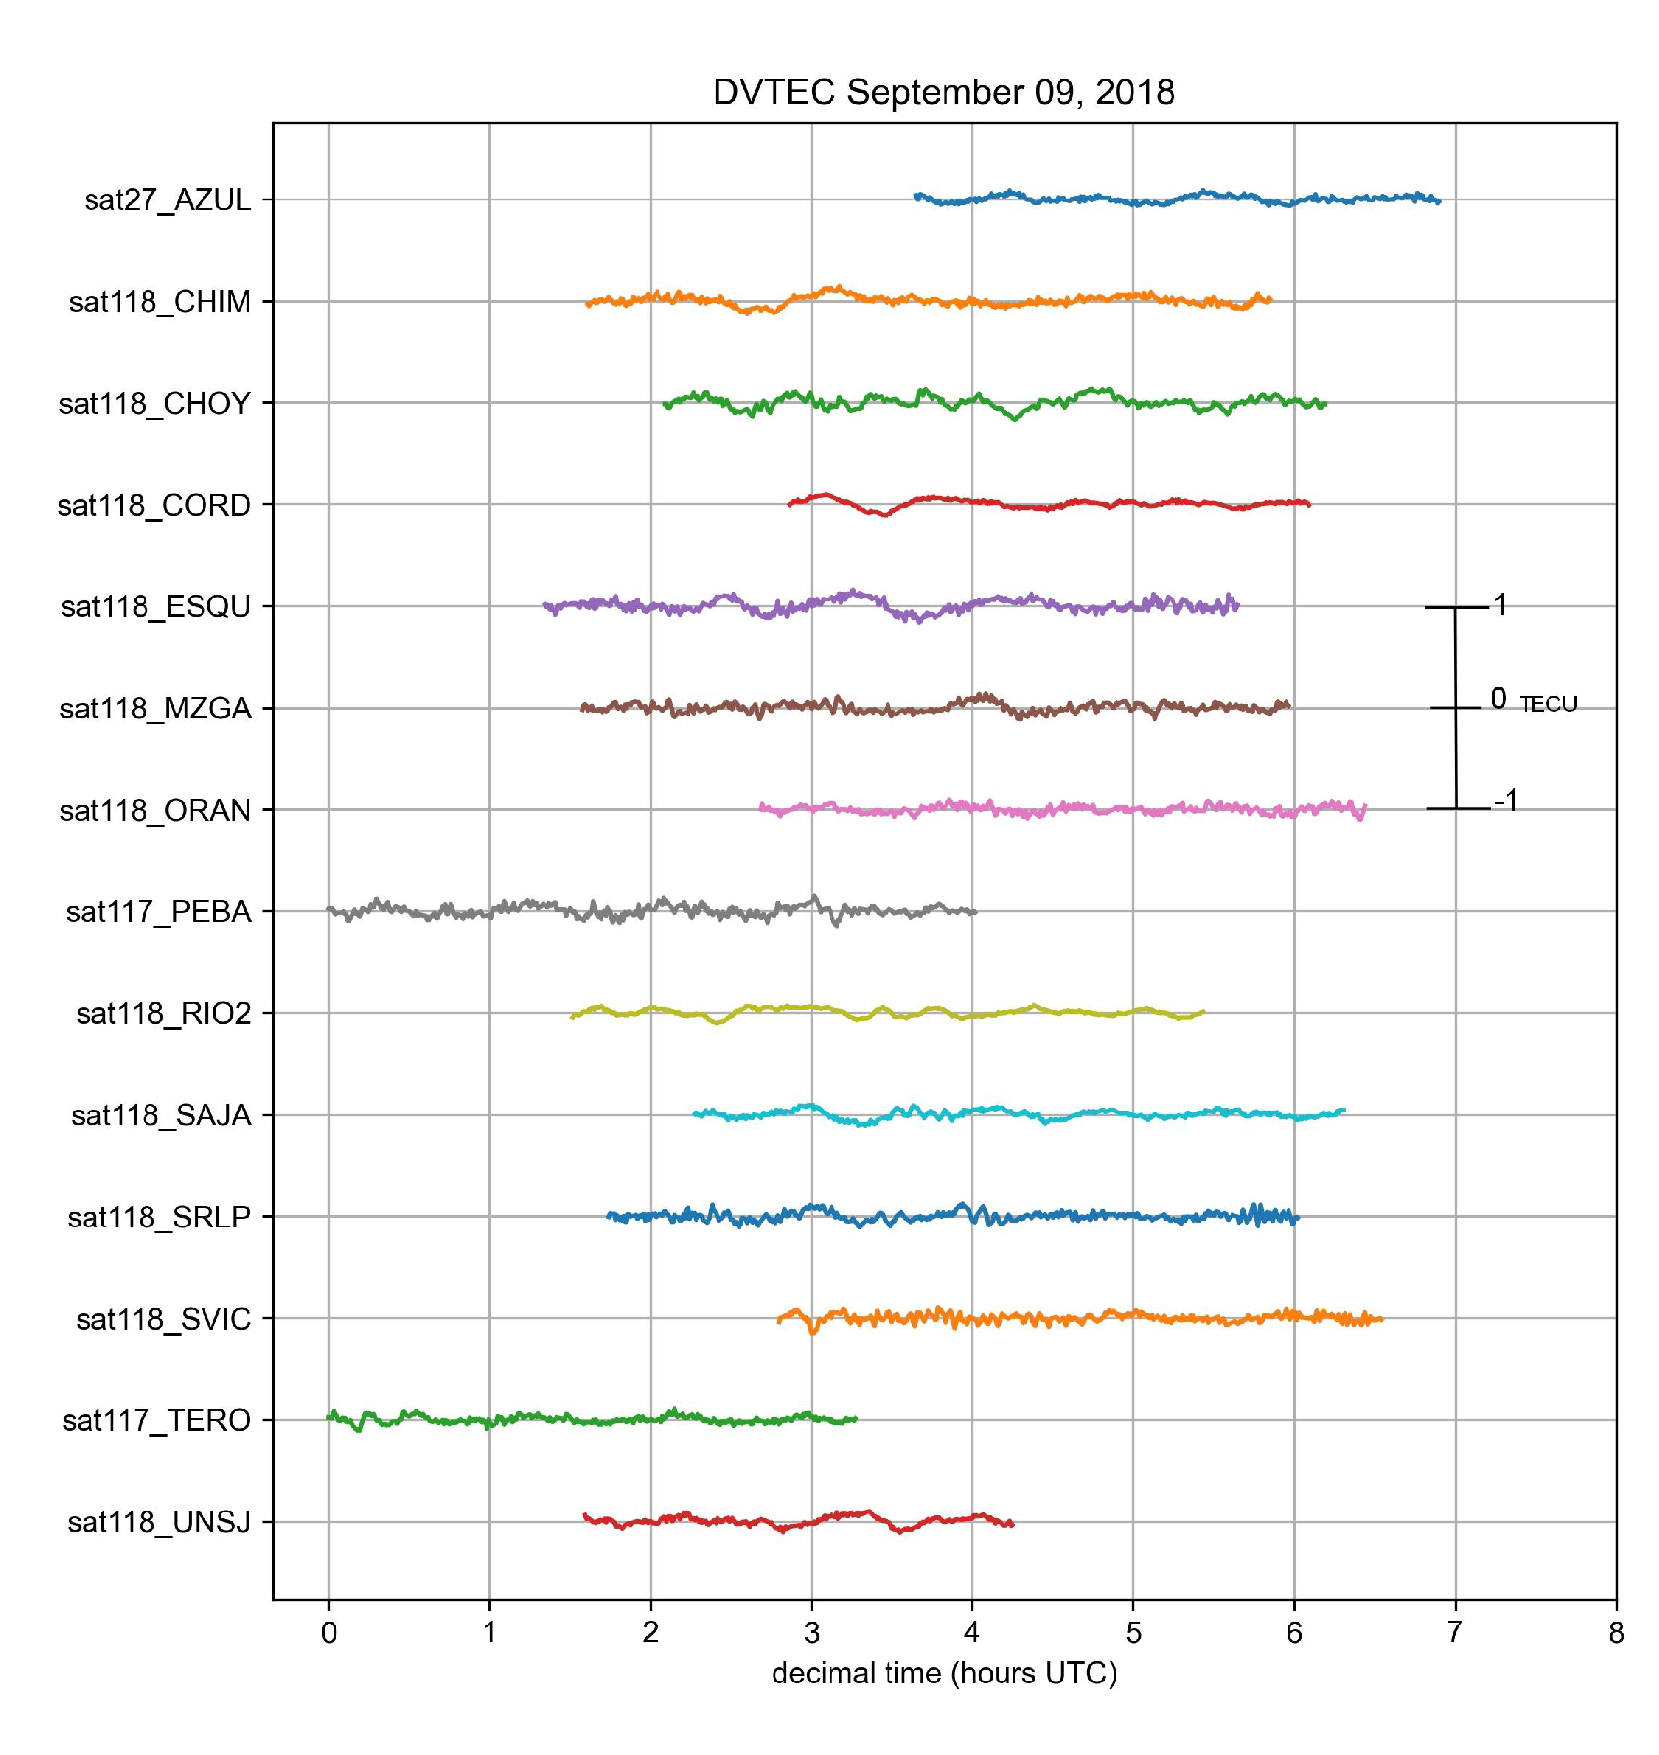
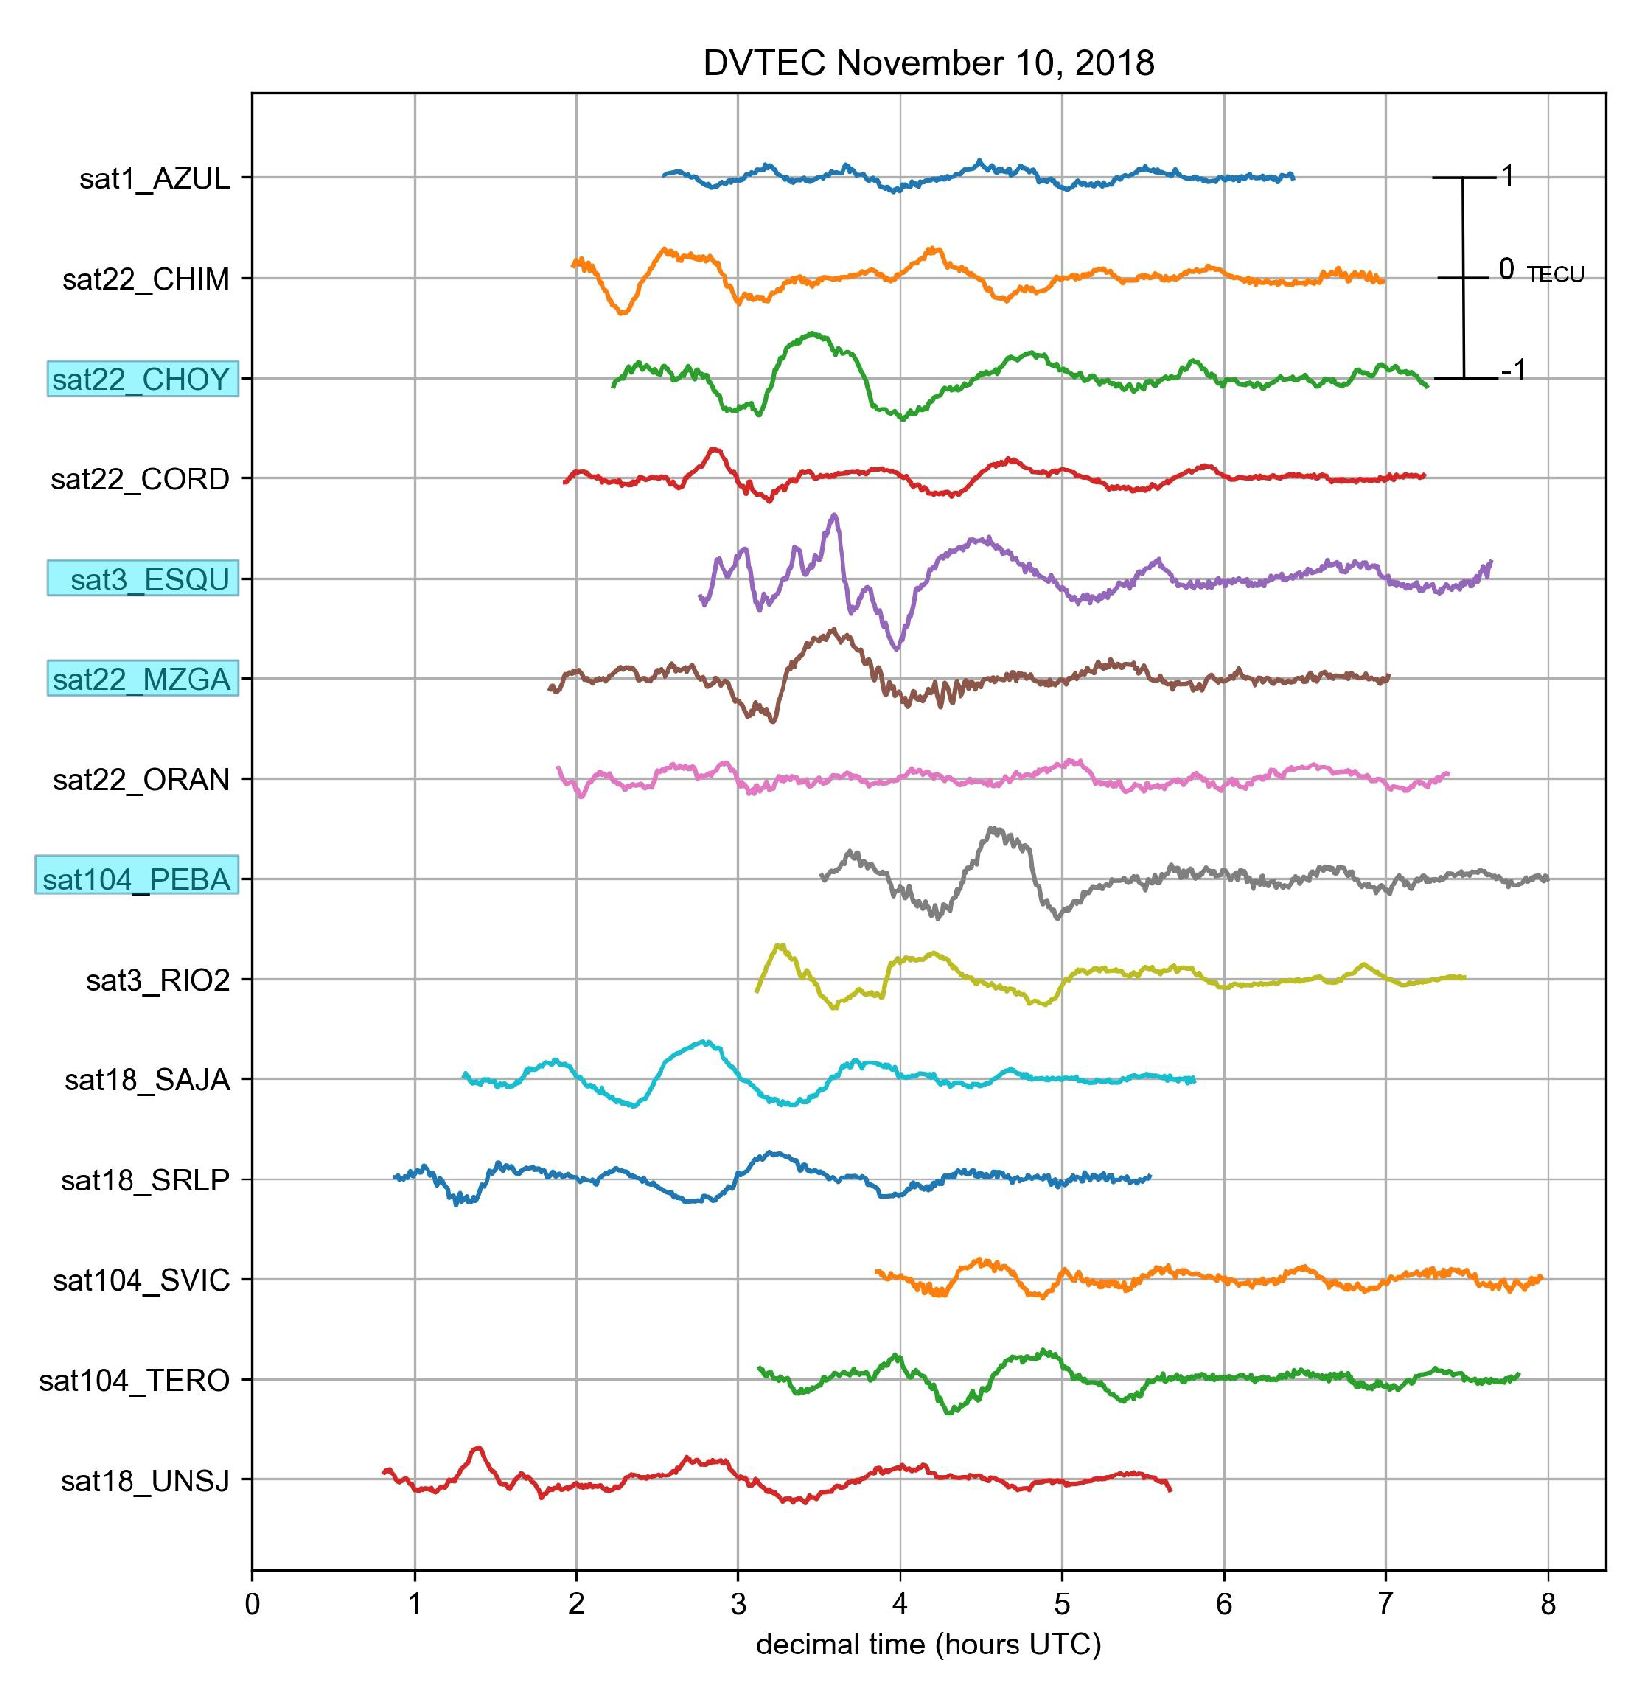
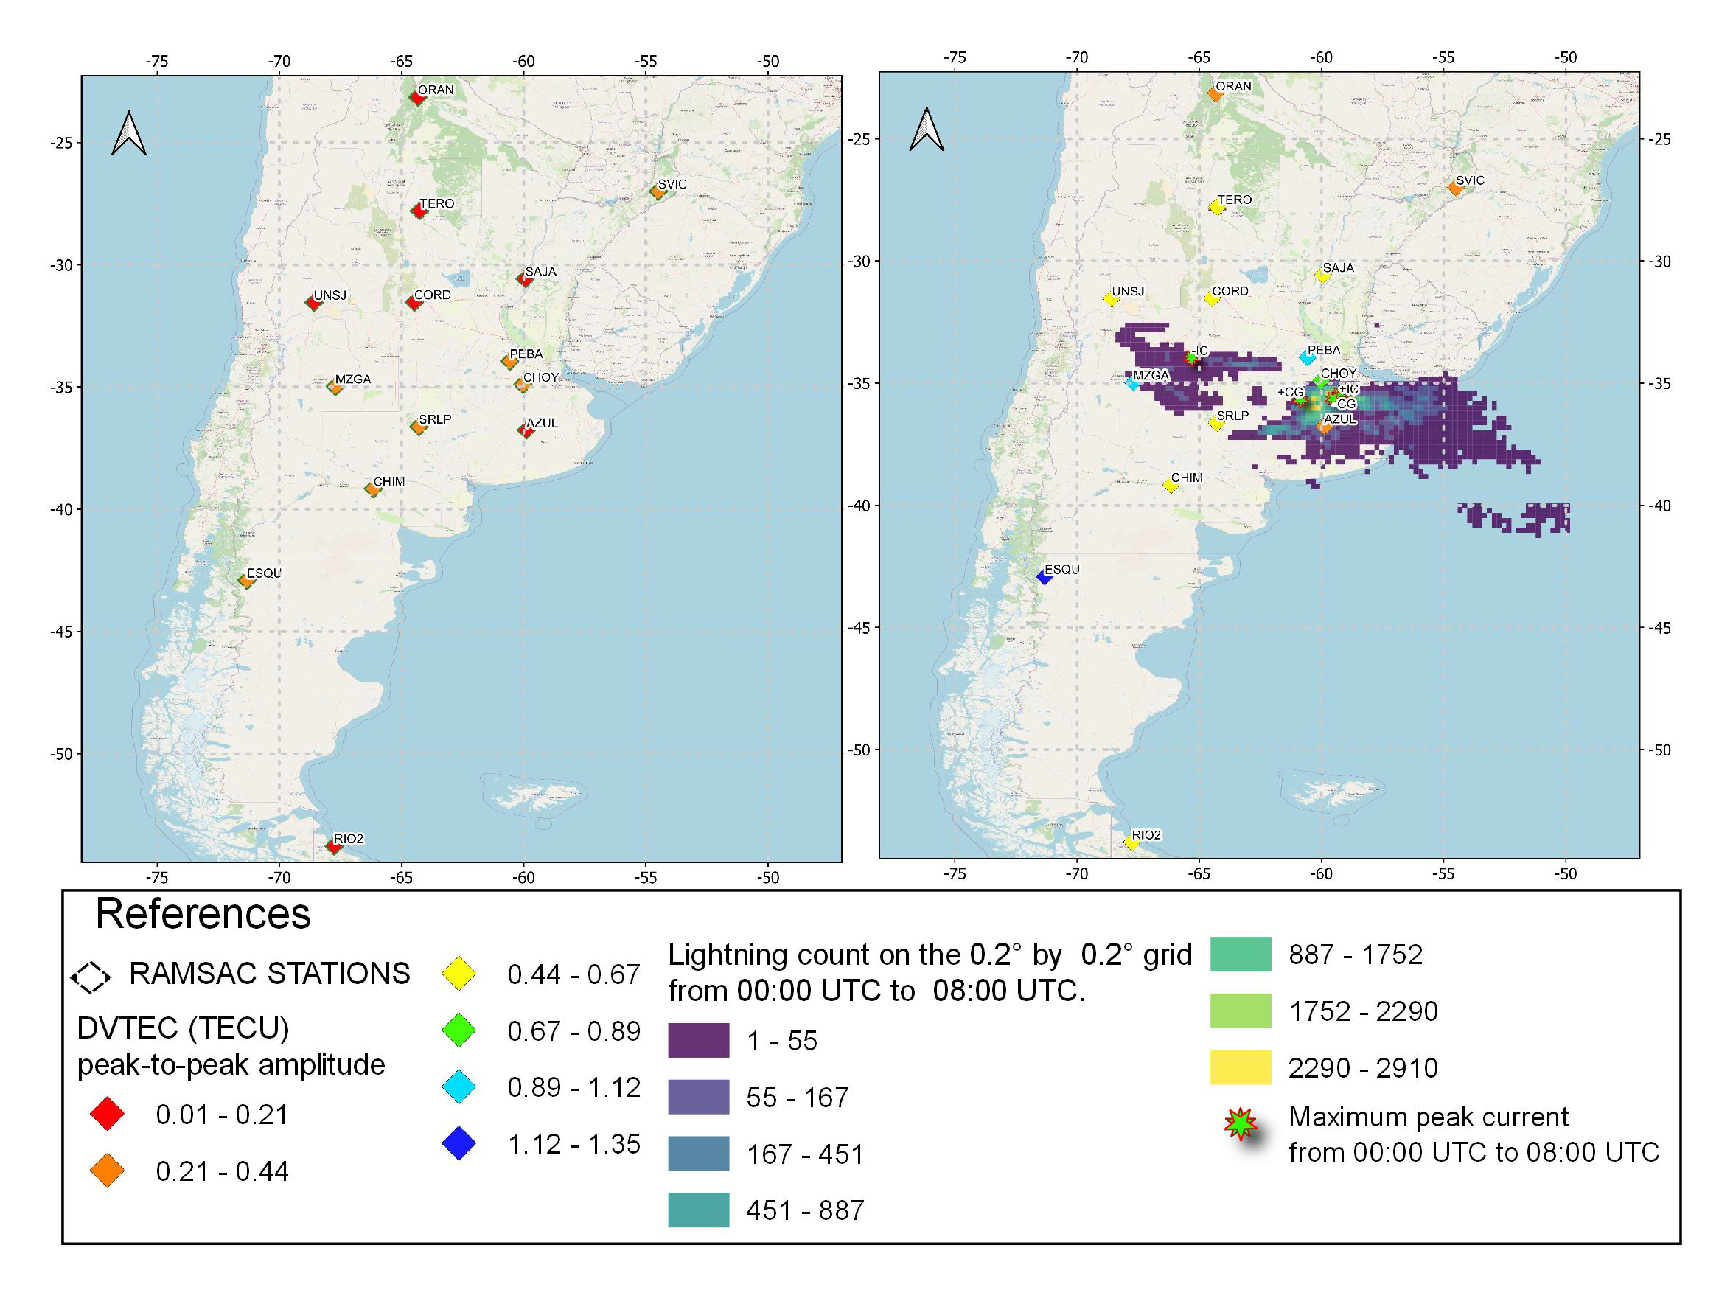
To be sure if the wave-like structures observed in the DVTEC records are the result of storms, we worked with a base day (reference day), in which the geomagnetic activity was low and the electrical activity was null for the whole study period in Argentina. At this point, we worked only with 14 RAMSAC stations. Comparing the peak-to-peak DVTEC amplitude of the reference value with the peak-to-peak DVTEC amplitude of the day with AEA for the whole study period (00:00 UTC - 08:00 UTC), it was observed that the 14 stations presented disturbances due to storms. Out of these, the ESQU station had the highest DVTEC deviation levels, with a maximum peak-to-peak amplitude of 1.35 TECU. It was positioned to the southwest of the storm region, on the Andes Mountain. Additionally, two of the 14 stations (AZUL and CHOY) were situated above the storm located to the southeast, near the maximum peak current and lightning count. At these stations, peak-to-peak DVTEC amplitudes of 0.32 TECU and 0.87 TECU, respectively, were observed. Comparing these values with those obtained on a reference day, we observed that in both cases there was a greater than two-fold increase in peak-to-peak amplitude. Looking at the rest of the stations, we saw a 2.91-fold increase in the peak-to-peak amplitude of the DVTEC when thunderstorms were present (see
Table 3). Therefore, we could say that the wavelet structures observed in the DVTEC signal were due to the studied storms .
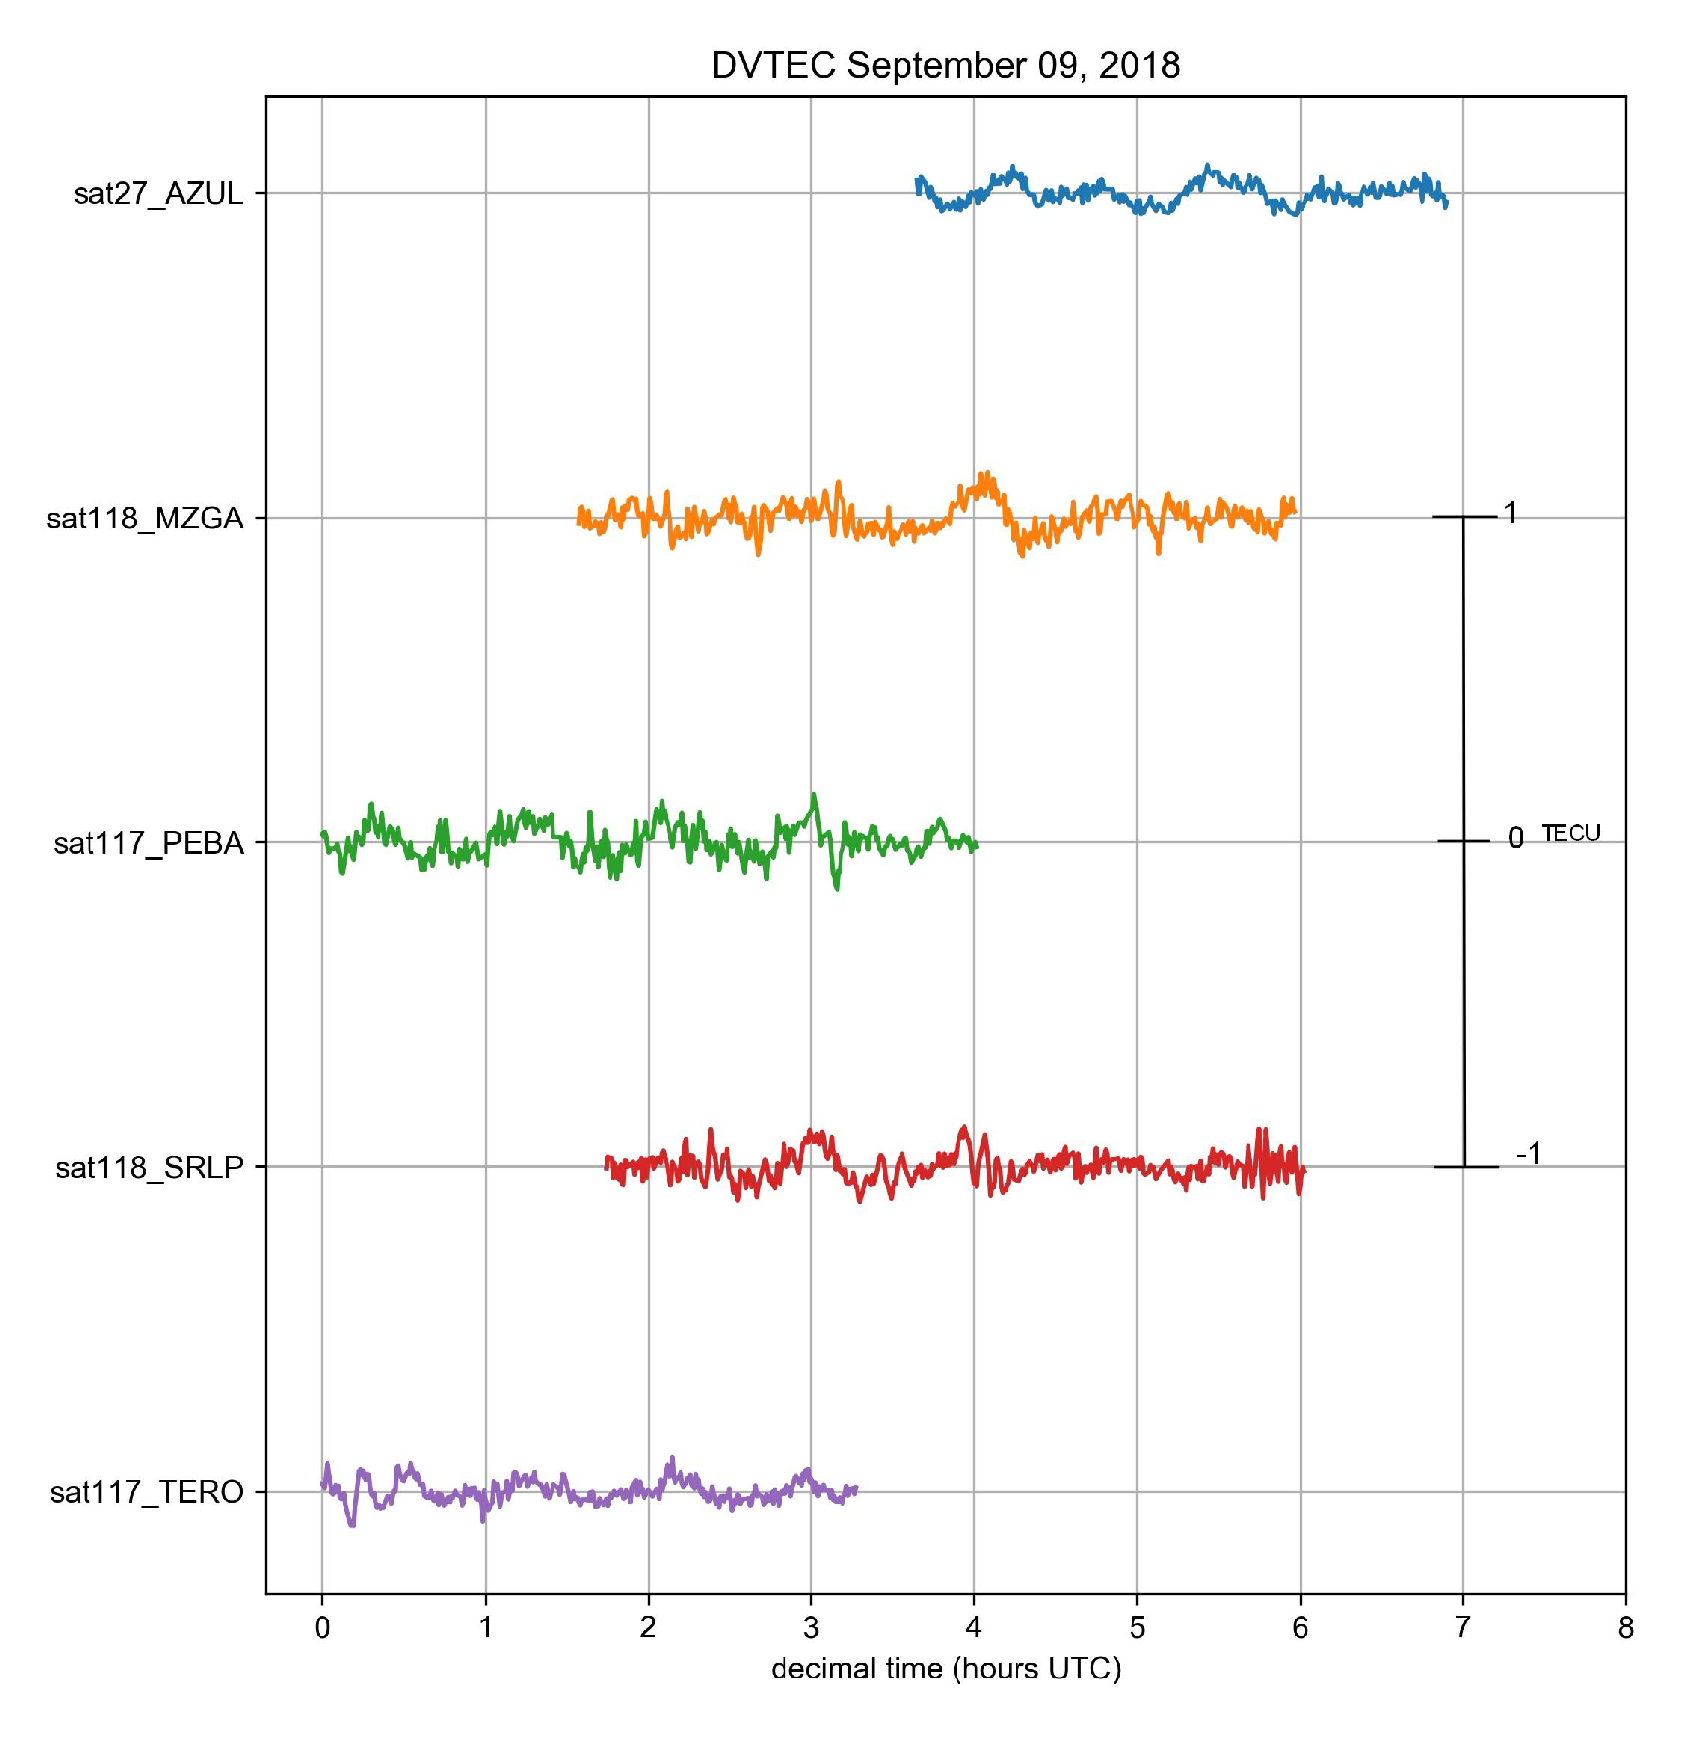
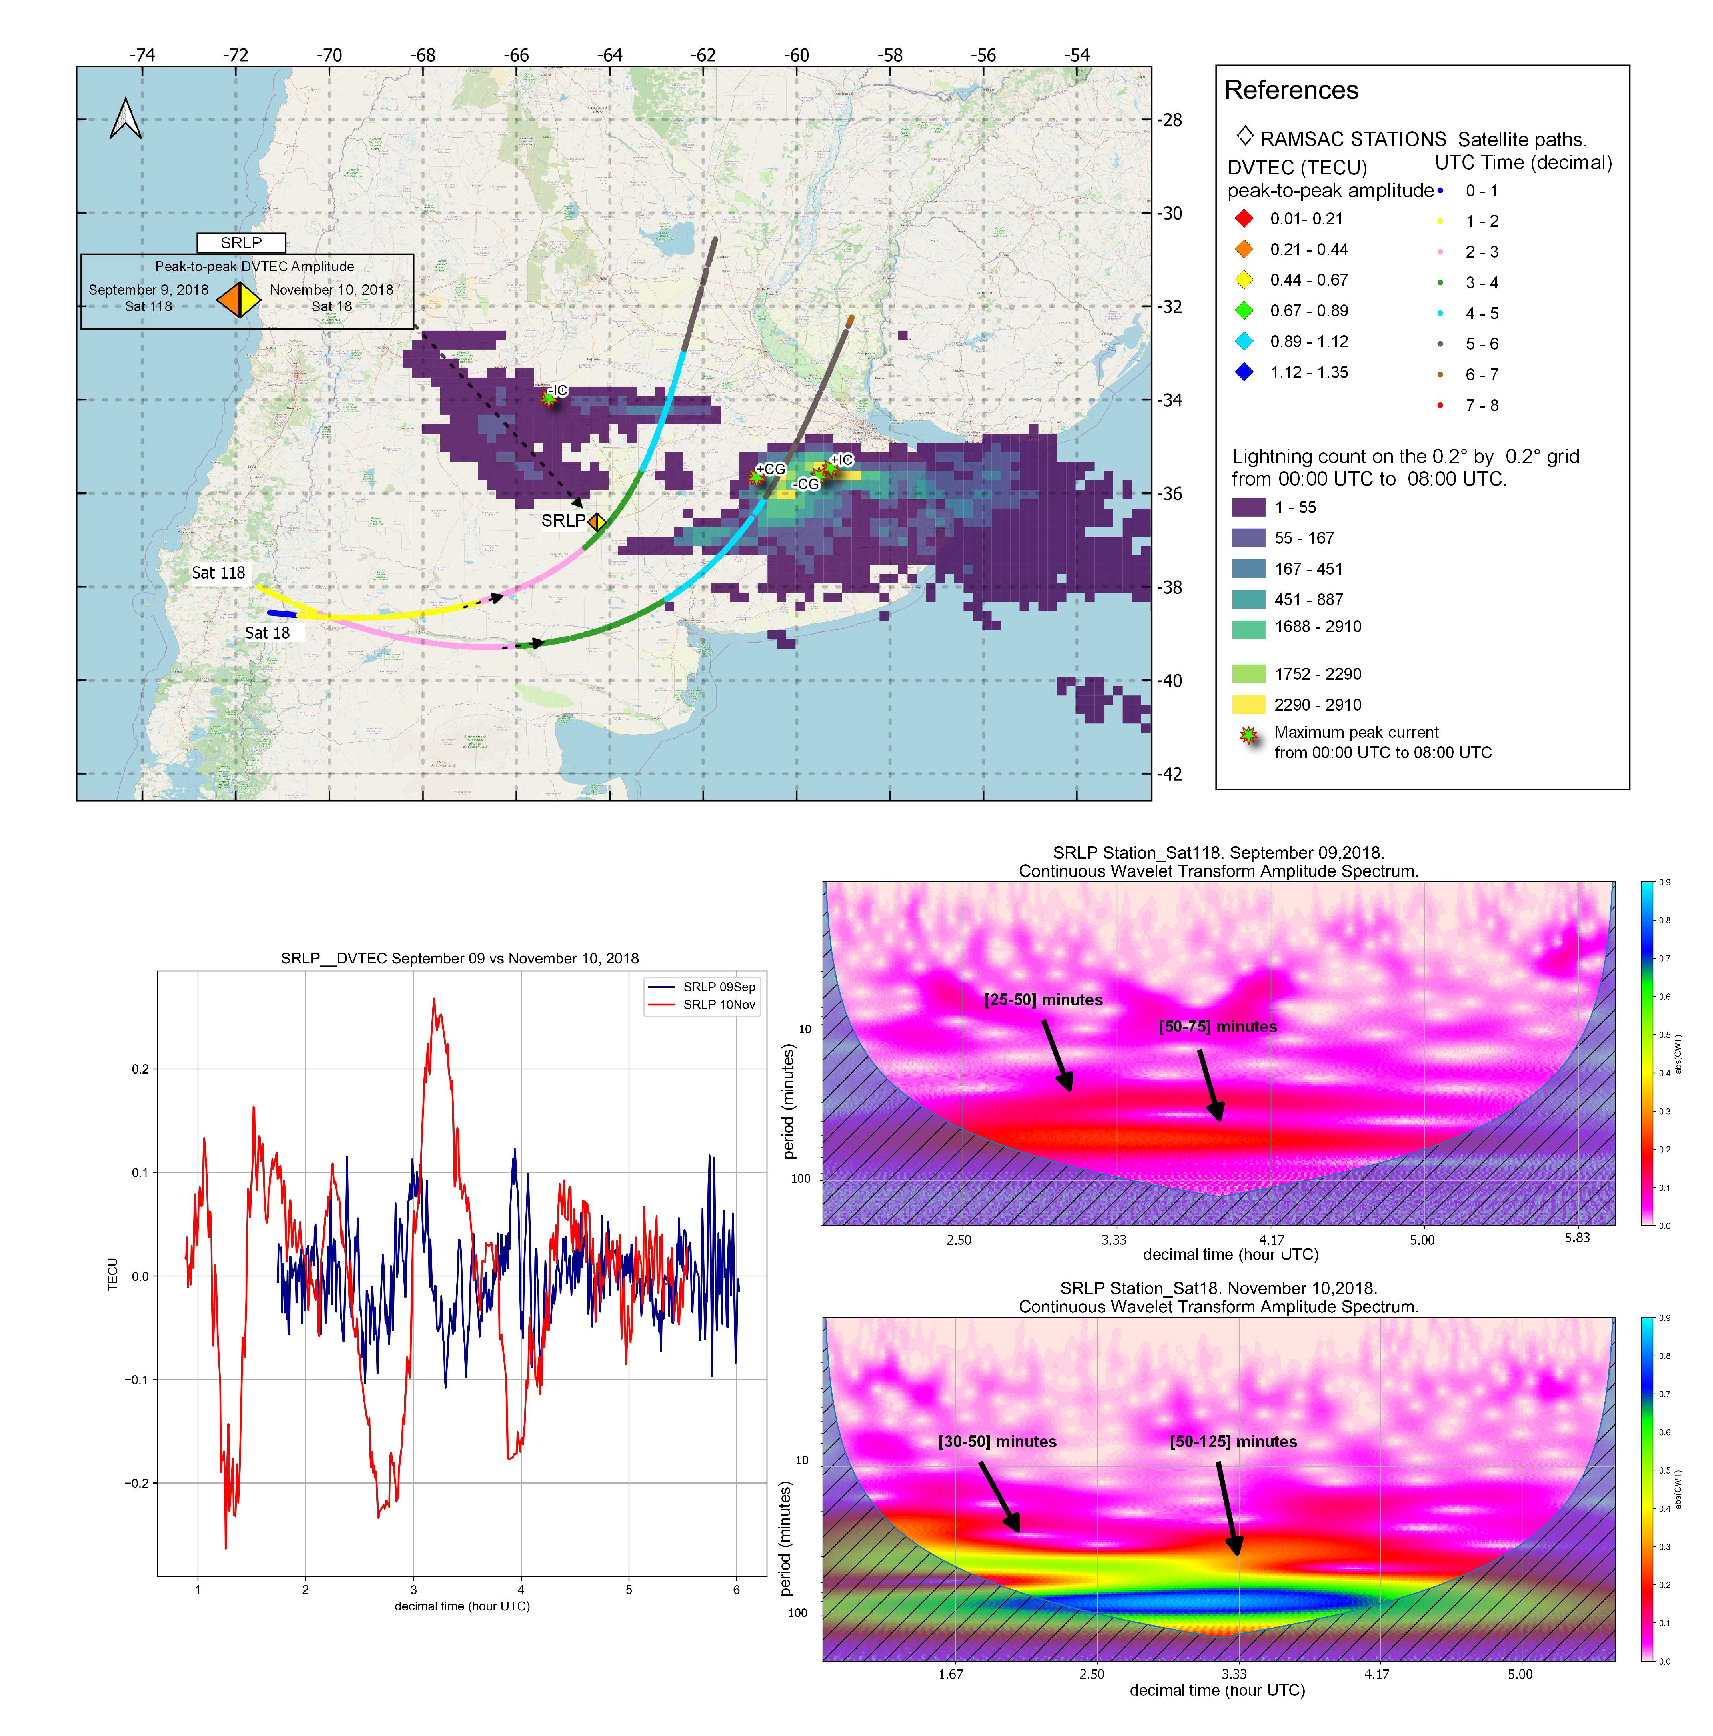
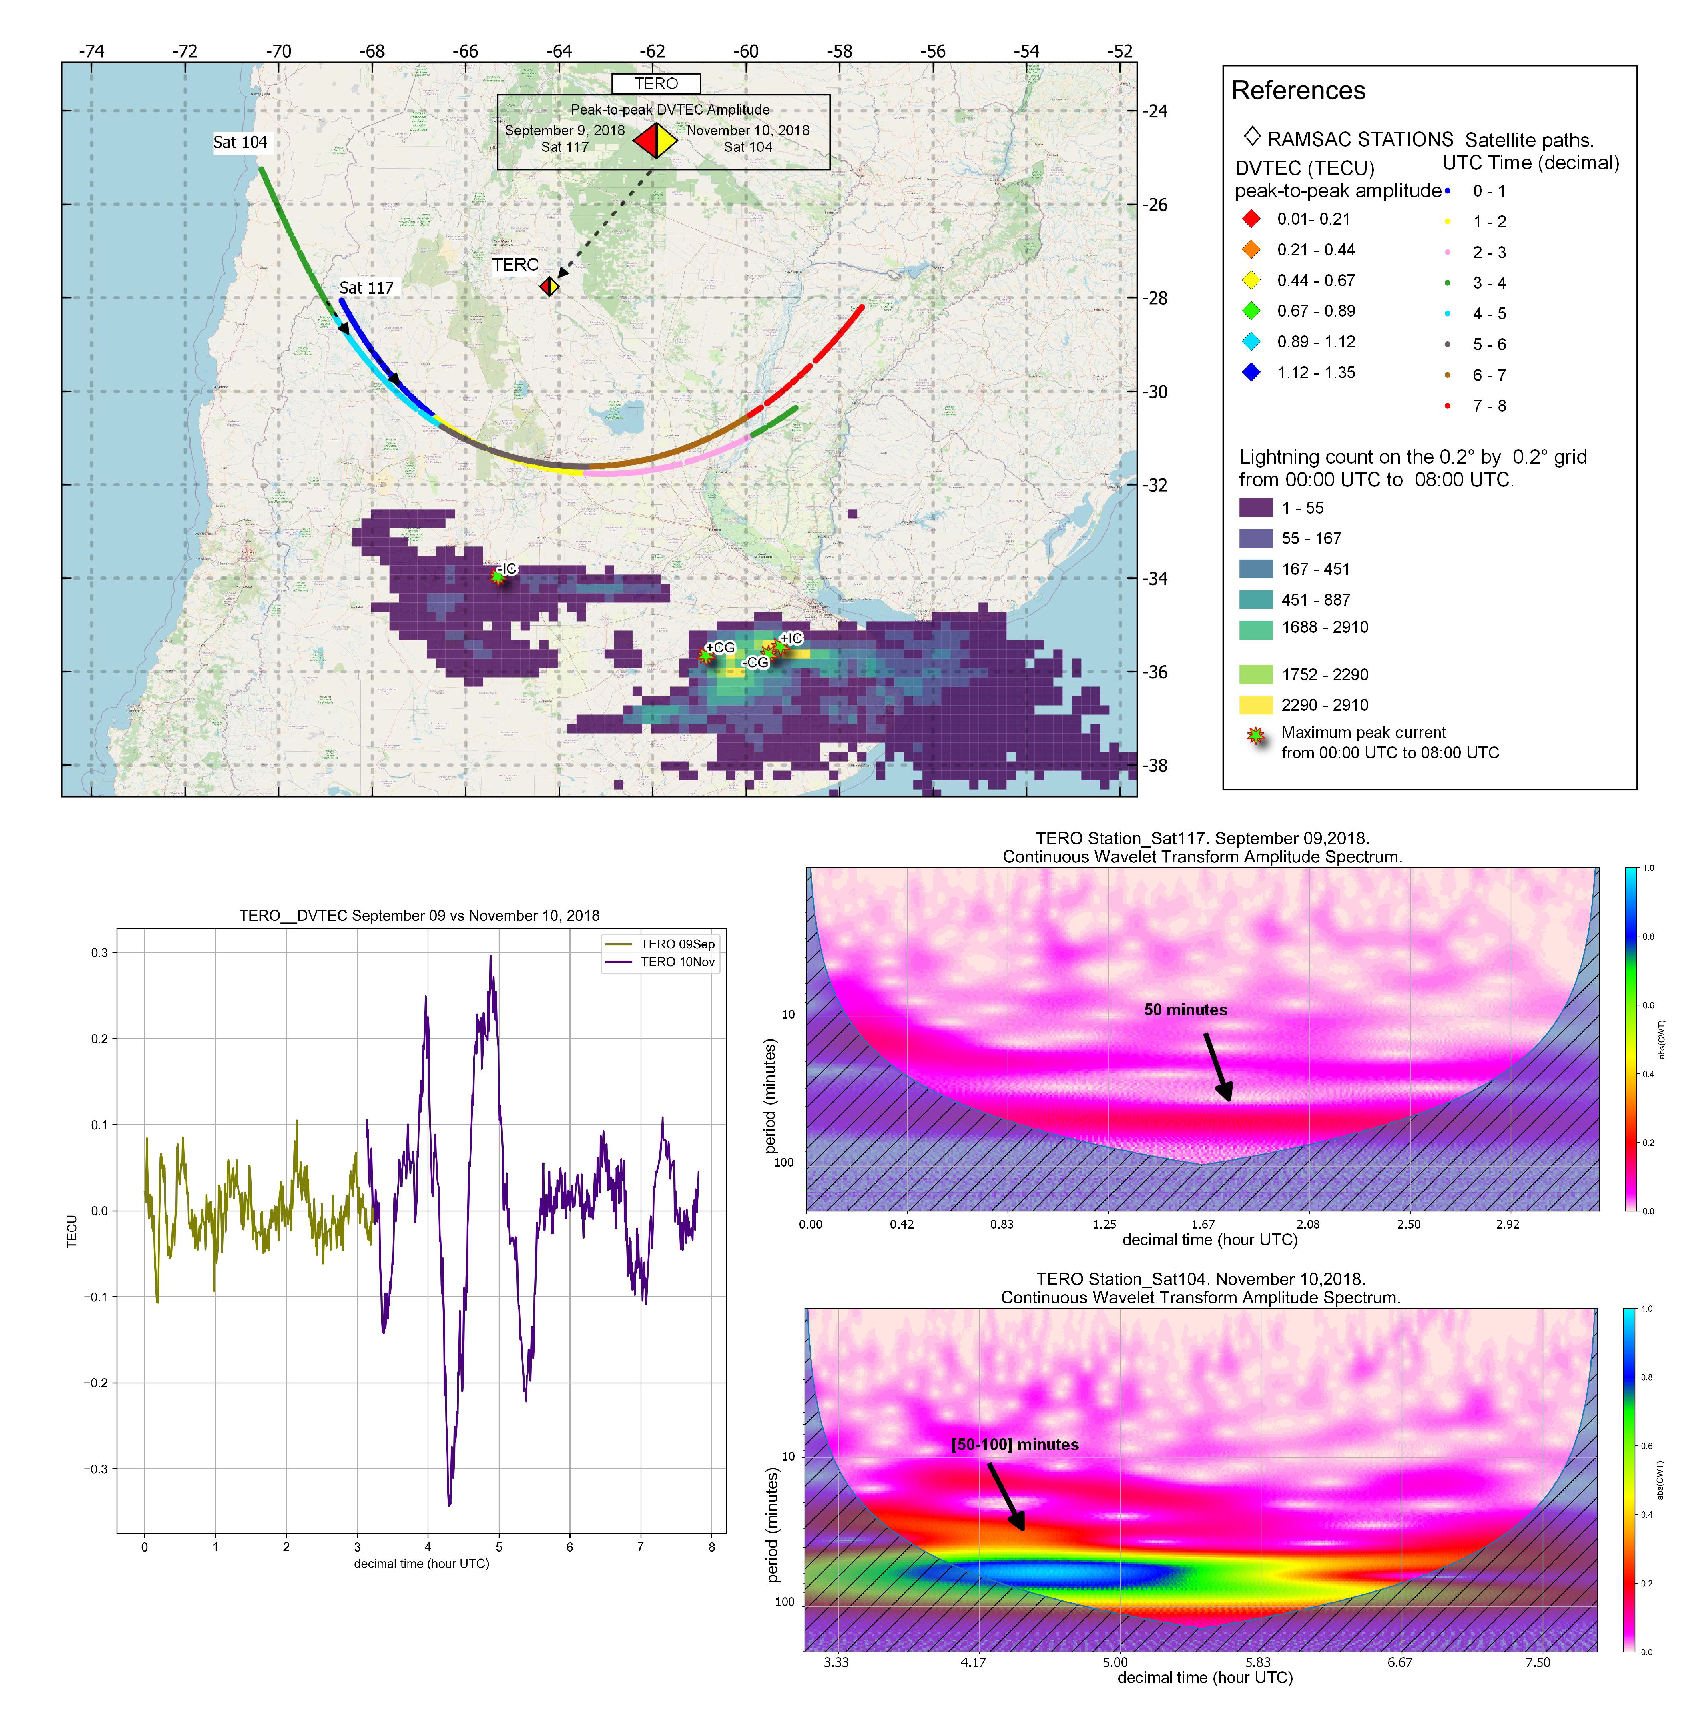
Finally, five stations close to the region where the storms developed were analyzed for both days. From the wavelet analysis, variabilities with periods less than or equal to 100 minutes, spectral amplitudes up to 1.4 and peak-to-peak DVTEC amplitudes up to 0.93 TECU were obtained during the day with storm. Whereas, during the reference day, wavelets with periods less than 75 minutes, spectral amplitudes up to 0.2, and peak-to-peak DVTEC amplitude up to 0.29 TECU were observed.
5. Conclusions
To sum up, we performed an electrical characterization of the thunderstorms that took place in central Argentina on November 10 and observed their effect on the ionosphere. As a result, we obtained that the thunderstorm produced disturbances with periods less than or equal to 100 minutes and peak-to-peak DVTEC amplitudes up to 1.35 TECU. The results found are in agreement with the work of [
49,
50]. [
49] found waves with periodicities around 60 minutes over West Africa; and [
50], obtained an average period between 60 and 120 minutes for all regions of the world. These disturbances, known as atmospheric gravity waves, appear to be related to the lightning count. Indeed, when the highest lightning count occurred, the highest peak-to-peak amplitudes were obtained in the DVTEC.
Considering that CG discharges constitute 25% and IC discharges 75% of the atmospheric electrical activity ([
45]), we can conclude that the results found in the percentage of discharges is as expected, since more than 70% of the discharges are of the IC type, mainly of negative polarity.
In thunderstorm conditions, DVTEC amplitudes between [0.1 - 1.4] TECU were obtained for the mid-latitude U.S. storms ([
5]). For Chinese storms, corresponding to low latitudes, amplitudes between [0.2 - 0.8] TECU were obtained ([
6]). While for the storms in Argentina developed in mid-latitudes, peak-to-peak amplitudes between [0.21 - 1.35] TECU were obtained.
When comparing the analyzed DVTEC signals, a progressive increase in instability was observed, especially in Zone 3. In particular, the southwest region of Zone 3 shows the most significant signal disturbances. It is worth mentioning that this specific zone is recognized for its frequent generation of gravitational waves ([
48]). Therefore, the observed results cannot be attributed solely to the investigated storms.
In the period, 02:40-05:20 UTC, the highest peak-to-peak DVTEC amplitudes were obtained, and the highest lightning count was recorded. Therefore, does the high lightning count generate an increase in DVTEC amplitudes? Rahmani
et al. [
1] found a direct relationship between the increase in storm activity and DVTEC amplitudes. They found that the average amplitudes of disturbances on days with severe thunderstorms were 1.3 times greater than on days without lightning. In our case, the average peak-to-peak amplitude of the 14 stations on the day with thunderstorms was about 2.91 times higher than on the day without lightning activity.
Finally, the ABRA and ORAN stations are located more than 1000 km away from the storms. At these stations, we observed peak-to-peak DVTEC amplitude values higher than 0.21 TECU. Therefore, we detected disturbances more than 1000 km from the center of the storms. This distance is greater than that found in the work of [
6], where they obtained perturbations 200-800 km from the storm center. This would indicate that gravitational waves can be found beyond the storm zone. According to [
51] "This may occur since, under suitable conditions, gravity waves as they propagate upward become unstable at higher altitudes and may break up (at an altitude of about 100 km) into secondary waves ([
12]) which continue to propagate upward, possibly modulating the E-region plasma distribution producing polarization electric fields that map the F-region ionosphere ([
52])." Moreover, there are authors, such as [
53], and [
54], who suggest that these disturbances in the ionosphere may be due to vertical transport of electrostatic discharge ([
4]). Others have suggested ([
55]) that this may be caused by Transient Luminous Events (TLEs), which would induce fluctuations in the D region of the ionosphere ([
4]).
Author Contributions
Conceptualization, C.I.V.A., M.G.N., A.M., M.P.N., and E.E.A.; methodology, C.I.V.A., M.G.N., A.M., M.P.N., and E.E.A.; software, C.I.V.A., A.M.,and M.P.N.; validation, C.I.V.A., M.G.N., A.M., M.P.N., and E.E.A.; formal analysis, C.I.V.A., M.G.N., A.M., M.P.N., and E.E.A.; investigation, C.I.V.A., M.G.N., A.M., M.P.N., and E.E.A.; resources, C.I.V.A., M.G.N., A.M., and M.P.N.; data curation, C.I.V.A., M.G.N.,and A.M.; writing—original draft preparation, C.I.V.A., M.G.N., A.M., M.P.N., and E.E.A.; writing—review and editing, C.I.V.A., M.G.N., A.M., M.P.N., E.E.A., M.R., and F.R.; visualization, C.I.V.A., M.G.N., A.M., M.P.N., E.E.A., M.R., and F.R.; supervision, C.I.V.A., M.G.N., and E.E.A.; project administration, M.G.N., A.M.,and M.P.N.; funding acquisition, M.G.N., M.R., and F.R. All authors have read and agreed to the published version of the manuscript.
Figure 1.
Study region outlined in orange.
Figure 1.
Study region outlined in orange.
Figure 2.
RAMSAC Stations [
32].
Figure 2.
RAMSAC Stations [
32].
Figure 3.
GOES-R 16 image, channel 13 (10.3 m). Plots are made every two hours from 18:00 UTC on November 9, 2018 to 16:00 UTC on November 10, 2018. The study subregion, defined between latitudes 43°S - 28°S and longitudes 70°W - 51°W, is outlined in yellow.
Figure 3.
GOES-R 16 image, channel 13 (10.3 m). Plots are made every two hours from 18:00 UTC on November 9, 2018 to 16:00 UTC on November 10, 2018. The study subregion, defined between latitudes 43°S - 28°S and longitudes 70°W - 51°W, is outlined in yellow.
Figure 4.
Evolution of hourly storms from 00:00 UTC to 03:00 UTC in the study subregion. Diamonds are used to represent IntraCloud (IC) discharges (brown for -IC and green for +IC), and stars to represent Cloud-to-Ground (CG) discharges (blue for -CG and light blue for +CG). The color scale represents the brightness temperature corresponding to band 13 of the ABI sensor, GOES-R 16.
Figure 5.
Evolution of hourly storms from 04:00 UTC to 07:00 UTC in the study subregion. Diamonds are used to represent IntraCloud (IC) discharges (brown for -IC and green for +IC), and stars to represent Cloud-to-Ground (CG) discharges (blue for -CG and light blue for +CG). The color scale represents the brightness temperature corresponding to band 13 of the ABI sensor, GOES-R 16.
Figure 6.
Lightning count on the 0.2° by 0.2° grid from 00:00 to 08:00 UTC (21:00 LT - 05:00 LT). Light colors represent the location with the highest lightning count. The stars indicate the sites where the maximum peak currents of the +CG, -CG, +IC, and -IC discharges occurred.
Figure 6.
Lightning count on the 0.2° by 0.2° grid from 00:00 to 08:00 UTC (21:00 LT - 05:00 LT). Light colors represent the location with the highest lightning count. The stars indicate the sites where the maximum peak currents of the +CG, -CG, +IC, and -IC discharges occurred.
Figure 7.
Right. Relative frequency of lightning at UTC hour. Left. Relative frequency of lightning at the period of time.
Figure 7.
Right. Relative frequency of lightning at UTC hour. Left. Relative frequency of lightning at the period of time.
Figure 8.
Lightning count on the 0.2° by 0.2° grid from 00:00 UTC to 02:40 UTC (21:00 LT - 23:40 LT). Light colors represent the location with the highest lightning count. Stars indicate the locations where the peak currents of the +CG, -CG, +IC, and -IC discharges occurred.
Figure 8.
Lightning count on the 0.2° by 0.2° grid from 00:00 UTC to 02:40 UTC (21:00 LT - 23:40 LT). Light colors represent the location with the highest lightning count. Stars indicate the locations where the peak currents of the +CG, -CG, +IC, and -IC discharges occurred.
Figure 9.
Lightning count on the 0.2° by 0.2° grid from 02:40 UTC to 05:20 UTC (23:40 LT - 02:20 LT). Light colors represent the location with the highest lightning count. Stars indicate the locations where the peak currents of the +CG, -CG, +IC, and -IC discharges occurred.
Figure 9.
Lightning count on the 0.2° by 0.2° grid from 02:40 UTC to 05:20 UTC (23:40 LT - 02:20 LT). Light colors represent the location with the highest lightning count. Stars indicate the locations where the peak currents of the +CG, -CG, +IC, and -IC discharges occurred.
Figure 10.
Lightning count on the 0.2° by 0.2° grid from 05:20 UTC to 08:00 UTC (02:20 LT - 05:00 LT). Light colors represent the location with the highest lightning count. Stars indicate the locations where the peak currents of the discharges +CG, -CG, +IC, and -IC occurred.
Figure 10.
Lightning count on the 0.2° by 0.2° grid from 05:20 UTC to 08:00 UTC (02:20 LT - 05:00 LT). Light colors represent the location with the highest lightning count. Stars indicate the locations where the peak currents of the discharges +CG, -CG, +IC, and -IC occurred.
Figure 11.
Lightning counts on the 0.2° by 0.2° grid from 00:00 UTC to 08:00 UTC (21:00 LT - 05:00 LT). Light colors represent locations with the highest lightning counts. RAMSAC stations are marked with diamonds, and the three study zones are delimited with ellipses.
Figure 11.
Lightning counts on the 0.2° by 0.2° grid from 00:00 UTC to 08:00 UTC (21:00 LT - 05:00 LT). Light colors represent locations with the highest lightning counts. RAMSAC stations are marked with diamonds, and the three study zones are delimited with ellipses.
Figure 12.
Temporal variations of the differential vertical total electron content (DVTEC) of the RAMSAC stations within Zone 1. On the x-axis, with colored bars, the three time periods analyzed in the previous section are represented, blue for the period 00:00 UTC- 02:40 UTC (i.e. 21:00 LT - 23:40 LT), yellow for the interval 02:40 UTC- 05:20 UTC (i.e. 23:40 LT- 02:20 LT), and in green for the period 05:20 UTC - 08:00 UTC (i.e. 02:20 LT - 05:00 LT). On the y-axis, the stations are located 1 TECU apart. A scale is shown in the figure as a reference. The stations with the largest deviations observed in DVTEC are outlined in blue.
Figure 13.
Temporal variations of the differential vertical total electron content (DVTEC) of the RAMSAC stations within Zone 2.On the x-axis, with colored bars, the three time periods analyzed in the previous section are represented, blue for the period 00:00 UTC- 02:40 UTC (i.e. 21:00 LT - 23:40 LT), yellow for the interval 02:40 UTC- 05:20 UTC (i.e. 23:40 LT- 02:20 LT), and in green for the period 05:20 UTC - 08:00 UTC (i.e. 02:20 LT - 05:00 LT). On the y-axis, the stations are located 1 TECU apart. A scale is shown in the figure as a reference. The stations with the largest deviations observed in DVTEC are outlined in blue.
Figure 14.
Temporal variations of the differential vertical total electron content (DVTEC) of the RAMSAC stations within Zone 3. On the x-axis, with colored bars, the three time periods analyzed in the previous section are represented, blue for the period 00:00 UTC- 02:40 UTC (i.e. 21:00 LT - 23:40 LT), yellow for the interval 02:40 UTC- 05:20 UTC (i.e. 23:40 LT- 02:20 LT), and in green for the period 05:20 UTC - 08:00 UTC (i.e. 02:20 LT - 05:00 LT). On the y-axis, the stations are located 1 TECU apart. A scale is shown in the figure as a reference. The stations with the largest deviations observed in DVTEC are outlined in blue.
Figure 15.
Map of RAMSAC stations in Zone 1. The range of peak-to-peak DVTEC amplitudes obtained at each station are marked with colored diamonds. Lightning counts are plotted on the 0.2° by 0.2° grid. Light colors represent the location with the highest lightning counts. The locations of the maximum peak currents for IC and CG discharges are indicated by stars. The three maps represent, the three time periods analyzed: top left map: 00:00 UTC - 02:40 UTC (21:00 LT - 23:40 LT); top right map: 02:40 UTC - 05:20 UTC (23:40 LT - 02:20 LT); bottom left map: 05:20 UTC - 08:00 UTC (02:20 LT - 05:00 LT).
Figure 16.
Map of RAMSAC stations in Zone 2. The range of peak-to-peak DVTEC amplitudes obtained at each station are marked with colored diamonds. Lightning counts are plotted on the 0.2° by 0.2° grid. Light colors represent the location with the highest lightning counts. The locations of the maximum peak currents for IC and CG discharges are indicated by stars. The three maps represent, the three time periods analyzed: top left map: 00:00 UTC - 02:40 UTC (21:00 LT - 23:40 LT); top right map: 02:40 UTC - 05:20 UTC (23:40 LT - 02:20 LT); bottom left map: 05:20 UTC - 08:00 UTC (02:20 LT - 05:00 LT).
Figure 17.
Map of RAMSAC stations in Zone 3. The range of peak-to-peak DVTEC amplitudes obtained at each station are marked with colored diamonds. Lightning counts are plotted on the 0.2° by 0.2° grid. Light colors represent the location with the highest lightning counts. The locations of the maximum peak currents for IC and CG discharges are indicated by stars. The three maps represent, the three time periods analyzed: top left map: 00:00 UTC - 02:40 UTC (21:00 LT - 23:40 LT); top right map: 02:40 UTC - 05:20 UTC (23:40 LT - 02:20 LT); bottom left map: 05:20 UTC - 08:00 UTC (02:20 LT - 05:00 LT).
Figure 18.
Maps of the 14 RAMSAC stations on September 9, reference day (left image), and on November 10, 2018, day with AEA (right image). On the November 10 map, lightning count is plotted on the 0.2° by 0.2° grid, and the locations where the highest current peaks occurred for intracloud (IC) and for Cloud-to-Ground (CG) discharges are indicated with stars.
Figure 19.
Reference day. Temporal variations of the differential vertical total electron content (DVTEC) of the 14 RAMSAC stations. On the y-axis, the stations are located 1 TECU apart. In the figure, a scale has been plotted for reference.
Figure 19.
Reference day. Temporal variations of the differential vertical total electron content (DVTEC) of the 14 RAMSAC stations. On the y-axis, the stations are located 1 TECU apart. In the figure, a scale has been plotted for reference.
Figure 20.
Day with AEA. Temporal variations of the differential vertical total electron content (DVTEC) of the 14 RAMSAC stations. On the y-axis, the stations are located 1 TECU apart. In the figure, a scale has been plotted for reference. The stations with the largest observed deviations in DVTEC are delineated.
Figure 21.
Maps of the 14 RAMSAC stations for the reference day (left image) and for the AEA day (right image). In the map of the day with AEA, we plot on the 0.2° by 0.2° grid the lightning count, and indicate with stars the locations of the highest peak currents for intracloud (IC) and Cloud-to-Ground (CG) discharges. In both maps, we represent with colored diamonds the peak-to-peak DVTEC amplitude values.
Figure 22.
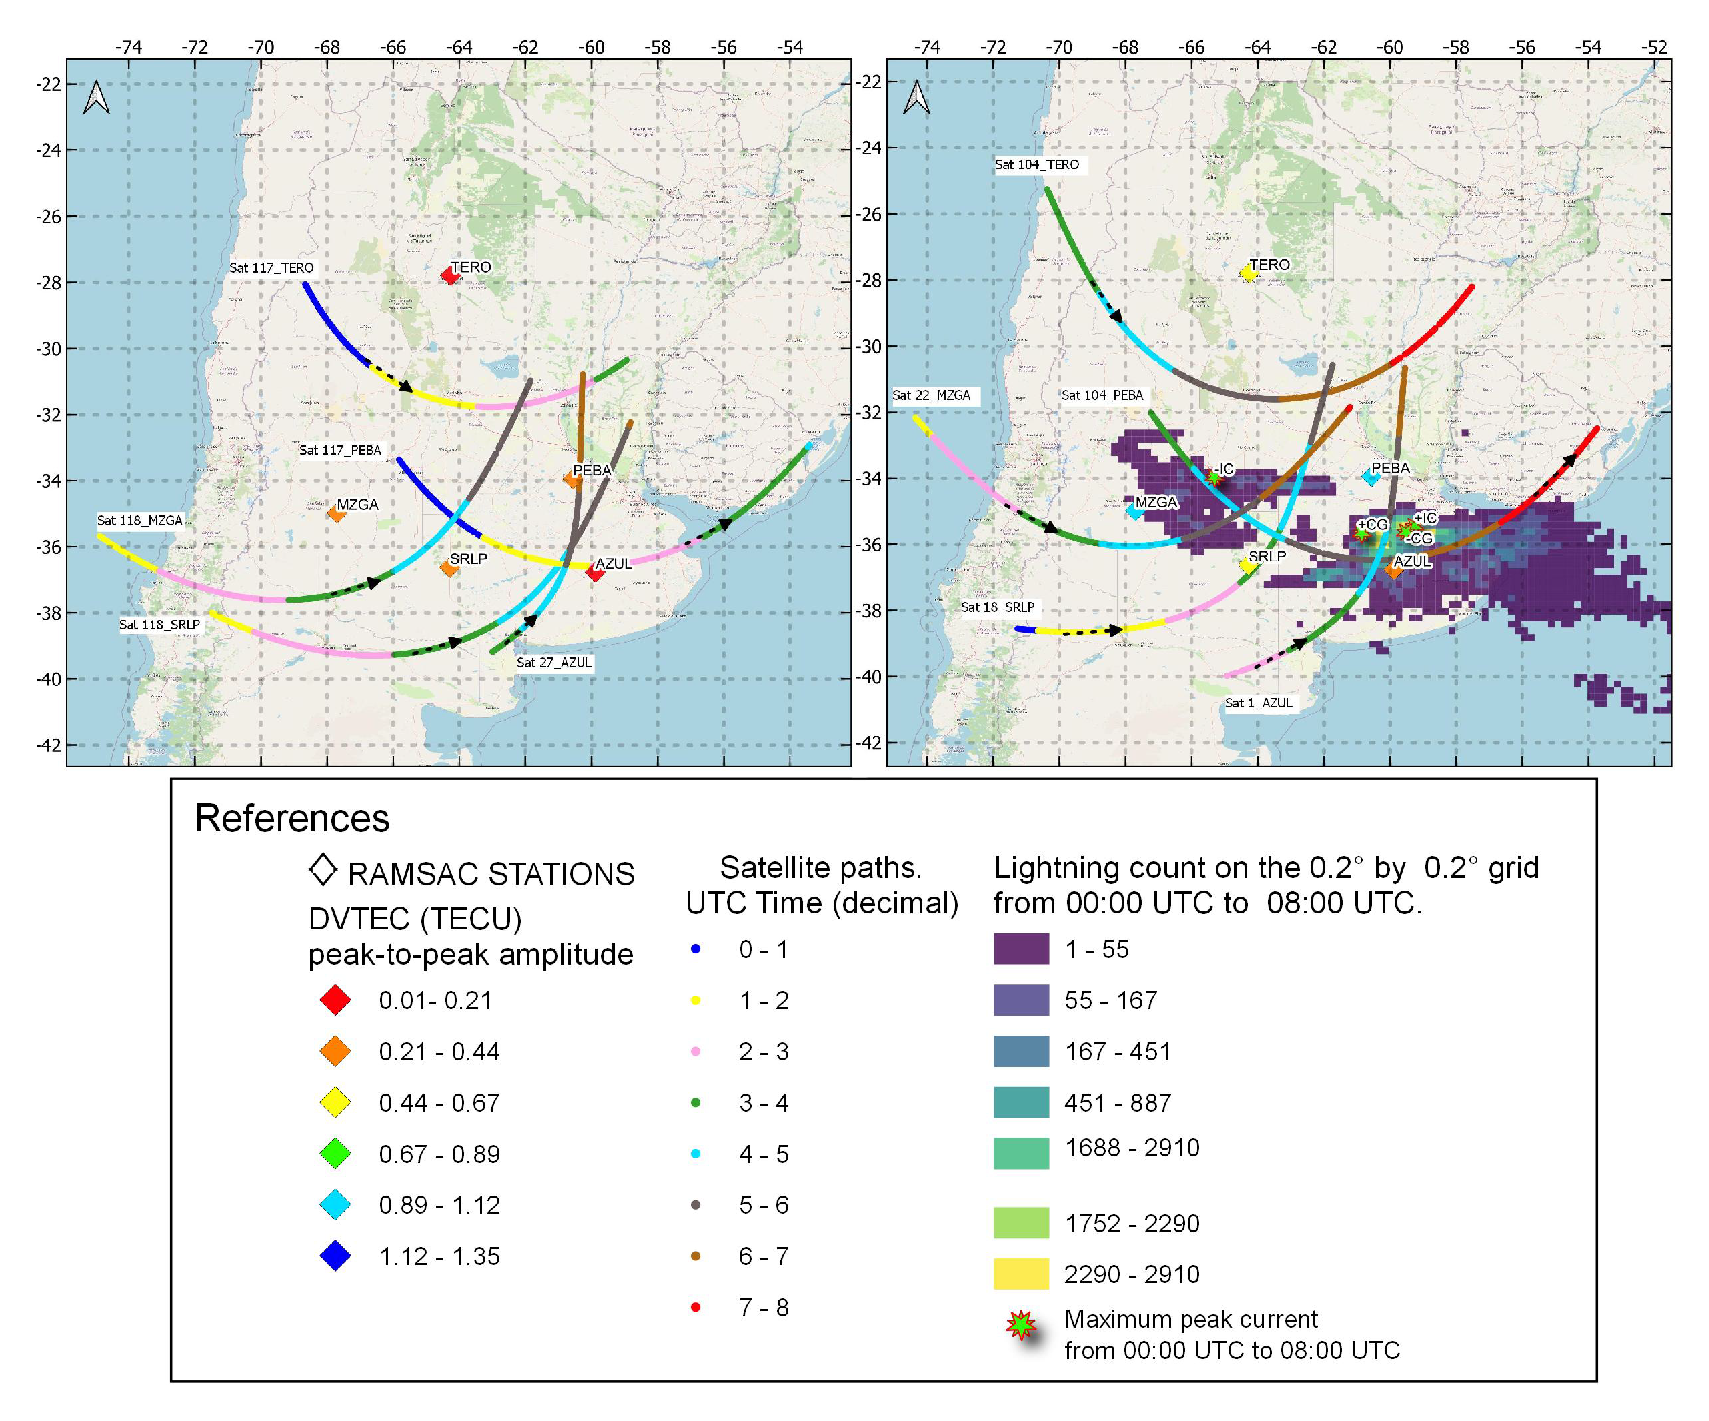
Maps of the 5 RAMSAC stations. The map on the left corresponds to September 9 and the one on the right to November 10, 2018. With colored dots, the trajectory in time followed by satellites 1, 18, 22, 27, 104, 117, and 118 are plotted. In both maps, we represent with colored diamonds the peak-to-peak DVTEC amplitude values. On the November 10 map, lightning count is plotted on the 0.2° by 0.2° grid, and locations, where the highest current peaks occurred for IntraCloud (IC) and Cloud-to-Ground (CG) discharges, are indicated with stars.
Figure 23.
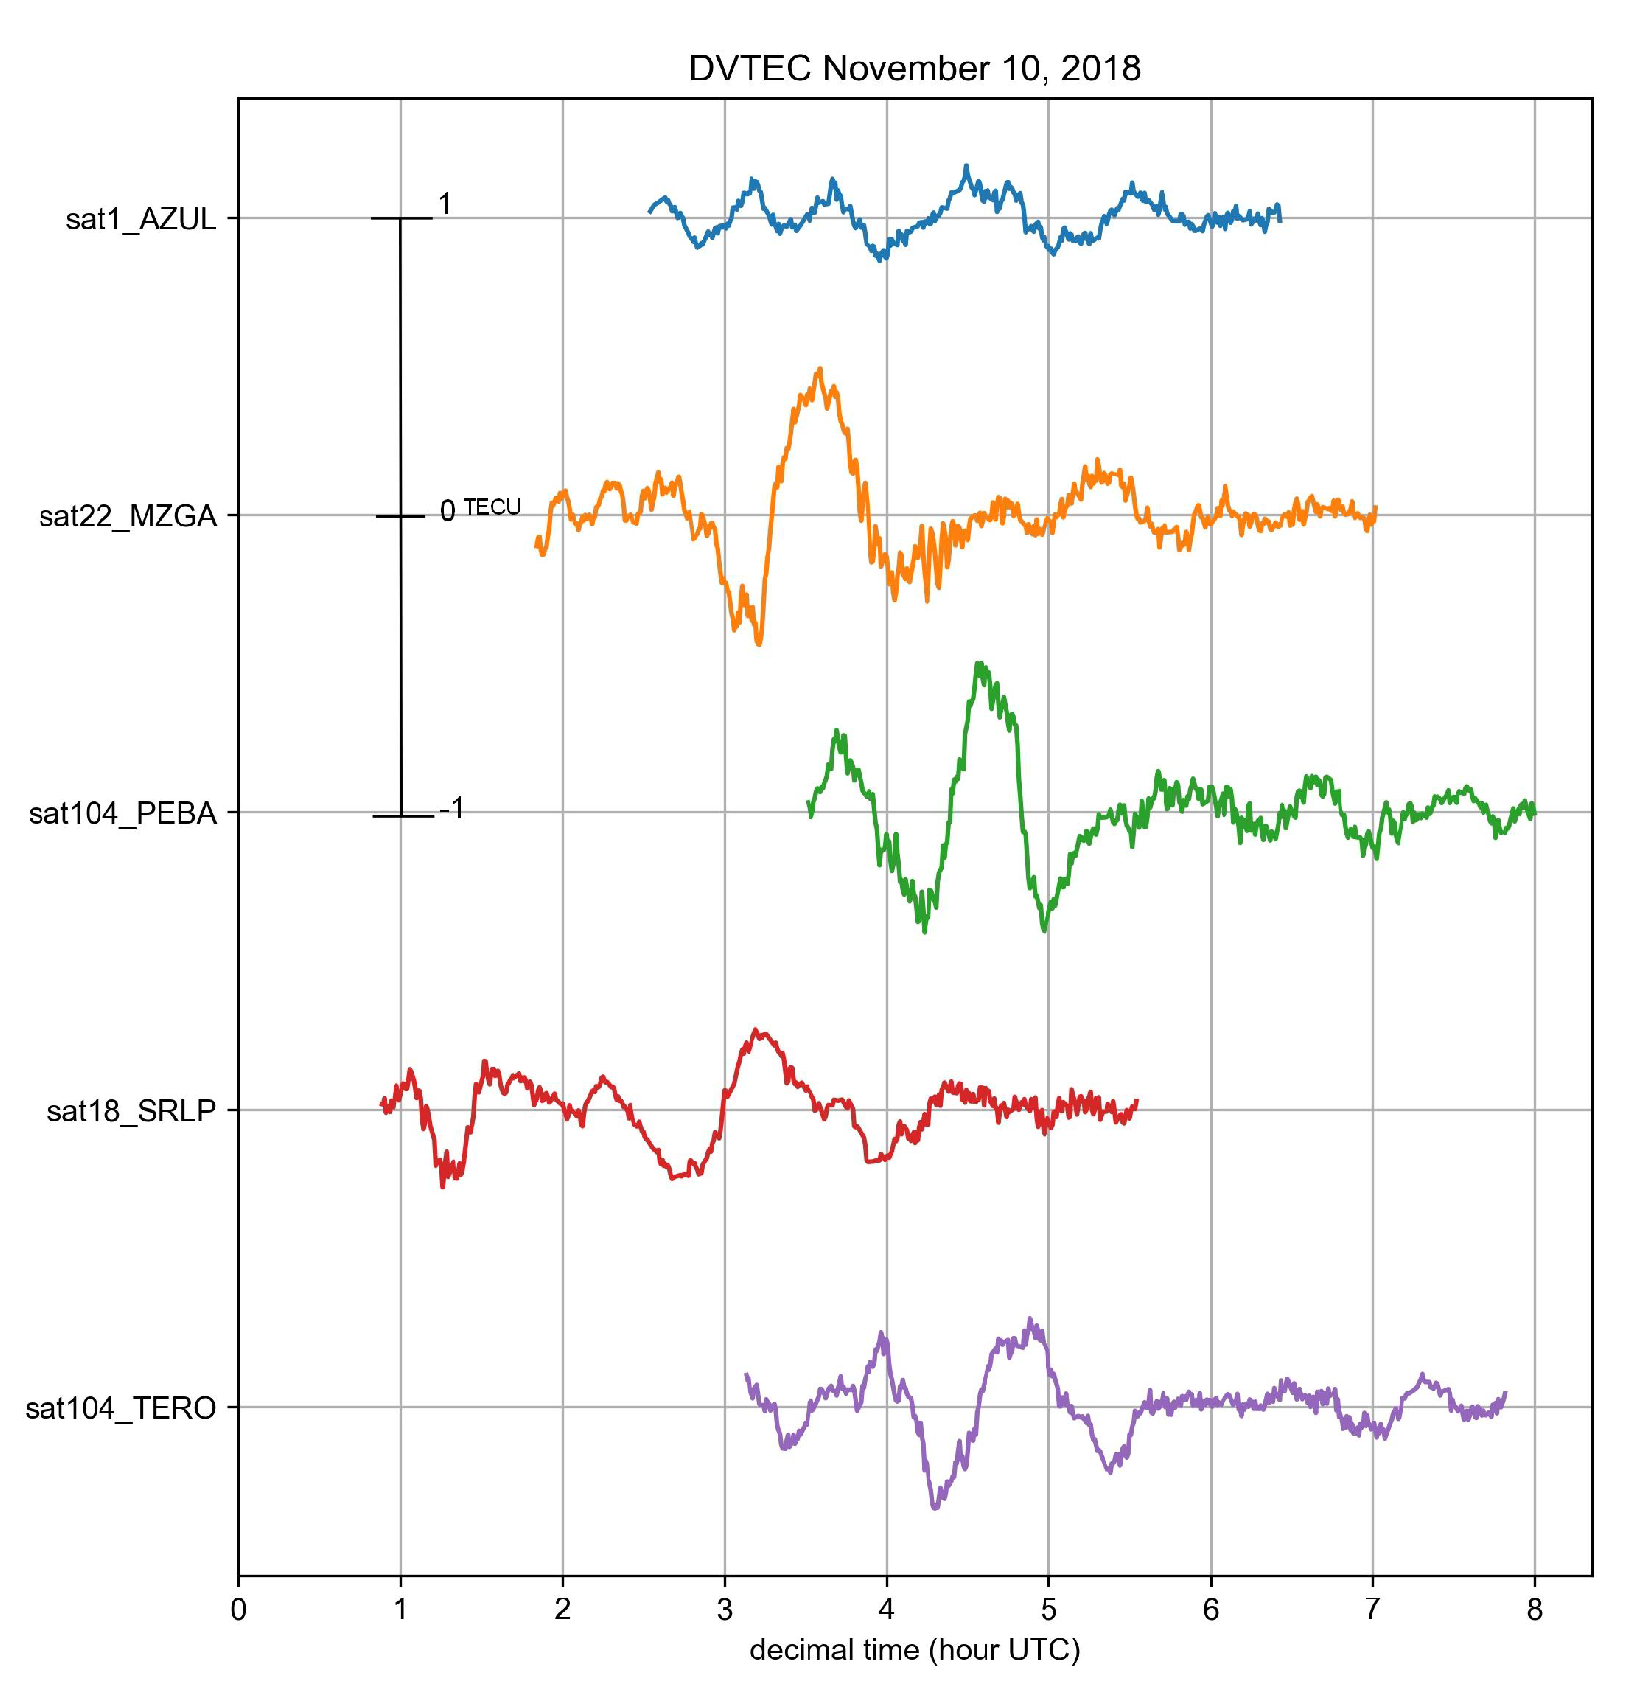
Reference day. Temporal variations of the differential vertical total electron content (DVTEC) of the 5 RAMSAC stations. On the y-axis, the stations are located 1 TECU apart. A scale has been plotted in the figure for reference.
Figure 23.
Reference day. Temporal variations of the differential vertical total electron content (DVTEC) of the 5 RAMSAC stations. On the y-axis, the stations are located 1 TECU apart. A scale has been plotted in the figure for reference.
Figure 24.
Day with AEA. Temporal variations of the differential vertical total electron content (DVTEC) of the 5 RAMSAC stations. On the y-axis, the stations are located 1 TECU apart. A scale has been plotted in the figure for reference.
Figure 24.
Day with AEA. Temporal variations of the differential vertical total electron content (DVTEC) of the 5 RAMSAC stations. On the y-axis, the stations are located 1 TECU apart. A scale has been plotted in the figure for reference.
Figure 25.
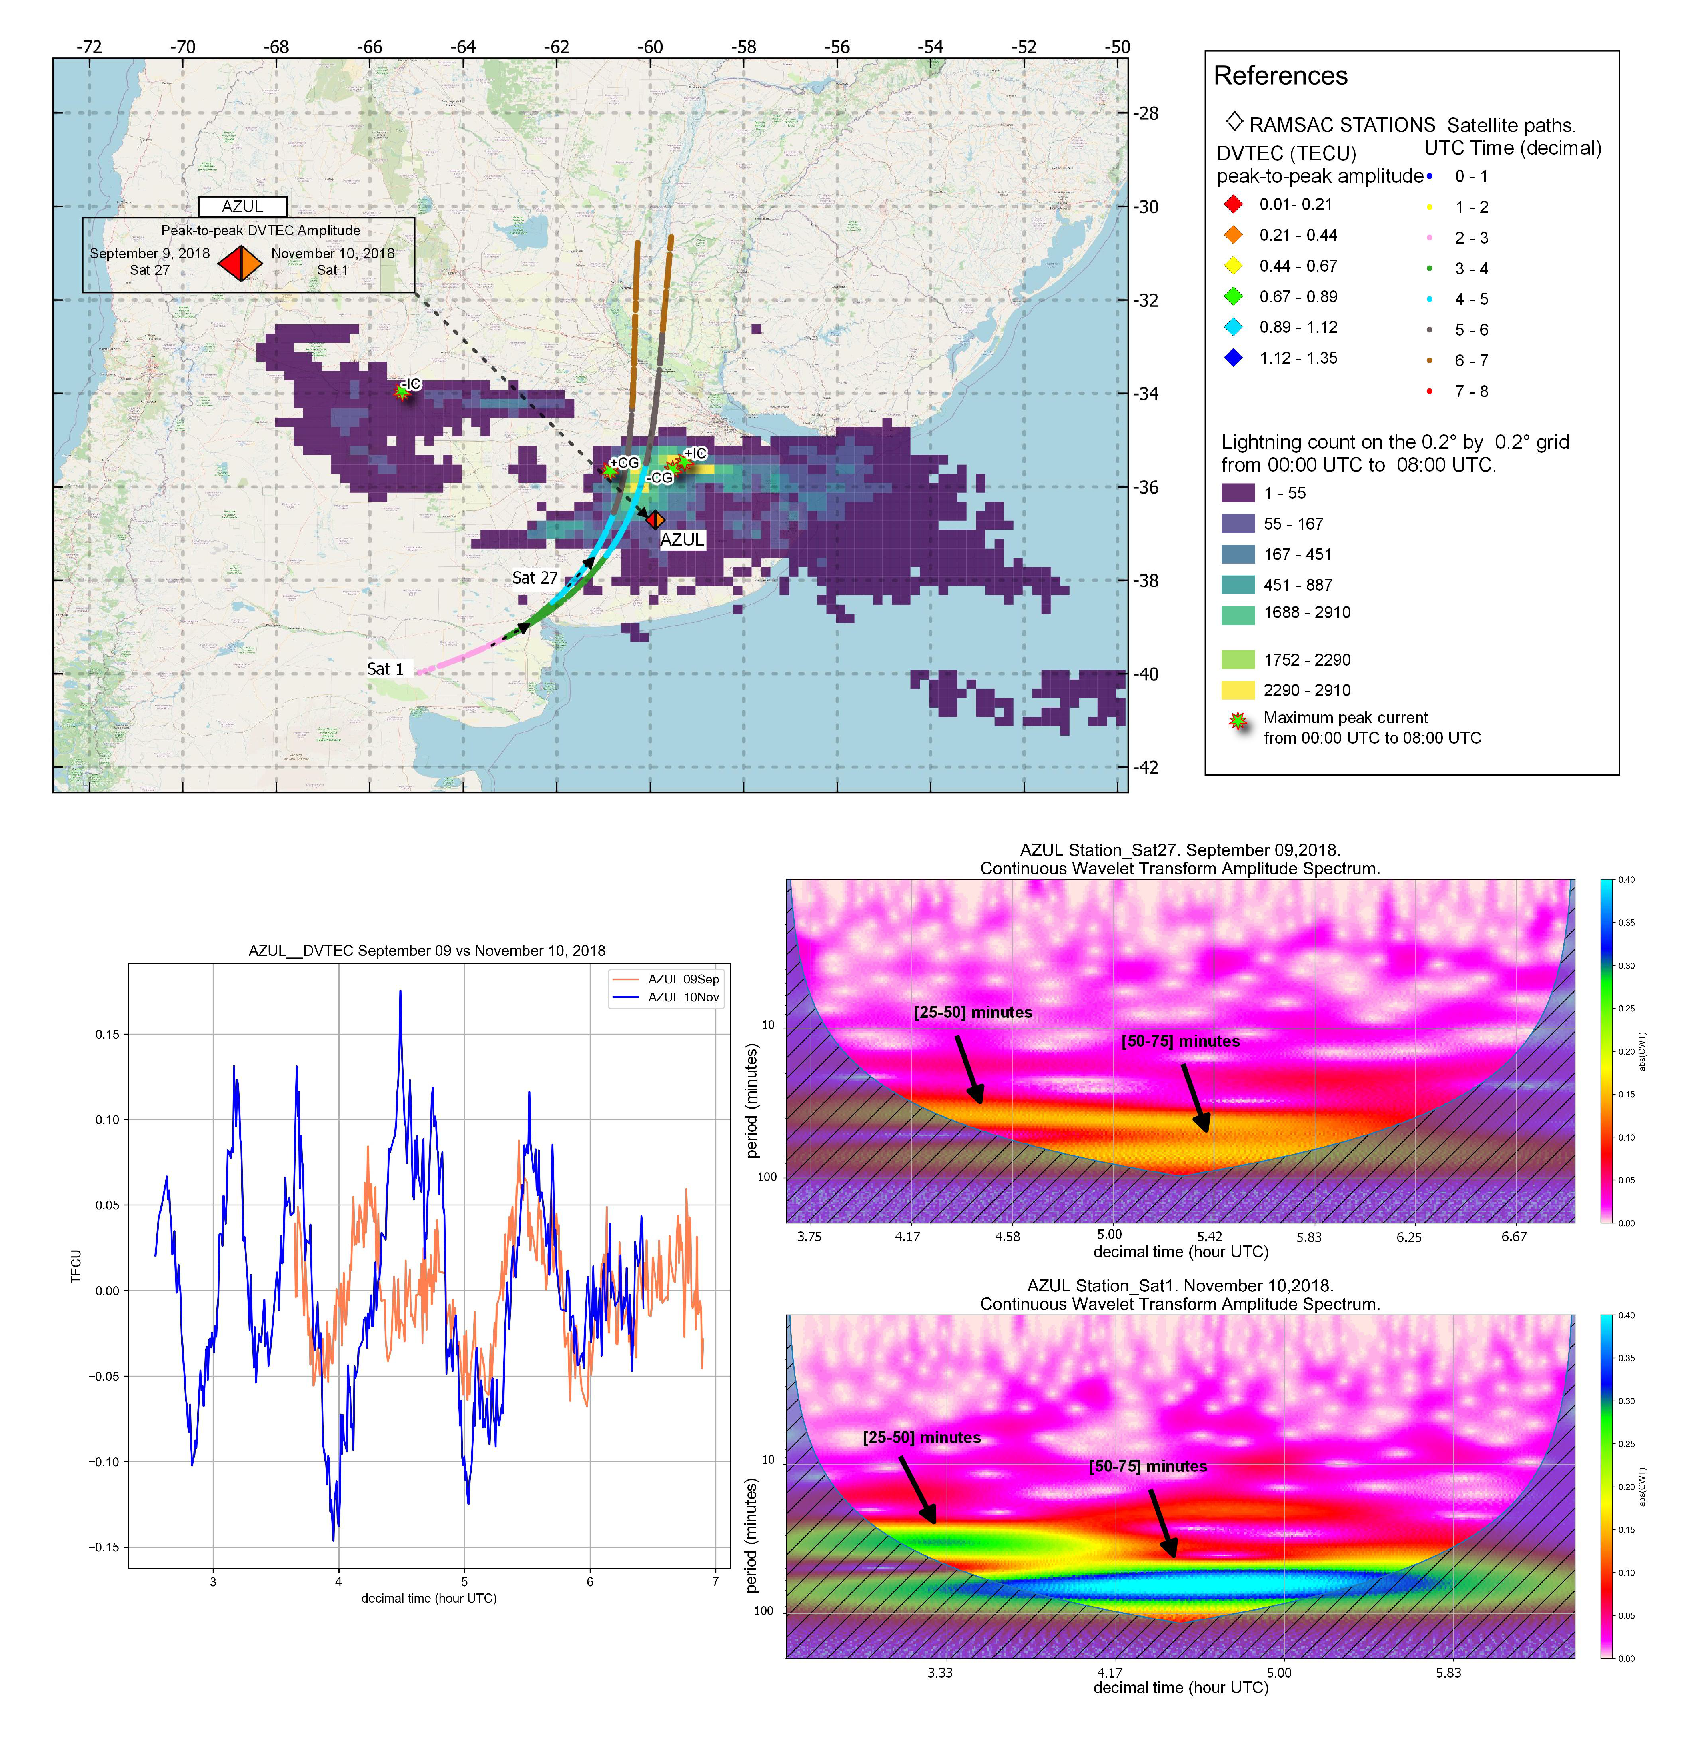
AZUL station, top panel: Station location with peak-to-peak DVTEC amplitude value plotted with colored diamonds; and satellite trajectory as a function of time for the reference day (September 9) and for the day with AEA (November 10). Lightning counts are plotted on the 0.2° by 0.2° grid, and the locations of the highest current peaks for IntraCloud (IC) and Cloud-to-Ground (CG) discharges are indicated with stars. Bottom panel: DVTEC time variations and periodogram (continuous wavelet transform) for both days are plotted. In the periodogram with arrows, the period obtained is marked.
Figure 26.
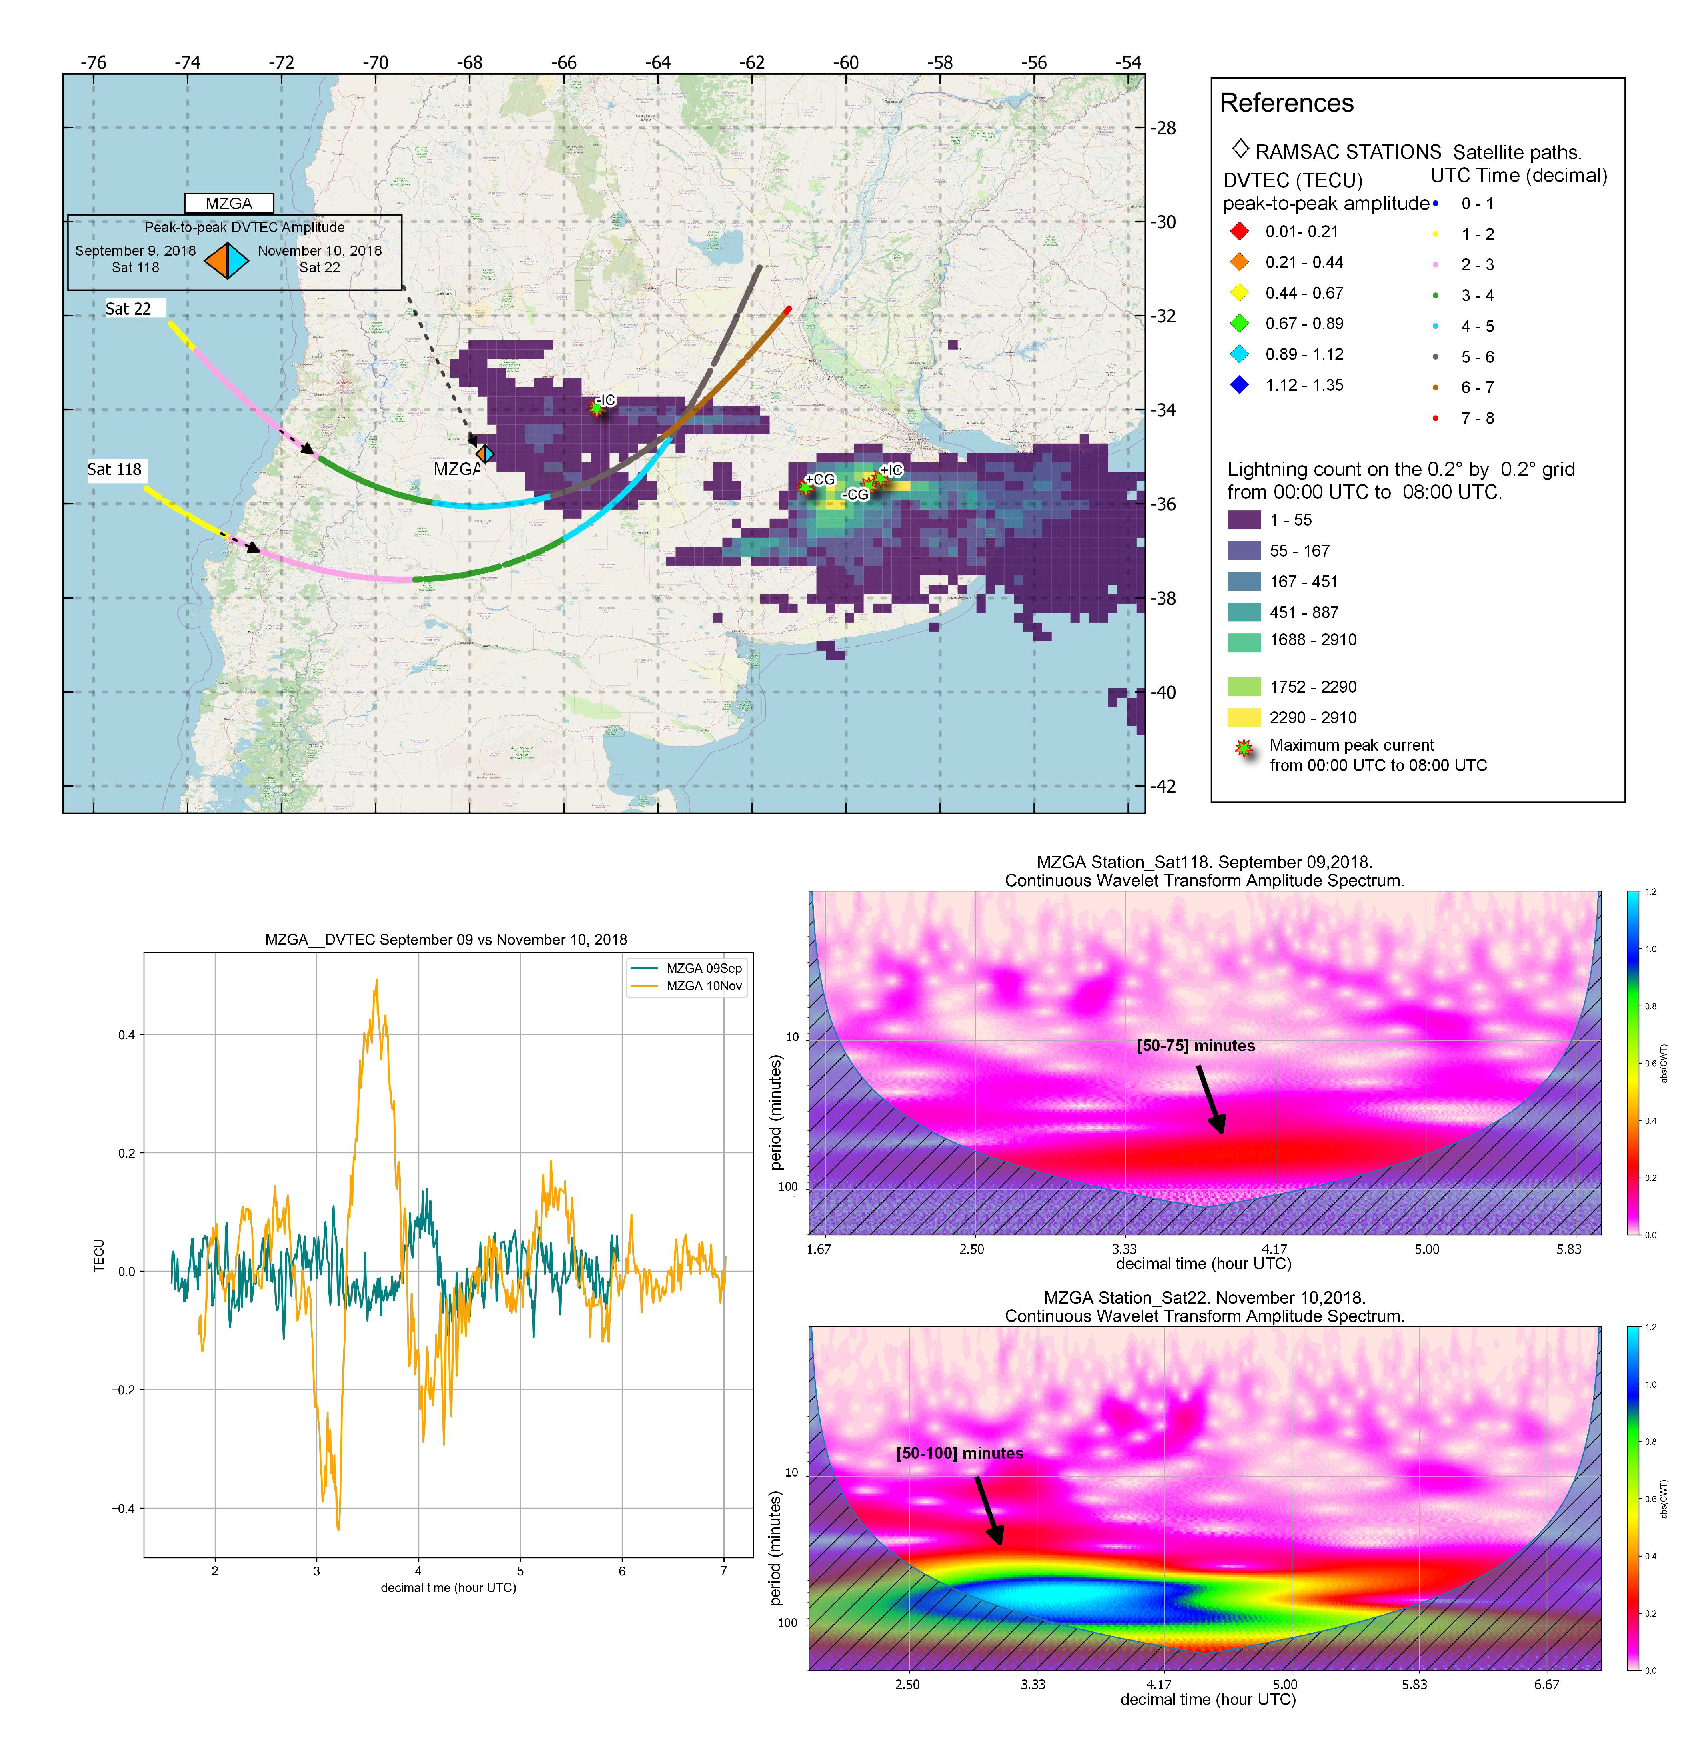
MZGA station, top panel: Station location with peak-to-peak DVTEC amplitude value plotted with colored diamonds; and satellite trajectory as a function of time for the reference day (September 9) and for the day with AEA (November 10). Lightning counts are plotted on the 0.2° by 0.2° grid, and the locations of the highest current peaks for IntraCloud (IC) and Cloud-to-Ground (CG) discharges are indicated with stars. Bottom panel: DVTEC time variations and periodogram (continuous wavelet transform) for both days are plotted. In the periodogram with arrows, the period obtained is marked.
Figure 27.
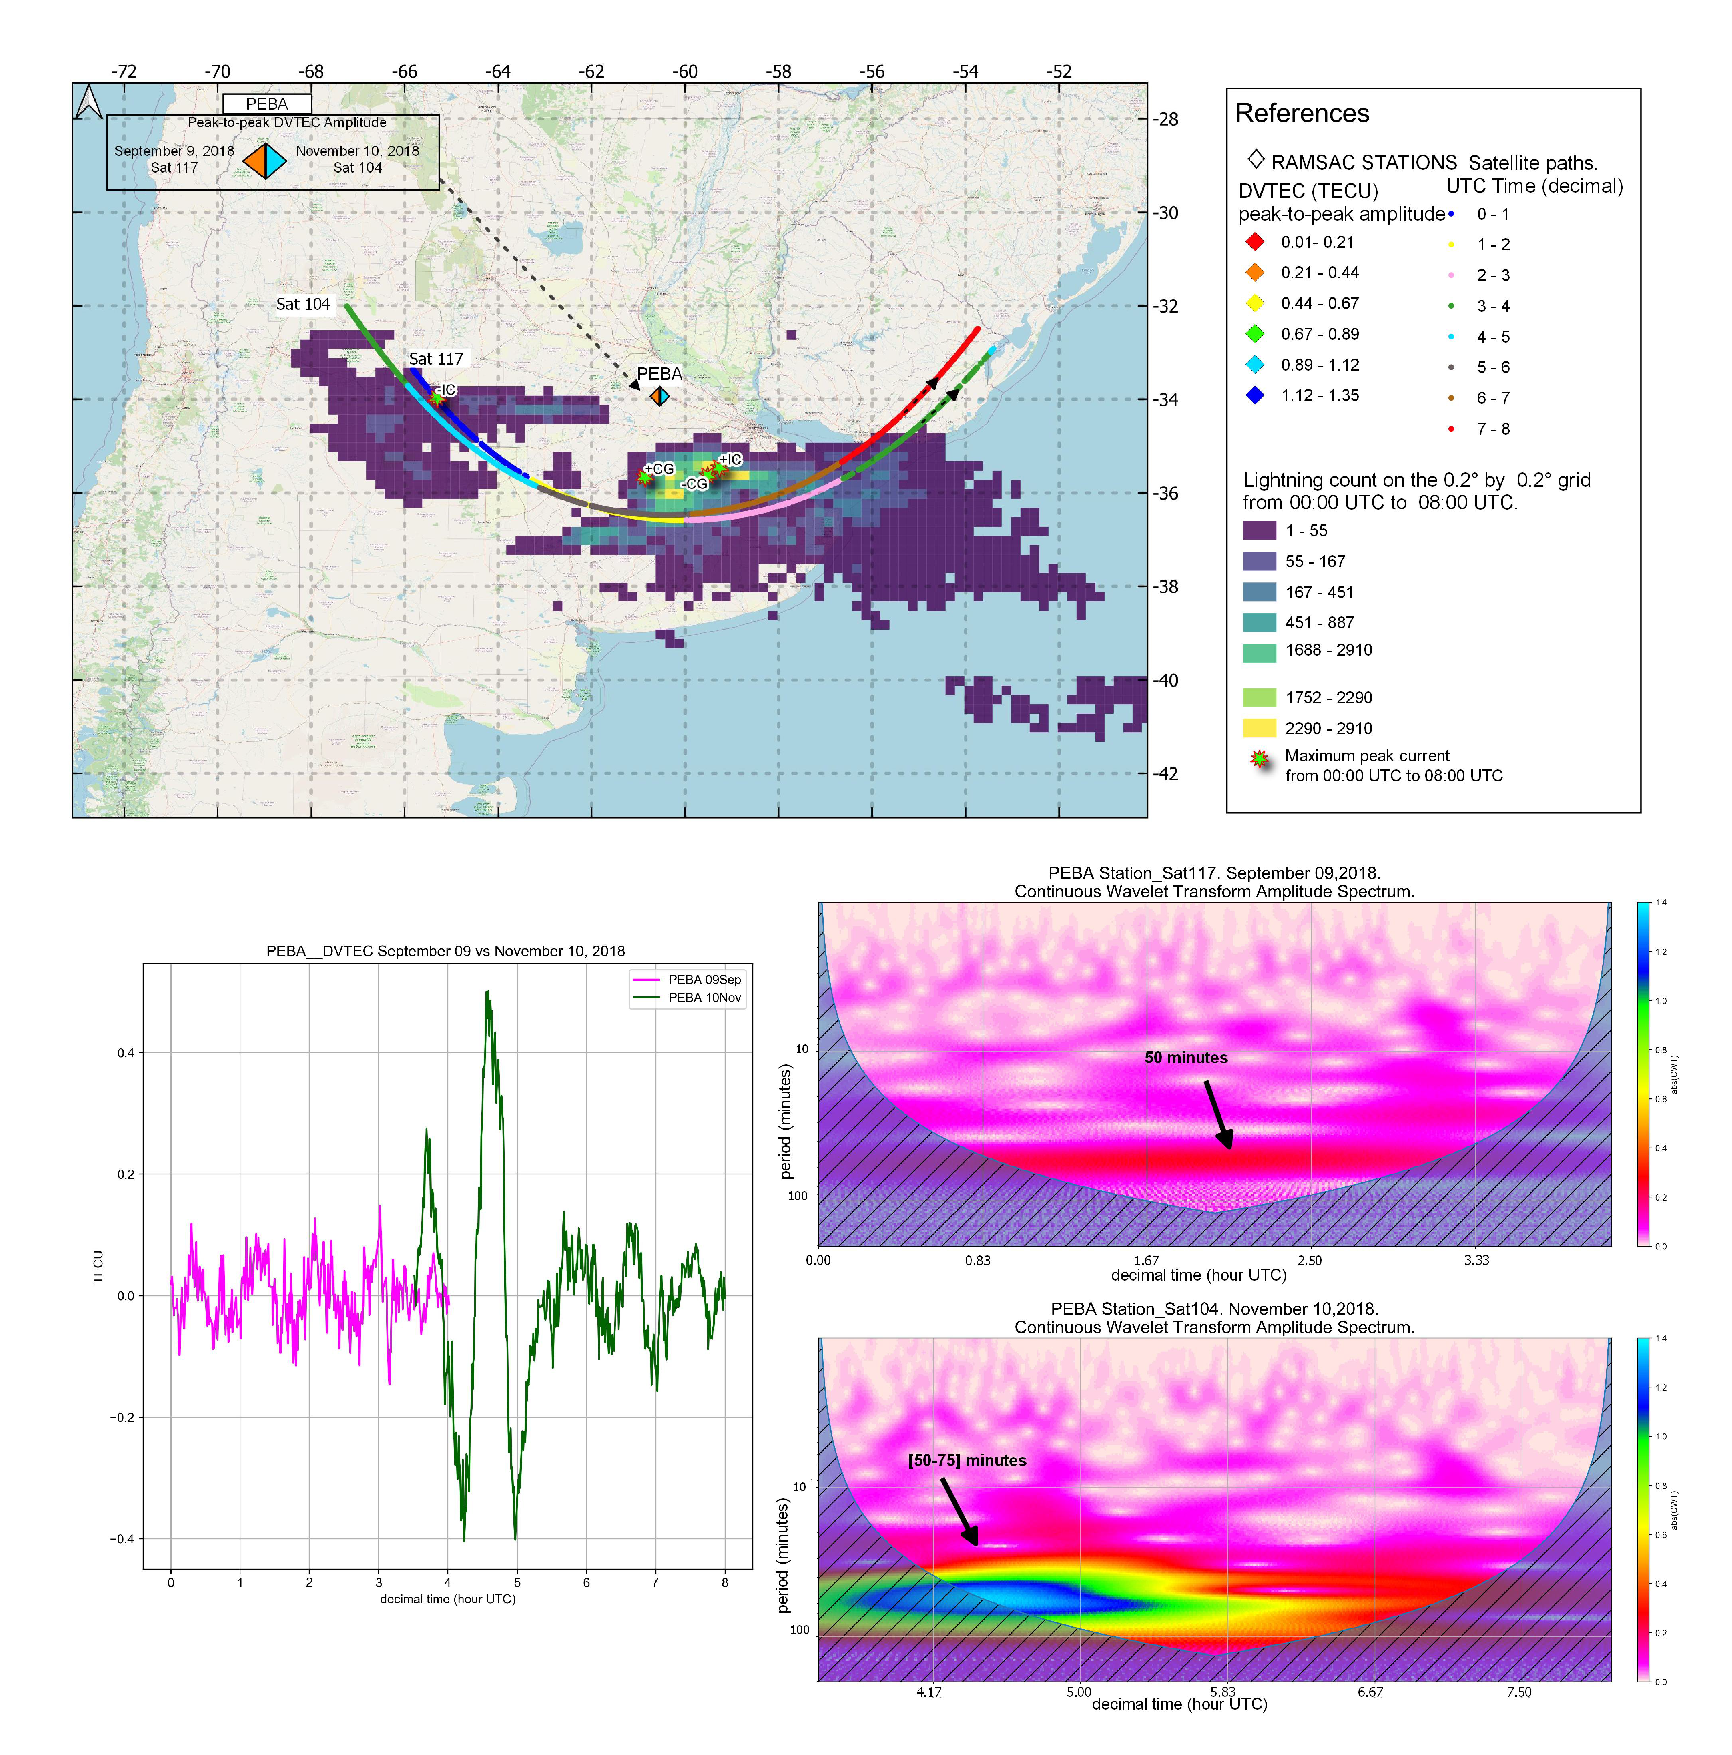
PEBA station, top panel: Station location with peak-to-peak DVTEC amplitude value plotted with colored diamonds; and satellite trajectory as a function of time for the reference day (September 9) and for the day with AEA (November 10). Lightning counts are plotted on the 0.2° by 0.2° grid, and the locations of the highest current peaks for IntraCloud (IC) and Cloud-to-Ground (CG) discharges are indicated with stars. Bottom panel: DVTEC time variations and periodogram (continuous wavelet transform) for both days are plotted. In the periodogram with arrows, the period obtained is marked.
Figure 28.
SRLP station, top panel: Station location with peak-to-peak DVTEC amplitude value plotted with colored diamonds; and satellite trajectory as a function of time for the reference day (September 9) and for the day with AEA (November 10). Lightning counts are plotted on the 0.2° by 0.2° grid, and the locations of the highest current peaks for IntraCloud (IC) and Cloud-to-Ground (CG) discharges are indicated with stars. Bottom panel: DVTEC time variations and periodogram (continuous wavelet transform) for both days are plotted. In the periodogram with arrows, the period obtained is marked.
Figure 29.
TERO station, top panel: Station location with peak-to-peak DVTEC amplitude value plotted with colored diamonds; and satellite trajectory as a function of time for the reference day (September 9) and for the day with AEA (November 10). Lightning counts are plotted on the 0.2° by 0.2° grid, and the locations of the highest current peaks for IntraCloud (IC) and Cloud-to-Ground (CG) discharges are indicated with stars. Bottom panel: DVTEC time variations and periodogram (continuous wavelet transform) for both days are plotted. In the periodogram with arrows, the period obtained is marked.
Table 1.
Statistical table of estimated peak current from 00:00 UTC to 08:00 UTC (21:00 LT - 05:00 LT).
Table 1.
Statistical table of estimated peak current from 00:00 UTC to 08:00 UTC (21:00 LT - 05:00 LT).
| |
Peak currents (kA) |
|
| Types of discharges |
Average |
Maximum |
Minimum |
|
| - IC |
-9.55 |
-29.99 |
-1.69 |
|
| + IC |
10.89 |
29.99 |
1.42 |
|
| - CG |
-16.46 |
-267.25 |
-3.50 |
|
| + CG |
33.15 |
322.64 |
15.00 |
|
Table 2.
Statistical table of estimated peak current for each period of time.
Table 2.
Statistical table of estimated peak current for each period of time.
| |
Peak currents (kA) |
|
UTC
time period
|
00:00 - 02:40 |
02:40 - 05:20 |
05-:20 - 08:00 |
|
Types of
discharges
|
Avg |
Max |
Min |
Avg |
Max |
Min |
Avg |
Max |
Min |
|
| - IC |
-9.8 |
-29.9 |
-2.2 |
-9.1 |
-29.9 |
-1.7 |
-9.8 |
-29.9 |
-1.7 |
|
| + IC |
11.5 |
29.9 |
2.29 |
10.5 |
29.9 |
1.8 |
10.7 |
29.9 |
1.4 |
|
| - CG |
-15.8 |
-219.2 |
-3.5 |
-14.4 |
-214.13 |
-3.5 |
-20.2 |
-267.3 |
-3.5 |
|
| + CG |
31.5 |
181.5 |
15.0 |
34.0 |
211.1 |
15.0 |
33.9 |
322.6 |
15.0 |
|
Table 3.
Peak-to-peak DVTEC amplitude of the 14 RAMSAC stations, for the reference and storm day in the whole study period (00:00 UTC - 08:00 UTC).
Table 3.
Peak-to-peak DVTEC amplitude of the 14 RAMSAC stations, for the reference and storm day in the whole study period (00:00 UTC - 08:00 UTC).
| |
Peak-to-peak DVTEC Amplitude (TECU) |
|
| RAMSAC Stations |
Day without AEA
(Reference Day)
|
Day with AEA |
|
| AZUL |
0.16 |
0.32 |
|
| CHIM |
0.27 |
0.66 |
|
| CHOY |
0.31 |
0.87 |
|
| CORD |
0.2 |
0.53 |
|
|
ESQU
|
0.32 |
1.35 |
|
|
MZGA
|
0.26 |
0.93 |
|
| ORAN |
0.19 |
0.37 |
|
|
PEBA
|
0.29 |
0.91 |
|
|
RIO2
|
0.18 |
0.63 |
|
|
SAJA
|
0.2 |
0.65 |
|
| SRLP |
0.23 |
0.53 |
|
| SVIC |
0.25 |
0.4 |
|
|
TERO
|
0.21 |
0.64 |
|
| UNSJ |
0.21 |
0.55 |
|
