1. Introduction
“Mitochondria” was named by Carl Benda in 1898 to describe the threadlike granules found within the cytoplasm of eukaryotic cells [
1,
2]. Today, mitochondria are recognized as dynamic, ubiquitous organelles involved in various biological functions, including ATP synthesis, calcium signaling, metabolism, and apoptosis [
3,
4]. Mitochondrial DNA was first discovered in chick embryos by electron microscopy in 1963 [
5]. However, it was not until 1981 that the complete sequence of the first human mitochondrial DNA (mtDNA) was published and established as the mtDNA Cambridge Reference Sequence (CRS) [
6,
7]. Since then, the field of mitochondrial genomics has advanced rapidly and revolutionized matrilineal genetics, mitochondrial pathologies and oncogenetics, providing insights into human evolution, population genetics, and disease mechanisms [
7,
8,
9,
10,
11,
12].
Mitochondria presumably originated as ancestral bacteria that were engulfed and integrated within host cells over 1.5 billion years ago [
13]. This widely accepted “Endosymbiotic Theory” is supported by the presence of DNA (mitogenome) and a distinct RNA translation system within the eukaryotic cell [
12,
13,
14,
15]. The human mitogenome is a 16.6 kilobases (kb), double-stranded, circular DNA separate from the nuclear genome and matrilineally inherited [
6,
16,
17]. It contains 37 genes, including 13 protein-coding genes, 22 transfer RNA (tRNA) genes, and 2 ribosomal RNA (rRNA) genes [
6,
16,
17]. The non-coding region or control region (CR) plays a crucial role in mitochondrial DNA replication and transcription. The hypervariable regions (HV-I, HV-II and HV-III) within the CR have a higher mutation rate than coding regions [
18,
19,
20]. Hence, the discriminative power of HV-polymorphisms has been exploited for maternal lineage tracing, population studies, and forensics [
18,
19,
20].
In 1987, Cann et al. published their groundbreaking discovery on lineage tracing of modern human mtDNA that led to a single tribe or “mother” in Africa, colloquially named, “Mitochondrial Eve” [
21]. Torroni et al. later used the terms “haplotypes” and “haplogroups” (haplotype clusters or lineages) in particular, “A” through “D” for the defining mtDNA polymorphisms of indigenous tribes who peopled the Americas [
22]. Today, next-generation sequencing (NGS) has revolutionized the field of mtDNA haplotyping. NGS enables rapid and cost-effective sequencing of the mitogenome, allowing for the identification of single nucleotide polymorphisms (SNP), insertions, deletions, and structural variants, providing a comprehensive view of mtDNA diversity [
18,
19,
20]. Over the last decade, the number of bioinformatics tools developed for mtDNA haplotyping has also increased [
23]. García-Olivares et al. evaluated 11 software programs all using the preeminent PhyloTree
mt (online compendium with >5,400 haplotypes) for classification [
23,
24]. The majority were exceptional, web-based tools using FASTA files as input [
23]. However, the primary drawback for users of these online programs is the disjointed steps, i.e., uploading FASTA files, downloading haplotyping results, and concatenating results to sample information. Furthermore, geographic origins associated with the haplogroups are not readily accessible to infer phylogeography and race/ethnicity. To consolidate and streamline these time-consuming steps, we developed and tested a customized mitogenome database embedded within an automated workflow for sequence analysis, read mapping, variant analysis, haplotyping and geo-mapping in CLC Genomics Workbench [
25]. Our findings demonstrate that the streamlined workflow is a rapid and accurate means of mtDNA sequence analysis to advance human mitogenomics for molecular anthropology, population genetics, and medical genetics.
2. Results
2.1. hMITO DB Haplogroup Distribution and Geographic Origins
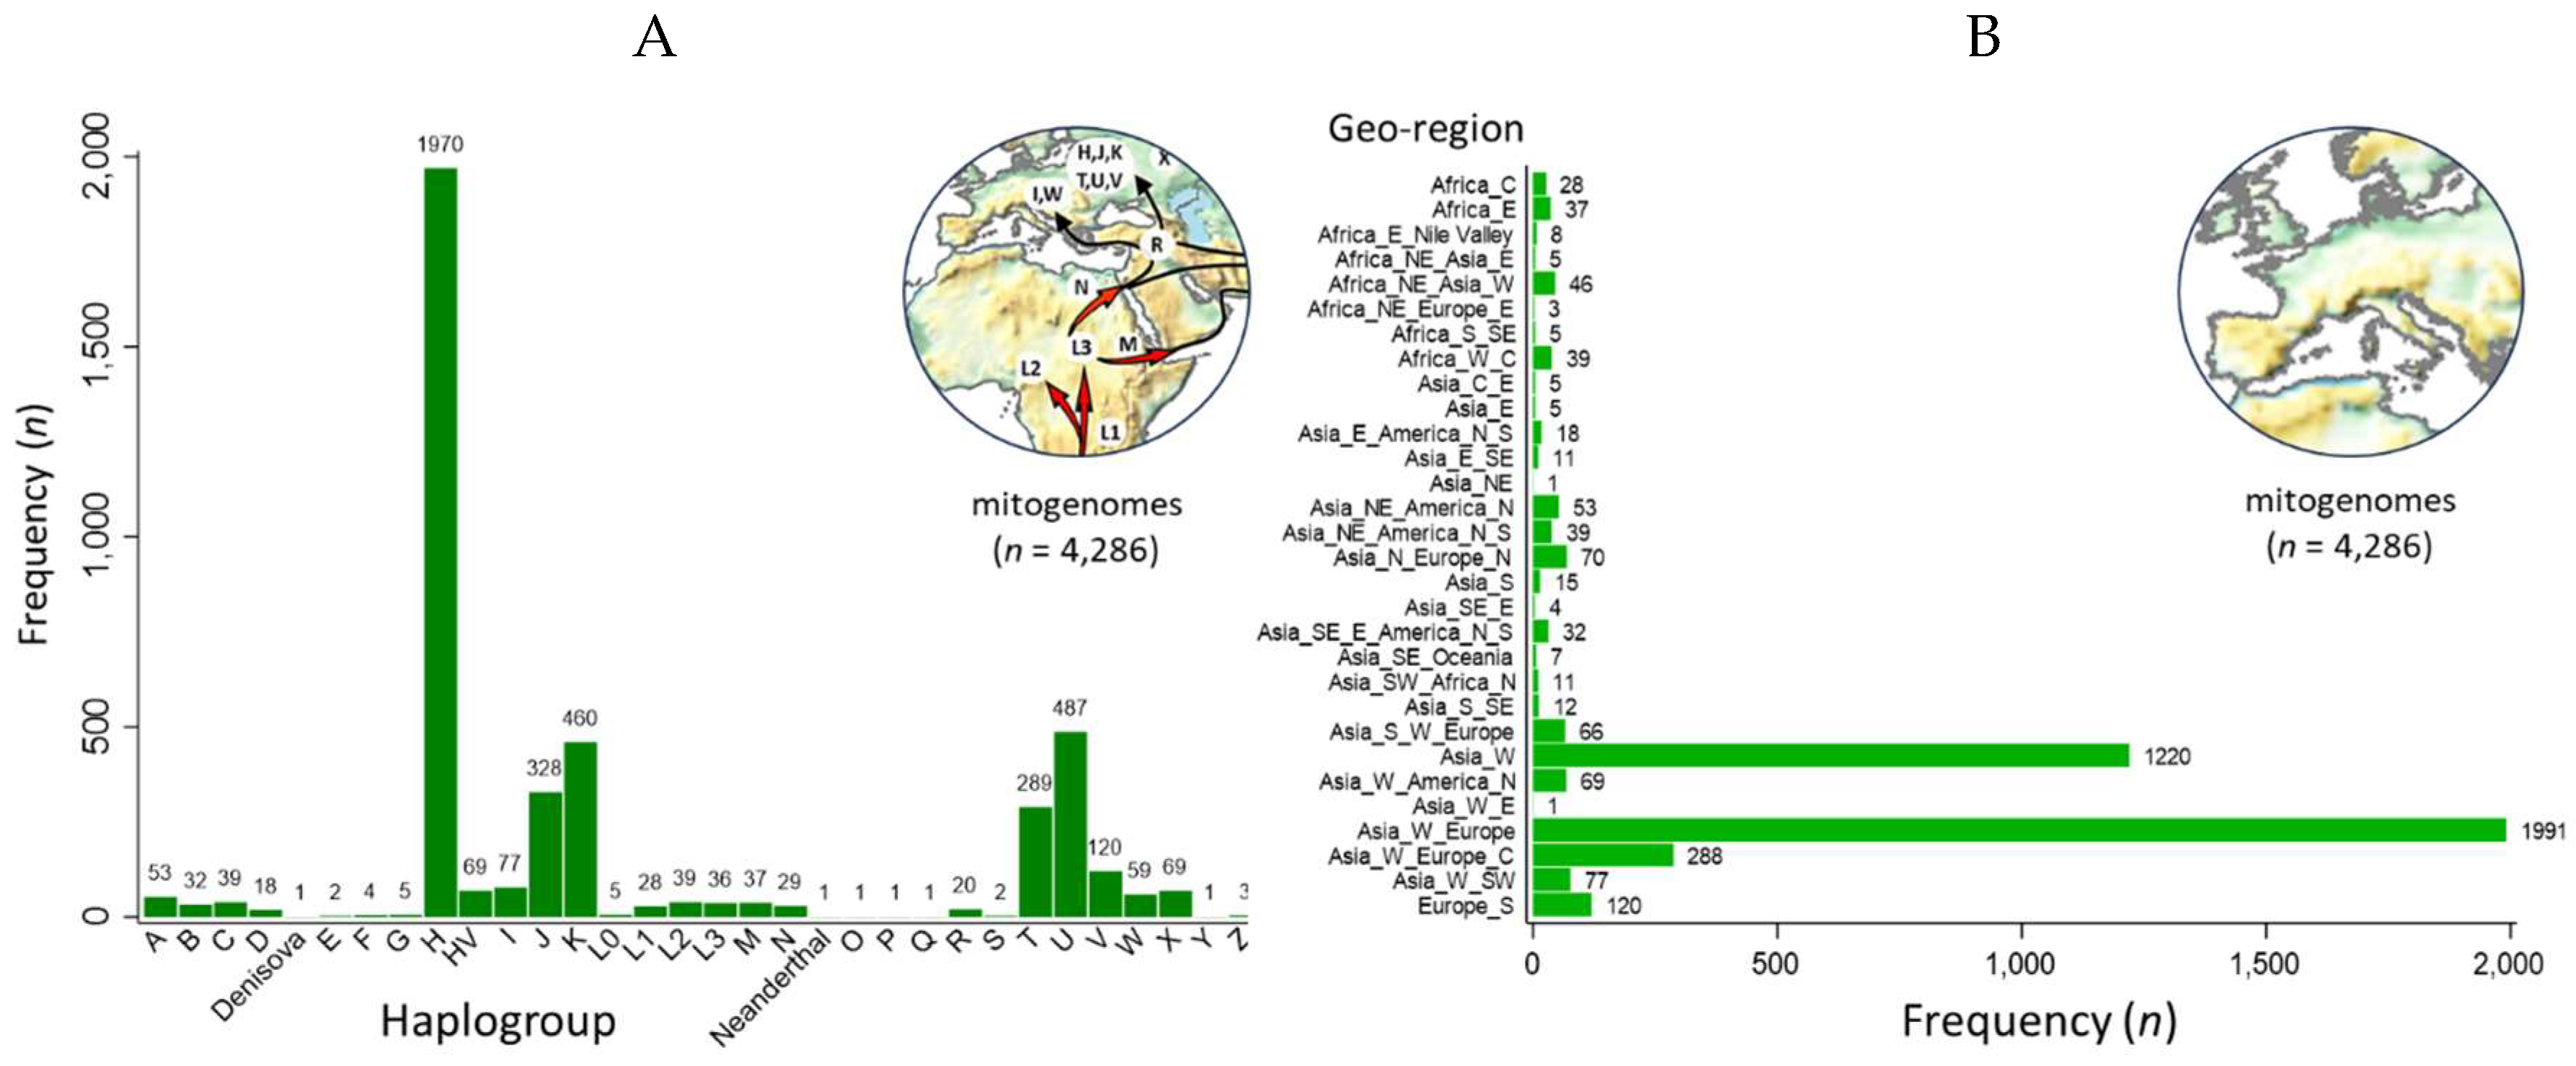
The hMITO DB was composed of 4,286 mitogenomes. The macro-haplogroups identified by MITOMASTER and/or Haplogrep 3 revealed five predominant haplogroups (H, J, K, T and U) (
Figure 1A) [
26,
27,
28,
29]. Since the majority of mitogenomes (
n = 4,265) were contributed by Behar et al., this dataset exhibited a non-parametric distribution with under representation from indigenous peoples living in remote and isolated regions of the world [
30]. The hMITO DB was supplemented with mitogenomes from haplogroups O, P, Q, S, and Y from indigenous peoples of Oceania and Siberia to achieve the full spectrum of macro-haplogroups (“A” through “Z”) [
31,
32,
33]. Like the haplogroup distribution, the geographic origin was dominated by Europe and West Asia with under representation from other continental regions (
Figure 1B). The biased distribution of haplogroup and geo-origin reflected the biased frequency of 59,389 human mitogenomes deposited in GenBank [
27].
2.1.1. Phylogenetic Tree of Representative Human Mitogenomes
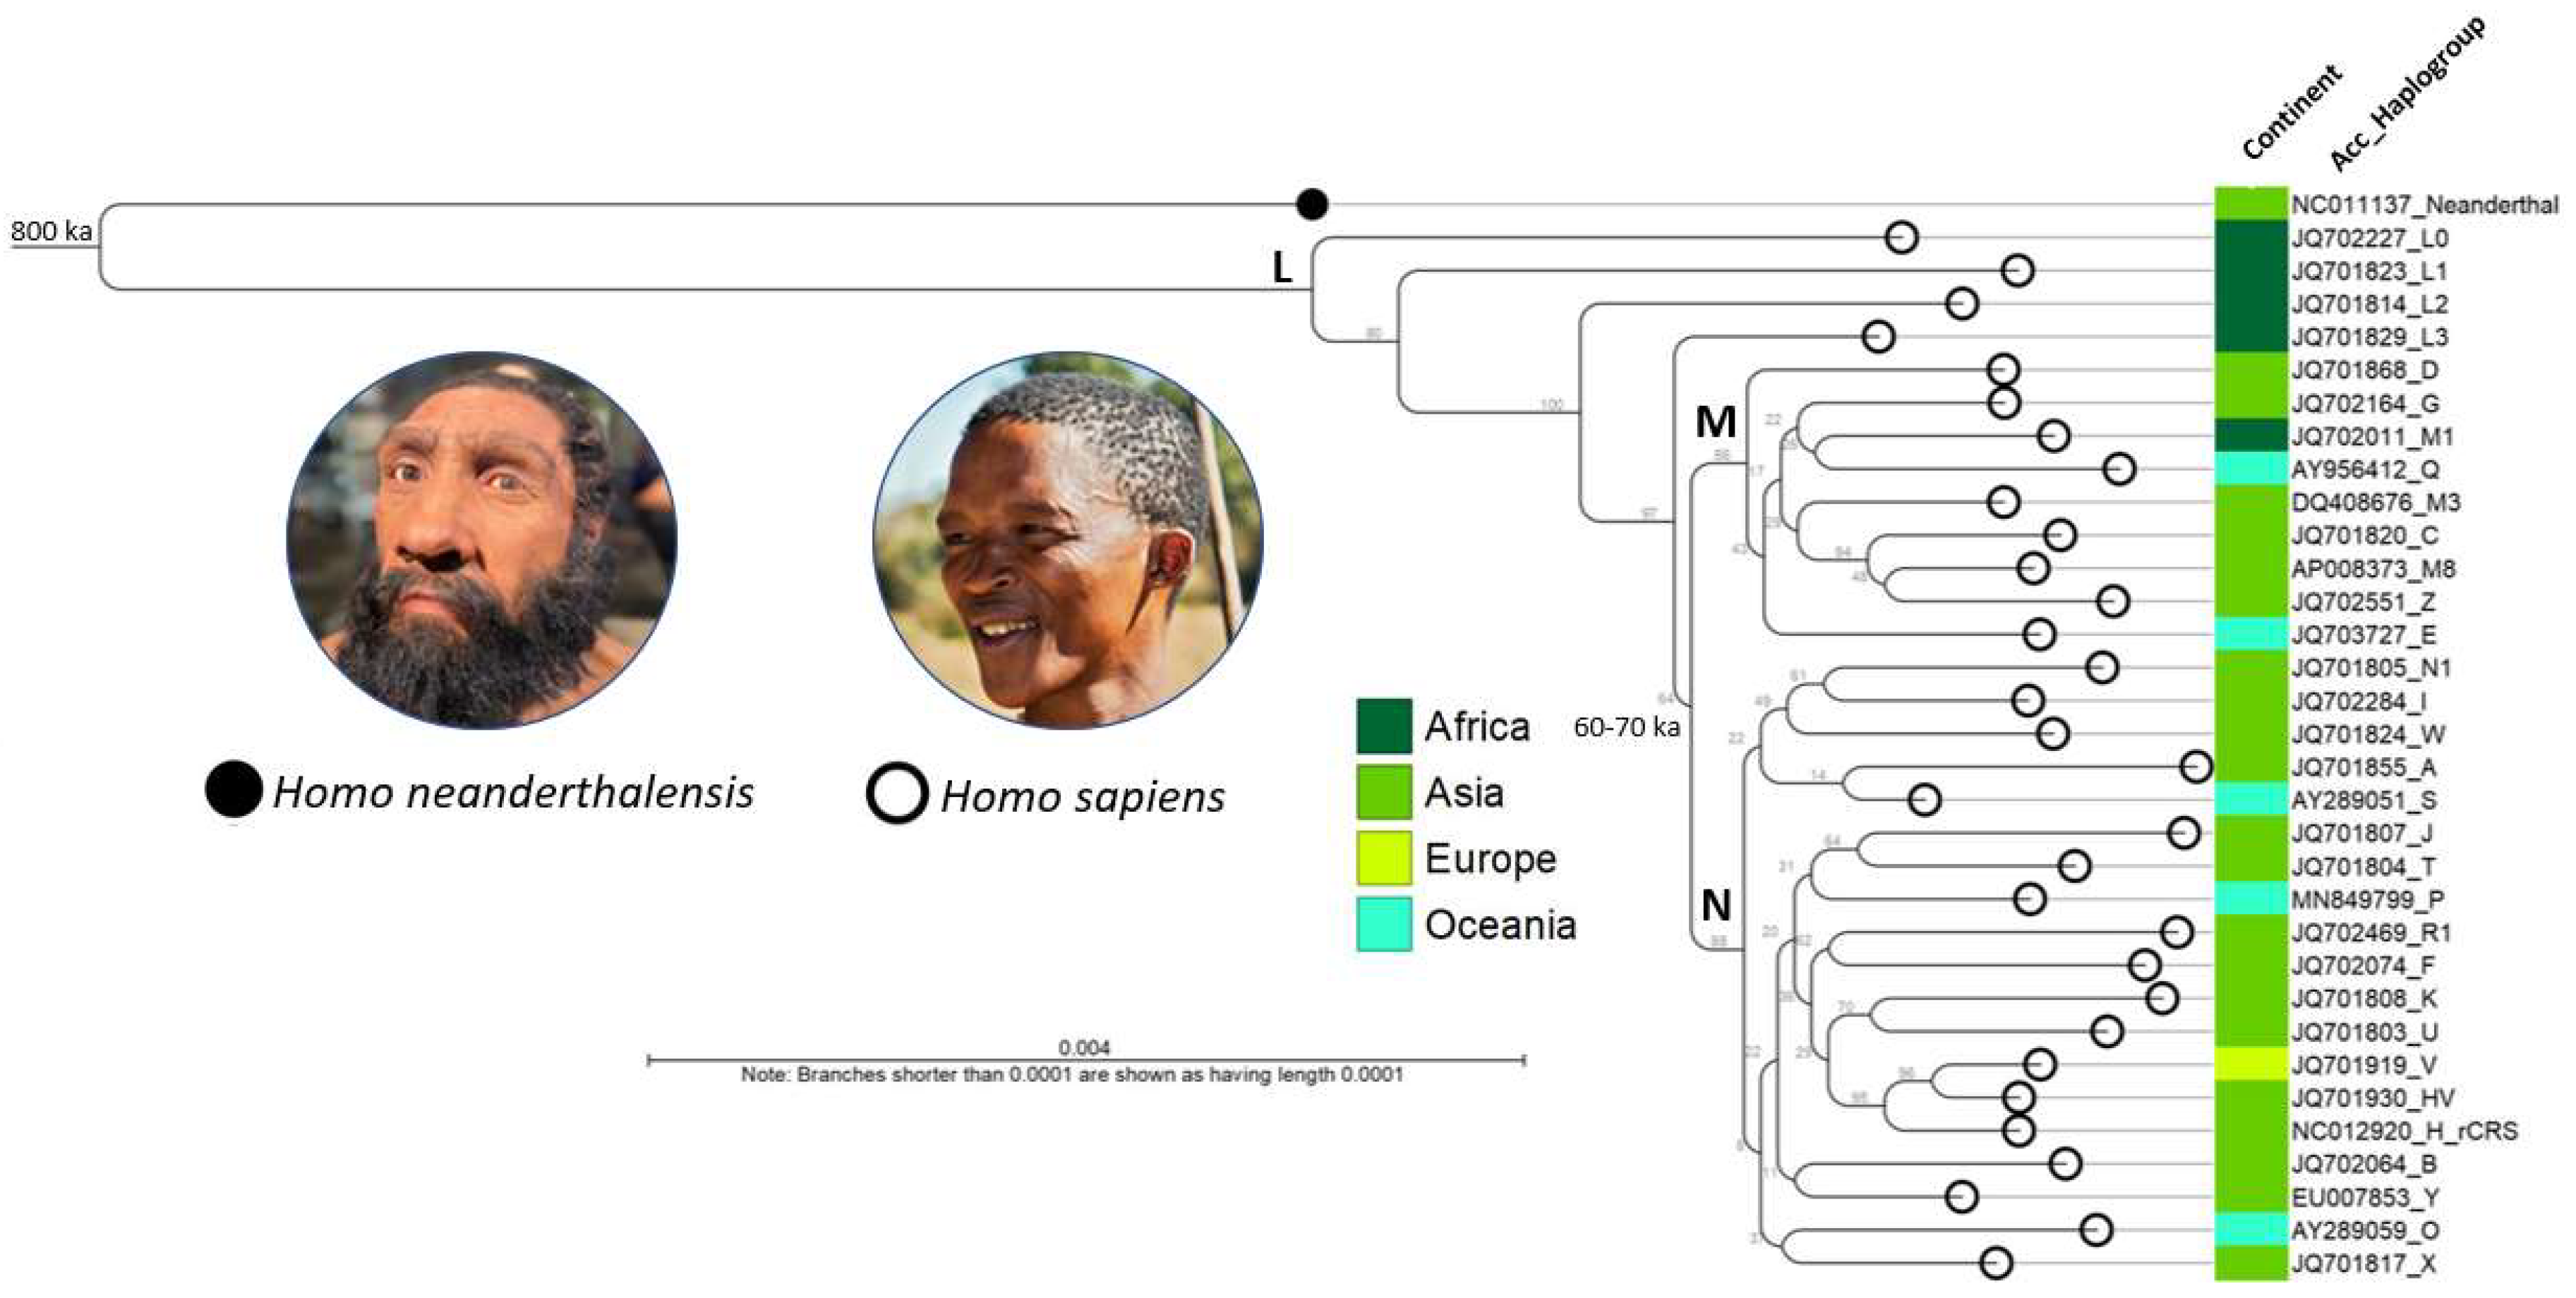
A neighbor joining (NJ) tree was constructed after alignment of the mitogenomes of Homo neanderthalensis RefSeq, revised Cambridge Reference Sequence (rCRS), and major haplogroups, A through Z (n = 31) from the hMITO DB (
Figure 2) [
6,
34]. The rooted tree shows the Neanderthal-modern human divergence which transpired circa 800 ka
(800,000 years ago) [34,35}. The metadata decorated tree reveals the phylogenetic, temporal and spatial relationships between haplogroups. The tree is consistent with the out-of-Africa hypothesis and dispersal along the “Southern” (coastal) and “Northern” routes as shown by the respective macro-haplogroups M and N descending from L3 and branching out to distinct haplogroups [
30,
36]. The out-of-Africa migration and ensuing human expansion dates back to ~60-70,000 years ago [
30,
37]. Computationlly, the runtimes for the “create alignment” and “create tree” tools in CLC Genomics only took 28 min 20 sec and 5 sec, respectively to visualize our ancestral past.
2.2. Utility of hMITO DB for Sequence Analysis, Haplotyping, and Geo-Mapping of a mtDNA NGS dataset from Cervical Cytology Samples and Cancer Cell lines
2.2.1. Read Mapping and Visualization of Mapped Tracks
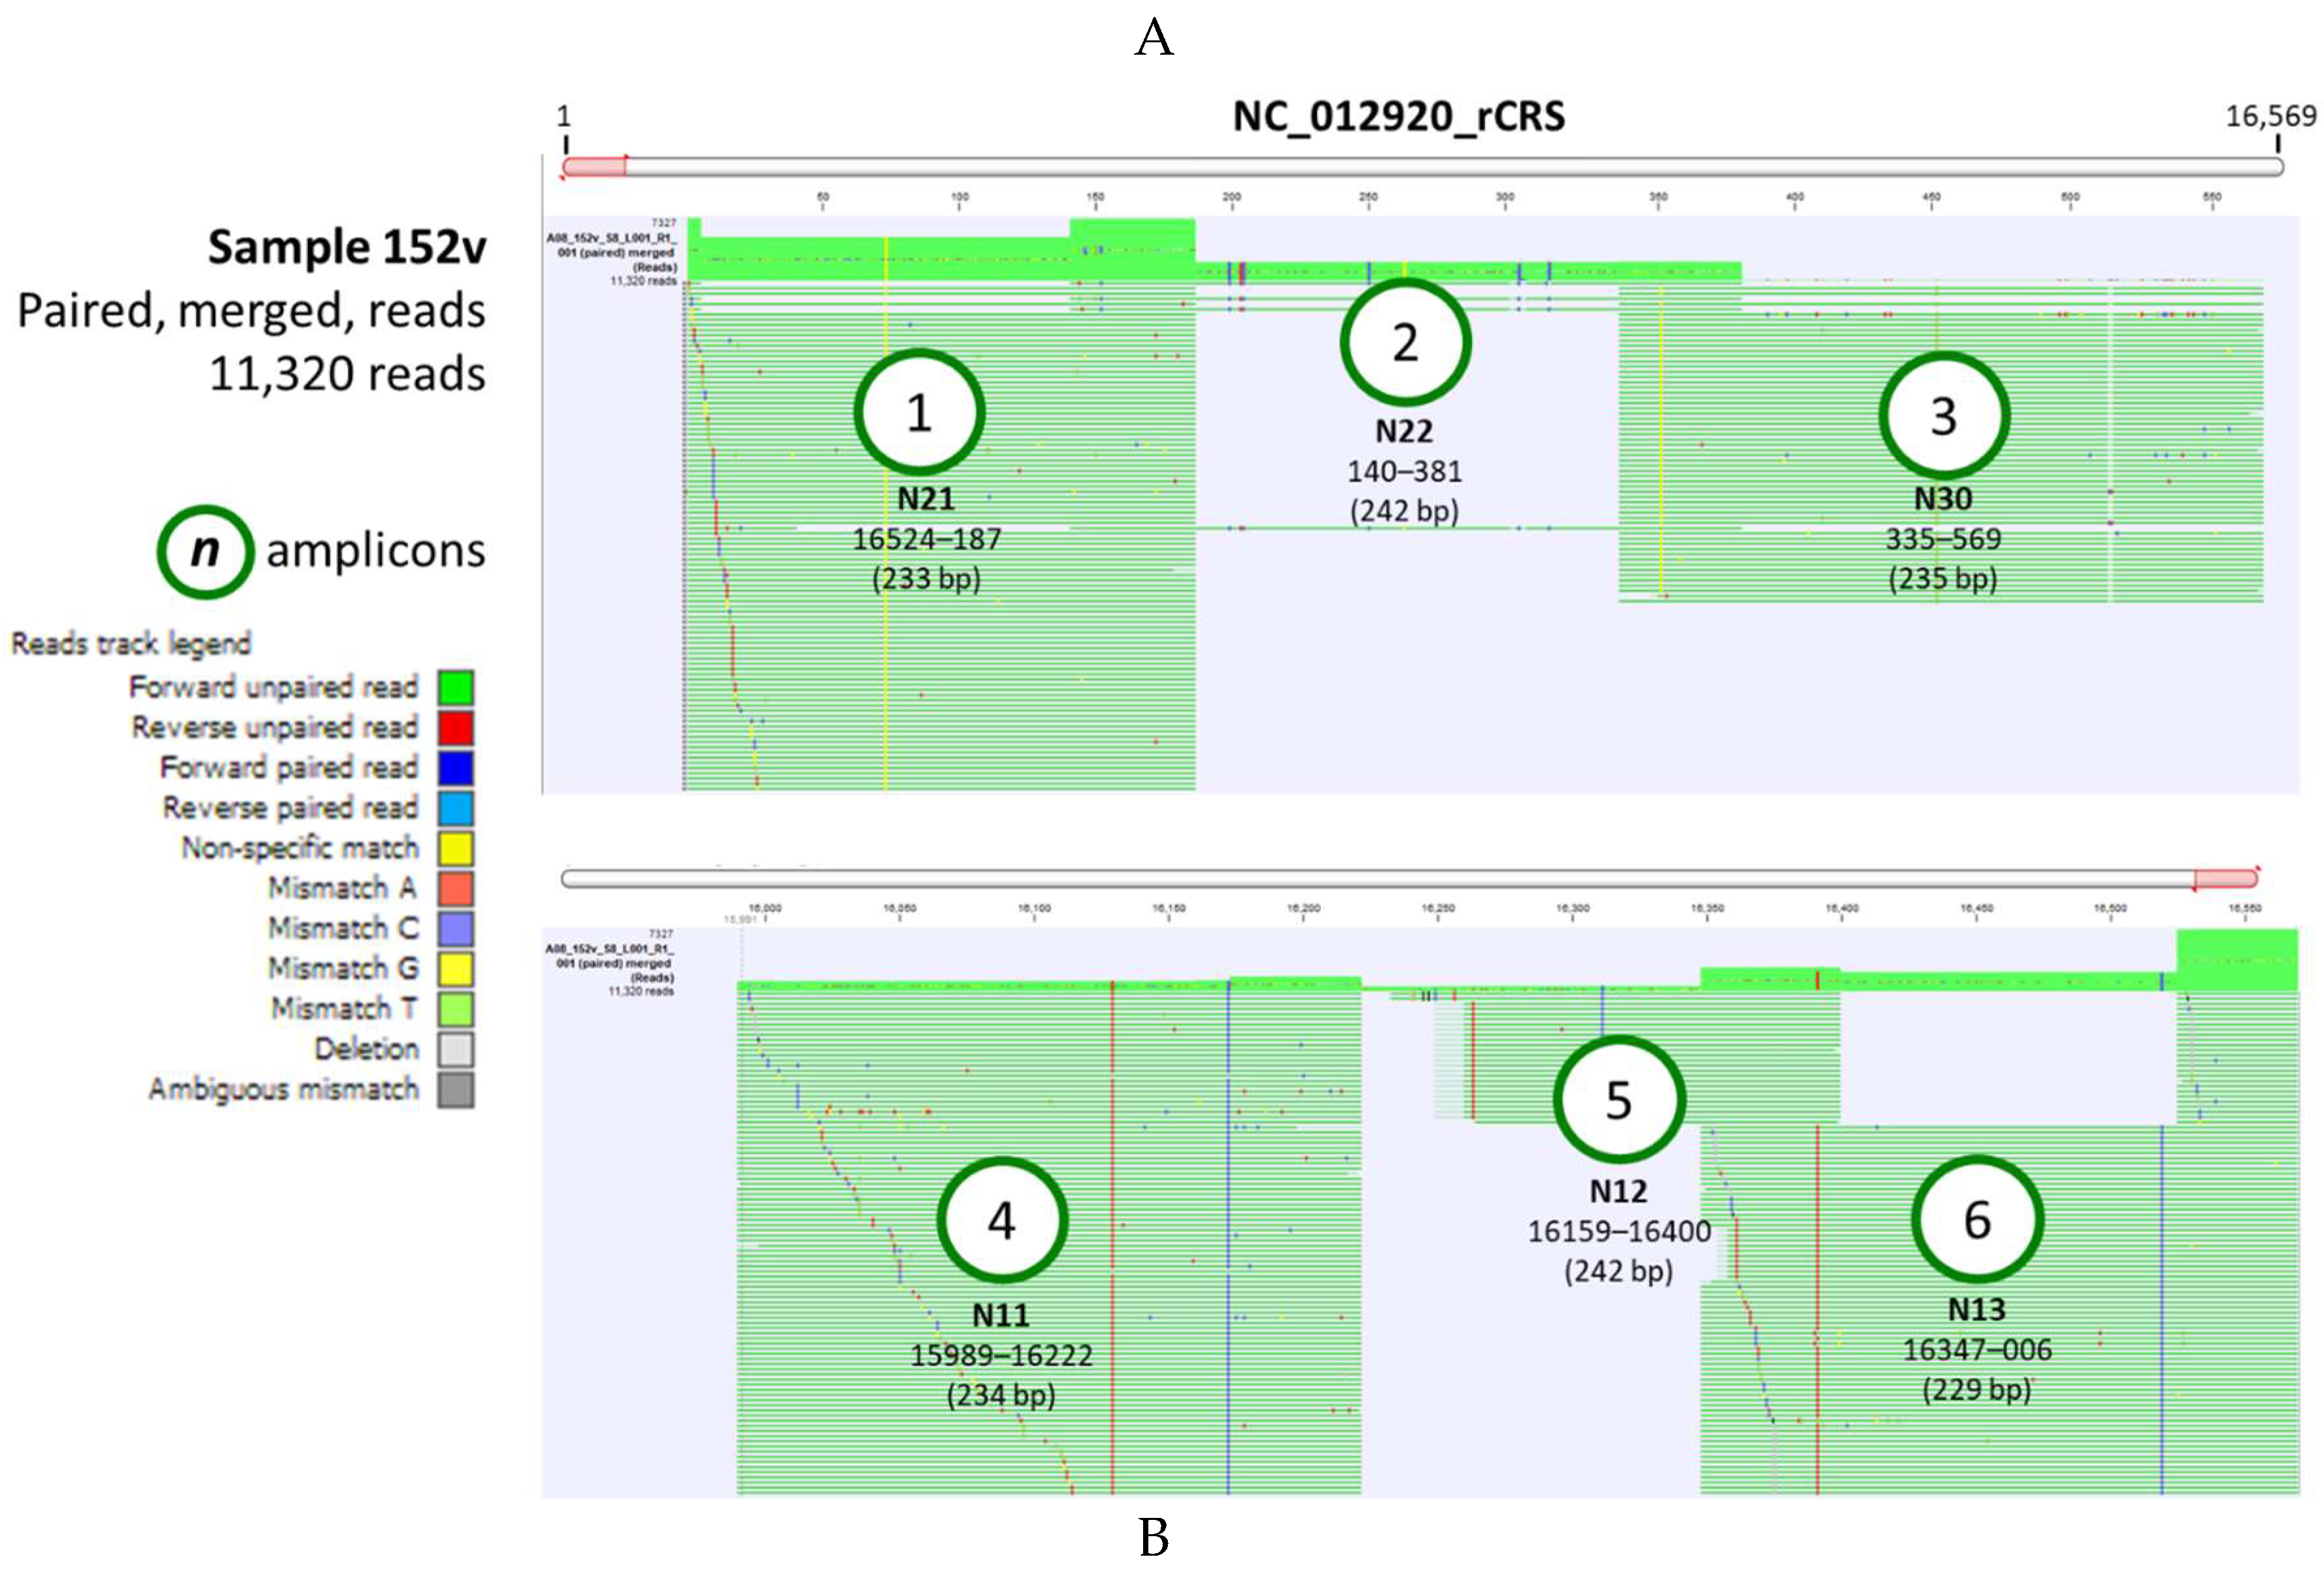
The “Map Reads to Reference” tool within the CLC workflow generated two outputs: (1) mapping report, and (2) reads track (
Figure 3A). The mapping report summarized the total number of reads, mapped/unmapped reads, intact/broken paired reads, and matched/unmatched read length distribution per sample. A representative reads track shows 11,320 paired-reads of sample 152v mapped onto the linearized rCRS genome (
Figure 3A and Supplementary Video 1). Mapping fortuitously revealed lower coverage for amplicons 2 and 5 presumably due to PCR or sequencing bias. Coverage bias or unevenness have been attributed to low-GC target regions, library preparation enzymes, library PCR amplification, cluster amplification, and sequencing [
38]. The zoomed-in view at the nucleotide level allowed for comparison to the reference genome and detection of variants. The six amplicon start and end locations covered the entire mitochondrial control region (16024 to 576 bp) and corresponded to the forward/reverse primer sequences.
2.2.2. Low Frequency Variant Track and Table
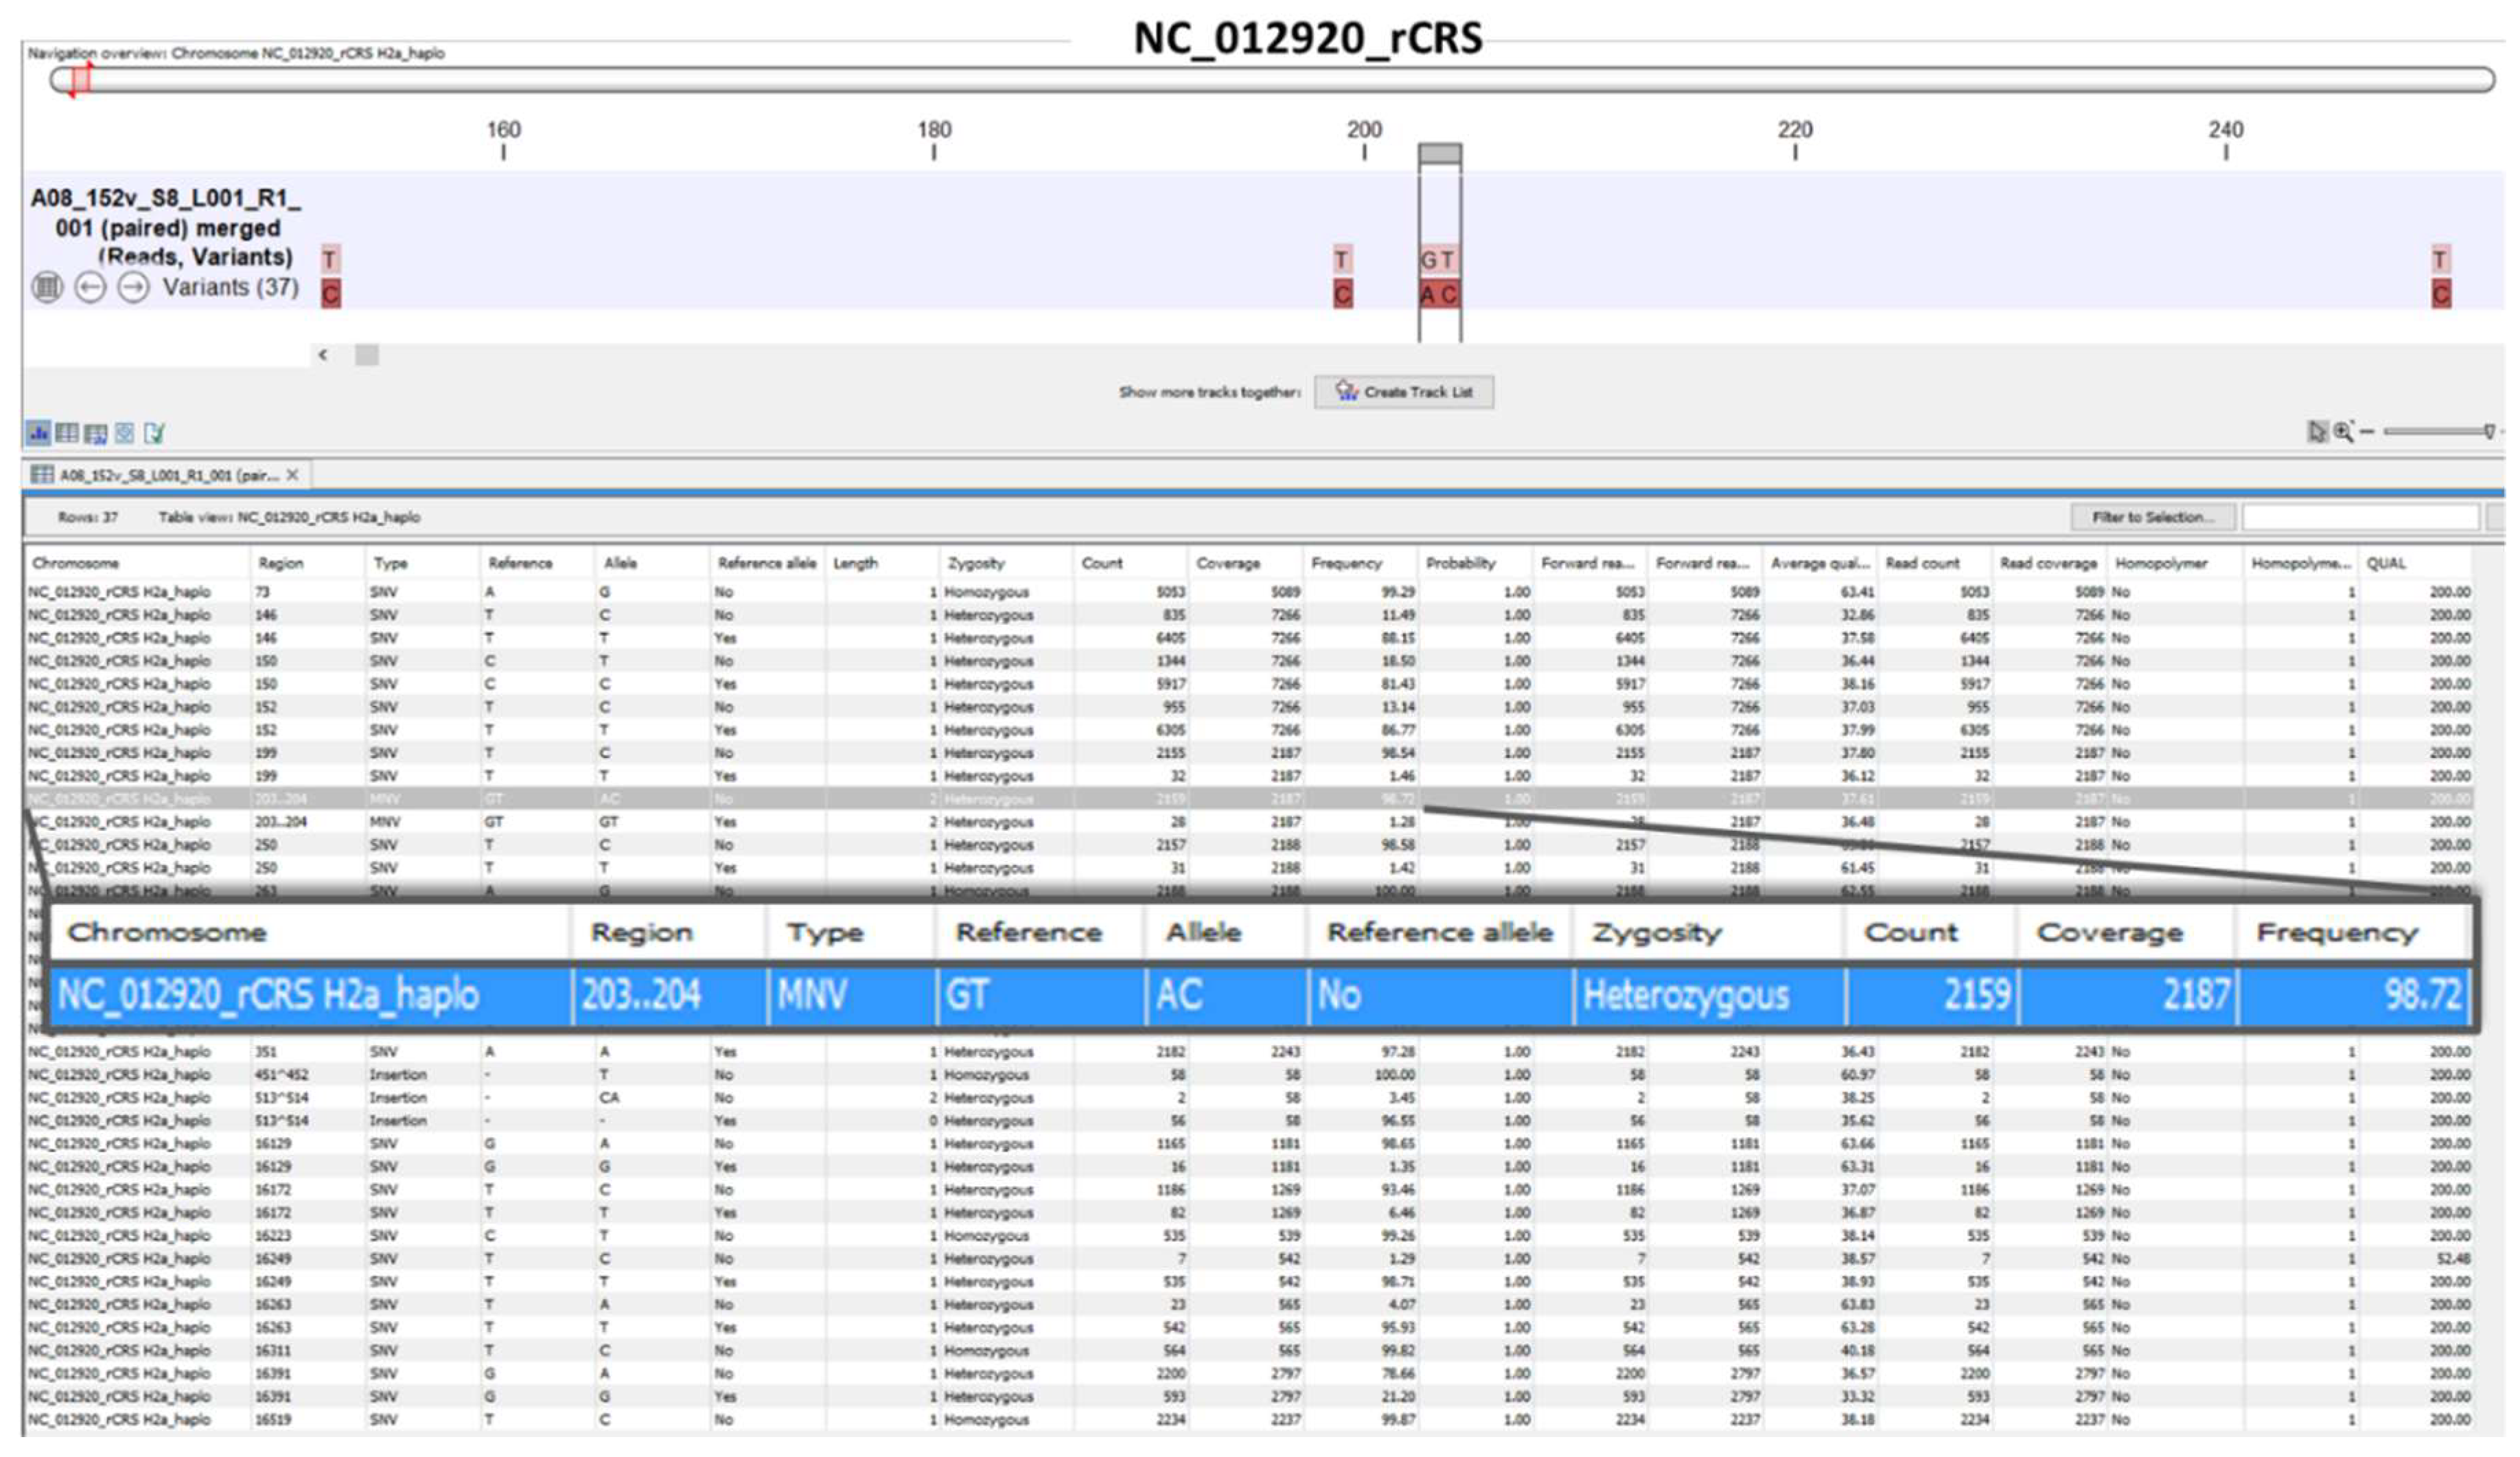
The “Low Frequency Variant Detection” tool within the hMITO DB workflow generated two outputs: (1) variant track, and (2) variant table (
Figure 3B). The variant track for representative sample 152v displays the location of the variants, while the variant table (Supplementary Table 1 and Video 1) lists the attributes of each variant. A row at positions 203-204 is magnified to show the sample’s “Allele” alongside the rCRS “Reference.” The percentage of variants (reads) is listed under “Frequency” derived from dividing read “Count” by read “Coverage” x 100. For sample 152v, the heterozygous “AC” allele, typed as a multi-nucleotide variant (MNV) was identified in 98.72% of the reads. The “zygosity” column was helpful in deciphering homoplasty or heteroplasty (i.e., identical or non-identical copies of mtDNA). For evolutionary analysis, haplotype classification is based on defining mtDNA polymorphisms, such as the variants shown in
Figure 3B, that represent major branch points on the human phylogenetic tree [
24].
2.3. mtDNA Haplotyping and Comparison to Self-Reported Race/Ethnicity
The haplotypes and geo-origins of the five cervical carcinoma cell lines (controls) were consistent with the Genome Ancestry information (origin, % genome) published in Cellosaurus [
39,
40]. Specifically, the haplotypes and geo-origins by BLAST search against the hMITO DB were: HeLa (L3b1a; Africa_E), SiHa (X2b+226; Asia_W_America_N); Ca Ski (HV; Asia_W), C33-A (U5a1b1a1; Asia_W_Europe_C), and DoTc2 (U2e1b1; Asia_S_W_ Europe). The respective Genome Ancestry information (origin, % genome) were: HeLa (African, 65%), SiHa (East Asian-North, 84%), Ca Ski (European-North, 68%), C33-A (European-North, 67%), and DoTc2 (European-North, 67%).
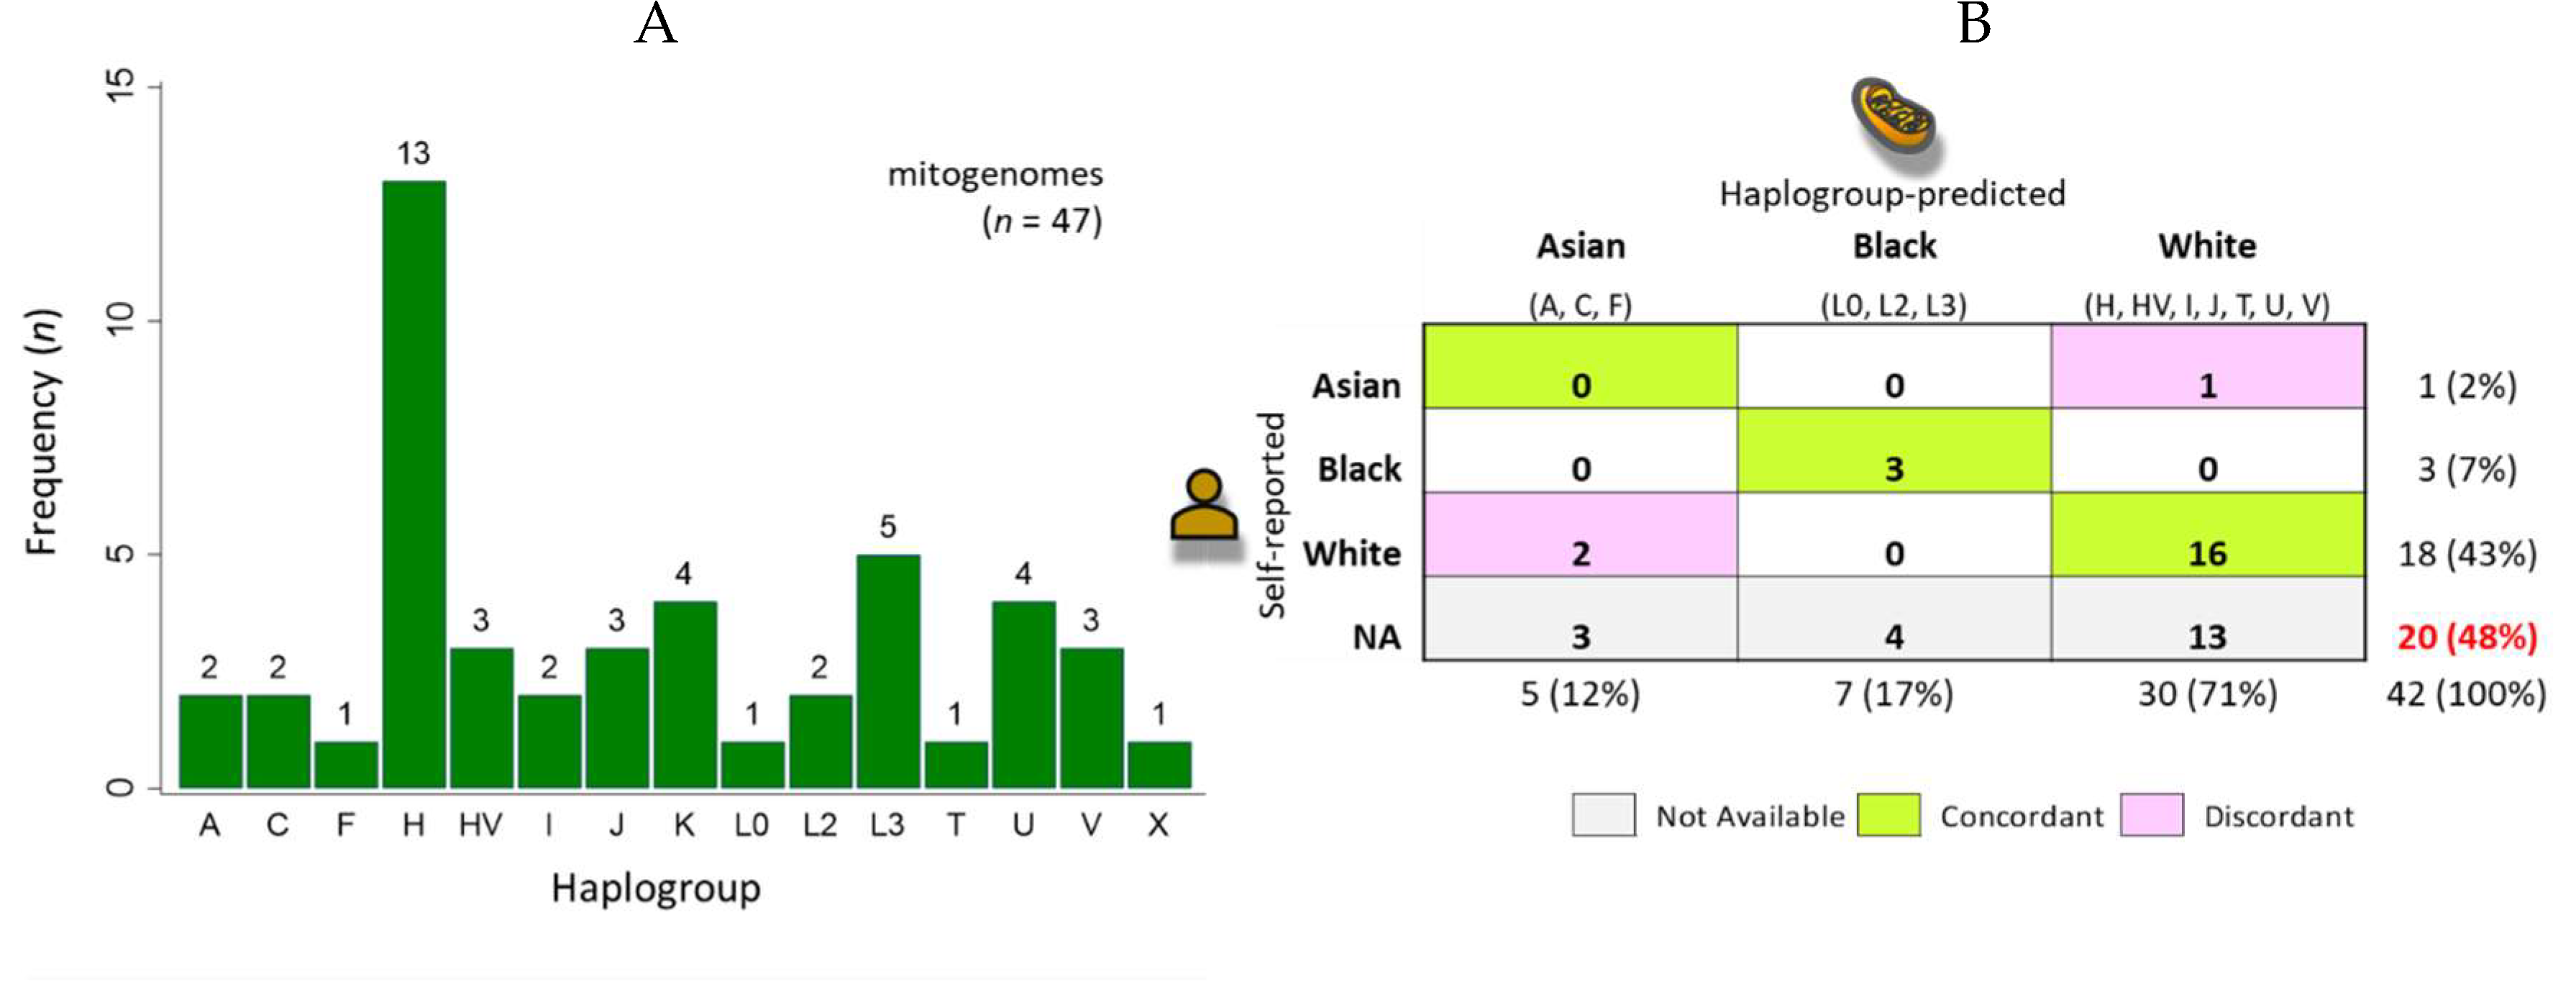
The macro-haplogroup distribution of the clinical samples and cell lines after BLAST is shown in
Figure 4A. The entire BLAST table is provided as Supplementary Table 2. Haplotypes and predicted race were classified for all clinical samples. In contrast, self-reported race/ethnicity was missing in 20/42 (48%) of electronic health records (EHR). The inter-rater agreement between Black or White race was high (86%). Whereas the inter-rater disagreement (14%) was found only between Asian/White race (
Figure 4B).
2.4. FASTQ File Sizes and Workflow Runtimes
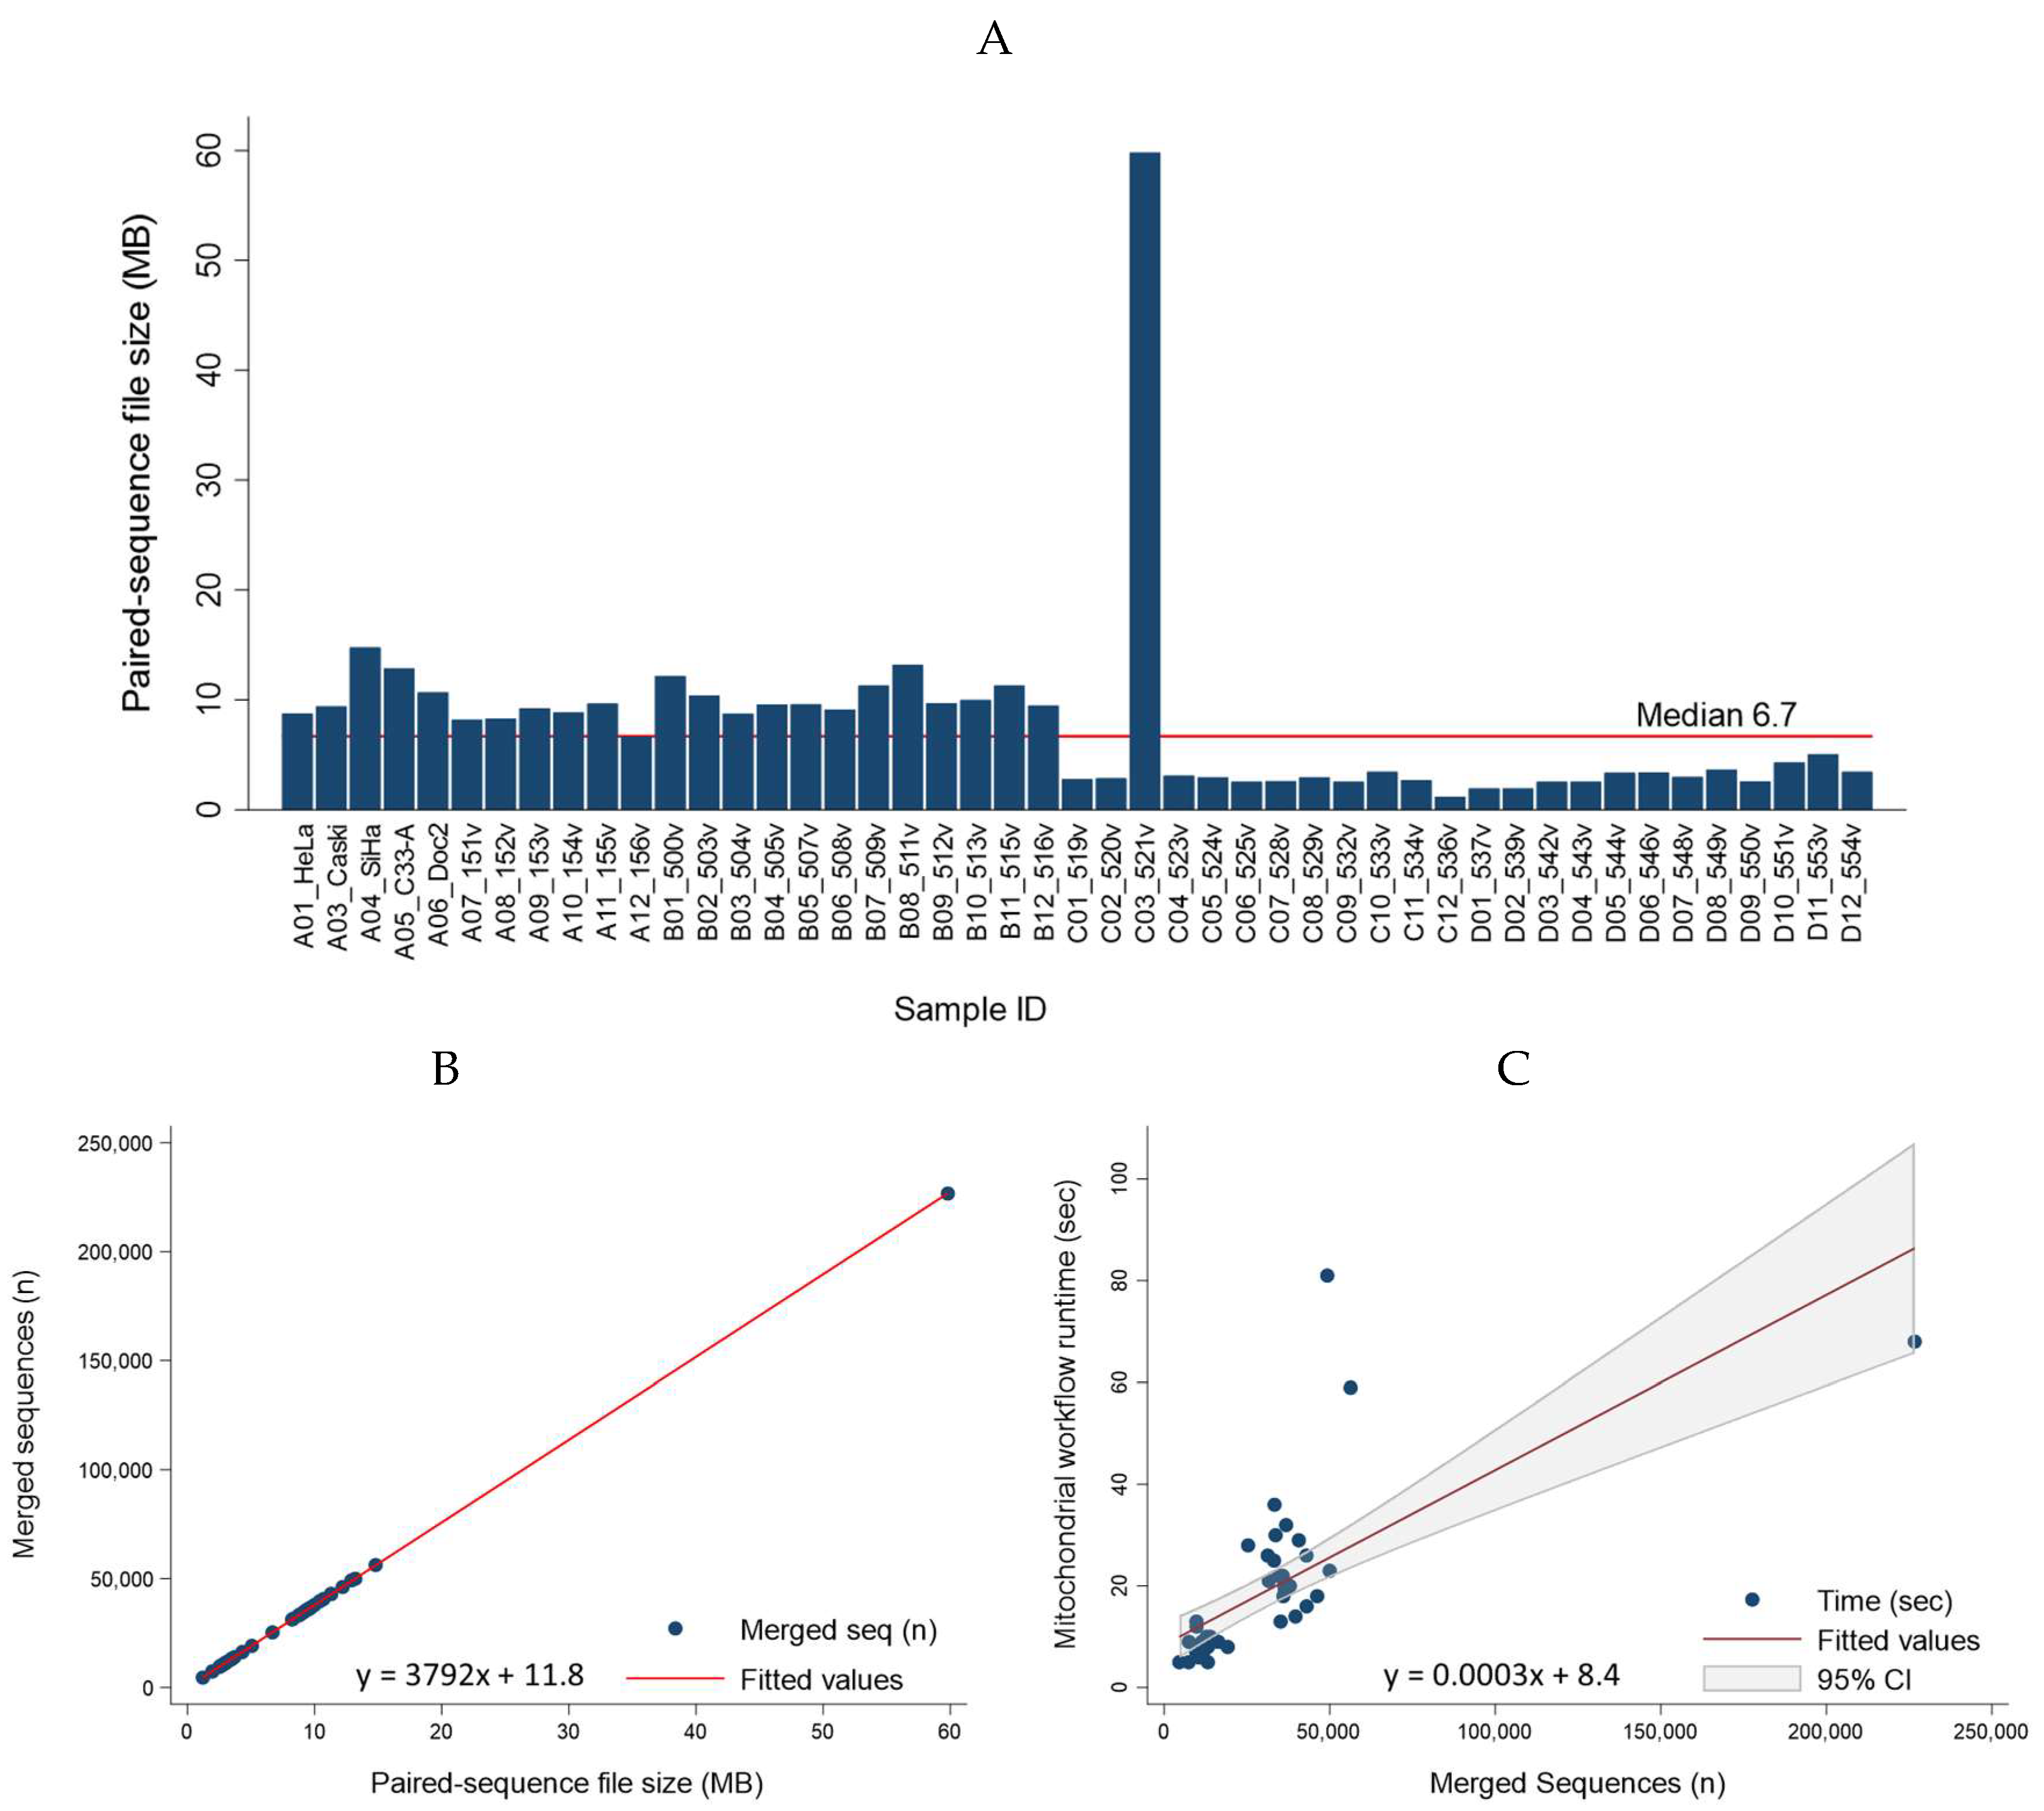
The sequencing file size of the 47 samples ranged broadly between 1.21 and 59.8 MB with a median of 6.7 MB (
Figure 5A). The samples were sequenced on separate days as two separate batches (A01 to B12 and C01 to D12). The noticeably smaller file sizes for batch 2 (C01 to D12) except for C03 was presumed due to a lower quantity of pooled DNA library submitted for sequencing. Nontheless, the reads per sample were sufficient for analysis and interpretation. The file size correlated perfectly with the number of merged sequences (
Figure 5B) with a median of 25,354 (range, 4,580 to 226,664) and R
2 = 1.0. The median runtime per sample for the mtDNA workflow was 13 sec (range, 8 to 81 sec). The cumulative runtime was 14.4 min for 47 samples. The timed results demonstrated exceptional efficiency and established benchmark metrics for future studies. A modest correlation between number of merged sequences/sample and mtDNA workflow runtimes was found (R
2 = 0.50) (
Figure 5C) . In practice, the regression equations derived from the correlation analysis may be utilized for estimating runtimes based on the number of merged reads/sample or file size (
Figure 5B, C). Statistical analyses were performed using STATA/IC 17.0 (StataCorp LP, College Station, TX, USA).
3. Discussion
In this study, we developed a customized, human mitogenome database (hMITO DB) for use within CLC Genomics. After construction, we were able to visualize and examine the haplogroup distribution and associated places-of-origin of the NCBI-derived mitogenomes (
n = 4,286). The mass of the distribution was concentrated on five predominant haplogroups (H, J, K, T and U) of European and West Asian origin. We supplemented the database with rare mitogenomes of indigenous peoples to ensure representation from the entire spectrum of macro-haplogroups. Furthermore, representative mitogenomes from each macro-haplogroup were aligned for phylogenetic tree construction to confirm accuracy. The expanded, customized metadata of the hMITO DB enhanced visualization of the phylogenetic, temporal, and spatial relationships between haplogroups. The addition of the Neanderthal mitogenome and two crucial time points in human evolution, i.e., Neanderthal-modern human divergence (~800 ka) and out-of-Africa migration (~60-70 ka) bestowed a temporal perspective to human dispersal across continents [
34,
35,
36,
37].
The utility of the hMITO DB was demonstrated by using a Pap smear-derived mtDNA NGS dataset. By incorporating the curated database within the CLC workflow, we were able to process NGS data simply by inputting the FASTQ files, selecting the reference database, and setting the parameters. The read mapping and variant tracks with zoomable visualization provided effortless inspection of mapped regions and detected variants. A comprehensive analysis of each variant was provided in the auto-generated table of variants with columns of attributes. The mtDNA consensus sequences generated from the workflow was BLAST aligned very efficiently (5 sec for 47 samples) for haplotyping and geo-mapping. More importantly, we were able to haplotype and predict the race for all clinical samples. In contrast, self-reported race/ethnicity was missing in 20/42 (48%) EHR records. The inter-rater agreement between Black or White race was high (86%). Whereas the inter-rater disagreement (14%) was found only between Asian/White race. The 5 samples with Asian haplogroups (A, C, and F) were self-reported as White (
n = 2) or non-reported (
n = 3). The geographic origins of haplogroups A and C are North and South America most frequently found in American Indians (AI) and indigenous peoples of Siberia, respectively [
22,
33]. The F haplogroup is common among the Lahu people of East Asia [
41]. Our preliminary findings, although small in sample size, were consistent with a recent systematic review of 43 U.S. based studies that showed EHRs frequently had “incomplete and/or inaccurate data on the race/ethnicity of patients” [
42]. In contrast, disease registries or databases had highly accurate data for White and Black subjects, but relatively high rates of “misclassification and incomplete data for Hispanic/Latinx patients” [
42]. The most misclassified populations were Asians, Pacific Islanders, and American Indian/Alaska Native (AI/AN) [
42]. Misclassification of race/ethnicity for Asians and American Indians has been problematic in cancer registries for years [
43]. In fact, researchers have used the North American Association of Central Cancer Registries Asian/Pacific Islander Identification Algorithm (NAPIIA) to disaggregate and untangle Asian data to advance health disparity research [
43]. Taken together, mitochondrial haplotyping is a highly relevant and valuable method of studying human health and disease, such as, demography, population genetics, social determinants of health (SDOH), genetic dispositions for disease, pharmacogenomics, and forensics [
18,
42,
43,
44,
45,
46].
The strength of this study is twofold. First, the customized workflow with integrated mtDNA database unified numerous manual steps and automated time-consuming read mappings, variant detection, and consensus sequence generation. The incorporation of haplotypes and geographic origins in the hMITO DB eliminated manual searching, inputting and outputting data to and from two indispensable, online software programs, e.g., MITMAP and Haplogrep3 to deduce a result. Finally, the auto-generated tables, reports and visualizations from the workflows abolished the shortcomings of manual data production to improve delivery speed, reduce costs, and minimize errors. Second, matrilineal haplotyping as a molecular tool will reduce the inherent problems of race/ethnicity classification based on self-reported data in EHRs, i.e., incomplete and/or inaccurate data [
42]. The application of our streamlined, mitogenomics approach will facilitate and improve data accuracy in studies of human health, disease, and beyond [
47].
We acknowledge that our study has limitations. In the current version of the hMITO DB, we aimed to capture the entire spectrum of macro-haplogroups. However, each macro-haplogroup has descendants ranging from few to many sub-lineages, such as M1 through M52 of the M macro-haplogroup [
24]. In fact, van Oven and Kayser’s PhyloTree
mt Build 17 was based on 5,400 mtDNA haplotypes [
24]. To achieve a balance between the number of mitogenomes and workflow runtimes, we intend to expand our database with rare mitogenomes and avoid duplicating existing haplotypes in future versions of hMITO DB. As for the wet lab, alternative methods: 1) Illumina mtDNA kit (Illumina
, San Diego, CA, USA) using two mitogenome-spanning amplicons for NGS, and 2) IDT xGen Human mtDNA Hybridization Panel (IDT, Coralville, Iowa, USA) with distinct advantages for intact and degraded DNA, respectively, warrants performance testing.
4. Materials and Methods
4.1. Construction and Content of Customized Reference Database
A total of 4,286 complete human mitochondrial genomes were downloaded to construct the customized reference database. The genomes included: 1) the rCRS RefSeq belonging to European haplogroup H2a2a1 (NCBI Genome accession no. NC_012920.1), 2) haplotyped mtDNA genome (
n = 20) from the NCBI database (Supplementary Table 3, rows 4266 to 4286, excluding 4279), and 3) the Behar et al. dataset of mitogenomes (
n = 4,265) (NCBI PopSet accession nos. JQ701803 to JQ706067) [
30]. The Behar et al. dataset in FASTA format is also available for batch download through PhyloTree [
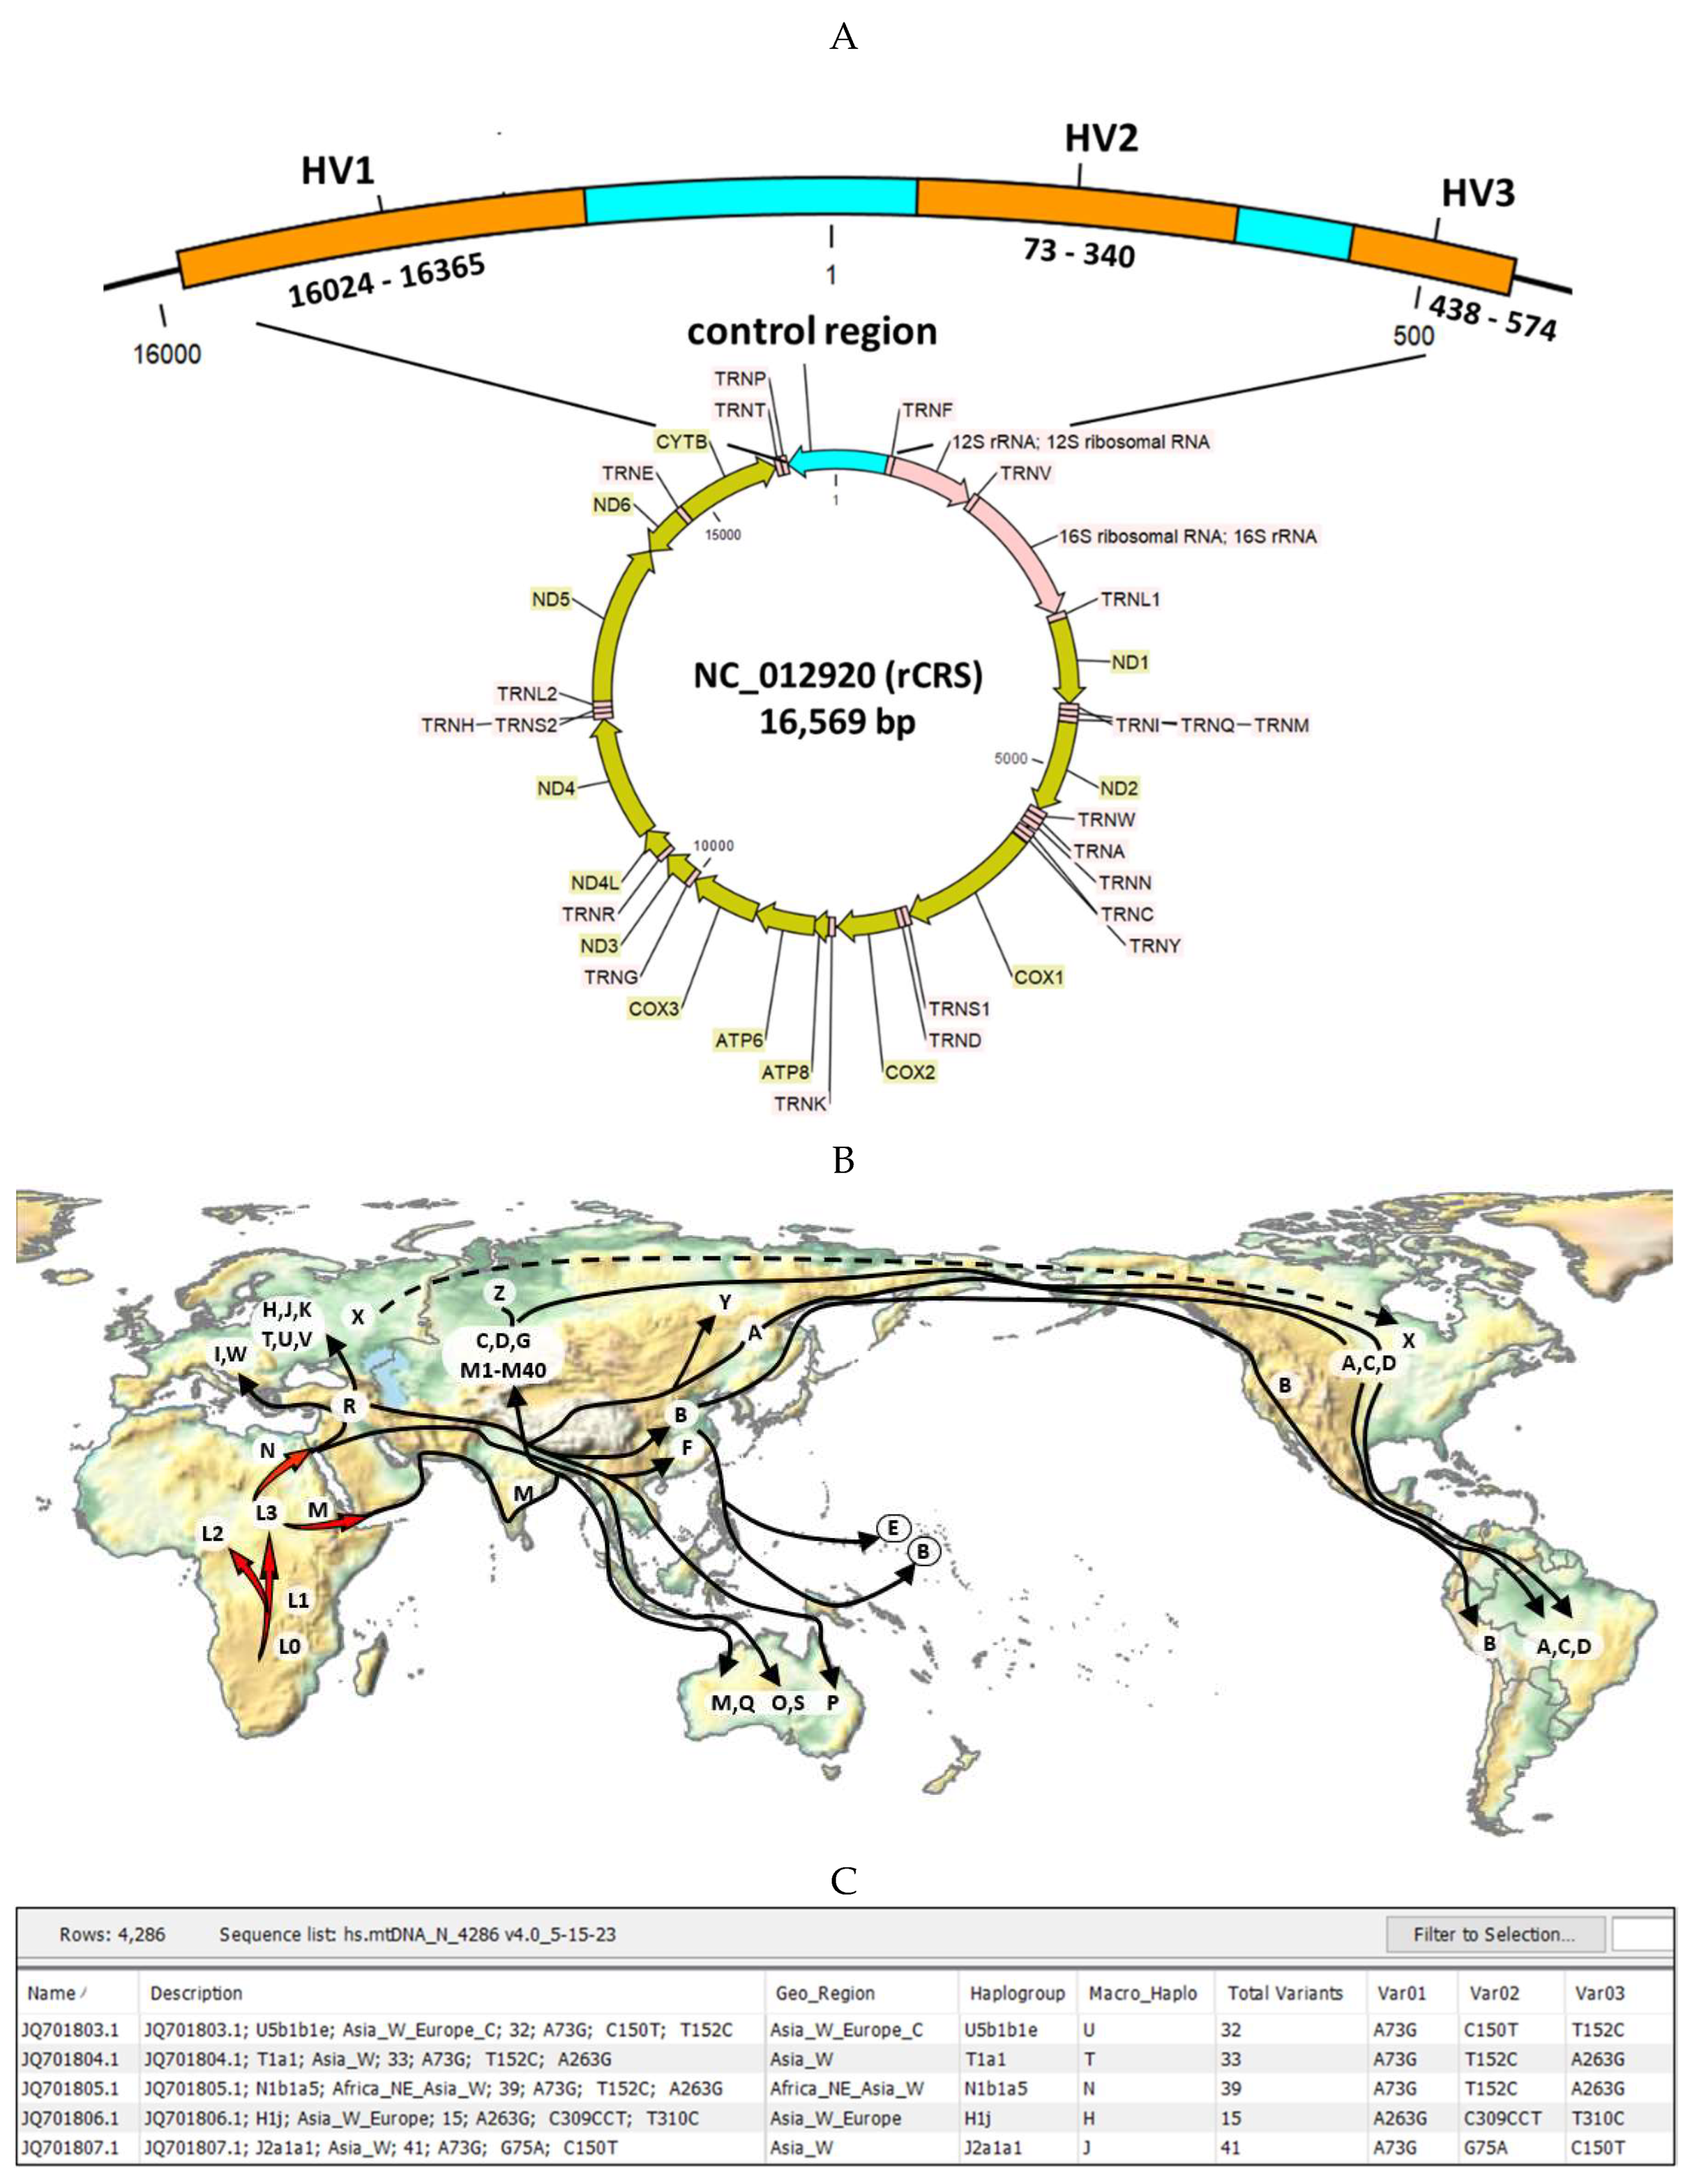
24]. All mtDNA FASTA files were imported into CLC Genomics and customized as described below for use as a mtDNA genome and BLAST database. The annotated rCRS RefSeq mtDNA genome is shown in
Figure 6A.
The 4,286 mtDNA FASTA files were subjected to haplotype classification and nucleotide variant determination using MITOMASTER [
26,
27]. The tabulated output included: 1) predicted haplotype, 2) total variants (
n), and 3) variants by nucleotide position. For unclassifiable queries in MITOMASTER, Haplogrep 3 (3.2.1) was used for haplotype determination [
28,
29]. The Haplogrep parameter, “phylogenetic tree” was set at “rCRS PhyloTree 17.2” using the latest release and rCRS as the reference sequence. The parameter “distance function” was set at “Kulczynski (default),” a weighted metric that returns the best hit for haplotype identification [
29].
The presumed geographic origin of a particular macro-haplogroup was classified according to the 7-continent terminology (Africa, Asia, Europe, North America, South America, Australia, and Antarctica) (
Figure 6B) [
48]. For subregions of Africa, Asia and Europe, the nomenclature of the United Nations geoscheme was used: (Africa – North, South, East, West, and Central; Asia - North, South, East, South-East, West, and Central; Europe - North, South, East, and West) [
49]. For Australia, the United Nations term “Oceania” inclusive of Australia, New Zealand, Melanesia, Micronesia, and Polynesia was used as the collective place of origin [
49]. For the database, the places-of-origin variable was named “Geo-region.” A map of macro-haplogroups and possible places of origin is shown in
Figure 6B. The migration routes were adapted from Wallace et al. [
50] and Vilar et al. for haplogroups B and E of the Chamorro people of the Marianas Islands [
51]. The world map was created with Mathematica 13.2 (Wolfram Research, Champaign, IL, USA).
Database customization involved incorporation of the haplogroup and geo-region data and creation of a new “Description” variable for each mtDNA genome file (
Figure 6C). The “Description” was an author-defined, clinically relevant, concatenated 7-dimensional descriptor of each mtDNA file. Specifically, the 7-dimensions are as follows: Name (NCBI accession number); Haplogroup; Continent_subregion; Total number of variants; Variant 1; Variant 2; and Variant 3. Only the first 3 variants identified by MITOMASTER and/or Haplogrep 3 are listed in the “Description” column due to space constraints. For completeness, the metadata of the database lists all identified variants (up to 81) for each mtDNA genome in separate columns. As an example, the “Description” of the homo sapiens isolate Aus23 of an Australian Aborigine (Accession no. AY289059) [
31] was annotated as “AY289059; O; Oceania; 44; C44CC; A73G; A263G.” Finally, all customized data created and curated as a metadata file was incorporated into the attribute fields of the sequence file for downstream applications as described in
Section 2.2. See Supplementary Table 3 and Video 1 for the full-length hMITO DB (n = 4,286) with select attribute columns.
4.2. mtDNA sequence analysis and BLAST workflows
CLC Genomics Workbench Premium 23.0.4 inclusive of the CLC Microbial Genomics Module (CLC MGM) (Redwood City, CA, USA) were installed on an HP notebook computer (specifications: Windows 10 operating system, Intel i7-7500U dual-core processor @ 2.70 GHz and 8 GB RAM) for all analyses. The CLC system requirements are provided online [
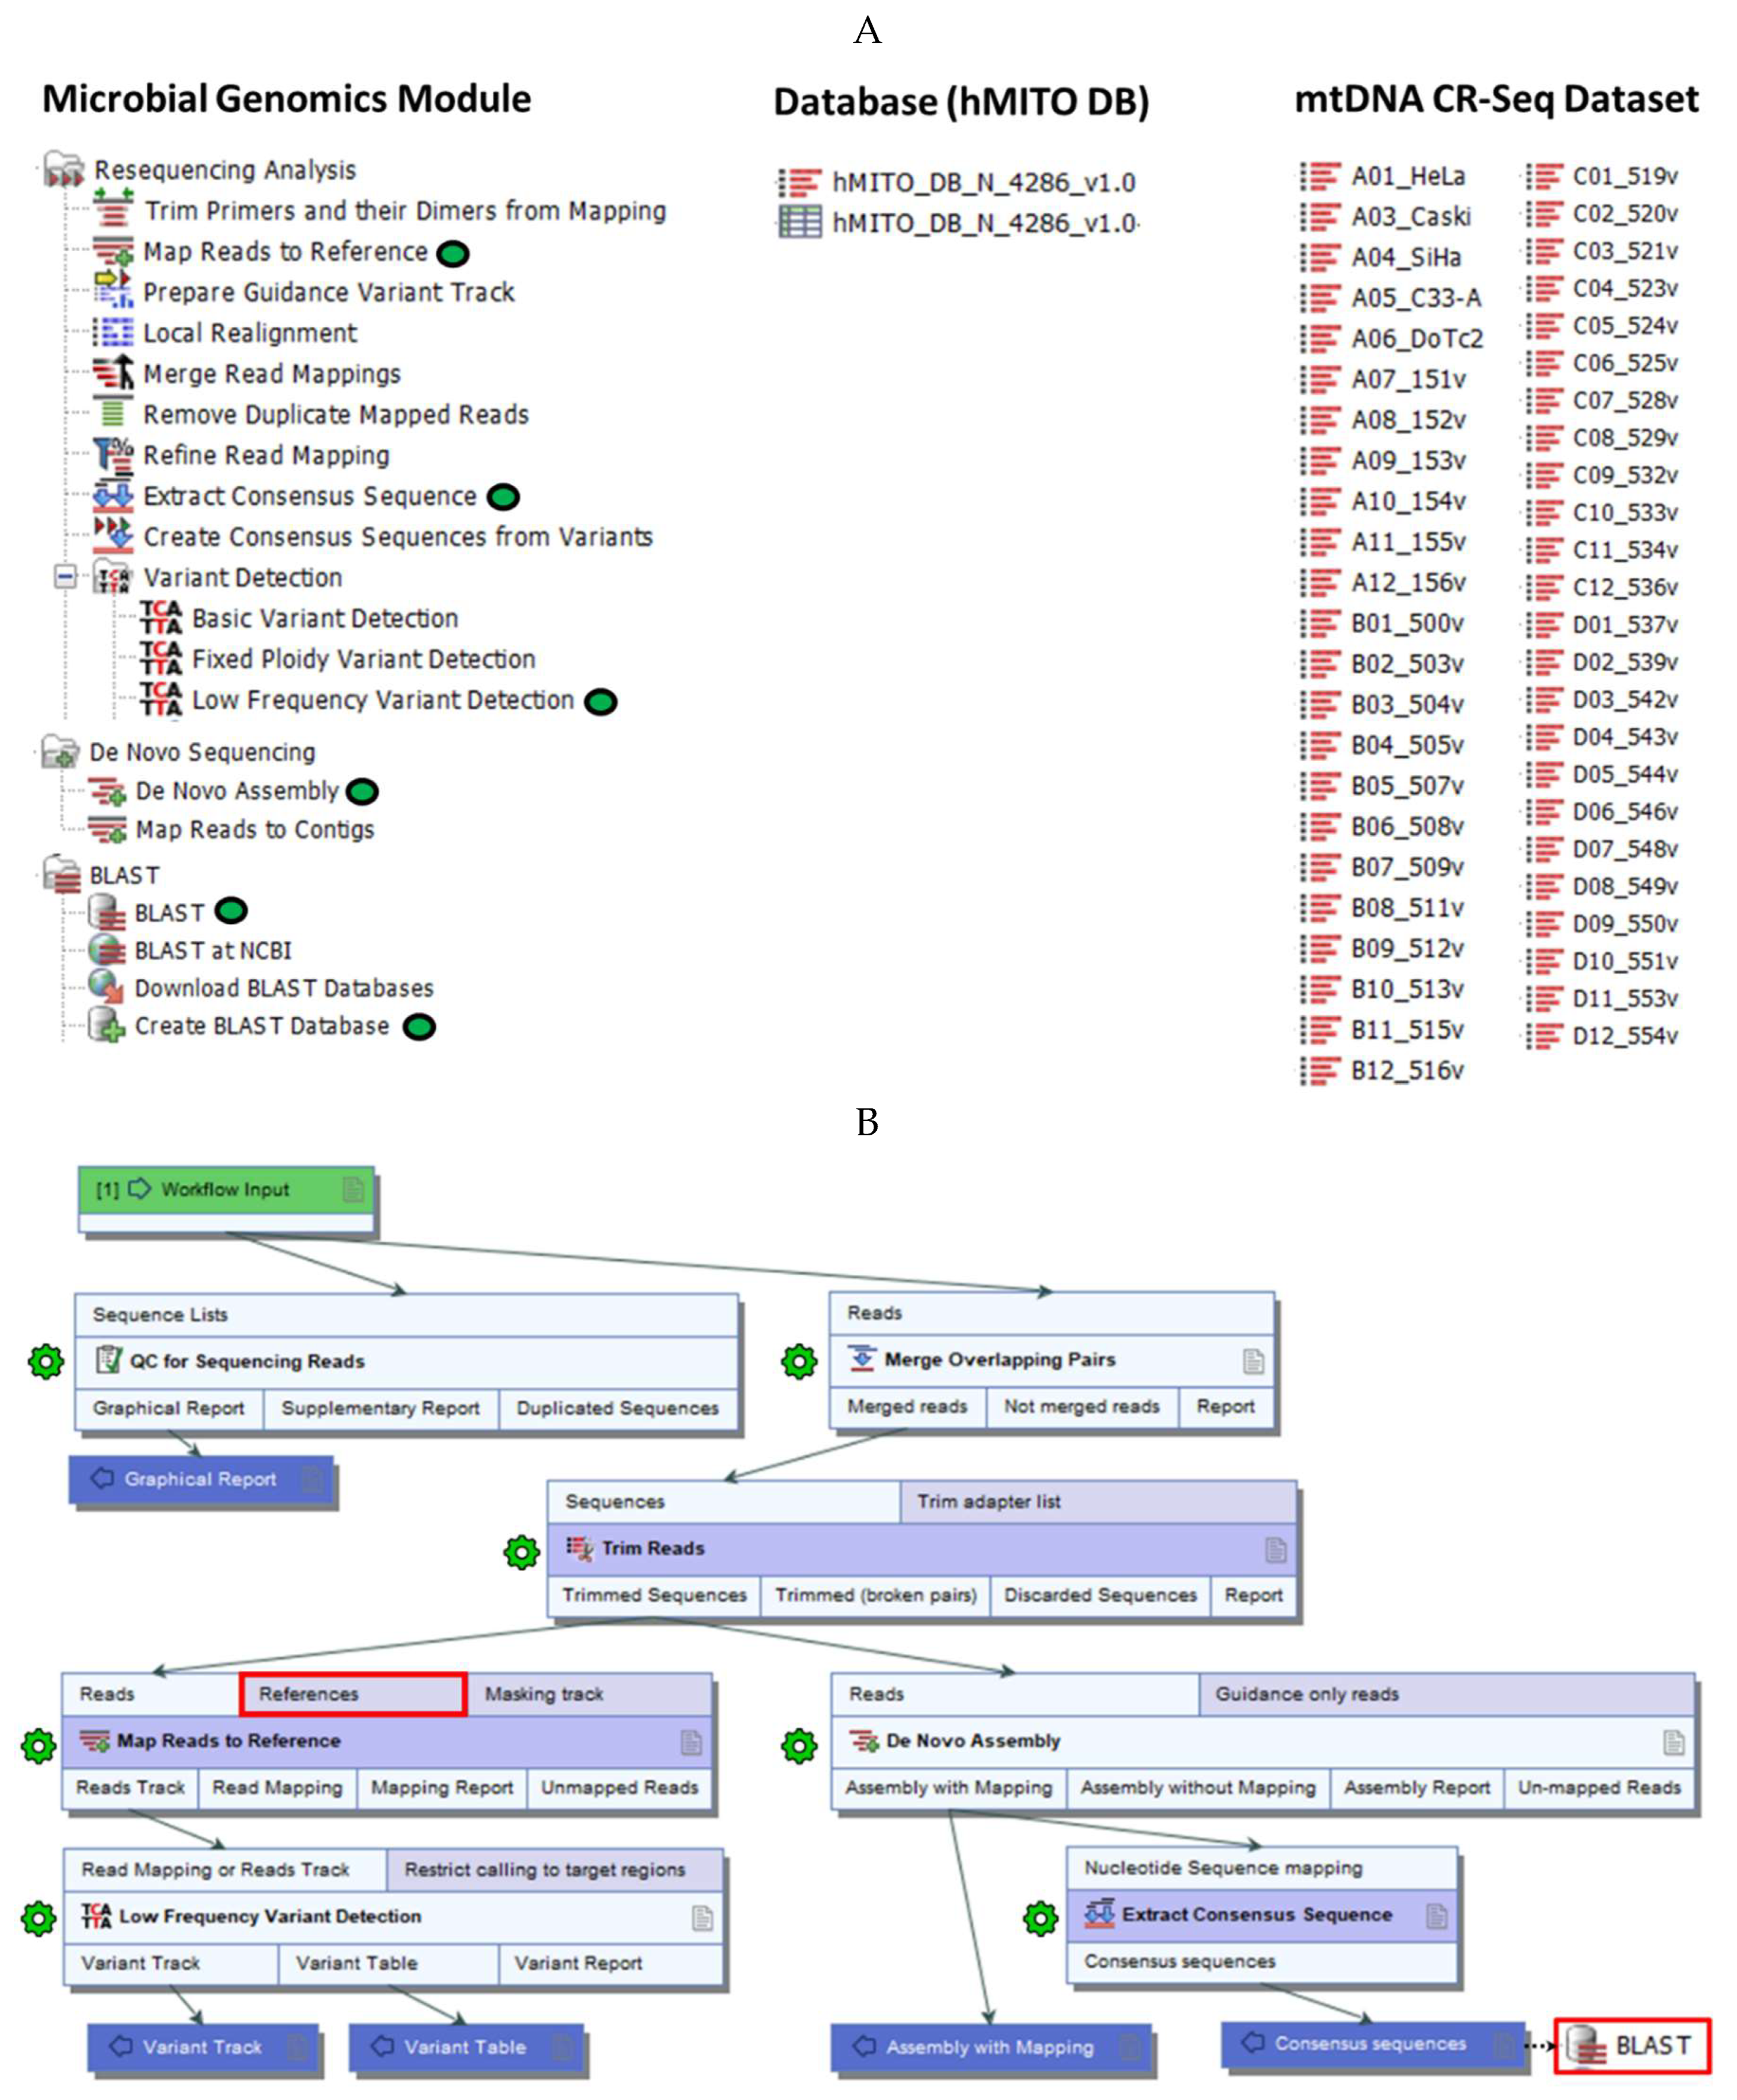
52]. A custom CLC workflow for mitochondrial DNA sequence analysis was constructed from 7 primary CLC MGM tools and connected for automated data processing and output (
Figure 7A, B).
The analysis consisted of the following steps: 1) Data import and quality control (QC), 2) Merge Overlapping Pairs, 3) Trim Reads, 4) Reads mapping to human mtDNA reference genomes, 5) Low frequency variant detection, 6) De Novo Assembly, and 7) Extract consensus sequence(s) (
Figure 7B). The embedded custom hMITO DB as described in section 4.1 was used for reads mapping, variant detection, and downstream BLAST search. The workflow generated genetic variant tracks and tables zoomable for inspection at the nucleotide level. The workflow also generated consensus sequences for BLAST query and identification of the most similar mitogenome, haplotype, and geographic origin.
4.3. Cell samples and mtDNA Control Region Sequencing
Five cervical cancer cell lines (SiHA, HeLa, Ca Ski, C33-A, and DoTc2) acquired from the American Type culture Collection (ATCC, Manassas, VA, USA) were cultured and extracted of genomic DNA (gDNA) for a previous study (
Figure 8A) [
53]. The stored gDNA was amplified using target-specific primers for mtDNA and sequenced to serve as controls. The haplogroup and geo-region results were verified against the documented genome ancestry of each cell line in Cellosaurus (Cell line encyclopedia) [
39,
40]. Cell culturing and imaging methods were described previously [
53].
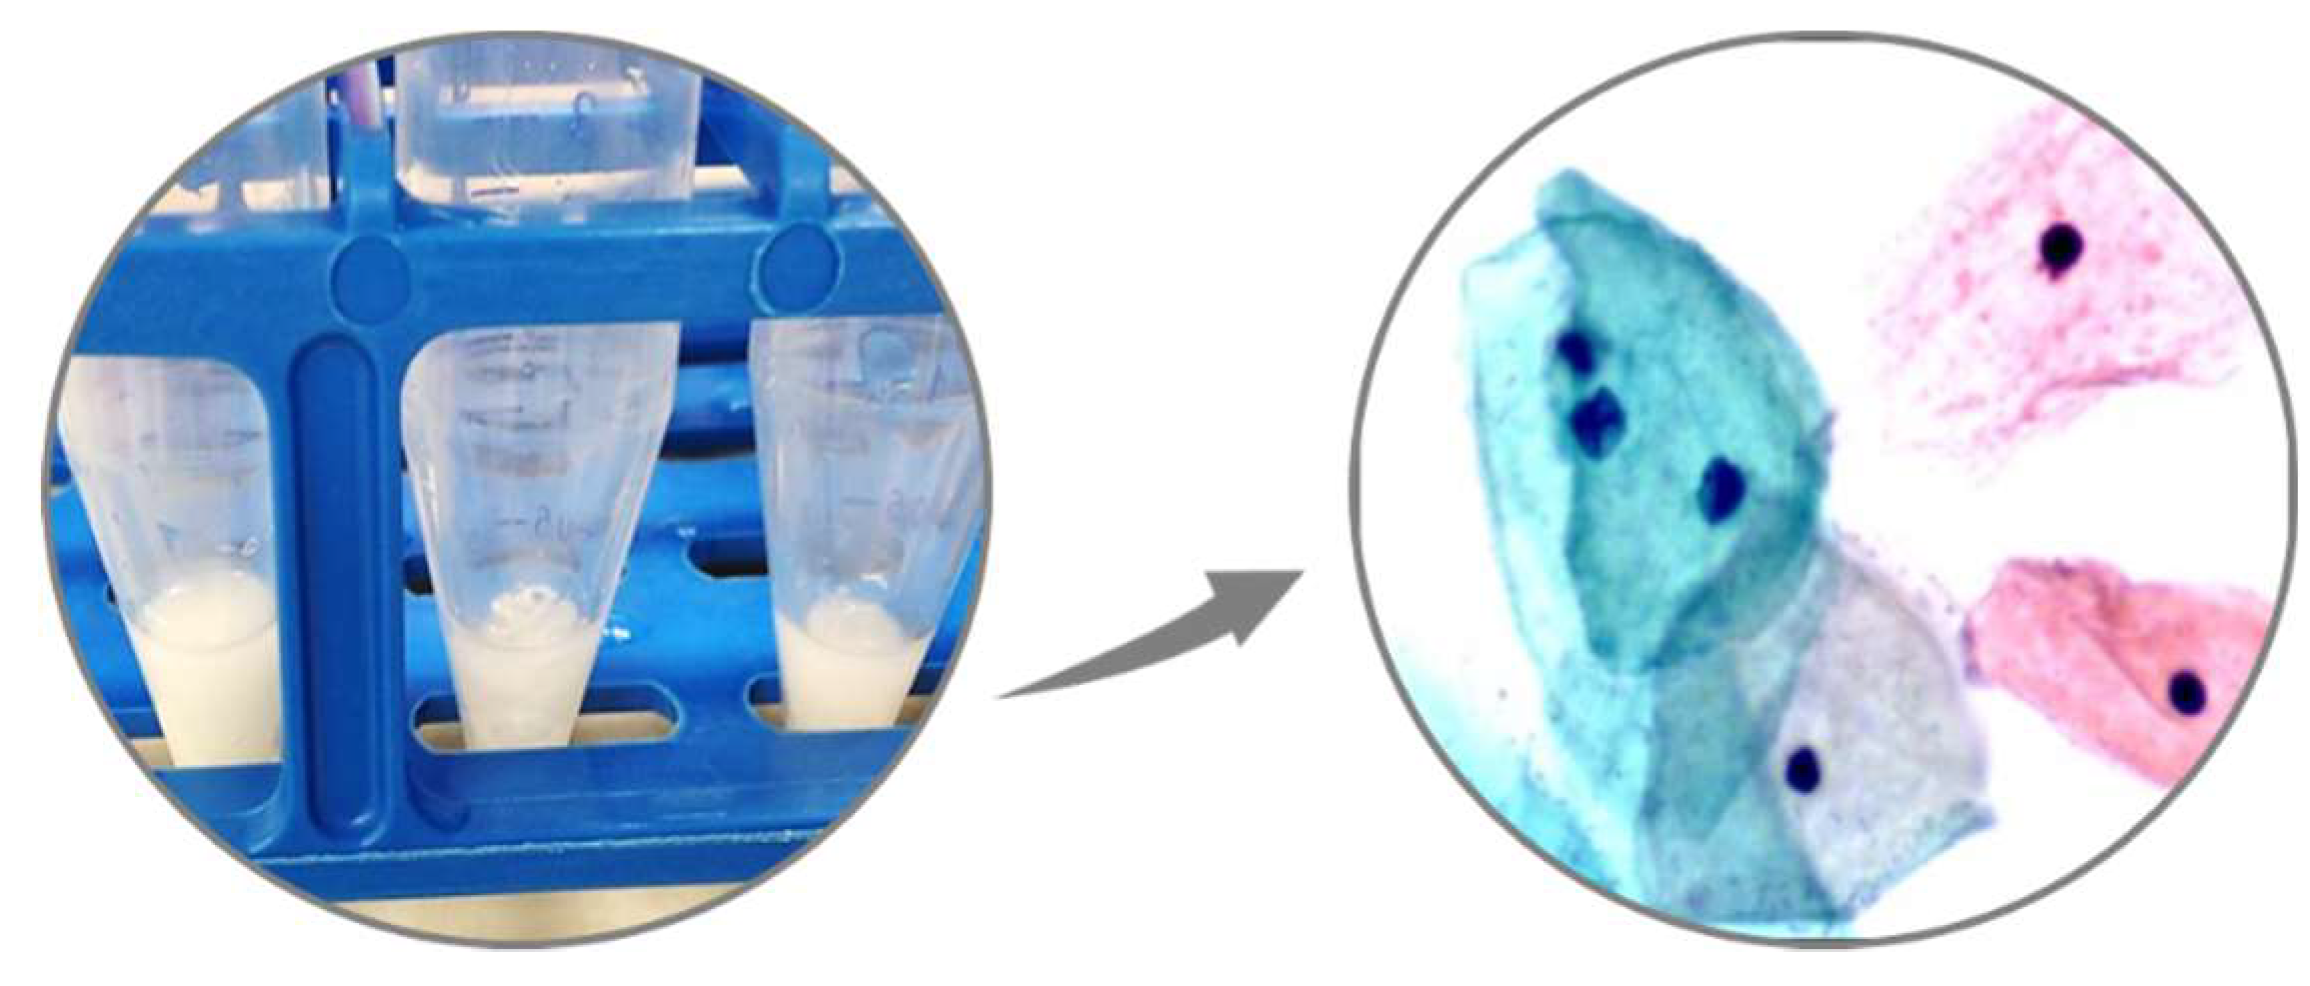
For clinical samples (
n = 42), the stored gDNA (-80C) extracted previously from liquid-based cervical cytology for another study (
Figure 8B) [
53] was used for mtDNA deep sequencing. Amplification of the entire mtDNA control region (CR) and sequencing were performed at Lucigen/LGC (Middleton, Wisconsin, USA). For mtDNA CR amplification, the “Midiplex primer sets I and II” designed by Lee et al. for forensic science were used [
18]. Six fragments (N11, N13, N22) and (N12, N21, and N30) were generated by two multiplex PCR reactions i.e., “Midiplex I and II” using 3 primer sets each. The forward and reverse primer sequences of Lee et al. was comprised of a common Nextera forward (Rd1) or reverse (Rd2) read sequence on the 5’ end joined by the mt-DNA specific sequence on the 3’ end [
18]. For this study, the NxSeq (LGC, Middleton, WI, USA) primers comprised of universal forward read sequence-(mtDNA-specific sequences)-3’ and universal reverse read sequence-(mtDNA-specific sequences)-3’ (listed in Supplementary Table 4) were used for the Midplex I and II PCR reactions per manufacturer’s instructions. The cycling protocol was as follows: activation [95C x 11 min]; 25 cycles [94C x 24s, 56C x 60s, 72C x 30s]; final extension [72C x 7 min]; hold 4C. The PCR products from Midiplex I and II were pooled for each sample (20 uL total) prior to the second PCR reaction for ligation of dual indices and platform specific sequences [
18]. The limited-cycle PCR protocol was as follows: activation [98C x 30s]; 5 cycles [98C x 10s, 72C x 75s]; final extension [72C x 5 min]; hold 4C.
After bead clean-up, the DNA libraries were normalized to ensure a pooled DNA library concentration of 4 ng/uL with an average amplicon size of 374 bp. Paired-end sequencing using the MiSeq 2x150 kit v2 nano format (300-cycles) was performed on the MiSeq sequencer (Illumina, San Diego, CA, USA). The mtDNA CR sequenced FASTQ dataset is shown in
Figure 7A.
5. Conclusions
In conclusion, our customized human mitochondrial database (hMITO DB) embedded within a CLC automated workflow provided a rapid and accurate means of sequence analysis. The pipeline for mitogenome analysis, haplotyping, and phylogeography will facilitate discoveries and advancements in human mitogenomics.
Supplementary Materials
The following supporting information can be downloaded at the website of this paper posted on Preprints.org, Table S1: Variant table for sample 152v, Table S2: BLAST results for human mtDNA haplotyping and geo-mapping, Table S3: Human mitochondrial database (hMITO DB) metadata; Table S4: Mitochondrial control region primers. Video S1: hMITO DB and dynamic functions of the read mapping and variant track.
Author Contributions
Conceptualization, J.SG.; methodology, J.SG. and Y.W.; database, J.SG.; validation, J.SG. and Y.W.; formal analysis, J.SG., H.C., and Y.W.; investigation, J.SG.; resources, J.SG. and Y.W.; data curation, J.SG., H.C., and Y.W.; writing – original draft preparation, J.SG.; writing – review & editing, J.SG., R.S.G, H.C. and Y.W.; visualization, J.SG, R.S.G. and Y.W.; supervision, J.SG. and Y.W.; project administration, J.SG. and Y.W.; funding acquisition, J.SG. All authors have read and agreed to the published version of the manuscript.
Funding
This research and the APC were funded by the Department of Clinical Investigation Intramural Funding Program at Brooke Army Medical Center, Fort Sam Houston, Texas.
Institutional Review Board Statement
This study was conducted according to the guidelines of the Declaration of Helsinki and approved by the institutional review board of Brooke Army Medical Center. .
Informed Consent Statement
Not applicable.
Data Availability Statement
The data presented in this study are openly available in the NCBI Sequence Read Archive (SRA). Title: A Customized Human Mitochondrial DNA Database (hMITO DB v1.0) for Rapid Sequence Analysis, Haplotyping and Geo-Mapping to Advance Translational Mitogenomics. SRA Accession Number: SRP450940; BioProject: PRJNA997736; BioSample Accession Numbers: SAMN36688595 to 36688641. The hMITO DB v1.0 (.clc format) that supports the findings of this study is available from the corresponding author, JSG, upon reasonable request.
Acknowledgments
We thank Behar and colleagues for generously depositing the mitochondrial genomes in the PopSet database of the NCBI. We are indebted to the world community for donating their mtDNA and the scientists for depositing the data in NCBI for scientific advancement. Photo credits: (1) Gunther, R. (2023). Neanderthal head reconstruction at the Smithsonian National Museum of Natural History [Photograph]. Author’s personal collection, (2) Beatty, I. (2006). San Bushman [Photograph]. Wikipedia.
https://en.wikipedia.org/wiki/San_people#/media/File:Santribesman. jpg. This paper has undergone PAO review at Brooke Army Medical Center and was cleared for publication. The view(s) expressed herein are those of the authors and do not reflect the official policy or position of Brooke Army Medical Center, the United States Army Medical Department, the United States Army Office of the Surgeon General, the Department of the Army, the Defense Health Agency, the Department of Defense, or the United States Government.
Conflicts of Interest
No potential conflicts of interest were disclosed by the authors. The funders had no role in the design of the study; in the collection, analyses, or interpretation of data; in the writing of the manuscript, or in the decision to publish the results.
Abbreviations
Acc: NCBI accession number; AI/AN, American Indian/Alaska Native; BLAST, Basic local alignment search tool; CLC MGM, CLC Microbial Genomics Module; CR, control region; EHR, electronic health record; GB, gigabyte; hMITO DB, human mitochondrial DNA database; HSIL, high-grade squamous intraepithelial lesion; HV, hypervariable region; ka, thousand years; kb, kilobase, MB, megabyte; MNV, multi-nucleotide variant; mtDNA, mitochondrial DNA; NCBI, National Center for Biotechnology Information; NILM , negative for intraepithelial lesion or malignancy; NGS, Next-generation sequencing; PopSet, population sequence database in GenBank; QC, quality control; rCRS, revised Cambridge Reference Sequence; RefSeq, reference sequence collection in GenBank.
References
- Sun, N.; Finkel, T. Cardiac mitochondria: A surprise about size. J. Mol. Cell. Cardiol. 2015, 82, 213–215. [Google Scholar] [CrossRef] [PubMed]
- O'Rourke, B. From bioblasts to mitochondria: ever expanding roles of mitochondria in cell physiology. Front. Physiol. 2010, 1, 7. [Google Scholar] [CrossRef] [PubMed]
- Herrera-Cruz, M.S.; Simmen, T. Over Six Decades of Discovery and Characterization of the Architecture at Mitochondria-Associated Membranes (MAMs). Advances in experimental medicine and biology. 2017, 997, 13–31. [Google Scholar] [CrossRef] [PubMed]
- Moon, D.-O. Calcium’s Role in Orchestrating Cancer Apoptosis: Mitochondrial-Centric Perspective. Int. J. Mol. Sci. 2023, 24, 8982. [Google Scholar] [CrossRef] [PubMed]
- Nass, M.M.K.; Nass, S. INTRAMITOCHONDRIAL FIBERS WITH DNA CHARACTERISTICS. J. Cell Biol. 1963, 19, 593–611. [Google Scholar] [CrossRef]
- Anderson, S.; Bankier, A.T.; Barrell, B.G.; De Bruijn, M.H.L.; Coulson, A.R.; Drouin, J.; Eperon, I.C.; Nierlich, D.P.; Roe, B.A.; Sanger, F.; et al. Sequence and organization of the human mitochondrial genome. Nature 1981, 290, 457–465. [Google Scholar] [CrossRef]
- Bandelt, H.-J.; Kloss-Brandstätter, A.; Richards, M.B.; Yao, Y.-G.; Logan, I. The case for the continuing use of the revised Cambridge Reference Sequence (rCRS) and the standardization of notation in human mitochondrial DNA studies. J. Hum. Genet. 2013, 59, 66–77. [Google Scholar] [CrossRef]
- DiMauro, S. A Brief History of Mitochondrial Pathologies. Int. J. Mol. Sci. 2019, 20, 5643. [Google Scholar] [CrossRef]
- Wallace, D.C. A Mitochondrial Paradigm of Metabolic and Degenerative Diseases, Aging, and Cancer: A Dawn for Evolutionary Medicine. Annu. Rev. Genet. 2005, 39, 359–407. [Google Scholar] [CrossRef]
- Beadnell, T.C.; Scheid, A.D.; Vivian, C.J.; Welch, D.R. Roles of the mitochondrial genetics in cancer metastasis: not to be ignored any longer. Cancer Metastasis Rev. 2018, 37, 615–632. [Google Scholar] [CrossRef]
- Kim, M.; Mahmood, M.; Reznik, E.; Gammage, P.A. Mitochondrial DNA is a major source of driver mutations in cancer. Trends Cancer 2022, 8, 1046–1059. [Google Scholar] [CrossRef]
- Scheid, A.D.; Beadnell, T.C.; Welch, D.R. The second genome: Effects of the mitochondrial genome on cancer progression. 2019, 142, 63–105. [Google Scholar] [CrossRef]
- Smith, D.R. The past, present and future of mitochondrial genomics: have we sequenced enough mtDNAs? Briefings Funct. Genom. 2015, 15, 47–54. [Google Scholar] [CrossRef] [PubMed]
- Embley, T.M.; Martin, W. Eukaryotic evolution, changes and challenges. Nature 2006, 440, 623–630. [Google Scholar] [CrossRef] [PubMed]
- Degli Esposti, M.; Chouaia, B.; Comandatore, F.; Crotti, E.; Sassera, D.; Lievens, P.M.-J.; Daffonchio, D.; Bandi, C. Evolution of Mitochondria Reconstructed from the Energy Metabolism of Living Bacteria. PLOS ONE 2014, 9, e96566. [Google Scholar] [CrossRef]
- Greiner, S.; Lehwark, P.; Bock, R. OrganellarGenomeDRAW (OGDRAW) version 1.3.1: Expanded toolkit for the graphical visualization of organellar genomes. Nucleic Acids Res. 2019, 47, W59–W64. [Google Scholar] [CrossRef]
- Akbari, M.; Nilsen, H.L.; Montaldo, N.P. Dynamic features of human mitochondrial DNA maintenance and transcription. Front. Cell Dev. Biol. 2022, 10, 984245. [Google Scholar] [CrossRef] [PubMed]
- Lee, E.Y.; Lee, H.Y.; Oh, S.Y.; Jung, S.-E.; Yang, I.S.; Lee, Y.-H.; Yang, W.I.; Shin, K.-J. Massively parallel sequencing of the entire control region and targeted coding region SNPs of degraded mtDNA using a simplified library preparation method. Forensic Sci. Int. Genet. 2016, 22, 37–43. [Google Scholar] [CrossRef]
- Vinueza-Espinosa, D.C.; Cuesta-Aguirre, D.R.; Malgosa, A.; Santos, C. Mitochondrial DNA control region typing from highly degraded skeletal remains by single-multiplex next-generation sequencing. ELECTROPHORESIS 2023. [Google Scholar] [CrossRef]
- Bodner, M.; Perego, U.A.; Gomez, J.E.; Cerda-Flores, R.M.; Migliore, N.R.; Woodward, S.R.; Parson, W.; Achilli, A. The Mitochondrial DNA Landscape of Modern Mexico. Genes 2021, 12, 1453. [Google Scholar] [CrossRef]
- Cann, R.L.; Stoneking, M.; Wilson, A.C. Mitochondrial DNA and human evolution. Nature 1987, 325, 31–36. [Google Scholar] [CrossRef] [PubMed]
- Torroni, A.; Schurr, T.G.; Yang, C.C.; Szathmary, E.J.; Williams, R.C.; Schanfield, M.S.; A Troup, G.; Knowler, W.C.; Lawrence, D.N.; Weiss, K.M. Native American mitochondrial DNA analysis indicates that the Amerind and the Nadene populations were founded by two independent migrations. Genetics 1992, 130, 153–162. [Google Scholar] [CrossRef] [PubMed]
- García-Olivares, V.; Muñoz-Barrera, A.; Lorenzo-Salazar, J.M.; Zaragoza-Trello, C.; Rubio-Rodríguez, L.A.; Díaz-de Usera, A.; Jáspez, D.; Iñigo-Campos, A.; González-Montelongo, R.; Flores, C. A benchmarking of human mitochondrial DNA haplogroup classifiers from whole-genome and whole-exome sequence data. Sci. Rep. 2021, 11, 20510. [Google Scholar] [CrossRef] [PubMed]
- van Oven, M.; Kayser, M. Updated comprehensive phylogenetic tree of global human mitochondrial DNA variation. Hum. Mutat. 2009, 30, E386–E394. [Google Scholar] [CrossRef]
- Qiagen Digital Insights. Available online: https://digitalinsights.qiagen.com/products-overview/discovery-insights-portfolio/analysis-and-visualization/qiagen-clc-microbial-genomics-module/ (accessed on 12 July 2023).
- Lott, M.T.; Leipzig, J.N.; Derbeneva, O.; Xie, H.M.; Chalkia, D.; Sarmady, M.; Procaccio, V.; Wallace, D.C. mtDNA Variation and Analysis Using Mitomap and Mitomaster. Curr. Protoc. Bioinform. 2013, 44, 1–23. [Google Scholar] [CrossRef]
- MITOMASTER. Available online: https://www.mitomap.org/foswiki/bin/view/MITOMASTER/WebHome (accessed on 12 July 2023).
- Schönherr, S.; Weissensteiner, H.; Kronenberg, F.; Forer, L. Haplogrep 3 - an interactive haplogroup classification and analysis platform. Nucleic Acids Res. 2023, 51, W263–W268. [Google Scholar] [CrossRef]
- Halogrep 3. Available online: https://haplogrep.i-med.ac.at/ (accessed on 12 July 2023).
- Behar, D.M.; van Oven, M.; Rosset, S.; Metspalu, M.; Loogväli, E.-L.; Silva, N.M.; Kivisild, T.; Torroni, A.; Villems, R. A “Copernican” reassessment of the human mitochondrial DNA tree from its root. Am. J. Hum. Genet. 2012, 90, 675–684. [Google Scholar] [CrossRef]
- Ingman, M.; Gyllensten, U. Mitochondrial Genome Variation and Evolutionary History of Australian and New Guinean Aborigines. Genome Res. 2003, 13, 1600–1606. [Google Scholar] [CrossRef]
- Nagle, N.; van Oven, M.; Wilcox, S.; Pellekaan, S.v.H.; Tyler-Smith, C.; Xue, Y.; Ballantyne, K.N.; Wilcox, L.; Papac, L.; Cooke, K.; et al. Aboriginal Australian mitochondrial genome variation – an increased understanding of population antiquity and diversity. Sci. Rep. 2017, 7, srep43041. [Google Scholar] [CrossRef]
- Dryomov, S.V.; Nazhmidenova, A.M.; Starikovskaya, E.B.; Shalaurova, S.A.; Rohland, N.; Mallick, S.; Bernardos, R.; Derevianko, A.P.; Reich, D.; Sukernik, R.I. Mitochondrial genome diversity on the Central Siberian Plateau with particular reference to the prehistory of northernmost Eurasia. PLOS ONE 2021, 16, e0244228. [Google Scholar] [CrossRef]
- Wielgus, K.; Danielewski, M.; Walkowiak, J. Svante Pääbo, reader of the Neanderthal genome. Acta Physiol. 2022, 237. [Google Scholar] [CrossRef]
- Gómez-Robles, A. Dental evolutionary rates and its implications for the Neanderthal–modern human divergence. Sci. Adv. 2019, 5, eaaw1268. [Google Scholar] [CrossRef] [PubMed]
- Cabrera, V.M.; Marrero, P.; Abu-Amero, K.K.; Larruga, J.M. Carriers of mitochondrial DNA macrohaplogroup L3 basal lineages migrated back to Africa from Asia around 70,000 years ago. BMC Evol. Biol. 2018, 18, 1–16. [Google Scholar] [CrossRef]
- Rito, T.; Vieira, D.; Silva, M.; Conde-Sousa, E.; Pereira, L.; Mellars, P.; Richards, M.B.; Soares, P. A dispersal of Homo sapiens from southern to eastern Africa immediately preceded the out-of-Africa migration. Sci. Rep. 2019, 9, 1–10. [Google Scholar] [CrossRef]
- Head, S.R.; Komori, H.K.; LaMere, S.A.; Whisenant, T.; Van Nieuwerburgh, F.; Salomon, D.R.; Ordoukhanian, P.; Forth, L.F.; Höper, D.; Enroth, C.H.; et al. Library construction for next-generation sequencing: Overviews and challenges. BioTechniques 2014, 56, 61–77. [Google Scholar] [CrossRef] [PubMed]
- Bairoch, A. The Cellosaurus, a Cell-Line Knowledge Resource. J. Biomol. Tech. 2018, 29, 25–38. [Google Scholar] [CrossRef] [PubMed]
- Cellosaurus. Available online: https://www.cellosaurus.org (accessed on 12 July 2023).
- Wen, B.; Xie, X.; Gao, S.; Li, H.; Shi, H.; Song, X.; Qian, T.; Xiao, C.; Jin, J.; Su, B.; et al. Analyses of Genetic Structure of Tibeto-Burman Populations Reveals Sex-Biased Admixture in Southern Tibeto-Burmans. Am. J. Hum. Genet. 2004, 74, 856–865. [Google Scholar] [CrossRef]
- Johnson, J.A.; Moore, B.; Hwang, E.K.; Hickner, A.; Yeo, H. The accuracy of race & ethnicity data in US based healthcare databases: A systematic review. Am. J. Surg. 2023, 226, 463–470. [Google Scholar] [CrossRef]
- Hsieh, M.-C.; A Pareti, L.; Chen, V.W. Using NAPIIA to improve the accuracy of Asian race codes in registry data. J. Regist. Manag. 2011, 38. [Google Scholar]
- Cardena, M.M.S.G.; Ribeiro-Dos-Santos. ; Santos, S.; Mansur, A.J.; Pereira, A.C.; Fridman, C. Assessment of the Relationship between Self-Declared Ethnicity, Mitochondrial Haplogroups and Genomic Ancestry in Brazilian Individuals. PLOS ONE 2013, 8, e62005. [Google Scholar] [CrossRef]
- A Cook, L.; Sachs, J.; Weiskopf, N.G. The quality of social determinants data in the electronic health record: a systematic review. J. Am. Med Informatics Assoc. 2021, 29, 187–196. [Google Scholar] [CrossRef] [PubMed]
- Jones, S.W.; Ball, A.L.; Chadwick, A.E.; Alfirevic, A. The Role of Mitochondrial DNA Variation in Drug Response: A Systematic Review. Front. Genet. 2021, 12. [Google Scholar] [CrossRef] [PubMed]
- Zhou, Y.; Shi, J.; Stein, R.; Liu, X.; Baldassano, R.N.; Forrest, C.B.; Chen, Y.; Huang, J. Missing data matter: an empirical evaluation of the impacts of missing EHR data in comparative effectiveness research. J. Am. Med Informatics Assoc. 2023, 30, 1246–1256. [Google Scholar] [CrossRef] [PubMed]
- WorldAtlas Continents. Available online: https://www.worldatlas.com/continents (accessed on 12 July 2023).
- United Nations Statistical Division-Geographic Regions. Available online: ttps://unstats.un.org/unsd/methodology/m49/ (accessed on 12 July 2023).
- Wallace, D.C.; Chalkia, D. Mitochondrial DNA Genetics and the Heteroplasmy Conundrum in Evolution and Disease. Cold Spring Harb. Perspect. Biol. 2013, 5, a021220–a021220. [Google Scholar] [CrossRef]
- Vilar, M.G.; Chan, C.W.; Santos, D.R.; Lynch, D.; Spathis, R.; Garruto, R.M.; Lum, J.K. The origins and genetic distinctiveness of the chamorros of the Marianas Islands: An mtDNA perspective. Am. J. Hum. Biol. 2012, 25, 116–122. [Google Scholar] [CrossRef]
- Qiagen CLC Genomics Workbench system requirements. Available online: https://digitalinsights.qiagen.com/technical-support/system-requirements/ (accessed on 12 July 2023).
- Shen-Gunther, J.; Xia, Q.; Stacey, W.; Asusta, H.B. Molecular Pap Smear: Validation of HPV Genotype and Host Methylation Profiles of ADCY8, CDH8, and ZNF582 as a Predictor of Cervical Cytopathology. Front. Microbiol. 2020, 11, 595902. [Google Scholar] [CrossRef]
|
Disclaimer/Publisher’s Note: The statements, opinions and data contained in all publications are solely those of the individual author(s) and contributor(s) and not of MDPI and/or the editor(s). MDPI and/or the editor(s) disclaim responsibility for any injury to people or property resulting from any ideas, methods, instructions or products referred to in the content. |
© 2023 by the authors. Licensee MDPI, Basel, Switzerland. This article is an open access article distributed under the terms and conditions of the Creative Commons Attribution (CC BY) license (http://creativecommons.org/licenses/by/4.0/).
