Preprint
Article

Mechanistic Study and Application of Anionic/Cationic Combination Collector ST-8 for the Flotation of Spodumene

Altmetrics

Downloads

124

Views

13

Comments

0

A peer-reviewed article of this preprint also exists.

Submitted:

24 July 2023

Posted:

26 July 2023

You are already at the latest version

Alerts
Abstract
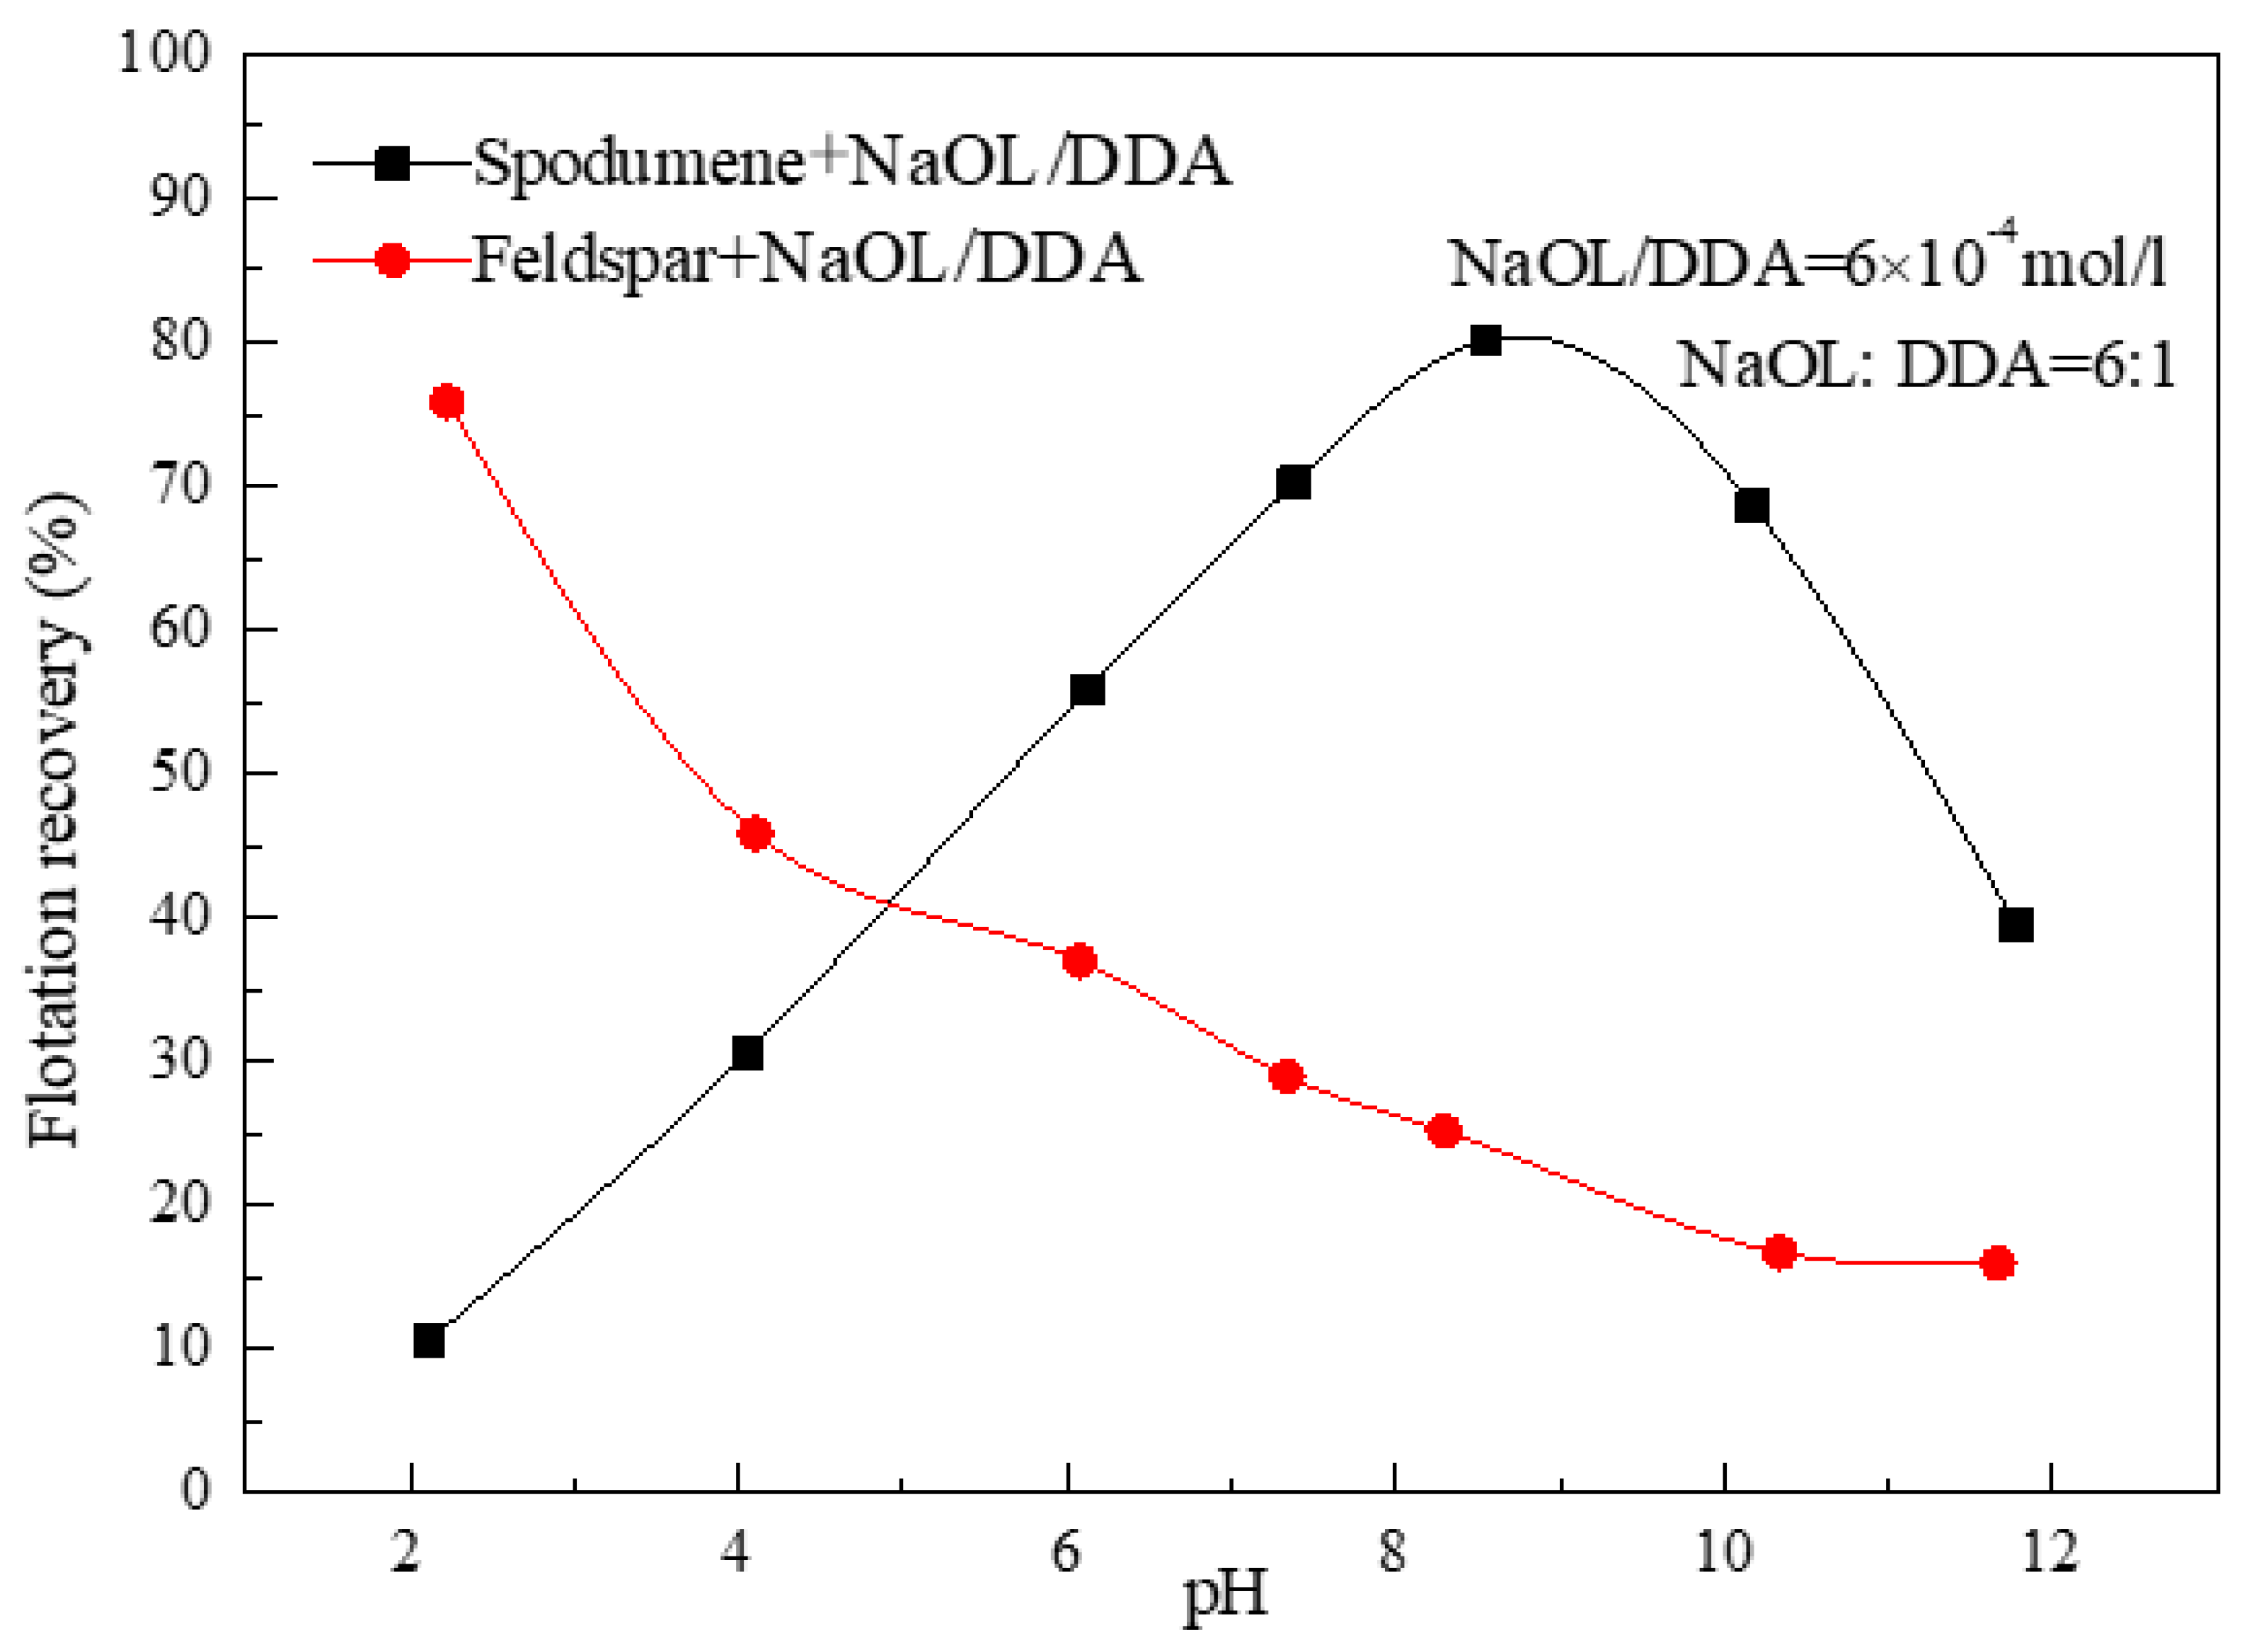
The mechanism of anionic/cationic combination collector ST-8 for the efficient separation of spodumene and feldspar was investigated by flotation tests, surface tension measurements, zeta potential measurements and infrared spectroscopy analysis. The flotation results indicated that when the optimum molar combination of sodium oleate and dodecylamine was 6:1-10:1 and pH=8.5 or so, the recovery of spodumene reached a maximum of 80% and that of feldspar reached about 24.5%. Zeta potential measurements showed that the negative shift of the kinetic potential on the surface of spodumene was much stronger than that on the surface of feldspar, indicating that the adsorption capacity of the combined collector on spodumene surface and feldspar surface was greatly different. From the surface tension as well as the synergistic parameters, there was a strong mutual attraction between dodecylamine and sodium oleate, and there was a significant synergistic effect between them. Infrared spectroscopy indicated that the combined collector chemisorbed on the mineral surface, and the intensity of the absorption peak after the action of spodumene was much stronger than that after the action of feldspar. The solution chemistry of the combined collector revealed that at pH 8.5, the positively charged ions RNH3+ and (RNH3+)22+ in dodecylamine and the negatively charged RCOO- and (RCOO-)22- ions in oleic acid form highly reactive complexes to interact with the mineral surface by electrostatic gravitation, thus achieving efficient separation of spodumene and feldspar. Finally, from the closed circuit test results, a flotation index of 6.34% Li2O grade and 88.51% Li2O recovery was obtained.
Keywords: 
Subject: Engineering  -   Mining and Mineral Processing

1. Introduction

Lithium, which was lighter, white in color and less dense, was a more metal active metal. Lithium was widely used in batteries, ceramics, glass, lubricants, metallurgy and nuclear industry. Therefore, lithium enjoys the reputation of "the new energy metal of the 21st century", "an important element to drive the world forward", "industrial MSG", etc [1,2].
For the flotation system of pegmatite silicate minerals, it had been a difficult problem in the field of mineral processing due to the small variability of the surface properties of its useful minerals and the main vein mineral feldspar, and the poor selectivity of the action with flotation chemicals [3,4]. For a long time, for the flotation of silicate minerals, a lot of research work has been carried out at home and abroad, mainly focusing on the crystal structure of silicate minerals, surface properties, the mechanism of action of the collector and the enhancement of the collecting performance. Regarding the enhancement of flotation agent recovery performance, Wang Dianzuo proposed the "activity-selectivity principle of flotation agents" [5]: agents with low reactivity are more selective for minerals, while flotation agents with higher activity are necessarily less selective. According to this principle, it is difficult to obtain good selectivity and high recovery of flotation at the same time by using monofunctional group agents alone. There were two ways to give consideration to both activity and selectivity: one was to use multi-functional agents, such as agent modification and synthesis of new agents, to obtain good flotation effect through the advantages of multi-functional compounds in the bonding process, the interaction between functional groups or the coordination between different active functional groups; The second was the combination of drugs, through different drug combinations, different active components and selective complementation to produce synergy. For modified agents and newly developed high-efficiency agents, it was generally difficult to completely replace the traditional flotation agents considering the cost of agents. Therefore, the use of combined reagents had always been an important topic in the research of flotation reagents.
In this paper, the combined collector was used as the collector to investigate the effect of pH value, the ratio of sodium oleate and dodecylamine on the floatability of spodumene, and the mechanism was discussed by Zeta potential test and infrared spectrum analysis, which provided a theoretical basis for spodumene flotation.

2. Experiment

2.1. Ore Samples, Main Reagents and Instruments

The spodumene ore sample used in the test was taken from the pegmatitic Xinjiang Cocotohai rare metal mine of similar ore genesis, and the sodium feldspar ore sample was taken from Hengshan, Hunan. The ore blocks were hand crushed and hand sorted to remove impurities; then the two selected monominerals with higher purity were crushed to about 5 mm by a jaw crusher with corundum liner, and then ground finely by a ceramic ball mill and sieved to control the particle size of the monomineral samples between -0.075 mm and +0.038 mm. The two monomineral products were washed several times with ultrapure water, and filtered and dried at low temperature (50°C), and the final mineral samples obtained were stored in wide-mouth glass bottles for backup. The results of chemical composition analysis of the two monominerals were shown in Table 1. The results of the multi-element analysis of raw ore were shown in Table 2.
Main agents: (1) pH adjuster: H2SO4, NaOH, analytical pure; (2) Cationic collector: dodecylamine(DDA); (3) Anionic collector: sodium oleate(NaOL); The test water is distilled water.
Main equipment and instruments: XFG(40ml) hanging cell flotation machine; Zetasizer nano Zs90 Zeta potential analyzer; Jk99cm automatic tension meter; PE frontier type Fourier transform mid / far infrared spectrometer.

2.2. Test method

2.2.1. Flotation Test

A 40ml XFG hanging cell flotation machine was used for single mineral flotation test. The rotation speed of the main shaft of the flotation machine is 1600r/min in the single mineral test, 2.0g of single minerals were weighed each time and put into the flotation cell. 35ml of deionized water was added. After stirring for 2min, H2SO4 or NaOH was added to adjust the pH value for 2min, and then the collector was added. After stirring for 3min, the pH was measured and the flotation was conducted for 5min. Finally, the foam products were scraped out manually with a scraper. The products were filtered, dried and weighed, and the floating rate was calculated. (calculation of floating rate: ε= M1/(M1+M2) × 100%, where M1 is the foam product and M2 is the product in the tank.)

2.2.2. Determination of Zeta Potential

The mineral sample was ground to -2μm with an agate mortar, and 20mg of the mineral sample was added into a 100ml beaker with 50ml of ultrapure water, stirred for 2min with a magnetic stirrer, then the pH value was adjusted with HCl or NaOH to determine the pH value of the slurry, and finally a certain concentration of trapping agent was added and stirred for 5min to fully disperse the slurry, and the upper layer of diluted slurry was taken after settling for 10min. After settling for 10 min, the upper diluted slurry was injected into the electrophoresis cell of Zetasizer Nano Zs90 potentiometric analyzer for potential determination. Each sample was measured 3 times and the average value was taken.

2.2.3. Determination of Surface Tension

The critical micelle concentration of the drug can be determined by measuring the surface tension. The test instrument is JK99cm full-automatic tensiometer and the ring method was used. The test method was to take 50ml distilled water, add different concentrations of chemicals, and measure the surface tension until the inflection point appears.

2.2.4. Infrared Spectrum Test

The infrared spectra of minerals, reagents and products after the interaction of minerals and reagents were measured by transmission method on PE frontier type Fourier transform mid / far infrared spectrometer. Preparation method and test method of ore sample with agent interaction: add 2g mineral grinding to -5μm in the flotation tank, and then add various agents according to the flotation test sequence. After pulping, the ore sample was taken out, cleaned with distilled water under the same pH condition for 3 times, and then vacuum-filtered, and the solid product was naturally air-dried at room temperature. For measurement, 1mg of mineral was mixed evenly with 100mg of spectrally pure KBr and ground with an agate mortar. Then it is added to the special grinding tool for pressing, making, and finally tested.

3. Results and Discussion

3.1. Effect of the Ratio of NaOL and DDA and pH Value on the Floatability of Spodumene

Using NaOL and DDA as single collector, NaOL and DDA were used in combination according to the molar ratio of 10:1, 8:1, 6:1, 4:1, 2:1 and 1:1. The influence of the ratio and dosage of NaOL and DDA on the flotation behavior of spodumene was investigated. The results were shown in Figure 1 and Figure 2.
It could be seen from Figure 1 that when NaOL: DDA < 6:1, with the decrease of the proportion of DDA in the combined collector, the recovery rate of feldspars decreased rapidly from 82.12% when NaOL: DDA =1:1 to 25.18% when NaOL: DDA =6:1;When NaOL: DDA > 6:1, the recovery rate of feldspar showed a trend of slow decline with the decrease of DDA ratio in the combined collector. For spodumene, with the decrease of DDA proportion in the combined collector, the recovery rate of spodumene did not decrease significantly, basically tends to a stable value, and its stable recovery rate was 80%. Therefore, it can be known that the combined collector for flotation separation of spodumene and feldspar, the best molar combination ratio of anionic collector NaOL and cationic collector DDA was 6:1-10:1. As can be seen from Figure 2, the recovery of spodumene firstly increases with the increase of pH, from 10.58% at pH=2.18 to 80.15% at pH=8.55, and then the continued increase of pH would reduce the recovery rate of spodumene. At pH=11.78, the recovery rate of spodumene decreased to 39.49%. The recovery of feldspar decreased with the increase of pH, from 75.84% at pH=2.23 to 15.97% at pH=11.67. It could be seen that the combined collecting agent had a large flotation variability for spodumene and feldspar at about ph=8.5. Yu Fushun et al [6] explained from the quantum chemical point of view that the exposed Al and Li metal cation activation centers on the surface of spodumene create good conditions for the adsorption of ion-molecule congeners formed by mixing NaOL and DDA, while the surface of feldspar and quartz minerals lack effective metal ion activation centers and had a weaker effect with the combined collecting agent, so the use of combined NaOL and DDA collecting agent could achieve spodumene selective flotation.

3.2. Effect of Combined Collectors on Zeta Potential of Spodumene Surface

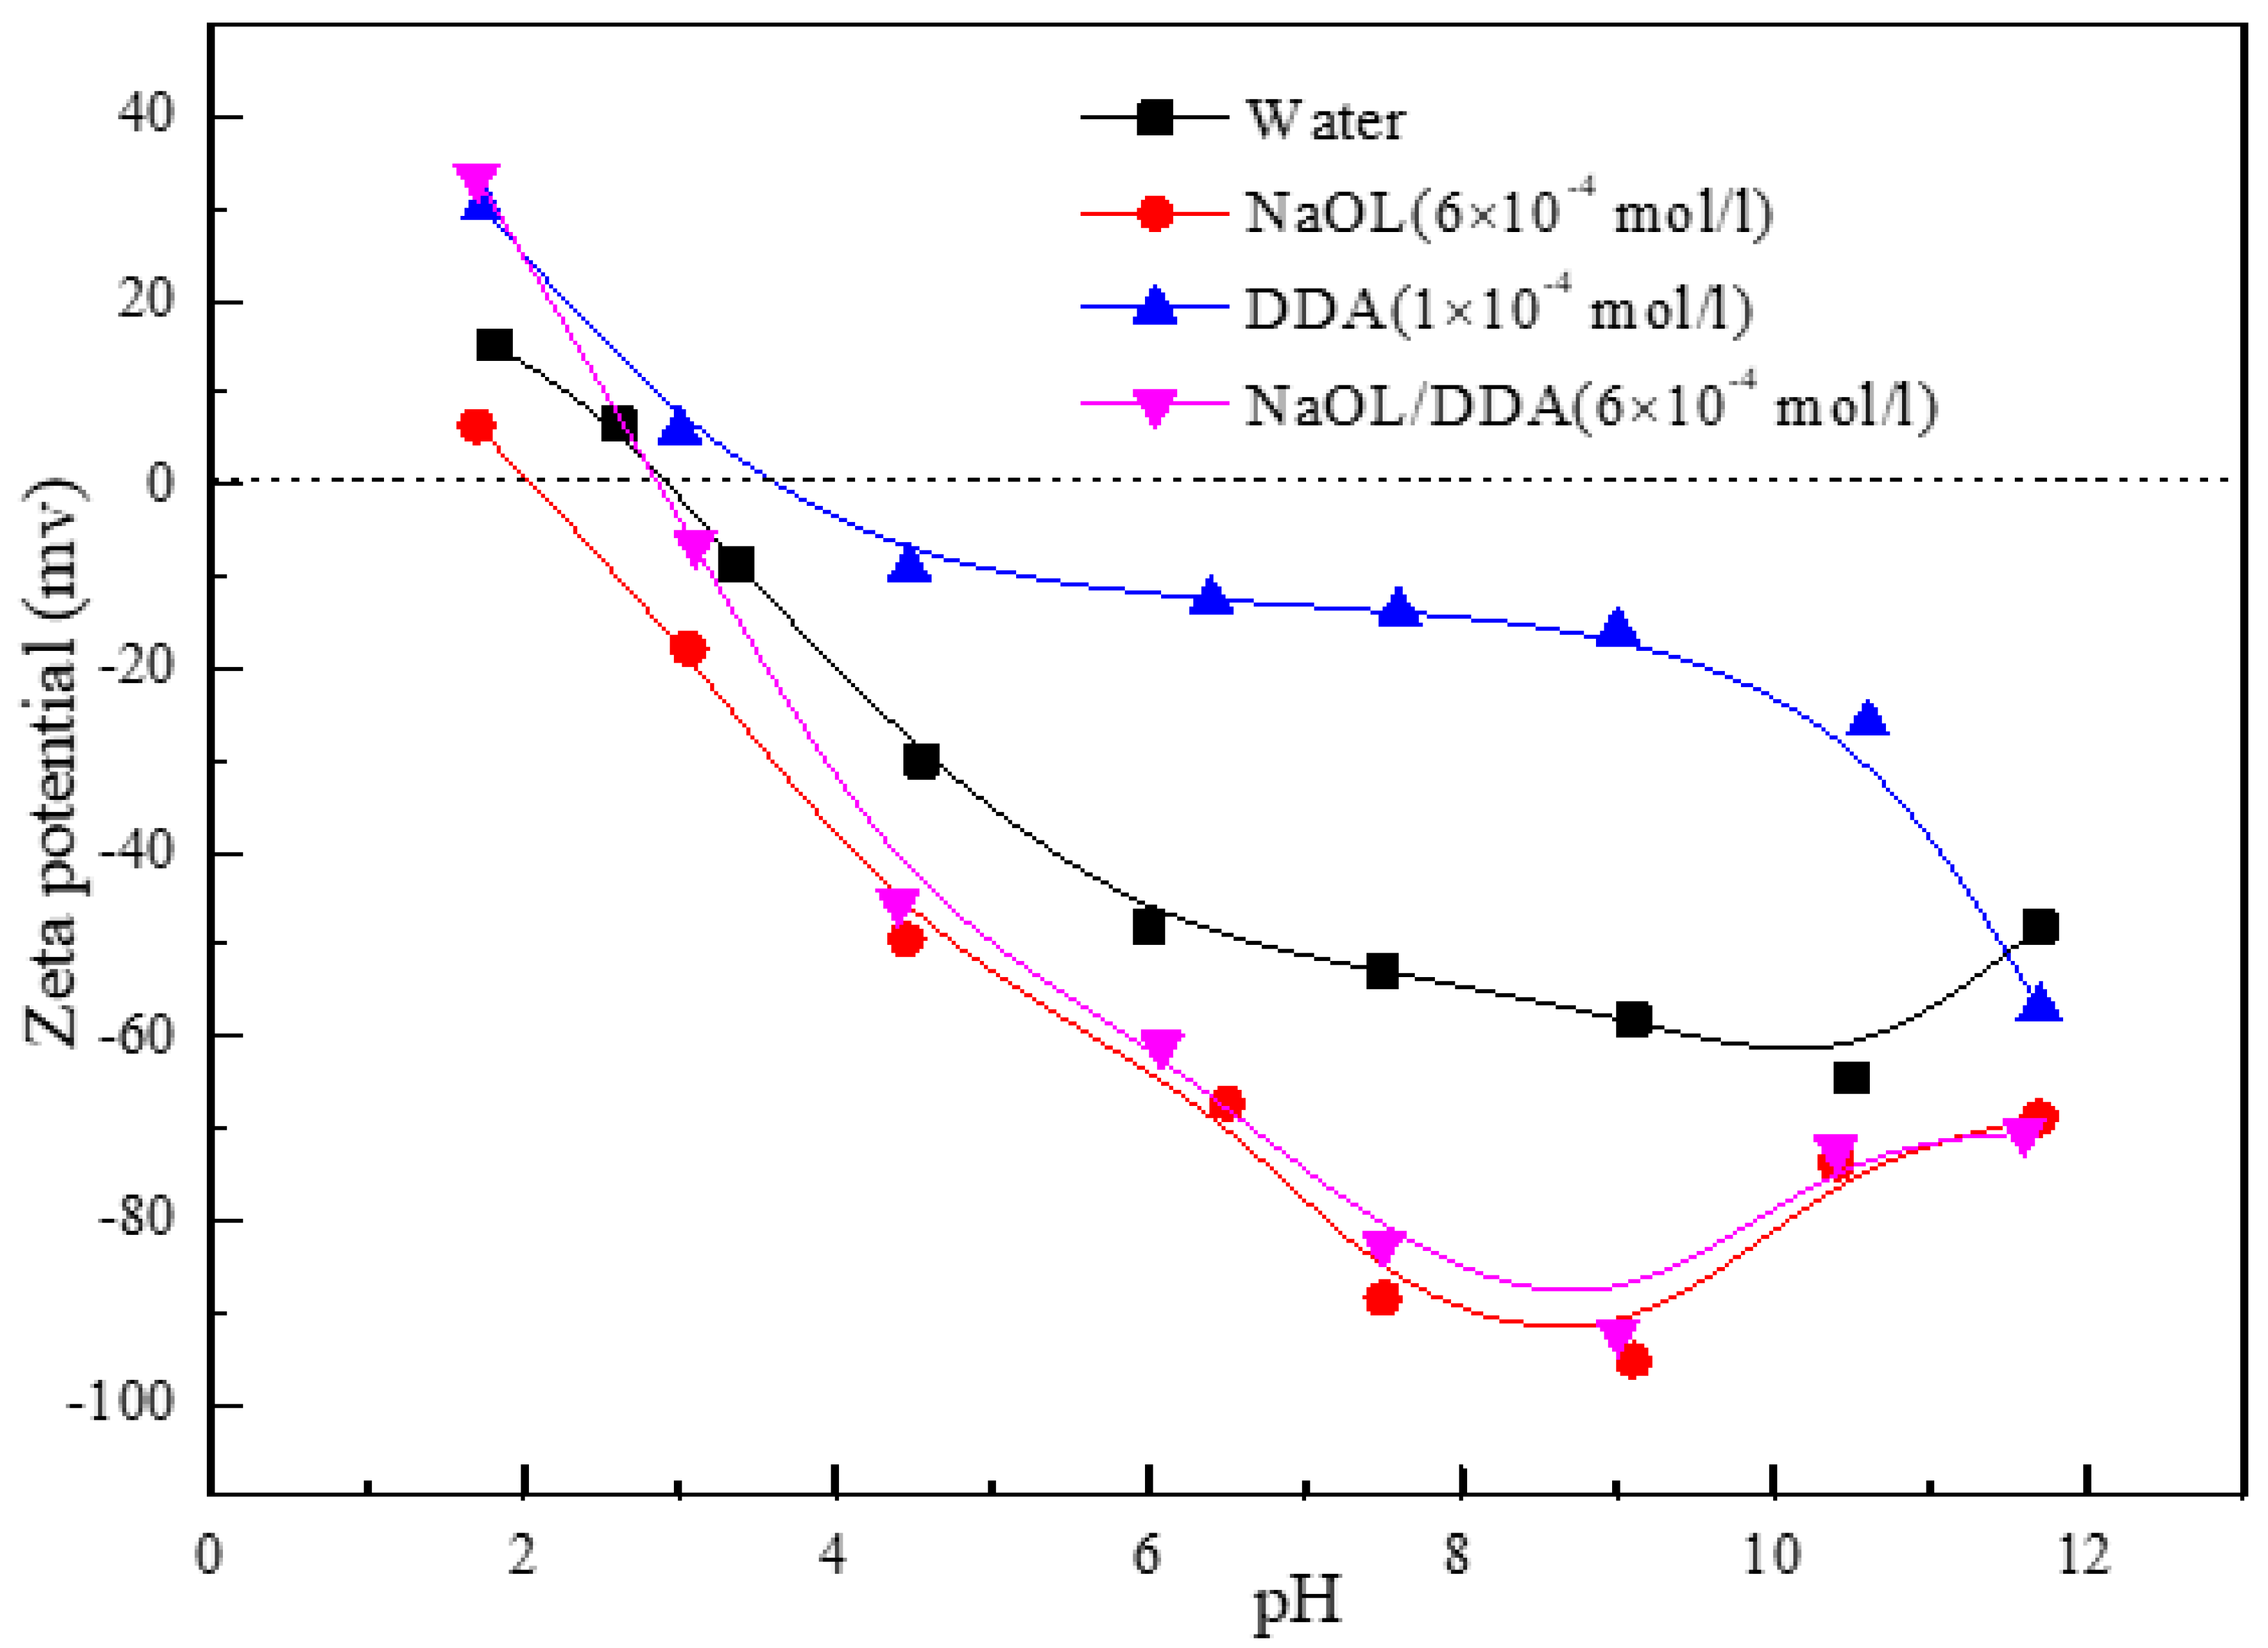
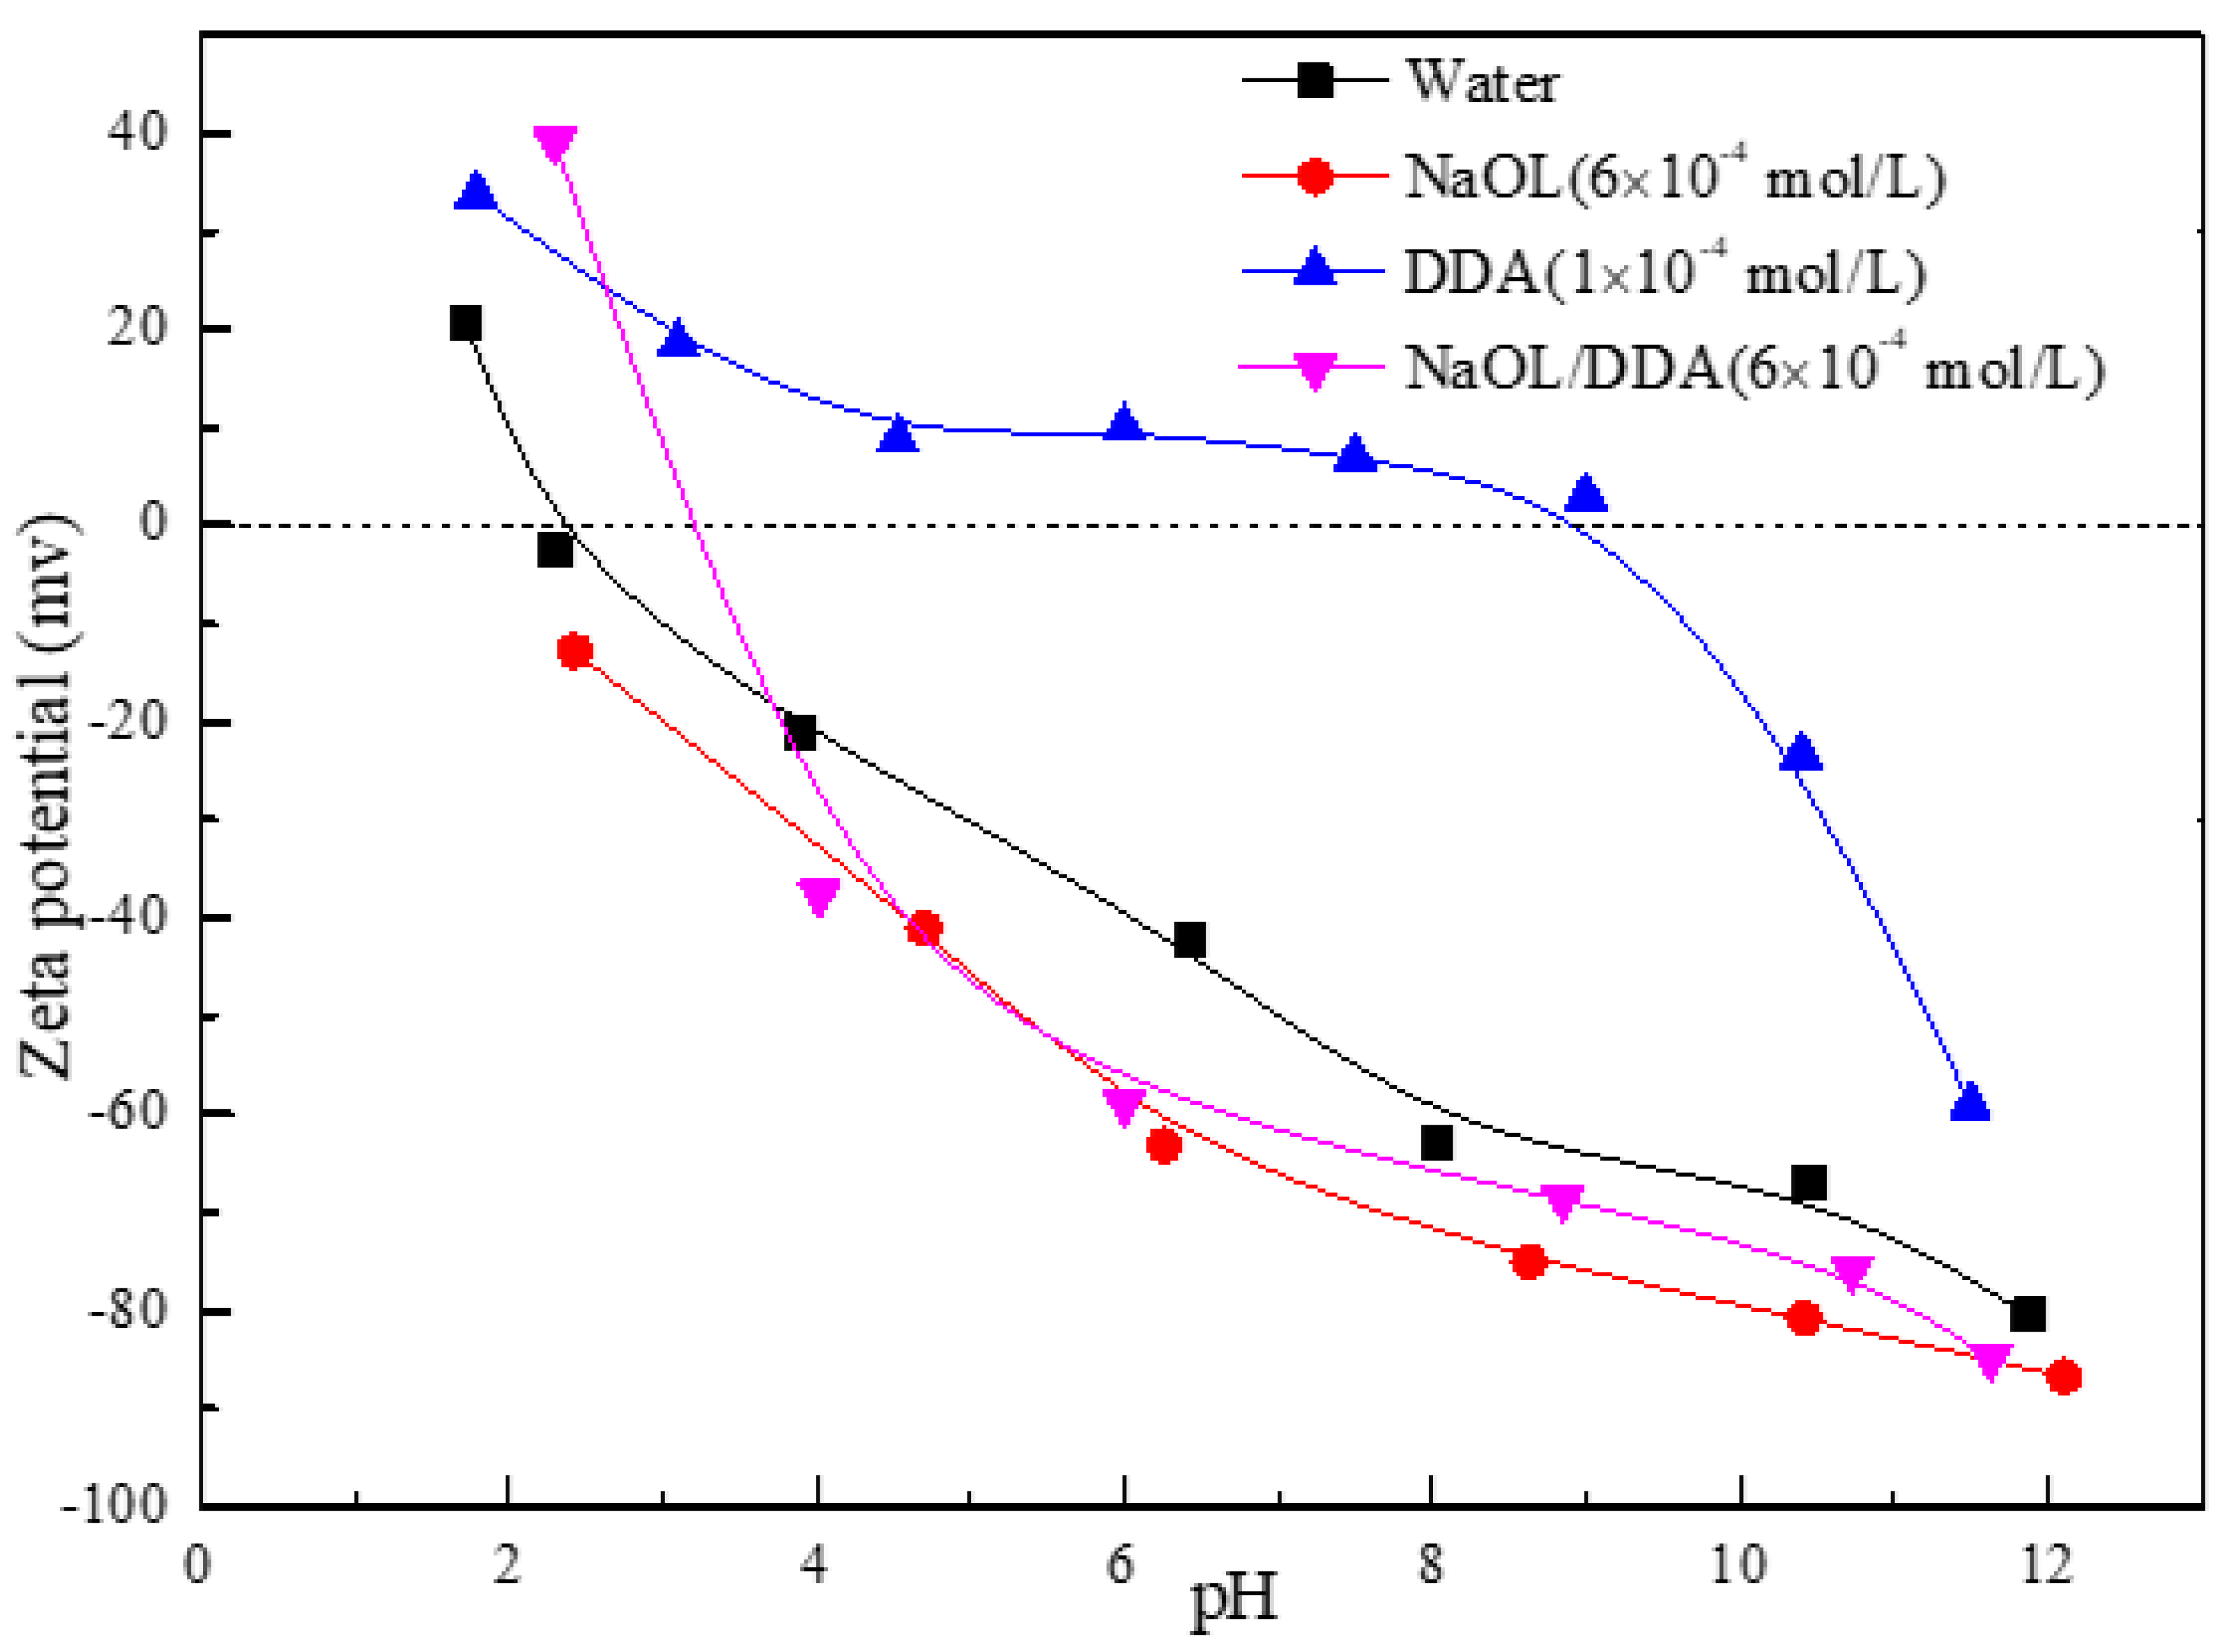
The development direction of collector for flotation separation of spodumene was from single drug to mixed drug. It could be seen from the literature that combined collecting agents had certain advantages over single collecting agents, and the mechanism of this positive synergistic effect was more complicated [7]. In this study, the zeta potential of spodumene and feldspar surfaces were measured from the perspective of the variation of spodumene surface potential under different collector systems and different pH conditions, and the results were shown in Figure 3 and Figure 4.
It could be seen from Figure 3 and Figure 4 that after the interaction of NaOL with minerals, the Zeta potential on spodumene surface had a large negative shift in the whole pH value range. However, the negative shift of zeta potential on the surface of albite was not large, which indicated that the adsorption of NaOL on spodumene surface was strong and the adsorption of NaOL on albite surface was weak. In DDA solution, the surface potential of spodumene and feldspar were significantly positive shifted, indicating that DDA had relatively strong adsorption on the surface of these two minerals. However, in strong alkaline solution, the positive shift degree of electrodynamic potential on spodumene and feldspar surface was obviously reduced. In the combined collector solution, the negative shift degree of the dynamic potential on the surface of spodumene was obviously stronger than that on the surface of feldspar, which indicated that the adsorption capacity of the combined collector on the surface of spodumene and feldspar was quite different, so that the separation of spodumene and feldspar could be realized.

3.3. Analysis of Surface Tension Determination of Combined Collecting Agents and Calculation of Synergistic Parameters

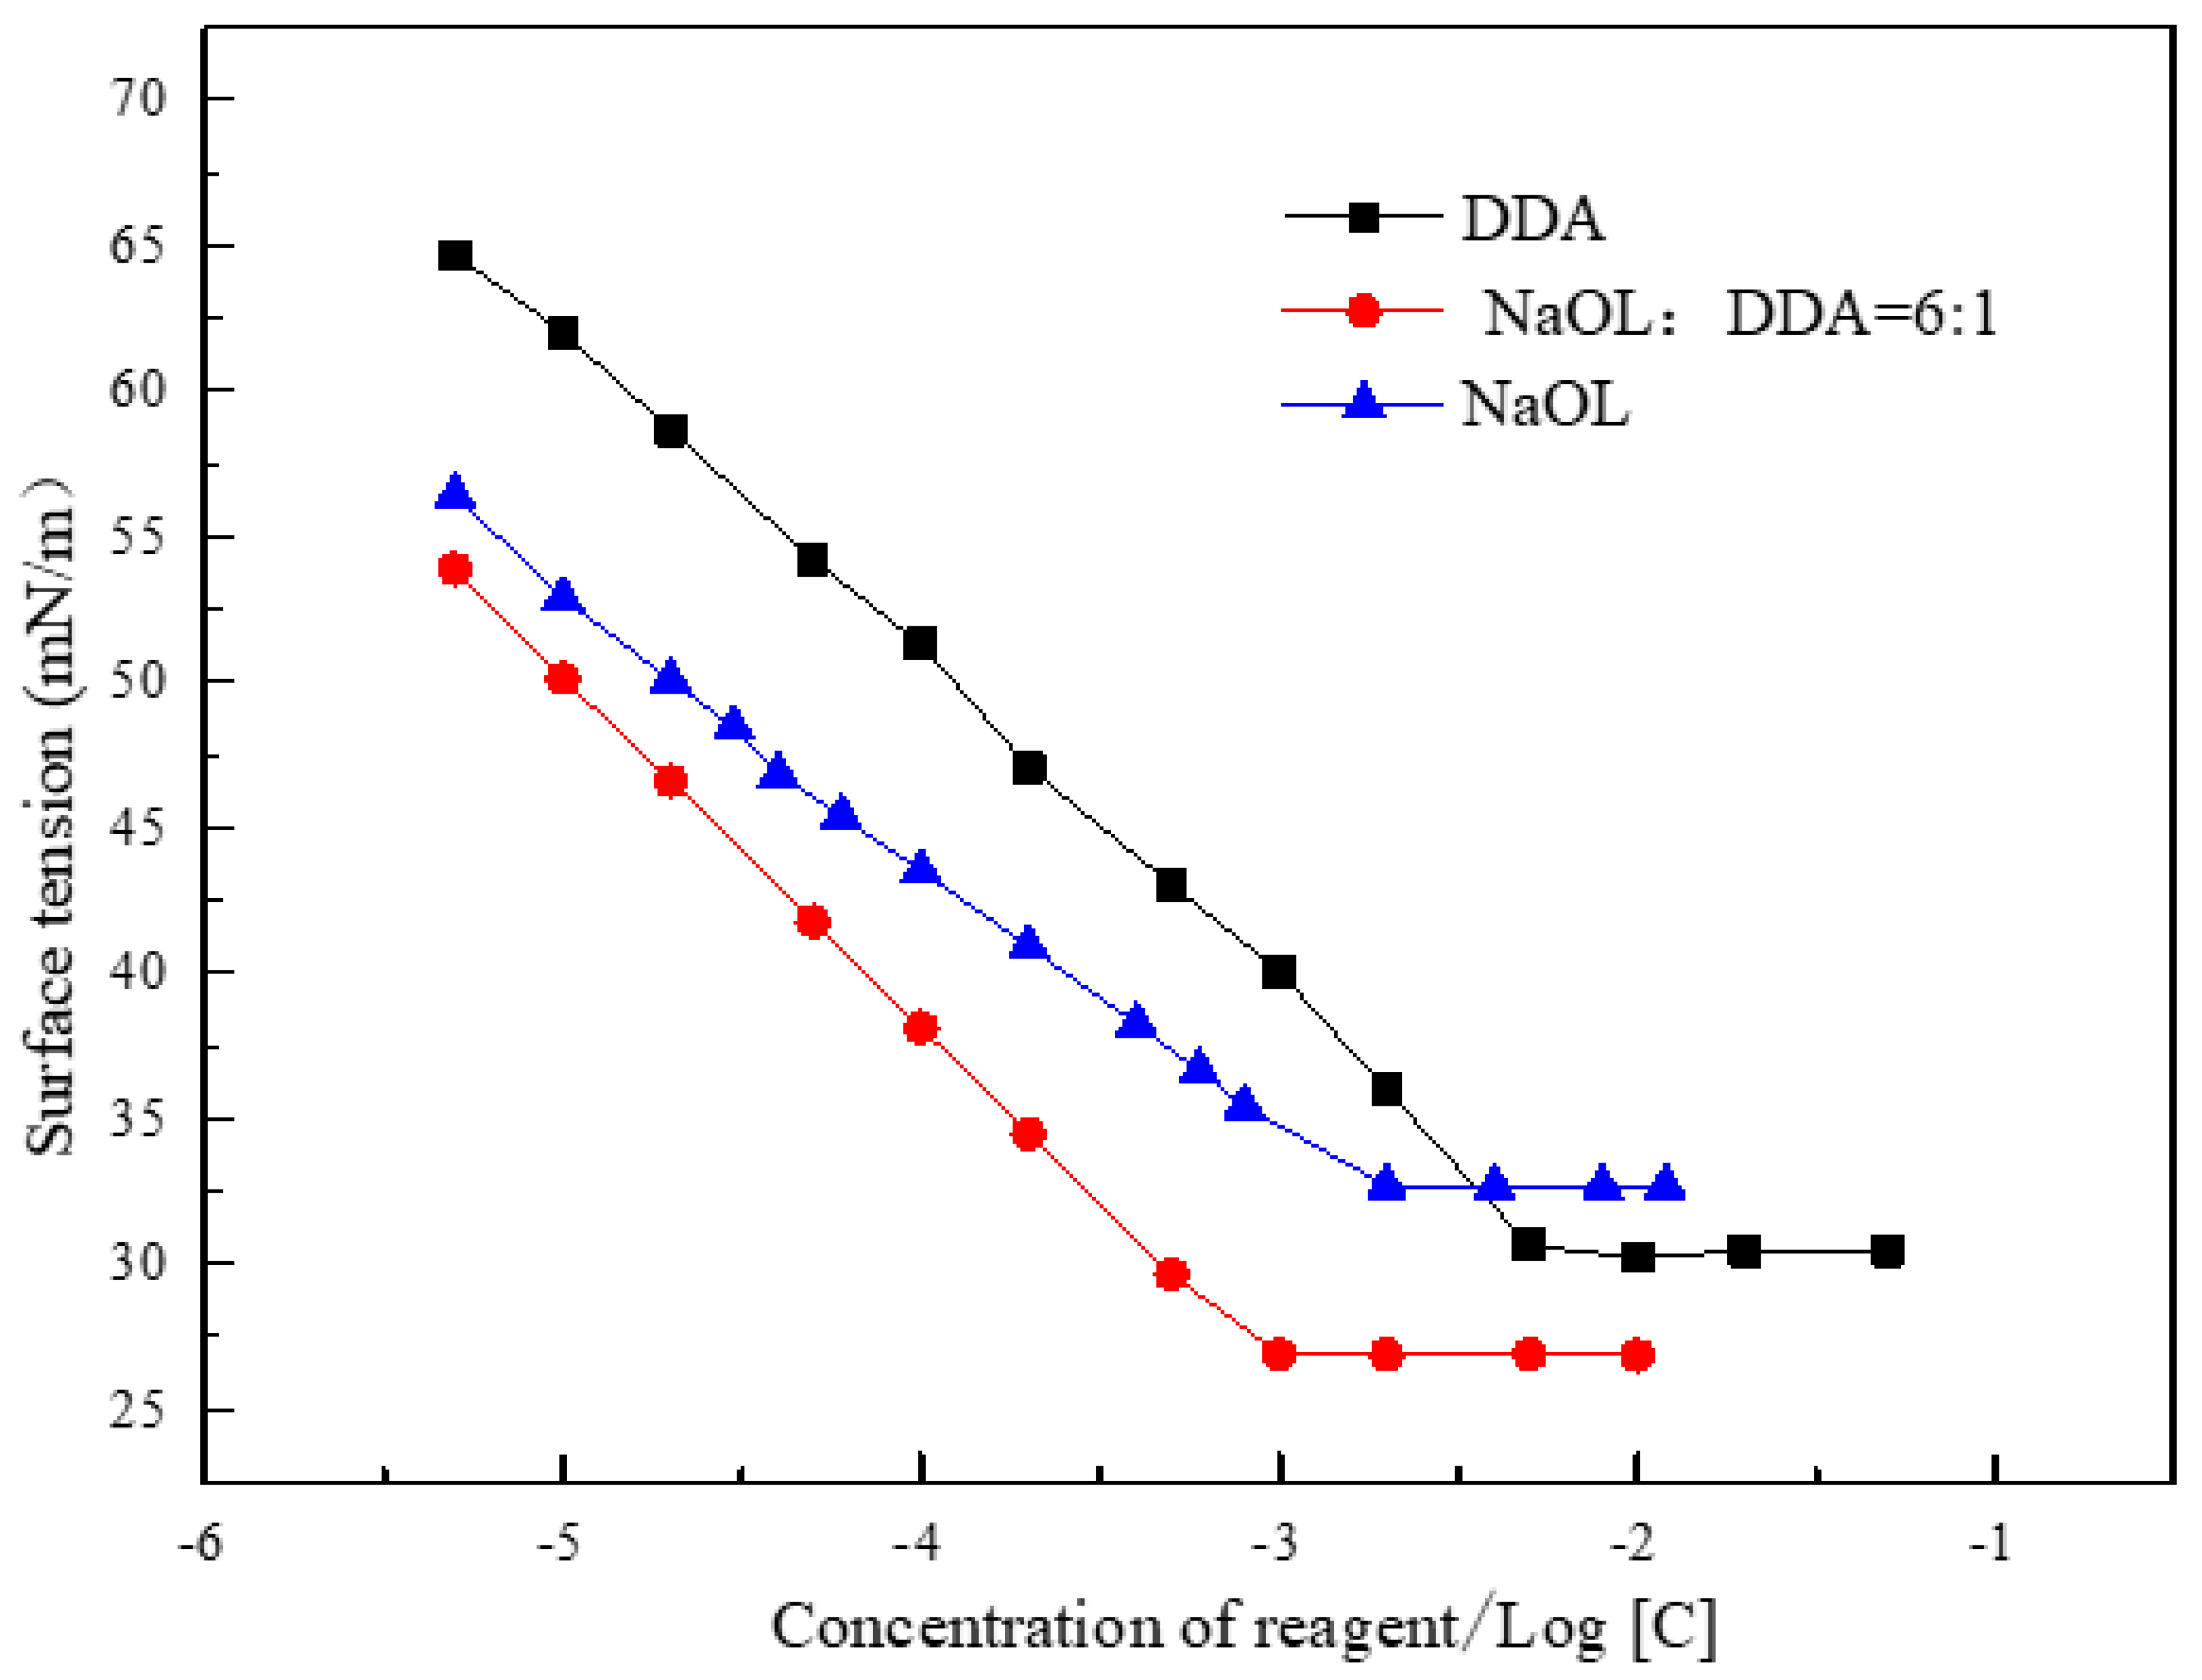
In order to investigate the relationship between the surface tension and the concentration of anionic and cationic combination collectors, as well as anionic and cationic collectors, the surface tension of DDA, NaOL and the combination collector formed by combining NaOL and DDA at a molar ratio of 6:1 were measured respectively, and the results were shown in Figure 5.
The results of Figure 3 showed that the trace addition of NaOL in water significantly reduces the surface tension of water, and with the increase of the concentration of NaOL, the surface tension of the solution gradually decreases. When the concentration of NaOL was 1.58×10⁻³mol/L, the surface tension of the solution reached a minimum of 32.7mN/m, and then the increase of the concentration of NaOL cannot significantly reduced the surface tension of water. Therefore, the CMC value of NaOL could be determined to be about 1.58×10⁻³mol/L. Similarly, it could be seen that the CMC value of DDA was about 3.98×10⁻³mol/L, and the surface tension was 30.6mN/m. The surface tension test results of the aqueous solution of the combined collector showed that the CMC value was about 1.0×10⁻³mol/L, and the surface tension of the aqueous solution was 26.9mN/m at the CMC value. Under the condition of the same agent concentration, the surface tension of the combined anionic and cationic collector was lower than that of the separate anionic and cationic collectors. At the same time, the surface tension of the anionic and cationic combination collector tended to a stable value when the concentration was 10-3mol/L, but it was lower than that of the single ion collector, and the surface tension of the single ion collector still had a downward trend. The lower the surface tension of the combined collectors, the stronger the synergistic effect between the collectors. In order to quantitatively describe the magnitude of the anion-cation synergy in the combined collectors, the interaction parameter   β m between the combined collectors was calculated [8].
The interaction parameters between the combined anionic and cationic collectors could be derived from the Rubingh and Rosen [9,10] theoretical model with the equations shown in Eqs. 1,2 and 3.
( X c a m ) 2 ln ( X c a C M C m i x m X c a m C M C c a m ) ( 1 X c a m ) 2 ln ( ( 1 X c a ) C M C m i x m ( 1 X c a m ) C M C a n m ) = 1
            β m = ln X c a C M C m i x m X c a m C M C c a m ( 1 X c a m )
ln f c a m = β m 1 X c a m 2
In the formula, X c a m   and X c a were the molar fractions of the combined collector micelles and the cationic collector in the combined collector; C M C c a m , C M C a n m and C M C m i x m were the critical micelle concentrations of the cationic collector, the anionic collector and the combined collector solution;   β m was the interaction parameter between the collector molecules in the combined collector micelles;   β m < 0 and f c a m < 1 meant that the two components had mutual attraction;   β m > 0 and f c a m > 1 meant that the two components had mutual repulsion;   β m ≈ 0 and f c a m ≈1 meant that the interaction between the two components in the combined trap was the same as that in the single trap system.   β m < 0, f c a m < 1, indicating mutual attraction between the two components;   β m > 0, f c a m > 1, indicating mutual repulsion between the two components;   β m ≈ 0, f c a m ≈ 1, indicating that the interaction between the two components in the combined collector was the same as the interaction between the same molecules in the single trap system [11,12,13].
Bringing the critical micelle concentration (CMC) of Fig. 3 into Eqs. 1, 2 and 3, it could find   β m = 0.03 ; f c a m = 0.97 . According to the calculation results of relevant parameters, the   β m value in the combined collector system was negative and the f c a m value was less than 1, indicating that there was mutual attraction between the cationic collector DDA and the anionic collector NaOL, and the strength of attraction was greater than their individual action before mixing.

3.4. Infrared Spectrum Analysis of the Product of Combined Collector on Spodumene and Feldspar Surfaces

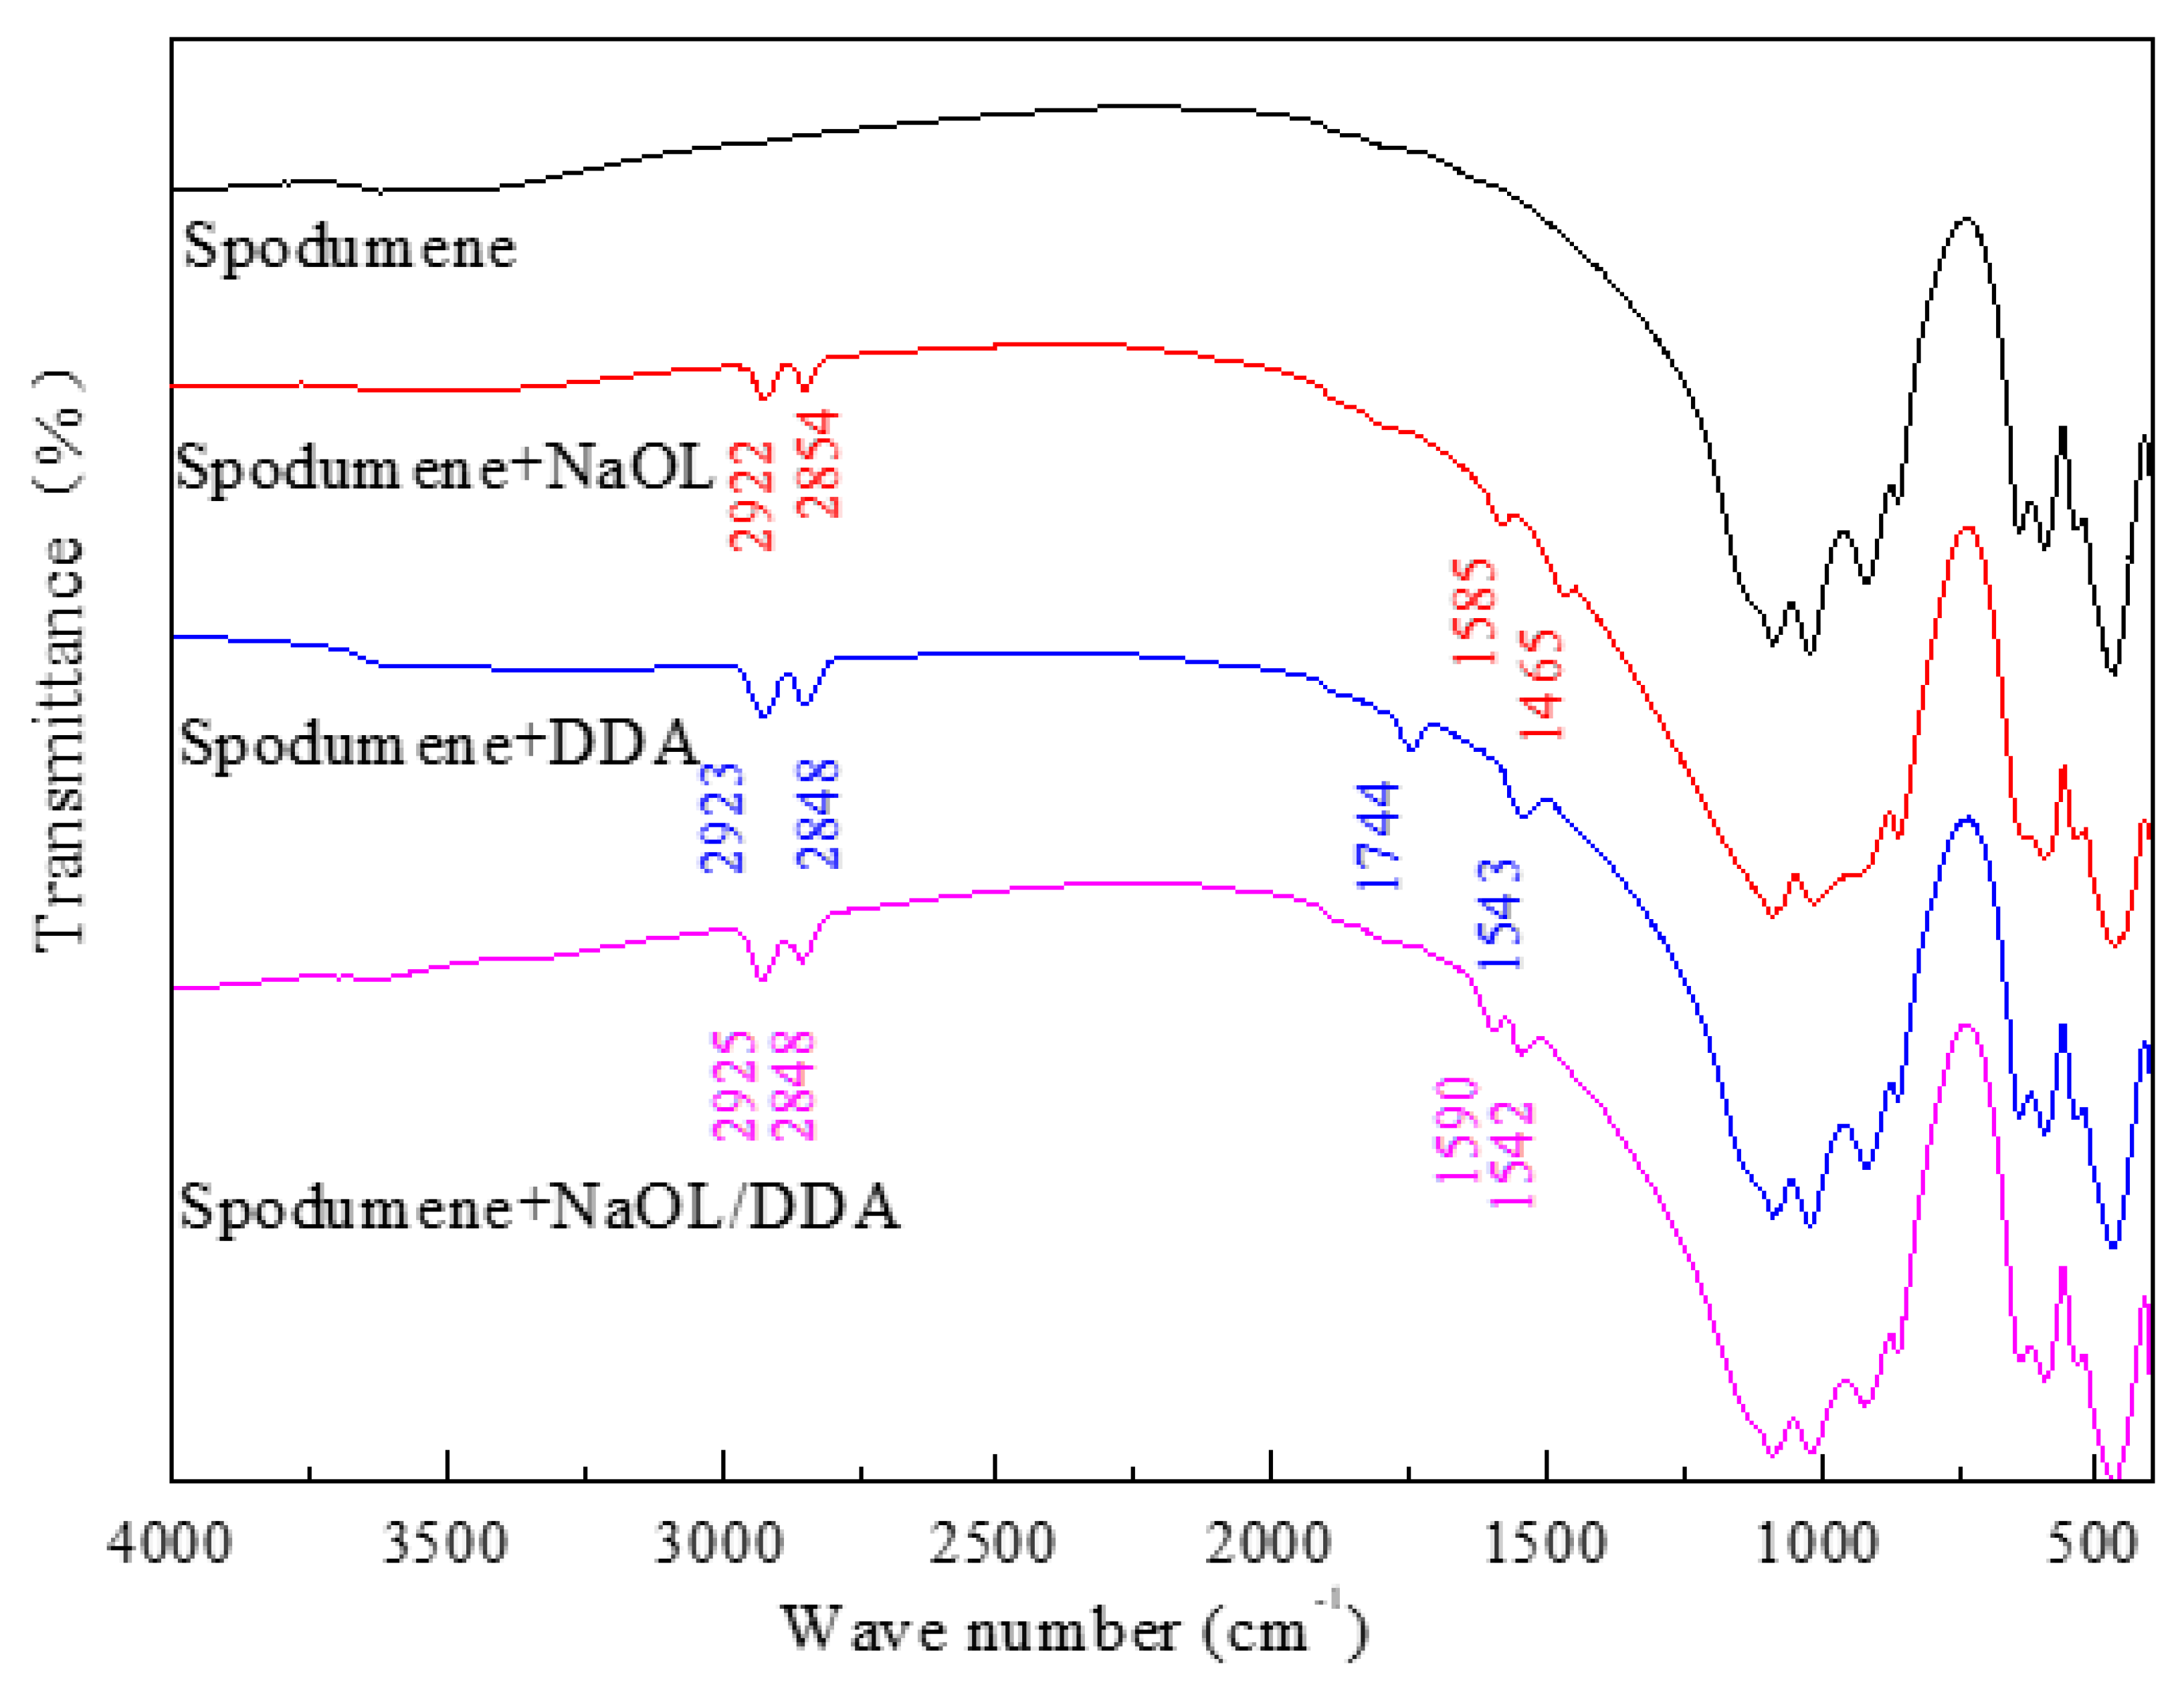
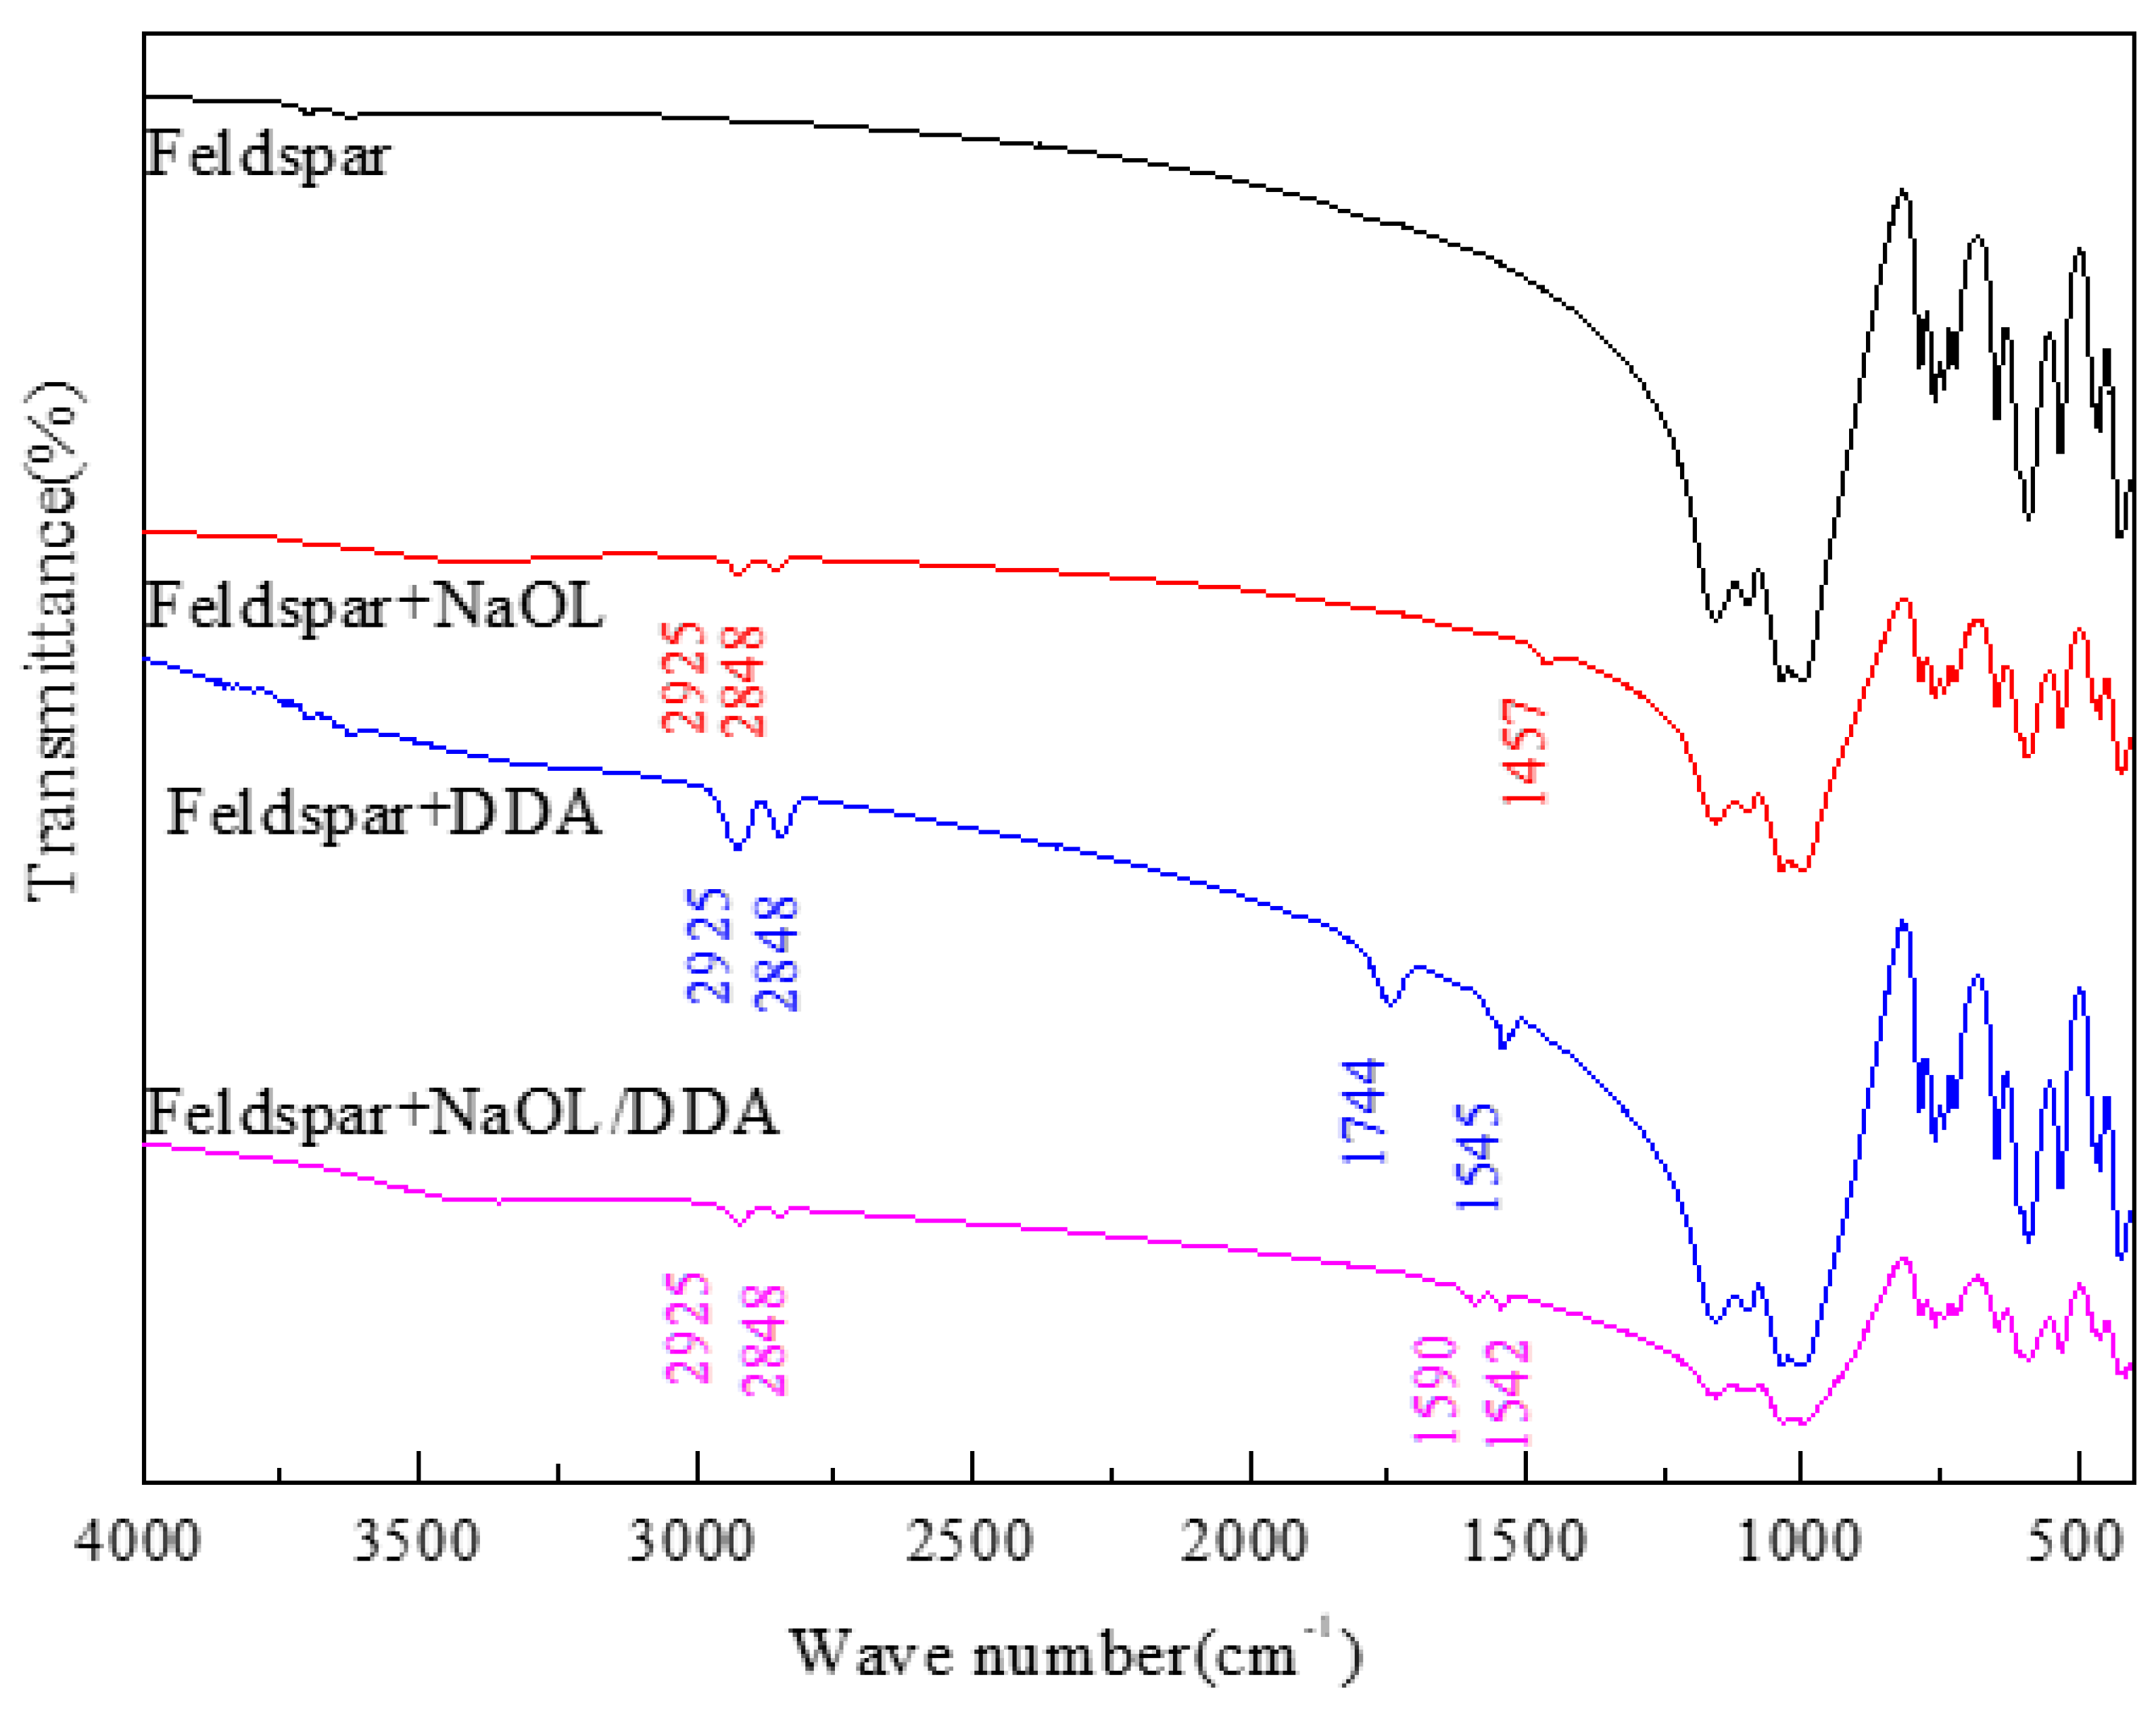
In order to further explore the interaction mechanism of mixed collectors with spodumene and feldspar, the products of different collectors with spodumene and feldspar were analyzed by infrared spectroscopy [14,15]. According to the standard infrared spectrum of NaOL, the two absorption peaks of 2923cm-1 and 2848cm-1 were the symmetric vibration absorption peaks of C-H bond in -CH2- and -CH3 in NaOL. The two absorption peaks of 1562 cm-1 and 1448 cm-1 were the characteristic absorption peaks of carboxylate, which were the asymmetric and symmetric stretching vibration absorption peaks of -COO- group in the carboxy group, respectively[16,17]. In the standard infrared spectrum of DDA, the absorption peaks at 1543 cm-1 and 1109 cm-1 were the bending vibration absorption peak of -NH2 and the stretching vibration absorption peak of C-N [18,19]. The absorption peaks at 3236cm-1 and 3294cm-1 were symmetric and asymmetric stretching vibration absorption peaks of -NH2. Figure 6 and Figure 7 were infrared spectra of spodumene and feldspar before and after acting with the combined collector, respectively.
As could be seen from the spectra of spodumene after interaction with NaOL in Figure 6, new absorption peaks appear at 2922 cm-1, 2854 cm-1, 1585 cm-1 and 1465 cm-1, respectively. These peaks corresponded to the symmetric stretching vibration absorption peaks of -CH2- and -CH3, the asymmetric stretching vibration absorption peaks of -C=O- group and the symmetric stretching vibration absorption peaks, and the positions of the two characteristic absorption peaks of carboxyl group were shifted to a certain extent, indicating that NaOL had obvious chemical adsorption on the spodumene surface. New absorption peaks appeared at 2923 cm-1, 2848 cm-1, 1744 cm-1 and 1543 cm-1 in the spectra of spodumene interacted with DDA. The absorption peak at 1543 cm-1 corresponded to the bending vibration absorption peak of -NH2, and the peak position did not appear to be shifted, indicating that DDA had physical adsorption on the spodumene surface.
In the spectrum after the action of the spodumene and the combined anion and cation collector, the C-H bond symmetric stretching vibration absorption peak appeared at 2925cm-1 and 2848 cm-1, and the stretching vibration absorption peak of the carboxylic COO- interaction with the mineral surface appeared at 1590cm-1.Compared with the band of the characteristic absorption peak of the carboxyl group of NaOL, the obvious shift occurred, indicating that the chemical adsorption of the agent and the mineral surface occurred. The absorption peak at 1542cm-1 was exactly the same as the bending vibration absorption peak position of -NH2 of DDA, indicating that the amine on the mineral surface still existed in the form of molecules.
In Figure 7, only part of the characteristic absorption peak of NaOL appeared in the spectrum of feldspar after interaction with NaOL, indicating that NaOL only weakly adsorbed on the surface of feldspar. The characteristic absorption peaks of 1744 cm-1 and 1545 cm-1 of dodecylamine appear in the spectra after the interaction between feldspar and dodecylamine, indicating that dodecylamine also had a certain adsorption on the surface of feldspar. In the spectrum of feldspar combined with anion collector, the absorption peak was similar to that of spodumene combined with anion collector, but the absorption peak of spodumene combined with anion collector was more obvious than that of feldspar combined with anion collector. This indicated that the adsorption strength of the combined anion collector on spodumene was greater than feldspar, and the adsorption on spodumene and feldspar surface was selective.

3.5. Solution Chemistry

DDA and oleic acid were weak electrolyte surfactants, and their presence in the solution hd a great relationship with the pH of the solution [20]. In the mixed collector solution, the anionic surfactant NaOL and the cationic surfactant DDA would have a neutralization reaction to form the NaOL-DDA complex, but there was no strong bond between the carboxyl functional group of NaOL and the amino functional group of DDA [21]. So the possible reason for the formation of the NaOL-DDA complex was due to the hydrogen bonding of the electronnegative atoms O and N in the carboxyl functional group of oleic acid and the amino functional group of DDA. Therefore, it could be considered that the existence state of each component in the combined collector NaOL/DDA in solution was similar to the existence state of NaOL and DDA alone in aqueous solution.
Both DDA and NaOL were weak electrolytes and undergo hydrolysis reactions when dissolved in water with the following acid-base equilibrium, dissociation equilibrium, conjugation equilibrium reactions and equilibrium constants:
Acidolytic dissociation equilibrium [22]:
R N H 3 + R N H 2 ( aq + H + K a = [ H + ] [ R N H 2 ( a q ) ] [ R N H 3 + ] = 1 0 10.63
Dissolution equilibrium:
R N H 2 ( S ) R N H 2 ( a q ) S = 2.0 × 1 0 5 mol / l
From Eq. 5, it could be seen that when [ R N H 2 ( aq ) ] = S , an amine precipitate was formed.
Ion-conjugation equilibrium:
2 R N H 3 + ( R N H 3 + ) 2 2 + K d = ( R N H 3 + ) 2 2 + [ R N H 3 + ] 2 = 1 0 2.08
Ion-molecule association equilibrium:
R N H 3 + + R N H 2 ( aq ( R N H 3 + · R N H 2 ( aq ) K 1 m = [ R N H 3 + · R N H 2 ( aq ] [ R N H 3 + ] [ R N H 2 ( aq ] = 1 0 3.12
Then MBE is C T = [ R N H 2 ( a q ) ] + [ R N H 3 + ] + 2 [ ( R N H 3 + ) 2 2 + ] + 2 [ R N H 3 + · R N H 2 ( a q ) ] Substituting equations 4, 5, 6 and 7 into the MBE equation and making K B = [ H + ] K a ,then get
2 ( K d K B 2 + K 1 m K B ) [ R N H 2 ( aq ] 2 + ( 1 + K B ) [ R N H 2 ( aq ] C T = 0
From the mixed collector concentration of 6×10⁻⁴mol/l and the molar ratio of NaOL to DDA of 6:1, it could be obtained that the concentration of DDA is C T = 6 × 1 0 4 × 1 7 = 8.6 × 1 0 5 mol / l , By checking the table of pHS of DDA precipitation at different concentrations, it could be obtained that pHS=10.5.
Therefore, when p H < p H S from equation 8:
[ R N H 2 ( a q ) ] = 1 + K B ) + ( 1 + K B ) 2 + 8 ( K d K B 2 + K 1 m K B C T 4 ( K d K B 2 + K 1 m K B
Let: X = K d K B 2 + K 1 m K B Y = ( 1 + K B + ( 1 + K B ) 2 + 8 X C T Then: [ R N H 2 ( aq ] = Y 4 X , namely:
log [ R N H 2 aq ] = log Y log X log 4     = log ( 1 K B + ( 1 + K B ) 2 + 8 ( K d K B 2 + K 1 m K B C T log K d K B 2 + K 1 m K B log 4
= log 1 1 0 10.63 p H + ( 1 + 1 0 10.63 p H ) 2 + 8 ( 1 0 23.34 2 p H + 1 0 13.75 - p H × 8.6 × 1 0 5
The same reasoning leads to:
log [ R N H 3 + ] = logK B + log Y log X log 4
        log [ ( R N H 3 + ) 2 2 + ] = logK d + 2 logK B + 2 log Y 2 log X 4 log 2
log [ R N H 3 + · R N H 2 aq ] = log K 1 m + logK B + 2 log Y 2 log X 4 log 2
When p H p H S [ R N H 2 aq ] = S = 2 × 1 0 5 mol / l From Eqs. 4, 6, and 7:
R N H 3 + = K B · S R N H 3 + · R N H 2 aq = K 1 m · K B · S 2 [ ( R N H 3 + ) 2 2 + ] = K d · K B 2 · S 2 K B = [ H + ] K a = 1 0 p H K a = 1 0 10.63 - p H [ R N H 2 ( S ) ] = C T S K B · S K 1 m · K B · S 2 K d · K B 2 · S 2
Then:
log [ R N H 2 ( aq ] = log S
log [ R N H 3 + ] = p K a p H + log S
log [ ( R N H 3 + · R N H 2 ( aq ) ] = log K 1 m + p K a p H + 2 log S
log [ ( R N H 3 + ) 2 2 + ] = logK d + 2 p K a 2 p H + 2 log S
log [ R N H 2 ( S ) ] = log ( C T S 1 0 10.63 p H · S K 1 m · 1 0 10.63 p H · S 2 K d · 1 0 21.23 2 p H · S 2 )
NaOL and oleic acid in water dissolution equilibrium was similar, that was, oleic acid instead of NaOL to carry out the calculation of the concentration of its components in relation to pH[6]. The solubility of oleic acid was S = 1 0 7.6 mol / l , and usually the concentration of oleic acid in the pulp was greater than the solubility at the flotation dosage, at which time dissolved oleic acid H O l ( a q ) in aqueous solution and the insoluble liquid oleic acid H O l ( s ) became a saturated solution between, and the equilibrium is as follows:
H O l l H O l aq S = 1 0 7.6
H O l aq H + + O l K a = [ H + ] [ O l ] [ H O l aq ] = 1 0 4.95 2 O l ( O l 2 2 K d = [ ( O l ) 2 2 ] [ O l ] 2 = 1 0 4.0 H O l aq + O l H ( O l 2 K 1 m = [ H ( O l ) 2 ] [ H O l aq ] [ O l ] = 1 0 4.7
MBE C T = [ H O l aq ] + [ O l ] + 2 [ ( O l 2 2 ] + 2 [ H ( O l 2 ]
Substituting Eq. 18 into Eq. 19 and making K H = K a [ H + ]   , then:
2 ( K 1 m K H + K d K H 2 ) [ H O l aq ] 2 + ( 1 + K H ) [ H O l aq ] C T = 0
From the mixed collector concentration of 6×10⁻⁴mol/l and the molar ratio of NaOL to DDA of 6:1, it could be obtained that the concentration of NaOL is C T = 6 × 1 0 4 × 6 7 = 5.1 × 1 0 4 mol / l ,and by checking the table of pH1 of oleic acid precipitation at different concentrations, it can be obtained that pH1=8.7。
Therefore, when p H > p H 1 Equation 20 yields:
[ H O l a q ] = 1 + K H ) + ( 1 + K H ) 2 + 8 ( K d K H 2 + K 1 m K H C T 4 ( K d K H 2 + K 1 m K H
Let Z = K d K H 2 + K 1 m K H ;   W = ( 1 + K H ) + ( 1 + K H ) 2 + 8 Z C T Similar to the calculation of DDA [22], then:
log [ H O l ( a q ) ] = log W log Z log 4
log [ O l ] = logK H + log W log Z log 4
log [ ( O l ) 2 2 ] = logK d + 2 logK H + 2 log W 2 log Z 4 log 2
log [ H ( O l ) 2 ] = log K 1 m + logK H + 2 log W 2 log Z 4 log 2
When   p H p H 1 then   log [ H O l ( aq ) ] = log S
log [ O l ] = logK a + log S + p H
log [ ( O l ) 2 2 ] = logK d + 2 ( log K a + log S + p H )
log [ H ( O l 2 ] = log K 1 m + logK a + 2 log S + p H
log [ H O l S ] = log C T S 1 0 p H 4.95 · S K 1 m · 1 0 p H 4.95 · S 2 K d · 1 0 2 p H 9.9 · S 2
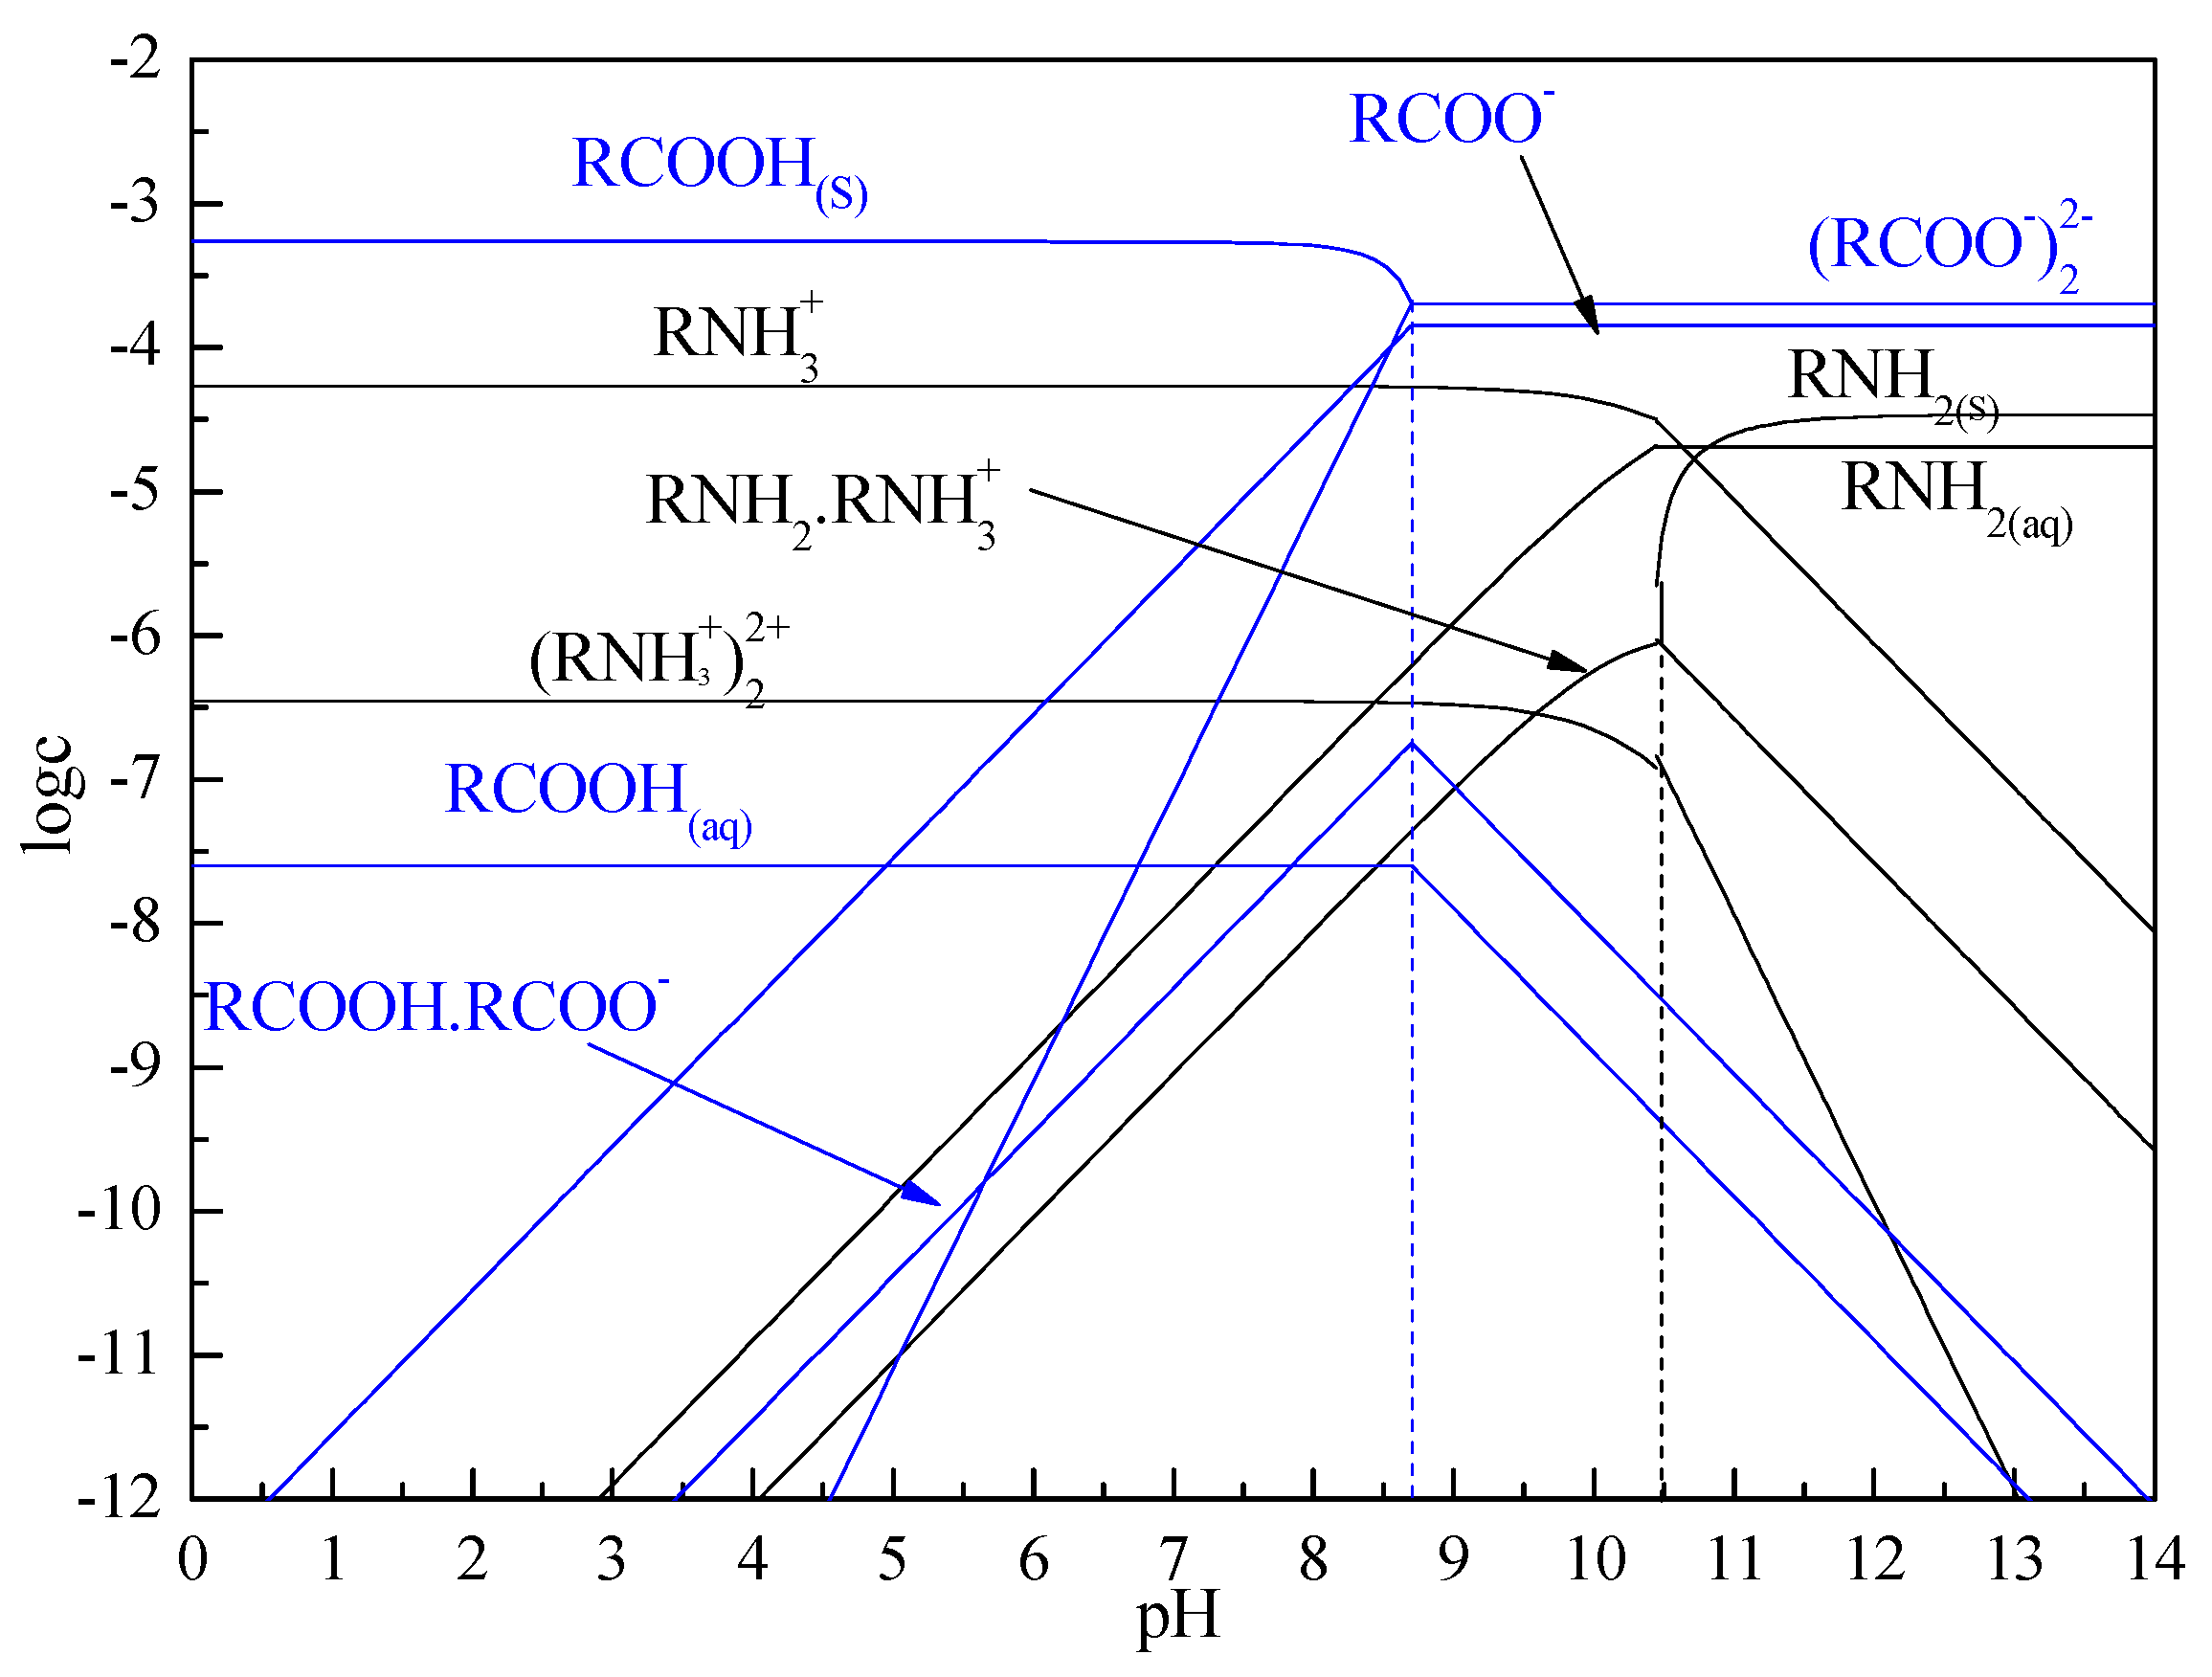
The relationship between the concentration of each component of DDA and NaOL and pH was calculated from the above and plotted as a logC-pH diagram as follows:
It could be seen from Figure 8 that DDA and oleic acid existed in different states in solution under different pH conditions. For DDA solution, when pH<10.5, the dodecamine mainly existed in the plasma form of RNH3+ and (RNH3+)22+, and when pH>10.5, the dodecamine mainly existed in the molecular state of RNH2. For oleic acid solution, when pH<8.7, oleic acid mainly existed in the form of oleic acid molecule RCOOH in the solution. When pH>8.7, oleic acid mainly existed in the form of oleic acid ion RCOO- and (RCOO-)22- plasma. Therefore, under acidic conditions, with the increase of pH, the positive charge on the mineral surface decreased. At this time, the oleic acid in the combined collector was mainly adsorbed on the mineral surface in the form of chemical adsorption, and then dodecamine ions form coadsorption with oleic acid ions through charge neutralization, and then form a complex on the mineral surface. Under alkaline conditions, the negative charge on the mineral surface dominates, and the electrostatic adsorption of dodecamine became the main effect of the mixed collector and the mineral surface, and then the oleic acid ion formed a coadsorption through charge neutralization, and then formed a complex on the mineral surface.
According to the above mechanism analysis, in the pure mineral test, it was concluded that the optimal pH of the anionic and cationic collector composed of NaOL/DDA for flotation separation of spoxide and feldspar was about 8.5. At this time, according to the concentration log plot of the dissociation-association equilibrium of the combined collector, it could be seen that the dodecamine in the combined collector existed in the state of positive ions such as RNH3+ and (RNH3+)22+, while the oleic acid in the state of negative ions such as negatively charged RCOO- and (RCOO-)22-.Therefore, the anionic and cationic ions in the combined collector form a highly active complex through electrostatic attraction to interact with the mineral surface. The high activity complex had a selective adsorption effect on spodumene, while the adsorption on feldspar surface was relatively weak, so as to realize the effective separation of spodumene and feldspar.

4. Closed Circuit Test

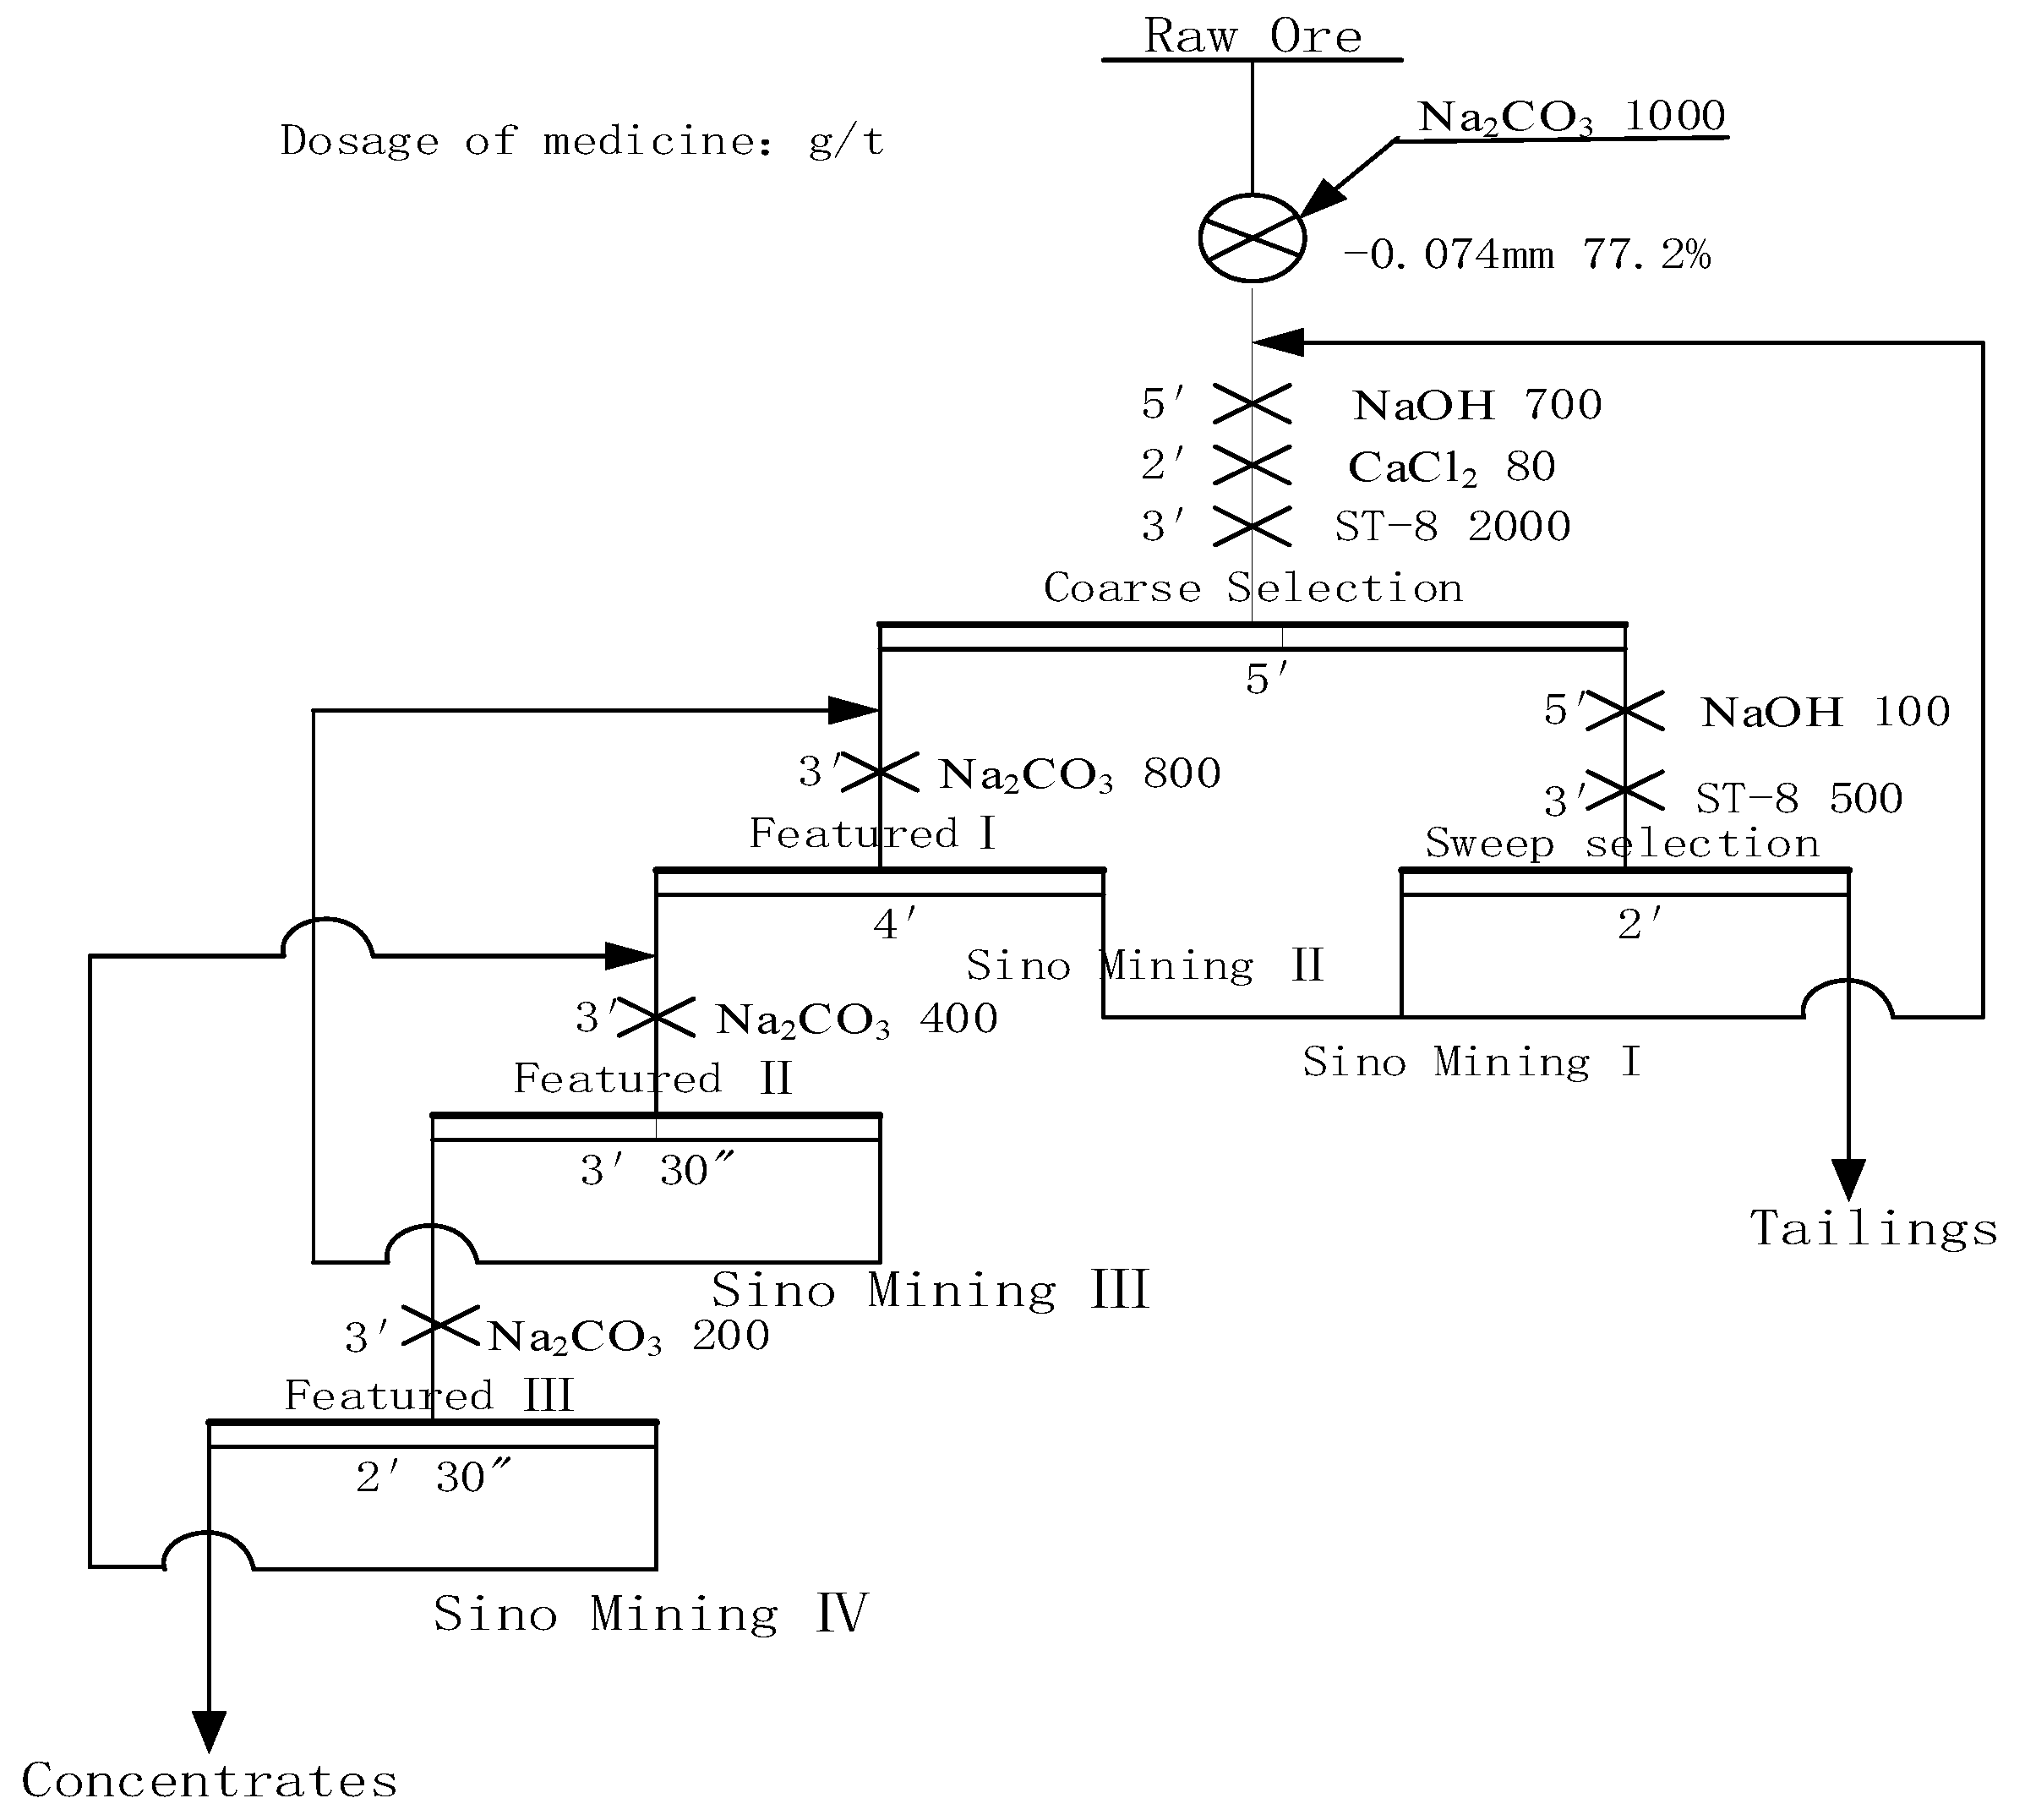
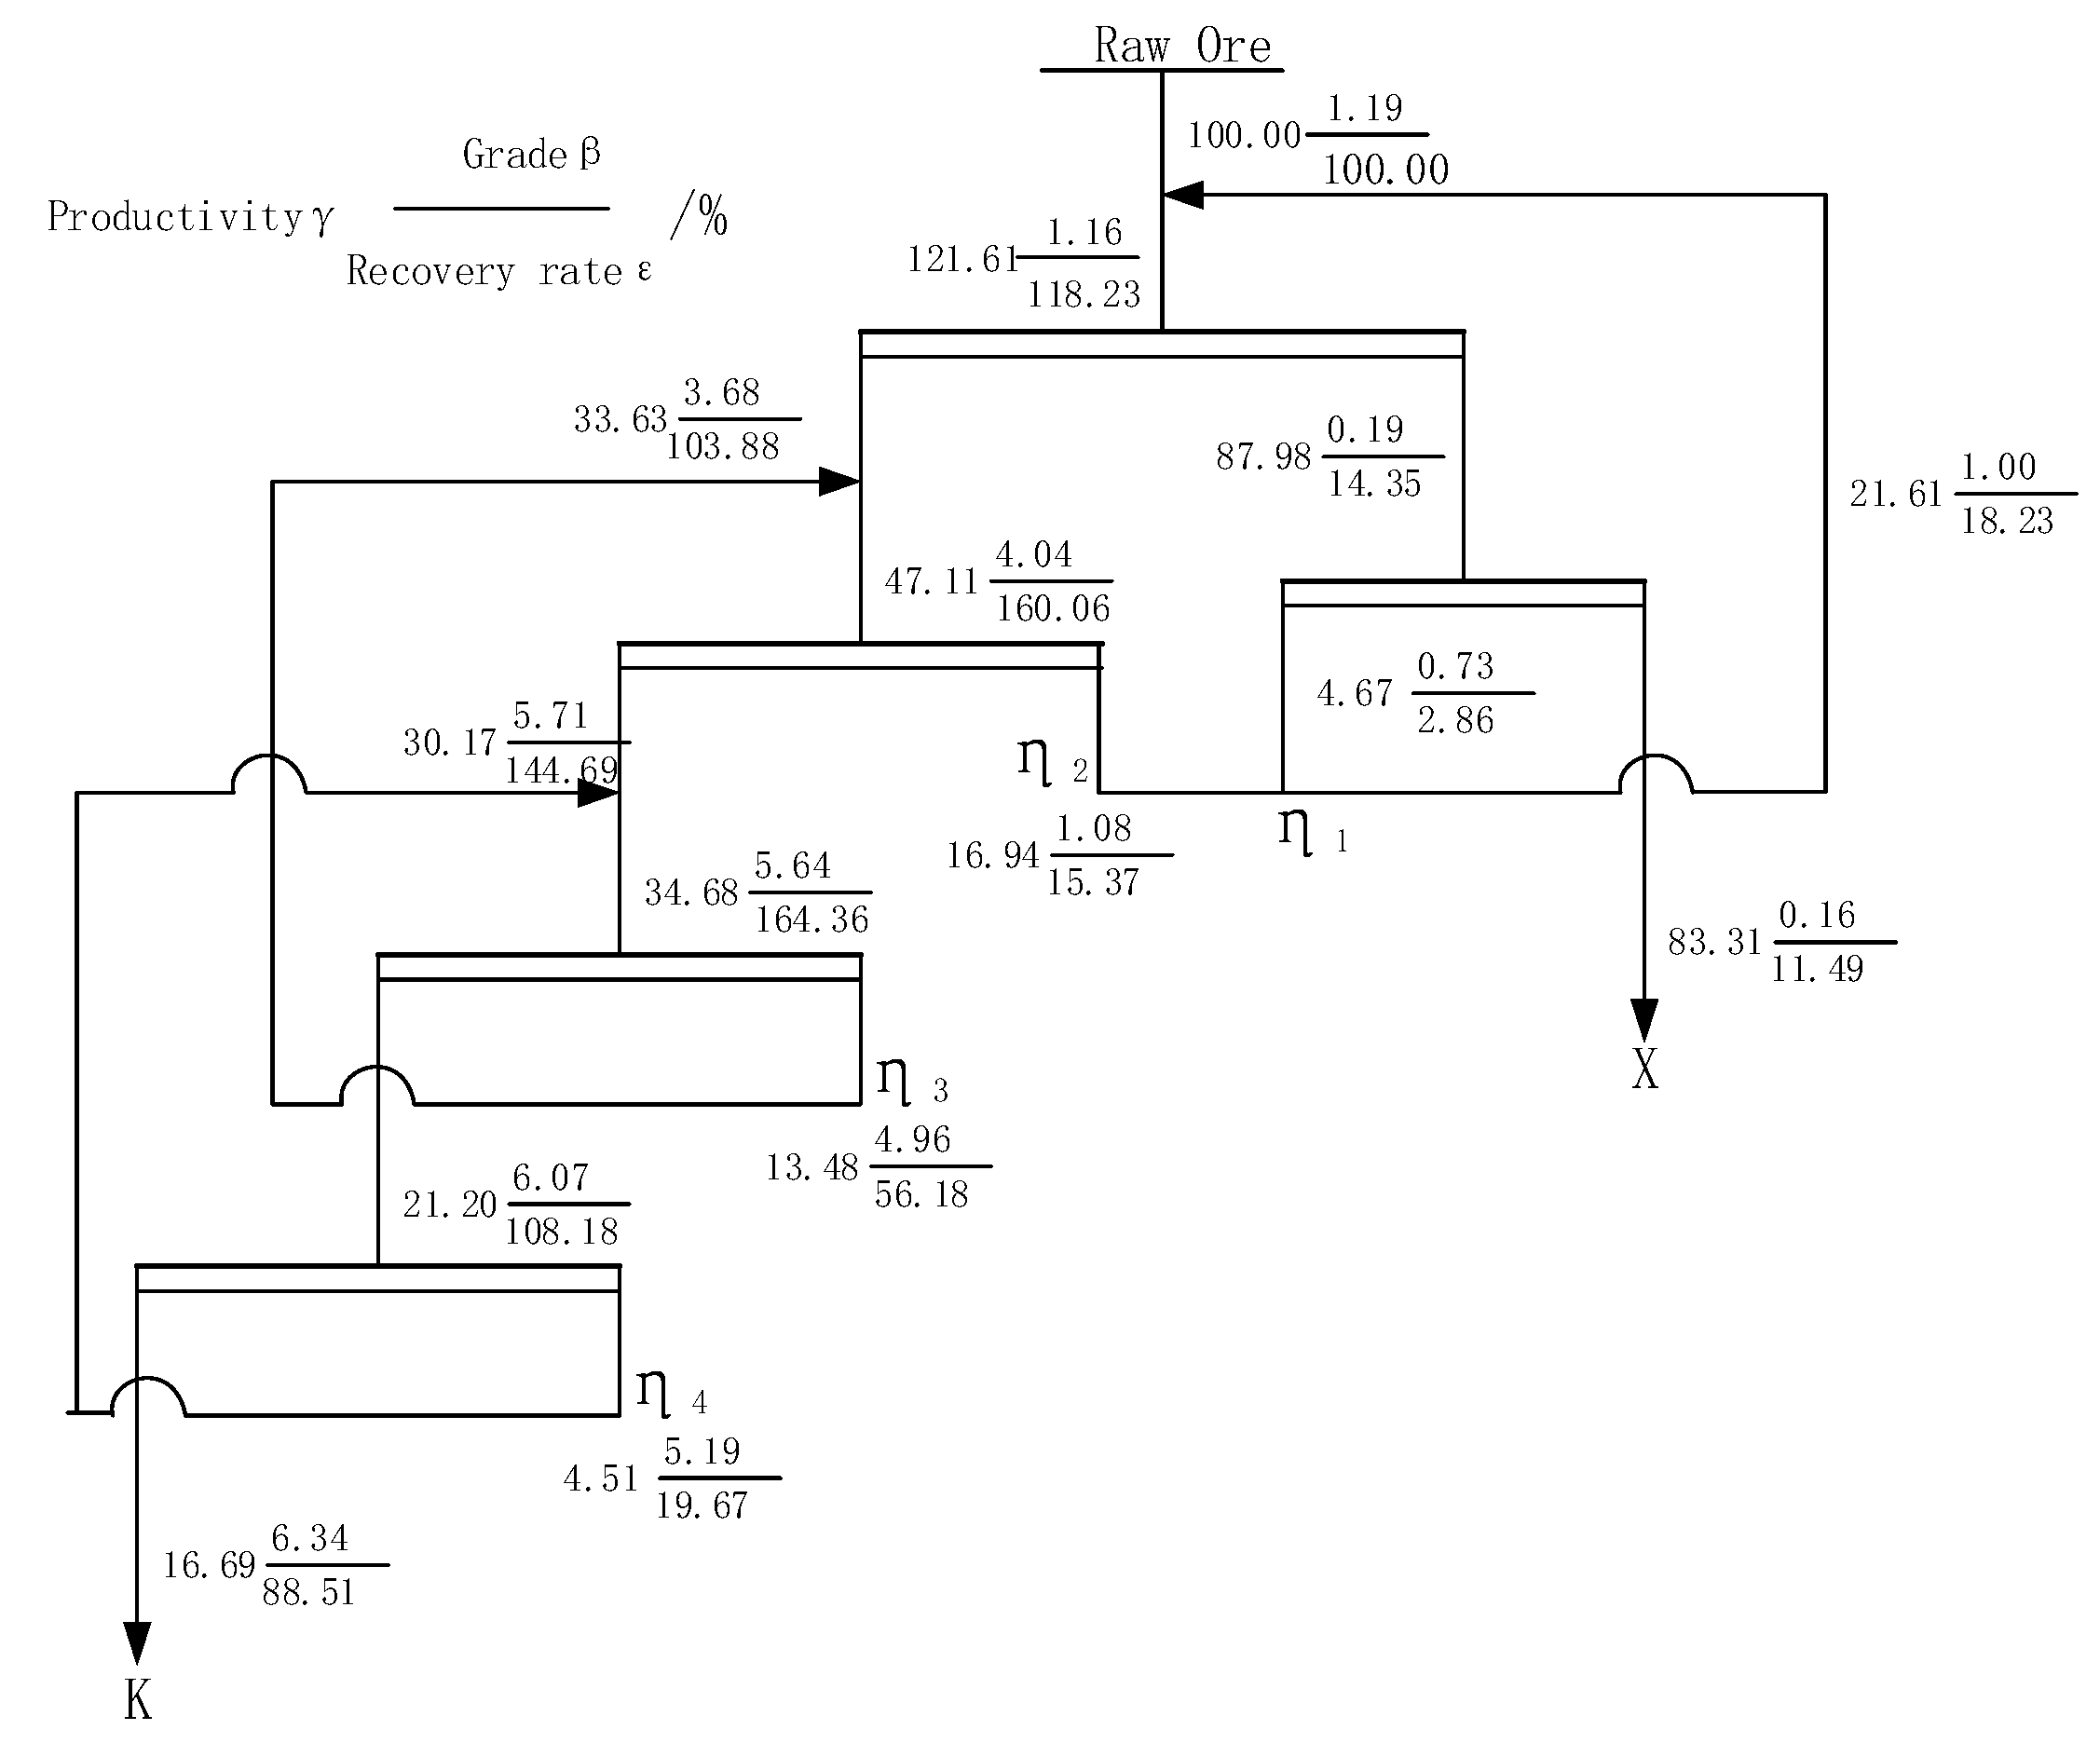
In actual ore flotation, the optimal agent regime was determined by single-factor condition tests and then closed-circuit tests were performed. In the grinding fineness of -0.074mm accounted for 77.2%, roughing Na2CO3 dosage of 1000g/t and added to the mill, NaOH, CaCl2 and anion/cation combination trap ST-8 dosage of 700g/t, 80g/t, 2000g/t, respectively; selection Ⅰ, selection Ⅱ and selection Ⅲ Na2CO3 dosage of 800g/t, 400g/t, 200g/t, respectively; sweeping NaOH dosage of 100g/t, anion/cation trap ST-8 dosage of 500g/t. t, 200g/t; sweeping NaOH dosage of 100g/t, anion / cationic trap ST-8 dosage of 500g/t, the closed circuit test process was a roughing three times selection a sweeping sequence of return in the ore. The process and results were shown in Figure 9 and Figure 10.
The closed circuit test results in Figure 9 and Figure 10 showed that when the grade of Li2O was 1.19%, the final flotation index could be 6.34% with Li2O grade and 88.51% Li2O recovery after a closed circuit process of one roughing, three selections and one sweeping sequence return.

5. Conclusion

  • For the flotation separation of single mineral spospoxene and feldspar, the optimal molar combination ratio of anionic collector NaOL and cationic collector DDA is 6:1-10:1, and the optimal pH range for the separation effect is about 8.5
  • After the combination collector interacts with spodumene and feldspar, the negative shift degree of spodumene surface zeta potential is much stronger than that of feldspar surface zeta potential. At the same time, the absorption peak intensity after the combination collector interacts with spodumene is much stronger than that after feldspar, indicating that the adsorption capacity of the combination collector on the surface of spodumene and feldspar is greatly different. At the same time, the selectivity of spodumene is stronger than that of feldspar, so that the separation of spodumene and feldspar can be realized.
  • The surface tension of the combined collector is lower than that of the anionic collector and the cationic collector used alone, indicating that the combined collector has a strong ability to reduce the surface tension of the gas-liquid interface, so as to improve the surface hydrophobicity of the mineral.
  • The absorption peak of the combined collector is similar to that of spodumene and feldspar, but the intensity of the absorption peak after spodumene action is much stronger than that after feldspar action, indicating that the selectivity of the anionic and cationic combination collector for spodumene is stronger than feldspar, so that the separation of spodumene and feldspar can be realized.
  • The closed circuit test results show that when the grade of Li2O is 1.19%, the final flotation index can be 6.34% with Li2O grade and 88.51% Li2O recovery after a closed circuit process of one roughing, three selections and one sweeping sequence return.

Author Contributions

L.Y.T. conceived and designed the experiments; L.J. and Z.J. performed the experiments; L.P. analyzed the data; L.F.Y. and L.Y.T. contributed reagents/materials/analysis tools; Z.J. wrote the paper.

Funding

The authors acknowledge financial support from the Hubei Province Unveiling System Project (2021BEC029); Hubei Province Technological Innovation Major Project (2018ACA153); Wuhan Engineering University Graduate Education Innovation Fund Project (CX2022578).

Acknowledgments

This work was partly supported by the Institute of Comprehensive Utilization of Minerals, Chinese Academy of Geological Sciences.

Conflicts of Interest

The authors declare no conflict of interest.

References

  1. Dazhe, L. The use of lithium and its resource development. Chinese Journal of Safety Science 2004, 76-80+98. [CrossRef]
  2. Ting, C.; Zihua, K. Progress of lithium resources and development technology in China. Guangdong Trace Element Science 2007, 6–9. [Google Scholar] [CrossRef]
  3. Wenlong, Z.; Wanfu, H. Overview of domestic and foreign lithium mineral resources and their beneficiation process. Modern Mining 2010, 26, 1–4. [Google Scholar]
  4. Xuejing; Shanying, H. Analysis of the current situation and prospect of lithium industry in China. Chemical Progress 2011, 30, 782–787. [Google Scholar] [CrossRef]
  5. Zhiyong, G. Fundamental study on the relationship between crystal anisotropy and flotation behavior of three calcium-bearing minerals. PhD, Central South University, 2013.
  6. Yu Fushun, W.Y. Theory and practice of lithium pyroxene ore flotation; Changsha: Central South University Press: 2015; p. 141.
  7. Moon, K.S.; Fuerstenau, D.W. Surface crystal chemistry in selective flotation of spodumene (LiAl[SiO3]2) from other aluminosilicates. International Journal of Mineral Processing 2003, 72, 11–24. [Google Scholar] [CrossRef]
  8. Yang, B.; Wanshun, C.; Weixiang, W.; Hongyun, A.; Fushun, Y.; Pingke, Y. Synergistic mechanism of combined anionic and cationic collecting agents at the gas-liquid interface of lithium mica flotation. Mineral Conservation and Utilization 2023, 43, 44–49. [Google Scholar] [CrossRef]
  9. Yaoyang, R.; Chuanli, W.; Huihua, L.; Wei, X.; Anyu, T.; Ru'an, C.; Bonar. , D. Flotation separation of quartz and dolomite from phosphate ore with cotton oil acid soap complex collector. Chemical Minerals and Processing 2022, 51, 9–14. [Google Scholar] [CrossRef]
  10. Zhengwu, W.; Ganzuo, L.; Juncheng, L.; Daren, G.; Anjing, L. Further study on the theory of compounding and synergism of non-ideal binary surfactants. Journal of Chemical Physics 2001, 426–432. [Google Scholar]
  11. Liu, L.; Yuhua, W.; Guangli, Z.; Fushun, Y.; School, G.D.; Dongfang, L.; Xiayu, Z. Application and mechanism of mixed collector flotation of lithium pyroxene. Chinese Journal of Nonferrous Metals 2020, 30, 675–683. [Google Scholar]
  12. Liu, R.; Wei, S.; Mu, F.; Zhi, M.; Jiao, J. Mechanism of combined collector flotation of lithium pyroxene. Chinese Journal of Nonferrous Metals 2018, 28, 612–617. [Google Scholar] [CrossRef]
  13. Liu, R.; Wei, S.; Mu, F.; Zhi, M.; Jiao, J. Study on the mechanism of action of a new collecting agent for flotation of lithium pyroxene. Non-ferrous metals (mineral processing part) 2018, 87-90+98.
  14. Kaiqian, S. Enhanced flotation separation and mechanism of action of combined anionic and cationic collecting agents on lithium pyroxene ore. Master, Southwest University of Science and Technology, 2021.
  15. Mu, F.; Wei, S.; Liu, R.; Zhi, M. Study on the synergistic effect of combined collecting agents in lithium pyroxene flotation. Non-ferrous metals (mineral processing part) 2015, 96-100.
  16. Vidyadhar, A.; Rao, K.H.; Chernyshova, I.V. Mechanisms of amine–feldspar interaction in the absence and presence of alcohols studied by spectroscopic methods. Colloids and Surfaces A: Physicochemical and Engineering Aspects 2003, 214, 127–142. [Google Scholar] [CrossRef]
  17. Vidyadhar, A.; Rao, K.H.; Chernyshova, I.V.; Pradip; Forssberg, K. S.E. Mechanisms of Amine–Quartz Interaction in the Absence and Presence of Alcohols Studied by Spectroscopic Methods. Journal of Colloid and Interface Science 2002, 256, 59–72. [Google Scholar] [CrossRef]
  18. Fengchun, L.; Jiadi, L. Separation of quartz-feldspar by flotation with mixed anionic and cationic trapping agents. China Mining 2000, 62–63. [Google Scholar]
  19. Kou, J.; Tao, D.; Xu, G. A study of adsorption of dodecylamine on quartz surface using quartz crystal microbalance with dissipation. Colloids and Surfaces A: Physicochemical and Engineering Aspects 2010, 368, 75–83. [Google Scholar] [CrossRef]
  20. Haiqiang, F.; Yuhua, W. A review of lithium pyroxene flotation collecting agents and their conformational relationships. Rare Metals 2022, 46, 1083–1096. [Google Scholar] [CrossRef]
  21. Jia, T.; Longhua, X.; Wei, D.; Fa-Cheng, Y.; Houqin, W.; Jing, L.; Zhen, W. Mixed-collector flotation separation of lithium pyroxene from feldspar and its mechanism. Journal of Central South University (Natural Science Edition) 2018, 49, 511–517. [Google Scholar]
  22. Wang Dianzuo, H.Y. Flotation solution chemistry; Changsha: Hunan Science and Technology Press: 1988; p. 343.
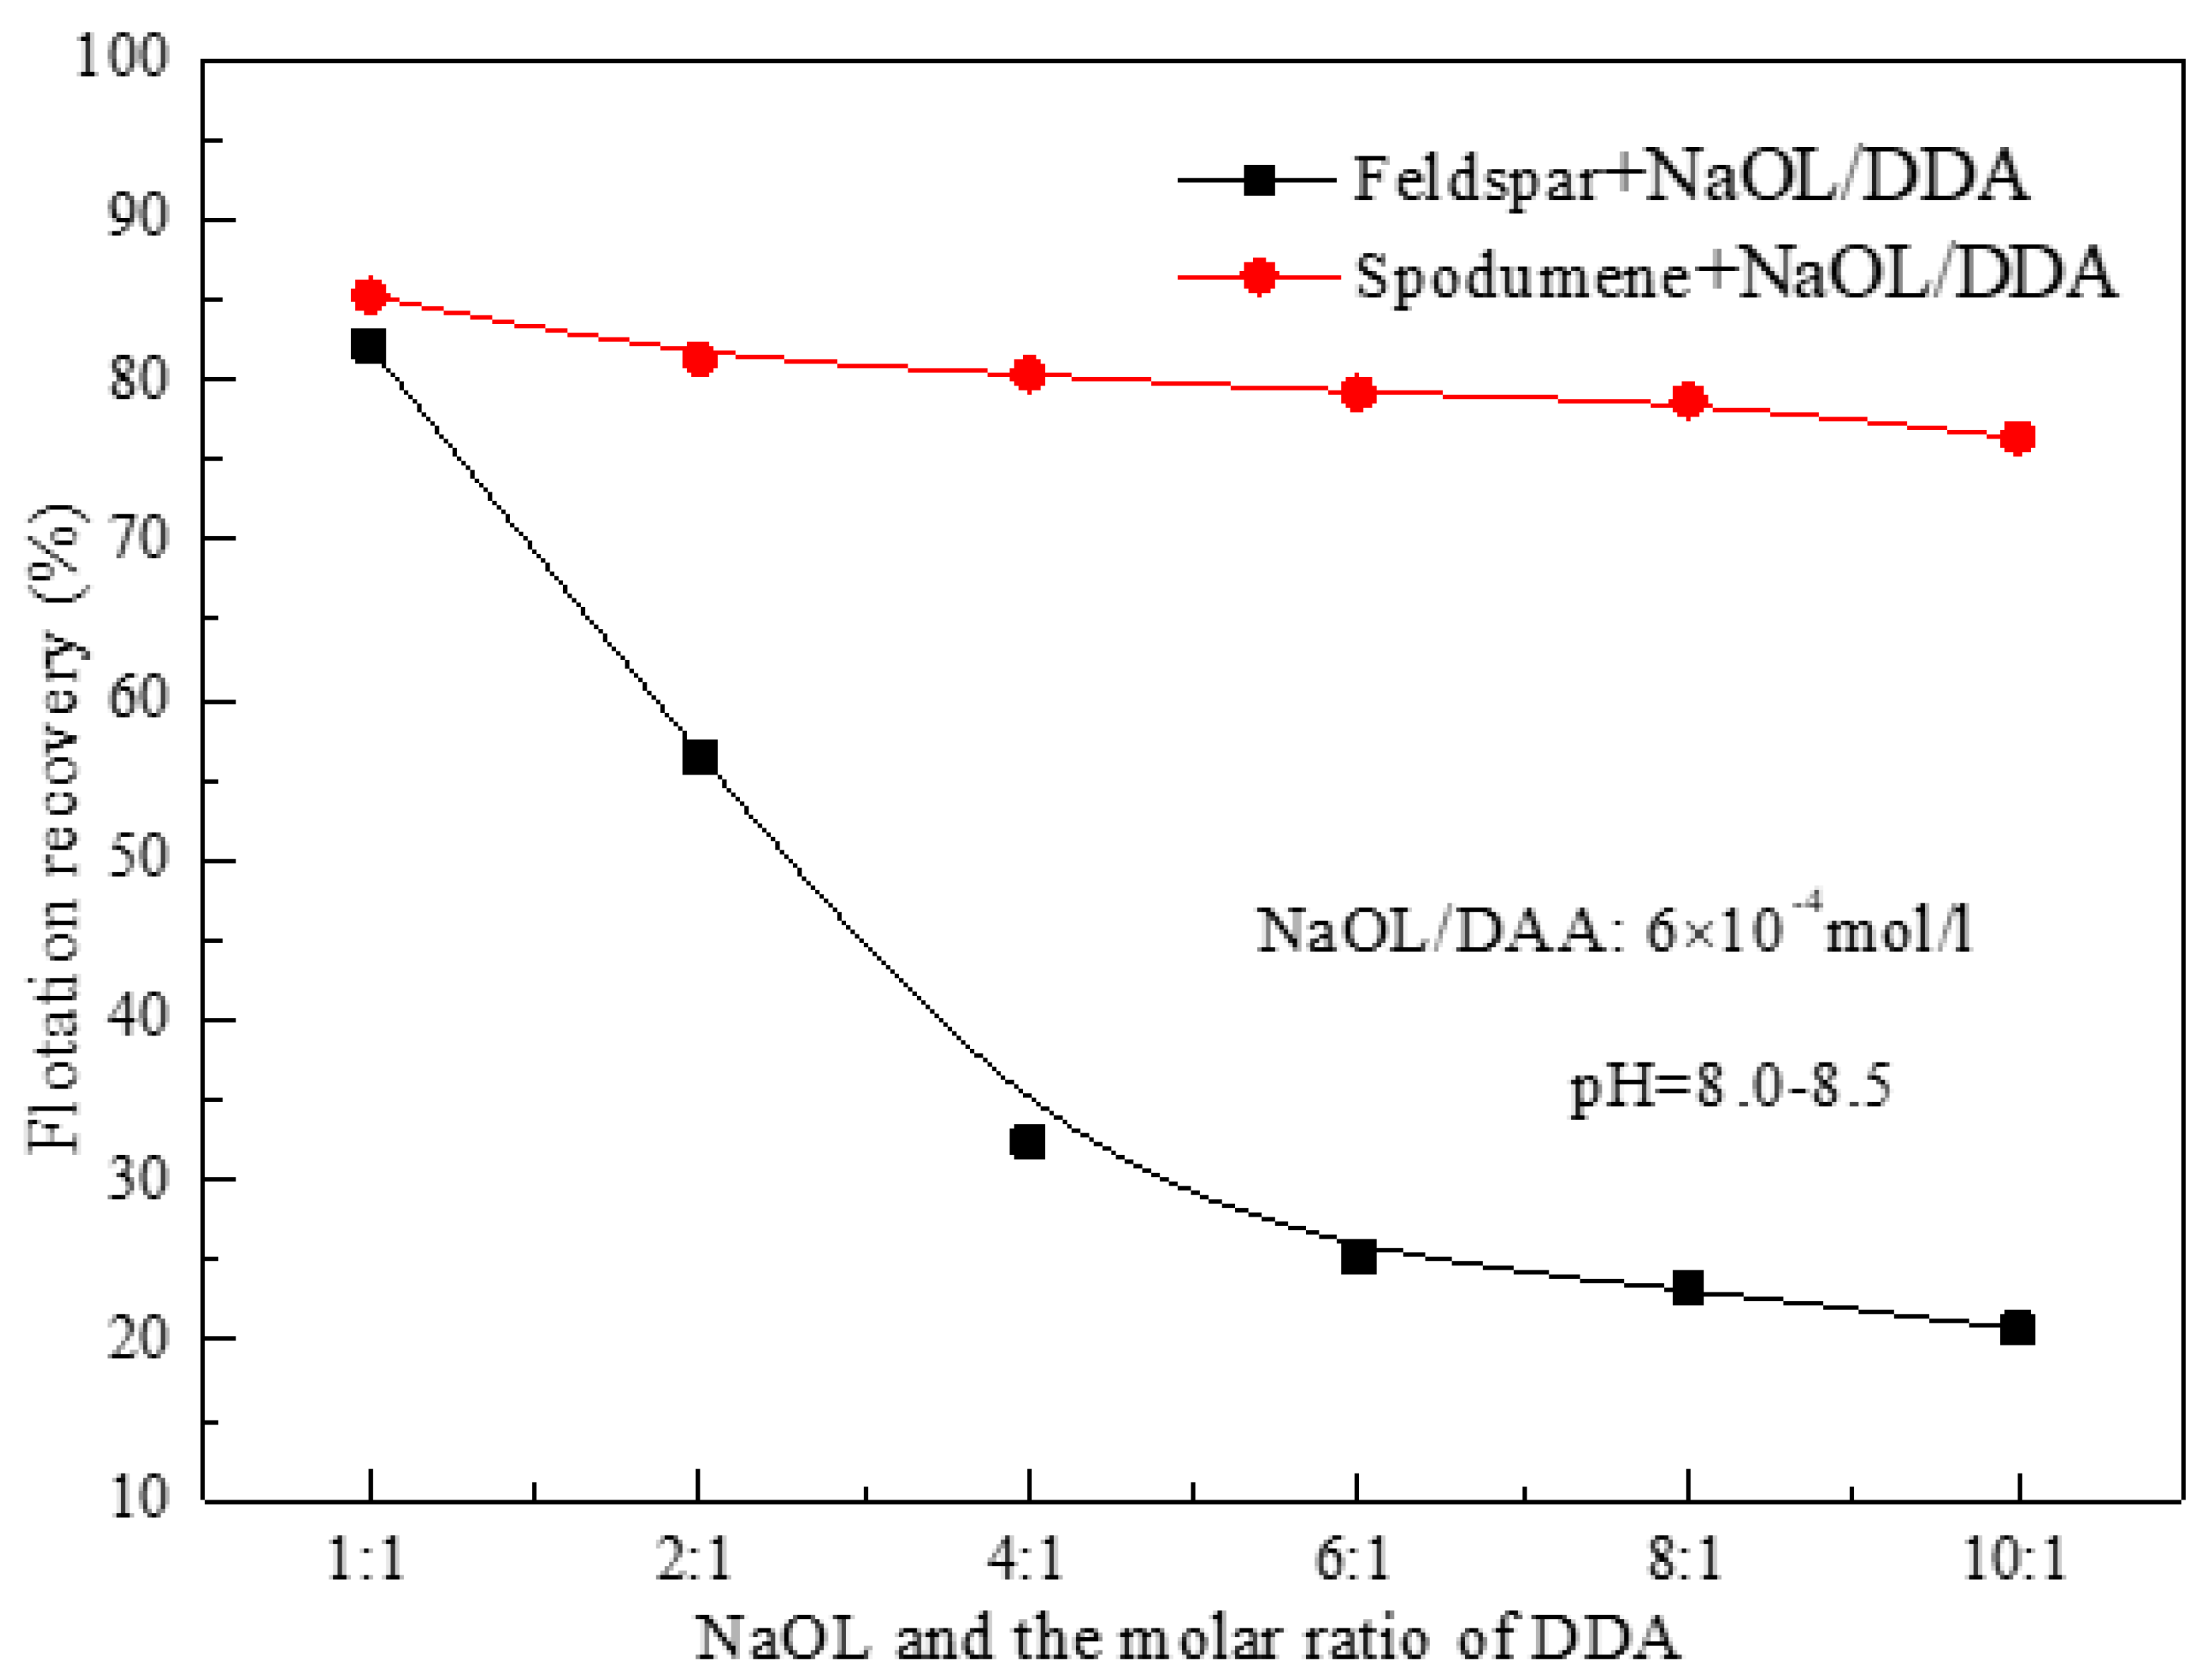
Figure 1. Test results of the ratio of NaOL and DDA.
Preprints 80429 g001
Figure 2. Effect of pH on the combination of NaOL and DDA collectors.
Preprints 80429 g002
Figure 3. Relationship between surface potential and pH value of spodumene in collector system.
Preprints 80429 g003
Figure 4. Relationship between surface potential and pH value of feldspar under collector system.
Preprints 80429 g004
Figure 5. Relation curve between surface tension of collector and logarithm of concentration.
Preprints 80429 g005
Figure 6. Infrared spectra before and after the action of the collector with spodumene.
Preprints 80429 g006
Figure 7. Infrared spectra before and after the action of collector with feldspar.
Preprints 80429 g007
Figure 8. Logarithmic plot of concentration of each component of the combined collector solution.
Preprints 80429 g008
Figure 9. Closed-circuit test flow chart.
Preprints 80429 g009
Figure 10. Closed-circuit quality flow chart.
Preprints 80429 g010
Table 1. Multi-element analysis of pure minerals (%).
Chemical Composition Li2O Na2O K2O SiO2 Al2O3 Fe2O3
spodumene 7.86 0.15 0.043 62.477 27.434 0.133
albite 11.60 0.144 66.432 20.584 0.253
Table 2. Multi-element analysis of raw ore(%).
Element Li2O P2O5 MnO Cs2O Rb2O Na2O MgO K2O Fe2O3
Content (%) 1.19 0.30 0.15 0.012 0.12 3.95 0.022 2.27 0.80
Element Al2O3 SiO2 CaO BeO* Sn* Ta2O5* Nb2O5* Ga* TFe
Content (%) 16.85 74.36 0.23 338 98.4 68. 5 90.1 29.4 0.28
Disclaimer/Publisher’s Note: The statements, opinions and data contained in all publications are solely those of the individual author(s) and contributor(s) and not of MDPI and/or the editor(s). MDPI and/or the editor(s) disclaim responsibility for any injury to people or property resulting from any ideas, methods, instructions or products referred to in the content.
Copyright: This open access article is published under a Creative Commons CC BY 4.0 license, which permit the free download, distribution, and reuse, provided that the author and preprint are cited in any reuse.
Prerpints.org logo

Preprints.org is a free preprint server supported by MDPI in Basel, Switzerland.

Subscribe

© 2024 MDPI (Basel, Switzerland) unless otherwise stated