Submitted:
21 July 2023
Posted:
25 July 2023
You are already at the latest version
Abstract
Keywords:
1. Introduction
2. Study Area, Dataset and Methods
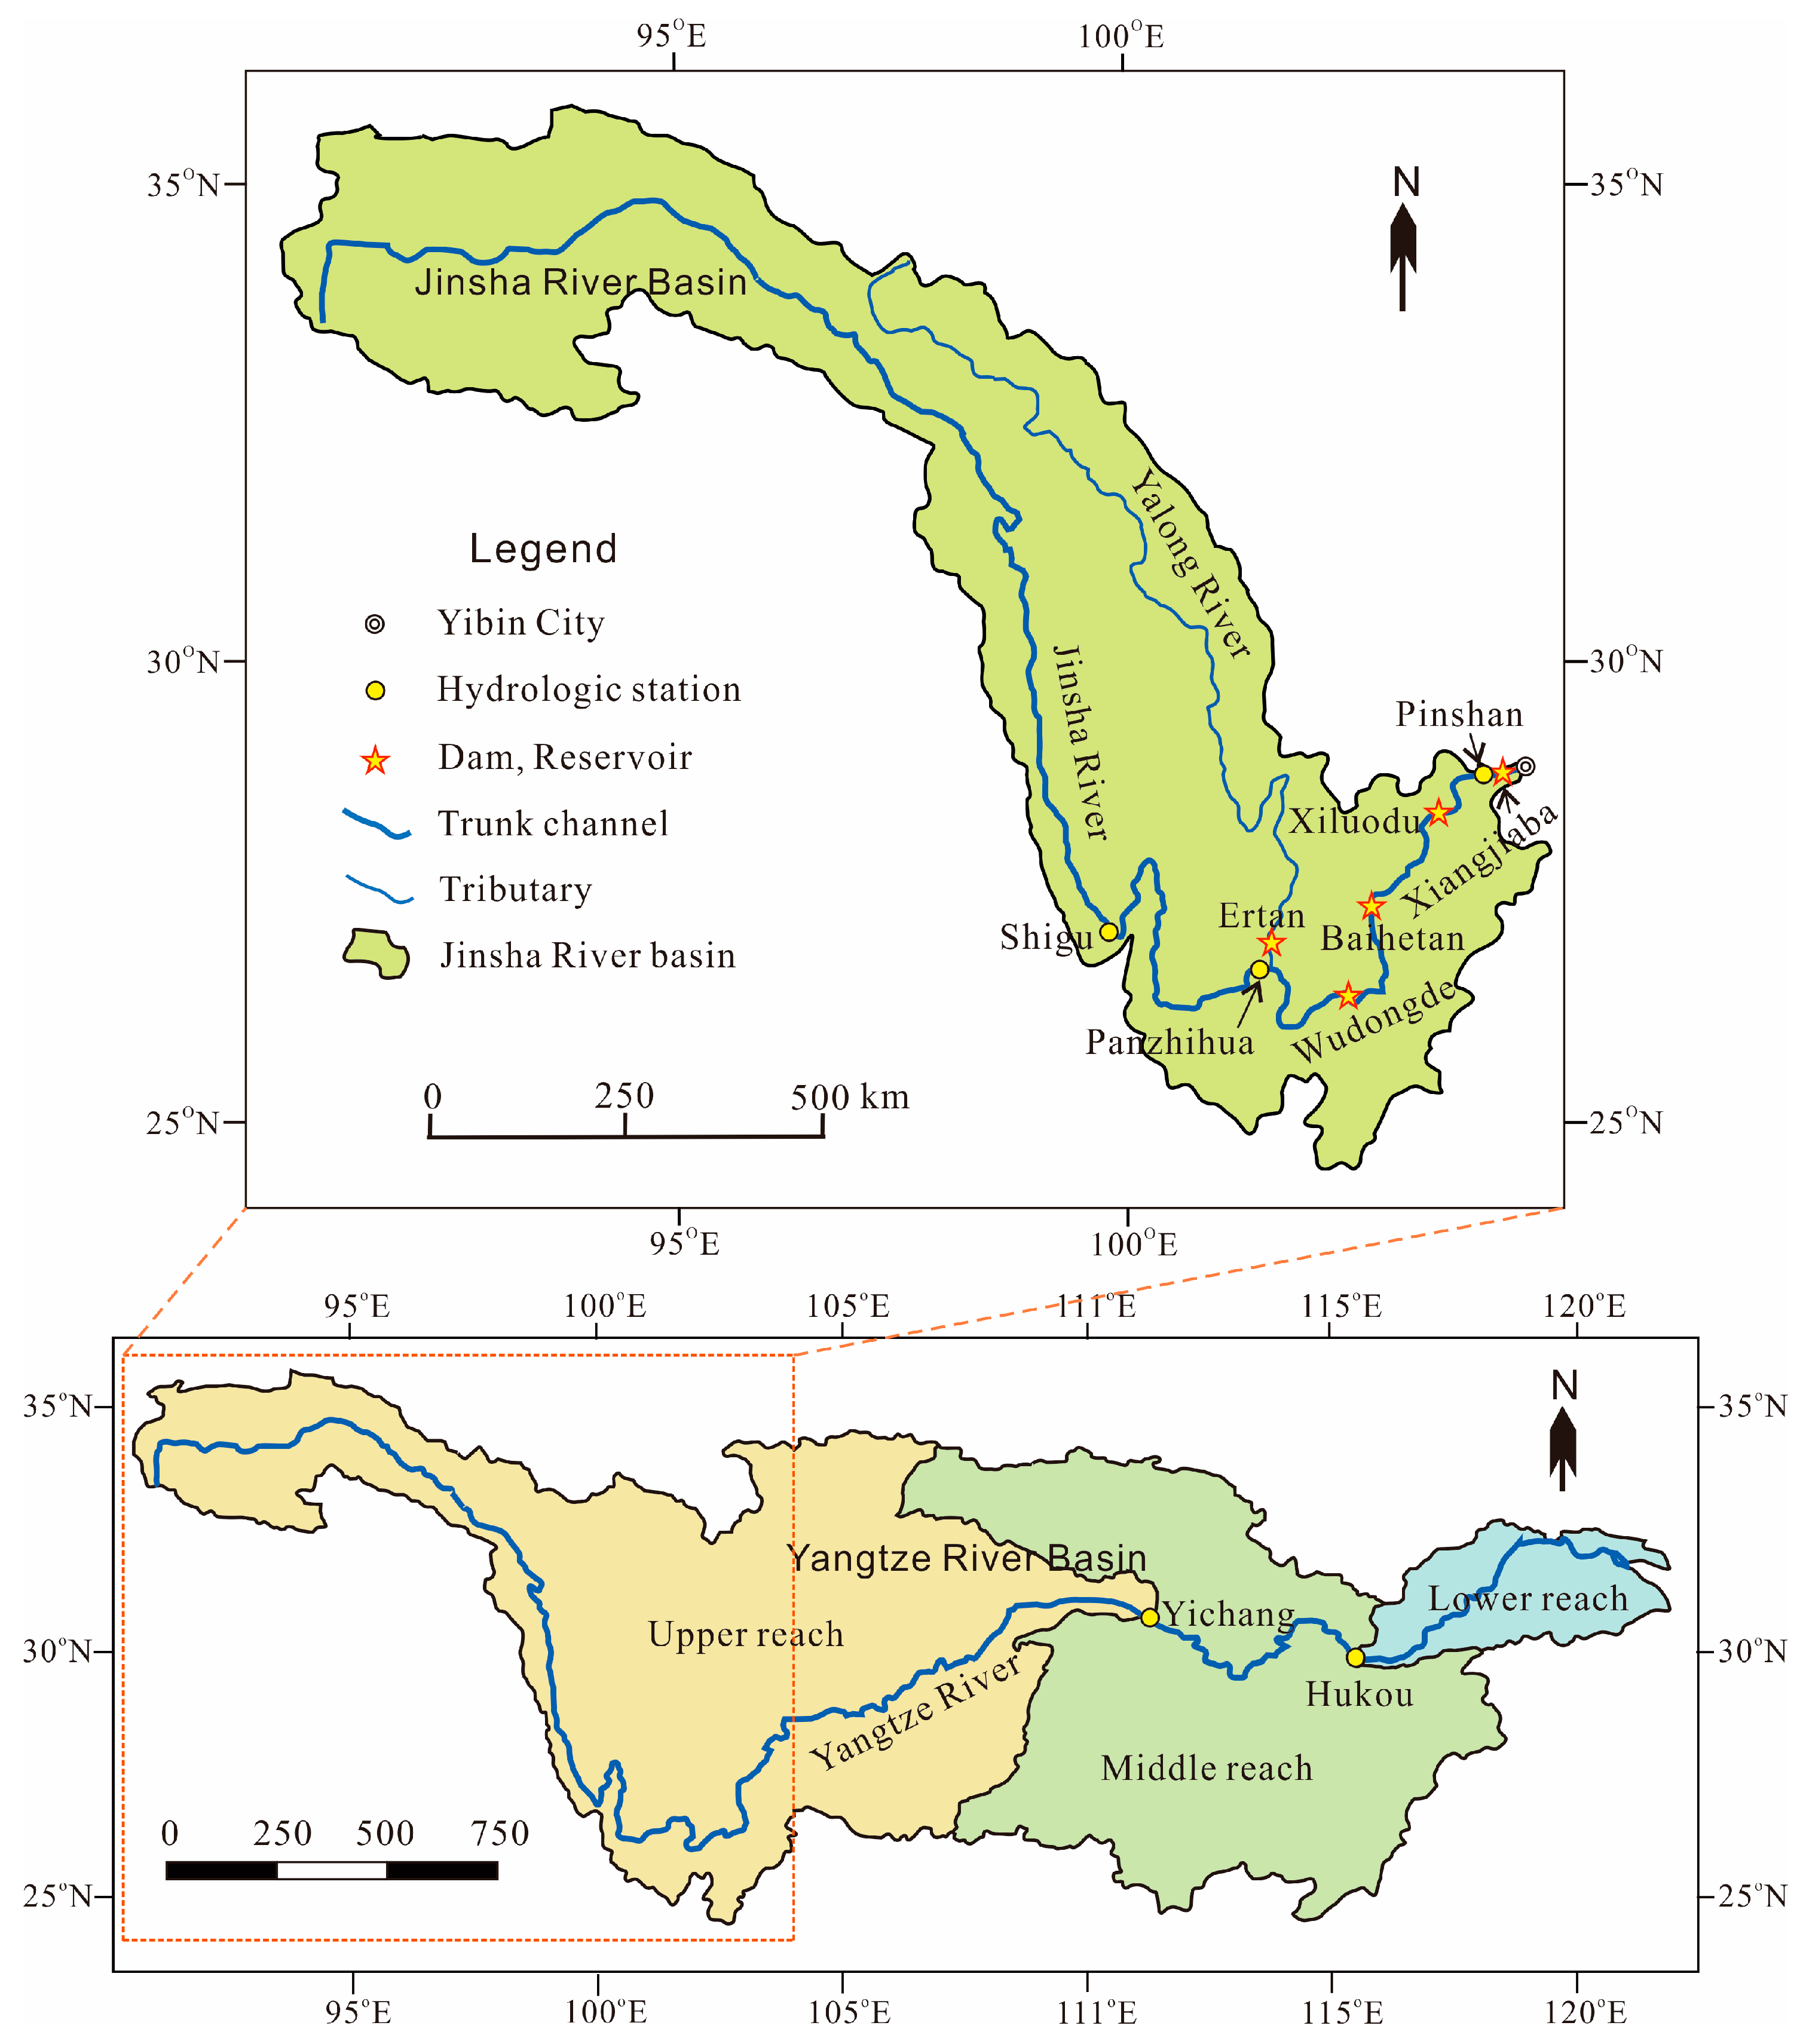
2.1. Study Area
2.2. Dataset
2.3. Methods
3. Results
3.1. Interannual Variations of Runoff and Sediment Transport
3.2. Variations of Sediment Concentration and Incoming Sediment Coefficient
3.3. Mutation in Water and Sediment Processes
3.4. Variation of Relationship Between Water and Sediment
4. Discussion
4.1. Reservoir Construction and the years of sharp-increasing storage capacity
4.2. Impact of Reservoirs on Water and Sediment Processes
5. Conclusions
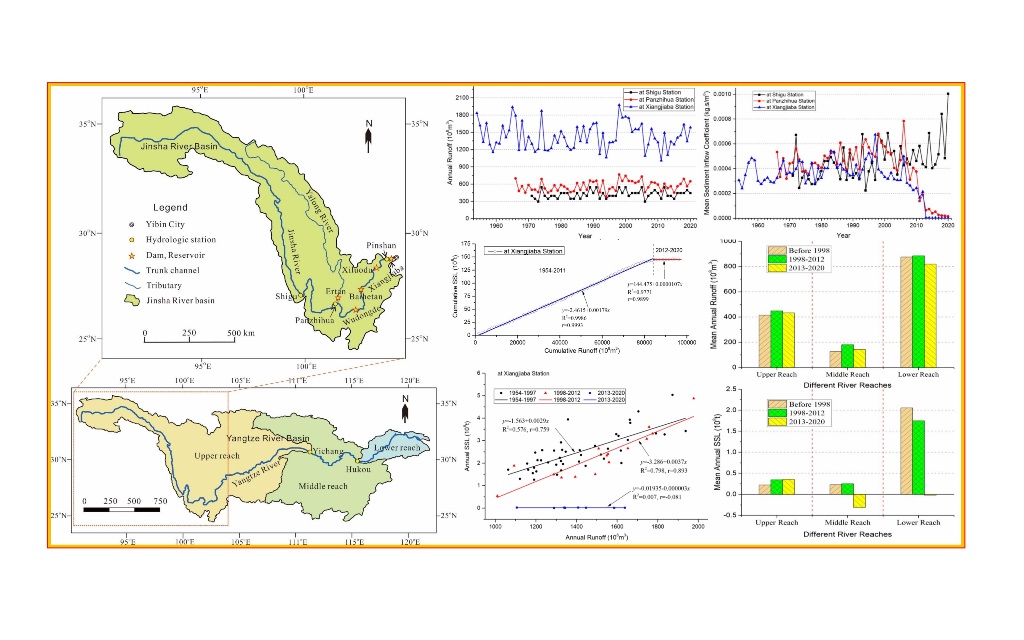
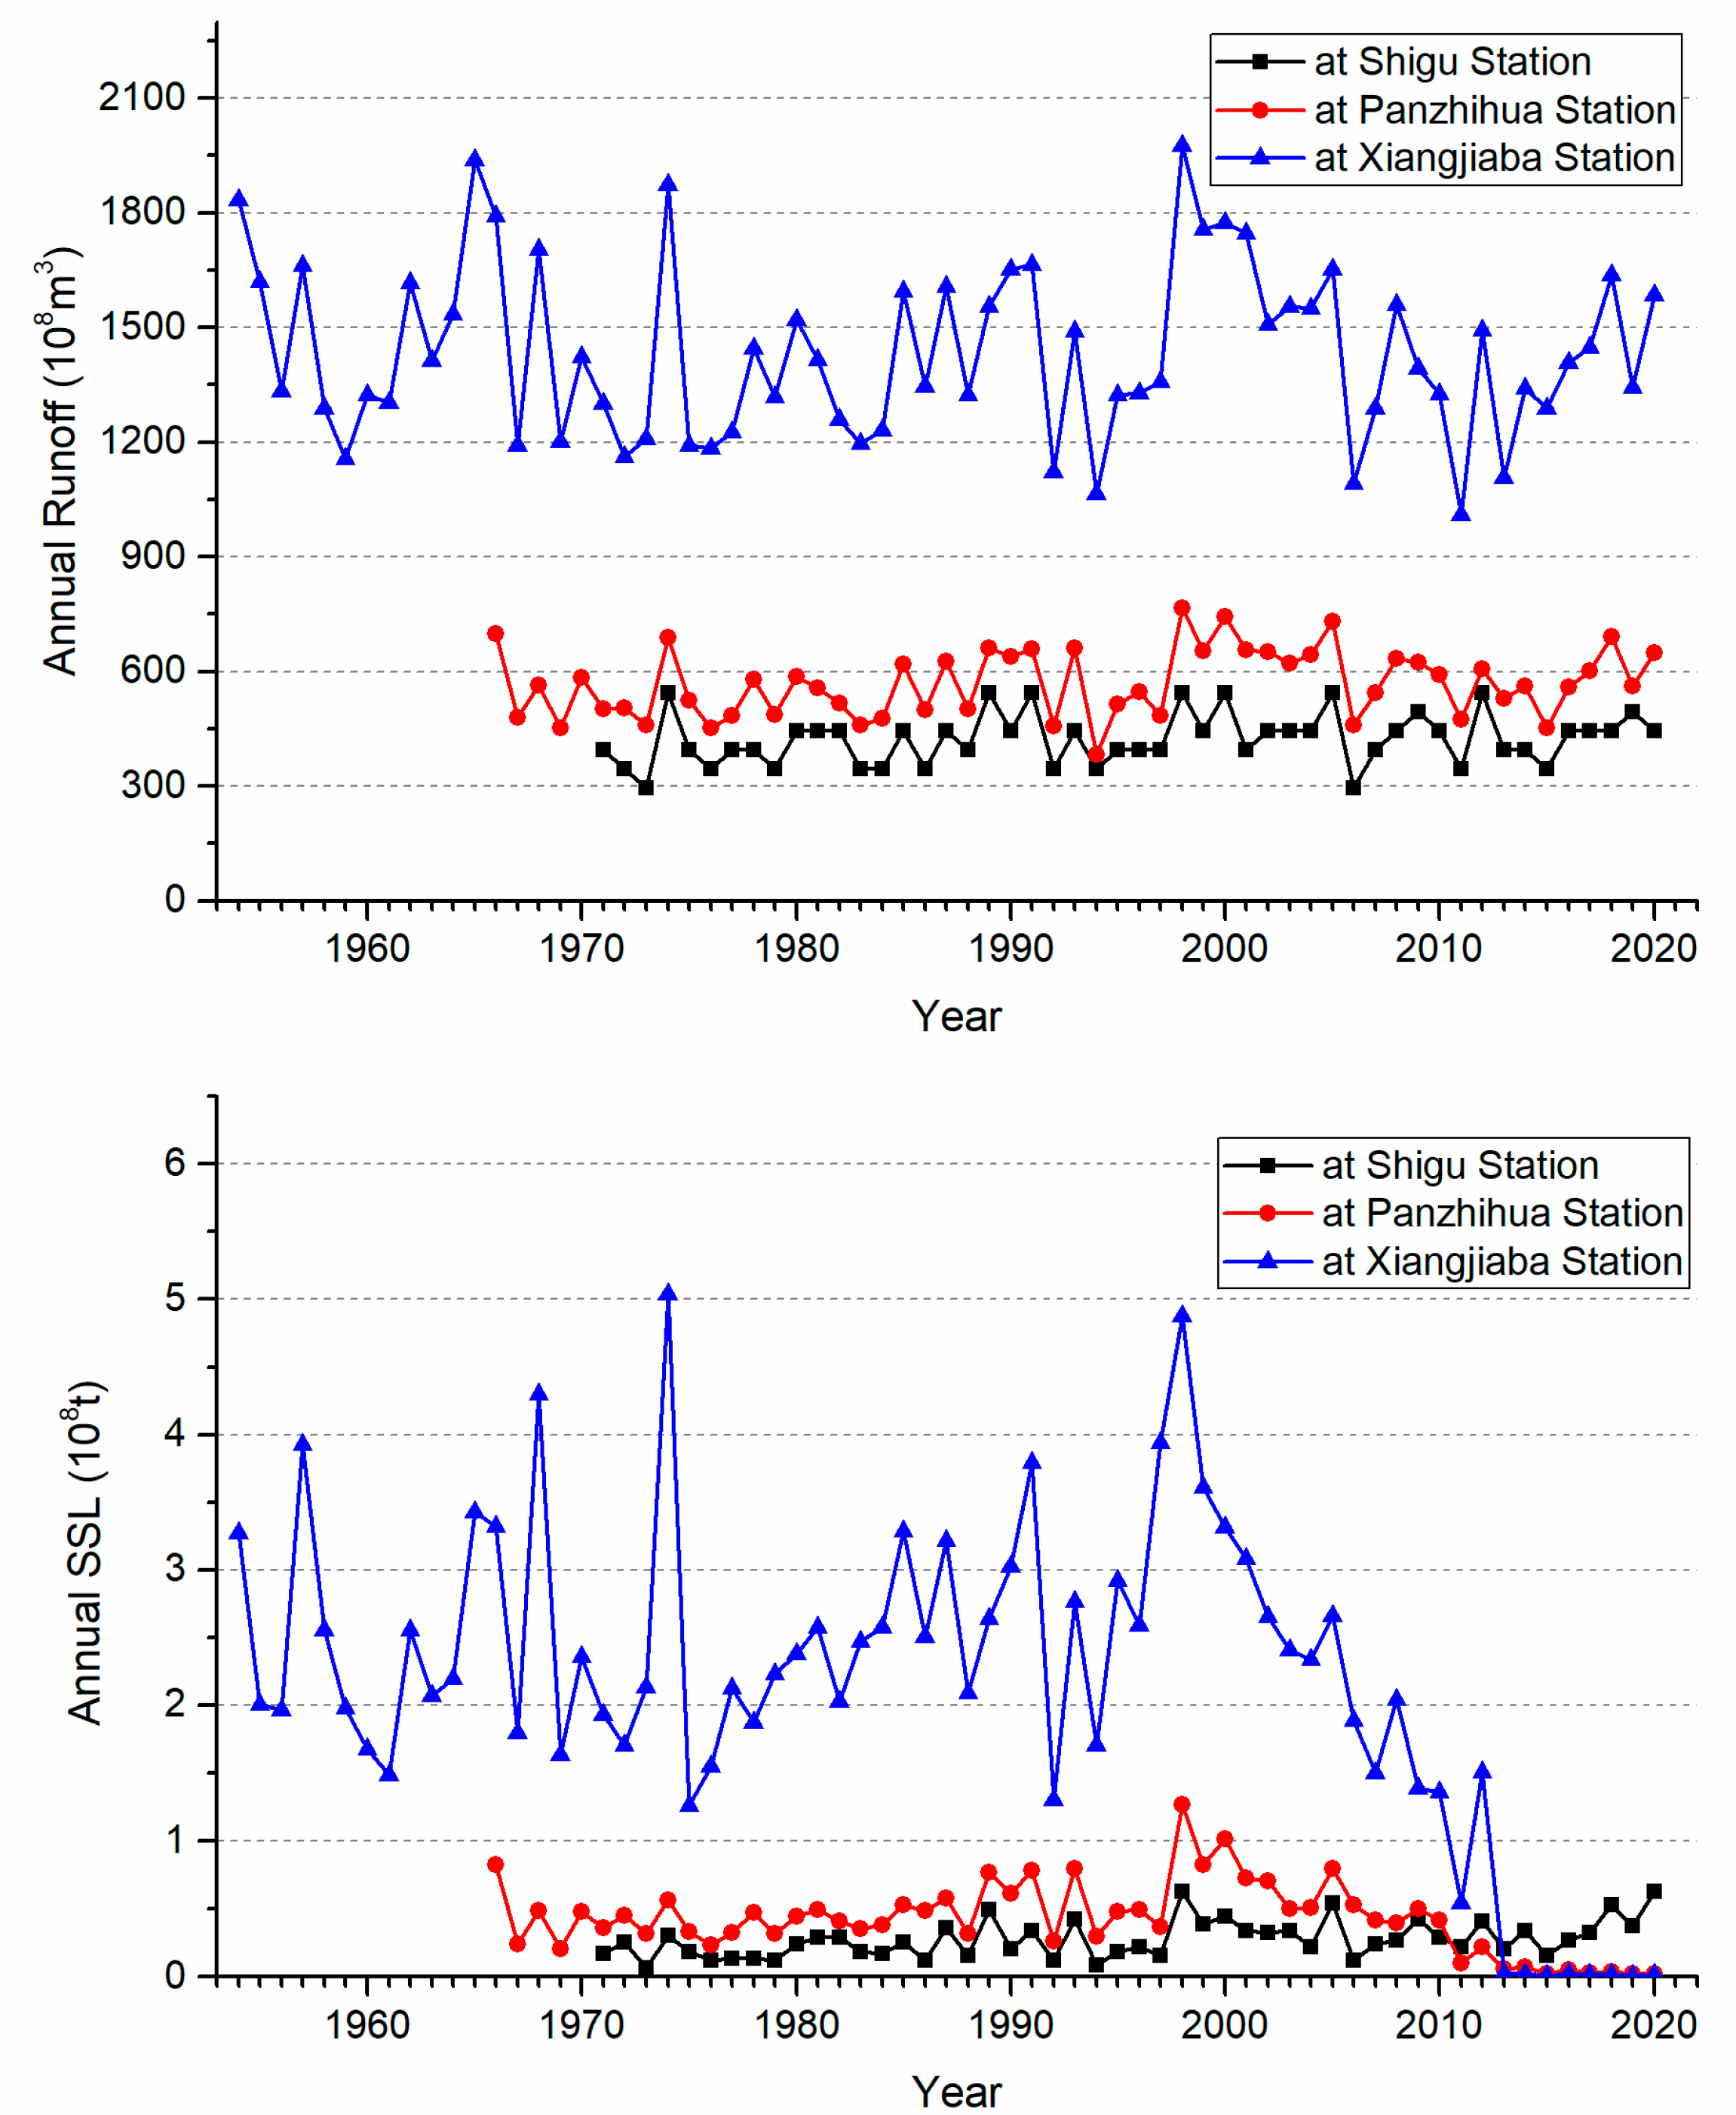
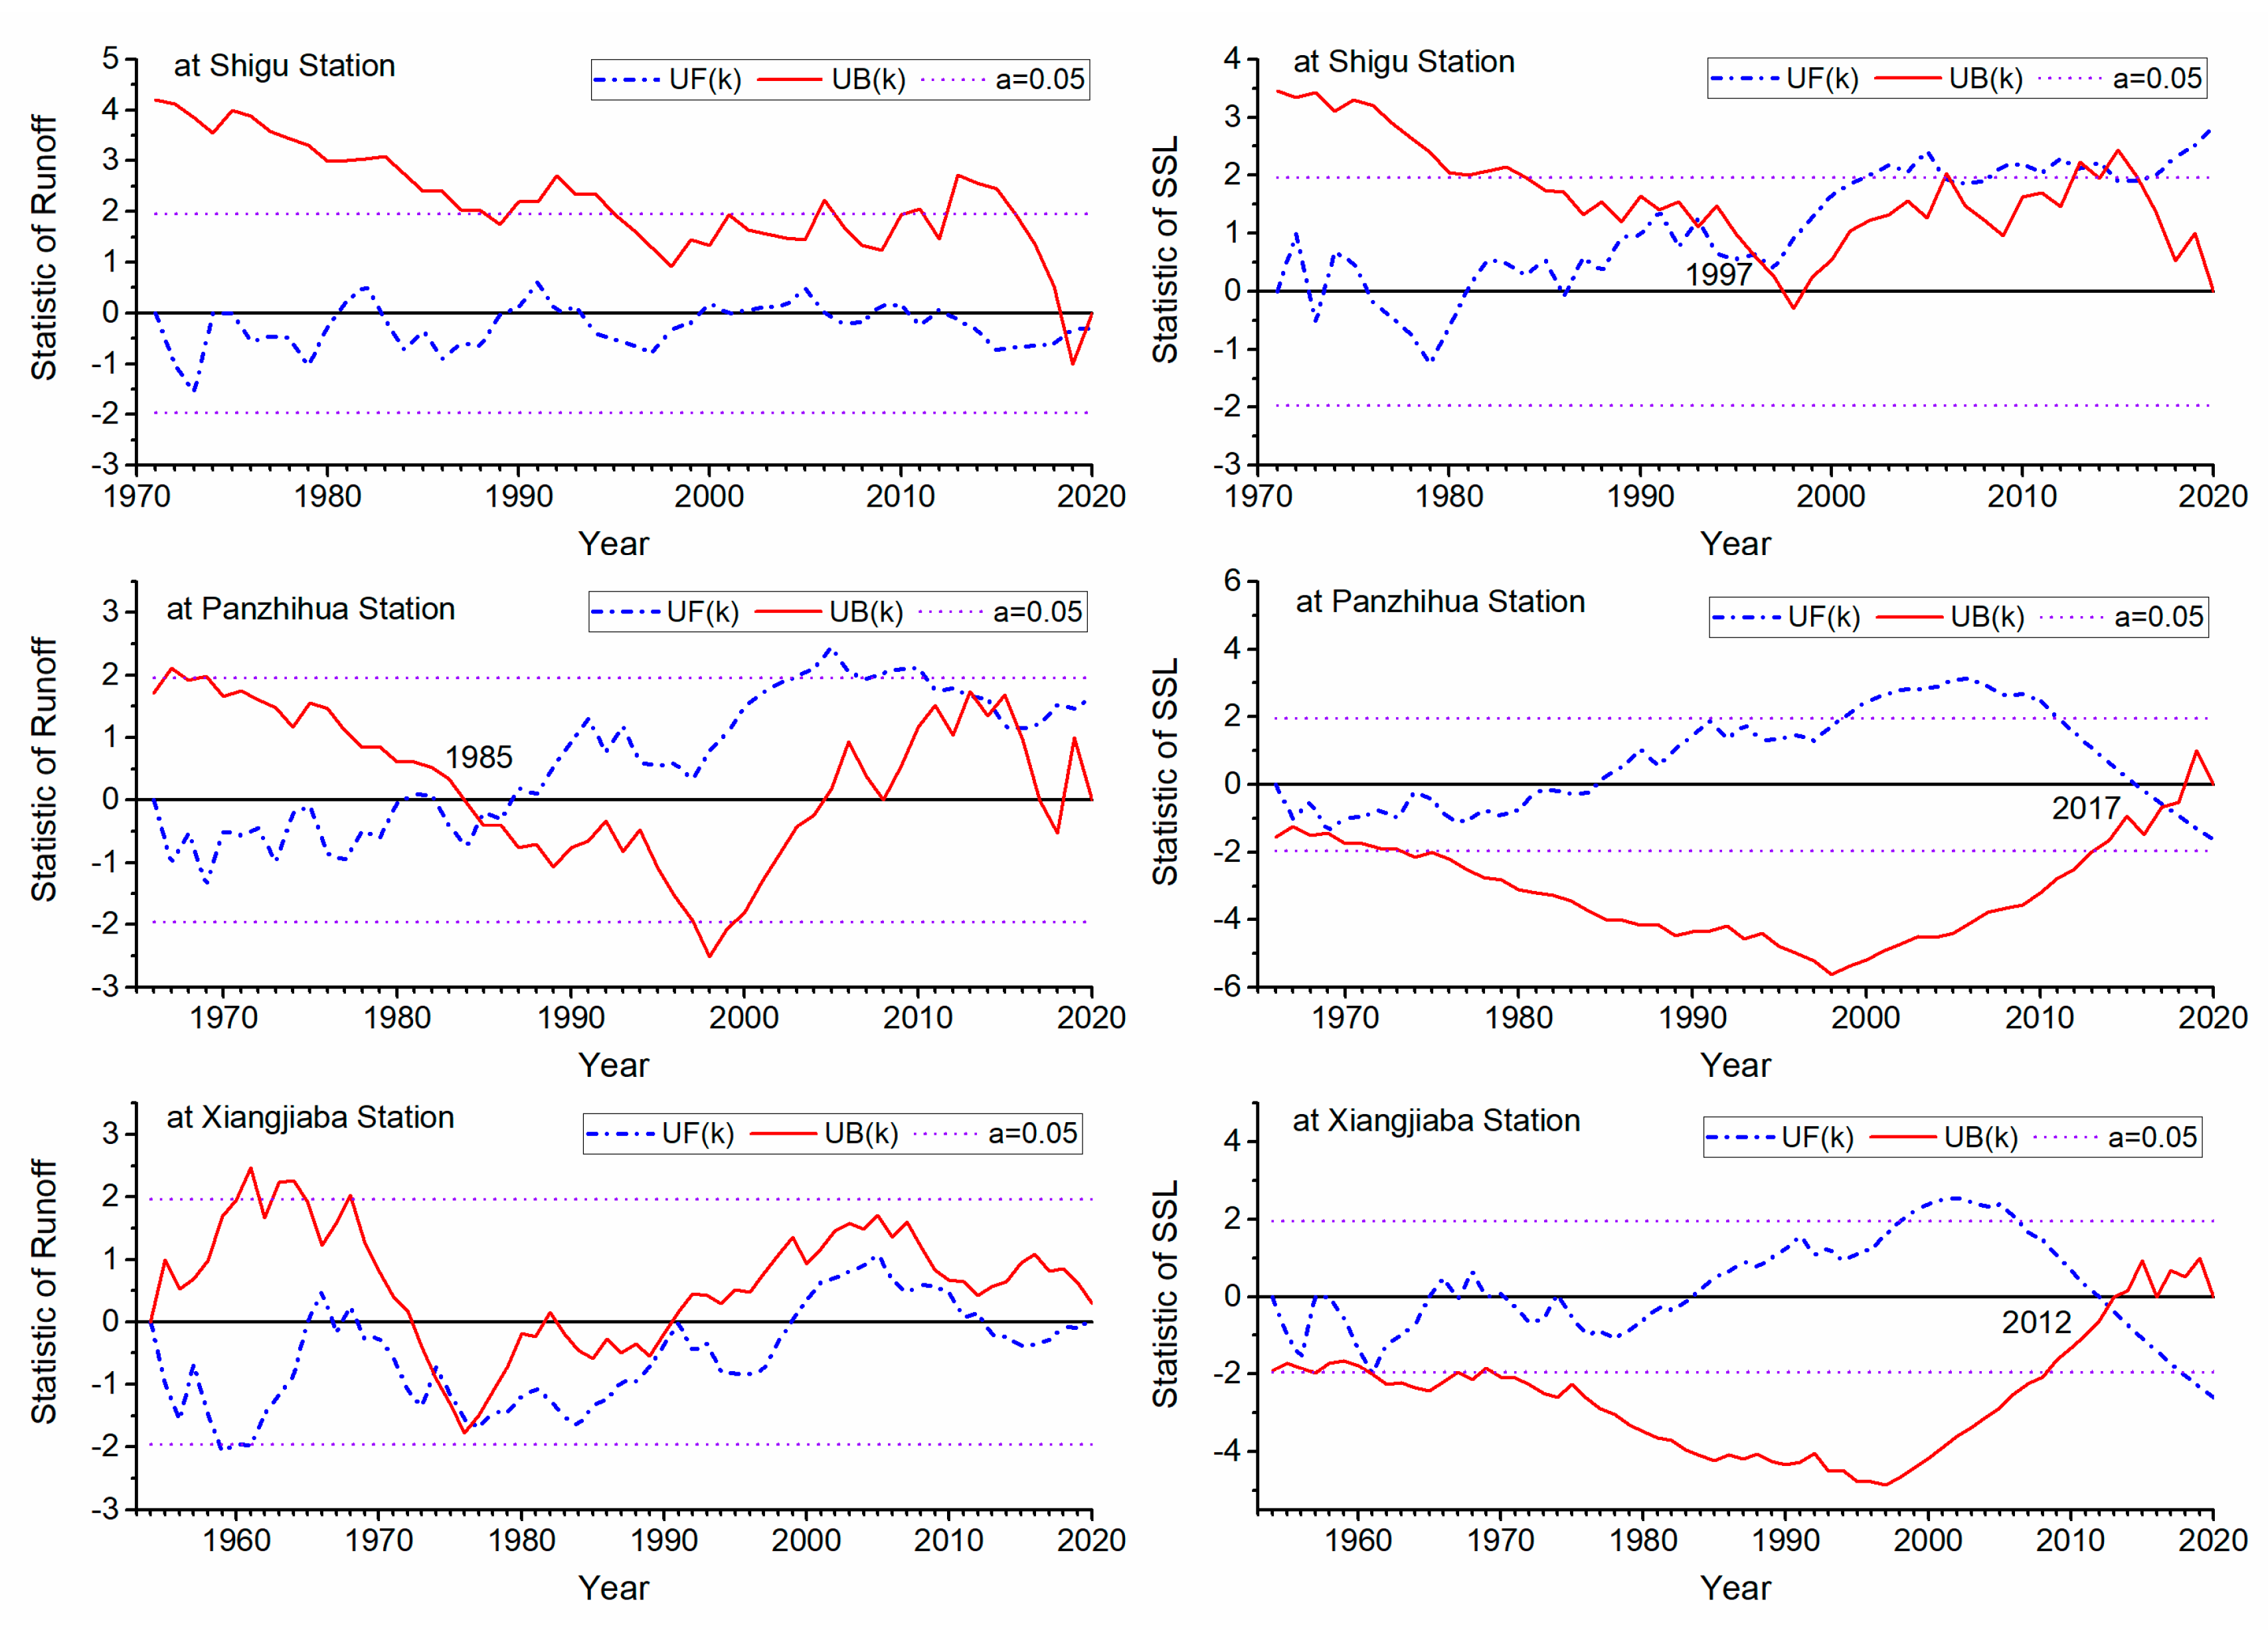
- The runoff of the Jinsha River basin has a significant and relatively obvious trend of increasing at Shigu and Panzhihua stations, respectively, while it slightly increases but not significantly at Xiangjiaba station. The interannual variation of runoff at Panzhihua Station has a significant mutation year, which is 1985, while that at the other two hydrological stations does not exhibit abrupt changes.
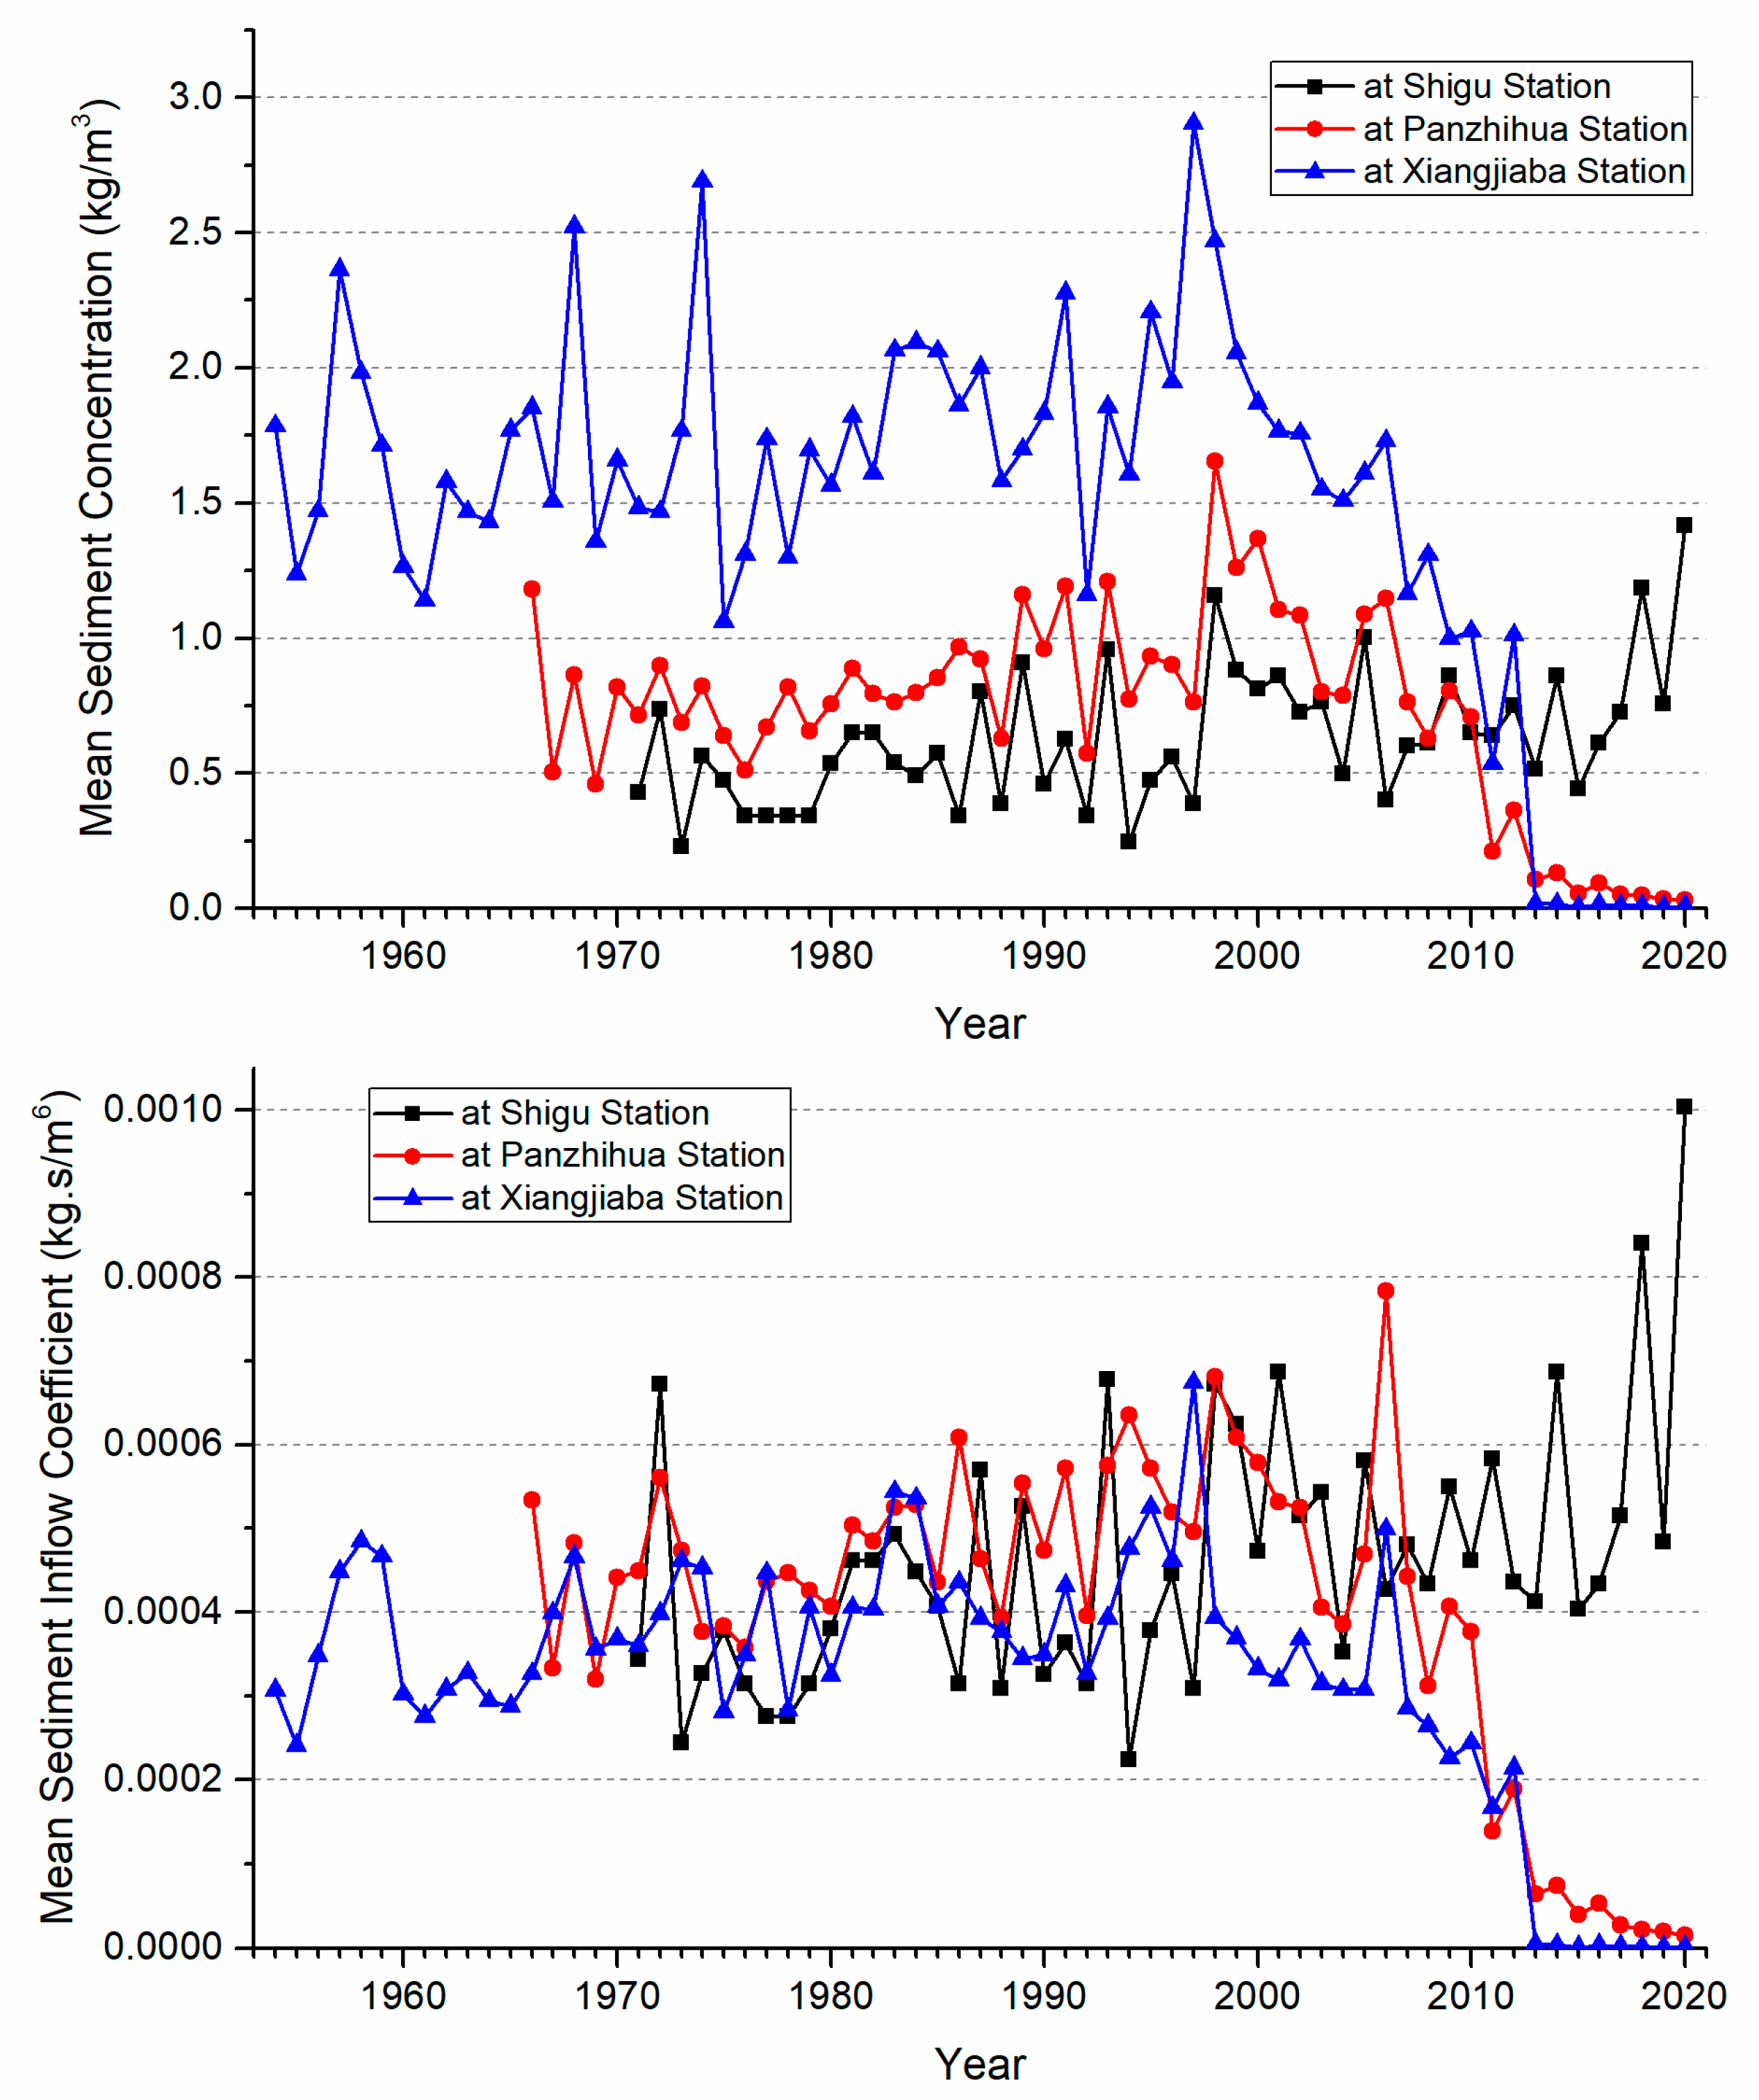
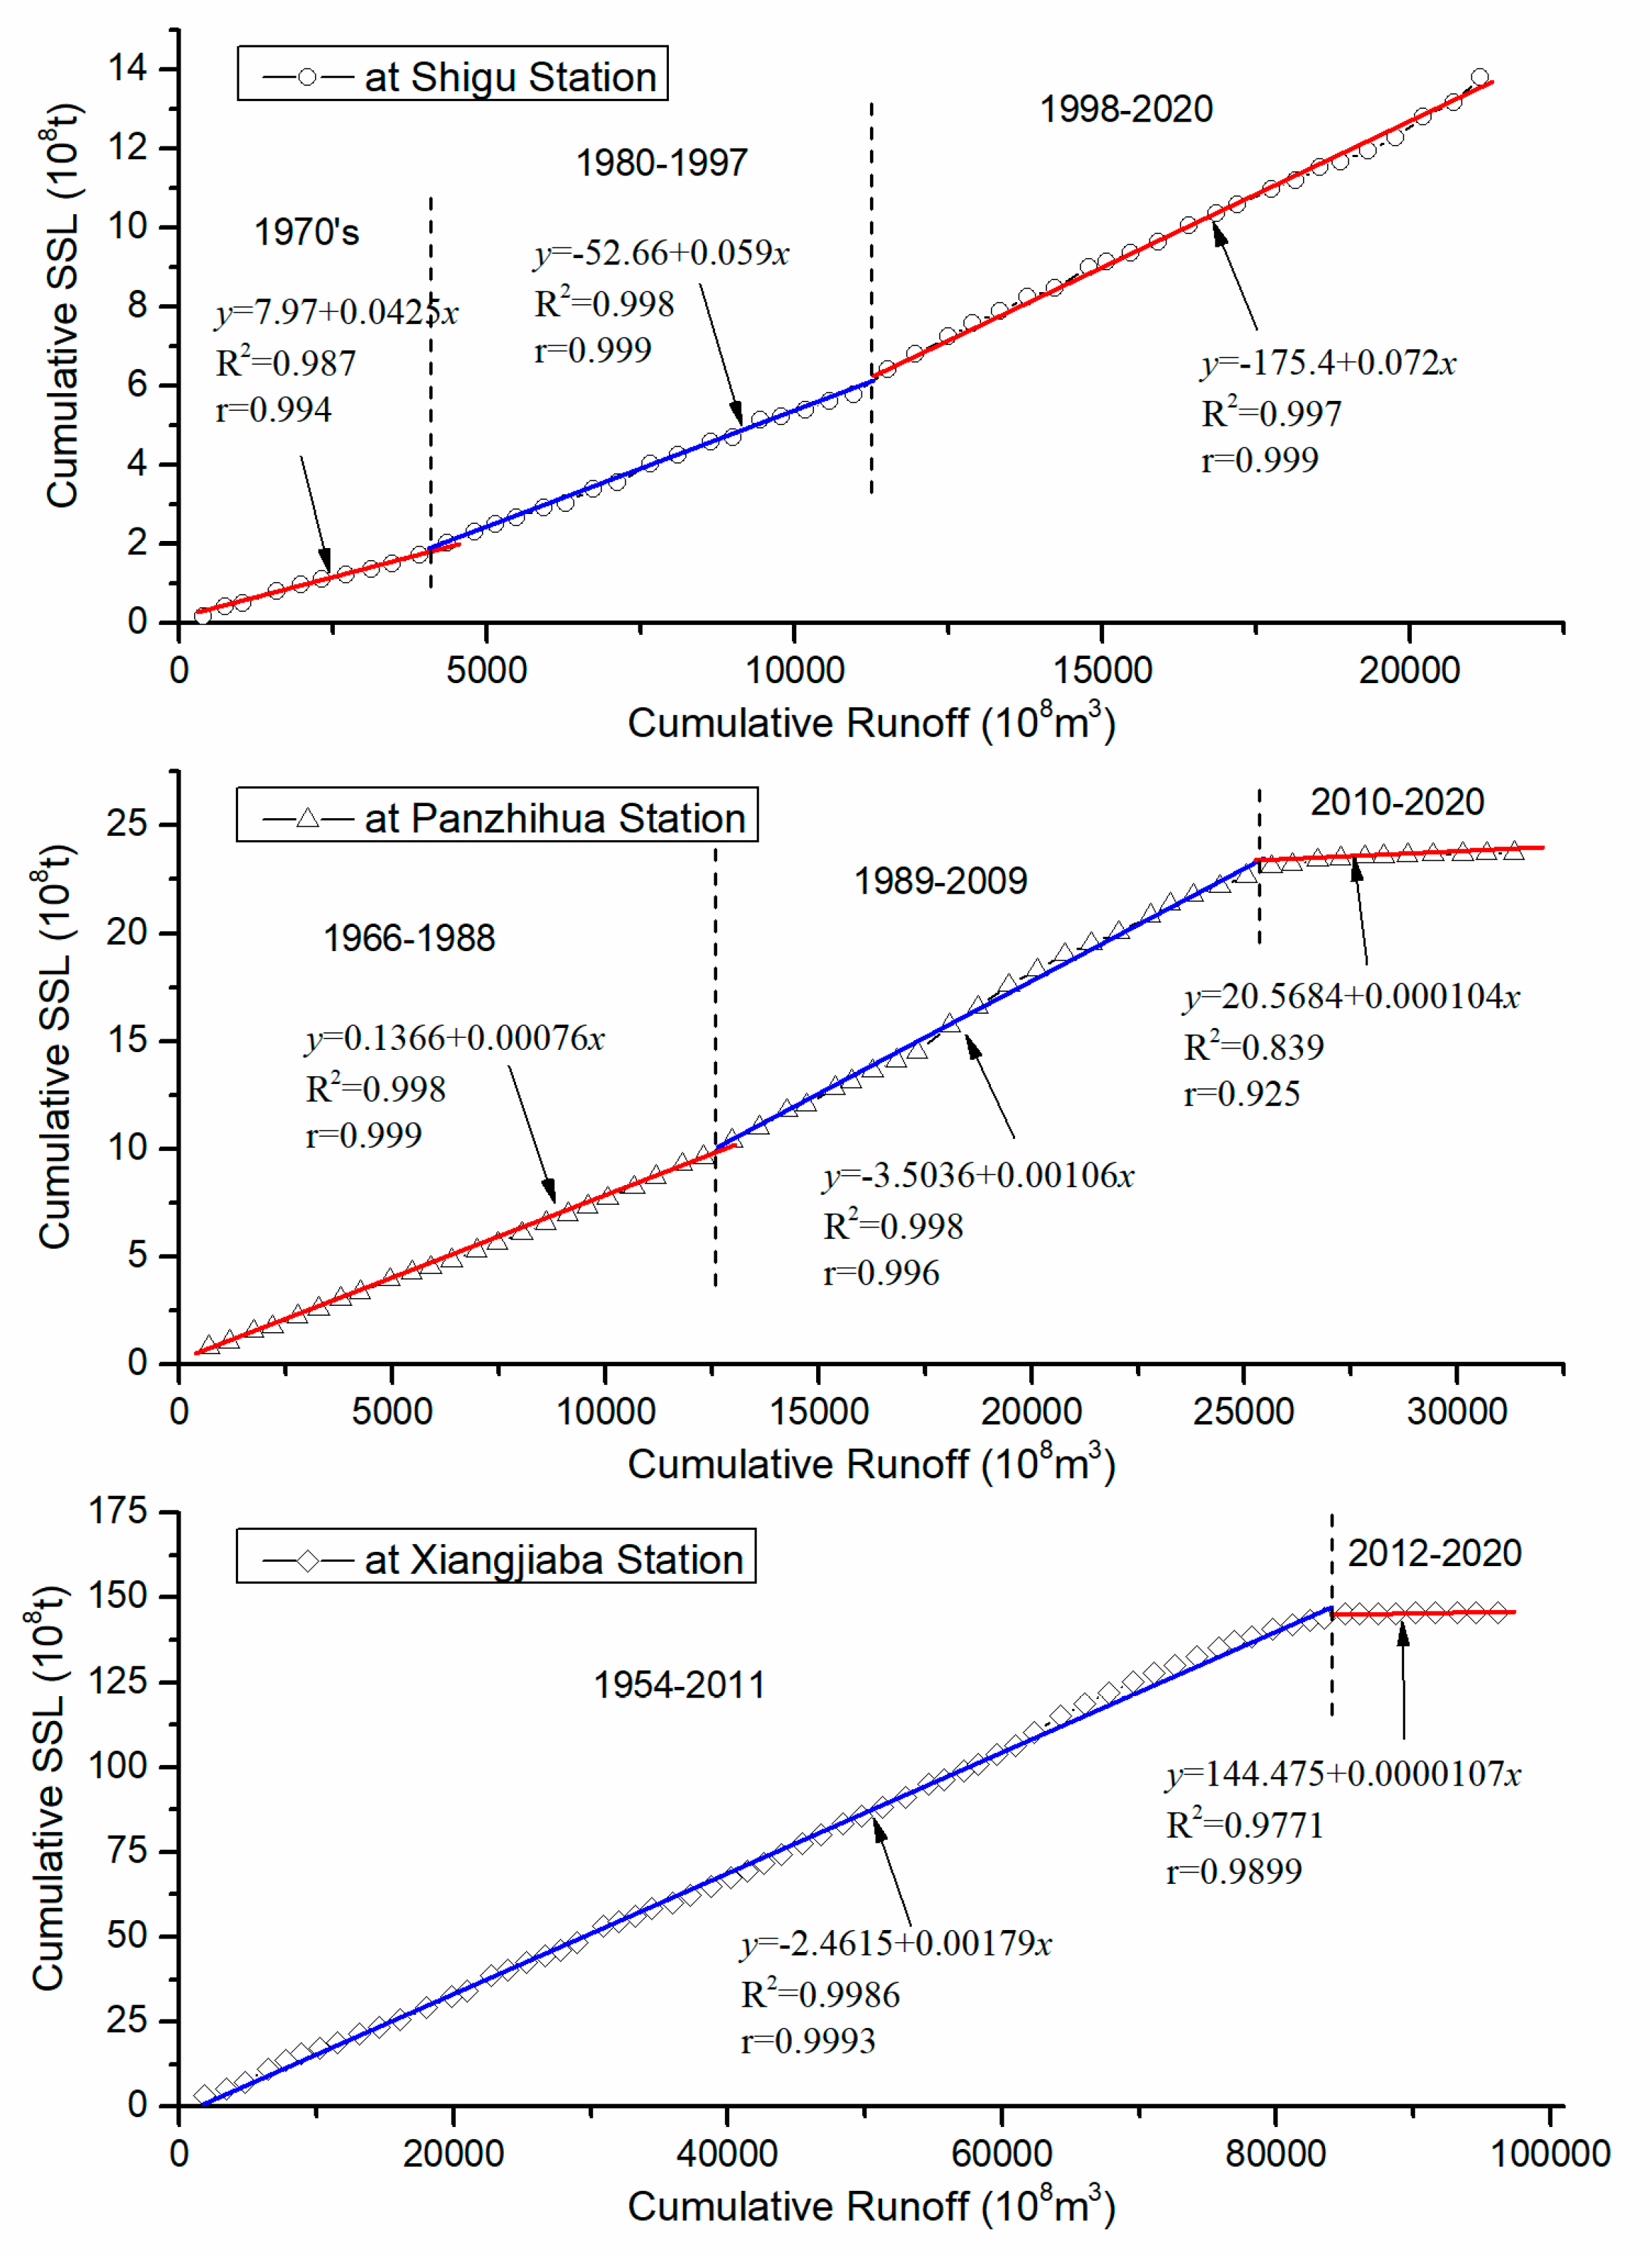
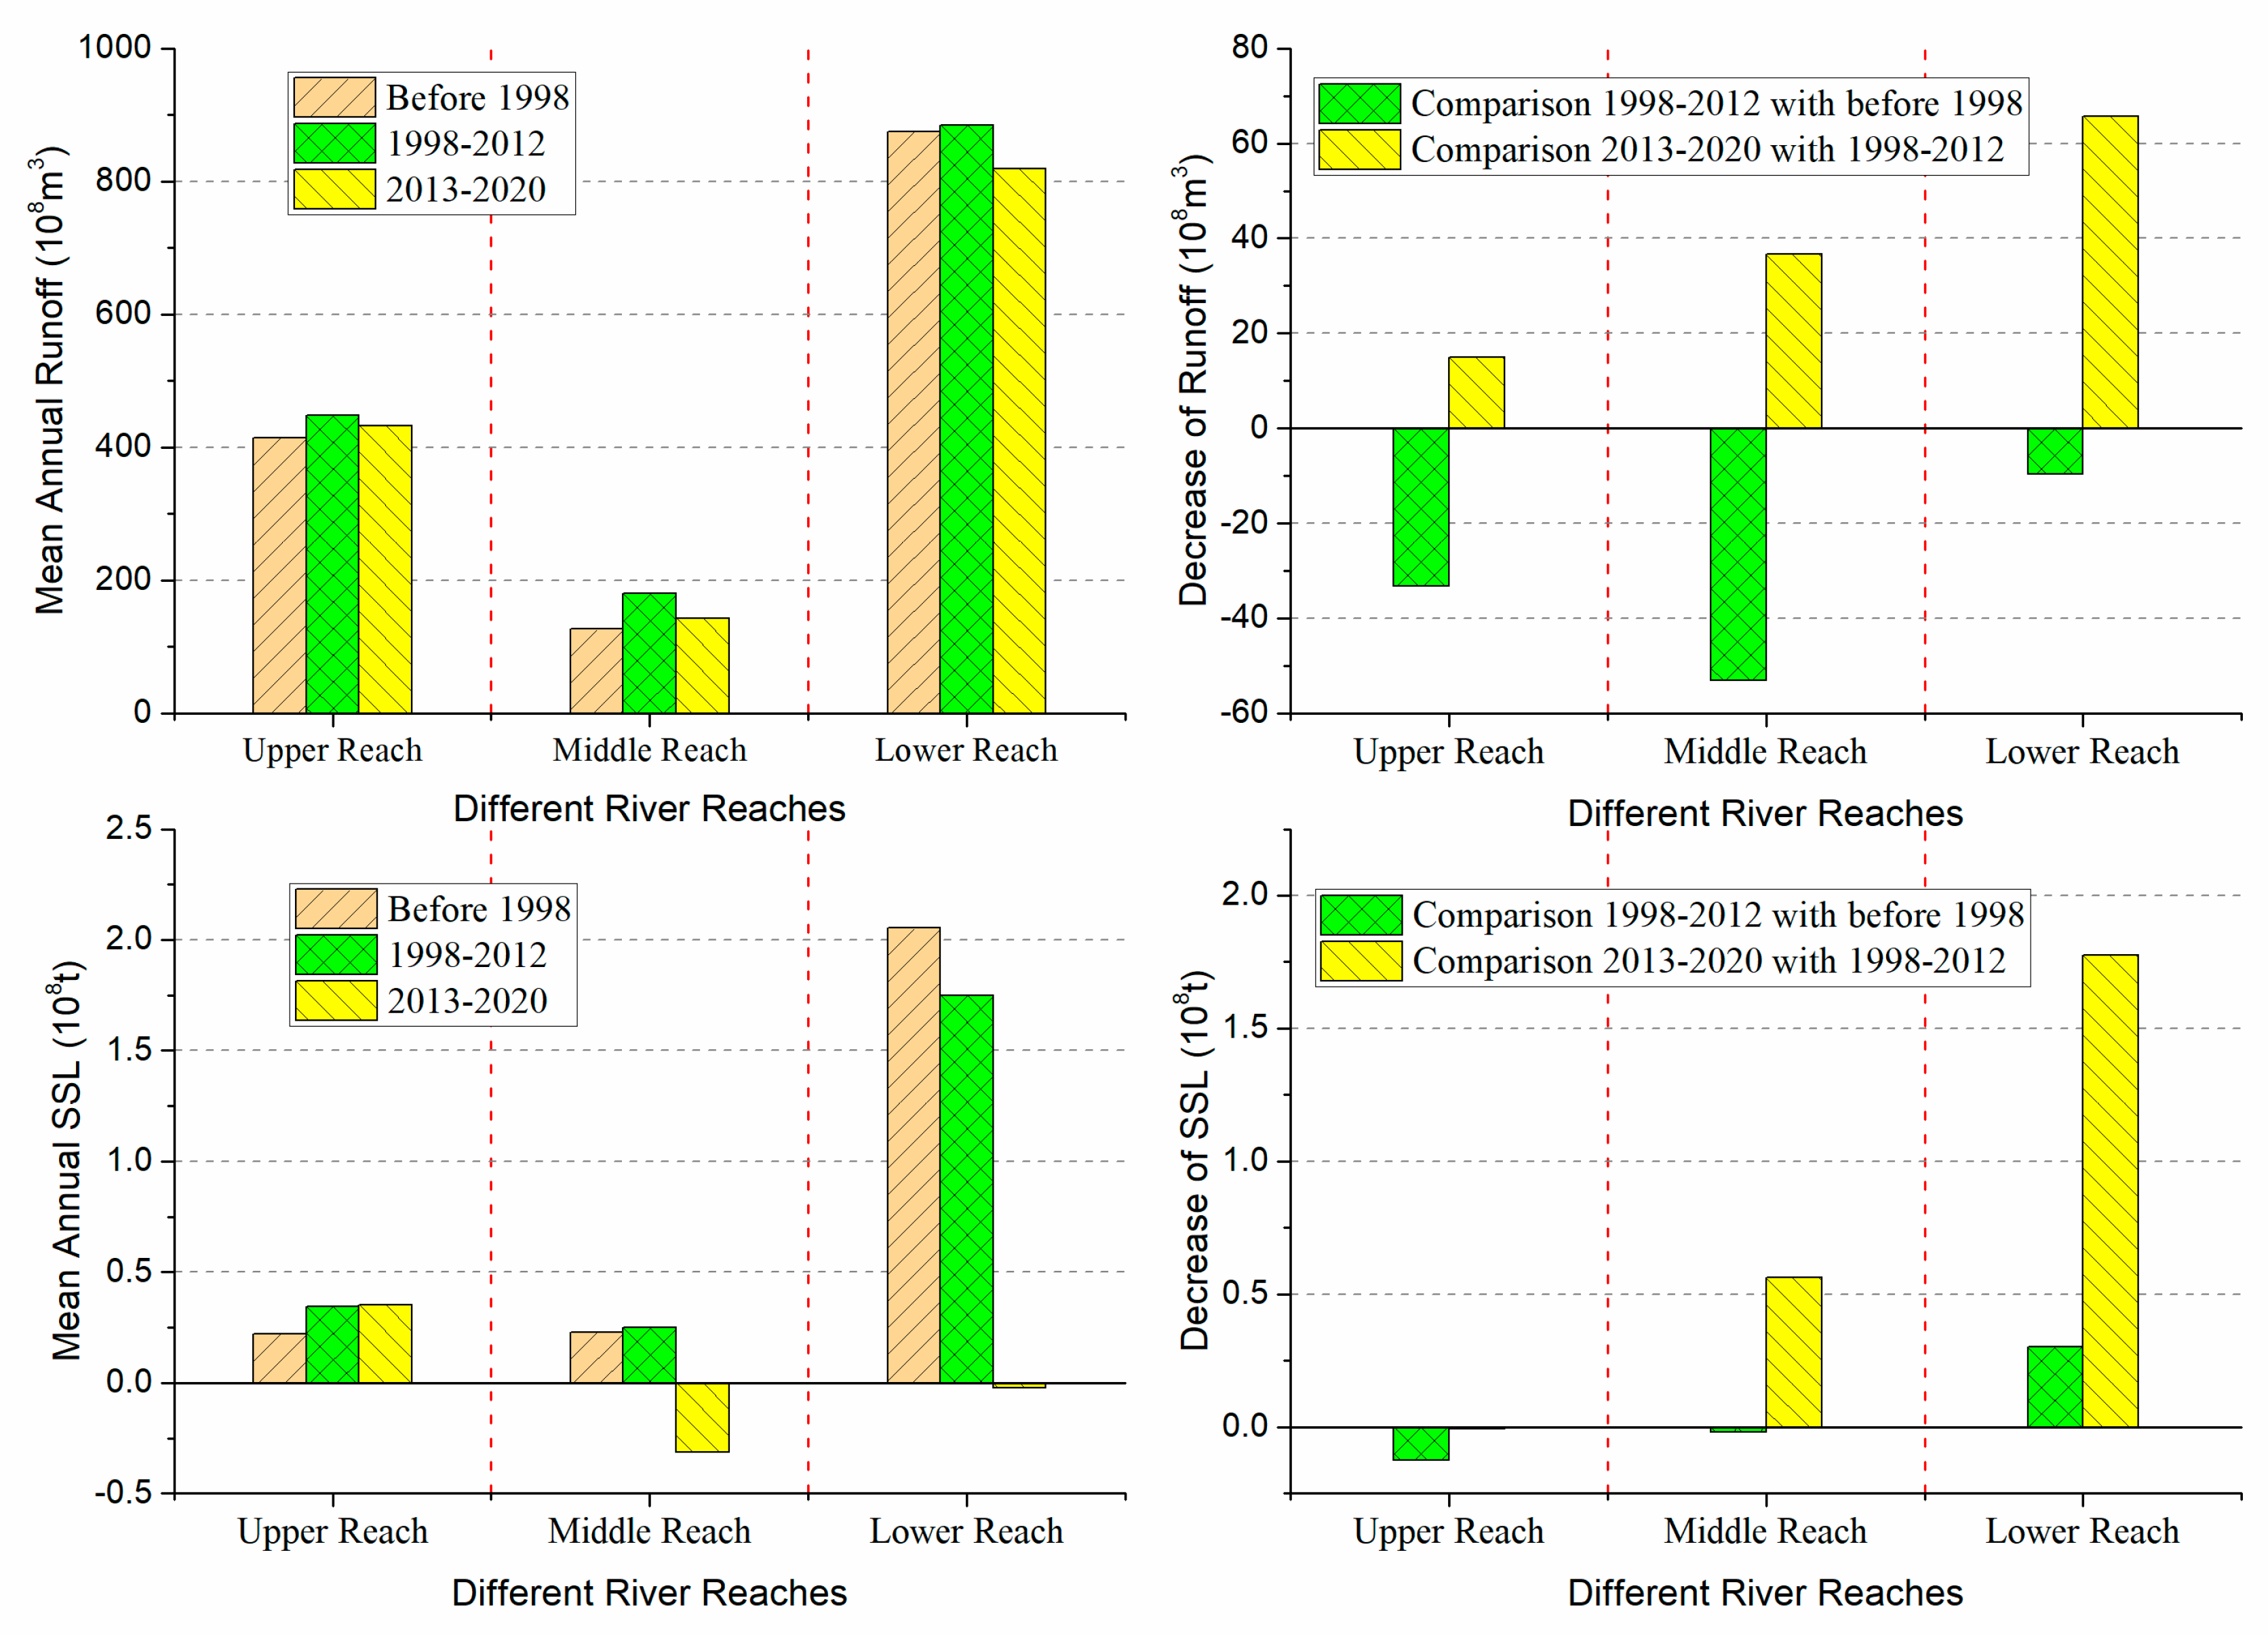
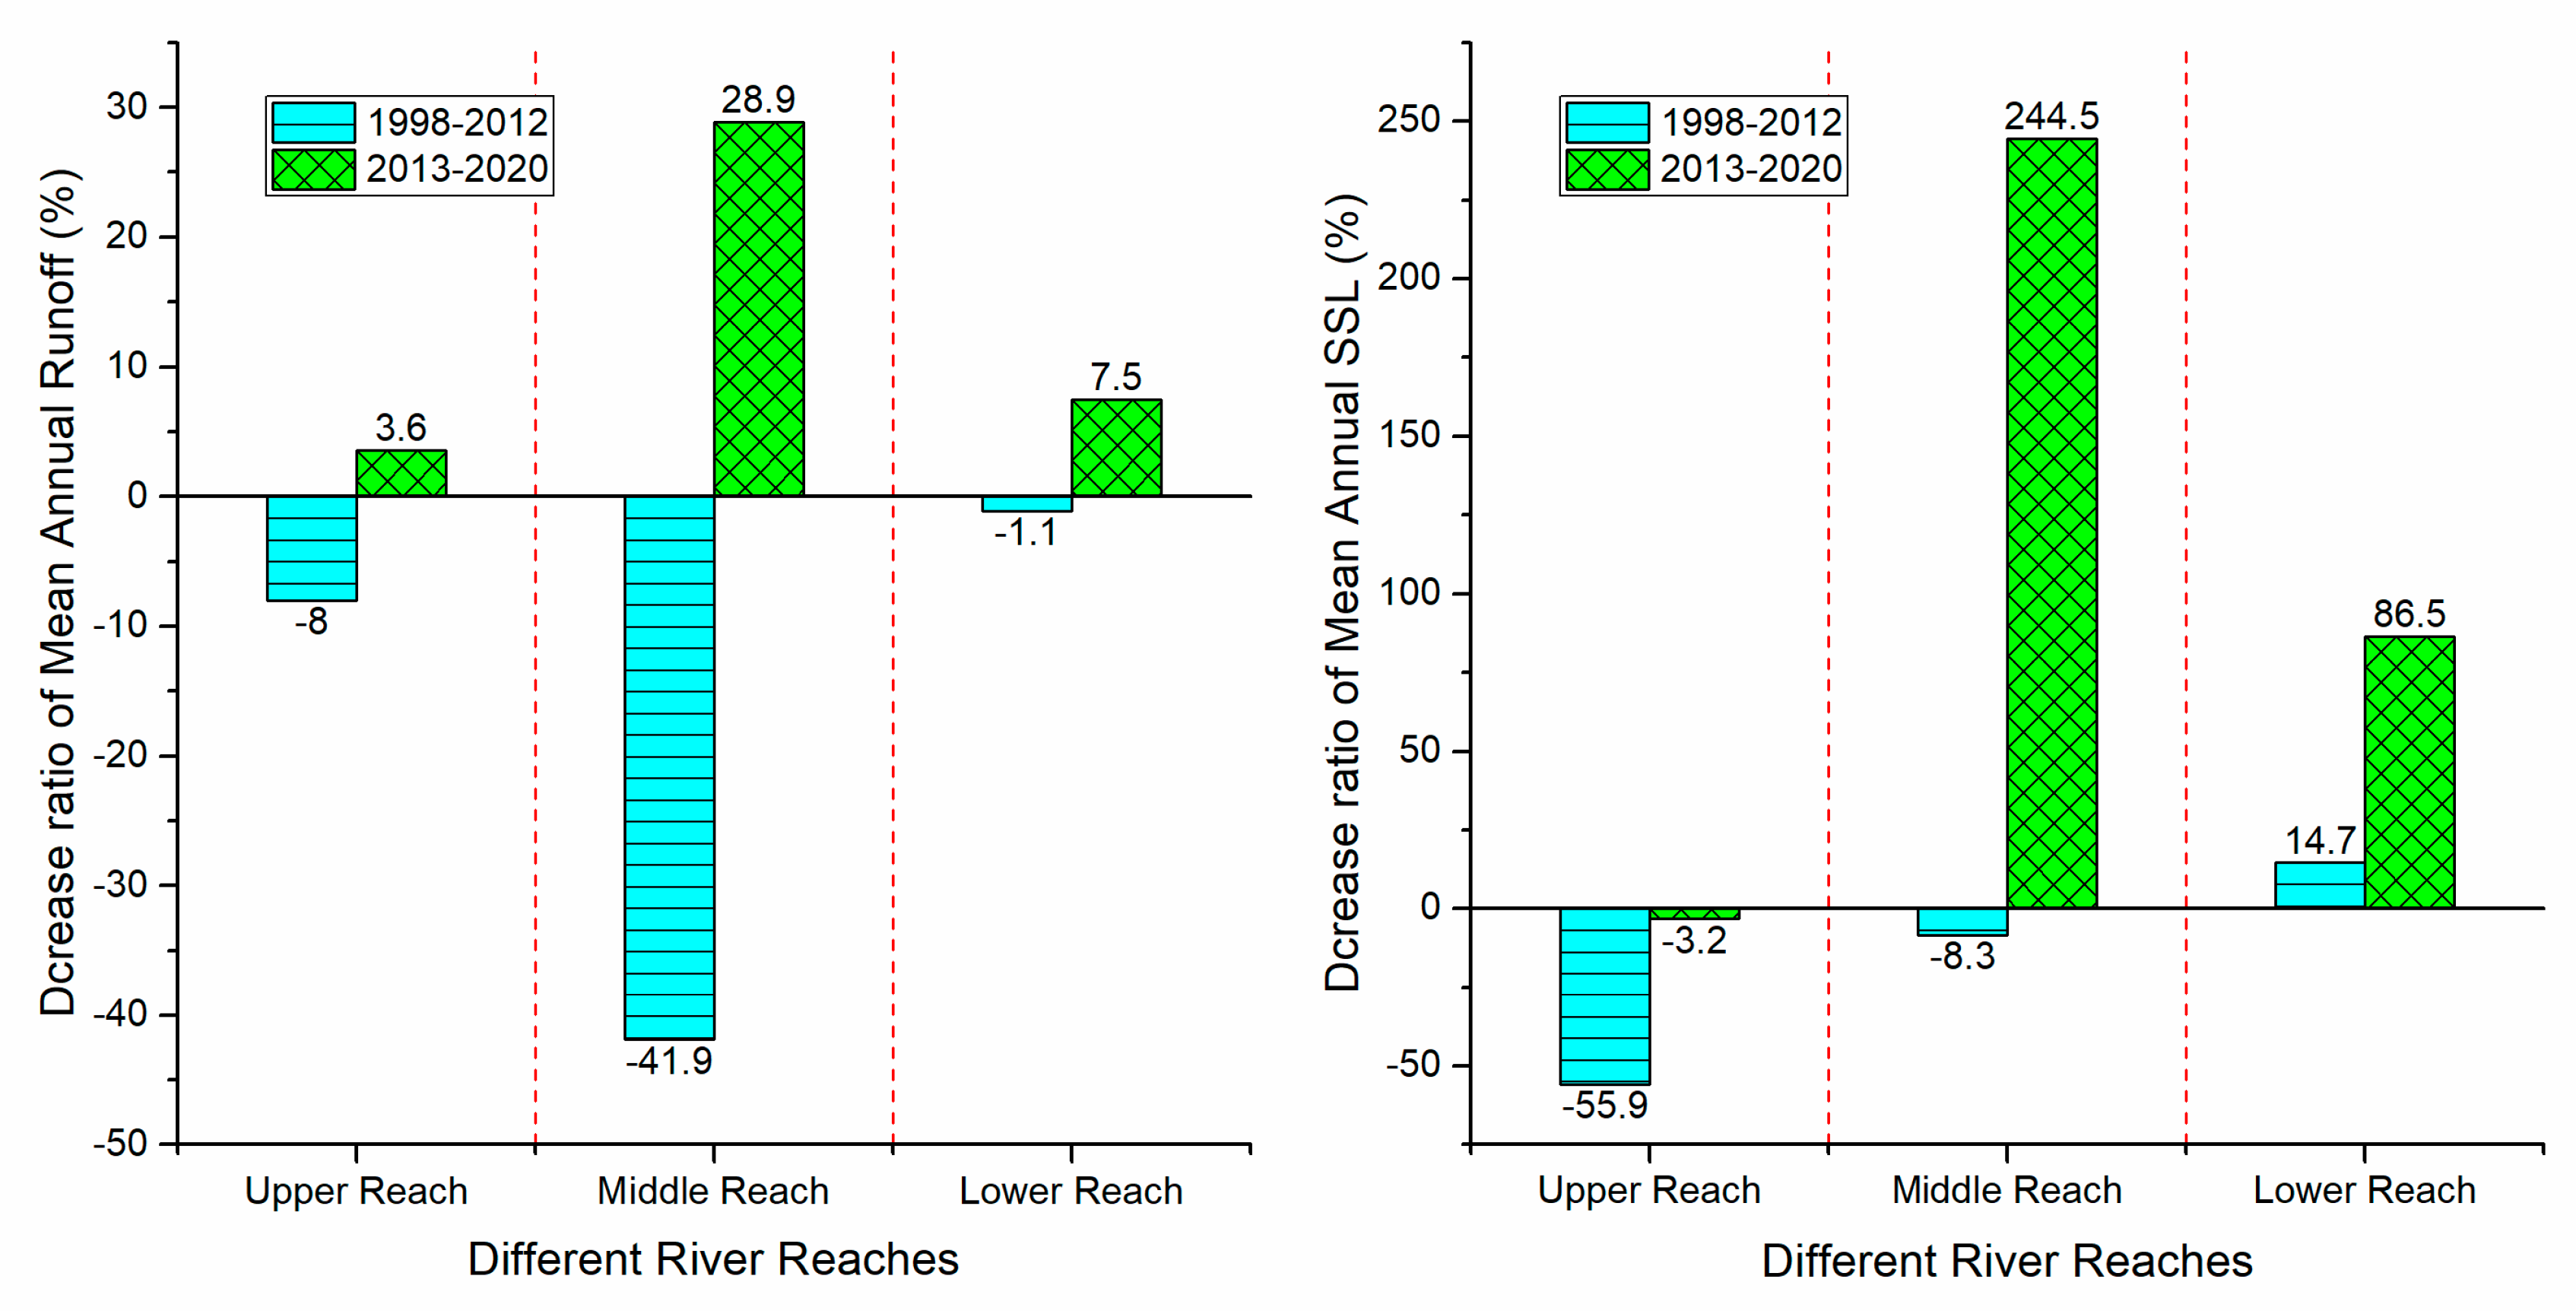
- The sediment transport process in the Jinsha River basin is characterized by both phased changes and spatial differentiation. The annual suspended sediment load at Shigu Station showed a fluctuating increasing trend, and the mutation year is 1997. For Panzhihua Station, the annual suspended sediment load showed an increasing trend before 1998, but has significantly decreased since 1998. The annual suspended sediment load at Xiangjiaba Station fluctuated significantly before 1998, but the trend was unclear. Since 1998, it has shown a significant decreasing trend, especially since 2013, the annual suspended sediment load has only accounted for 0.61% of its multi-year average. The interannual variation of sediment concentration and sediment inflow coefficient at the above hydrological stations is consistent with the interannual variation trend of sediment transport. The annual mean sediment concentration (0.63kg/m3, 0.74kg/m3, and 1.48kg/m3) increases along the river course, Indicating an increasing trend of sediment production and sediment transport capacity along the river course.
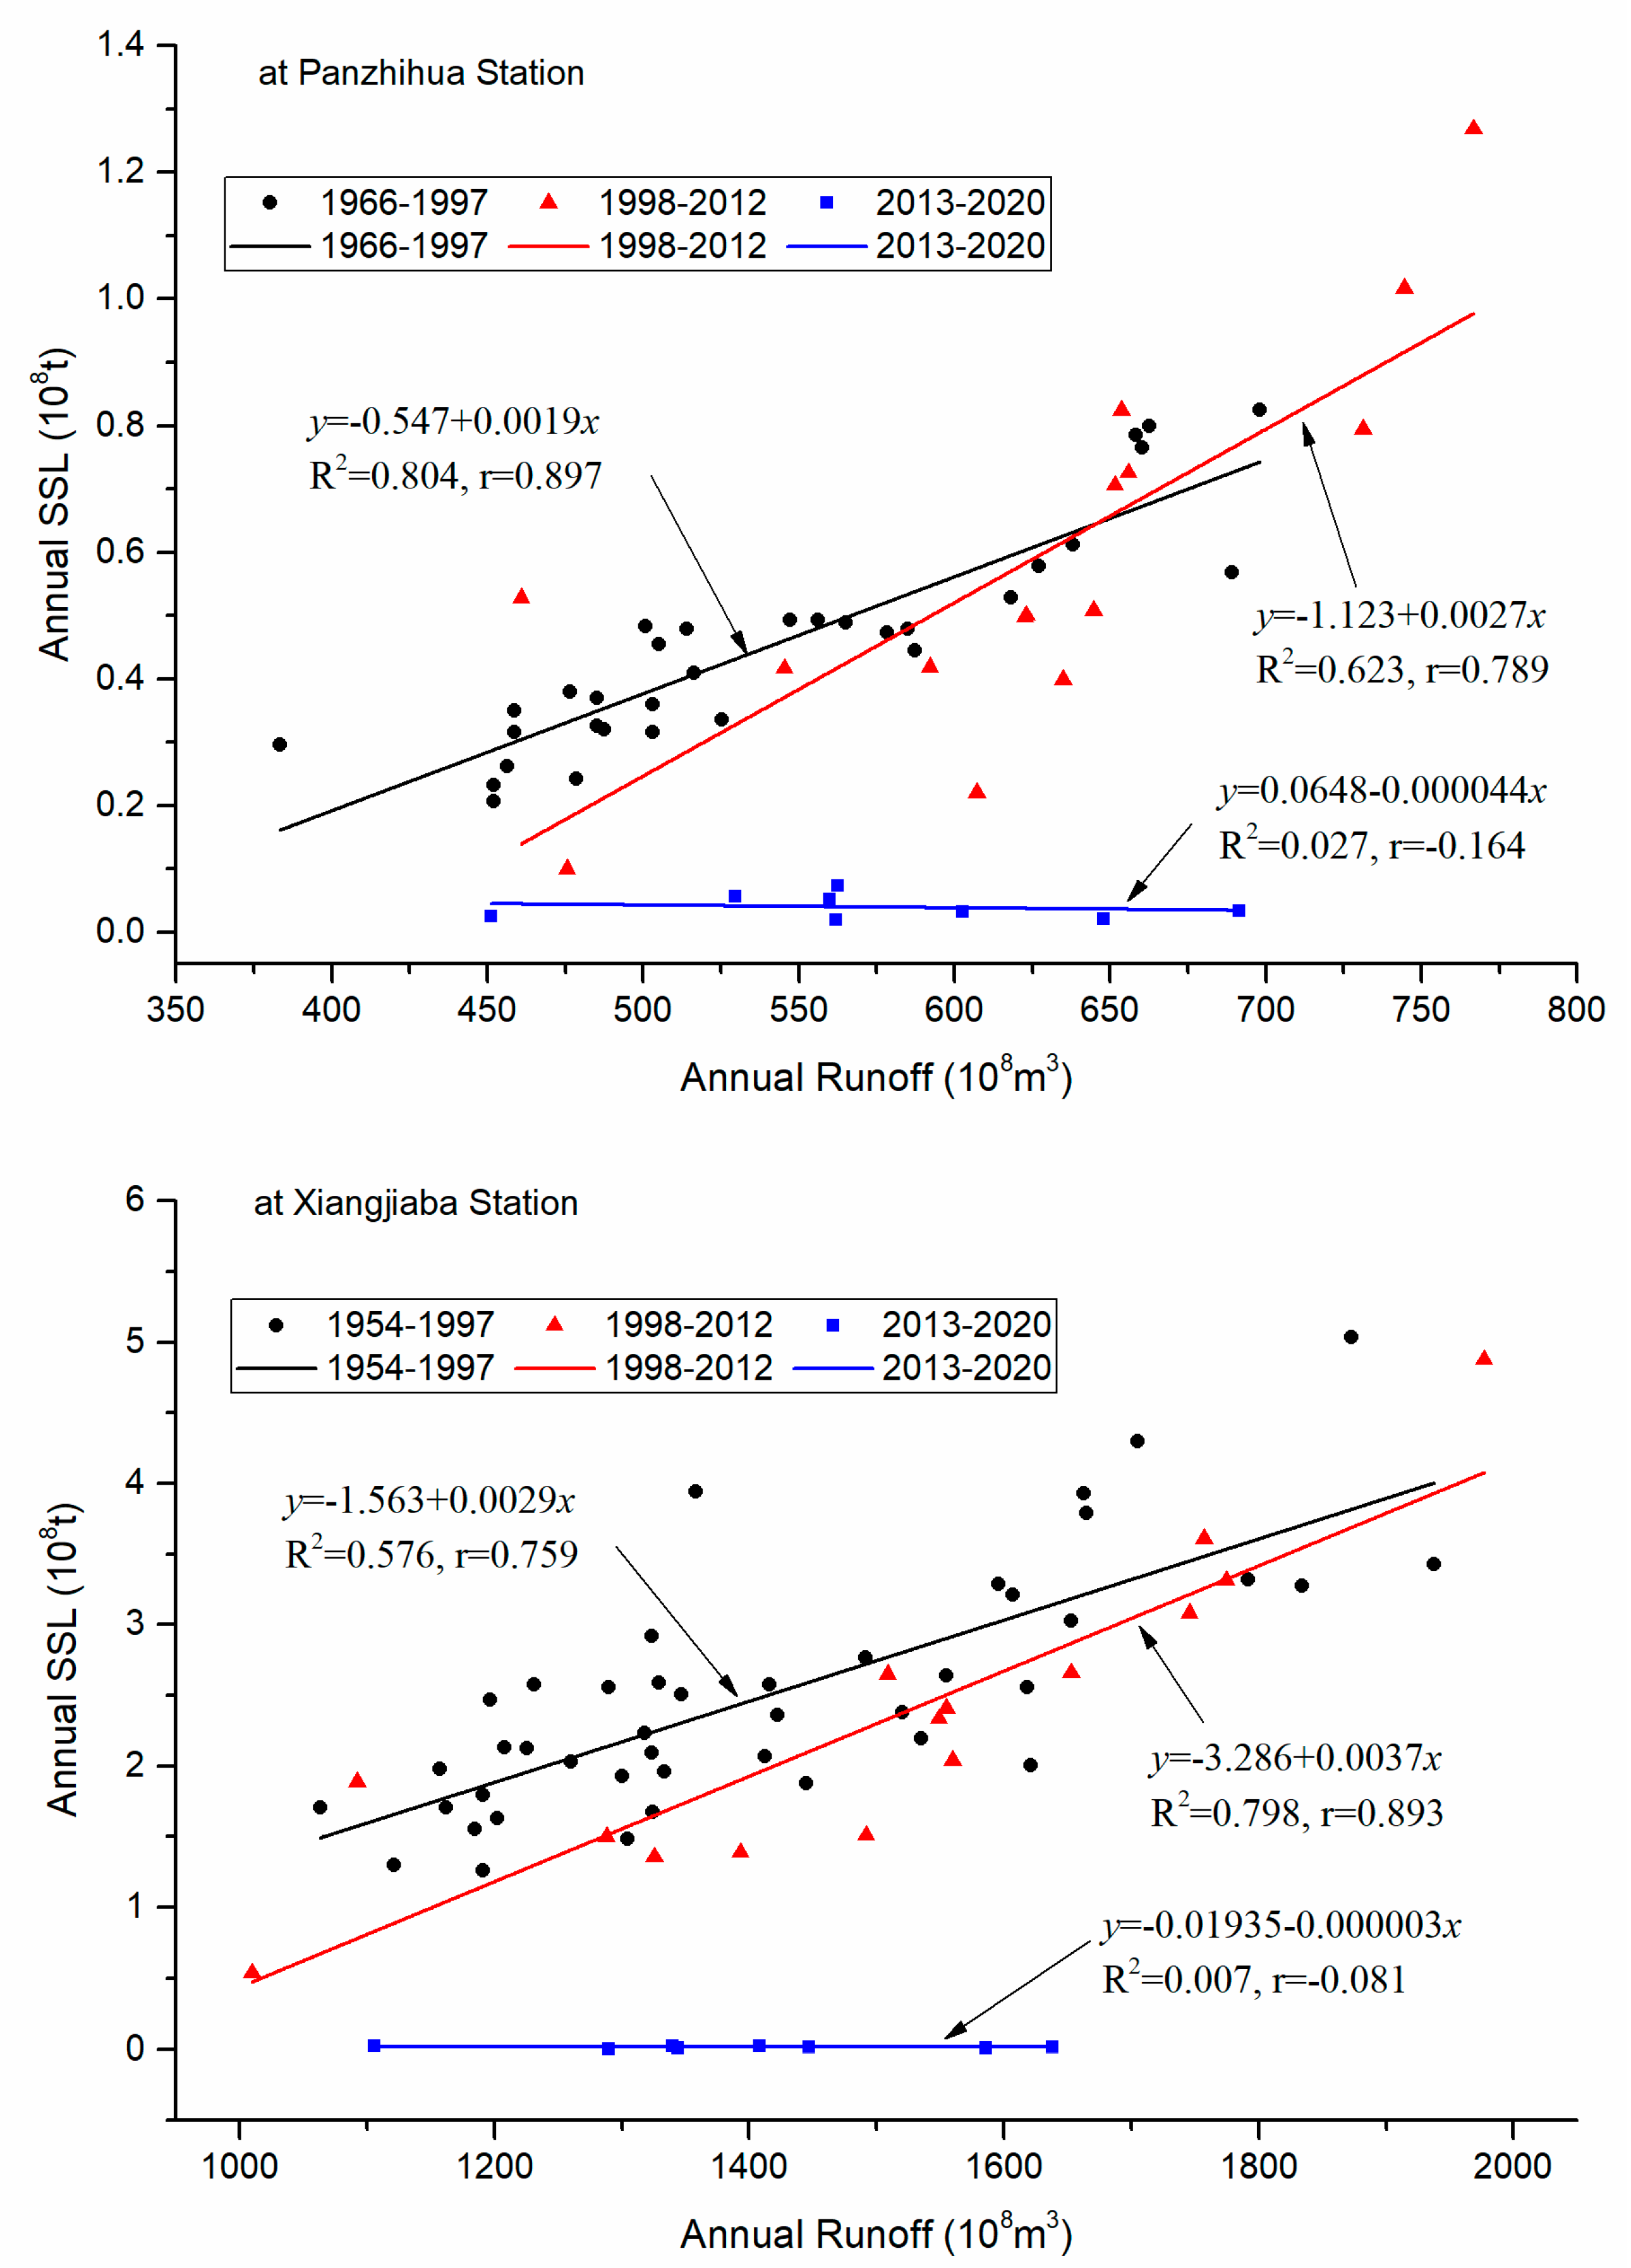
- Taking the 1998 and 2013 mutation years as the boundary of the data series, the coefficient of determination between annual runoff and suspended sediment load at Panzhihua and Xiangjiaba stations was high and higher (0.80, 0.58) before 1998, higher and high (0.62, 0.80) in the period from 1998 to 2012, and both very small (0.03, 0.01) in the period from 2013 to 2020, respectively.
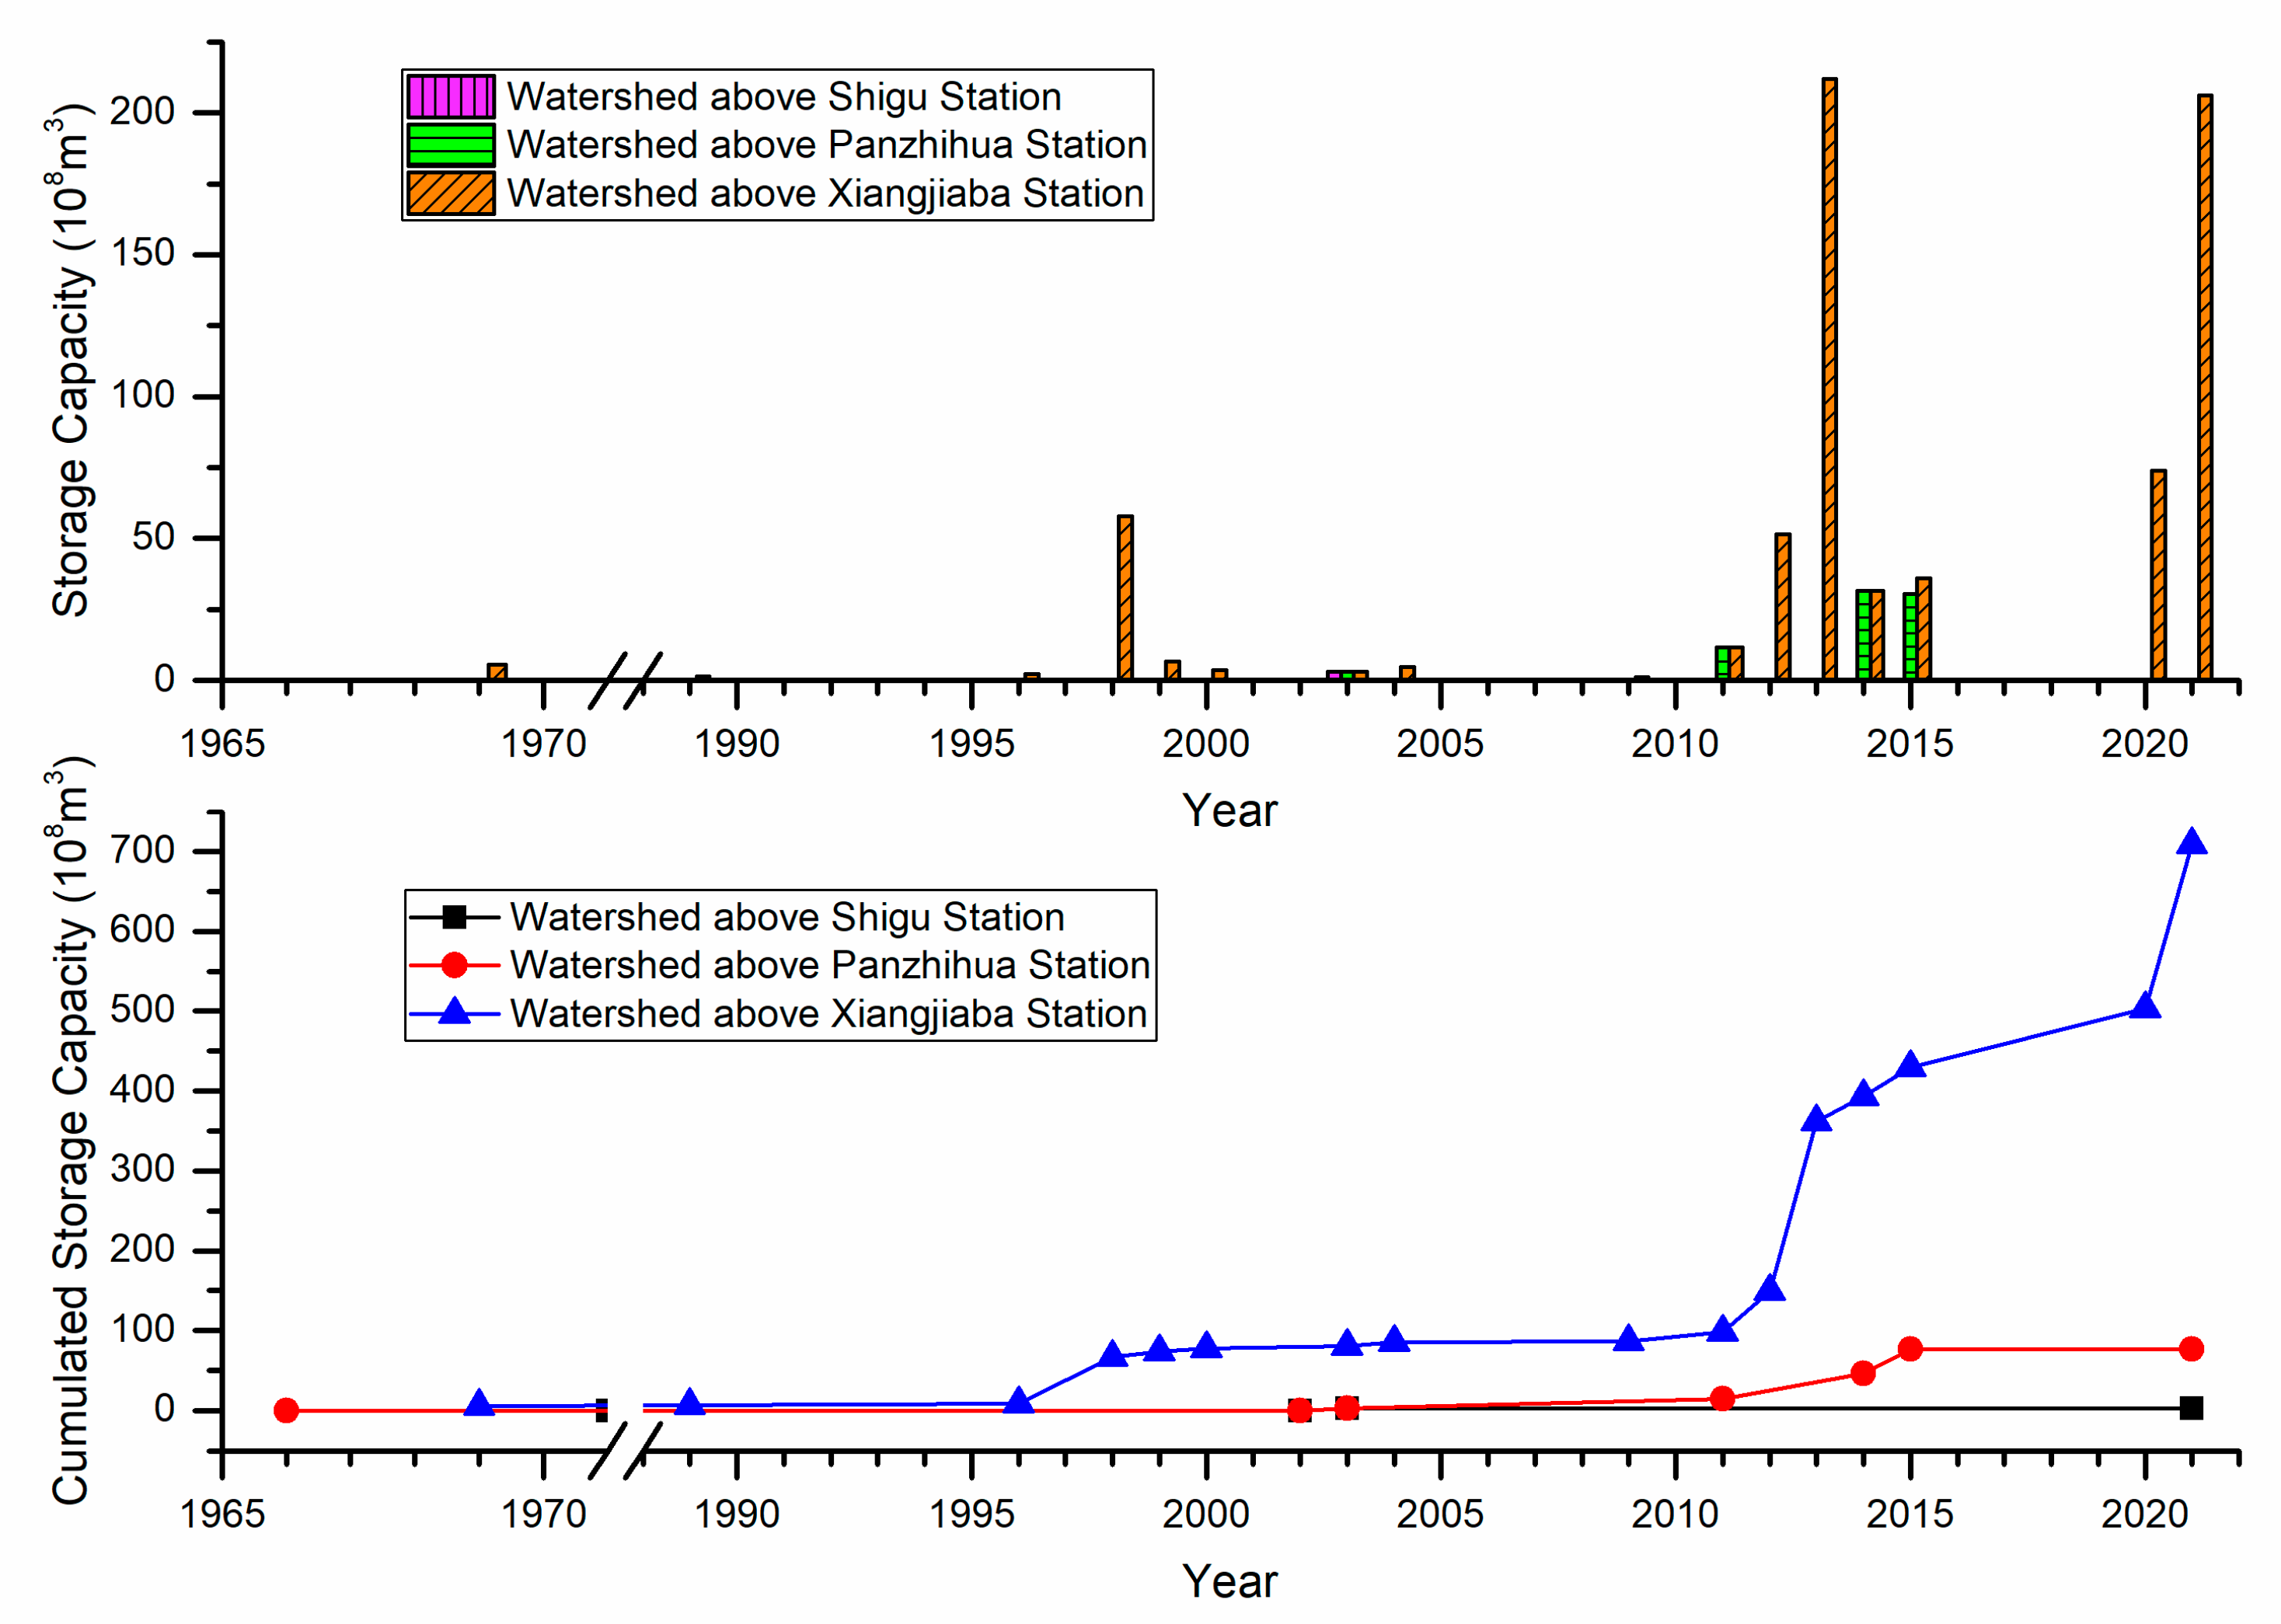
- The storage capacity of large reservoirs in the Jinsha River basin accounts for more than 91% of the storage capacity of all types of reservoirs. At the same time, the year when the storage capacity of large reservoirs increase sharply is just the same as the year when the sediment transport process and the relationship between water and sediment change abruptly. Therefore, it can be considered that the dam construction of large reservoirs and their large amount of sediment retention are the key reasons for the sudden change in the water-sediment relationship and the sharp decrease in annual suspended sediment load in the downstream sections below the reservoirs. The dam construction of large reservoirs also changed the natural attributes of the water-sediment relationship below the dam. The changes of climate and underlying surface in the study area are not significant, and their impact on the water and sediment processes, as well as the relationship between water and sediment in the river basin is limited.
Author Contributions
Funding
Acknowledgments
Conflicts of Interest
References
- Walling, D.E. The impact of global change on erosion and sediment transport by rivers: Current progress and future challenges; UNESCO: Paris, France, 2009. [Google Scholar]
- Milliman, J.D.; Farnsworth, K.L. River discharge to the coastal ocean: A global synthesis; Cambridge University Press: Cambridge, 2011. [Google Scholar]
- Walling, D.E; Fang, D. Recent trends in the suspended sediment loads of the world’s rivers. Global Planetary Changes 2003, 39, 111–126. [Google Scholar] [CrossRef]
- Wang, S.; Hassan, M.A.; Xie, X. Relationship between suspended sediment load, channel geometry and land area increment in the Yellow River delta. Catena 2006, 65(3), 302–314. [Google Scholar] [CrossRef]
- Walling, D.E. Human impact on land-ocean sediment transfer by the world's rivers. Geomorphology 2006, 79, 192–216. [Google Scholar] [CrossRef]
- Wang, S.; Yan, M.; Yan, Y. X.; Shi, C.; He, L. Contributions of climate change and human activities to the changes in runoff increment in different sections of the Yellow River. Quaternary International 2012, 282, 66–77. [Google Scholar] [CrossRef]
- Wang, S.; Wang, X. Changes of water and sediment processes in the Yellow River and their responses to ecological protection during the last six decades. Water 2023, 15, 2285. [Google Scholar] [CrossRef]
- Miao, C.; Ni, J.; Borthwick, A. G. L.; Yang, L. A preliminary estimate of human and natural contributions to the changes in water discharge and sediment load in the Yellow River. Global and Planetary Change 2011, 76, 196–205. [Google Scholar] [CrossRef]
- Walling, D.E. The role of dams in the global sediment budget. In A. L. Collins, V. Golosov, A.J. Horowitz, X. Lu, M. Stone, D.E. Walling, & X. Zhang (Eds.), Erosion and sediment yields in the changing environment (pp. 3–11). Wallingford: International Association of Hydrological Science. IAHS Publication, NO. 356. 2012.
- Wang, S.; Liu, W.; Yan, M.; He, L. Stepped changes in suspended sediment transport efficiency and discharge ratio and the main causes in the lower reach of the Yellow River. Research of Soil and Water Conservation 2020, 27, 104–111. (in Chinese). [Google Scholar]
- Wang, S.; Wang, Y.; Ran, L.; Su, T. Climatic and anthropogenic impacts on runoff changes in the Songhua River basin over the last 56 years (1955-2010), Northeastern China. Catena 2015, 127, 258–269. [Google Scholar] [CrossRef]
- Rossi, A.; Massei, N.; Laignel, B.; Sebag, D.; Copard, Y. The response of the Mississippi River to climate fluctuations and reservoir construction as indicated by wavelet analysis of streamflow and suspended–sediment load, 1950–1975. Journal of Hydrology 2009, 377, 237–244. [Google Scholar] [CrossRef]
- Hu, C.; Wang, Y.G; Zhang, Y.J. Variation tendency of runoff and sediment load in China major rivers and its causes. Advances in water science 2010, 21, 524–532. (in Chinese). [Google Scholar]
- Zhao, G.; Mu, X.; Strehmel, A.; Tian, P. Temporal variation of streamflow, sediment load and their relationship in the Yellow River Basin, China. PLOS One 2014, 9(3), e91048. [Google Scholar] [CrossRef] [PubMed]
- Wang, Y.; Hu, C.; Liu, X.; Shi, H. Study on variations of runoff and sediment load in the Upper Yangtze River and main influence factors. Journal of Sediment Research 2016, 1, 1–8. (in Chinese). [Google Scholar]
- Lu, C.; Dong, X.; Tang, J.; Liu, G. Impacts of large cascade reservoirs on runoff and sediment load variations in Jinsha River Basin. Science of Soil and Water Conservation 2019, 17, 36–43. (in Chinese). [Google Scholar]
- Chen, K.; Liu, C. The impact of human activities on the variation of water and sediment conditions in the upper reaches of the Yangtze River. China Rural Water and Hydropower 2021, 4, 126–131. (in Chinese). [Google Scholar]
- Liu, W.; Wang, S.; Sang, Y.; Ran, L.; Ma, Y. Effects of large upstream reservoir operations on cross–sectional changes in the channel of the lower Yellow River reach. Geomorphology 2021, 387, 107768. [Google Scholar] [CrossRef]
- Liu, H.C.; Zhang, H.L; Xia, S.Q; Pang, J. Runoff and sediment discharge variations and corresponding driving mechanism in Jinsha River Basin. Research of Soil and Water Conservation 2023, 30, 107–115. (in Chinese). [Google Scholar]
- Xu, J. Recent variations in water and sediment in relation with reservoir construction in the upper Changjiang River Basin. Journal of Mountain sciences 2009, 27, 385–393. (in Chinese). [Google Scholar]
- Li, H.B.; Zhang, X.F.; Hu, C.H.; Xu, Q. Impact of cascade reservoirs construction in the upper Yangtze River on sediment inflow to Three Gorges reservoirs. Journal of Hydroelectric Engineering 2011, 30(1), 94–100. [Google Scholar]
- Yang, X.; Lu, X.X. Estimate of cumulative sediment trapping by multiple reservoirs in large river basins: an example of the Yangtze River basin. Geomorphology 2014, 227, 49–59. [Google Scholar] [CrossRef]
- Duan, Y.C.; Li, D.X.; Wang, X.K. Analysis of the sediment trapping by reservoirs in the Upper Yangtze River. Journal of Sichuan University (Engineering Science Edition) (in Chinese). 2015, 47, 15–23. [Google Scholar]
- Yang, S.L.; Xu. K.H.; Milliman, J.D.; Yang, H.F.; Wu, C.S. Decline of Yangtze River water and sediment discharge: impact from natural and anthropogenic changes. Scientific Reports 2015, 5, 12581. [CrossRef]
- Zhu, L.L.; Dong, X.Y.; Chen, Z.F. Sediment deposition of cascade reservoirs in the Lower Jinsha River and its impact on Three Gorges Reservoir. Journal of Yangtze River Scientific Research Institute 2016, 34, 1–7. (in Chinese). [Google Scholar]
- Yuan, J.; Xu, Q.X. Sediment trapping effect by reservoirs in the Jinsha River basin. Advances in Water Science 2018, 29, 482–491. (in Chinese). [Google Scholar]
- Qin, L.L.; Dong, X.Y.; Du, Z.D.; Chen, X.J. Processes of water–sediment and deposition in cascade reservoirs in the lower reach of Jinsha River. Journal of Sediment Research 2019, 44, 24–30. (in Chinese). [Google Scholar]
- Zhang, M.; Huang, X.; Wang, Y. Analysis of runoff evolution process and influencing factors in Jinsha River Basin. Water Resources and Power 2022, 40, 27–31. (in Chinese). [Google Scholar]
- Feng, S.H.; Wang, D.W.; Qin, L.L.; Deng, A.J.; Xing, L. The characteristics and cause of runoff variation in Jingsha River basin. South–to–North Water Transfers and Water Science & Technology 2023, 21, 248–257. (in Chinese). [Google Scholar]
- Liu, S.W.; Zhang, X.F.; Xu, Q.X.; Yue, Y. Transport characteristics and contributing factors of suspended sediment in Jinsha River in recent 50 years. Journal of Sediment Research 2020, 45, 30–37. (in Chinese). [Google Scholar]
- Xi, Y.Y.; Huang, X.R.; Li, J.J. Analysis on variation features of precipitation in Jinsha River basin. Yangtze River 2017, 48, 50–55. (in Chinese). [Google Scholar]
- Mann, H.B. Nonparametric tests against trend. Econometrica 1945, 13, 245–259. [Google Scholar] [CrossRef]
- Kendall, M.G. Rank Correlation Methods; Charles Griffin and Company Ltd: London, UK, 1975. [Google Scholar]
- Wu, B.S.; Shen, G.Q. Discussion on physical meaning of sediment–coming coefficient. Yellow River 2008, 30, 15–16. (in Chinese). [Google Scholar]
- Wang, S.; Yan, Y.; Yan, M.; Zhao, X. Quantitative estimation of the impact of precipitation and human activities on runoff change of the Huangfuchuan River basin. Journal of Geographical Sciences 2012, 22(5), 906–918. [Google Scholar] [CrossRef]
- Lu, L.; Wang, Q.; Wang, G.; Liu, Y.; Liu, C. Trend of climate change over the recent 60 years and its hydrological responses for Jinsha River Basin. Journal of North China University of Water Resources and Electric Power (Natural Science Edition) 2016, 37, 16–21. (in Chinese). [Google Scholar]
- Shi, W.Y.; Zhang, Z.Y.; Li, Z.Y. Temporal and spatial distribution characteristics of precipitation in Jinsha River Basin in recent 55 years and changing trend. Yangtze River 2016, 47, 39–43. (in Chinese). [Google Scholar]
- Wang, G.; Han, L.; Tang, X.Y.; Jin, Z.C. Temporal and spatial variation of vegetation in the Jinsha River basin. Resources and Environment in the Yangtze Basin 2012, 21, 1191–1196. (in Chinese). [Google Scholar]
- Du, J.; Shi, C.X.; Zhang, C. D.Modeling and analysis of effects of precipitation and vegetation coverage on runoff and sediment yield in Jinsha River Basin. Water Science and Engineering 2013, 6(1), 44–58. [Google Scholar]
- Zhang, G.; Chen, G.; Shao, H.; Xian, W. Spatial-temporal characteristics of vegetation coverage and its response to climate from 2000 to 2015 in Jinsha River Basin, China. Resources and Environment in the Yangtze Basin 2021, 30, 1638–1648. (in Chinese). [Google Scholar]
- Magilligan, F.J.; Nislow, K.H. Changes in hydraulic regime by dams. Geomorphology 2006, 71, 61–78. [Google Scholar] [CrossRef]
- Wang, H.; Sun, F.; Liu, W. Characteristics of streamflow in the main stream of Changjiang River and the impact of the Three Gorges Dam. Catena 2020, 189, 104498. [Google Scholar] [CrossRef]
- Gao, Y.; Ren, S.; Wang, H.; Lv, C.; Zhao, H. Characteristics of incoming runoff and sediment load in the Three Gorges Reservoir during high flood period after the operation of the cascade reservoirs in the lower Jinsha River. J. Lake Sci. 2023, 35. (in Chinese) [Google Scholar] [CrossRef]
| Hydrological station | Dataset span | S for runoff | Z for runoff | S for SSL | Z for SSL |
|---|---|---|---|---|---|
| Shigu | 1971−2020 | 236 | 1.966** | 379 | 3.162** |
| Panzhihua | 1966−2020 | 234 | 1.647* | −217 | −1.527* |
| Xiangjiaba | 1954−2020 | 34 | 0.179 | −472 | −2.549** |
Disclaimer/Publisher’s Note: The statements, opinions and data contained in all publications are solely those of the individual author(s) and contributor(s) and not of MDPI and/or the editor(s). MDPI and/or the editor(s) disclaim responsibility for any injury to people or property resulting from any ideas, methods, instructions or products referred to in the content. |
© 2023 by the authors. Licensee MDPI, Basel, Switzerland. This article is an open access article distributed under the terms and conditions of the Creative Commons Attribution (CC BY) license (http://creativecommons.org/licenses/by/4.0/).


