Preprint
Article

Optimization of Carbon Capture & Hydrogen Production via Steam Reforming: A Simulation-Based Case Study

Altmetrics

Downloads

630

Views

225

Comments

0

A peer-reviewed article of this preprint also exists.

Submitted:

20 July 2023

Posted:

21 July 2023

You are already at the latest version

Alerts
Abstract
Hydrogen has been considered a future energy carrier for decades and the demand for hydrogen in refineries is always upward due to the revival of new technologies. The steam methane reforming method is frequently employed because of its high hydrogen generation efficiency at a cheap cost and minimal negative impact on the environment. But depending on the type of feedstock, one unit of hydrogen generate 9-10 units of CO2 that is needed to be treated for environmental sustainability. Therefore, the optimization of hydrogen production and CO2 capture is very important to address. The simulation research was conducted to anticipate and optimize steam reforming using Aspen HYSYS. A conversion-type reactor was used to develop this simulation-based model. The primary goal of this work is to investigate and optimize the production efficiency of hydrogen and the mitigation of CO2 that is generated from the steam reforming process by varying process parameters. CO2 capture efficiency was investigated at the different yields for hydrogen production and was found that a maximum of 98.8% of the CO2 can be absorbed using the proposed carbon capture system. Later, the Aspen Energy Analyzer tool revealed potential improvements for energy and cost optimization.
Keywords: 
Subject: Engineering  -   Chemical Engineering

1. Introduction

The primary source of electricity generation and greenhouse gas emissions around the globe is fossil fuel-fired power plants. Coal-fired power plants account for 38% of the global electricity generation and 38% of C O 2 production, leading to global warming [1,2]. The recent release of the Intergovernmental Panel on Climate Change (IPCC) in 2022 stated that global warming resulted in widespread shrinkage in cryosphere and ocean warming absorbing more than 90% of excess heat in the climate system. Also, global warming is likely to exceed 1.5°C between 2030 and 2052 if it continues to increase at the current rate which is against the IPCC 2022 goal [3]. The ever-surging demand for energy in recent years has highlighted the need for investigations around cost-effective and sustainable energy production to mitigate the climatic crises. This need is highly essential in industries such as petroleum refineries due to high energy consumption. In the refinery process, the most energy-consuming processes are crude distillation, followed by the hydrotreater, reforming, and vacuum distillation, emitting more than 1100 million tons of C O 2 per year [4,5]. Therefore, the inclusion of C O 2 capture and storage (CCS) in conventional-fossil fuel-based hydrogen production processes can result in tens of millions of dollars of profit (i.e., a constitute for building materials, formation of synthetic fuels) in the long run for refineries [6,7,8] and serve as a climate change diminution approach.
Due to the highly reactive nature of hydrogen atoms, it instantaneously reacts with other elements [9,10]. Therefore, despite it being abundant in nature and the cosmos, it can never be discovered in its purest form [11]. So, these chemicals must be decomposed or reformed to get pure hydrogen as gas or liquid. Hydrogen is considered a key raw ingredient for the petroleum and petrochemical industries and a byproduct of numerous petroleum refining and chemical manufacturing processes such as chlorine synthesis, photobiological water splitting, and others [12]. Therefore, significant ambitious strategies [13,14,15,16,17] have been undertaken not only by international energy agencies [18] but also by different states and industries to establish a hydrogen economy.
Hydrogen is acknowledged as one of the future's clean energy vectors [5]. It is an excellent alternative to produce lighter, cleaner fuels and reduce our reliance on fossil fuels. The LHV of hydrogen combustion is approximately 143 MJ/kg, which is three times that of petroleum [19]. Hydrogen can be used in fuel cells, devices that convert raw hydrogen into electrical energy for use in electric automobiles and power plants [20], and thus can serve as a replacement for combustion engines. Currently, in the USA alone, hydrogen production is approximately 14 million tons per year (MT/y), which is enough to power about 3 million cars or about 8 million homes [21].
Among the technologies for hydrogen production, the two prominent technologies are steam reforming [22] and electrolysis [23,24]. Steam reforming with and without conventional CO2 capture technologies are termed blue hydrogen and grey hydrogen, respectively. On the other hand, hydrogen produced through water electrolysis using renewable electricity is called green hydrogen [25,26]. Using an electric current, electrolysis separates water into its constituent parts [24]. The production of green hydrogen through electrolysis is still an expensive process and even more using other renewable energy sources such as wind and solar energy to drive the electrolysis process [27]. Moreover, according to DOE reports, the capture of CO2 is an expensive and technologically challenging process costing more than 400 million dollar for each unit [28,29]. There are several methods for the production of hydrogen such as partial oxidation used to produce hydrogen and carbon monoxide by combining oxygen with hydrocarbons (such as natural gas, naphtha, petroleum coke, or coal) [30,31,32,33]. Ammonia decomposition is another method for the separation of ammonia into its essential components, hydrogen, and nitrogen [34]. Additionally, the emerging technologies which include various biogas production options using gasification [35] or pyrolysis processes [36], or biomass fermentation with microorganisms [37,38], and newly developed photo-electrochemical water splitting [39] and thermochemical processes, including microbial electrolysis [40] for splitting of water into H 2 and O 2 with lower energy compared to conventional electrolysis [41].
From all these methods, steam methane reforming is a well-matured technology with an efficiency of over 75-85% [42,43,44], the highest of any commercial hydrogen generation process, and runs at or near its maximum capability [45]. Moreover, it is the most often employed technique where natural gas (methane) or other light hydrocarbons like ethane or propane reacts with steam in the presence of a catalyst. This process of hydrogen production is comparatively cheaper than the other methods and will continue to dominate for the upcoming decades. The well-developed natural gas distribution system in the United States is a major determinant of the overall cost of hydrogen production which makes this particular process most economically feasible over the other production process. However, this process owing to a few constraints and challenges of high carbon products released, which is almost 7   k g   C O 2 / k g   H 2 [19] which is against the goal of the recent COP27. Nowadays, the government, research communities, and industries are more concerned with environmentally benign technologies and C O 2 mitigation, being the primary source of greenhouse gas, which must be captured before release. Moreover, C O 2 is acidic, and as a result, it cannot be sequestrated underwater or in the ocean as it may reduce the pH of the water which would adversely affect the ecohydrology [46]. Furthermore, to avoid environmental pollution and bringing a sustainable green economy, every industry and production factory must minimize the CO2 emission to the atmosphere [47]. Therefore, adequate CO2 capture and storage technologies are essential to protect the atmospheric environment from the potential CO2 pollution. Carbon capture and storage can be classified as follows- i) carbon-positive, ii) carbon-neutral, and iii) carbon-negative processes [48,49,50]. Carbon-positive processes continue to release CO2 into the atmosphere, whereas near-carbon-neutral processes do not release any CO2 and carbon-negative processes reduce the amount of CO2 that is already present in the atmosphere [51].
Since the SMR will continue to dominate the production of hydrogen for at least the next decade, it is essential to maximize its production and minimize CO2 emissions from this technology. There have been numerous studies [19,27,35,52,53,54,55,56] have been done on the production of hydrogen using steam reforming and capturing the emitted C O 2 from SMR. While there are different methods for C O 2 capture, ‘Post-Combustion Capture (PCC)’ which is one of the three major methods has shown superiority over other methods as it does not require serious alteration in the existing plant design and configuration before it can be implemented [57] and can be easily retrofitted into new ones [58]. In addition, PCC has some major advantages including capturing more than 90% of the C O 2 and ensuring the highest purity in the captured C O 2 . Aqueous amine-based technology is a chemical absorption process recognized as the most mature for PCC of C O 2 [59,60]. Studies have shown that amine based C O 2 absorption method can capture up to 100% of the C O 2 present in the flue gas while maintaining the purity more than 99% [61,62]. Besides this, amine based solvents are quite inexpensive as well as widely available and thermally stable compared to other methods of carbon dioxide capture [62]. Aqueous mono-ethanolamine (MEA) and Methyl Diethanolamine (MDEA) are considered fundamental solvents for PCC technology because of their high separation selectivity for C O 2 and their rapid rate of reaction [59,60,63]. The major barriers faced the implementation of CCS is the high cost for carbon capture and the post carbon capture procedure [7,8,61,64]. A properly integrated heat exchanger network system will reduce this cost [61,64]. High purity of carbon dioxide will lead to the reduction of the production cost of the processes where C O 2 is necessary [7,8,61]. In this study, Pinch Analysis (PA) has been done in a couple of the most energy demanding streams to optimize the heat integration. This also serves to debottleneck operations, optimize utility use, and improve the energy efficiency of overall systems [65]. The multi-stage compression is performed in several phases to maintain thermal equilibrium [56]. C O 2 capture technologies which are long been discussed which are applicable for steam reforming hydrogen plants. But fewer references are available on removing C O 2 from flue gas though interest of technology is growing. While several carbon capture and hydrogen production methods and strategies have been developed, this comprehensive review carefully investigates the gap in this field and describes a simulation-based method that could be a game-changer in this field of research. The goal of this work is two-fold- i) to present a unique approach and set a baseline for simultaneously increasing the production of hydrogen and, ii) improving the removal of C O 2 from the SMR system.

2. Model Development and Process Simulation

2.1. System Description

The process flow diagram for the steam methane reforming considered in this study is depicted in Figure 1. This work thoroughly investigates hydrogen production via steam reforming and the C O 2 capture that evolves during the process. The reforming reaction of methane and steam is a highly endothermic reaction. Therefore, this reaction is usually carried out at higher temperatures of 800-1000℃ and at a pressure of about 14-20 atm which are the set operating conditions. The reaction between methane and steam produces H 2 and CO in the reactor-1 with a molar ratio C H 4 : H 2 O of 1:3 based on the following reaction formula:
C H 4 + H 2 O 3 H 2 + C O    Δ H = 206   k J / m o l
For fast reforming reactions, a catalyst bed reactor is usually used [66]. The catalytic reactor concept has been explored for steam reforming of tars in the producer gas and to promote the water-gas shift reaction to maximize hydrogen production [66]. Also, research has been carried out to introduce a combined catalyst/sorbent system to replace three catalytic reactors. Following this reforming process, the Water Gas Shift (WGS) takes place in reactor-2 to reduce the carbon monoxide content at the outlet of reactor-1 where the SMR reaction took place. Thus, the flue gas is then fed into the reactor -2 for WGS reaction to remove the CO produced in reaction (2) and increase the hydrogen production. WSG reaction is moderately exothermic, therefore occurs at lower temperatures (300-400℃) than the reaction (1) to facilitates it [35]. The reaction follows as,
C O + H 2 O H 2 + C O 2 Δ H = 41 k J / m o l  
Afterward, the produced hydrogen is separated from the flue gas using a separator, and the rest of the flue gas is sent to a cooler to reduce the temperature followed by a water separator. About 99.72% of the water and 1.13% C O 2 is separated as the bottom cut of the water separator. The remaining products leave the separator as the top stream. This top stream then goes into the C O 2 absorber column where an amine solvent solution is added from the top of the column. This amine solution absorbs the C O 2 present in the flue gas and leaves the column from the bottom as the C O 2 Rich solution and the clean flue gas leaves the column as the top product of the carbon capture column.

2.2. Model Assumptions

Some of the key assumptions used in this process modeling are:
  • All components possess adiabatic boundaries.
  • Kinetic exergy and potential exergy overlooked for all the system components.
  • Usage of catalyst is considered.
  • Formation of coke is overlooked due to negligible concentration.
  • The outlet stream temperature of the reactors is considered as reactor’s temperature.
  • Tray efficiency in absorption column is assumed to be 100%.

2.3. Model Description

Typically, a steam reforming process involves two successive shift reactors for hydrogen generation followed by hydrogen and carbon dioxide separators [66]. The production of hydrogen via steam methane reforming process, and simultaneous capture of carbon dioxide using an amine solution were investigated. The simulation-based steady-state model as shown in the Figure 1 was developed using Aspen HYSYS V12.1. Peng Robinson equations of state and Acid Gas- Chemical solvent fluid packages were used to estimate the thermodynamic properties of the components and the mixtures in the streams.
Water is heated for steam generation and a multi-stage compressor mechanism is employed (Figure 1) to increase the pressure of the natural gas. The mole fraction of natural gas was considered 1 for methane. So, the gas is compressed in the first compressor and an inter-cooler is employed for cooling down the high-temperature gas. This process is repeated at least twice to ensure the data reproducibility capacity of the system. Then, methane and steam were mixed and heated in HE-2 before entering the conversion-type steam reforming reactor (reactor- 1). Conversion type reactors are the simplest type of reactor in HYSYS. Because of its simplicity it is extremely useful for designing complex reactors [67,68].
Here, a counter-current shell and tube configuration is assumed for all the heat exchangers. Natural gas and steam are heated-up to produce syngas ( C O + H 2 ) according to the endothermic steam methane reforming reaction-1. The water gas shift (WGS) reaction for high CO conversion is favored at lower temperatures. Therefore, the overhead product of the reactor-1 was cooled using HE-2 and HE-3 and fed into the WGS reactor (reactor-2). After that, the overhead product goes into the shell side of HE-4 for cooling before going into the hydrogen splitter. Hence, a cooling stream loop was introduced around the WGS reactor.
The remaining flue gases from the Hydrogen splitter (S-1) which is not good for the environment is fed into the carbon capture and storage system (CCS). Before that the stream is cooled down and then most of the water is separated from the stream using a separator (S2) to achieve a better carbon dioxide capture. Natural and refinery gases contain acid gases like hydrogen sulfide ( H 2 S ) and carbon dioxide ( C O 2 ). A refinery usually consumes 1.5% to 8% of feed as fuel depending on the complexity of operation. A refinery having capacity of 300,000 bbl per day usually accountable for C O 2 emission of 0.8 to 4.2 million tons per year [69]. Natural gas can contain up to 28 percent hydrogen sulfide gas ( H 2 S ), which may be considered as air pollutant near petroleum refineries and in oil and gas extraction areas [70]. The major acid gases are hydrogen sulfide ( H 2 S ) and carbon dioxide ( C O 2 ). Because of the corrosivity of acid gases in the presence of water, the toxicity of H 2 S , and the lack of heating value of ( C O 2 ), the gases must be purified prior to use with the aid of aqueous solutions of alkanolamines. They react reversibly with acid gases and therefore are generally used to remove them [20]. Chemical reaction processes remove the H 2 S and/or C O 2 from the gas stream by chemical reaction with a material in the solvent solution [70]. Clause process [71] is one of the most popular methods for removal of large quantities of H 2 S where one third of the H 2 S to be removed, is burnt to form sulphur dioxide. The reaction is an exothermic one. Then the produced S O 2 reacts with the unreacted H 2 S to form high quality sulphur (purity>99.9%) [71].
2 H 2 S + O 2 S O 2 + 2 H 2 O    Δ H = 519   k J / m o l
2 H 2 S + S O 2 3 8 S 8 + 2 H 2 O    Δ H = 146   k J / m o l
In this simulation, MEA and MDEA are used as aqueous solvent according to the industrial case. Likewise, amines and polyamines have been employed as low-cost and effective C O 2 capture support materials [72]. They offer several benefits over other C O 2 capture systems, including a reduced regeneration energy penalty when compared to aqueous amine solutions and a higher moisture tolerance when compared to some of their physi-sorbent equivalents, such as MOFs [67,68]. The gas-sweetening facility has twenty identical amine trains and a suitable pressure gradient across the column for an efficient C O 2 removal.

2.4. Fluid Packages

2.4.1. Peng-Robinson

The Peng-Robinson equation of state (Peng and Robinson, 1976) is satisfactory for predicting the gas phase properties of C O 2 and can be used to determine the enthalpy and entropy of a fluid or fluid mixture as a function of temperature and pressure [69].
This law is not working if the gas pressure is below the triple point due to the discontinuity of physical and chemical characteristics of gases. For instance, there is no latent heat of fusion found for gases beyond the triple point. However, the enthalpy estimation of a specific gas relative to a selected state is possible by using the Peng-Robinson equation of state unless the fluid is not obeying the ideal gas law [70]. Additional terms including reduced temperature, compressibility factor and acentric factors are included in the enthalpy and entropy function while fluid does not obey ideal law [73].

2.4.2. Acid Gas – Chemical solvent

The Acid Gas – Chemical Solvent package in Acid Gas technology supports is used to prepare the solvents including Methyl Diethanolamine (MDEA), Diethanolamine (DEA), Mono Ethanolamine (MEA), Diglycolamine (DGA), Diisopropanolamine (DIPA), Piperazine (PZ), and Triethanolamine (TEA). Additional supports are provided for multiple (>2 types) solvent blends including Sulfolane + DIPA, Sulfolane + MDEA, Sulfolane + MDEA + PZ, MDEA + MEA + DEA and any two chemicals solvent blend. The Acid Gas - Chemical Solvents package is developed with the Peng-Robinson equation of state for vapor phase and electrolyte nonrandom two-liquid (eNRTL) for electrolyte thermodynamics [73,74].

2.5. Pinch Analysis

Pinch analysis is a method used to reduce the energy consumption of the process by optimizing the energy recovery methods [75,76]. It examines potential heat exchanges between cold (requiring heat) and hot (emitting heat) streams to reduce irreversibility. The process data is represented as an array of energy flows or streams as a function of heat load (or enthalpy) vs. temperature. These data are integrated for all of the plant's streams to generate composite curves, one for all "hot streams" (streams that release heat) and one for all "cool streams" (requiring heat). The point of closest approach between the hot and cold composite curves is the pinch temperature (pinch point or plain pinch), and it is the point where design is most limited [75,76]. Consequently, the energy objectives may be met by utilizing heat exchangers to recover heat between hot and cold streams by identifying this location and beginning the design process there. In fact, cross-pinch heat transfers between streams with temperatures above and below the pinch are frequently seen during the pinch study. By eliminating these exchanges through alternate pairing, the process reaches its energy goal [77].

3. Results and Discussion

3.1. Production Variation with Change of Process Parameters

This section discusses the outcome of the modeling and the H 2 production. The process optimization for efficient system functioning is described in depth. In addition, the model was used to assess the impact of modifying the most critical parameters. Some critical parameters considered include Steam to Carbon ratio (S/C), molar flow, temperature, and mole fraction.
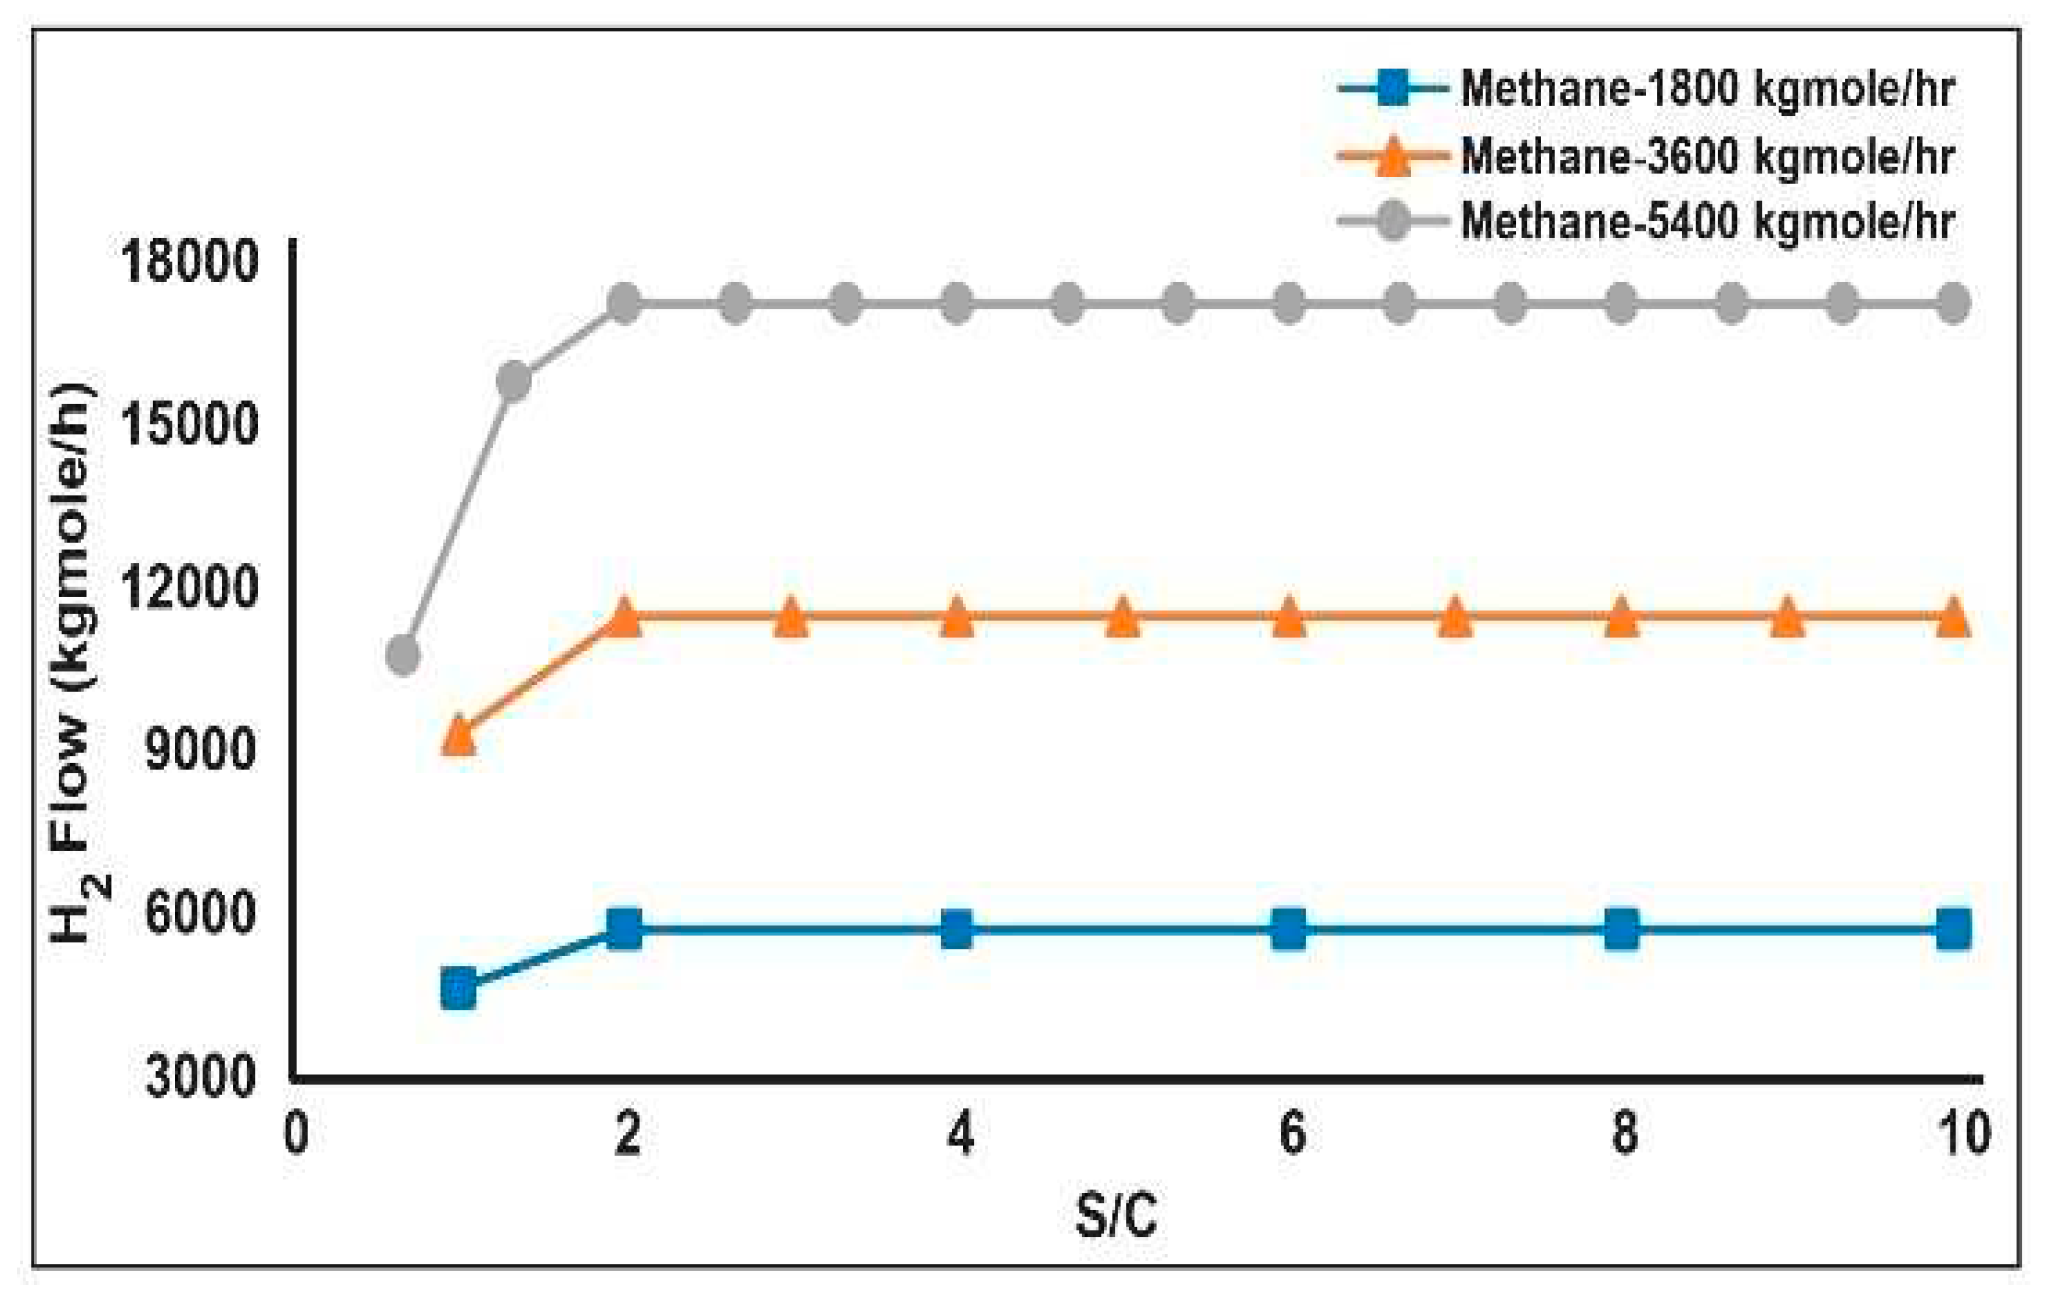
The higher the steam to carbon ratio, the lower the residual methane will be for a given reformer outlet temperature. Hence, less fuel energy is required in the furnace. Figure 2 shows the change in the molar flow of the hydrogen produced at the splitter with the change of the S/C (at different methane flowrates).
The S/C ratio was considered from 1 to 10, and change in hydrogen production was observed. With increasing S/C ratio the production also increased. However, after reaching an equilibrium point at S/C ratio of 2 the production of hydrogen remained the same even with the increasing ratio. Thus, when the S/C ratio reached 10 there was no significant effect on the hydrogen production. The reactors used in the simulation are conversion-type reactors as mentioned earlier. In conversion-type reaction, the percent of conversion remains constant throughout the process. Therefore, the production did not vary after reaching an equilibrium point. The increasing S/C ratio will have a negative effect on the CCS in the later part of the production as the increasing S/C will lead to the increase in the production of flue gas and water formation. However, an optimum S/C ratio of 3 [78] was maintained for the cost-minimization of the production process.
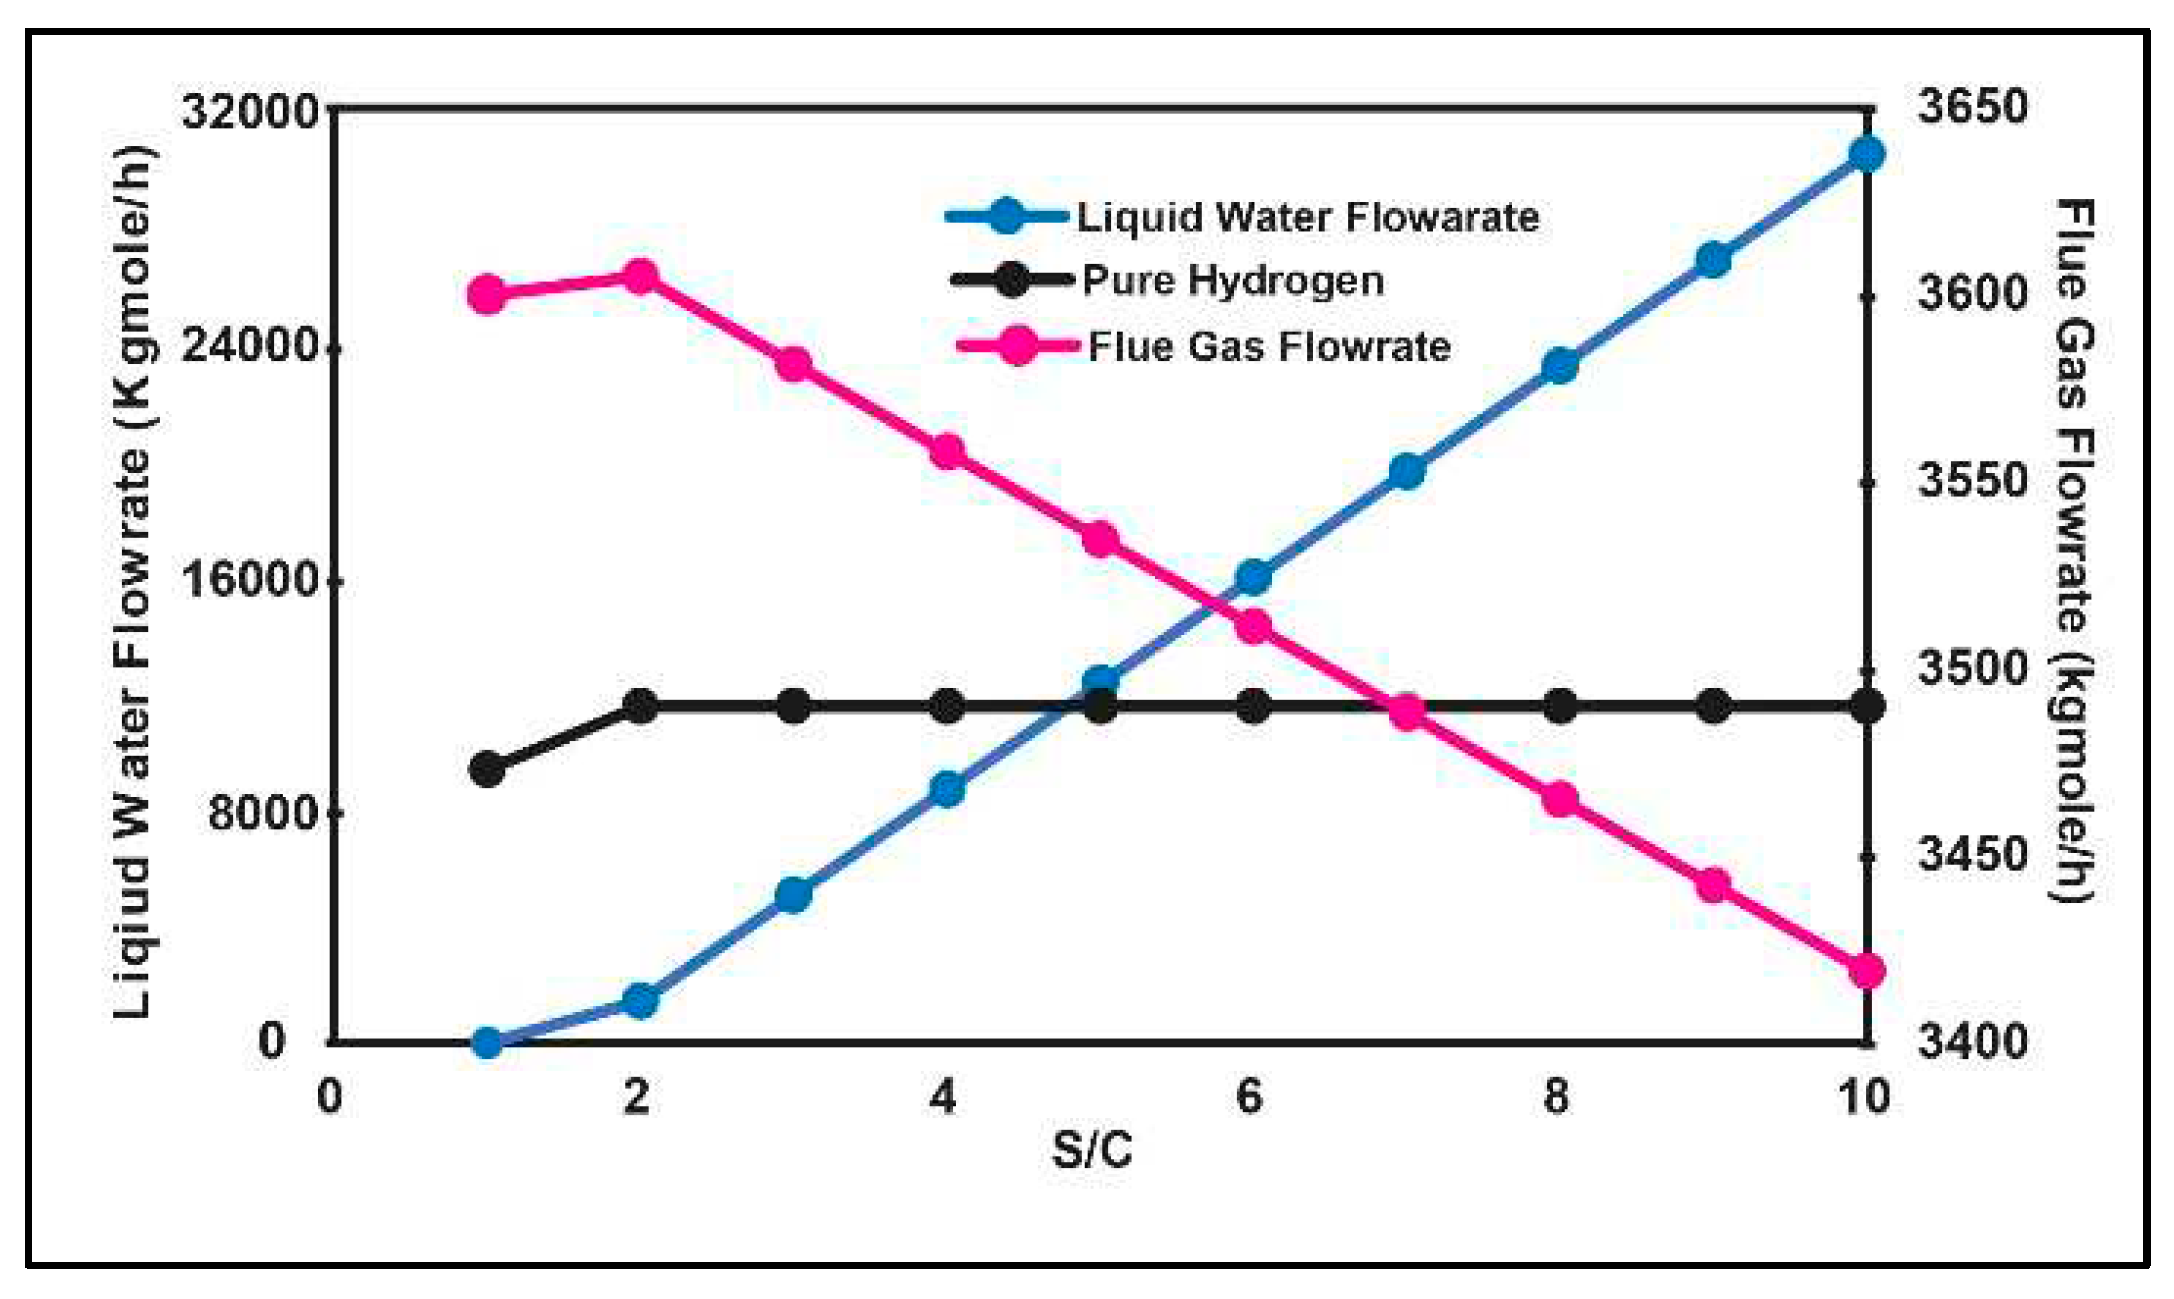
Figure 3 shows the variation in flow rates of liquid water and the flue gas at the outlet-stream of water separator (S-2). As observed from the graph, the flow rate of liquid water increases drastically with increasing S/C. With the variation of the S/C ratio from 1 to 10, the flow rate varies between 0 to 30420 kgmole/h. However, with the increase of S/C, the formation of flue gas did not vary that much. It reached a peak of 3605 kgmole/h at S/C of 2 and then decreased to 3419 kgmole/h. Thus, the effect of increasing S/C resulted in no significant change in the flue gas flow rate but a drastic increase in the liquid water flow rate is observed. On the other hand, the pure hydrogen production was 9360 kgmole/h at S/C of 1 as displayed in Figure 4. The maximum conversion rate which was 11520 kgmole/h reported when S/C ratio was 2 and remains constant after reaching this equilibrium point. This result indicates that the production of hydrogen did not vary with increasing S/C ratio. Thus, it only increases the cost of the process. Increasing S/C also has an adverse effect on the separator as the separator needs to remove more water before the flue gas is transferred to the carbon dioxide separator.
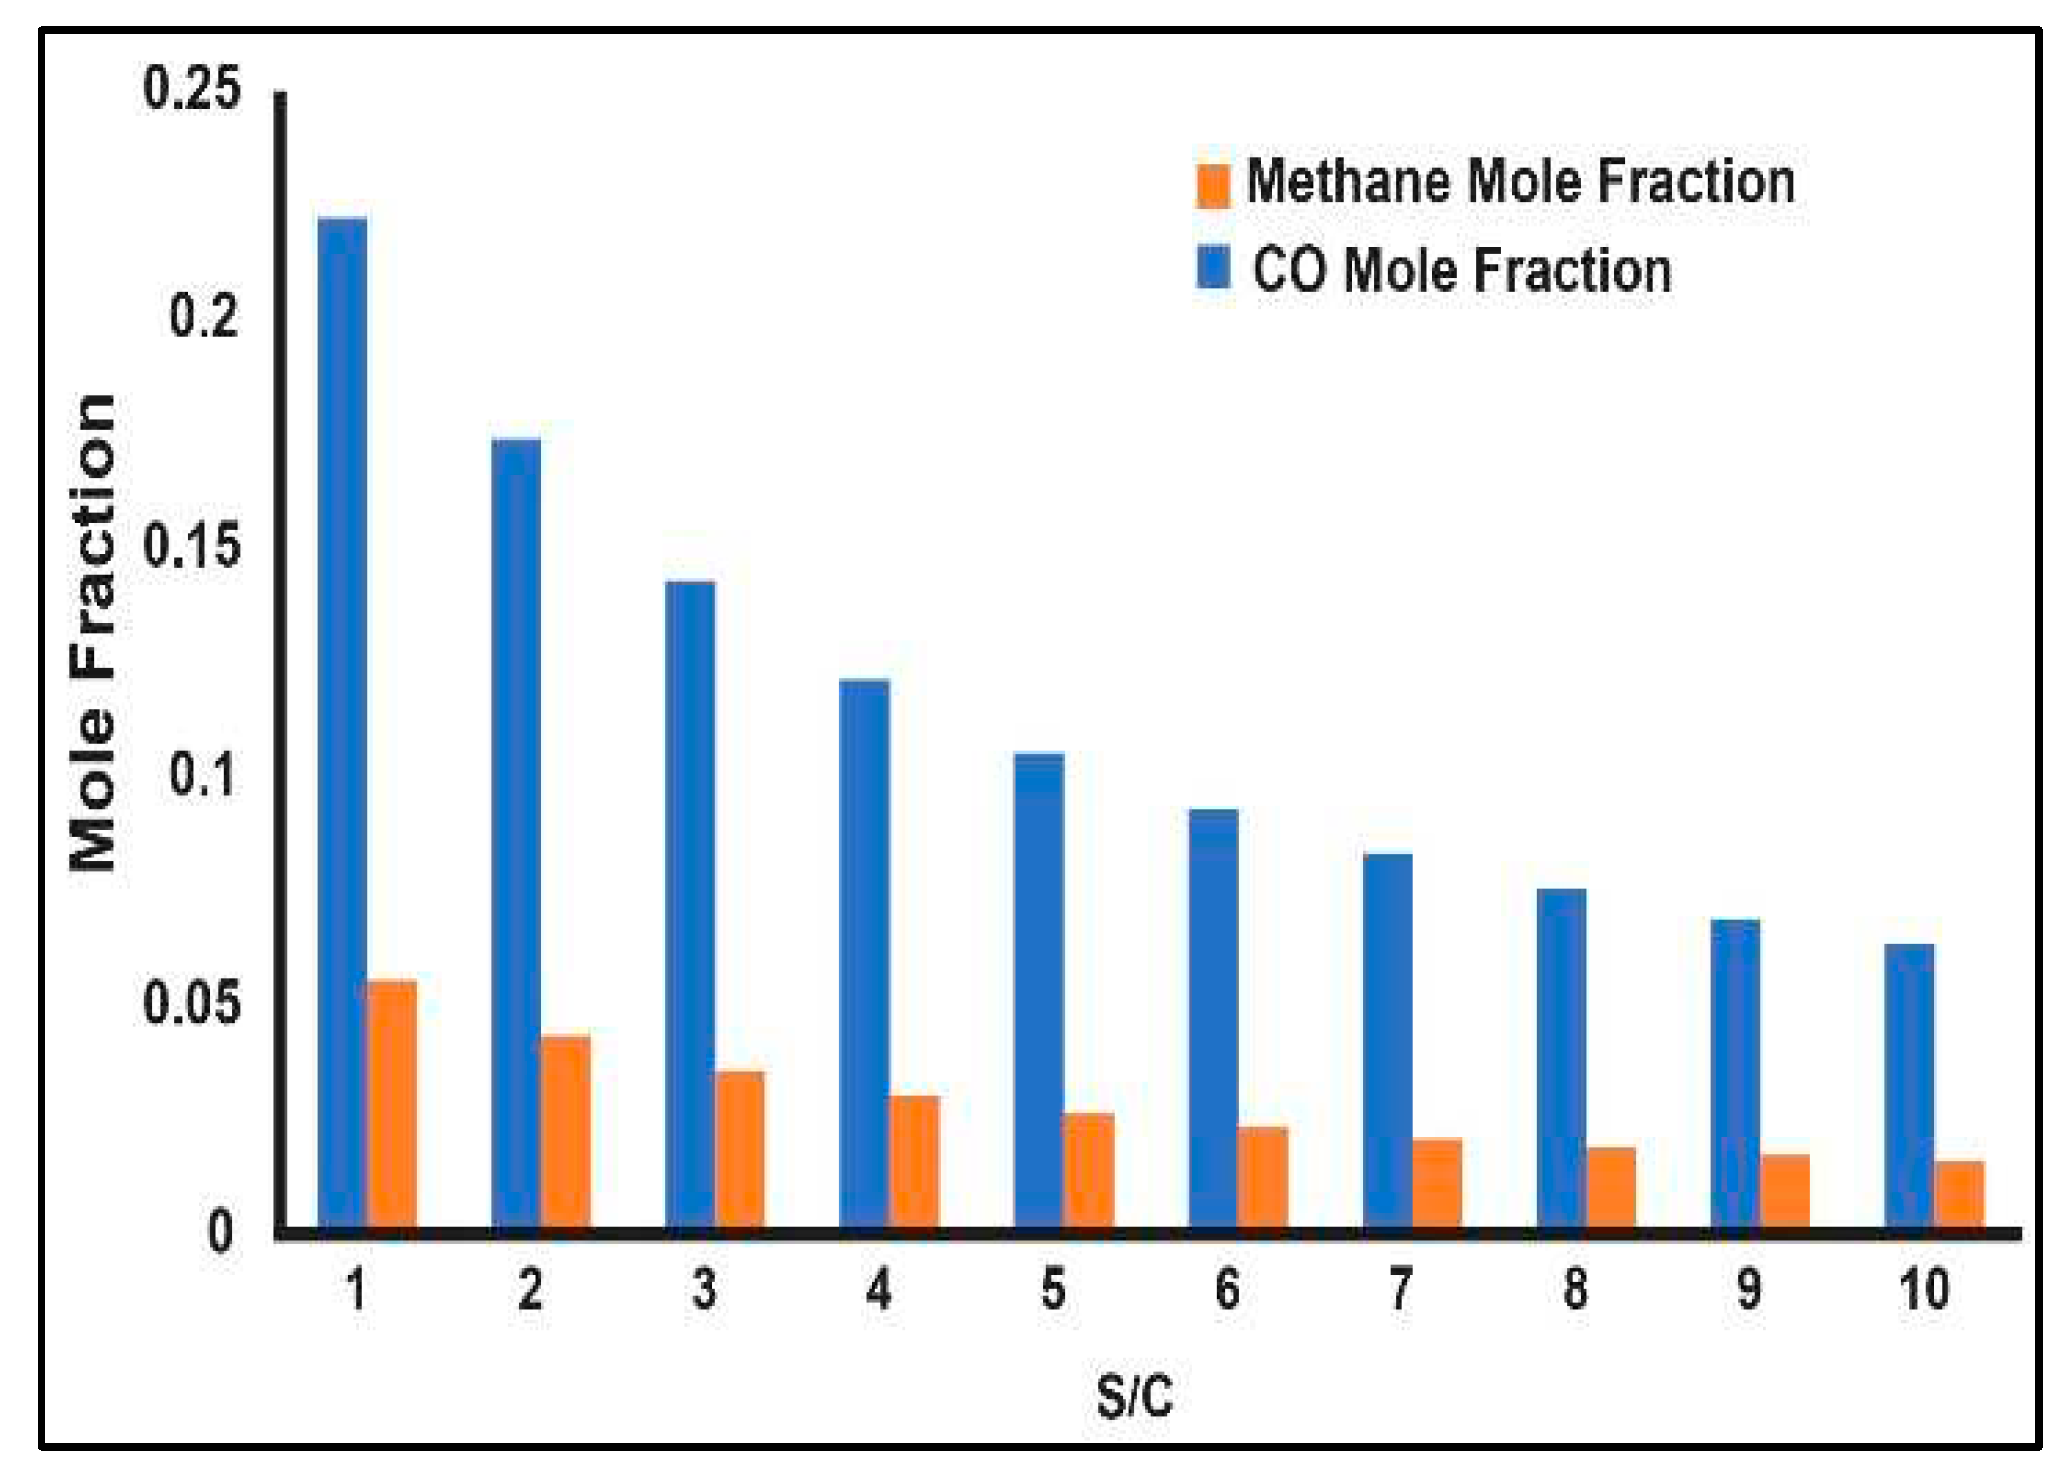
Figure 4 shows the change in mole fraction for methane and carbon monoxide in reactor 1 with the change of the S/C. The S/C ratio was considered from 1 to 10, and the mole fraction of CO and methane gas varied from 0.22 to 0.06 and 0.05 to 0.01, respectively. The lowest point was attained when the S/C was 10.
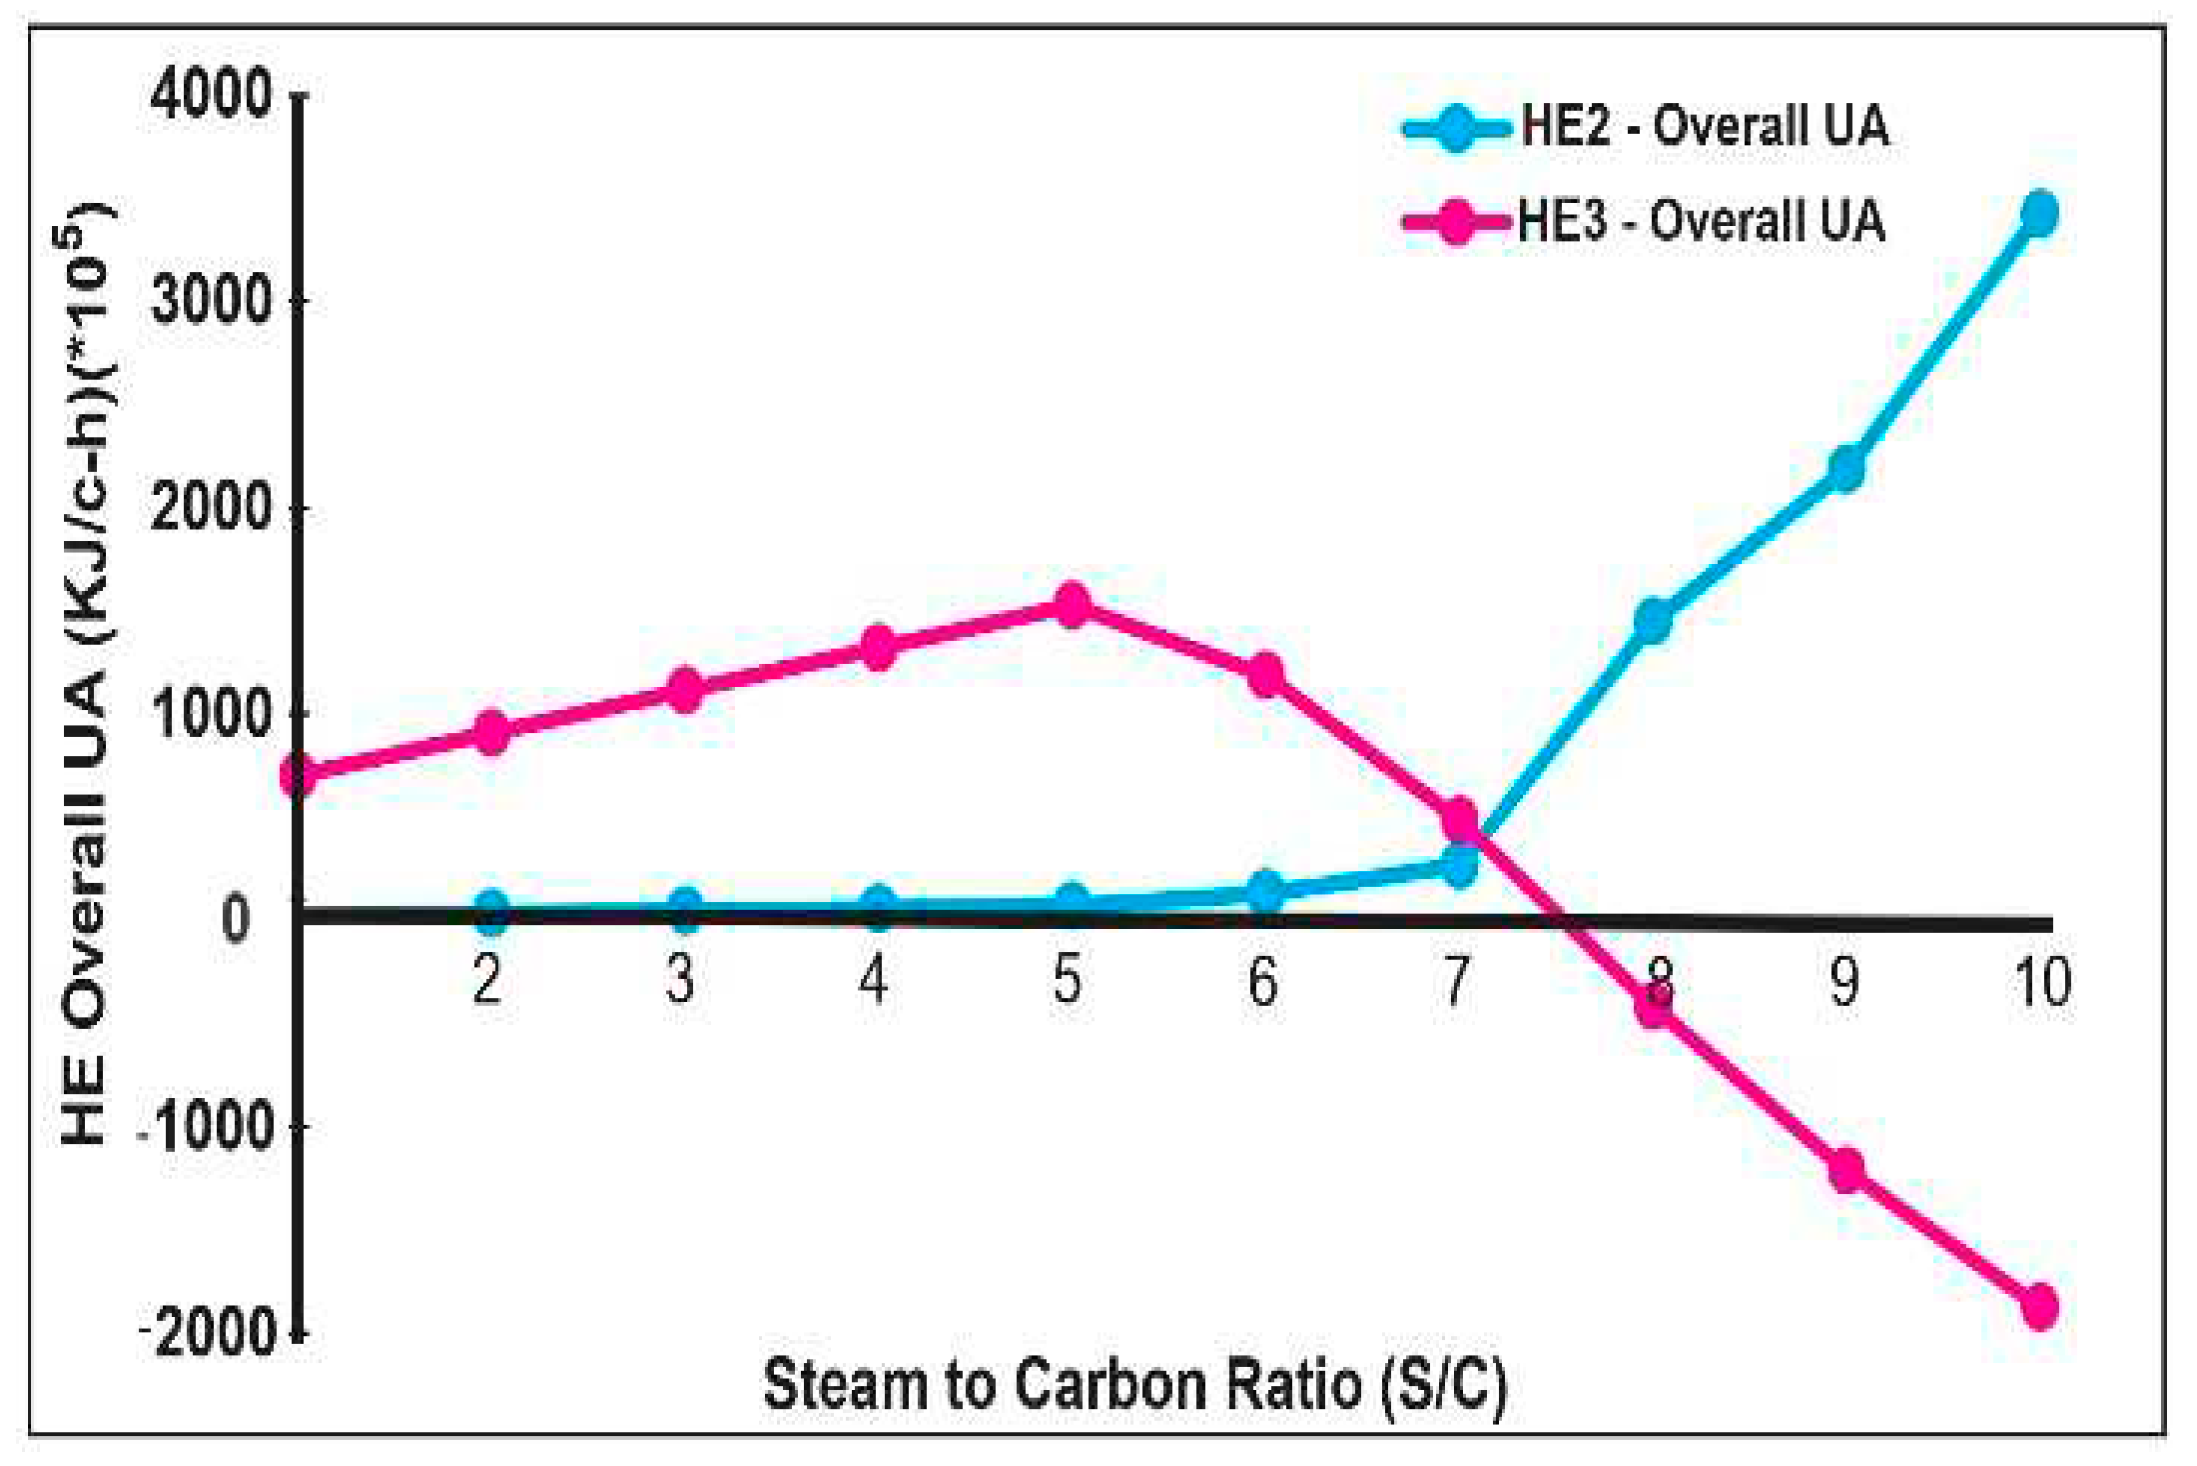
Figure 5 demonstrates the change in the overall UA of the heat exchangers 2 and 3 to S/C ratio, the values considered for the S/C ratio were from 1 to 10. For heat exchanger (HE)-2, the resultant UA varied from 0.1 to 2.7 kJ/C-h, respectively. The graph shows that in the initial stages, the overall UA would barely have an effect; however, with the increase in the S/C ratio from 6, the heat exchanger UA starts increasing. However, the UA was significantly affected when the S/C ratio exceeded 7, demonstrating that when S/C > 5, discernible results were observed. At S/C ratio 8, an abrupt peak was observed where change in the UA was recorded from 6.00E+06 to 1.50E+07 kJ/C-h. Nevertheless, the peak values of the UA were retained at 2.7e+07 kJ/C-h when S/C set at10. In contrast, the recorded UA values for HE-3 was ranged from 8.00E+05 to -8.00E+05kJ/C-h, The UA of the heat exchanger increases with the increase in S/C up to S/C = 5.5. However, when the S/C ratio is approaching 6, a dramatic downward slope of UA was recorded with a minimum value of -2000x105 kJ/C-h. Here, higher overall heat transfer coefficient signifies better heat transfer between the fluids and works better where higher heat transfer is required. On the other hand, lower heat transfer represents the medium is better for insulation purpose [79]. The negative value of UA indicates the reverse direction of heat transfer inside the heat exchanger.
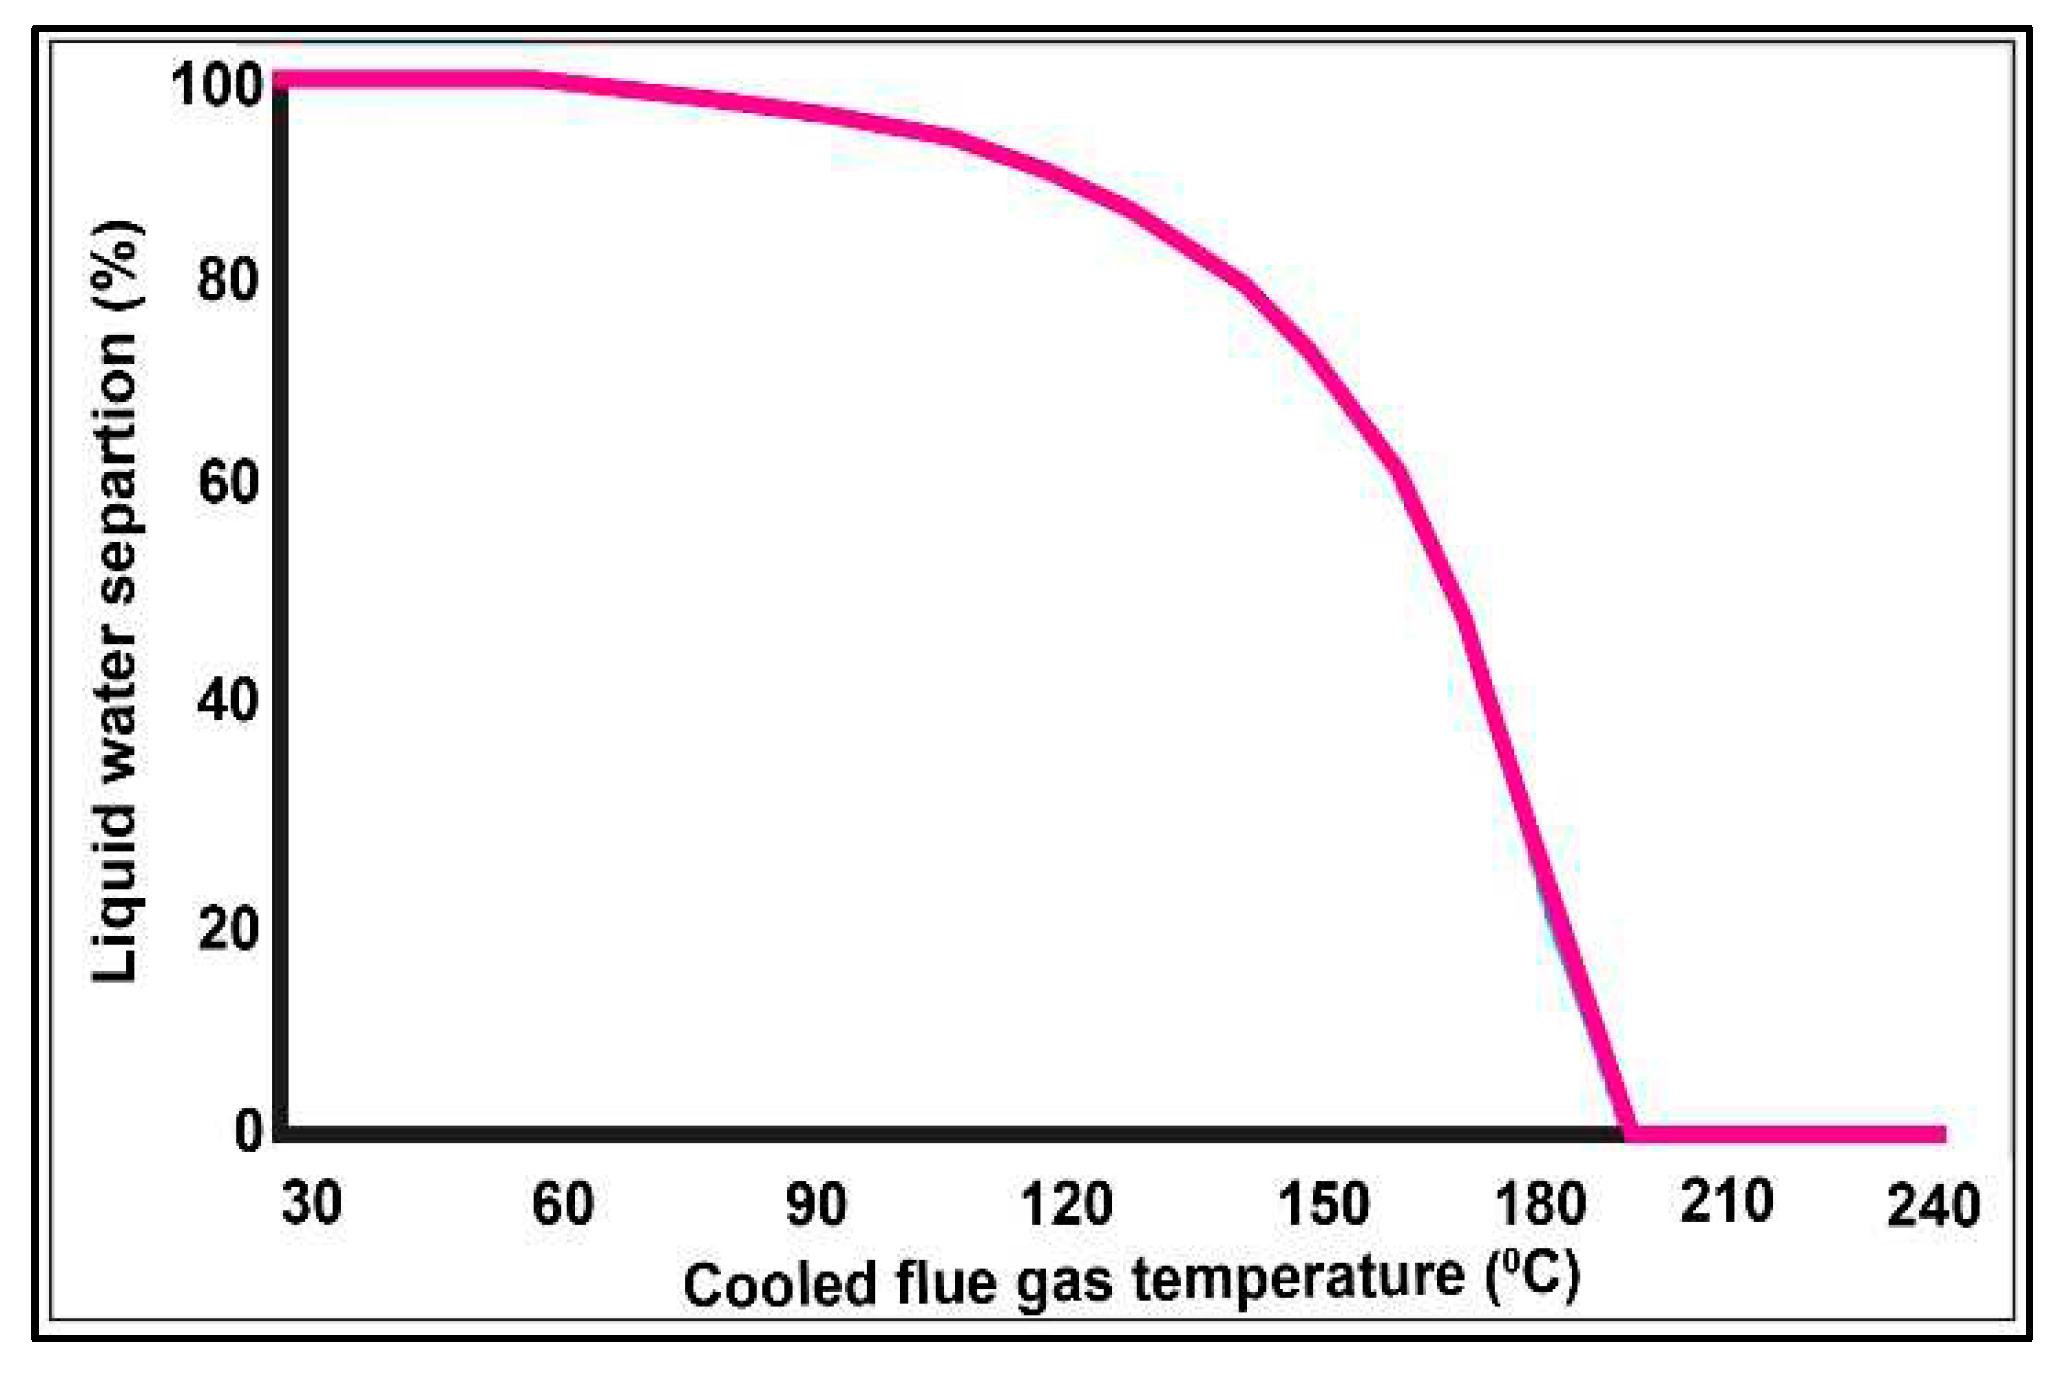
Figure 6 demonstrate the percentage of separated liquid water in the separator S-2 with varying cooled flue temperature. The value considered for the temperature was in the range of 30 to 240℃. The highest separation was almost 99.8% which is recorded at 30℃. Afterward, the amount of water that had been isolated began to decrease gradually. Eventually, at 190℃, the percent of liquid water separated in S-2 became 0 (zero) and remains the same for the rest of the study. Unless the water is removed earlier before entering the absorber, this water would create barrier in the column while separating the C O 2 from the flue gas. Thus, this separation of water makes the CCS more efficient.
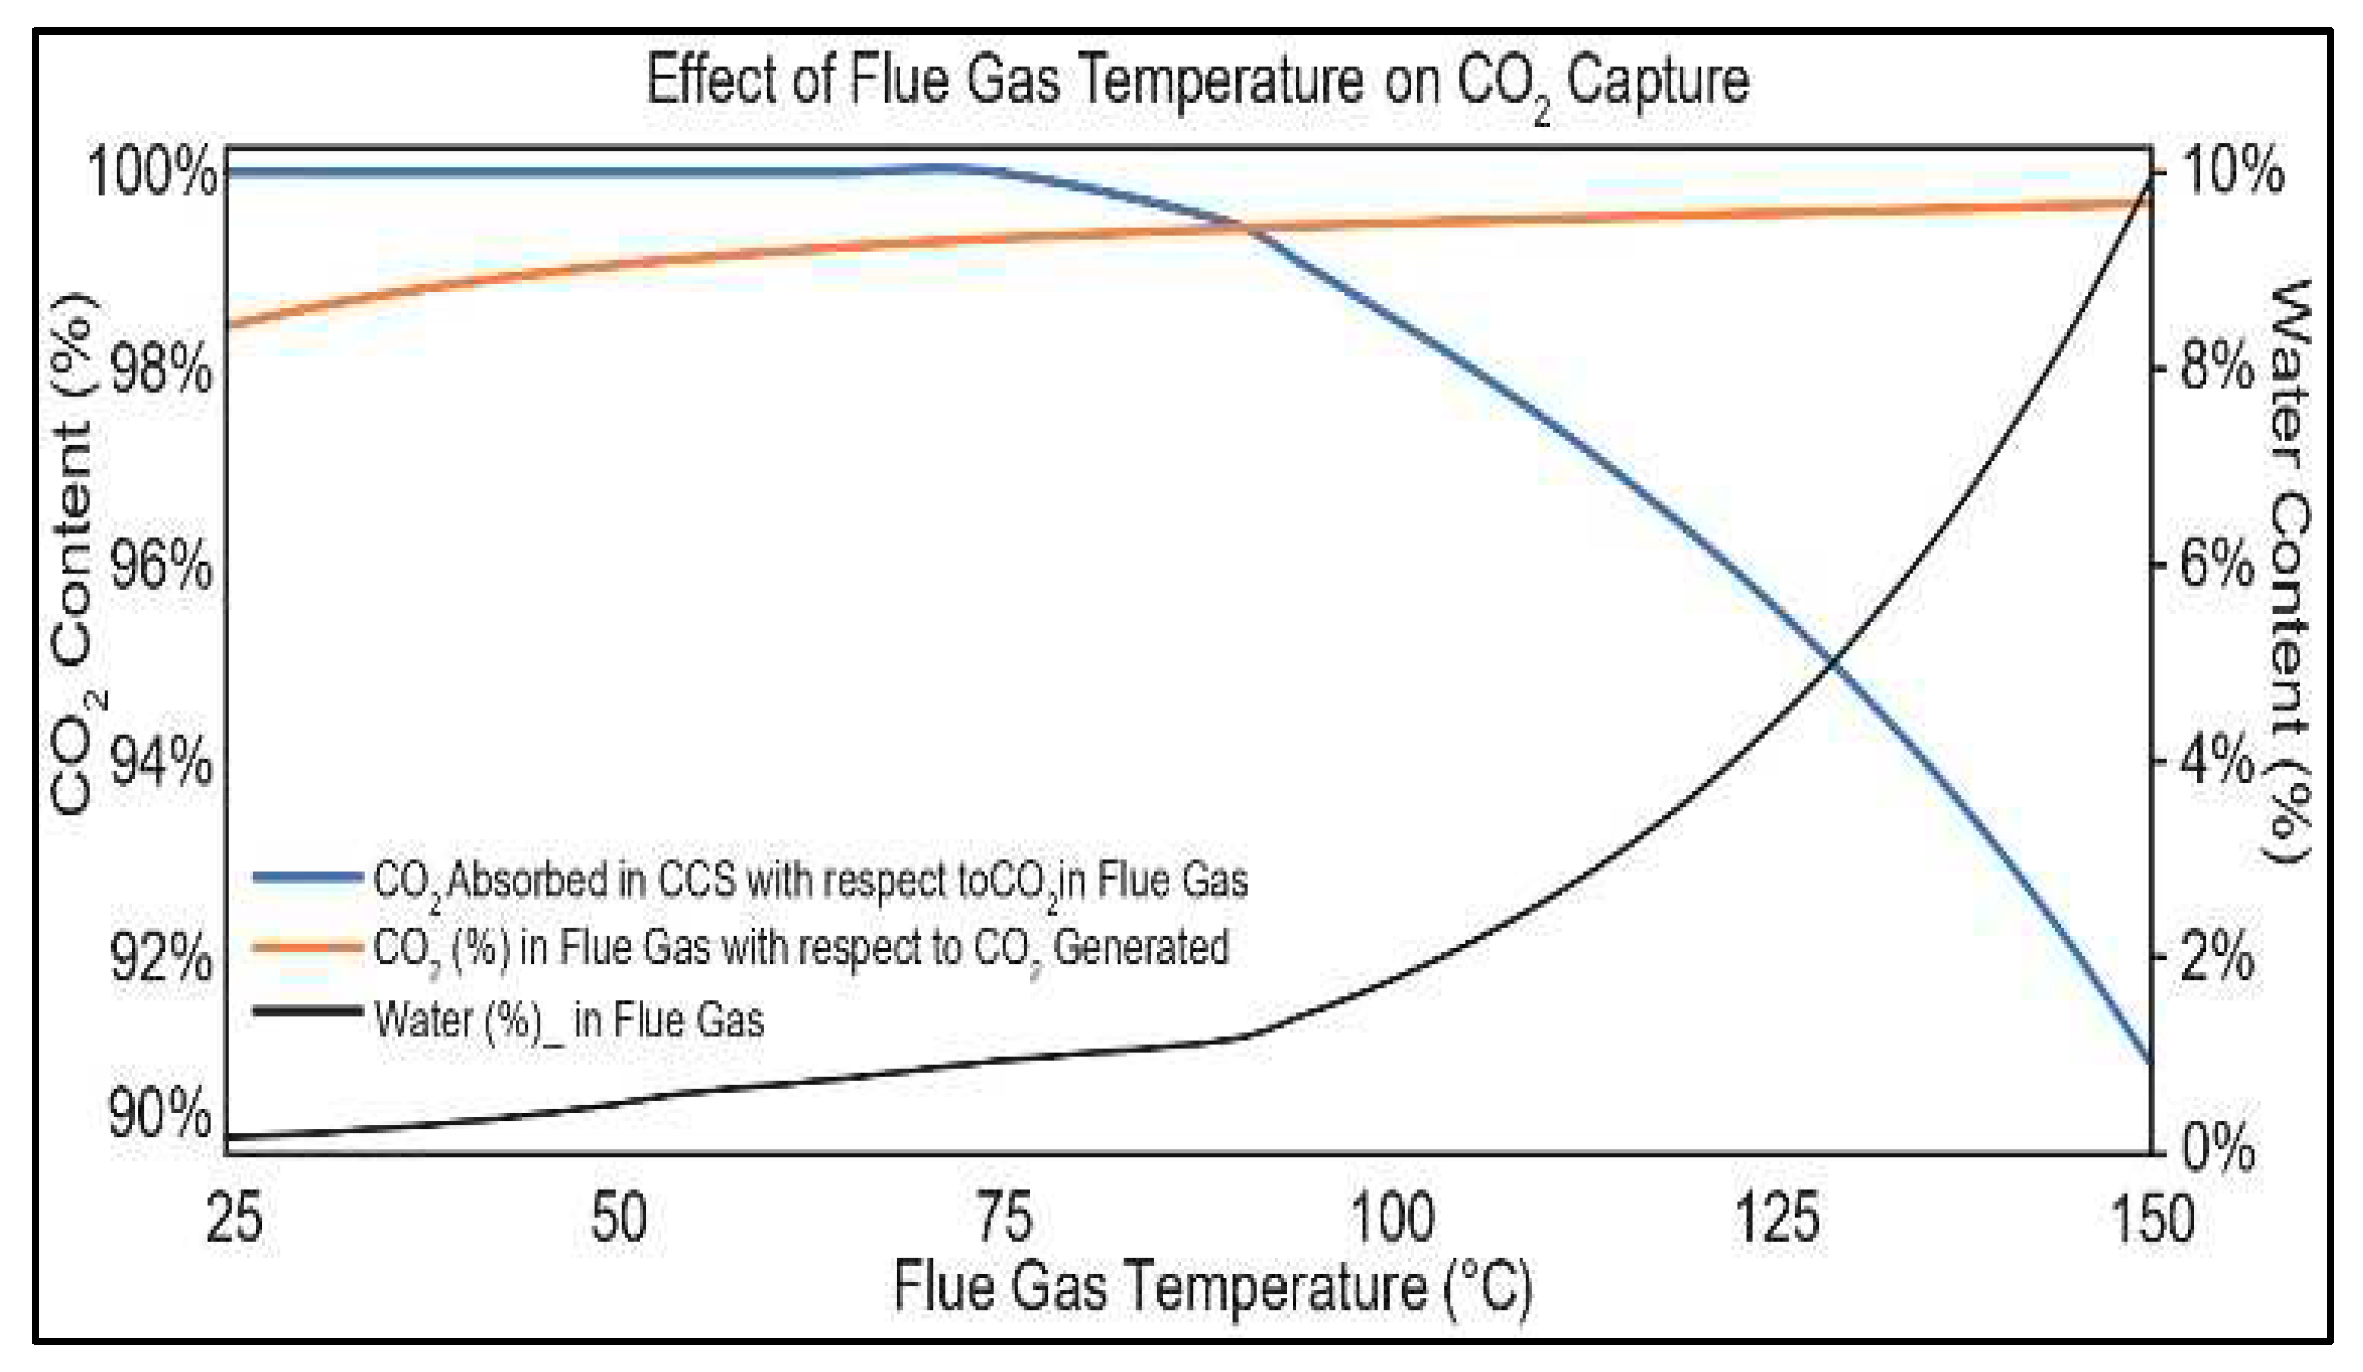
Figure 7 indicates the significance of using a cooler beforehand the flue gas enters the Separator-2 and C O 2 absorber. As observed from the graph, with an increase in the flue gas temperature the absorption capability of the absorption column decreases. It can be observed that at lower temperatures the column performs the best, having an efficiency of capturing 100% of C O 2 in the flue gas. The effect of flue gas’s temperature on liquid water removal is already described in Figure 6. However, it can be observed that the temperature not only affects the removal of water in separator 2 but also the C O 2 concentration in the flue gas. At lower temperature, about 2% of C O 2 goes with water which decreases as the temperature increases.

3.2. Pinch Analysis:

For the system, four streams are considered for pinch analysis:
  • Stream 1, from the initial water to the mixer
  • Stream 2, from the output of compressor 1 to the input of compressor 2
  • Stream 3, from the output of the hydrogen splitter to the input of the water separator
  • Stream 4, from the output steam turbine in the Rankine cycle subsystem to the water pump.
The streams are described numerically in the table below:
Table 1. Stream data for pinch analysis.
Stream No Stream Type Start Temperature (℃) Target Temperature (℃) Heat   Load   H (kW)
1 Cold 30 247.7 5.45 10 8
2 Hot 222.6 30 2.85 10 7
3 Hot 316.7 40 3.096 10 8
4 Hot 207.8 99.96 5.31 10 8
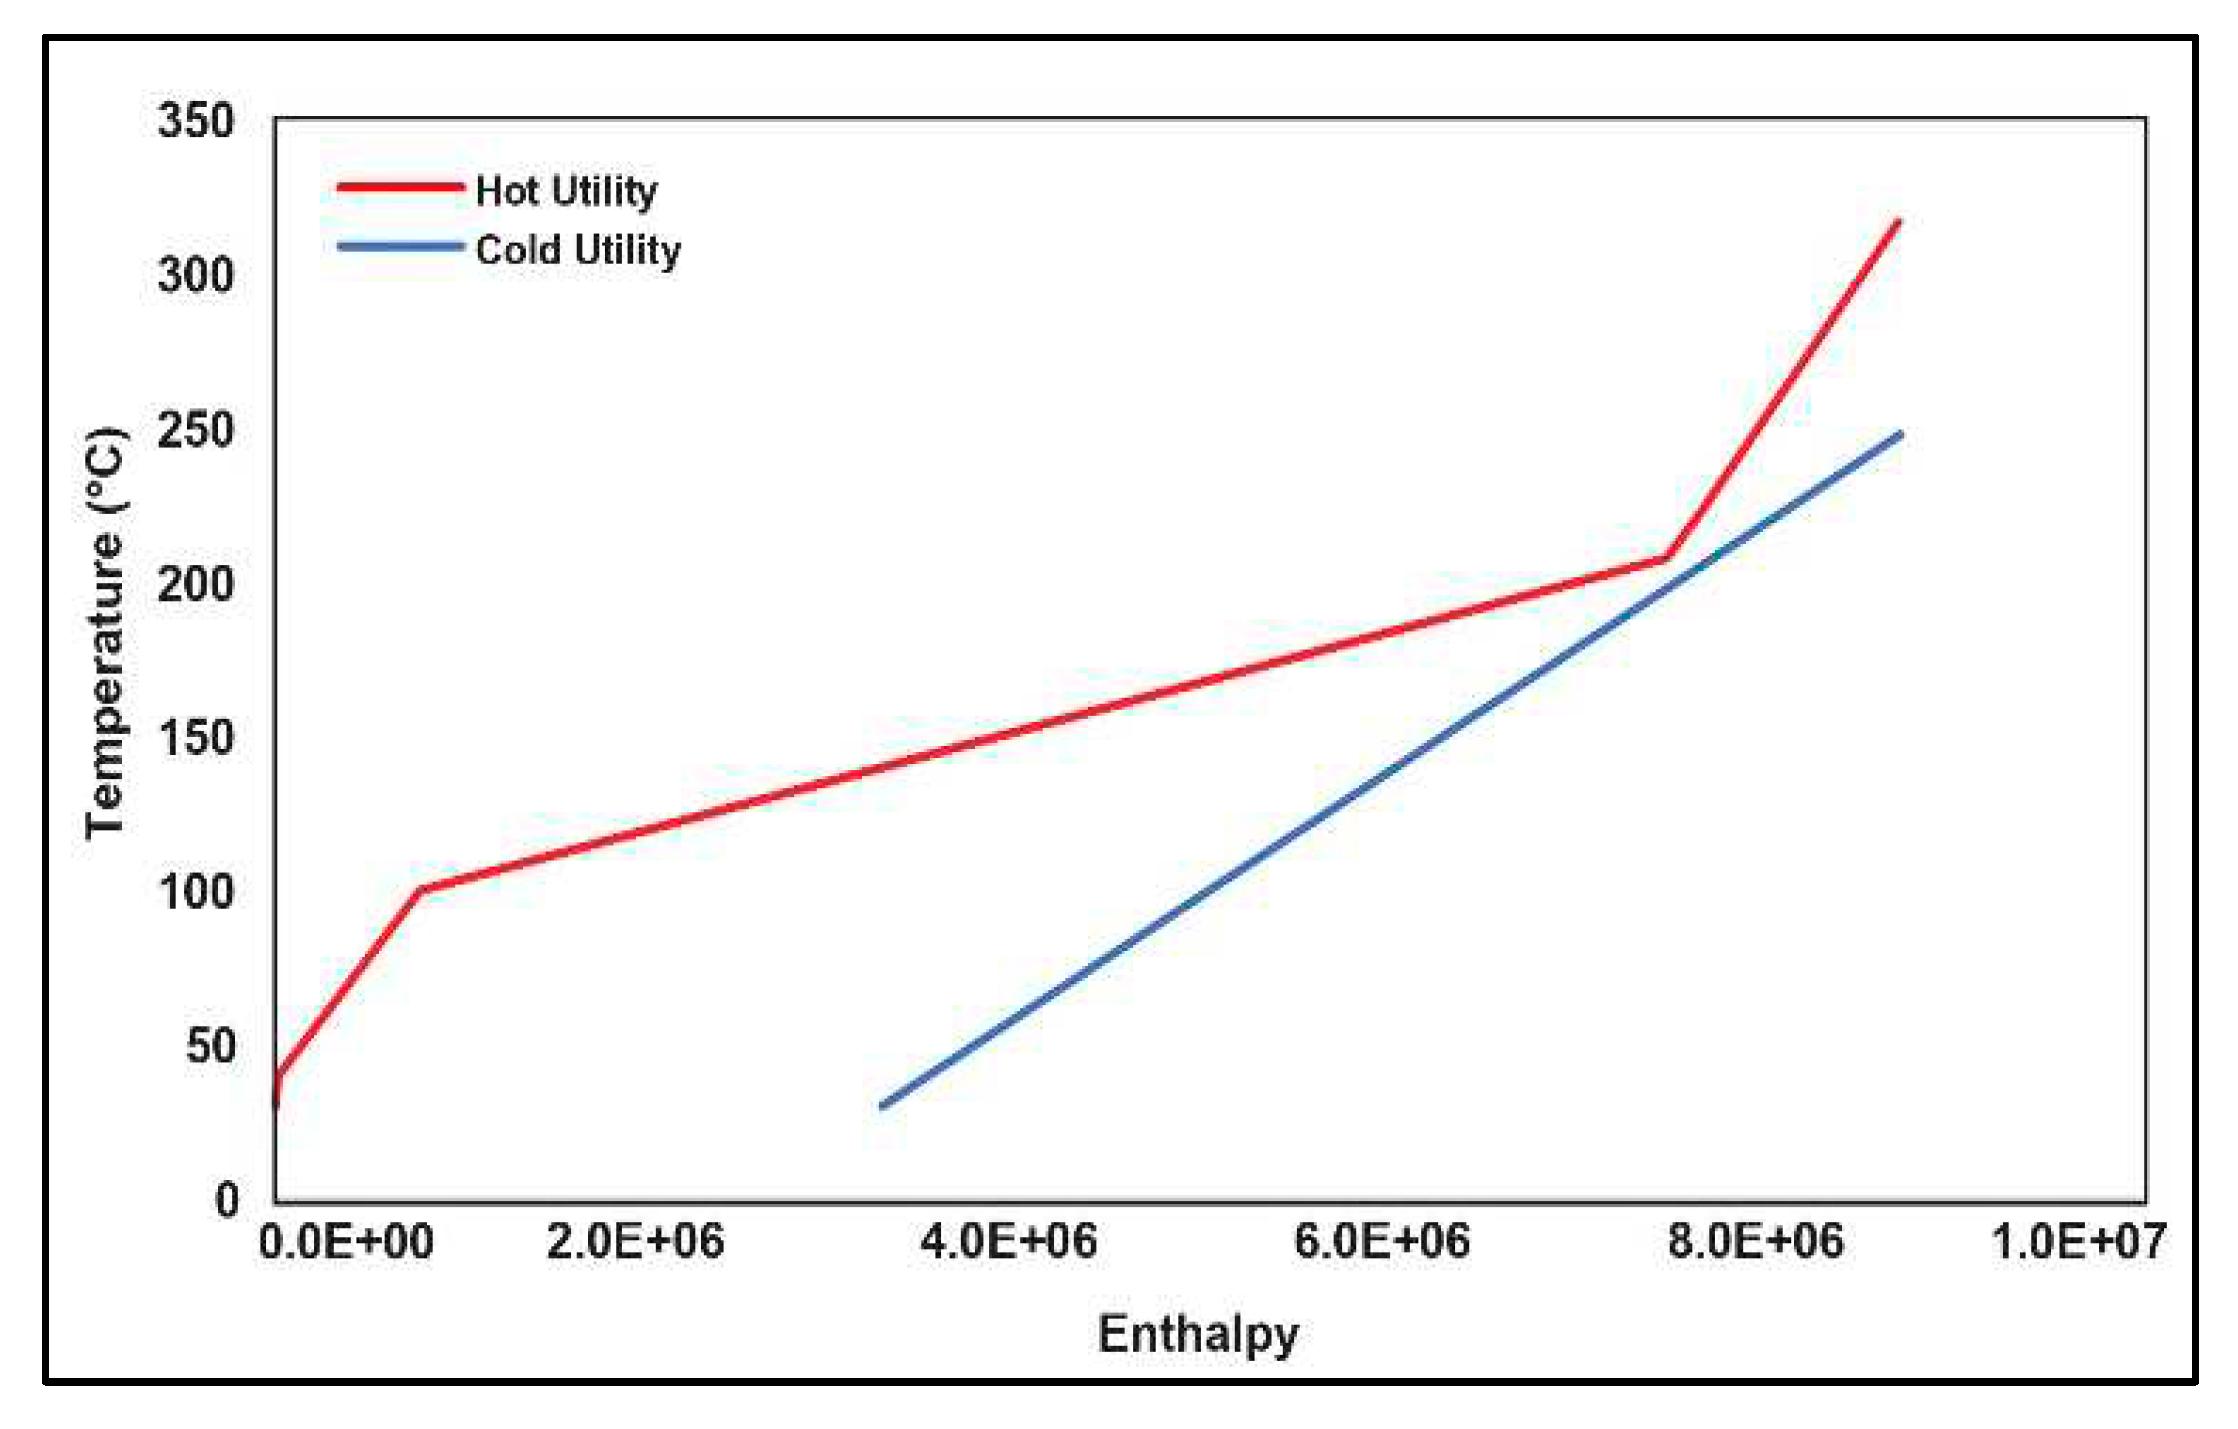
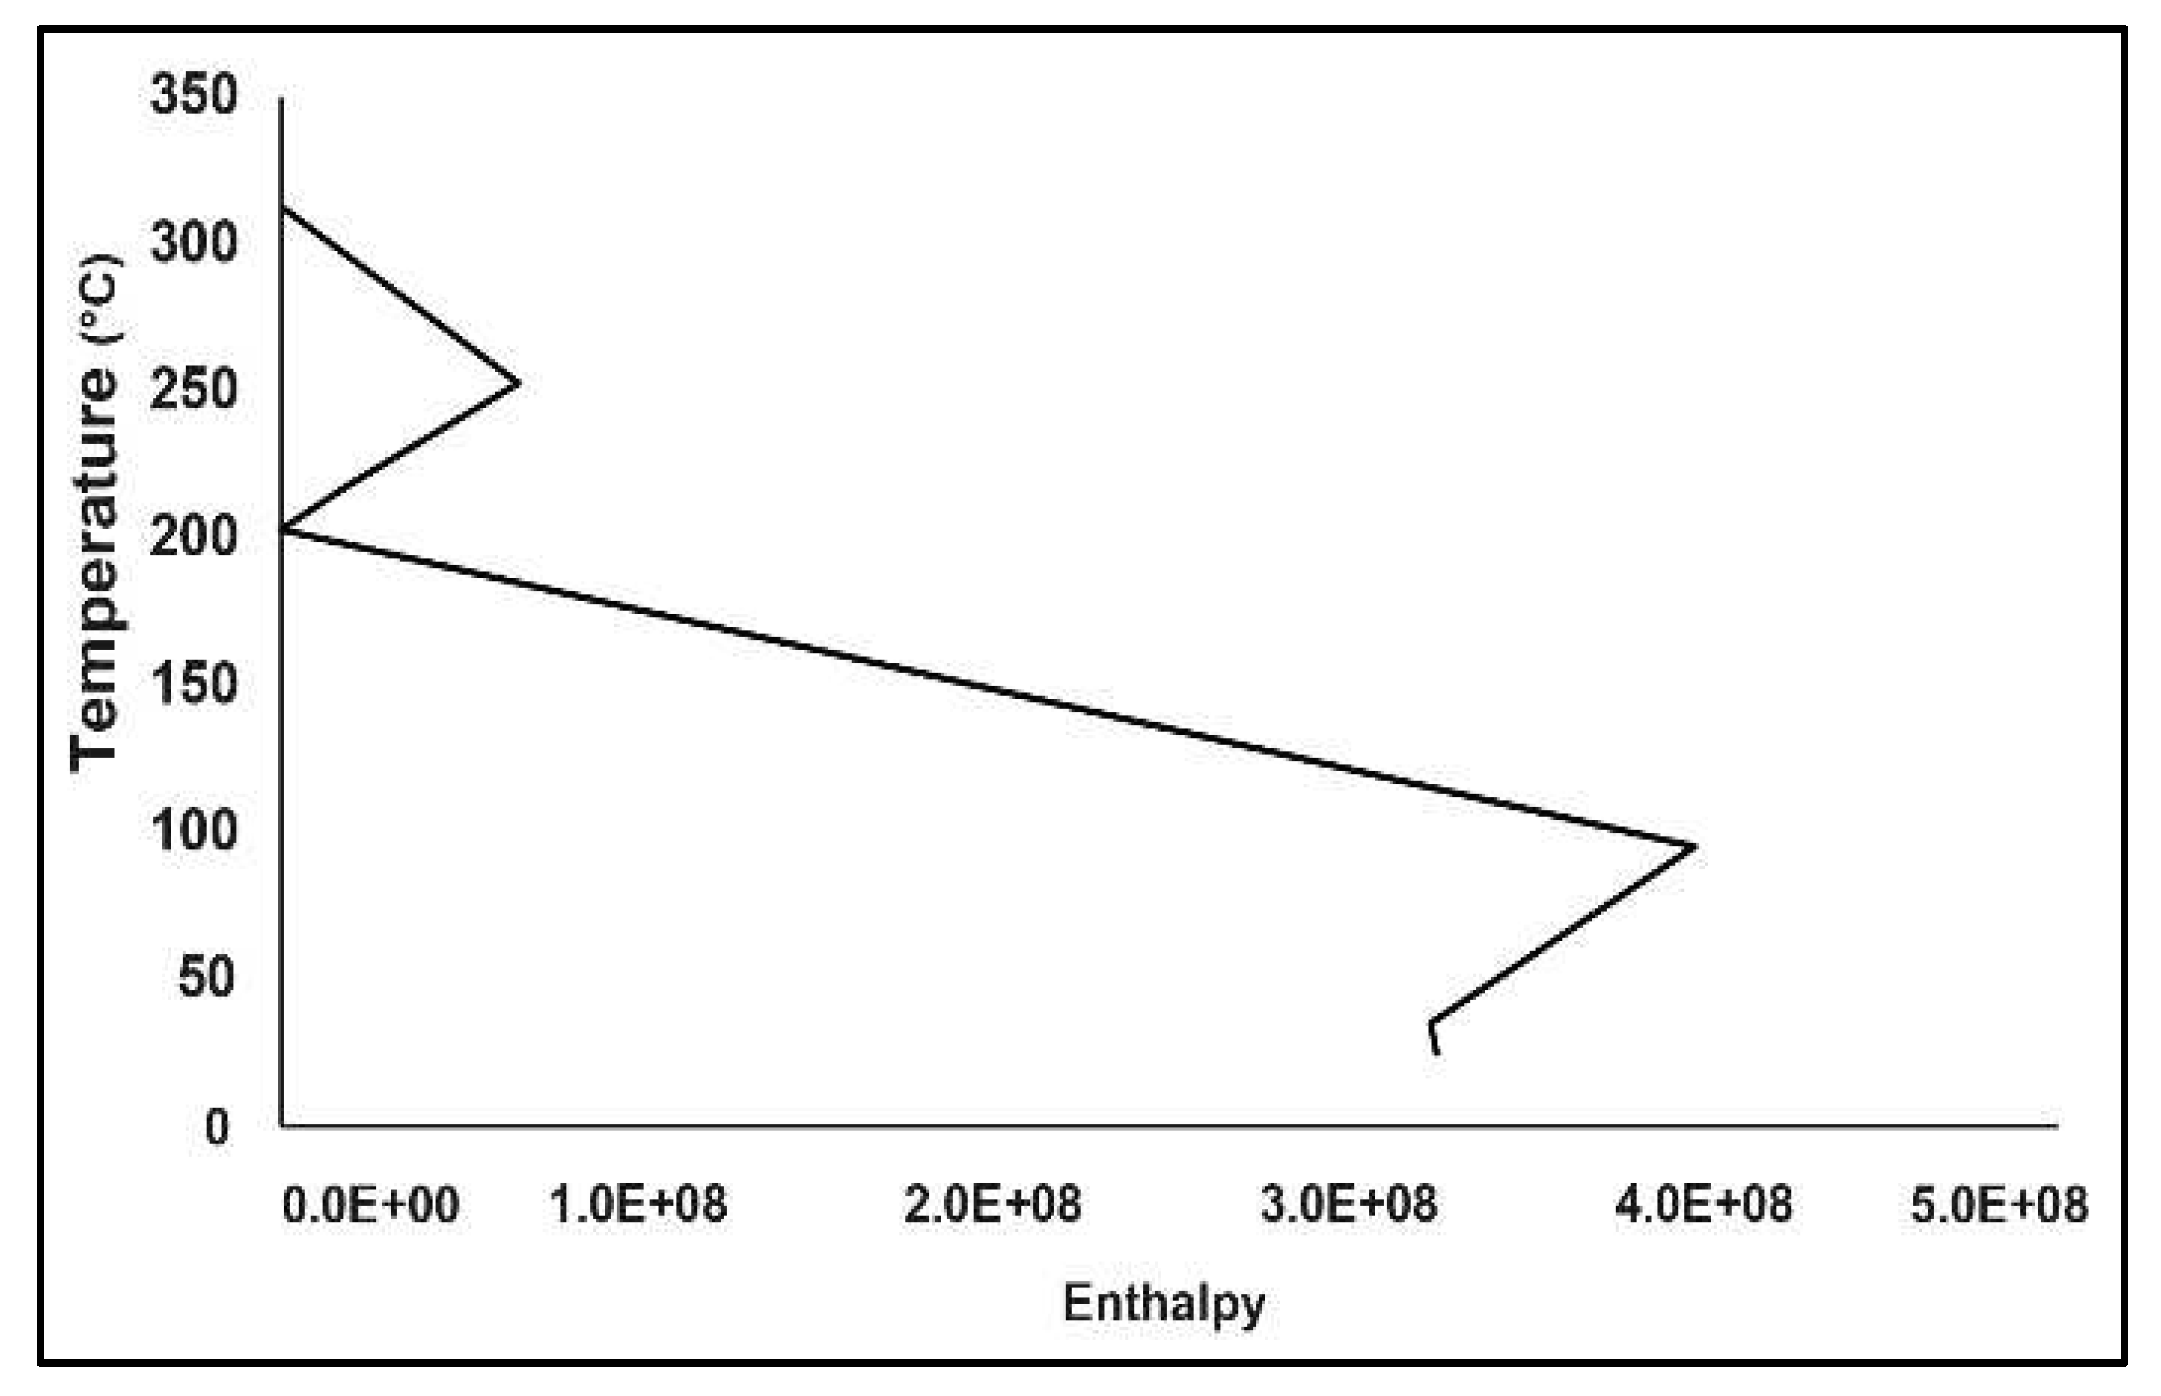
Figure 8 and Figure 9 represent the current model's composite and grand composite curves. It should be noted that this analysis is done independently of the current heat exchanger system, using the information related to the reactors and separators. This way, the analysis can be used to either validate or improve the heat exchanger network. The pinch analysis assumes that the minimum temperature difference between the hot and cold streams is 10°C to find a theoretical minimum for the modeled system. Heating and cooling utilities would be required outside of process exchange sections. It was revealed that there is a requirement for one (1) additional heat exchanger for this optimized heat integration network which is the major contributor to the increase in overall cost. This leaves room for further optimization of the overall process.
According to the pinch analysis finding, this system's theoretical minimum hot utility requirement is 245 KW. However, after the heat exchanger network design, the requirement for the hot utility was reduced to 0 kW. Therefore, it can be demonstrated that the current heat exchanger network is adequate to save the hot energy possible through heat exchange. As for the requirement for cooling utility, it theoretically required about 90 MW which was optimized by 0.3% requiring 99.7% of the required cooling utility. If the system has not yet been constructed and is still in the design phase, it may be recommended to use the alternative network to save money on the heat exchanger network.

3.3. Reformer 1 Yield Variation

Conversion type reactors are the simplest type of the reactor in Aspen HYSYS [80,81]. Due to their simplicity the yield needs to be defined at the beginning of the designing process leaving less room for investigating the effect of the change of process parameter on the final product. However, the steam methane reforming process is a well matured process, and the overall conversion efficiency is about 65-85% [44]. Therefore, the yield of the reformer 1 was varied with in an acceptable conversion yield of the reforming process and the H 2 production, flue gas formation and C O 2 capture process were investigated.
Table 2. C O 2 removal rate at different reformer yield.
Reformer Yield H 2 Production
(kgmole/hr)
Flue Gas Formation
(kgmole/hr)
C O 2 Formation
(kgmole/hr)
C O 2 Removal (%) in Absorber Amine Used (kgmole/
hr)
80 11520 8640 2880 100 14450
70 10080 9360 2520 100 15000
60 8640 10080 2160 99.99 16200

3.3.1. Multi-Stage Compression

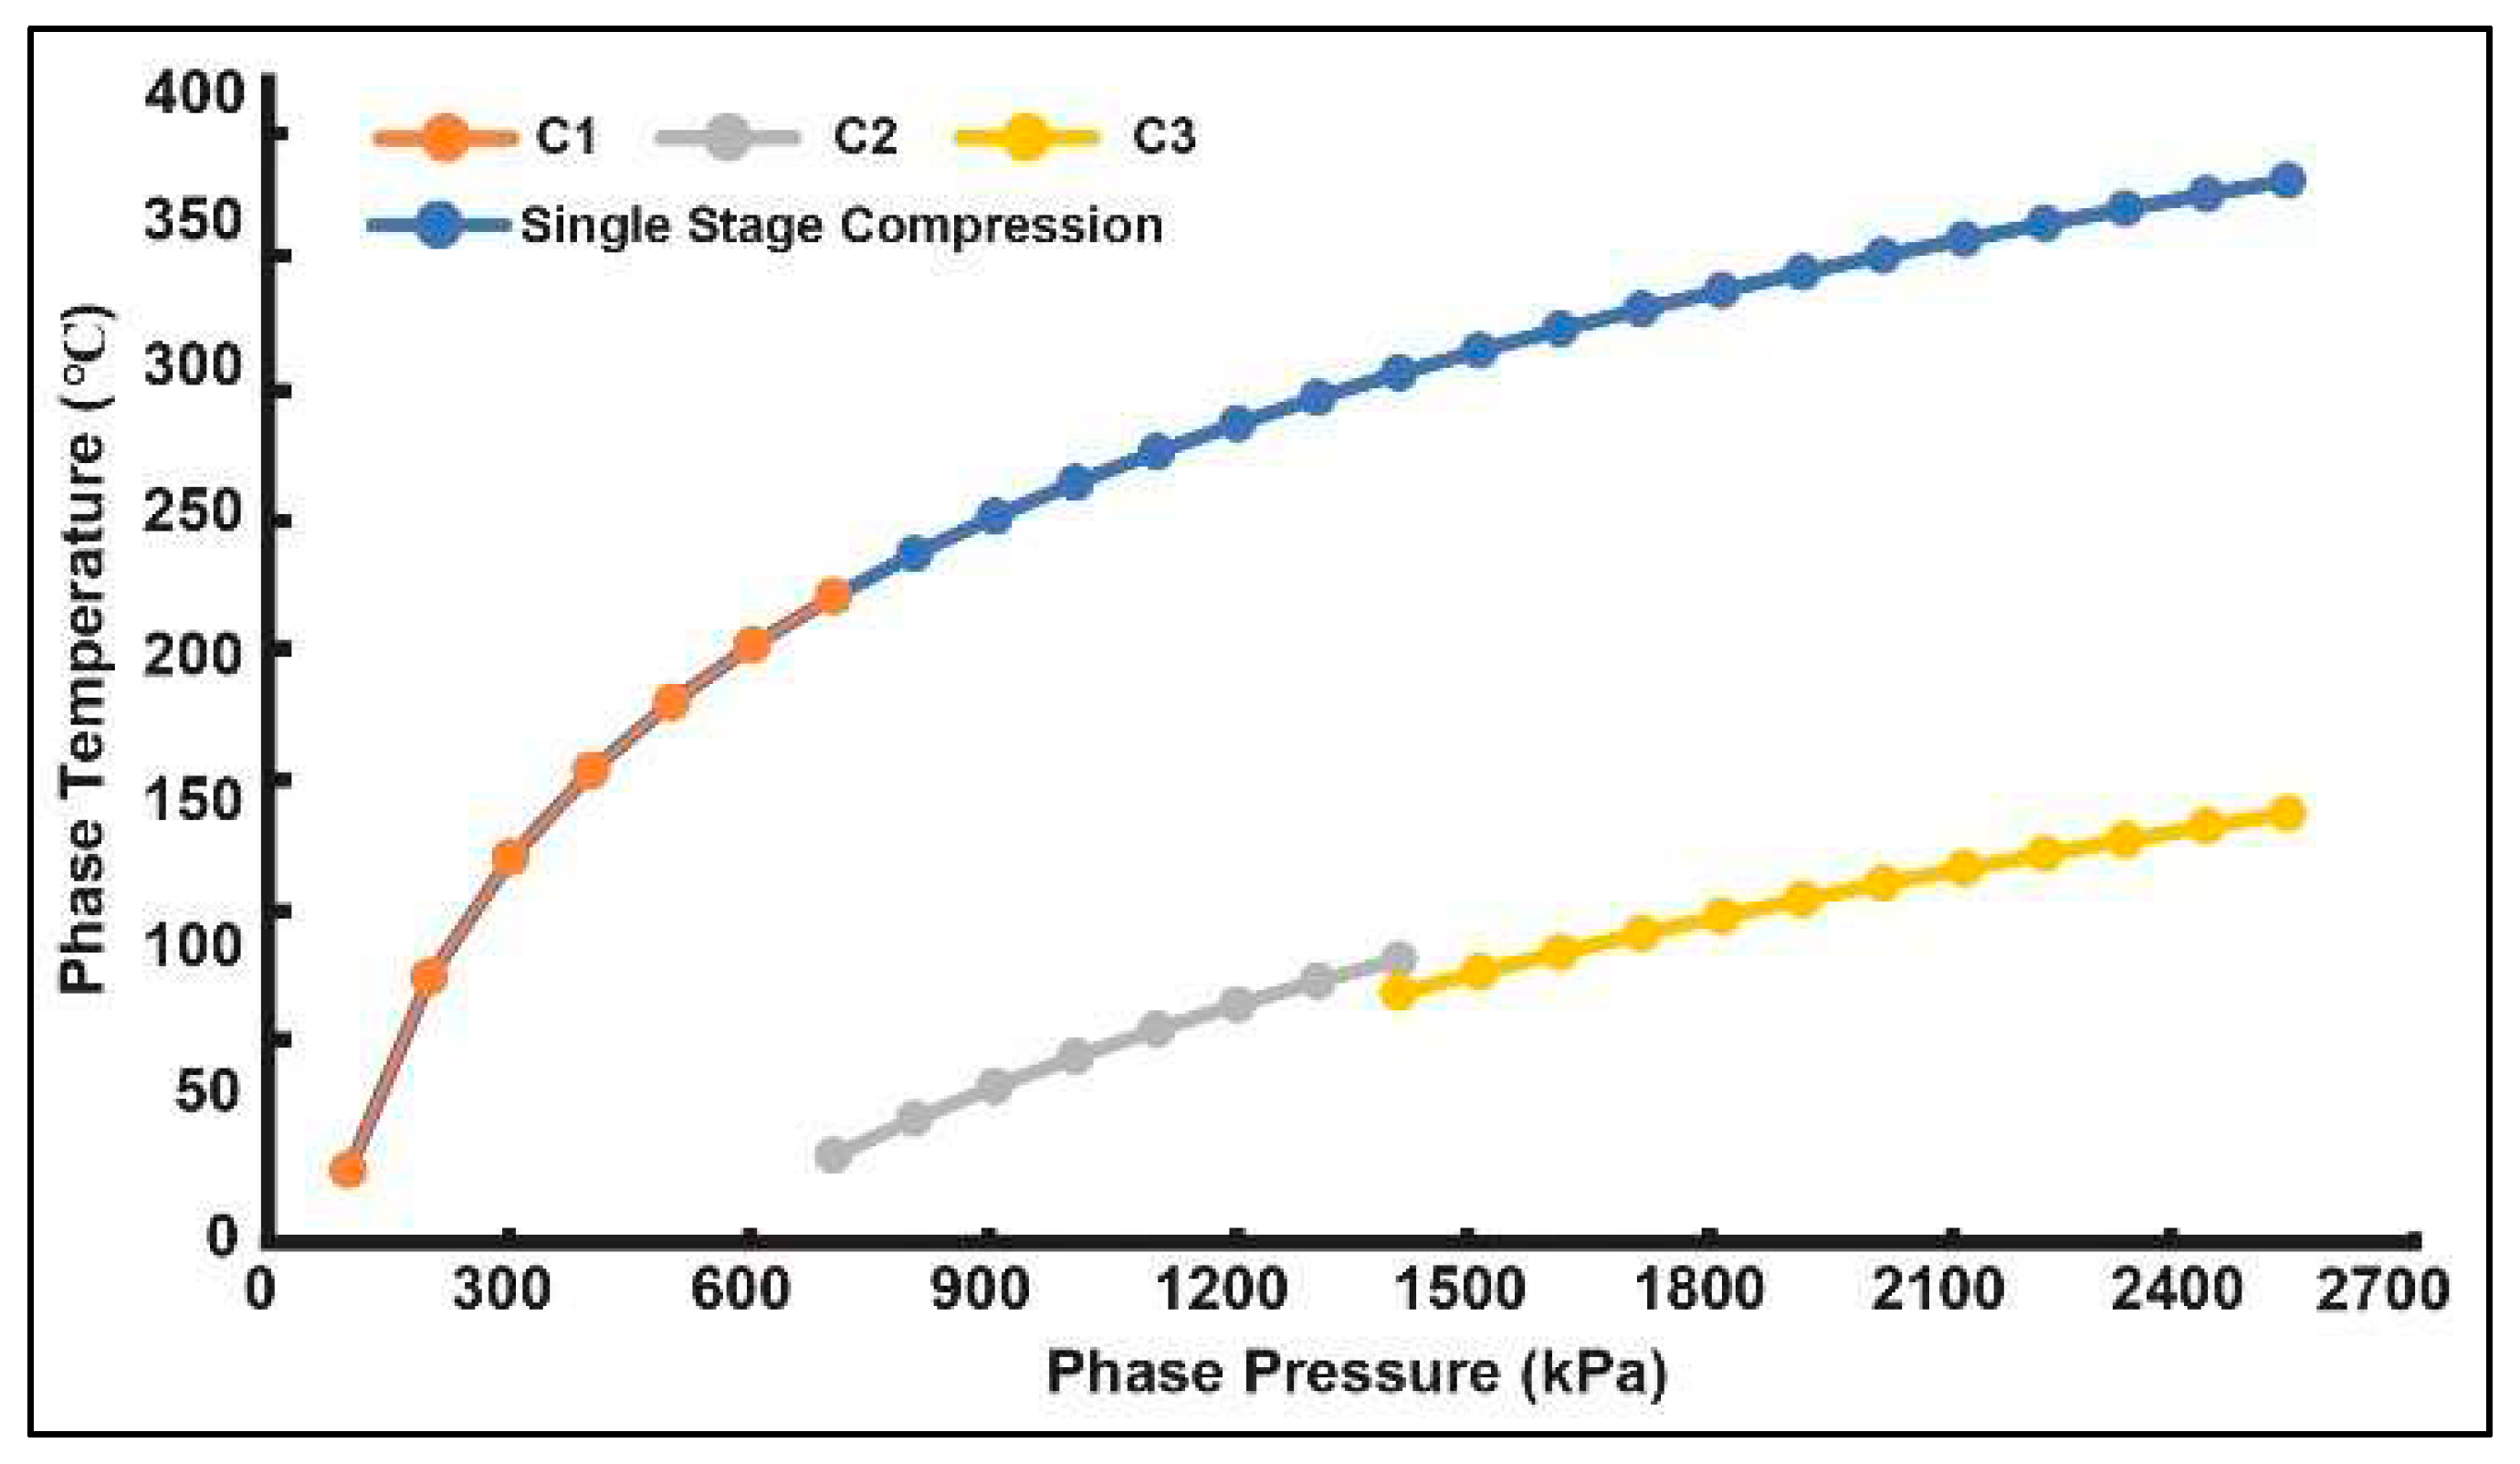
Initially, methane was compressed before mixing with water and feeding into the reactor. The compression of methane was done in multiple stages because compression generates heat. Therefore, the compressed gas needs to be cooled before sending into the next compressor, making the compression less adiabatic, but more isothermal.
The effect of compressing methane in a multi-stage process to single-stage compression is shown in Figure 10. As observed from the graph, the rise in temperature of the gas in the three-stage compression is not higher than single stage compression. The usage of interstage cooling also has a significant effect on compression. This phenomenon resulted in a less adiabatic and more isothermal condition because there is no significant increase in temperature.

3.5. Carbon Capture System (CCS)

Different absorbents (MDEA, MEA, Propylene carbonate) are simulated to determine the most efficient solvent for this carbon capture system. Upon reviewing a wide range of research work [57,59,60,61,62,63,72,82,83,84,85,86,87,88], rate of carbon dioxide capture depends on the temperature of the solvent. However, absorption increases with increasing temperature and decreases once a certain temperature is reached. Several studies have been conducted to find out the optimum temperature for both solvent and flue to achieve highest C O 2 capture [57,82]. Therefore, the flue gas, which was released at a higher temperature, needed to be cooled down for efficient absorption.
Absorption of C O 2 varies depending on the characteristics of the solvents. Therefore, a suitable solvent selection is important to ensure the highest efficiency of C O 2 absorption. Two of the most used amines in large scale industrial production are MEA, and MDEA which have shown higher percentage of CO2 absorption [84]. Consequently, these two as well as Propylene Carbonate, which is also used as a solvent, were considered for further case study in order to select the most suitable amine.
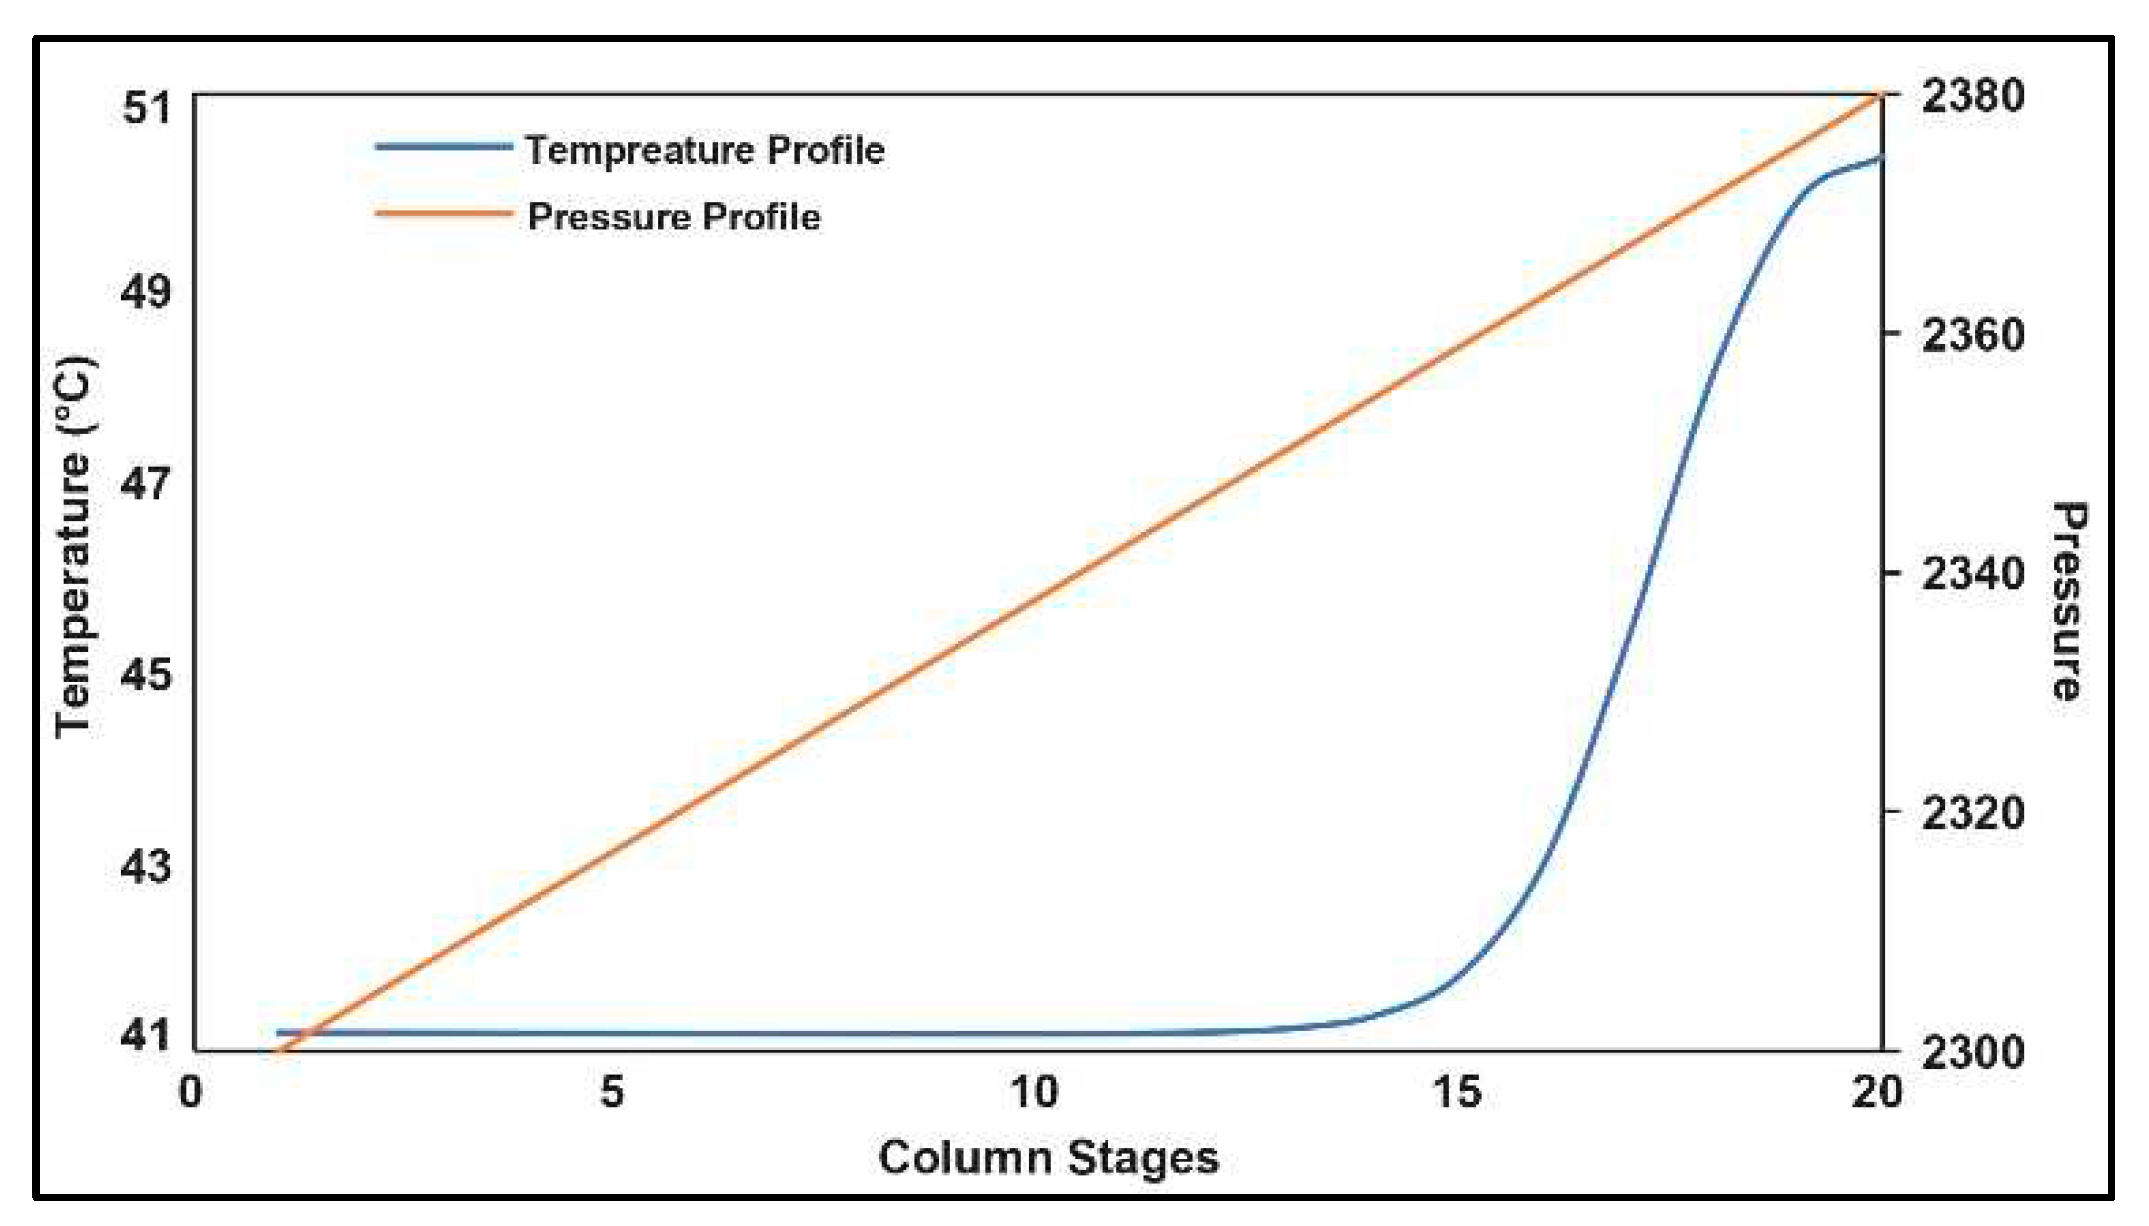
Figure 11 indicates the variation of absorption column temperature and pressure profile. As observed from the plot, the temperature of the column started rising around stage 13. On the other hand, the pressure profile throughout the column remained linear.
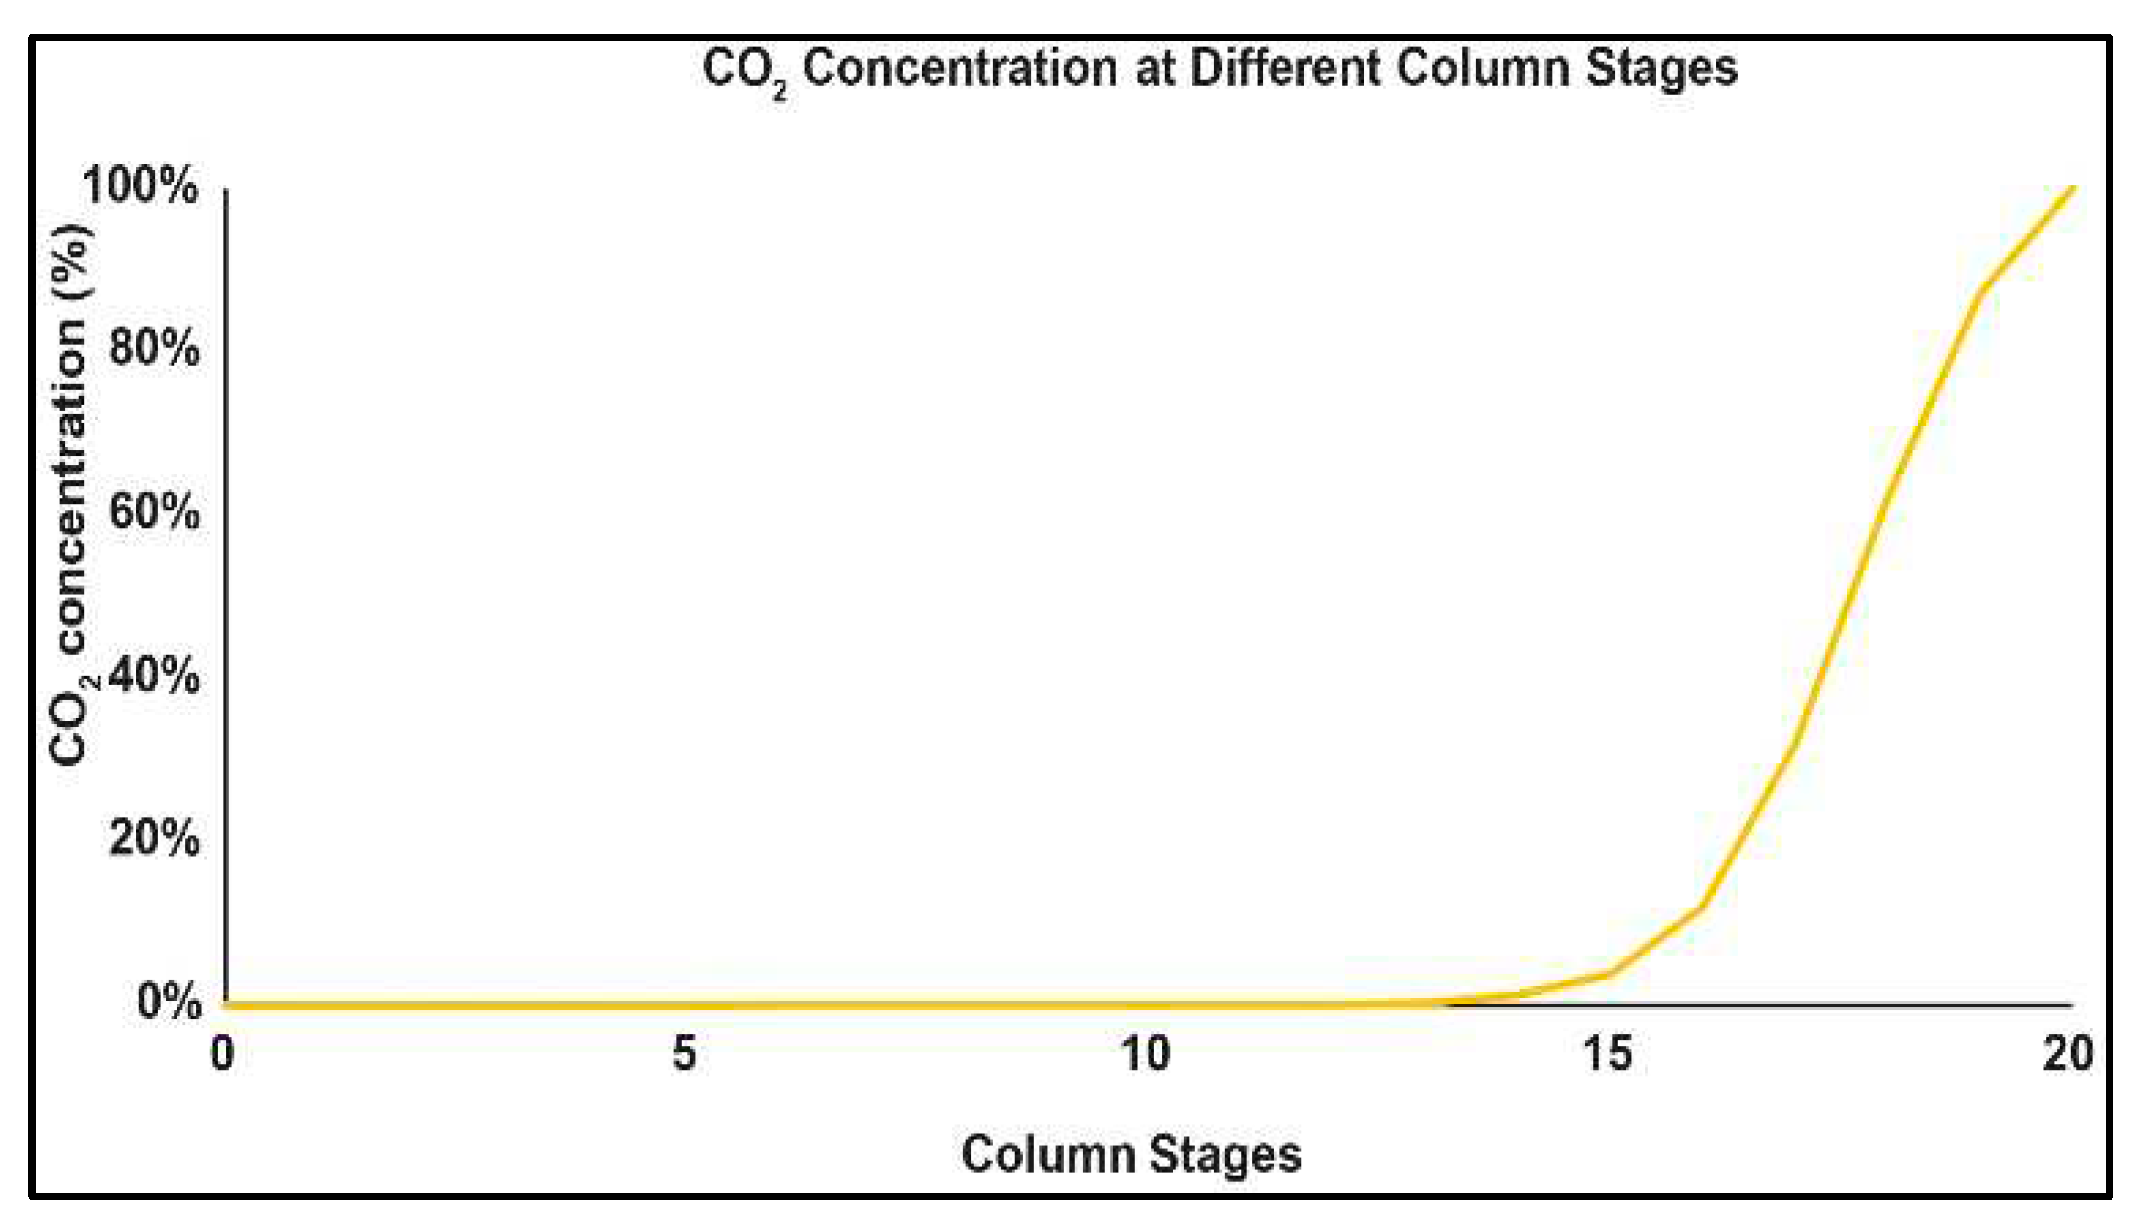
Figure 12 provides information on the concentration of C O 2 at different stages of the absorption column. The plot revealed that there was no C O 2 present above stage 12 and the concentration raised rapidly as we go to the bottom stages of the column. It showed that the maximum amount C O 2 was in the bottom stage of the column indicating that the amine was absorbing the C O 2 in the flue gas.
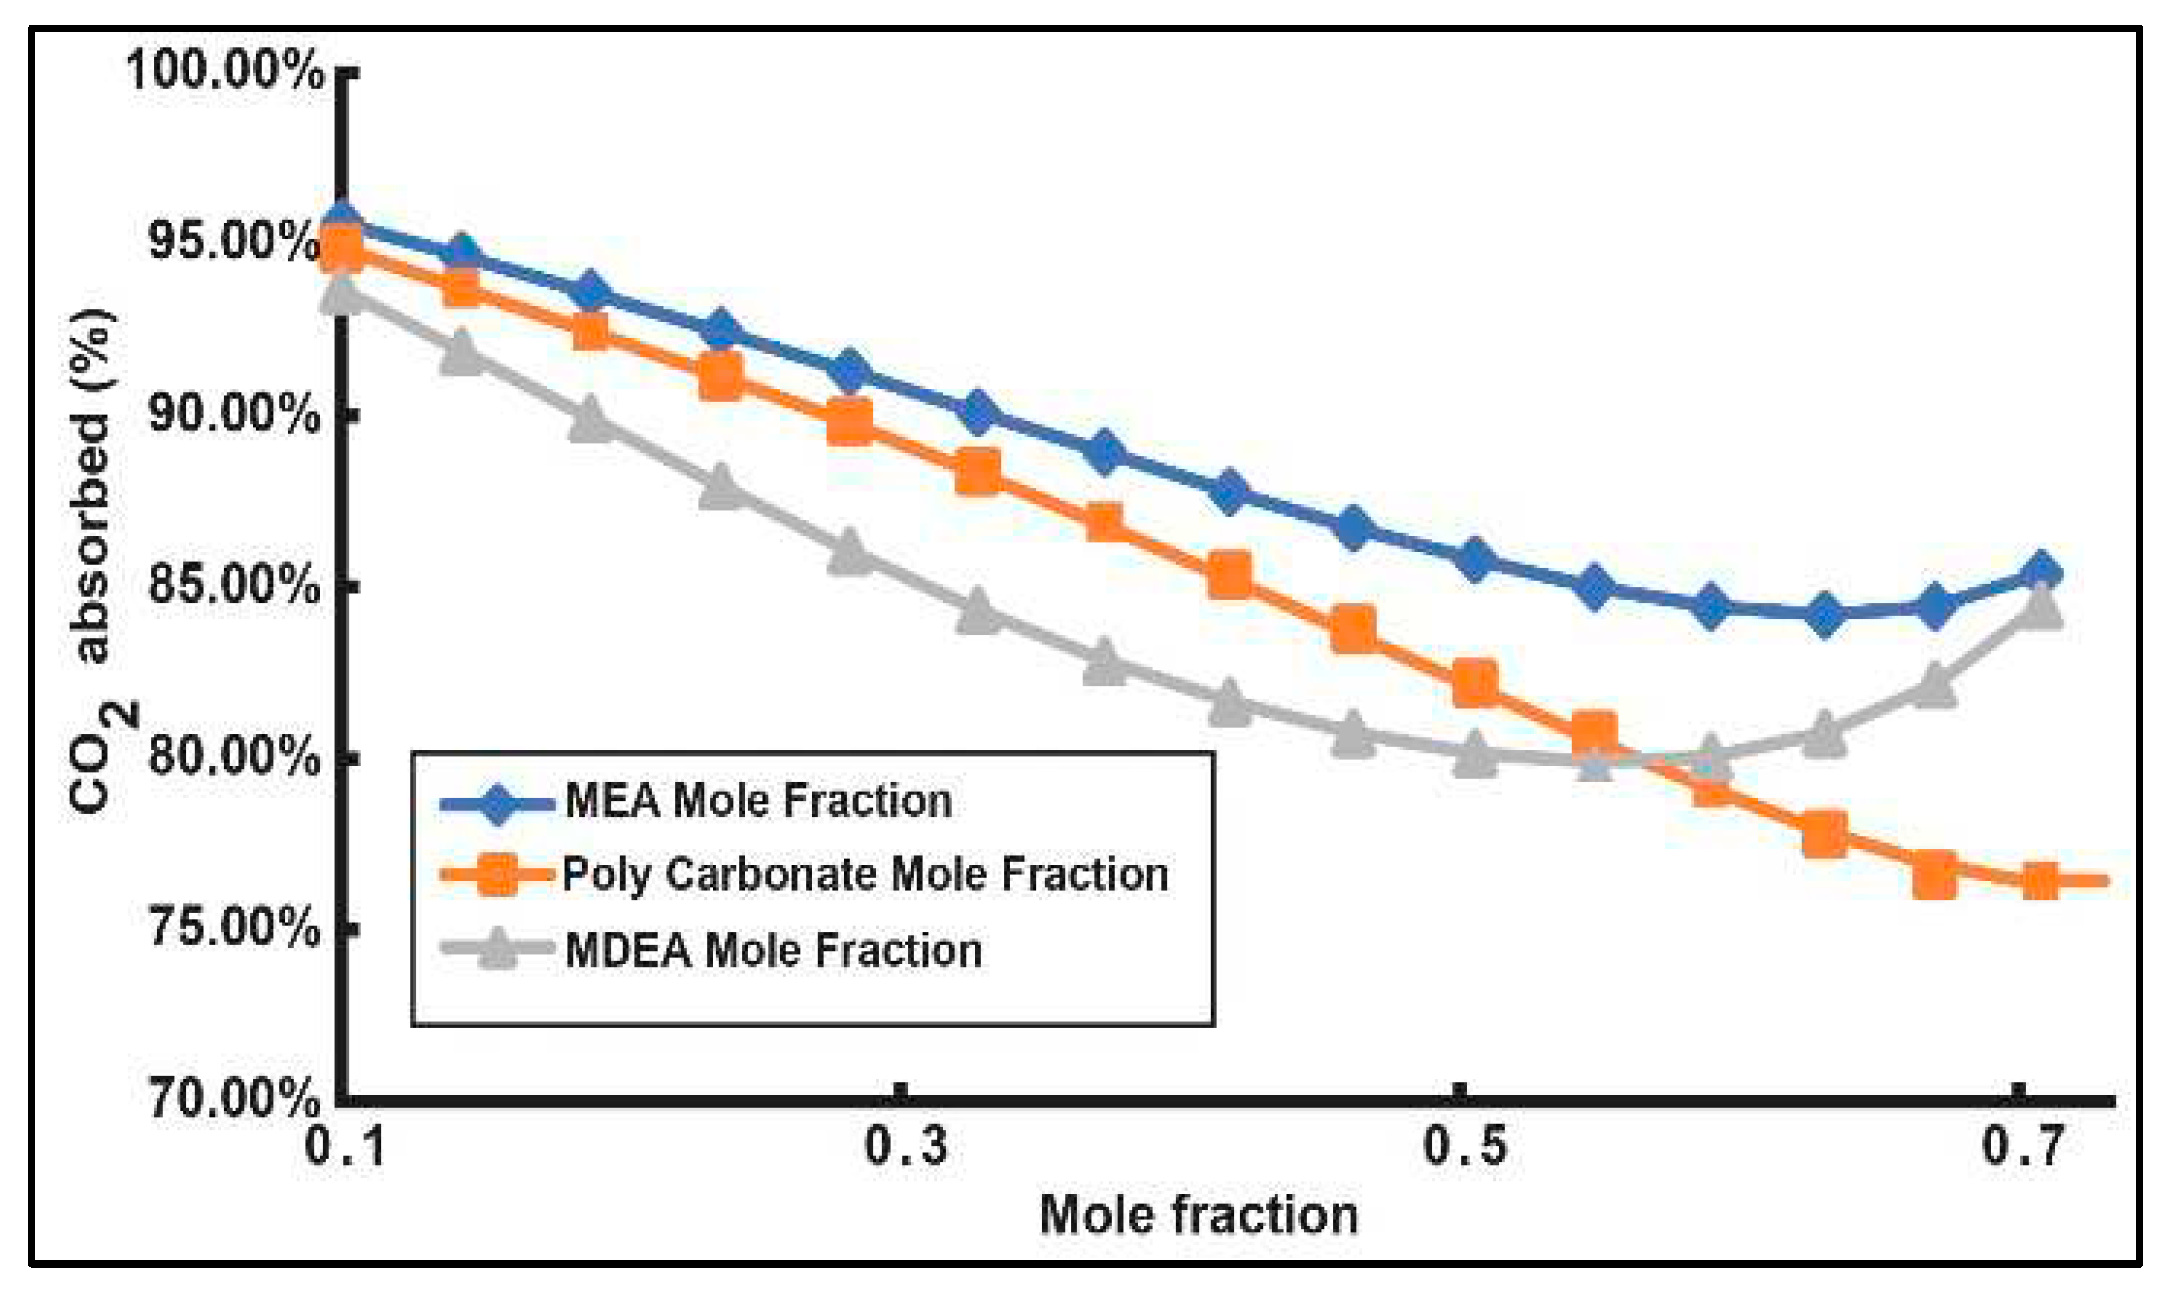
Figure 13 compares the percentage of C O 2 absorbed in the solvent along with the change of concentration of different solvents (using single amine only). Each of the solvent were studied under the same condition to find out the most suitable solvent for absorption. The mole fraction of amine solvents to H 2 S was varied between 0.1 to 0.8 and thus, the absorption of C O 2 were studied. C O 2 absorption varied from the minimum value of 75.02% to maximum of 95.60% for different solvents. Based upon the study, the highest C O 2 capture is achieved while using MEA and at a molar fraction of 0.1005 to H 2 S . Thus, it was selected for highest efficiency to CO2 capture.
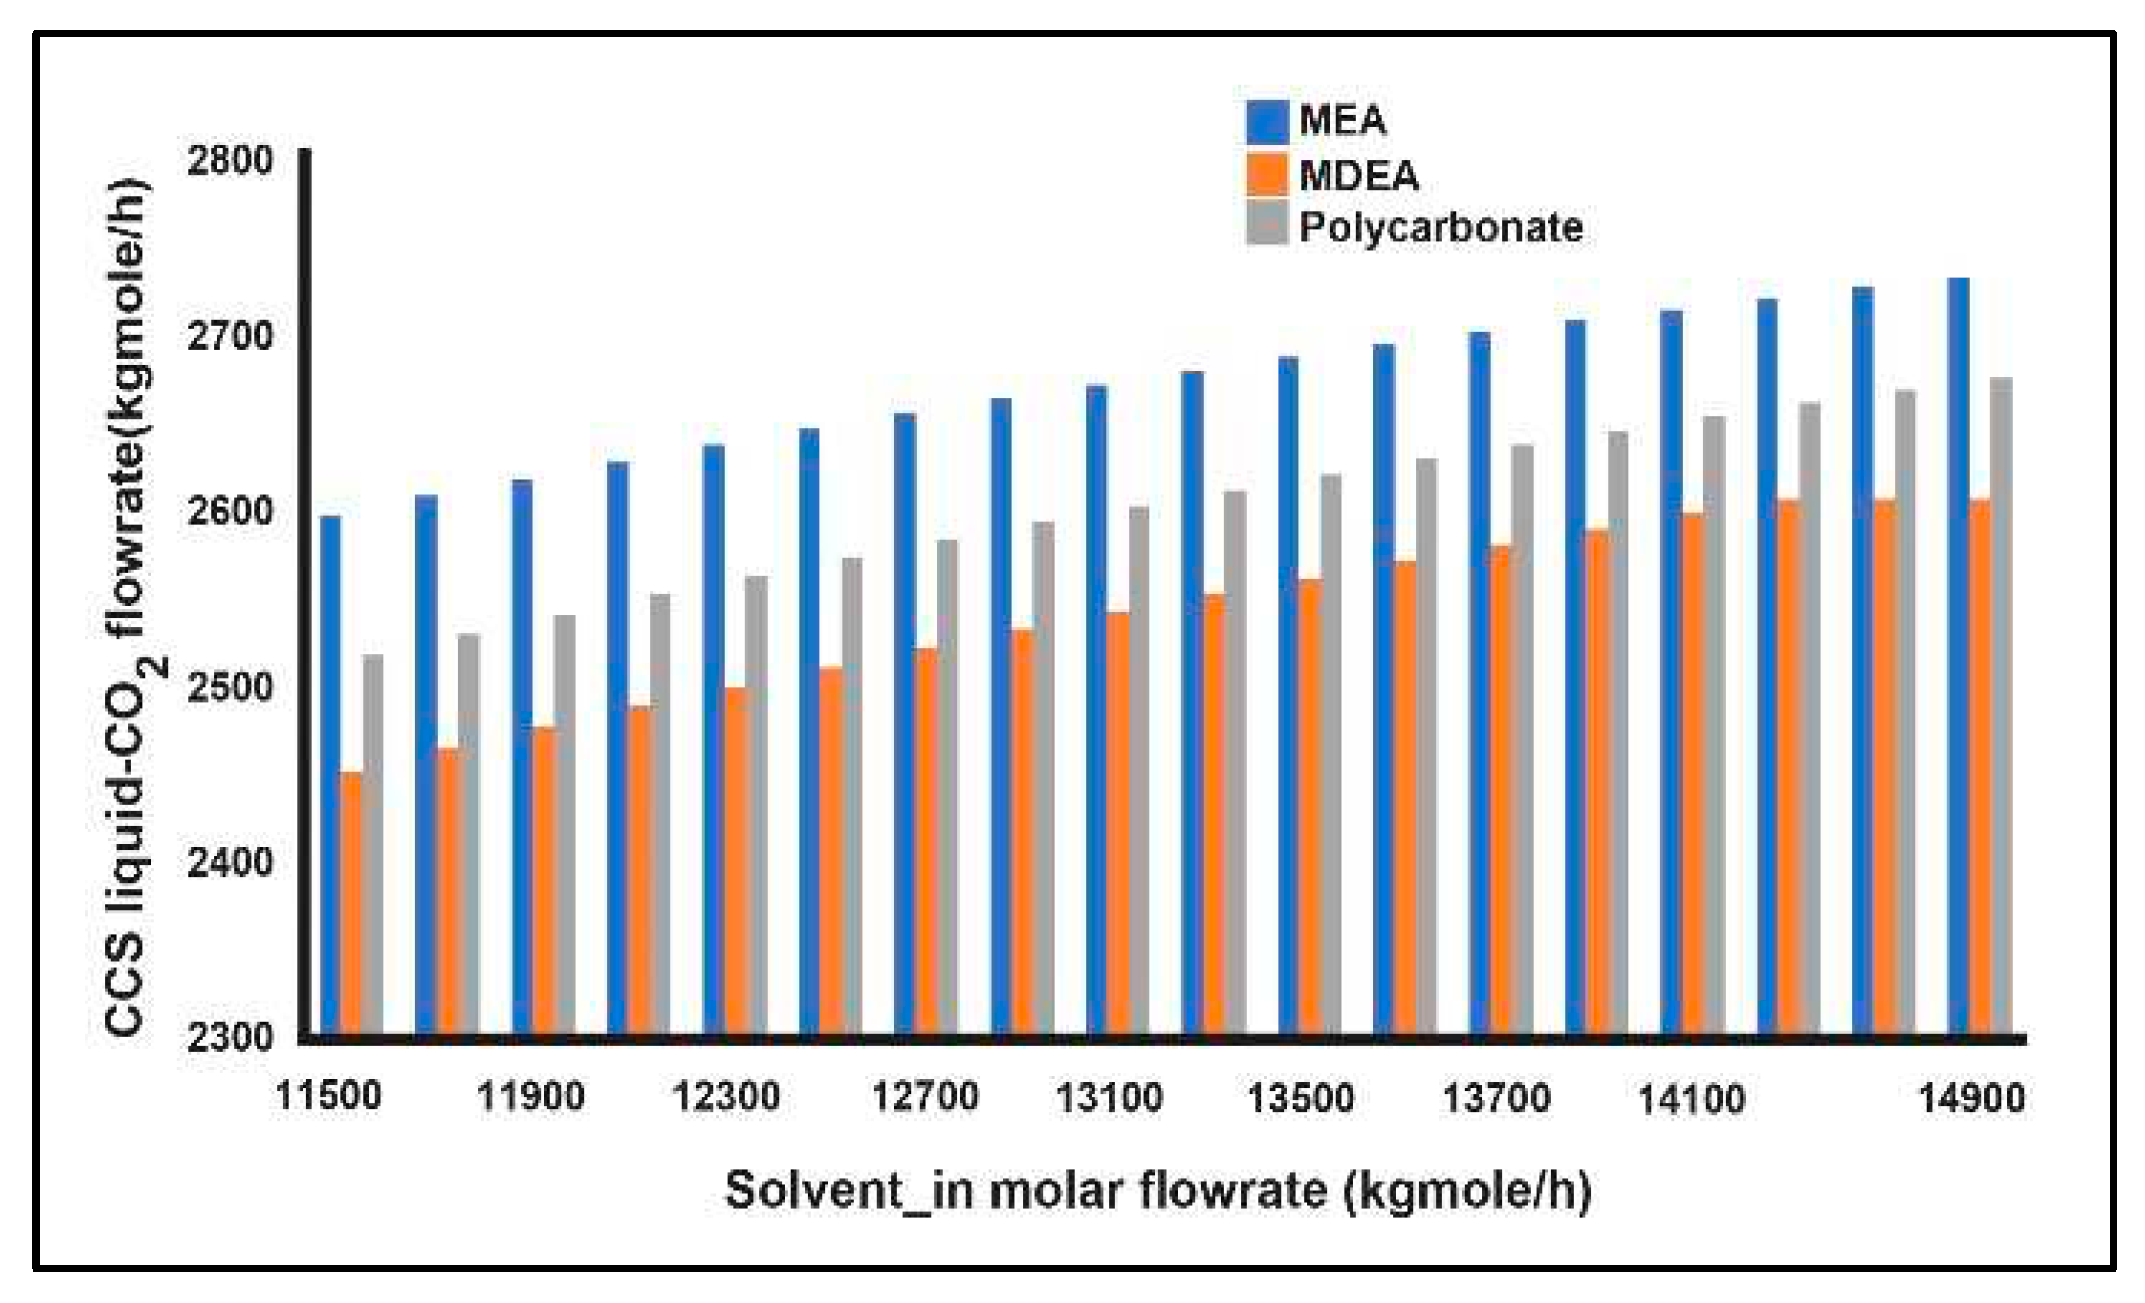
Figure 14 indicates the change in the molar flow of the C O 2 in CCS with respect to the change of solvent_in flow rate. Solvent flowrate from 11500 to 15000 kgmole/h is considered as long as the column converged successfully. However, the increase of absorption of C O 2 became less significant with respect to the increase of molar flow of the CCS solvent as the curve became flatter. That is why an acceptable value was chosen.
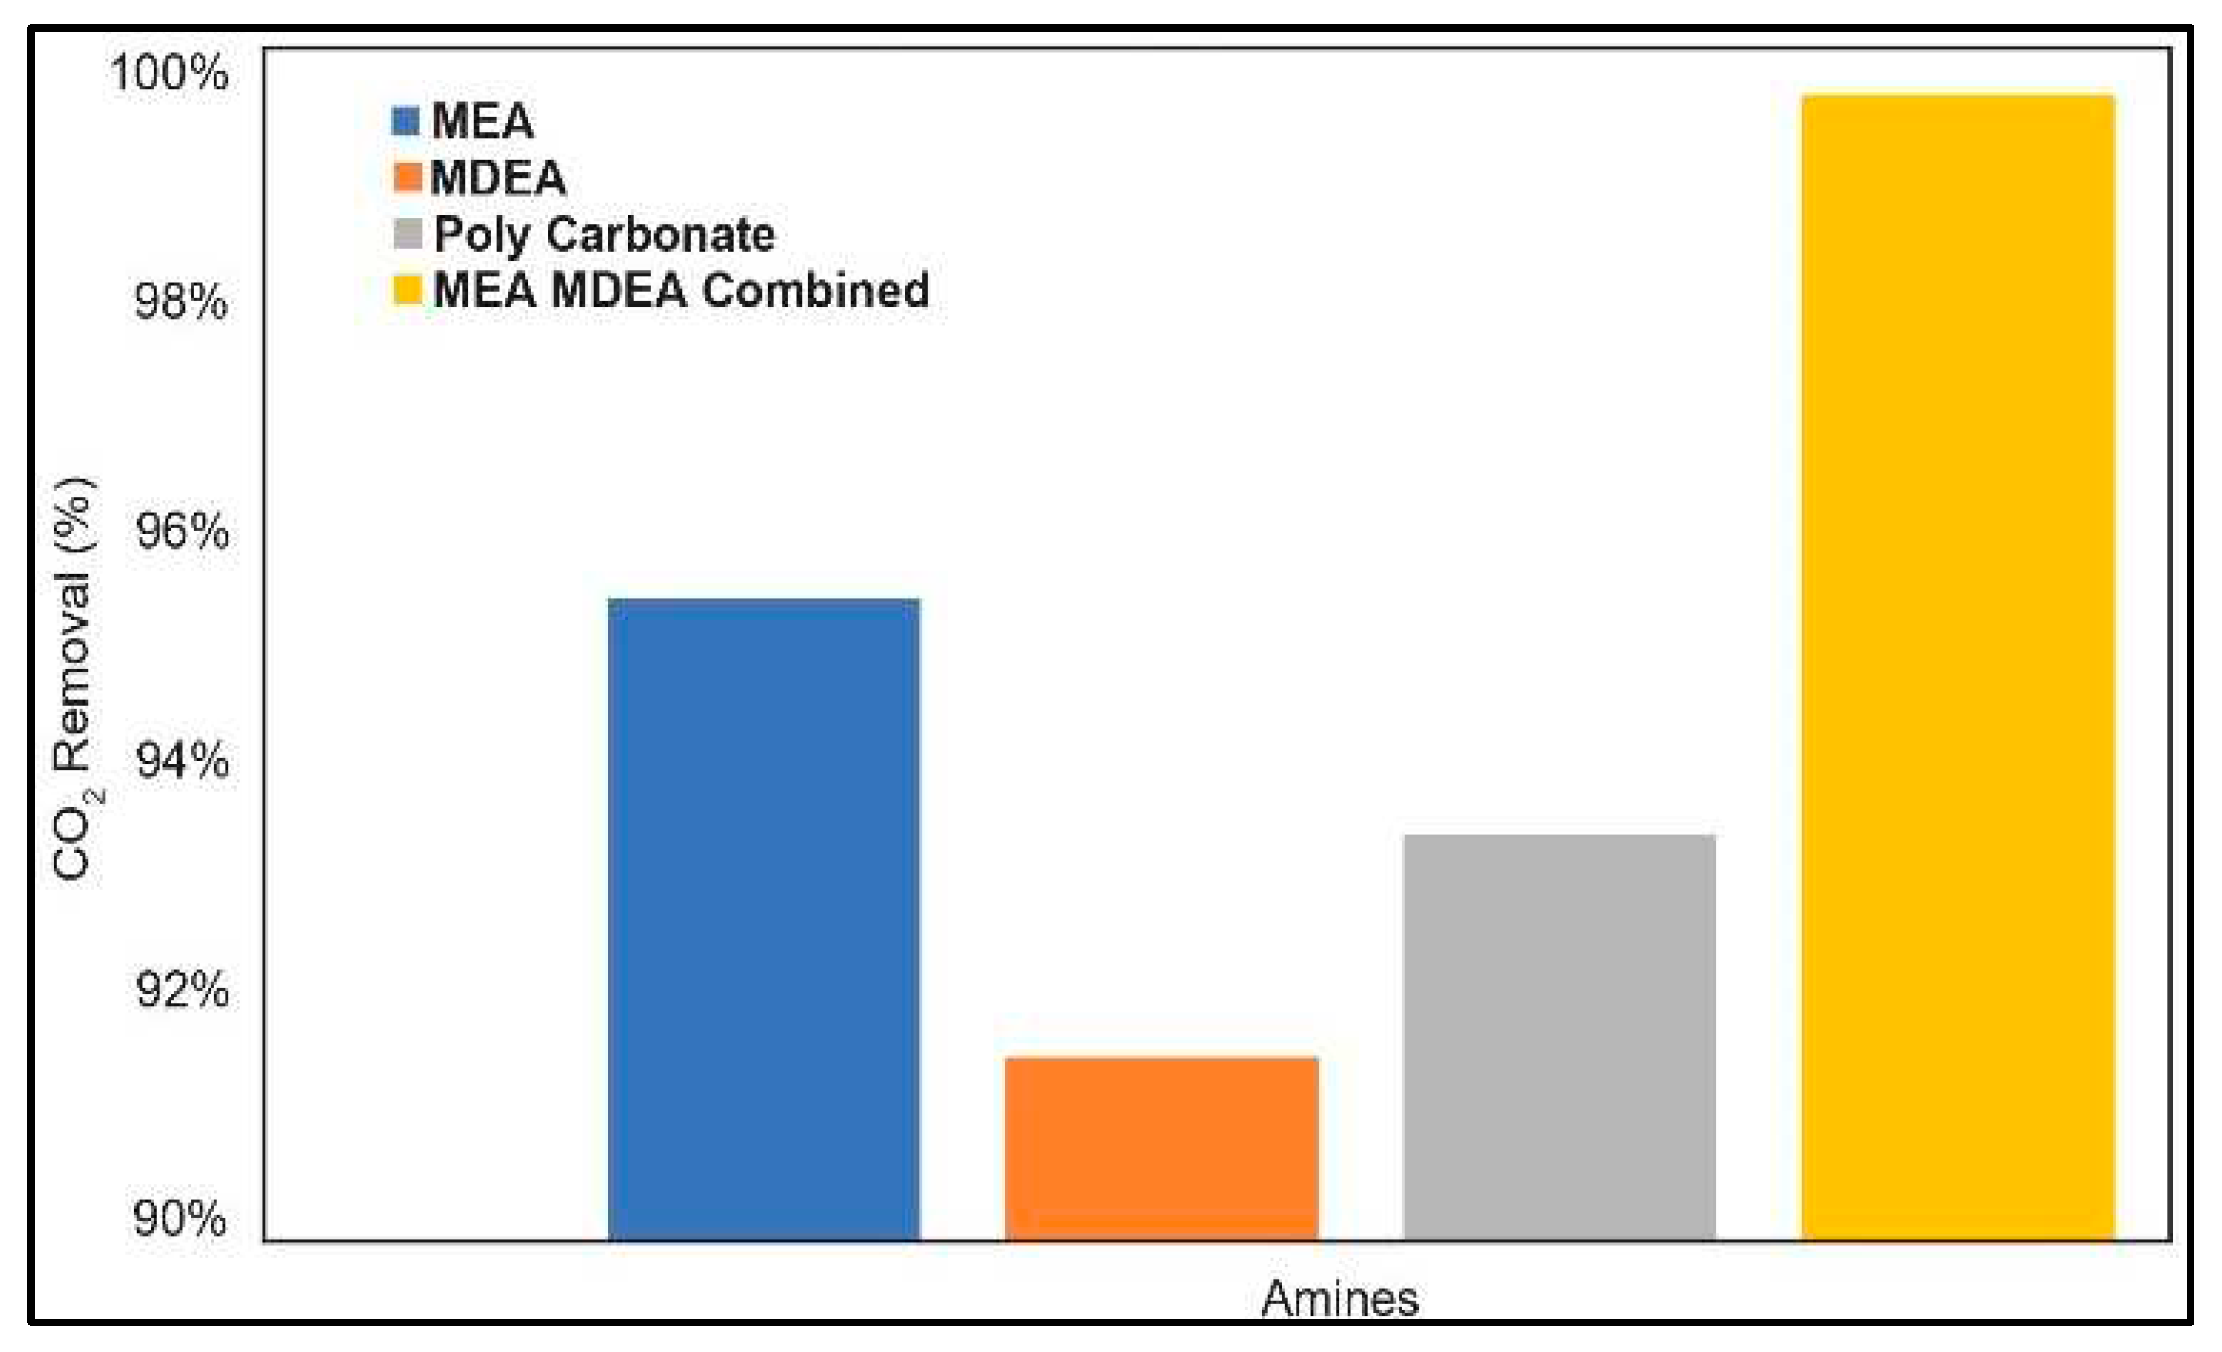
Figure 15 indicates the highest overall C O 2 removal from the flue gas that enters the absorption column using different amines (using single amine or multiple amines mixed). The plots indicates that the maximum absorption of 98.87% of the produced C O 2 in the flue gas was absorbed in the C O 2 absorber and goes out of the column as the bottom stream that previously was about only 0.37%, was achieved when a mixture of MEA and MDEA amines were used. It also gave information that a maximum of about 95.6% absorption was achieved with MEA, 93.5% with poly carbonate, and the lowest absorption among these three of 91.6% was achieved while using MDEA. Additionally, the mixture of MEA and MDEA can absorb the maximum of 100% of the C O 2 present in the flue gas entering the C O 2 capture absorption column as some of the C O 2 leaves the flue gas stream with liquid water at water separator. Other similar case studies have shown C O 2 capture from flue gas efficiency ranging from 80% to highest of 97.27% [61,89,90,91].
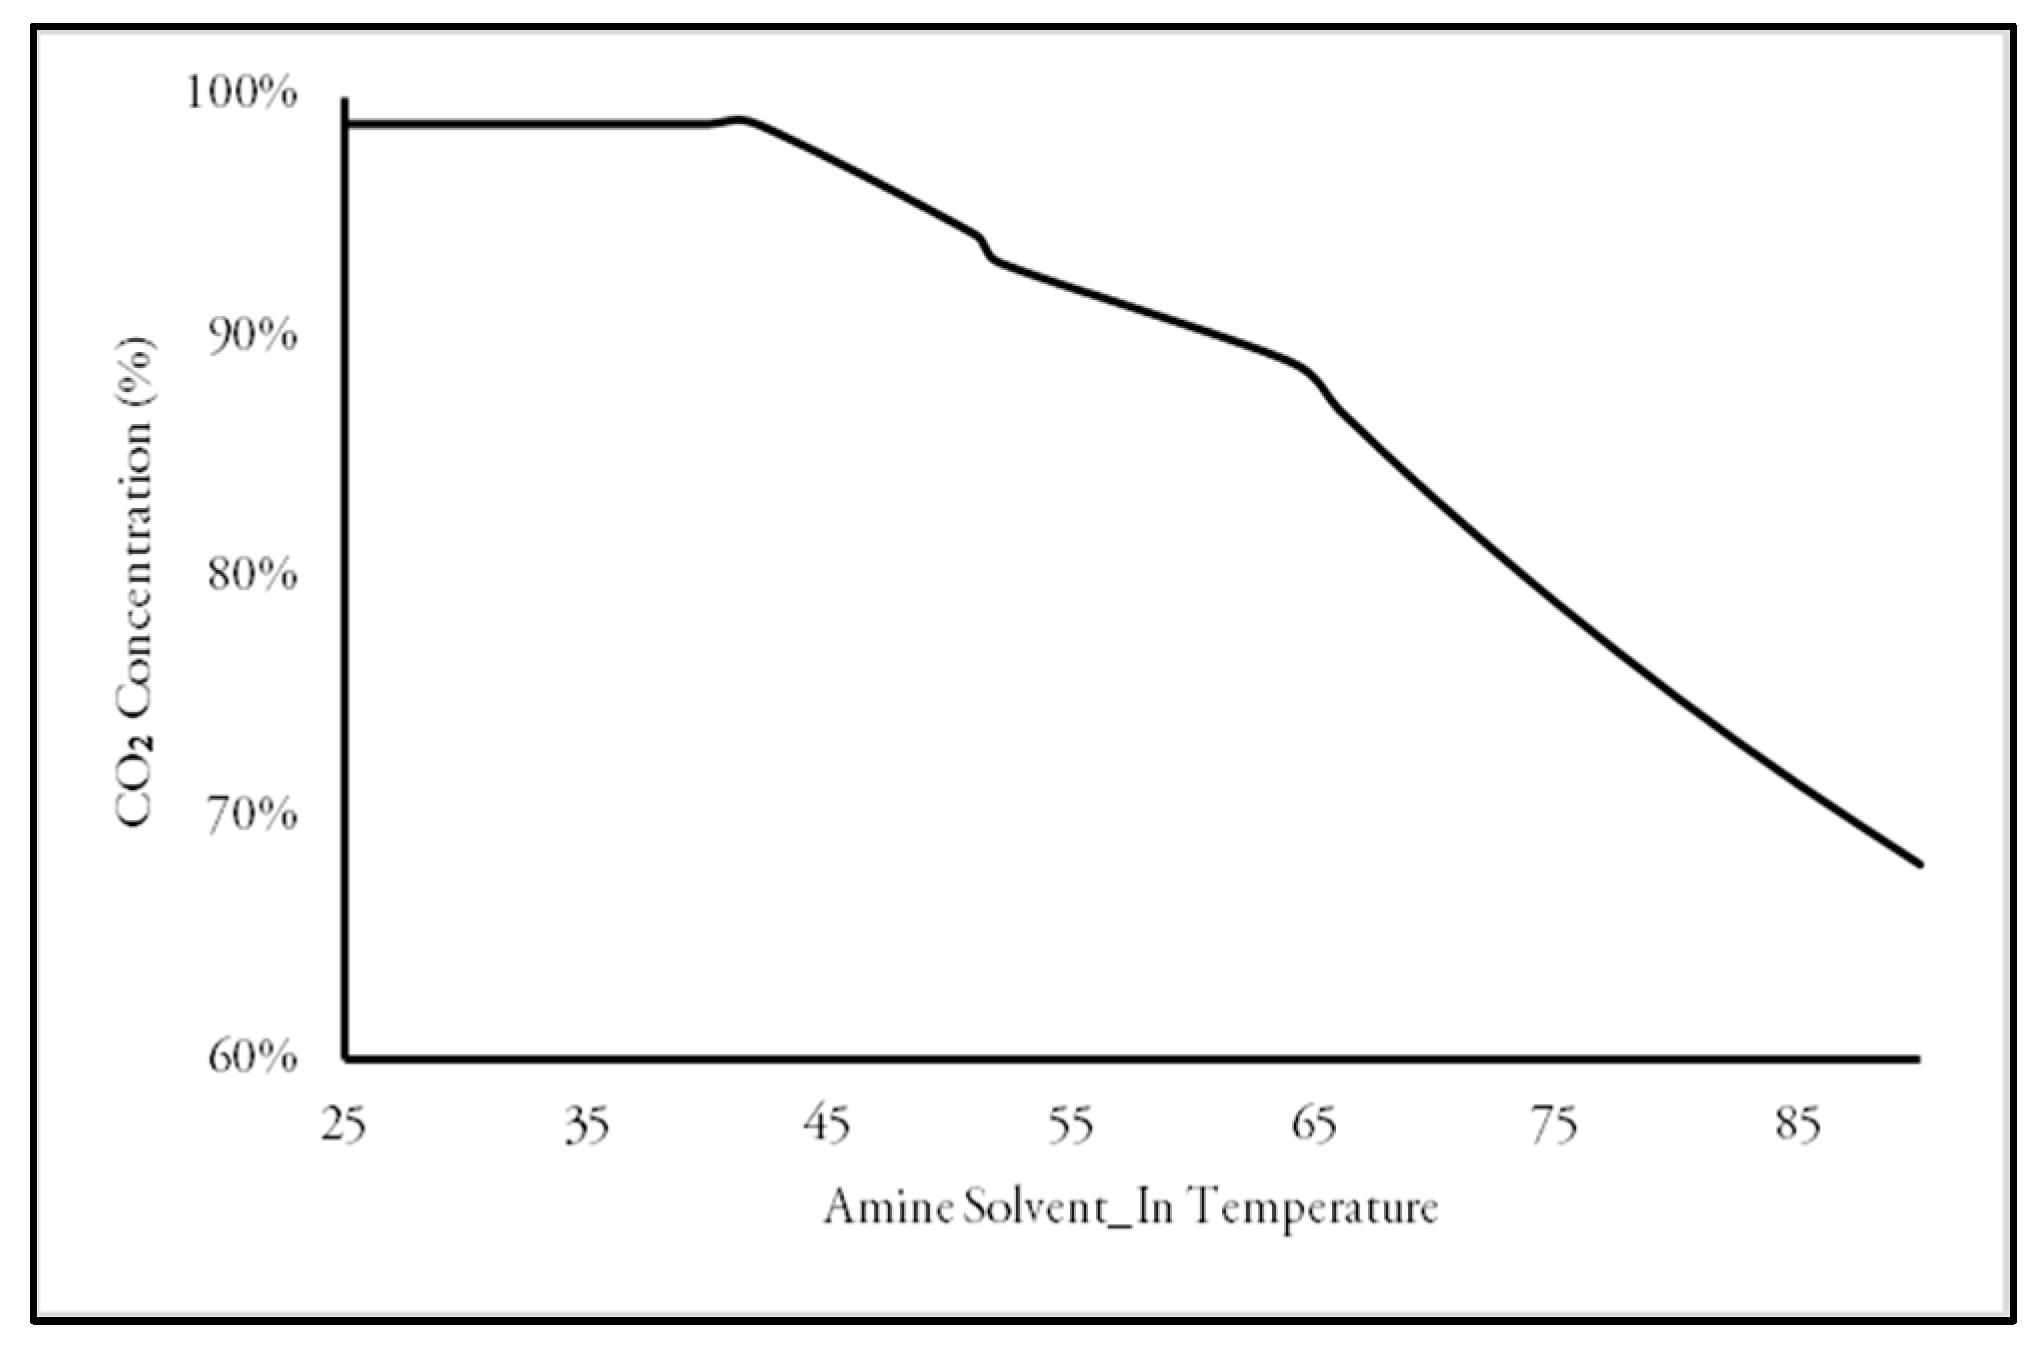
Figure 16 compares the (%) of molar concentration of the major absorbed C O 2 in the CCS liquid with the variation of the solvent inlet temperature. The plot indicates that the maximum of 98.87% of the produced C O 2 in steam reforming process was absorbed only at certain temperatures. When the solvent’s temperature exceeded that certain temperature, the C O 2 absorption efficiency decreased, and it continued with increasing solvent’s inlet temperature. Case studies revealed when the inlet temperature of the solvent was less than 50℃, the solvent absorbed the C O 2 with maximum efficiency. However, as the temperature increased, the absorption efficiency decreased gradually, 89.02% at 64℃, to finally 68.18% of total C O 2 produced at 90℃.

3.6. ASPEN Energy Analyzer

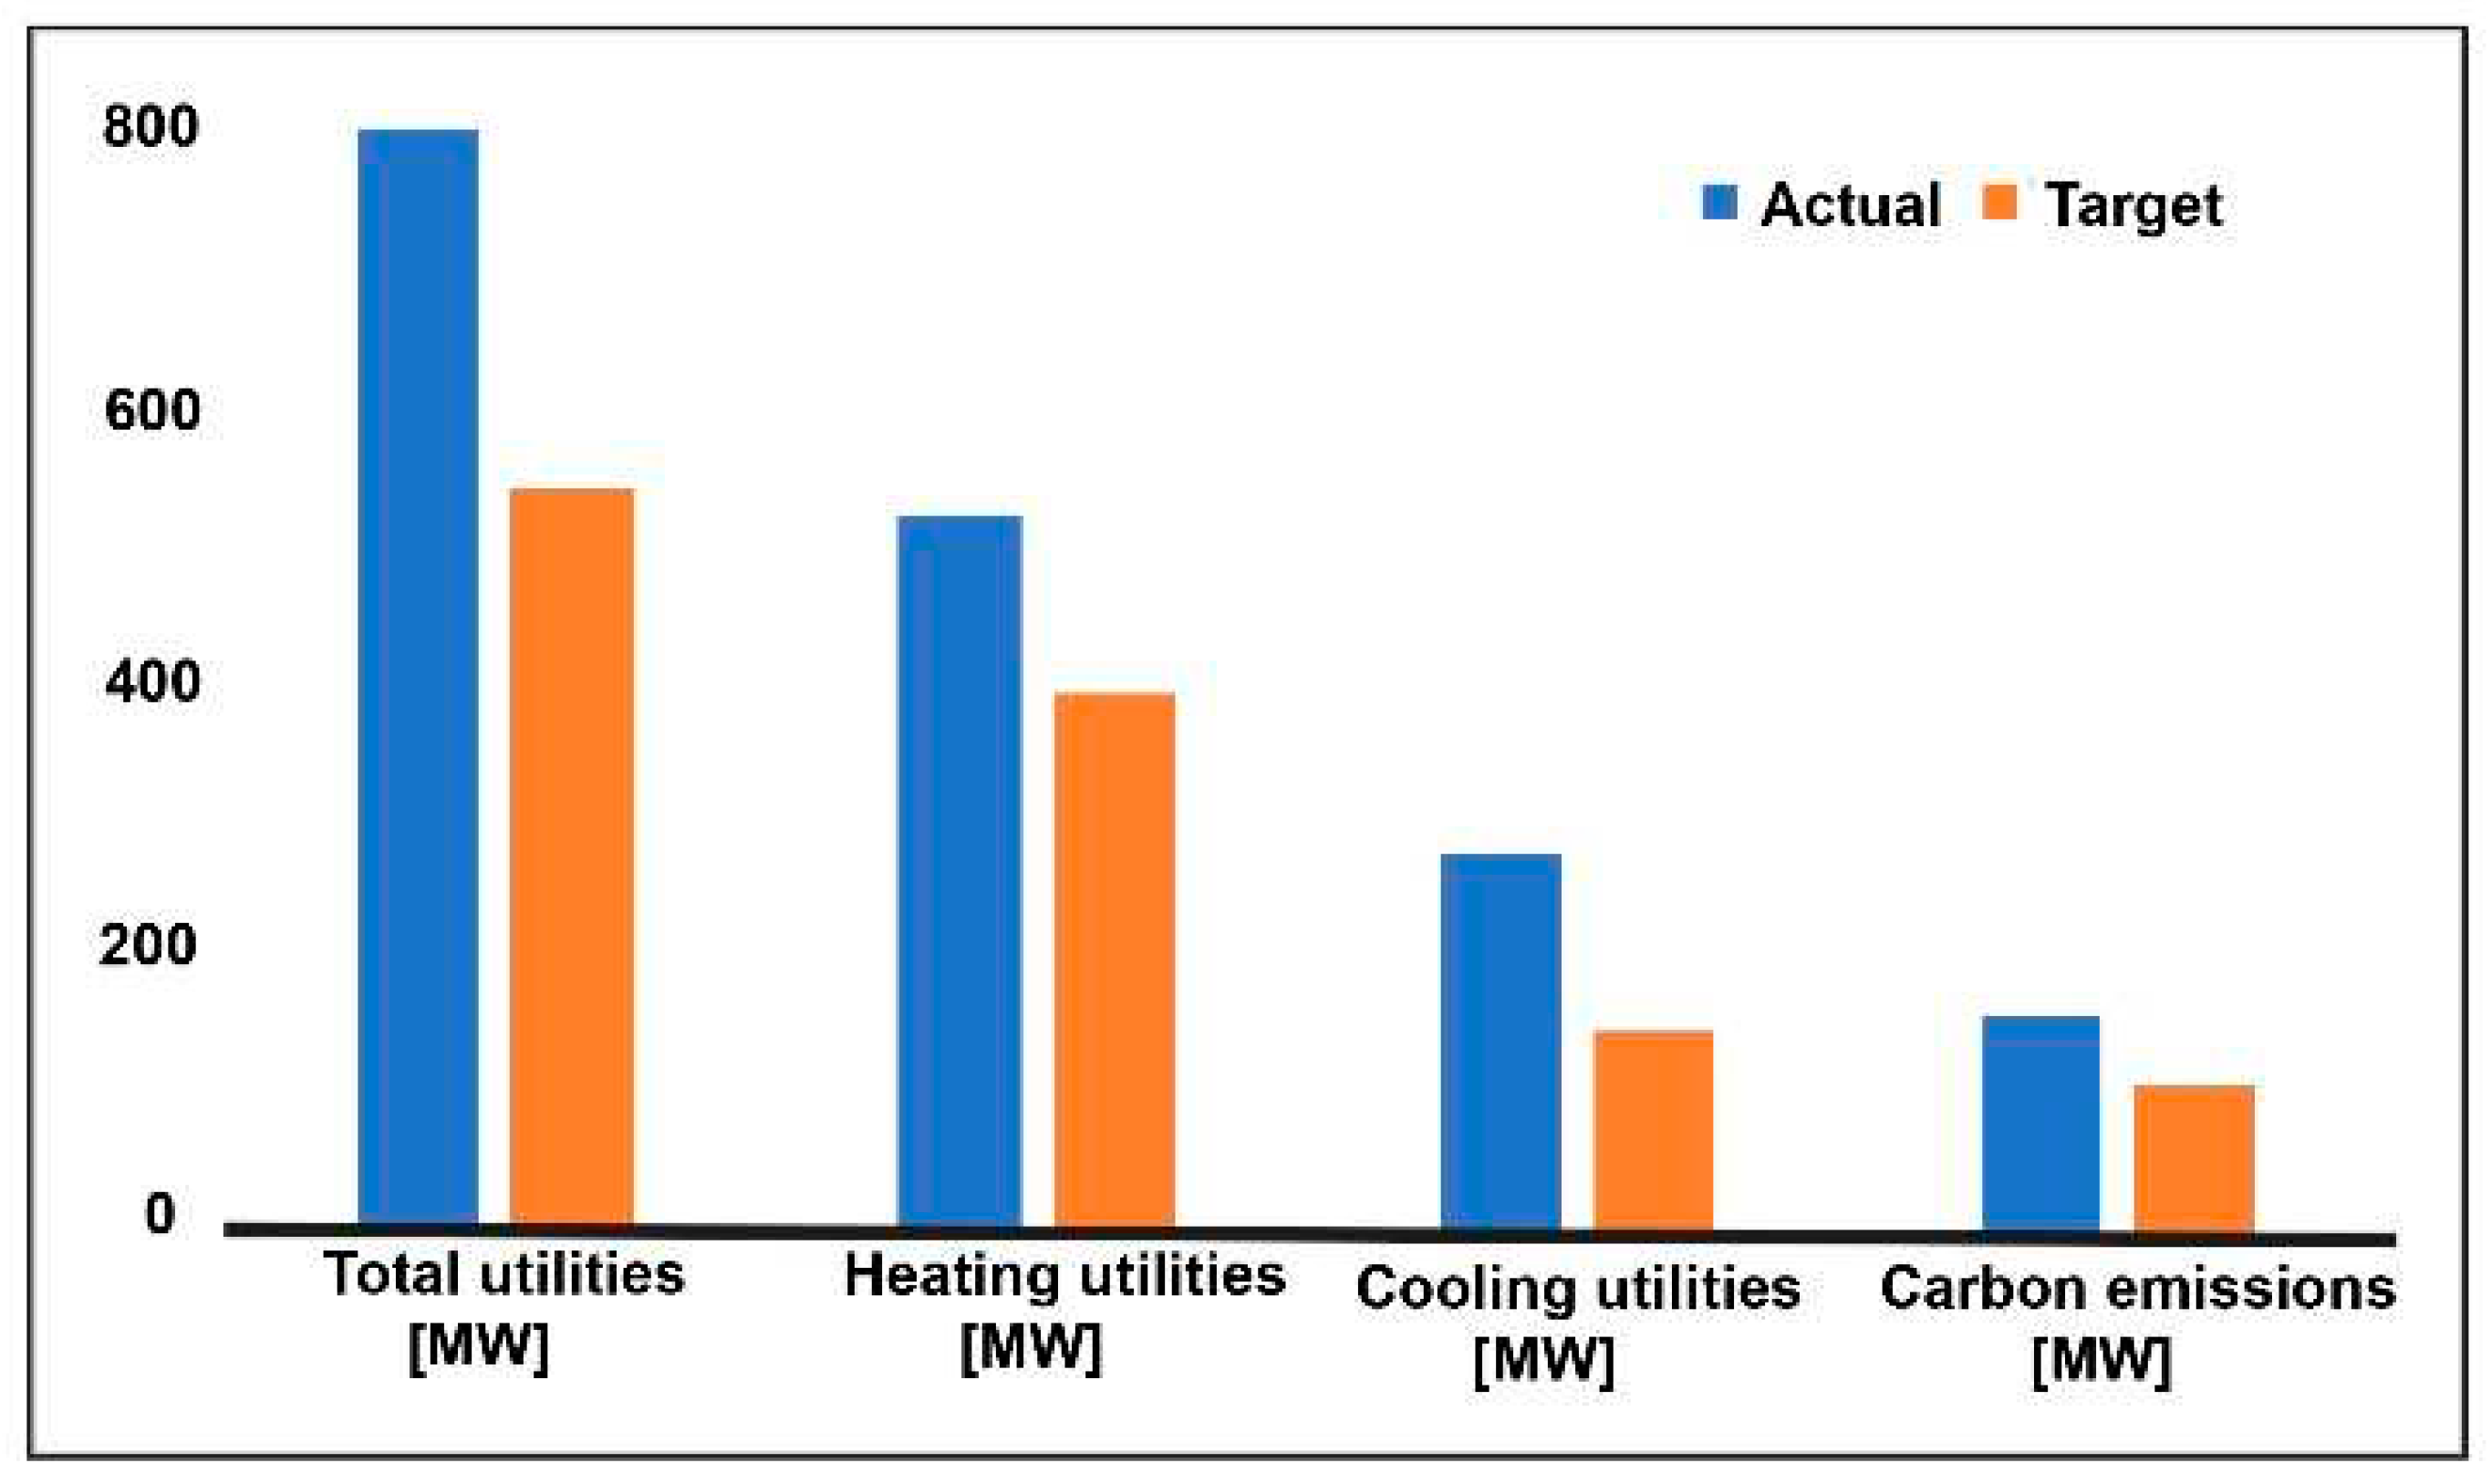
ASPEN Energy Analyzer tool uses pinch technology in all the utility to optimize the process. Figure 17 gives information about the possible scope optimization.
The figure shows that the total utility used is about 784 MW, in which hot utility is about 511.4 MW and cold utility is about 272.5 MW. It can be optimized to save about 24.9% for hot utility and 46.6% for cold utility which will be a savings of 32.43% in gross. Figure 13 also displayed that carbon emissions could be reduced from 157.7 tons/h to 106.6 tons/h which will be~ 32.44% saving in total. In addition, this process is a high energy demanding as reported in the graphical representation in Figure 13 Therefore, it is essential to optimize the process to reduce the overall production cost.

4. Conclusion

In this study, a comprehensive investigation of performed on the performance of the overall production by varying various design parameters. The study revealed that the S/C ratio significantly impacts flue gas formation and the carbon capture system. Due to the simple nature of the conversion-type reactors, the hydrogen production did not vary after reaching an equilibrium point. Moreover, the flue gas formation and C O 2 capture largely depend on the yield of reactor 1 which was revealed in a case study. Another important finding of this simulation-based investigation is how the change in process parameters affects the CCS which shows that an effective CCS depends not only on the temperature and pressure but also on the solvent itself, molar flow, and mole fraction. Case studies revealed that the temperature of the flue gas and the separation of the liquid water from the flue gas increased the overall performance of the CCS. Before the process optimization, only 0.37% of the produced C O 2 was separated from the absorber column as the bottom stream. Moreover, only 8.29% of the amine left the column as the bottom stream whereas it should have been 100% of the amine leaving with the absorbed C O 2 . Again, the temperature of the flue gas also contributes to the water content removal from the flue gas. It was also found that the high water content in the flue gas contributes to the inefficiency of the absorber column. Therefore, to make this process efficient, the flue gas needed to be cooled down (40℃) to ensure that the water is separated before it enters the absorption column. The temperature (41℃) and molar concentration (MDEA: MEA= 0.4: 0.6) of the amine solvent are also vital in an efficient CCS. The effect of using a mixture of two amines enhanced the overall carbon capture process. The pinch analysis and Aspen energy analyzer revealed that the process can be optimized and thus the overall cost can be reduced.

Author Contributions

Conceptualization, A. N. S; methodology- A.N.S and A.T.S.; software- A.N.S., A.T.S. validation, A.N.S, M.F.A, A. T. S. ; formal analysis-, A.N.S. and A. T. S. ; data cu-ration, A.N. S. and A. T.S.; writing—original draft preparation, A.N. S. and A. T. S.; writing—review and editing, A.N.S., A.T.S. visualization, A.T.S. and M.F.A.; supervision, A. N.S., and M. F. A.; All authors have read and agreed to the published version of the manuscript.

Funding

This research received no external funding.

Conflicts of Interest

The authors declare no conflict of interest.

Appendix A

Nomenclature
SMR Steam Methane Reforming
LHV Lower Heating Value
MDEA Methyl Diethanolamine
DEA Diethanolamine
MEA Mono Ethanolamine
CCS Carbon Capture and Storage
PCC Post Combustion Capture
PA Pinch Analysis
WGS Water Gas Shift
COP Climate Change Conference of Parties
DGA Diglycolamine
DIPA Di-isopropanolamine
PZ Piperazine
TEA Triethanolamine

References

  1. Asadi, J.; Kazempoor, P. Techno-economic analysis of membrane-based processes for flexible CO2 capturing from power plants. Energy Convers Manag. 2021, 246, 114633. [Google Scholar] [CrossRef]
  2. Hossain, M.R.; Khatun, A.A.; Ahmed, M.F.; Faroque, M.O.; Sobahan, M.A. Experimental Behavior of Bituminous Mixes with Waste Concrete Aggregate Experimental Behavior of Bituminous Mixes with Waste Concrete Aggregate. 2020, 9, 31–50.
  3. The Intergovernmental Panel on Climate Change (IPCC). Global Warming of 1.5 oC. Published 2018. Available online: https://www.ipcc.ch/sr15/ (accessed on 25 December 2022).
  4. Fetisov, V.; Gonopolsky, A.M.; Zemenkova, M.Y.; et al. On the Integration of CO2 Capture Technologies for an Oil Refinery. Energies (Basel). 2023, 16, 865. [Google Scholar] [CrossRef]
  5. Felseghi, R.A.; Carcadea, E.; Raboaca, M.S.; TRUFIN, C.N.; Filote, C. Hydrogen Fuel Cell Technology for the Sustainable Future of Stationary Applications. Energies (Basel). 2019, 12, 4593. [Google Scholar] [CrossRef]
  6. Khojasteh Salkuyeh, Y.; Saville, B.A.; MacLean, H.L. Techno-economic analysis and life cycle assessment of hydrogen production from natural gas using current and emerging technologies. Int J Hydrogen Energy. 2017, 42, 18894–18909. [Google Scholar] [CrossRef]
  7. International Energy Agency. Putting CO2 to Use- Creating Value from Emissions; 2019. [Google Scholar]
  8. RENEE CHO. Capturing Carbon’s Potential: These Companies Are Turning CO2 into Profits. State of Planet, Columbia Climate School. May 29, 2019. 29 May.
  9. Ahmed, F.; Hutton-prager, B. Influence of Bulk and Surface Interactions from Thick, Porous, Soil-based Substrates on the Spreading Behavior of Different Viscosity Oils. Environmental Challenges. 2021, 3, 100045. [Google Scholar] [CrossRef]
  10. Chakraborty, S.C.; Qamruzzaman, M.; Zaman, M.W.U.; et al. Metals in e-waste: Occurrence, fate, impacts and remediation technologies. Process Safety and Environmental Protection 2022. [Google Scholar] [CrossRef]
  11. Jolaoso, L.; Zaman, S.F. Catalytic Ammonia Decomposition for Hydrogen Production: Utilization of Ammonia in a Fuel Cell. In: Inamuddin, Boddula, R.; Asiri, A.M.; eds. Sustainable Ammonia Production. Springer International Publishing; 2020; pp. 81-105. [CrossRef]
  12. U.S. Department of Energy. Hydrogen Production and Distribution | Alternative Fuels Data Center. Available online: https://afdc.energy.gov/fuels/hydrogen_production.html (accessed on 31 December 2022).
  13. Clean Hydrogen Partnership, European Union. Hydrogen Roadmap Europe: A Sustainable Pathway for the European Energy Transition. Published 2019. Available online: https://www.h2haul.eu.
  14. Fuel Cell & Hydrogen Energy Association (FCHEA). US. Road Map to a US Hydrogen Economy: Reducing Emissions and Driving Growth Across the Nation. Published 2019. Available online: www.fchea.org.
  15. Gummer, J. Hydrogen in a Low-Carbon Economy. Committee on Climate Change. Published 2018. Available online: https://www.thecec.org.uk/wp-content/%20uploads/2018/11/Hydrogen-in-a-low-carbon-economy.
  16. Bruce, S. National Hydrogen Roadmap- Pathways to an Economically Sustainable Hydrogen Industry in Australia. AUSTRALIA’S NATIONAL SCIENCE AGENCY. Published 2018. Available online: https://www.csiro.au.
  17. BMWi, Federal Ministry of Education and Research. The National Hydrogen Strategy: The Federal Government. Published 2021. Available online: https://www.bmbf.de/files/bmwi_Nationale%20Wasserstoffstrategie_Eng_s01.pdf.
  18. IEA. The Future of Hydrogen: Seizing Today’s Opportunities. International Energy Agency. Published 2019. Available online: https://www.iea.org.
  19. Amran, U.I.; Ahmad, A.; Othman, M.R. Kinetic based simulation of methane steam reforming and water gas shift for hydrogen production using aspen plus. Chem Eng Trans. 2017, 56, 1681–1686. [Google Scholar]
  20. Zamaniyan, A.; Behroozsarand, A.; Ebrahimi, H. Modeling and simulation of large scale hydrogen production. J Nat Gas Sci Eng. 2010, 2, 293–301. [Google Scholar] [CrossRef]
  21. Department of Energy. Fact of the month May 2018: 10 million metric tons of hydrogen produced annually in the United States. Published May 2018. Available online: https://www.energy.gov/eere/fuelcells/fact-month-may-2018-10-million-metric-tons-hydrogen-produced-annually-united-states (accessed on 31 December 2022).
  22. Kumar, A.; Singh, R.; Sinha, A.S.K. Catalyst modification strategies to enhance the catalyst activity and stability during steam reforming of acetic acid for hydrogen production. Int J Hydrogen Energy. 2019, 44, 12983–13010. [Google Scholar] [CrossRef]
  23. Shiva Kumar, S.; Himabindu, V. Hydrogen production by PEM water electrolysis – A review. Mater Sci Energy Technol. 2019, 2, 442–454. [Google Scholar] [CrossRef]
  24. Chi, J.; Yu, H. Water electrolysis based on renewable energy for hydrogen production. Chinese Journal of Catalysis. 2018, 39, 390–394. [Google Scholar] [CrossRef]
  25. Oliveira, A.M.; Beswick, R.R.; Yan, Y. A green hydrogen economy for a renewable energy society. Curr Opin Chem Eng. 2021, 33, 100701. [Google Scholar] [CrossRef]
  26. Jolaoso, L.A.; Asadi, J.; Duan, C.; Kazempoor, P. A novel green hydrogen production using water-energy nexus framework. Energy Convers Manag. 2023, 276. [Google Scholar] [CrossRef]
  27. Pruvost, F.; Cloete, S.; Arnaiz del Pozo, C.; Zaabout, A. Blue, green, and turquoise pathways for minimizing hydrogen production costs from steam methane reforming with CO2 capture. Energy Convers Manag. 2022, 274, 116458. [Google Scholar] [CrossRef]
  28. National Energy Technology Laboratory (NETL), Mission Execution and Strategic Analysis (MESA). COST AND PERFORMANCE BASELINE FOR FOSSIL ENERGY PLANTS VOLUME 1: BITUMINOUS COAL AND NATURAL GAS TO ELECTRICITY; 2019. [Google Scholar]
  29. Jiang, Y.; Mathias, P.M.; Freeman, C.J.; et al. Techno-economic comparison of various process configurations for post-combustion carbon capture using a single-component water-lean solvent. International Journal of Greenhouse Gas Control. 2021, 106, 103279. [Google Scholar] [CrossRef]
  30. DISSANAYAKE, D. Partial oxidation of methane to carbon monoxide and hydrogen over a Ni/Al2O3 catalyst. J Catal. 1991, 132, 117–127. [Google Scholar] [CrossRef]
  31. Alejo, L.; Lago, R.; Peña, M.A.; Fierro, J.L.G. Partial oxidation of methanol to produce hydrogen over CuZn-based catalysts. Appl Catal A Gen. 1997, 162, 281–297. [Google Scholar] [CrossRef]
  32. Ge, Z.; Guo, S.; Guo, L.; Cao, C.; Su, X.; Jin, H. Hydrogen production by non-catalytic partial oxidation of coal in supercritical water: Explore the way to complete gasification of lignite and bituminous coal. Int J Hydrogen Energy. 2013, 38, 12786–12794. [Google Scholar] [CrossRef]
  33. ONOZAKI, M.; WATANABE, K.; HASHIMOTO, T.; SAEGUSA, H.; KATAYAMA, Y. Hydrogen production by the partial oxidation and steam reforming of tar from hot coke oven gas. Fuel. 2006, 85, 143–149. [Google Scholar] [CrossRef]
  34. George Thomas, George Parks. Potential Roles of Ammonia in a Hydrogen Economy.; 2006.
  35. Barelli, L.; Bidini, G.; Gallorini, F.; Servili, S. Hydrogen production through sorption-enhanced steam methane reforming and membrane technology: A review. Energy. 2008, 33, 554–570. [Google Scholar] [CrossRef]
  36. Nahar, G.; Mote, D.; Dupont, V. Hydrogen production from reforming of biogas: Review of technological advances and an Indian perspective. Renewable and Sustainable Energy Reviews. 2017, 76, 1032–1052. [Google Scholar] [CrossRef]
  37. Pandey, B.; Prajapati, Y.K.; Sheth, P.N. Recent progress in thermochemical techniques to produce hydrogen gas from biomass: A state of the art review. Int J Hydrogen Energy. 2019, 44, 25384–25415. [Google Scholar] [CrossRef]
  38. Mishra, P.; Krishnan, S.; Rana, S.; Singh, L.; Sakinah, M.; Ab Wahid, Z. Outlook of fermentative hydrogen production techniques: An overview of dark, photo and integrated dark-photo fermentative approach to biomass. Energy Strategy Reviews. 2019, 24, 27–37. [Google Scholar] [CrossRef]
  39. Wang, J.; Yin, Y. Fermentative hydrogen production using various biomass-based materials as feedstock. Renewable and Sustainable Energy Reviews. 2018, 92, 284–306. [Google Scholar] [CrossRef]
  40. Kadier, A.; Kalil, M.S.; Abdeshahian, P.; et al. Recent advances and emerging challenges in microbial electrolysis cells (MECs) for microbial production of hydrogen and value-added chemicals. Renewable and Sustainable Energy Reviews. 2016, 61, 501–525. [Google Scholar] [CrossRef]
  41. Basheer, A.A.; Ali, I. Water photo splitting for green hydrogen energy by green nanoparticles. Int J Hydrogen Energy. 2019, 44, 11564–11573. [Google Scholar] [CrossRef]
  42. Velazquez Abad, A.; Dodds, P.E. Production of Hydrogen. In Encyclopedia of Sustainable Technologies; Elsevier, 2017; pp. 293–304. [Google Scholar] [CrossRef]
  43. Kothari, R.; Buddhi, D.; Sawhney, R.L. Comparison of environmental and economic aspects of various hydrogen production methods. Renewable and Sustainable Energy Reviews. 2008, 12, 553–563. [Google Scholar] [CrossRef]
  44. Syed, M.B. Technologies for renewable hydrogen production. In Bioenergy Resources and Technologies; Elsevier, 2021; pp. 157–198. [Google Scholar] [CrossRef]
  45. van Twigg, M. Catalyst Handbook; Routledge, 2018. [Google Scholar] [CrossRef]
  46. National Oceanic and Atmospheric Administration (NOAA). Ocean Acidification. U.S. Department of Commerce.
  47. Renjie Shao, Aage Stangeland. Amines Used in CO2 Capture - Health and Environmental Impacts.; 2009.
  48. Mathews, J.A. Carbon-negative biofuels. Energy Policy. 2008, 36, 940–945. [Google Scholar] [CrossRef]
  49. Wilberforce, T.; Olabi, A.G.; Sayed, E.T.; Elsaid, K.; Abdelkareem, M.A. Progress in carbon capture technologies. Science of The Total Environment. 2021, 761, 143203. [Google Scholar] [CrossRef]
  50. Dincer, I.; Acar, C. Review and evaluation of hydrogen production methods for better sustainability. Int J Hydrogen Energy. 2015, 40, 11094–11111. [Google Scholar] [CrossRef]
  51. Budinis, S.; Krevor, S.; Dowell, N.; Brandon, N.; Hawkes, A. An assessment of CCS costs, barriers and potential. Energy Strategy Reviews. 2018, 22, 61–81. [Google Scholar] [CrossRef]
  52. Rostrup-Nielsen, J.R. Catalytic Steam Reforming. 1984; 1-117. [CrossRef]
  53. Christensen, K.O.; Chen, D.; Lødeng, R.; Holmen, A. Effect of supports and Ni crystal size on carbon formation and sintering during steam methane reforming. Appl Catal A Gen. 2006, 314, 9–22. [Google Scholar] [CrossRef]
  54. Collodi, G.; Azzaro, G.; Ferrari, N.; Santos, S. Techno-economic Evaluation of Deploying CCS in SMR Based Merchant H2 Production with NG as Feedstock and Fuel. Energy Procedia. 2017, 114, 2690–2712. [Google Scholar] [CrossRef]
  55. Meerman, J.C.; Hamborg, E.S.; van Keulen, T.; Ramírez, A.; Turkenburg, W.C.; Faaij, A.P.C. Techno-economic assessment of CO2 capture at steam methane reforming facilities using commercially available technology. International Journal of Greenhouse Gas Control. 2012, 9, 160–171. [Google Scholar] [CrossRef]
  56. Hacarlioglu, P.; Gu, Y.; Oyama, S.T. Studies of the Methane Steam Reforming Reaction at High Pressure in a Ceramic Membrane Reactor. Journal of Natural Gas Chemistry. 2006, 15, 73–81. [Google Scholar] [CrossRef]
  57. Oh, S.Y.; Binns, M.; Cho, H.; Kim, J.K. Energy minimization of MEA-based CO2 capture process. Appl Energy. 2016, 169, 353–362. [Google Scholar] [CrossRef]
  58. Hanak, D.P.; Biliyok, C.; Yeung, H.; Białecki, R. Heat integration and exergy analysis for a supercritical high-ash coal-fired power plant integrated with a post-combustion carbon capture process. Fuel. 2014, 134, 126–139. [Google Scholar] [CrossRef]
  59. Asadi, J.; Jolaoso, L.; Kazempoor, P. Efficiency And Flexibility Improvement of Amine-Based Post Combustion CO2 Capturing System (CCS) in Full and Partial Loads. In Proceedings of the ASME 2022 16th International Conference on Energy Sustainability ES 2022; 2022. [Google Scholar] [CrossRef]
  60. Choi, J.; Cho, H.; Yun, S.; et al. Process design and optimization of MEA-based CO2 capture processes for non-power industries. Energy. 2019, 185, 971–980. [Google Scholar] [CrossRef]
  61. Chai, S.Y.W.; Ngu, L.H.; How, B.S. Review of carbon capture absorbents for CO 2 utilization. Greenhouse Gases: Science and Technology. 2022, 12, 394–427. [Google Scholar] [CrossRef]
  62. Yu, C.H.; Huang, C.H.; Tan, C.S. A Review of CO2 Capture by Absorption and Adsorption. Aerosol Air Qual Res. 2012, 12, 745–769. [Google Scholar] [CrossRef]
  63. Wang, M.; Lawal, A.; Stephenson, P.; Sidders, J.; Ramshaw, C. Post-combustion CO2 capture with chemical absorption: A state-of-the-art review. Chemical Engineering Research and Design. 2011, 89, 1609–1624. [Google Scholar] [CrossRef]
  64. Budinis, S.; Krevor, S.; Dowell, N.M.; Brandon, N.; Hawkes, A. An assessment of CCS costs, barriers and potential. Energy Strategy Reviews. 2018, 22, 61–81. [Google Scholar] [CrossRef]
  65. Rossiter, A.P.; Jones, B.P. ENERGY MANAGEMENT AND EFFICIENCY FOR THE PROCESS INDUSTRIES; American Institute of Chemical Engineers and John Wiley & Sons, Inc, 2015. [Google Scholar]
  66. Jaber, O.; Naterer, G.F.; Dincer, I. Natural gas usage as a heat source for integrated SMR and thermochemical hydrogen production technologies. Int J Hydrogen Energy. 2010, 35, 8569–8579. [Google Scholar] [CrossRef]
  67. Hamdy, L.B.; Goel, C.; Rudd, J.A.; Barron, A.R.; Andreoli, E. The application of amine-based materials for carbon capture and utilisation: An overarching view. Mater Adv. 2021, 2, 5843–5880. [Google Scholar] [CrossRef]
  68. Aspen Technology. Inc. Aspen Tech®. Top 10 Questions About Acid Gas Removal Optimization With Aspen HYSYS®. Published 2018. Available online: https://www.aspentech.com (accessed on 31 December 2022).
  69. Yang, G.; Fan, Z.; Li, X. Determination of confined fluid phase behavior using extended Peng-Robinson equation of state. Chemical Engineering Journal. 2019, 378, 122032. [Google Scholar] [CrossRef]
  70. Aminian, A.; Celný, D.; Mickoleit, E.; Jäger, A.; Vinš, V. Ideal Gas Heat Capacity and Critical Properties of HFE-Type Engineering Fluids: Ab Initio Predictions of Cpig, Modeling of Phase Behavior and Thermodynamic Properties Using Peng–Robinson and Volume-Translated Peng–Robinson Equations of State. Int J Thermophys. 2022, 43, 87. [Google Scholar] [CrossRef]
  71. Maciá, E.; Marie Dubois, J.; Ann Thiel, P. Quasicrystals. In Ullmann’s Encyclopedia of Industrial Chemistry; Wiley-VCH Verlag GmbH & Co. KGaA, 2008. [Google Scholar] [CrossRef]
  72. Wu, J.; Zhu, X.; Yang, F.; Ge, T.; Wang, R. Easily-synthesized and low-cost amine-functionalized silica sol-coated structured adsorbents for CO2 capture. Chemical Engineering Journal. 2021, 425, 131409. [Google Scholar] [CrossRef]
  73. Bollas, G.M.; Chen, C.C.; Barton, P.I. Refined electrolyte-NRTL model: Activity coefficient expressions for application to multi-electrolyte systems. AIChE Journal. 2008, 54, 1608–1624. [Google Scholar] [CrossRef]
  74. Aspen Technology Inc. AspenHYSYS. Aspen HYSYS V12.1 User Guide; 2017. [Google Scholar]
  75. Priya, G.S.K.; Bandyopadhyay, S. Multiple objectives Pinch Analysis. Resour Conserv Recycl. 2017, 119, 128–141. [Google Scholar] [CrossRef]
  76. Santanu Bandyopadhyay. Mathematical Foundation of Pinch Analysis. Chem Eng Trans. 2015, 45, 1753–1758. [Google Scholar]
  77. ProSim S& S in, P.S. PINCH ANALYSIS. Available online: https://www.prosim.net/en/engineering-services/pinch-analysis/ (accessed on 31 December 2022).
  78. Fahim, M.A.; Alsahhaf, T.A.; Elkilani, A. Hydrogen Production. In Fundamentals of Petroleum Refining; Elsevier, 2010; pp. 285–302. [Google Scholar] [CrossRef]
  79. Song, K.; Lee, C.J.; Jeon, J.; Han, C. Dynamic simulation of natural gas liquefaction process. 2012, 882-886. [CrossRef]
  80. Alexander, H. Penn. Reactions in HYSYS. Rice University Chemical Engineering Department.
  81. Kamaruddin, M.; Hamid, A. HYSYS ® : An Introduction to Chemical Engineering Simulation For UTM Degree++ Program. Available online: http://www.fkkksa.utm.my/staff/kamaruddin.
  82. Masiren, E.E.; Harun, N.; W. Ibrahim, W.H.; Adam, F. Effect of Temperature on Diffusivity of Monoethanolamine (MEA) on Absorption Process for CO2 Capture. International Journal of Engineering Technology and Sciences. 2016, 3, 43–51. [Google Scholar] [CrossRef]
  83. Wang, M.; Wang, M.; Rao, N.; Li, J.; Li, J. Enhancement of CO 2 capture performance of aqueous MEA by mixing with [NH 2 e-mim][BF 4]. RSC Adv. 2018, 8, 1987–1992. [Google Scholar] [CrossRef] [PubMed]
  84. Liang, Z.; Fu, K.; Idem, R.; Tontiwachwuthikul, P. Review on current advances, future challenges and consideration issues for post-combustion CO2 capture using amine-based absorbents. Chin J Chem Eng. 2016, 24, 278–288. [Google Scholar] [CrossRef]
  85. ’Plaza, J.M. Modeling of Carbon Dioxide Absorption using Aqueous Monoethanolamine, Piperazine and Promoted Potassium Carbonate. Doctoral dissertation. Published online May 2012.
  86. van Straelen, J.; Geuzebroek, F.; Goodchild, N.; Protopapas, G.; Mahony, L. CO2 capture for refineries, a practical approach. Energy Procedia. 2009, 1, 179–185. [Google Scholar] [CrossRef]
  87. Bahadori, A. Natural Gas Sweetening. In Natural Gas Processing; Elsevier, 2014; pp. 483–518. [Google Scholar] [CrossRef]
  88. Earthworks. Hydrogen Sulfide. Published 2023. Available online: https://earthworks.org/issues/hydrogen-sulfide/.
  89. Wang, M.; Rahimi, M.; Kumar, A.; Hariharan, S.; Choi, W.; Hatton, T.A. Flue gas CO2 capture via electrochemically mediated amine regeneration: System design and performance. Appl Energy. 2019, 255, 113879. [Google Scholar] [CrossRef]
  90. Jiang, N.; Shen, Y.; Liu, B.; et al. CO2 capture from dry flue gas by means of VPSA, TSA and TVSA. Journal of CO2 Utilization. 2020, 35, 153–168. [Google Scholar] [CrossRef]
  91. Knudsen, J.N.; Jensen, J.N.; Vilhelmsen, P.J.; Biede, O. Experience with CO2 capture from coal flue gas in pilot-scale: Testing of different amine solvents. Energy Procedia. 2009, 1, 783–790. [Google Scholar] [CrossRef]
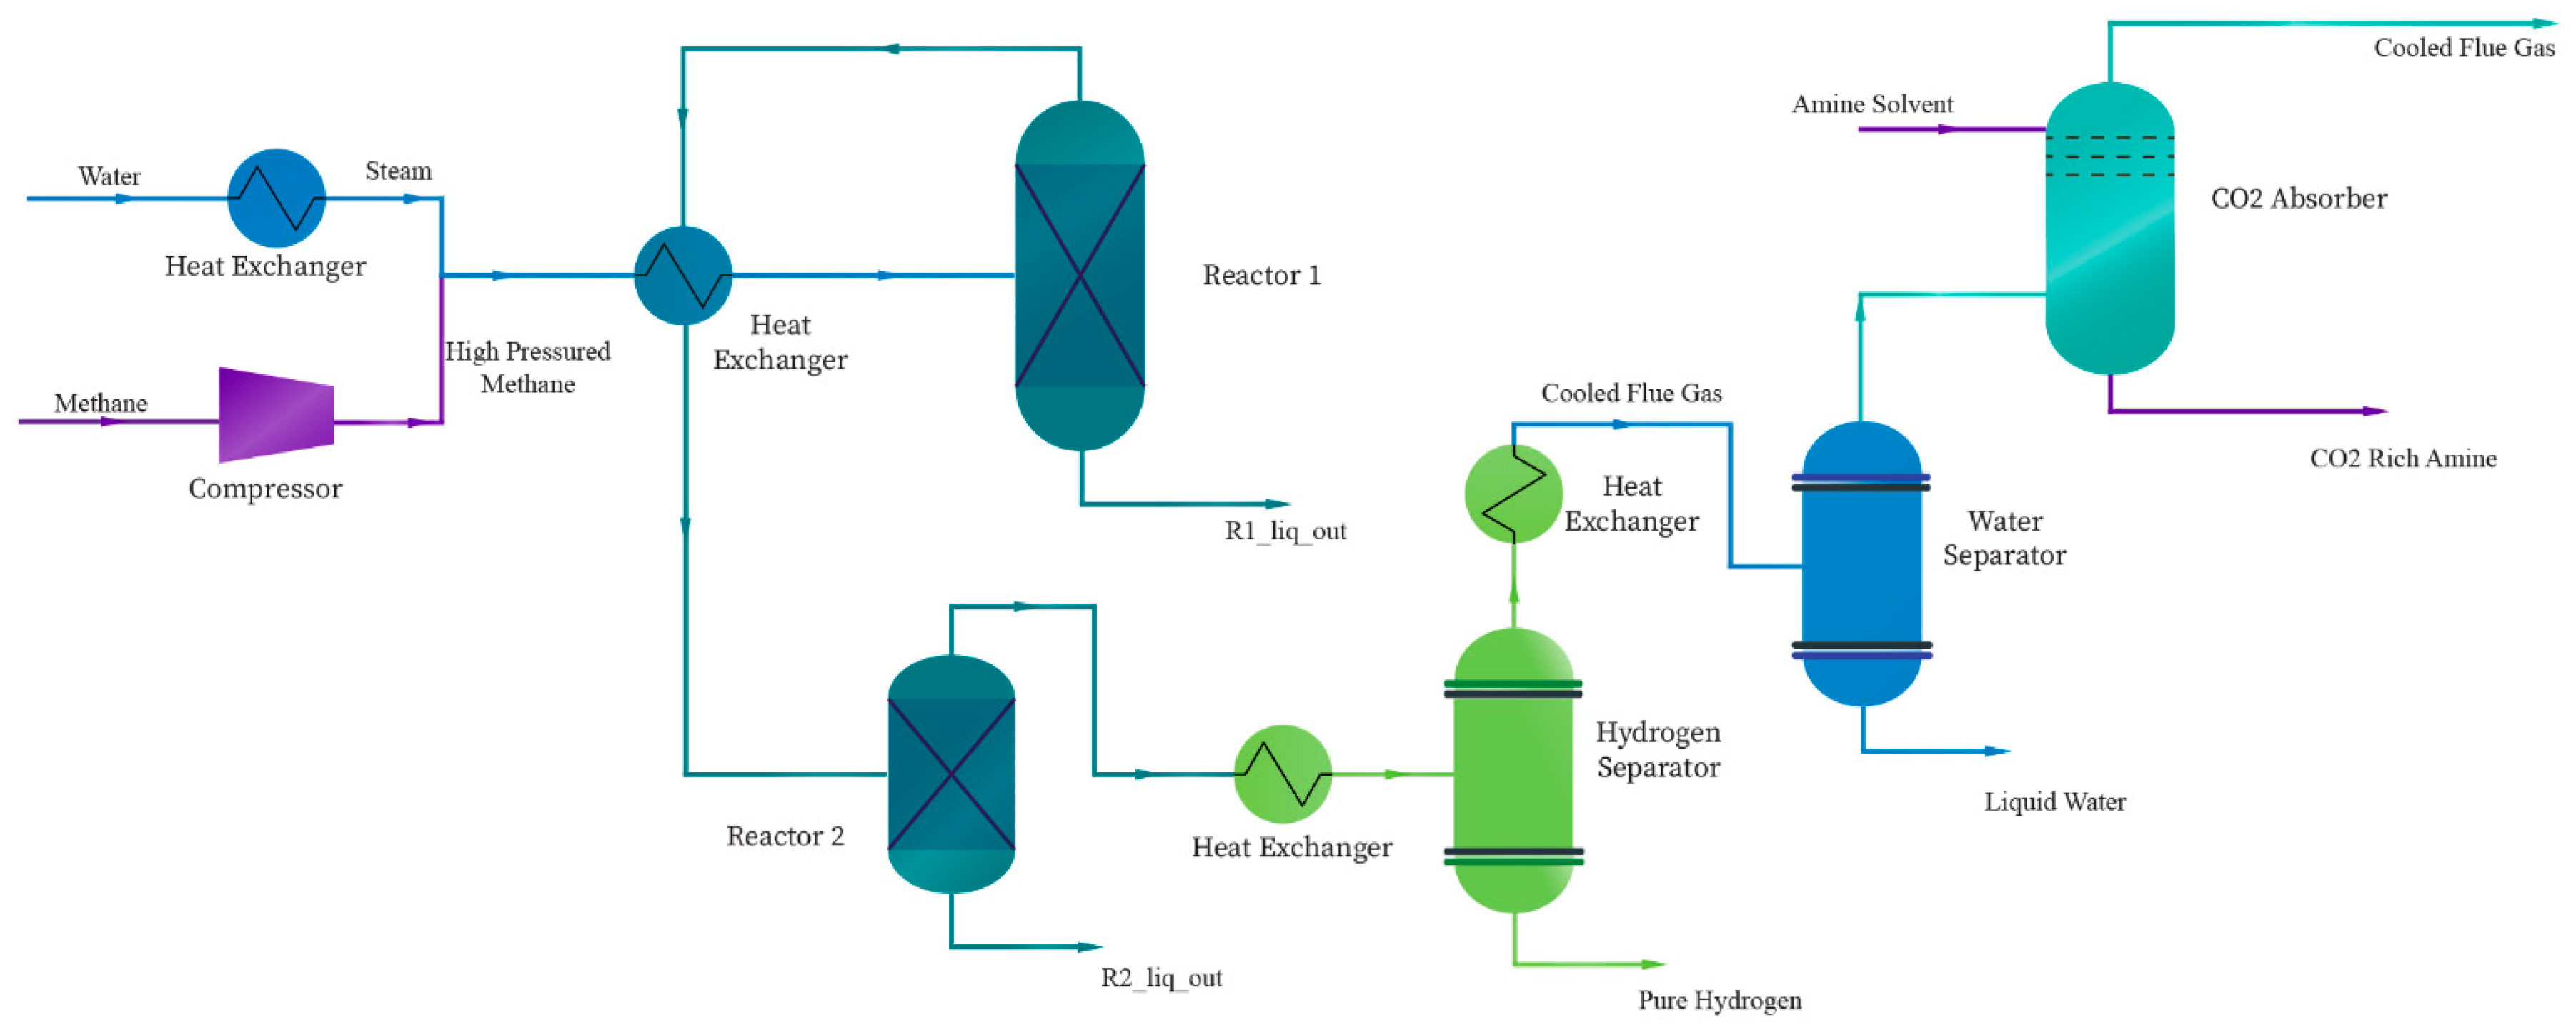
Figure 1. Process flow diagram of the proposed steam methane reforming process.
Preprints 80092 g001
Figure 2. Hydrogen production vs S/C.
Preprints 80092 g002
Figure 3. Hydrogen, Liquid water, and Flue gas flowrate of S-2 vs S/C.
Preprints 80092 g003
Figure 4. Mole fraction of methane and CO in reactor 1 vs S/C ratio.
Preprints 80092 g004
Figure 5. Overall UA of Heat Exchanger 2 and Heat Exchanger 3 vs S/C.
Preprints 80092 g005
Figure 6. Liquid water separation (%) vs Cooled flue gas temperature.
Preprints 80092 g006
Figure 7. Effect of flue gas temperature on C O 2 capture and water separation.
Preprints 80092 g007
Figure 8. Composite Curve.
Preprints 80092 g008
Figure 9. Grand Composite Curve.
Preprints 80092 g009
Figure 10. Multistage vs Single Stage Compression (Temperature Effect).
Preprints 80092 g010
Figure 11. Temperature and pressure profile of the absorption column.
Preprints 80092 g011
Figure 12. Concentration of C O 2 (%) at different absorption column stages.
Preprints 80092 g012
Figure 13. Mole Fraction of Solvents to H 2 S vs C O 2 Absorbed (%).
Preprints 80092 g013
Figure 14. Molar flow of the CCS Liquid vs the molar flow of Solvent.
Preprints 80092 g014
Figure 15. C O 2 capture from the flue gas entering the absorption column using different amines.
Preprints 80092 g015
Figure 16. C O 2 absorption in CCS liquid variation vs Amine solvent_ in temperature.
Preprints 80092 g016
Figure 17. Possible Utility Optimization.
Preprints 80092 g017
Disclaimer/Publisher’s Note: The statements, opinions and data contained in all publications are solely those of the individual author(s) and contributor(s) and not of MDPI and/or the editor(s). MDPI and/or the editor(s) disclaim responsibility for any injury to people or property resulting from any ideas, methods, instructions or products referred to in the content.
Copyright: This open access article is published under a Creative Commons CC BY 4.0 license, which permit the free download, distribution, and reuse, provided that the author and preprint are cited in any reuse.
Prerpints.org logo

Preprints.org is a free preprint server supported by MDPI in Basel, Switzerland.

Subscribe

© 2024 MDPI (Basel, Switzerland) unless otherwise stated