Submitted:
18 July 2023
Posted:
19 July 2023
You are already at the latest version
Abstract
Keywords:
1. Introduction
2. Materials and Methods
2.1. Global Distribution of Urochloa subquadripara, Eichhornia crassipes e Salvinia minima
2.2. CLIMEX
2.3. Parameter Adjustments and Model Validation in the CLIMEX Software
2.3.1. Subsubsection
2.3.1.1 Growth Indices
2.3.1.2. Stress Parameters
2.3.2. Eichhornia crassipes
2.3.2.1. Stress Parameters
2.3.2.2. Stress Parameters
2.3.3. Salvinia minima
2.3.3.1. Growth Indicess
2.3.3.2. Stress Parameters
2.4. Climate Data, Models, and Scenarios
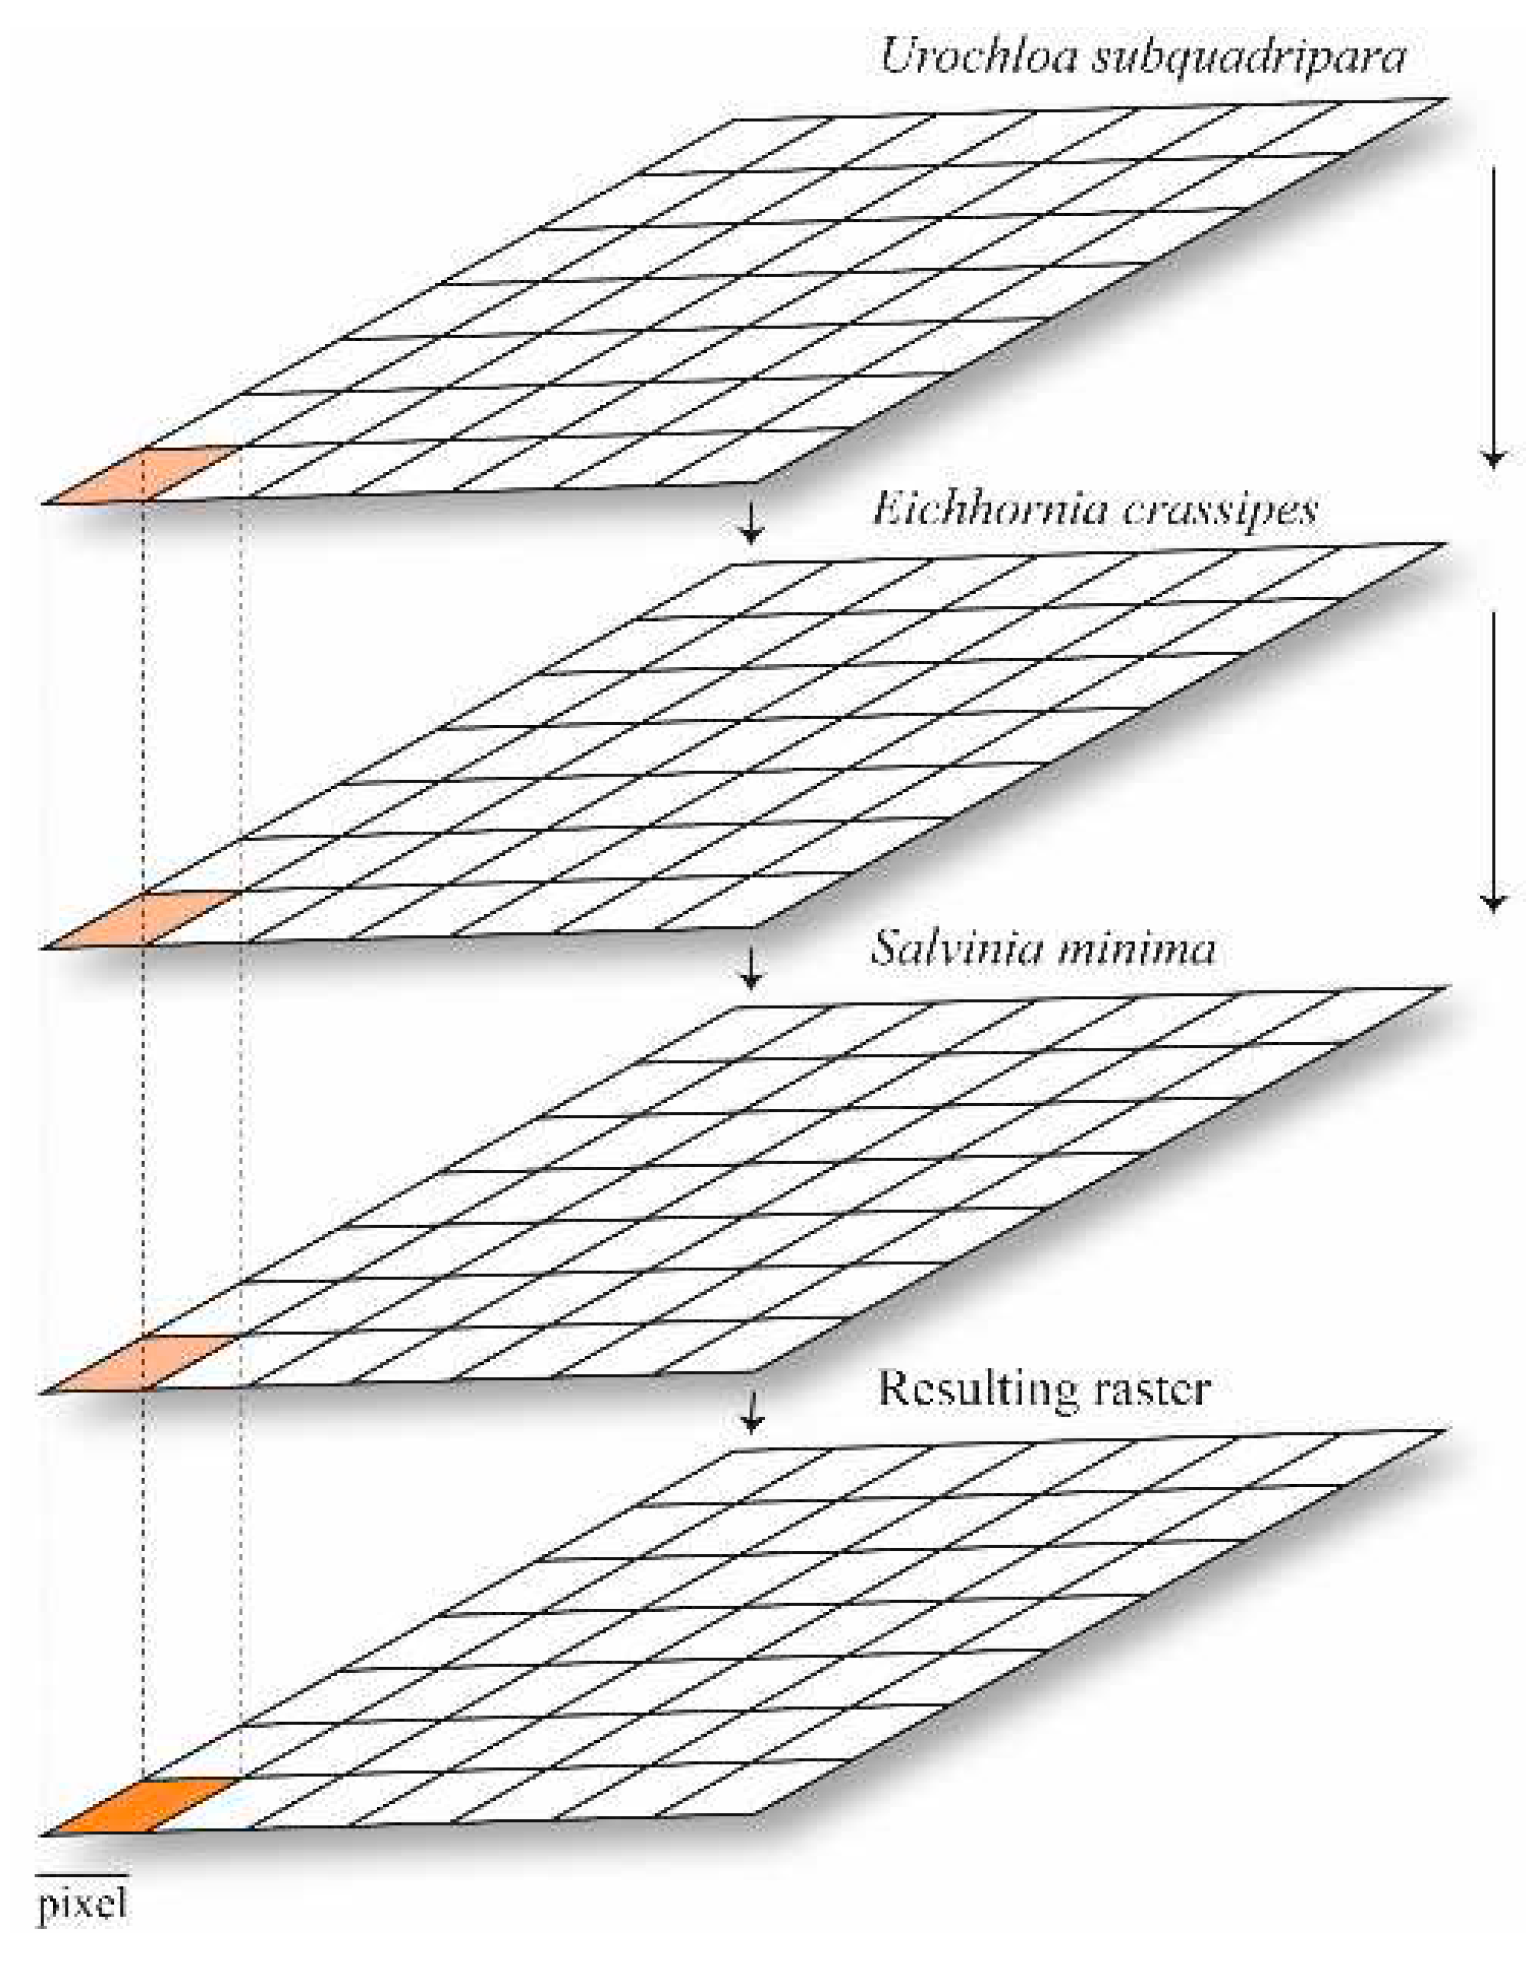
2.5. Multicriteria Decision-Making and Analytical Hierarchy Process
2.6. Global Lakes and Wetlands Database (GLWD)
3. Results
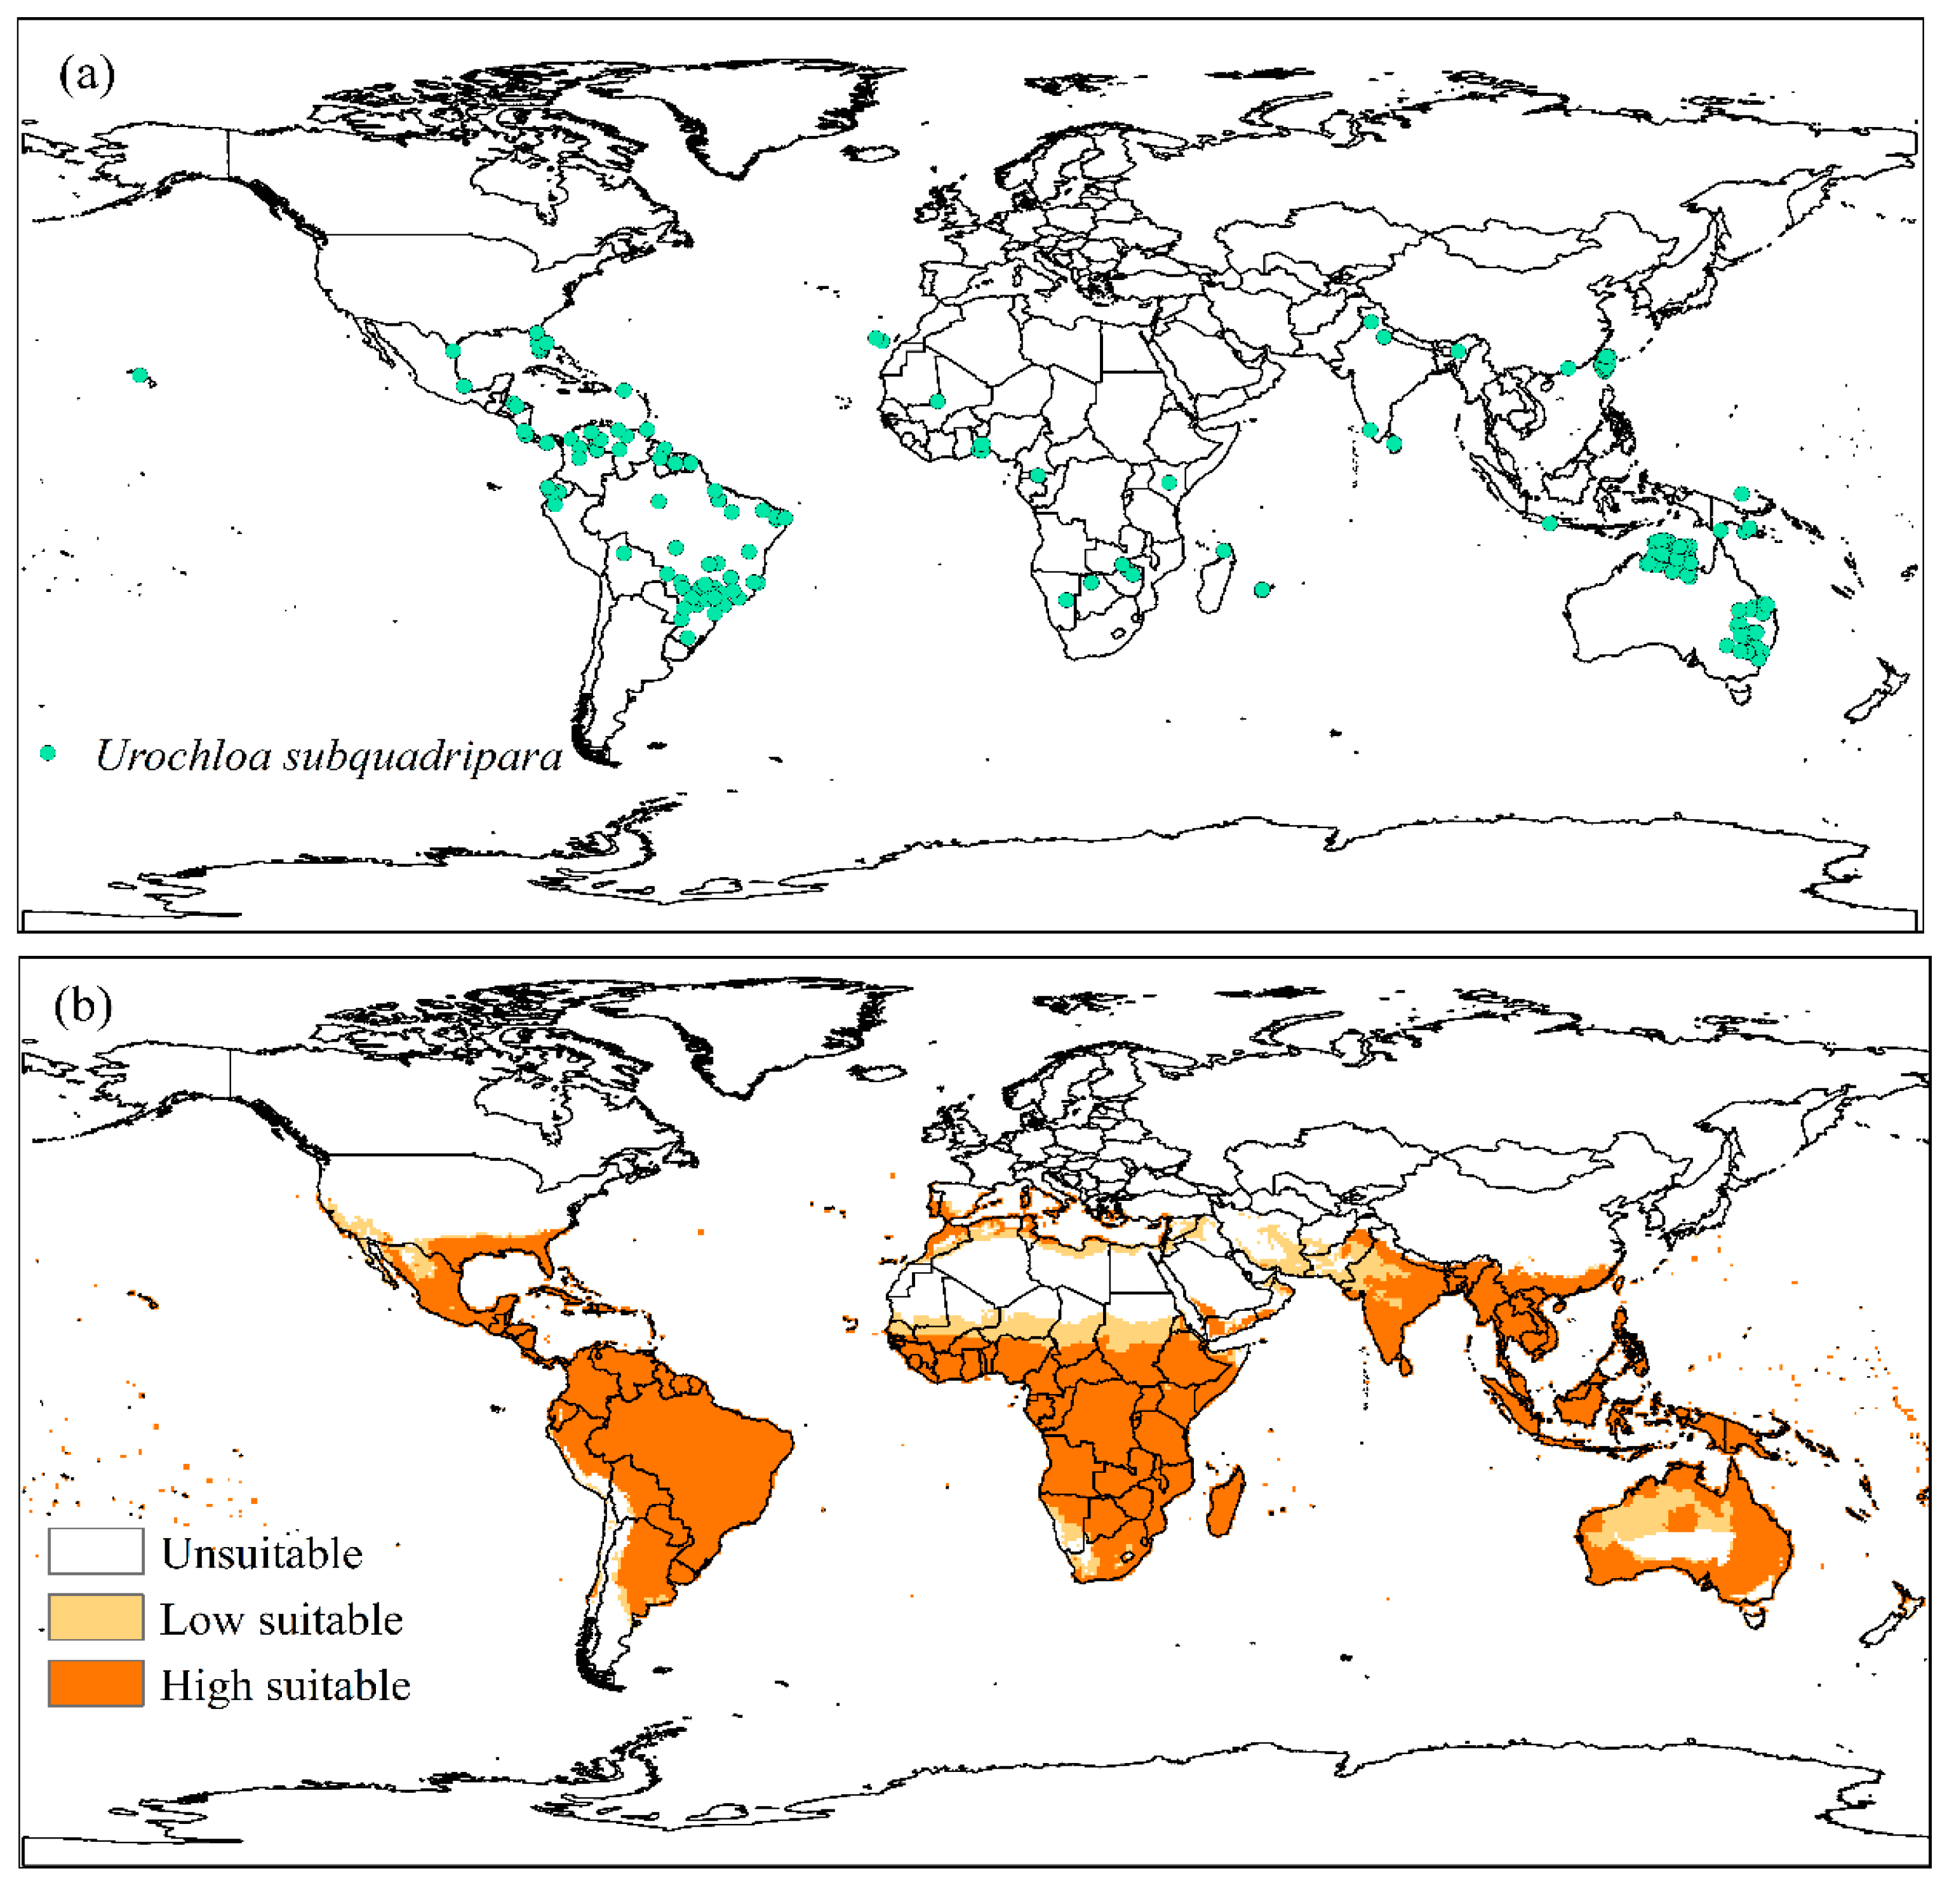
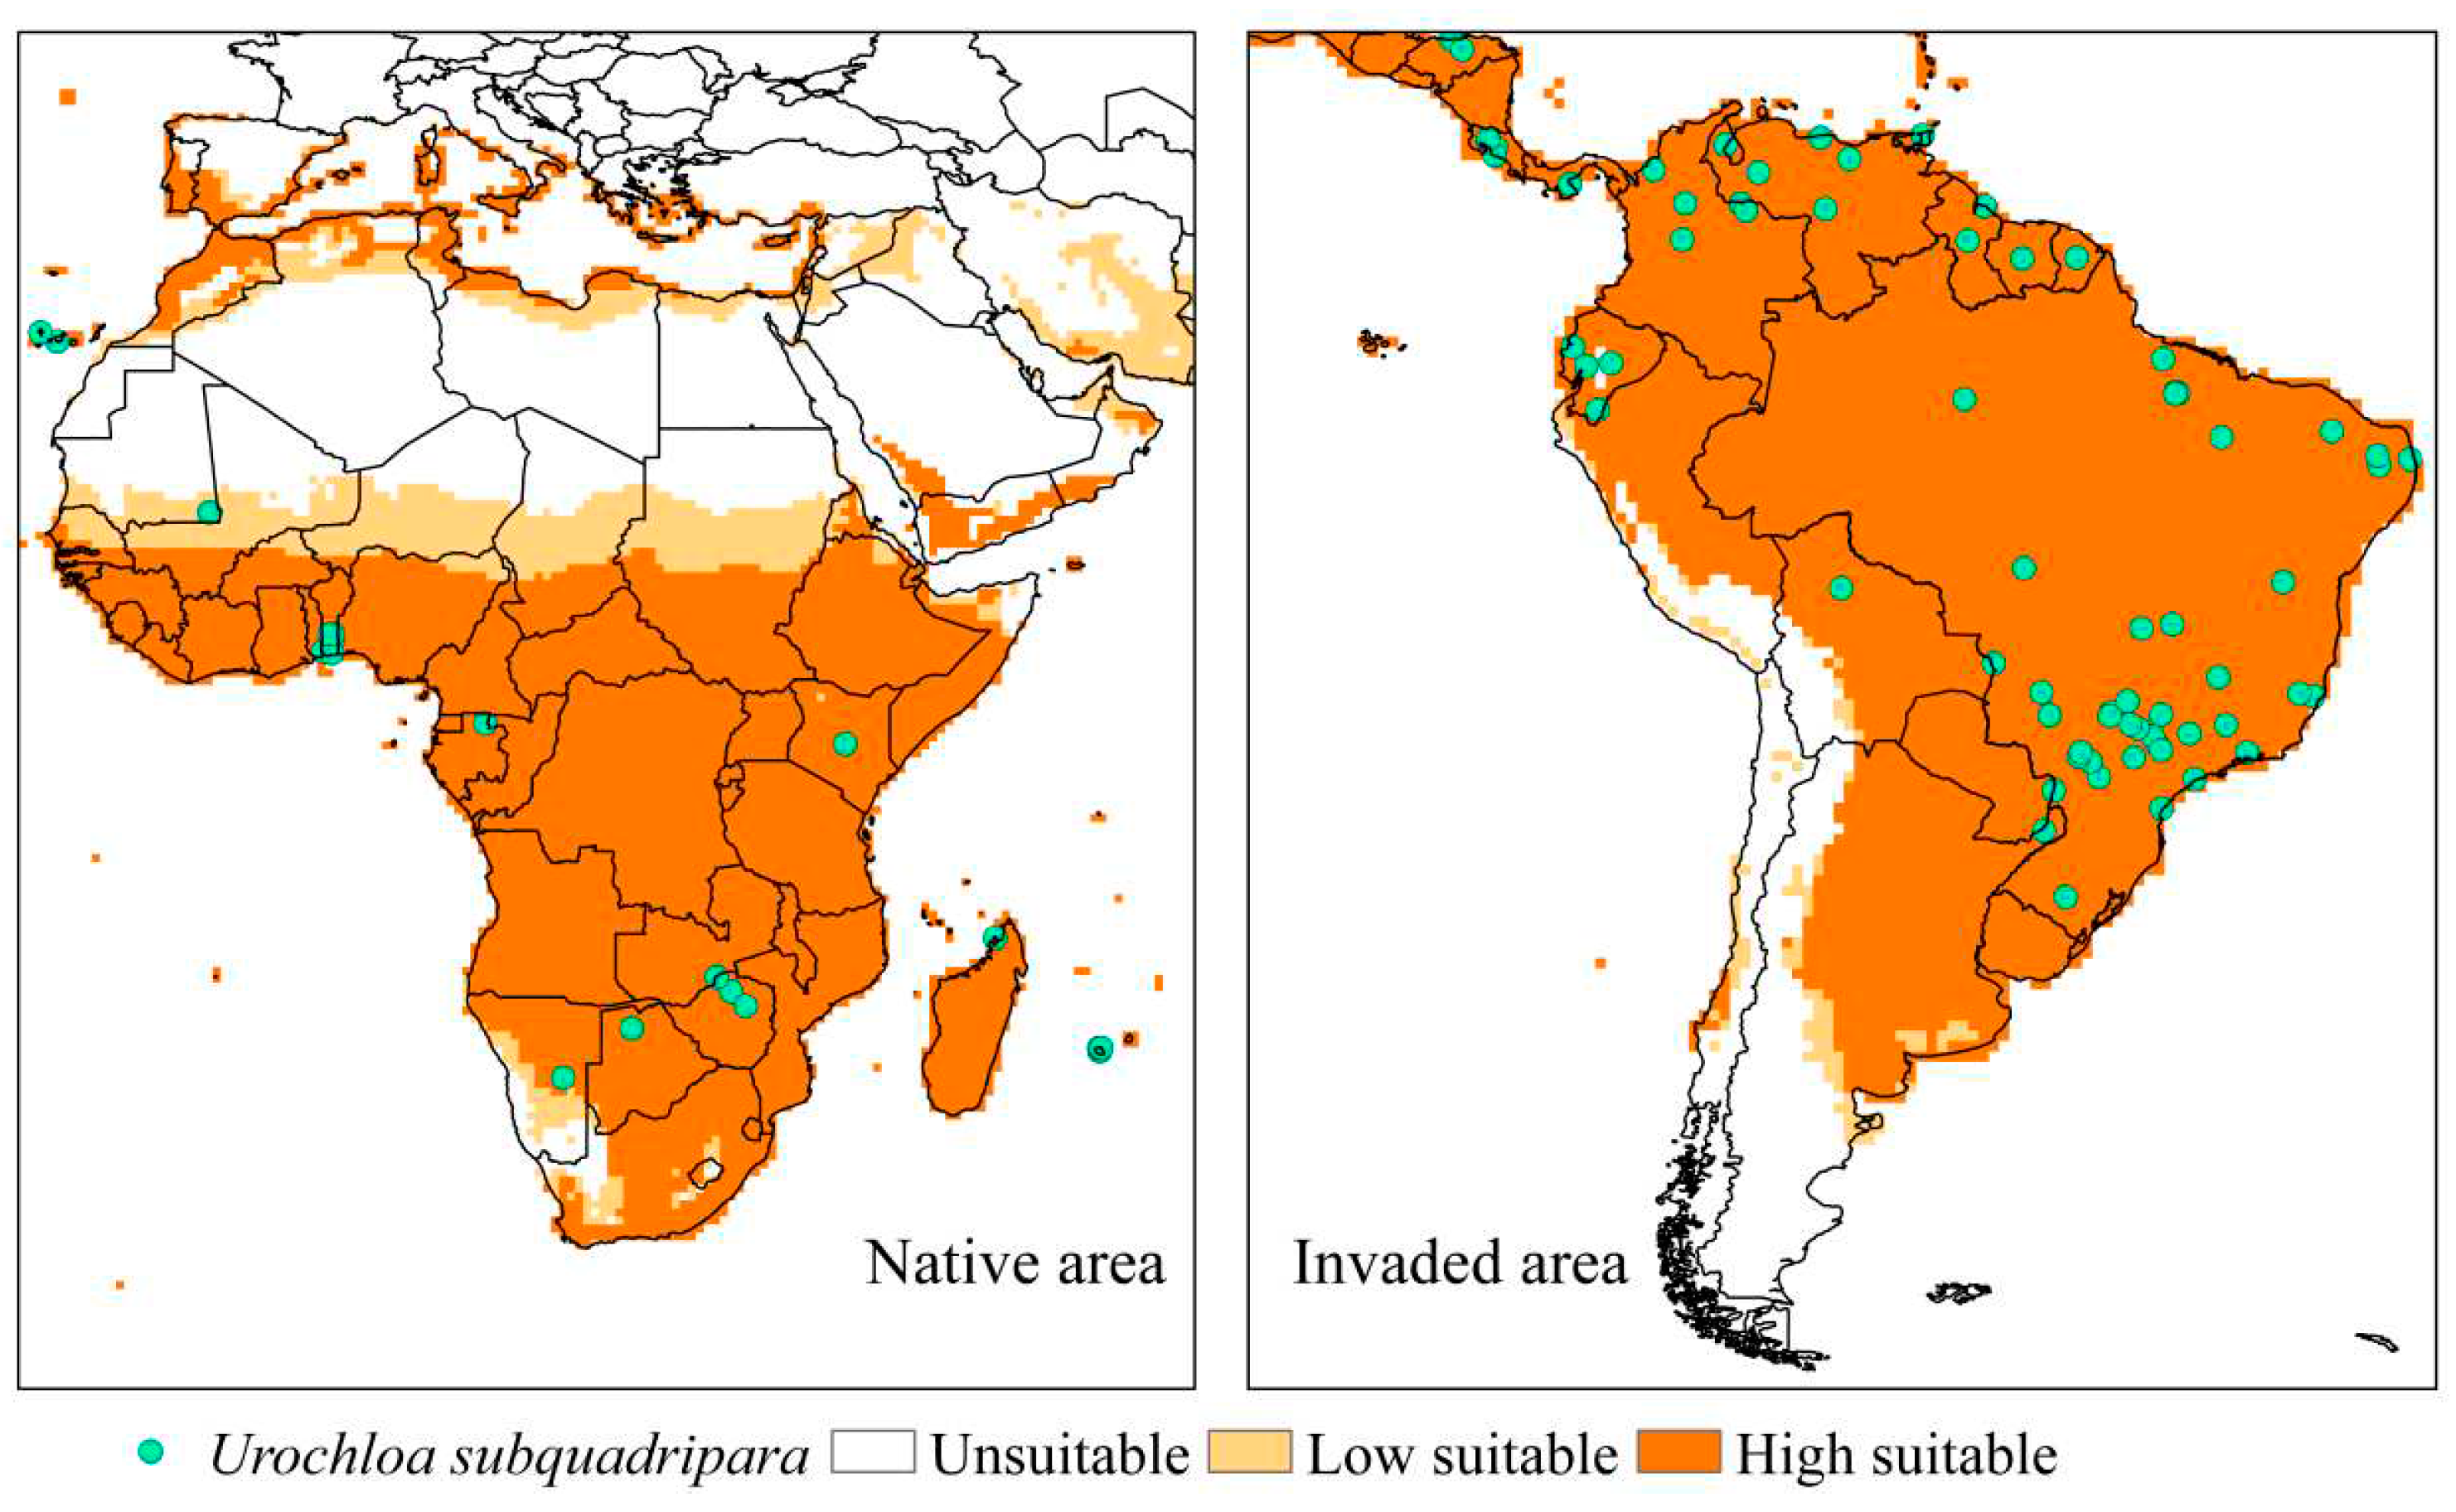
3.1. Invasive Exotic Species (Urochloa subquadripara)
3.2. Native Species
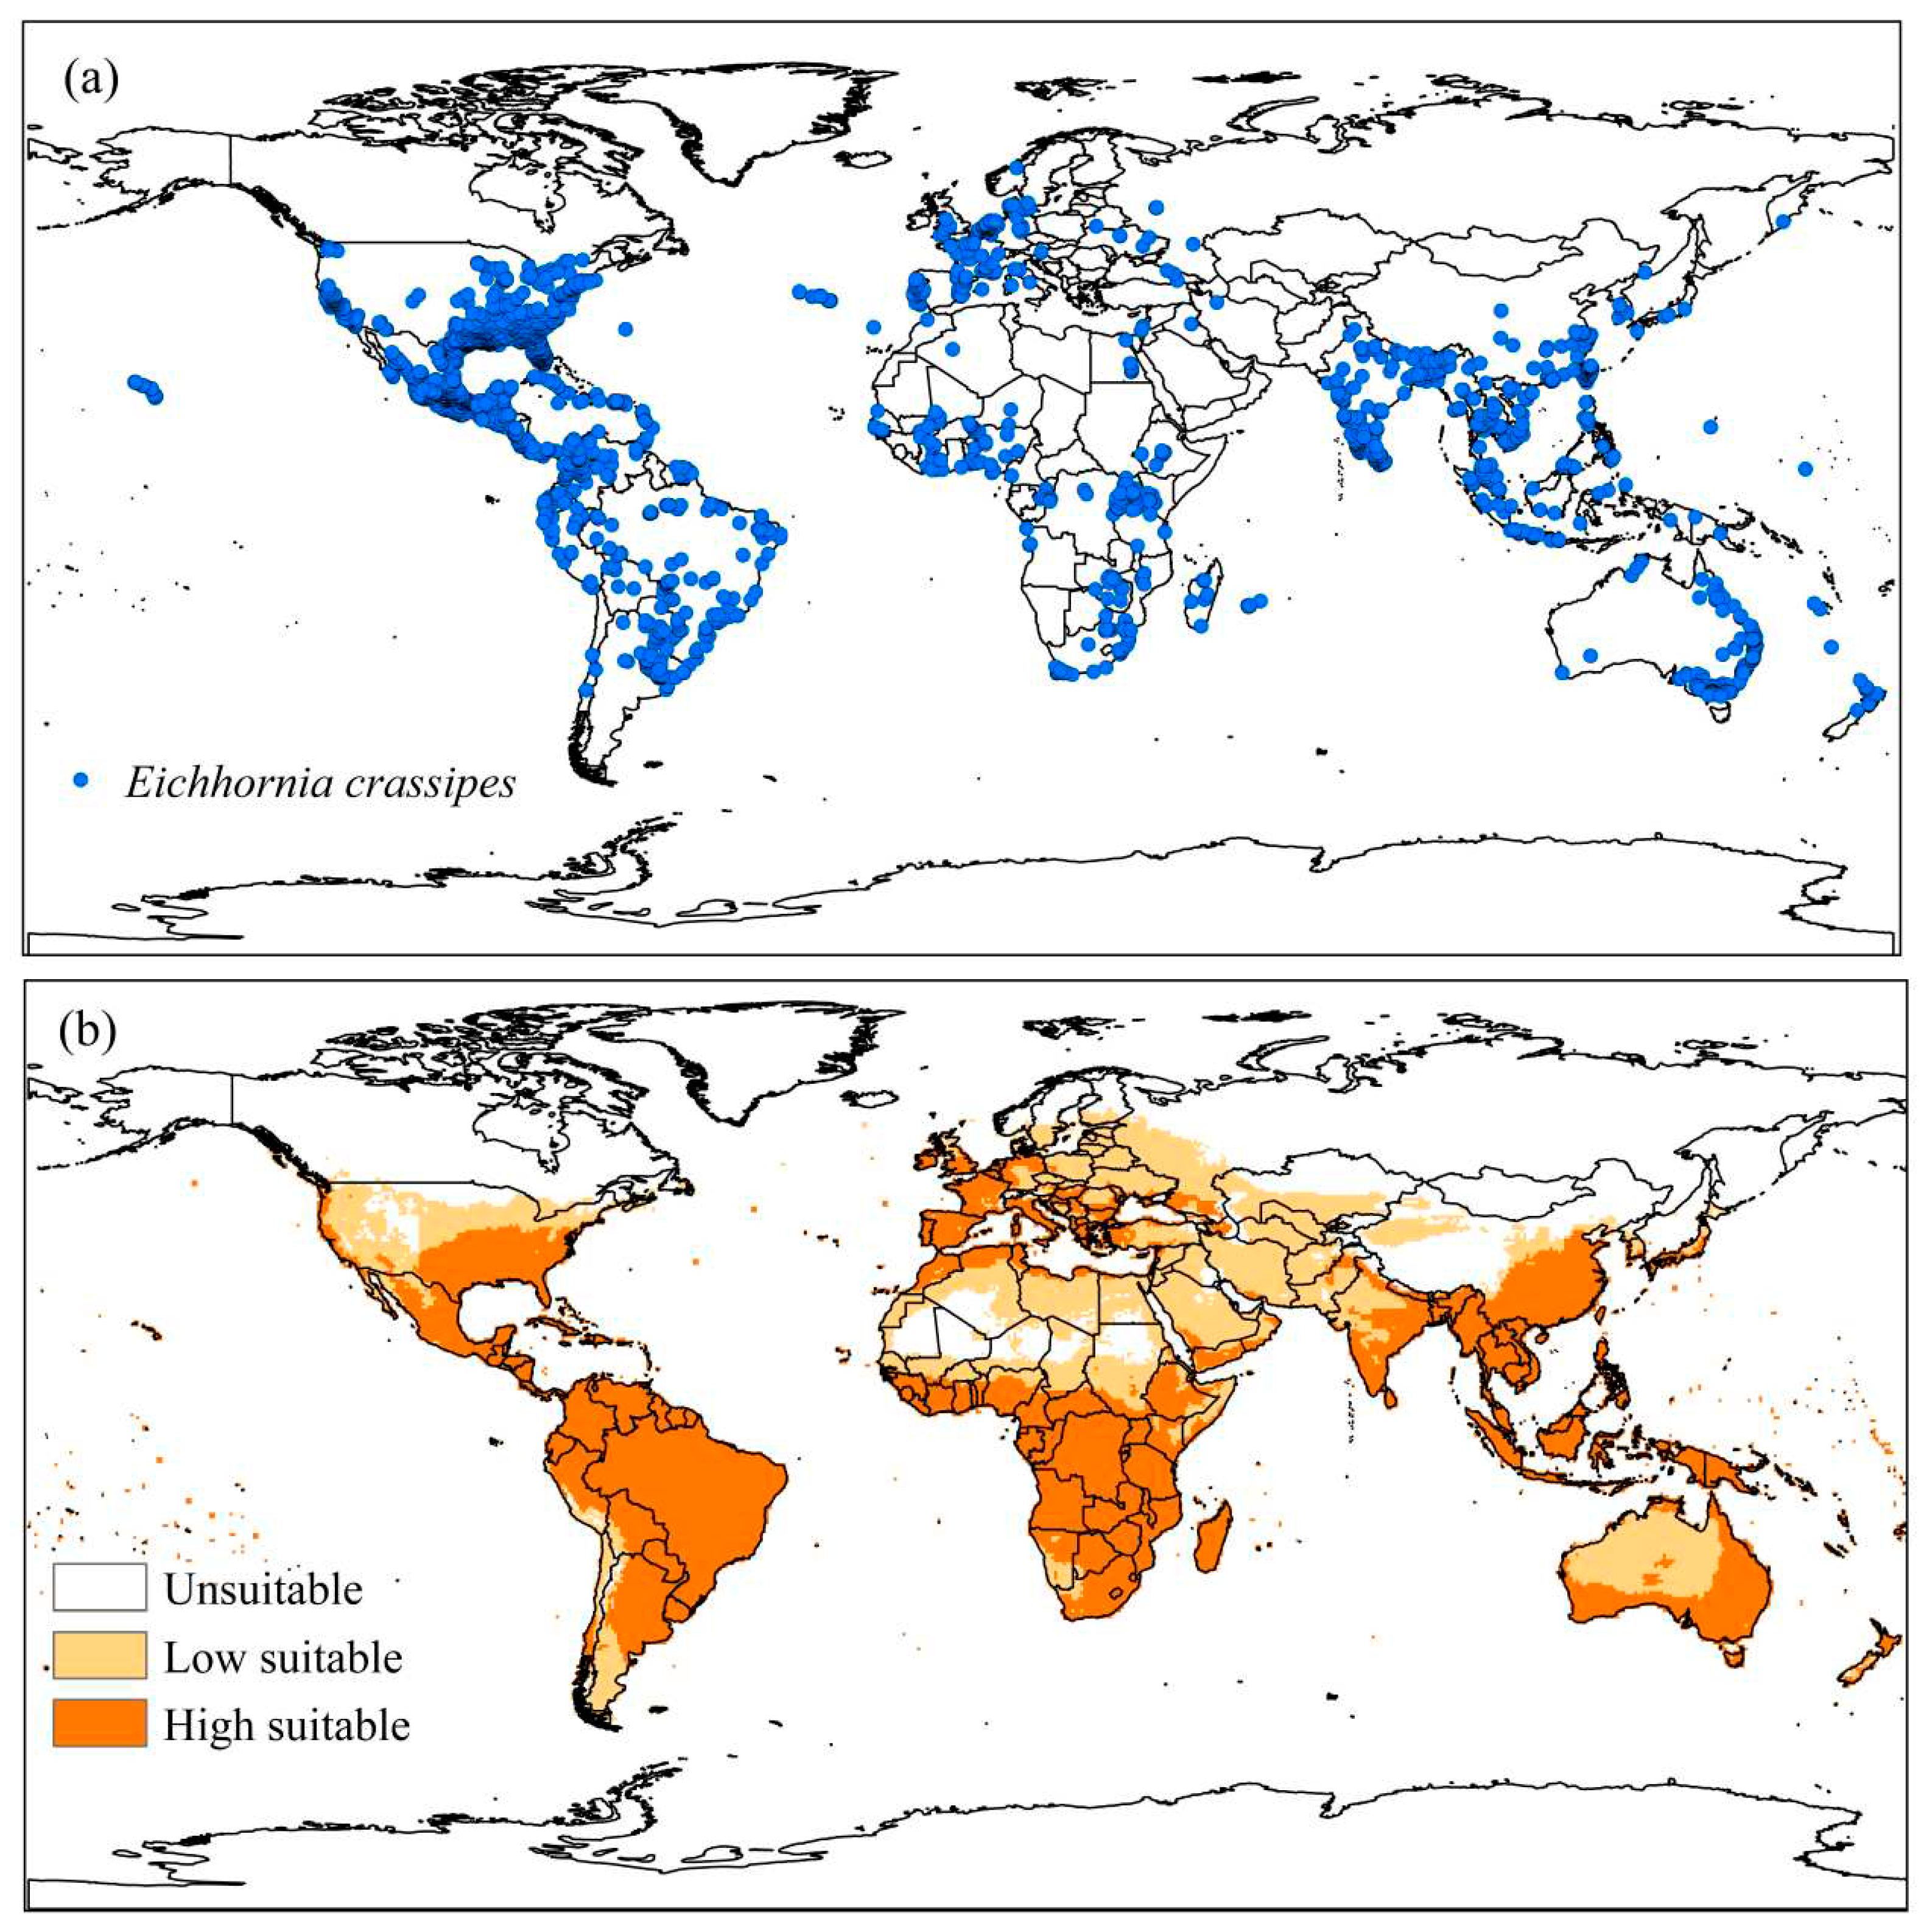
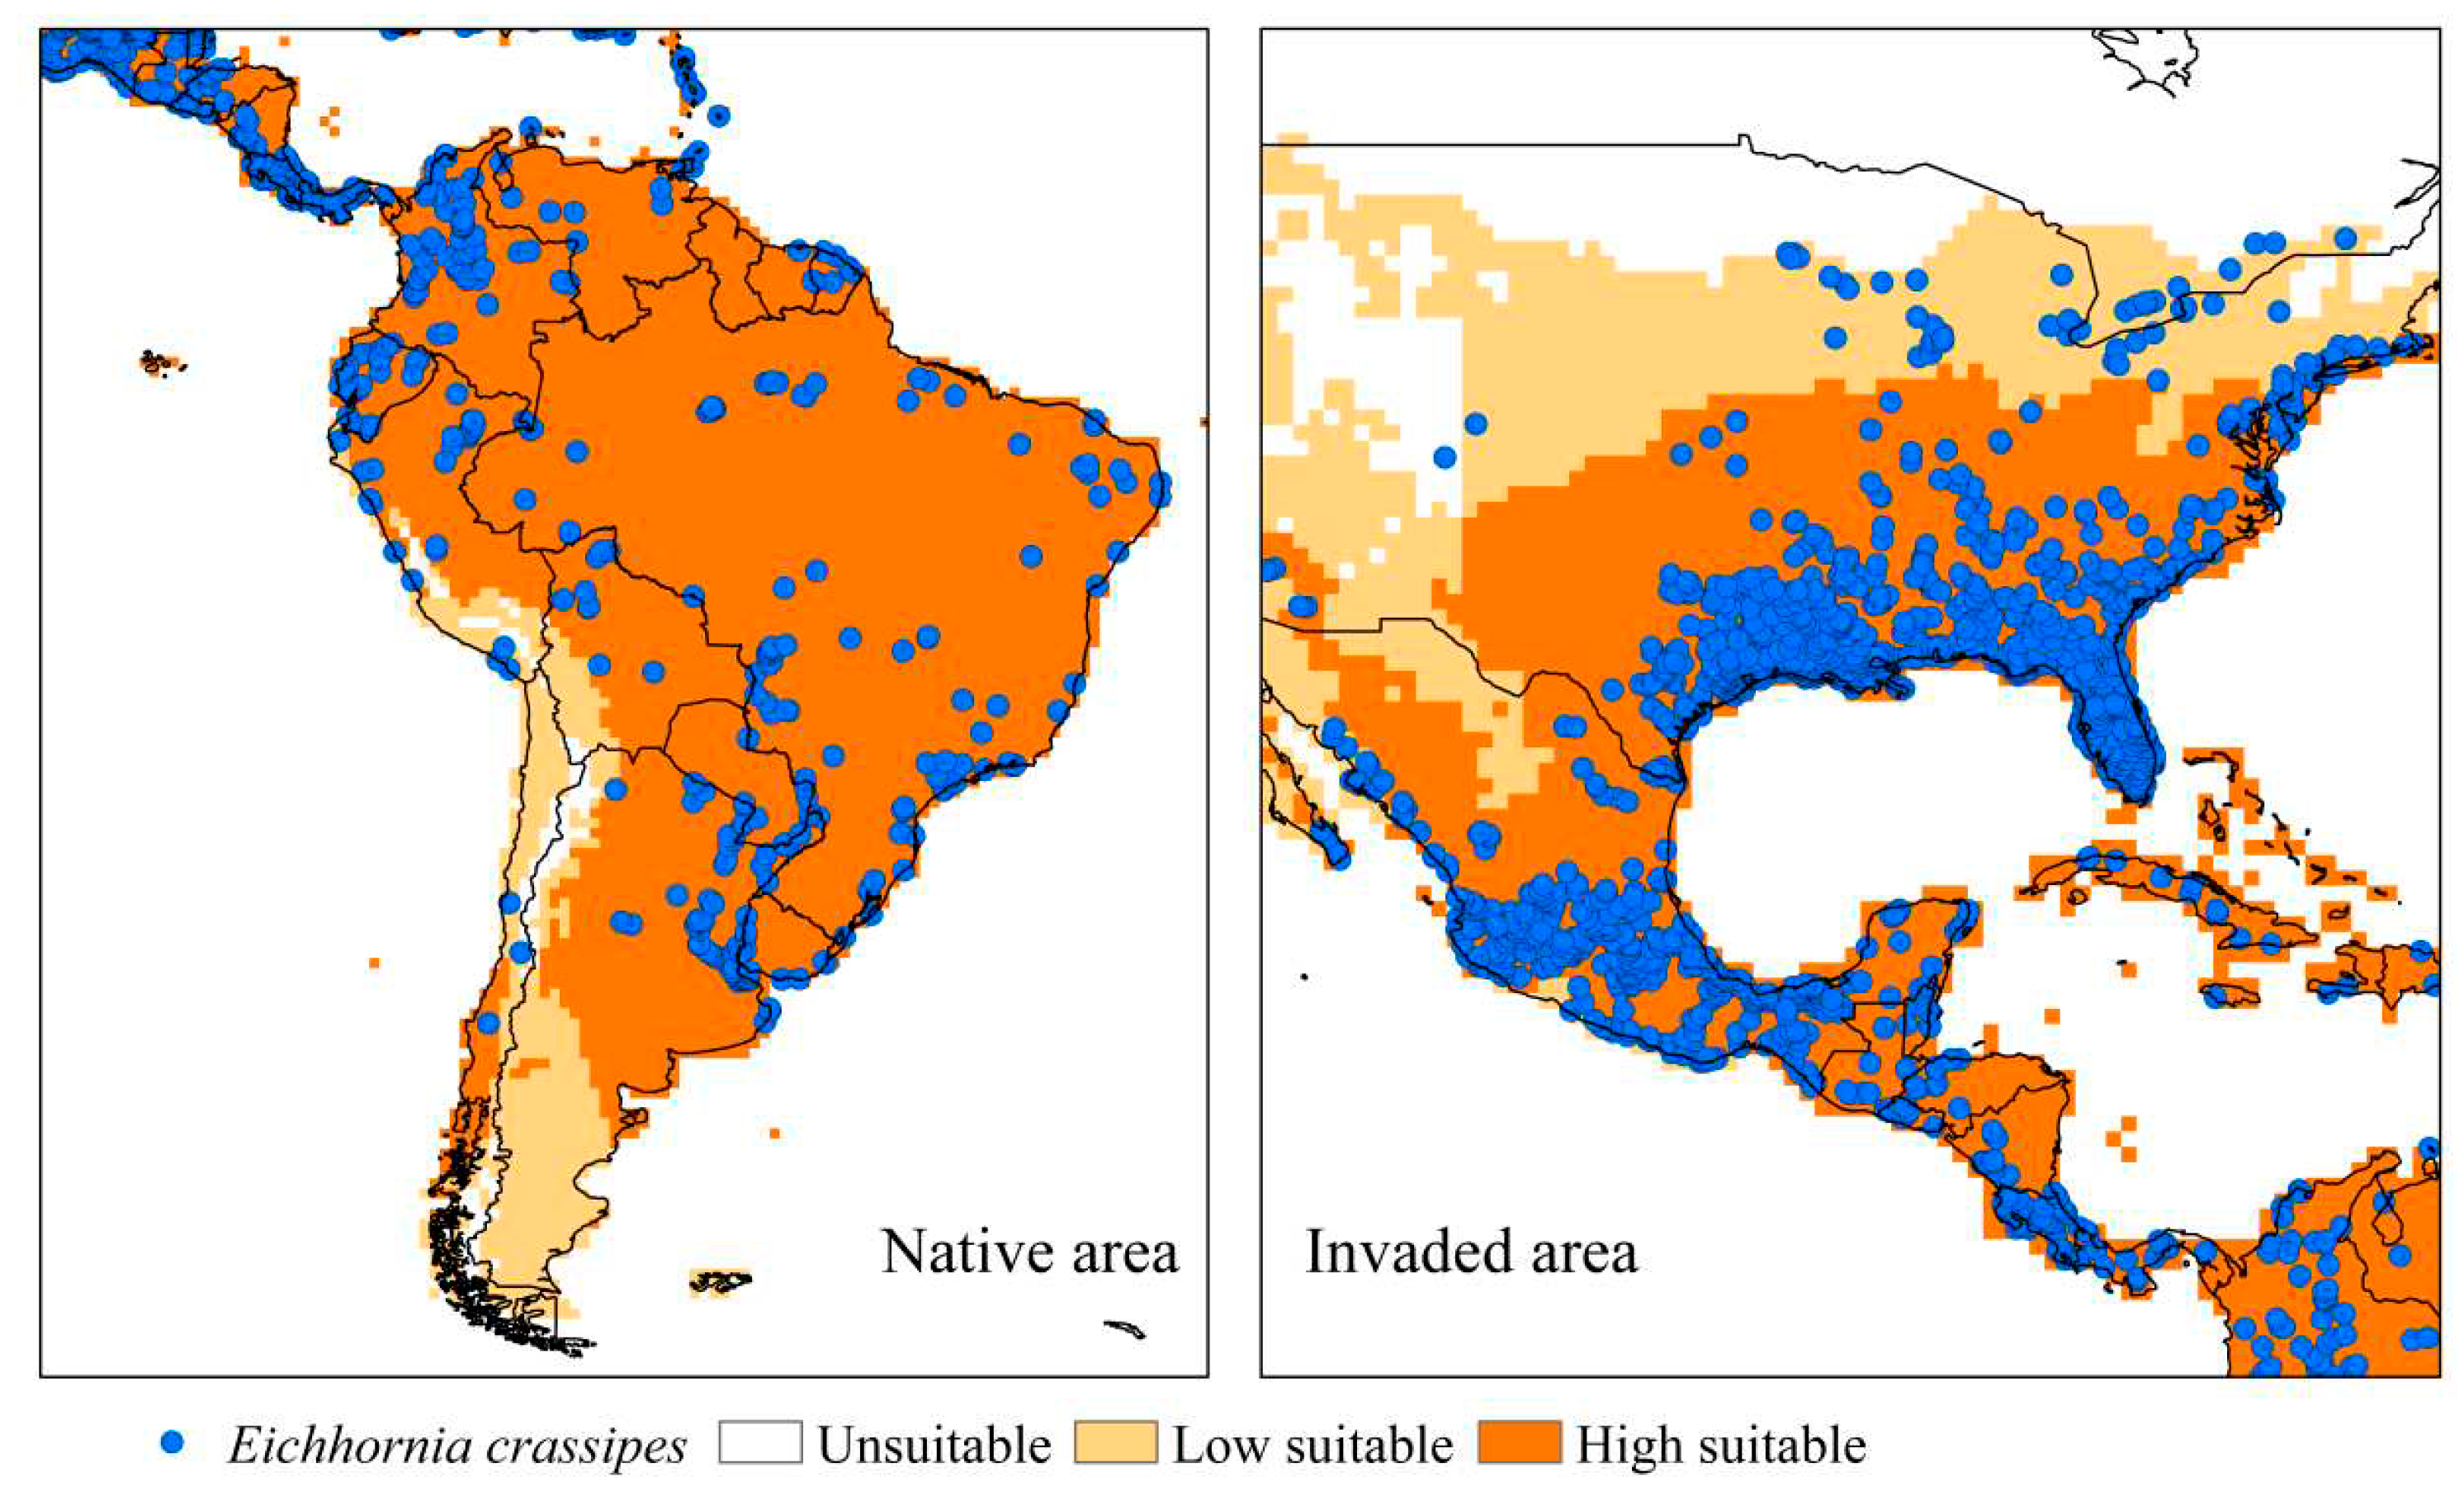
3.2.1. Eichhornia crassipes
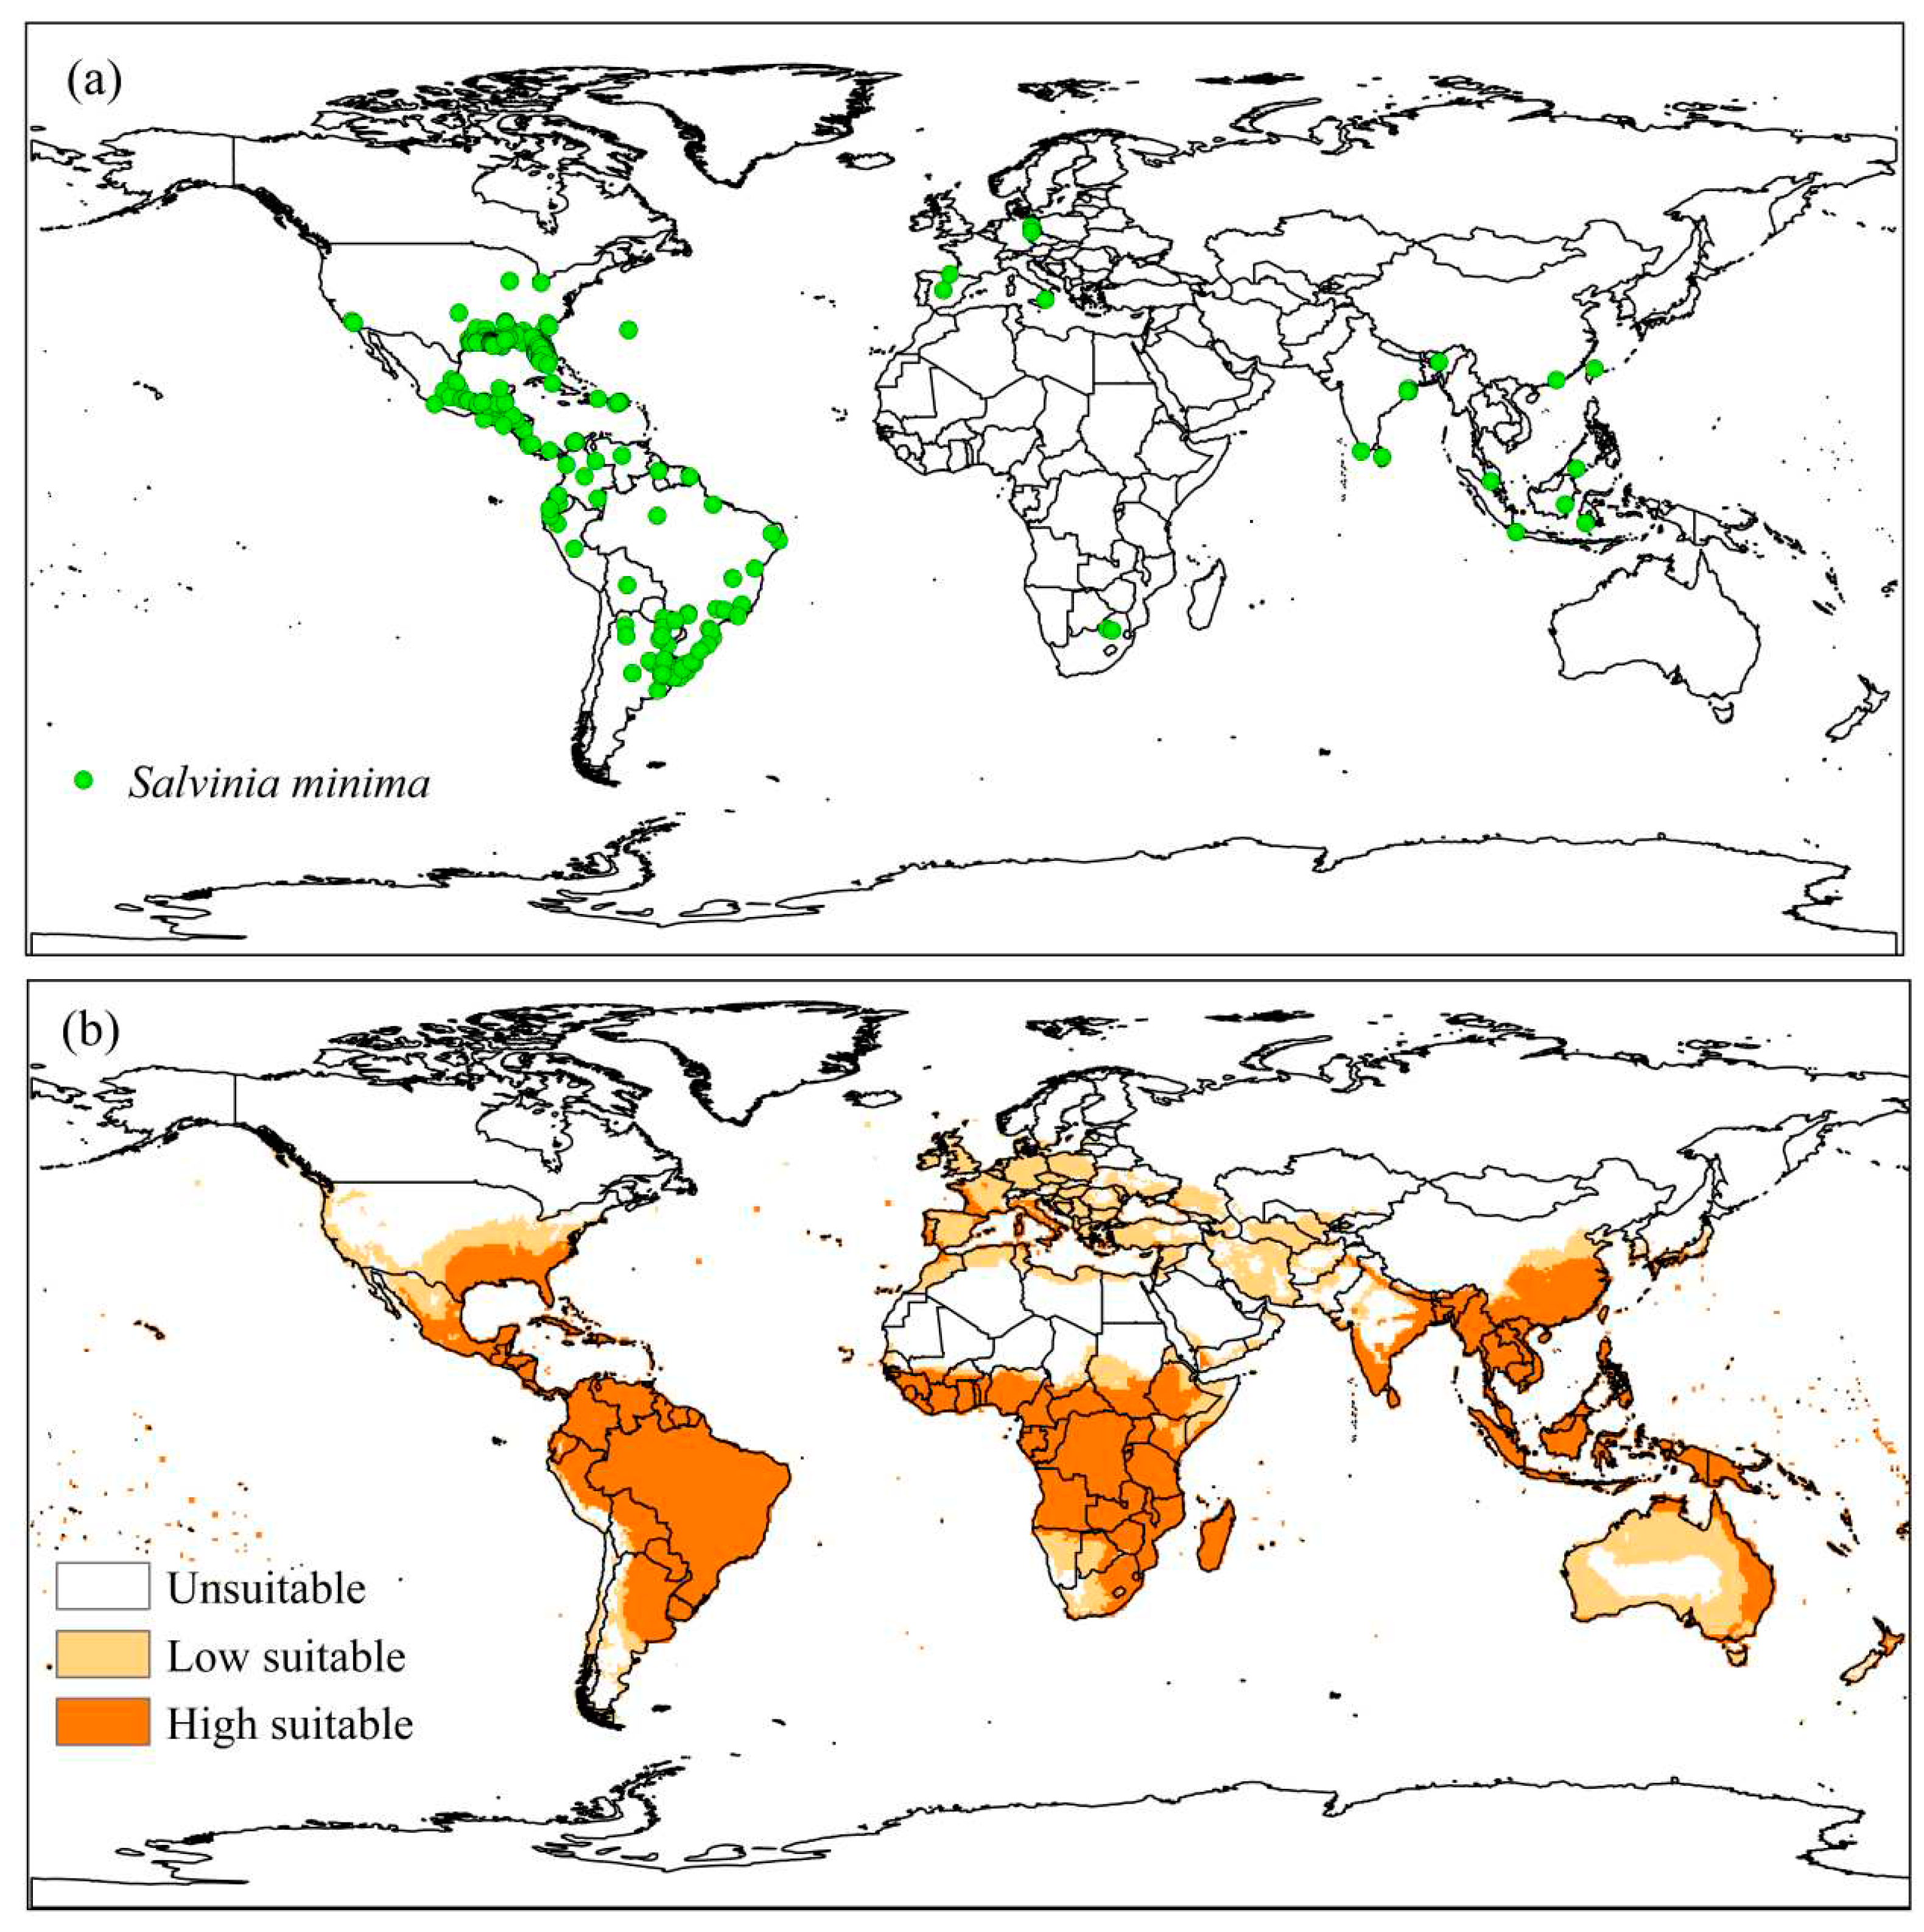
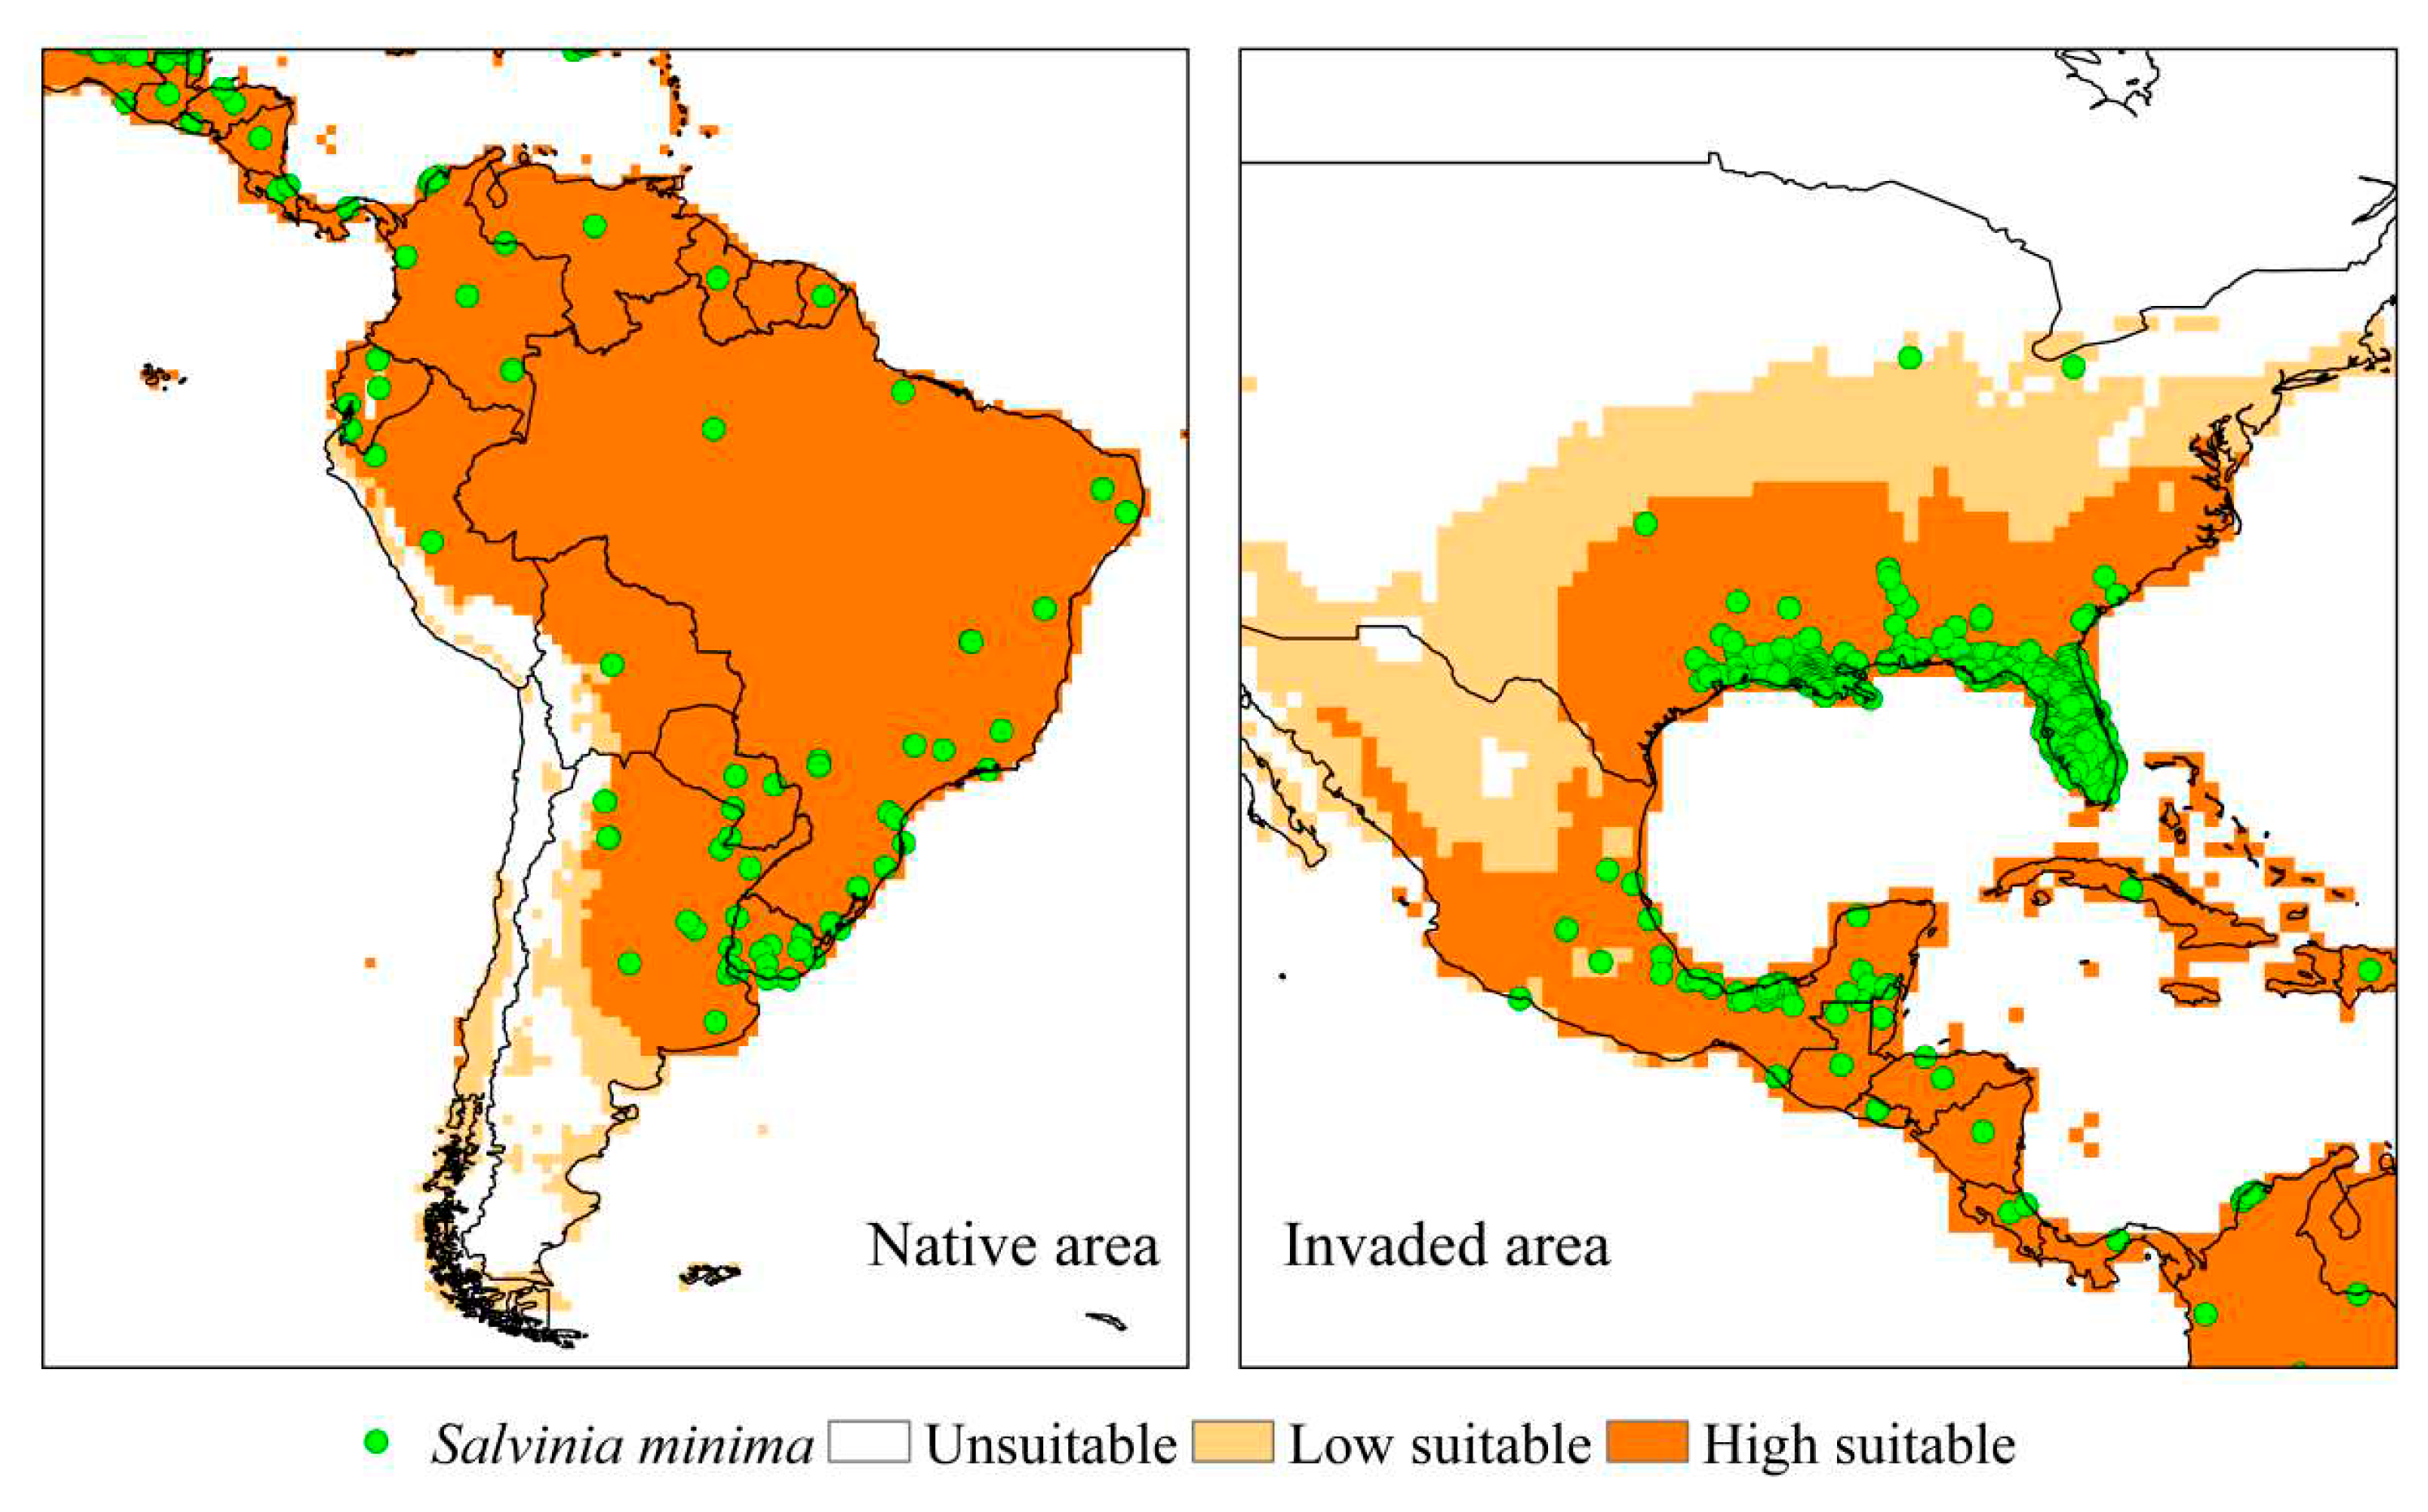
3.2.2. Salvinia minima
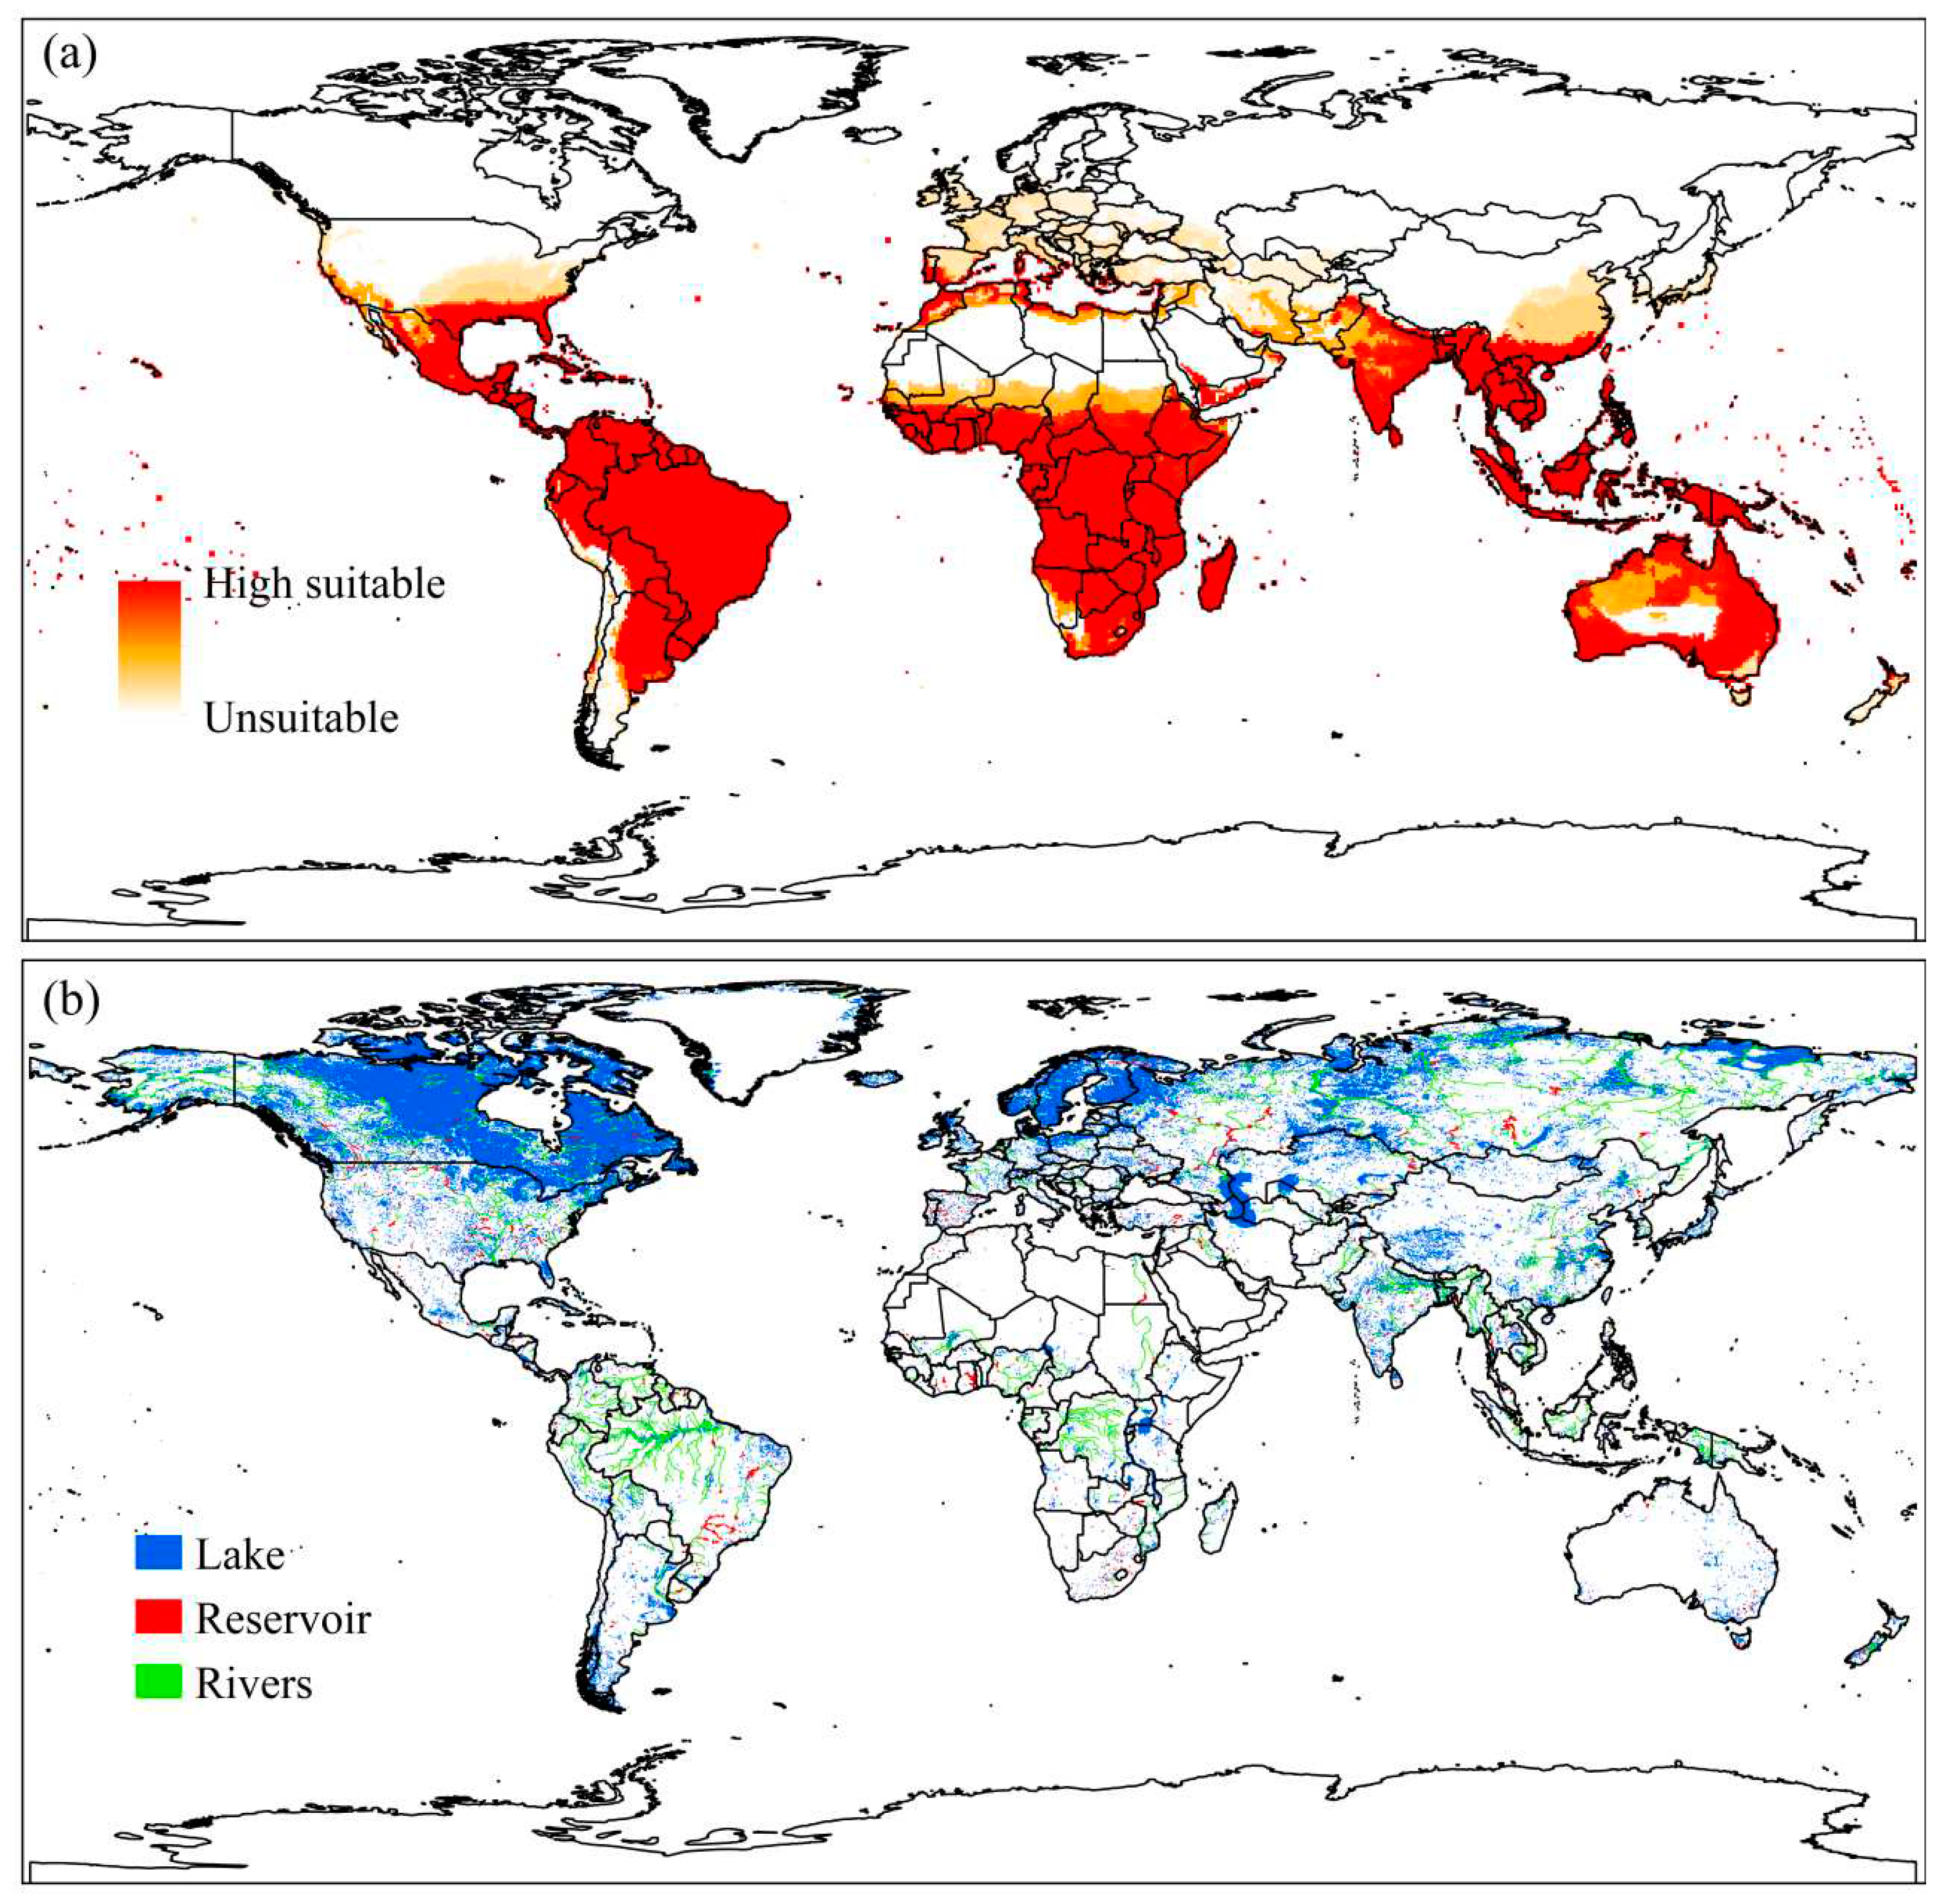
3.3. Co-Occurrence of Urochloa subquadripara with Native Species
4. Discussion
4.1. Invasive EXOTIC species (Urochloa subquadripara)
4.2. Native Species
4.2.1. Eichhornia crassipes
4.2.2. Salvinia minima
4.3. Co-Occurrence of Urochloa subquadripara with Native Species
5. Conclusions
Supplementary Materials
Author Contributions
Funding
Data Availability Statement
Acknowledgments
Conflicts of Interest
References
- Tasker, S. J.; Foggo, A.; Bilton, D. T. Quantifying the ecological impacts of alien aquatic macrophytes: A global meta-analysis of effects on fish, macroinvertebrate and macrophyte assemblages. Freshwater Biology, v. 67, n. 11, p. 1847-1860, 2022.
- Dudgeon, D. Freshwater biodiversity. Cambridge University Press, 2020.
- Diagne, et al. High and rising economic costs of biological invasions worldwide. Nature, v. 592, p. 571-576, 2021.
- Diamante, N. A. et al. Molecular analysis of the invasive populations of Urochloa (Poaceae) in a large Neotropical reservoir. Aquatic Botany, v. 161, p. 103183, 2020. [CrossRef]
- Carniatto, N. et al. Effects of an invasive alien Poaceae on aquatic macrophytes and fish communities in a Neotropical reservoir. Biotropica, v. 45, n. 6, p. 747-754, 2013.
- Thomaz, S. M. et al. Temporal trends and effects of diversity on occurrence of exotic macrophytes in a large reservoir. Acta Oecologica, v. 35, n. 5, p. 614-620, 2009. [CrossRef]
- Thomaz, S. M.; Silveira, M. J.; Michelan, T. S. The colonization success of an exotic Poaceae is related to native macrophyte richness, wind disturbance and riparian vegetation. Aquatic Sciences, v. 74, n. 4, p. 809-815, 2012. [CrossRef]
- Fares, A. L. B.; Nonato, F. A. S.; Michelan, T. S. New records of the invasive macrophyte, Urochloa arrecta extend its range to eastern Brazilian Amazon altered freshwater ecosystems. Acta Amazonica, v. 50, p. 133-137, 2020. [CrossRef]
- Amorim, S. R.; Umetsu, C. A.; Camargo, A. F. M. Effects of a non-native species of Poaceae on aquatic macrophyte community composition: a comparison with a native species. Journal of Aquatic Plant Management, v. 53, n. 1, p. 191-196, 2015.
- Michelan, T. S. et al. Effects of an exotic invasive macrophyte (tropical signalgrass) on native plant community composition, species richness and functional diversity. Freshwater Biology, v. 55, n. 6, p. 1315-1326, 2010. [CrossRef]
- Michelan, T. S.; Dainez Filho, M. S.; Thomaz, S. M. Aquatic macrophyte mats as dispersers of one invasive plant species. Brazilian Journal of Biology, v. 78, p. 169-171, 2017.
- Martins, D. et al. Caracterização da comunidade de plantas aquáticas de dezoito reservatórios pertencentes a cinco bacias hidrográficas do estado de São Paulo. Planta daninha, v. 26, p. 17-32, 2008.
- Pott, V. J. et al. Aquatic macrophyte diversity of the Pantanal wetland and upper basin. Brazilian Journal of Biology, v. 71, p. 255-263, 2011. [CrossRef]
- Flora do Brasil. Disponível em: <http://floradobrasil.jbrj.gov.br/reflora/floradobrasil/FB26027> . Acesso em 13 de julho de 2022.
- Domingos, V. D. et al. Initial growth of Brachiaria subquadripara (Trin.) Hitchc. plants under different nutritional conditions. Revista Brasileira de Engenharia Agrícola e Ambiental, v. 19, p. 560-566, 2015.
- Moraes, I. C. et al. Karyotype analysis and mode of reproduction of two species of Urochloa P. Beauv. Crop Science, v. 61, n. 5, p. 3415-3424, 2021. [CrossRef]
- Pitelli, R. et al. Dinâmica da comunidade de macrófitas aquáticas no reservatório de Santana, RJ. Planta daninha, v. 26, p. 473-480, 2008.
- Michelan, T.S.; Thomaz, S. M.; Bini, L. M. Native macrophyte density and richness affect the invasiveness of a tropical Poaceae species. PLoS One, v. 8, n. 3, p. e60004, 2013. [CrossRef]
- Thomaz, S. M.; Michelan, T.S. Associations between a highly invasive species and native macrophytes differ across spatial scales. Biological Invasions, v. 13, n. 8, p. 1881-1891, 2011. [CrossRef]
- Capers, R. S. et al. Aquatic plant community invasibility and scale-dependent patterns in native and invasive species richness. Ecology, v. 88, n. 12, p. 3135-3143, 2007. [CrossRef]
- Fridley, J. D. et al. The invasion paradox: reconciling pattern and process in species invasions. Ecology, v. 88, n. 1, p. 3-17, 2007.
- Stohlgren, T. J. et al. Scale and plant invasions: a theory of biotic acceptance. Preslia, v. 78, n. 4, p. 405-426, 2006.
- Thomaz, S. M.; Mormul, R. P.; Michelan, T.S. Propagule pressure, invasibility of freshwater ecosystems by macrophytes and their ecological impacts: a review of tropical freshwater ecosystems. Hydrobiologia, v. 746, n. 1, p. 39-59, 2015. [CrossRef]
- Patel, S. Threats, management and envisaged utilizations of aquatic weed Eichhornia crassipes: an overview. Reviews in Environmental Science and Bio/Technology, v. 11, n. 3, p. 249-259, 2012. [CrossRef]
- Sanchez-Galvan, G. et al. Assessment of the hyperaccumulating lead capacity of Salvinia minima using bioadsorption and intracellular accumulation factors. Water, Air, and Soil Pollution, v. 194, n. 1, p. 77-90, 2008. [CrossRef]
- Nichols, P. B.; Couch, J. D.; Al-Hamdani, S. H. Selected physiological responses of Salvinia minima to different chromium concentrations. Aquatic Botany, v. 68, n. 4, p. 313-319, 2000. [CrossRef]
- Alahuhta, J. et al. Macroecology of macrophytes in the freshwater realm: Patterns, mechanisms and implications. Aquatic Botany, v. 168, p. 103325, 2021. [CrossRef]
- Lind, L.; Eckstein, R. L.; Relyea, R. A. Direct and indirect effects of climate change on distribution and community composition of macrophytes in lentic systems. Biological Reviews, 2022. [CrossRef]
- Hintz, W. D., Schuler, M. S., Borrelli, J. J., Eichler, L. W., Stoler, A. B., Moriarty, V. W., ... & Relyea, R. A. (2020). Concurrent improvement and deterioration of epilimnetic water quality in an oligotrophic lake over 37 years. Limnology and Oceanography, 65(5), 927-938. [CrossRef]
- Gubiani, E. A. et al. Metapopulation models predict the temporal response of two macrophytes to drought in a subtropical water reservoir. Ecological Engineering, v. 100, p. 1-7, 2017. [CrossRef]
- Chaudhry, S; Sidhu, G.P.S. Climate change regulated abiotic stress mechanisms in plants: a comprehensive review. Plant Cell Reports, p. 1-31, 2021. [CrossRef]
- Battarbee, R. W. et al. Comparing palaeolimnological and instrumental evidence of climate change for remote mountain lakes over the last 200 years. Journal of Paleolimnology, v. 28, n. 1, p. 161-179, 2002. [CrossRef]
- Santamaría, L. Why are most aquatic plants widely distributed? Dispersal, clonal growth and small-scale heterogeneity in a stressful environment. Acta oecologica, v. 23, n. 3, p. 137-154, 2002. [CrossRef]
- Tourinho, L.; Vale, M.M. Choosing among correlative, mechanistic and hybrid models of species’ niche and distribution. Integrative Zoology, 2021.
- Silva, R. S. Impactos do aquecimento global na distribuição espaço-temporal do tomateiro e do inseto praga Neoleucinodes elegantalis. 2016.
- Jae-Min, J. et al. Prediction for potential distribution of yellow crazy ant (Anoplolepis Gracilipes) in response to climate change scenario. p. 313-313, 2016.
- Duque, T. S. et al. Potential Distribution of and Sensitivity Analysis for Urochloa panicoides Weed Using Modeling: An Implication of Invasion Risk Analysis for China and Europe. Plants, v. 11, n. 13, p. 1761, 2022. [CrossRef]
- Barroso, G. M. et al. Spatio-Temporal Distribution of Digitaria insularis: Risk Analysis of Areas with Potential for Selection of Glyphosate-Resistant Biotypes in Eucalyptus Crops in Brazil. Sustainability, v. 13, n. 18, p. 10405, 2021. [CrossRef]
- Kriticos, D. J.; Brunel, S. Assessing and managing the current and future pest risk from water hyacinth, (Eichhornia crassipes), an invasive aquatic plant threatening the environment and water security. PloS one, v. 11, n. 8, p. e0120054, 2016.
- Araújo, F. H. V. et al. Modelling climate suitability for Striga asiatica, a potential invasive weed of cereal crops. Crop Protection, v. 160, p. 106050, 2022. [CrossRef]
- Ferreira, S. R.; Dos Santos, J. C. B.; Ferreira, A. Análise de risco da invação biologica de Amaranthus palmeri no mundo frente às mudanças climáticas. Congresso Técnico Científico da Engenharia e da Agronomia – CONTECC, 2021.
- Chen, Y.; Yu, J.; Khan, S. Spatial sensitivity analysis of multi-criteria weights in GIS-based land suitability evaluation. Environmental modelling & software, v. 25, n. 12, p. 1582-1591, 2010. [CrossRef]
- Tavana, M.; Soltanifar, M.; Santos-Arteaga, F. J. Analytical hierarchy process: revolution and evolution. Annals of Operations Research, p. 1-29, 2021. [CrossRef]
- GBIF.org, Global Biodiversity Information Facility. Urochloa subquadripara (Trin.) R.D.Webster. Disponível em: <https://www.gbif.org/pt/species/2705869>. Acesso em: 20 de agosto de 2022a. [CrossRef]
- GBIF.org, Global Biodiversity Information Facility. Eichhornia crassipes (Mart.) Solms. Disponível em: <https://www.gbif.org/pt/species/2705869>. Acesso em: 21 de agosto de 2022b. [CrossRef]
- GBIF.org, Global Biodiversity Information Facility. Salvinia minima var. minima. Disponível em: <https://www.gbif.org/pt/species/2705869>. Acesso em: 20 de agosto de 2022c. [CrossRef]
- CABI, Invasive Species Compendium. Salvinia minima var. minima. Disponível em:< https://www.cabi.org/isc/datasheet/55773>. Acesso em: 20 de agosto de 2022a.
- CABI, Invasive Species Compendium. Urochloa subquadripara (Trin.) R.D.Webster. Disponível em:< https://www.cabi.org/isc/datasheet/55773>. 20 de agosto de 2022b.
- Kriticos, D. J. et al. Exploring the effects of climate on plants, animals and diseases. CLIMEX Version, v. 4, p. 184, 2015.
- Shelford, V. E. The ecology of North America. Urbana, IL. 1963. 10, p. 1237-1243, 2018.
- Teuton, T. C. et al. Factors affecting seed germination of tropical signalgrass (Urochloa subquadripara). Weed Science, v. 52, n. 3, p. 376-381, 2004. [CrossRef]
- Nahdi, M. S.; Darsikin, D. Distribusi dan Kemelimpahan Spesies Tumbuhan Bawah pada Naungan Pinus mercusii, Acacia auriculiformis dan Eucalyptus alba di Hutan Gama Giri Mandiri, Yogyakarta. Jurnal Natur Indonesia, v. 16, n. 1, p. 33-41, 2014. https://natur.ejournal.unri.ac.id/index.php/JN/article/view/2753/2696.
- St. Luce, M.; Gouveia, G. G.; Eudoxie, G. D. Comparative effects of food processing liquid slurry and inorganic fertilizers on tanner grass (Brachiaria arrecta) pasture: grass yield, crude protein and P levels and residual soil N and P. Grass and Forage Science, v. 72, n. 3, p. 401-413, 2017. https://doi-org.ez36.periodicos.capes.gov.br/10.1111/gfs.12240.
- Perozo-Bravo, A.; González, B.; Ortega-Alcalá, J. Efecto de la presión de pastoreo y la suplementación estratégica sobre la composición de la materia seca del pasto tanner (Brachiaria arrecta) antes y después del pastoreo. Revista de la Facultad de Agronomía, v. 26, n. 1, p. 39-58, 2009.
- Jack, H. et al. The mineral content of some tropical forages commonly used in small ruminant production systems in the Caribbean–Part 2. Tropical Agriculture, v. 97, n. 1, 2020.
- Galvão, A. K. L. et al. Levantamento fitossociológico em pastagens de várzea no Estado do Amazonas. Planta daninha, v. 29, p. 69-75, 2011. [CrossRef]
- Botero, S., & Martínez, S. (2017). Análise produtiva de dois modelos de suplementação de pastagem para mitigar o impacto da estação seca no gado de engorda em Montería, Colômbia (Dissertação de doutorado, Zamorano, Escuela Agricola Panamericano, 2017.).
- Evangelista, H. B. et al. Shade provided by riparian plants and biotic resistance by macrophytes reduce the establishment of an invasive Poaceae. Journal of Applied Ecology, v. 54, n. 2, p. 648-656, 2017. https://doi-org.ez36.periodicos.capes.gov.br/10.1111/1365-2664.12791.
- Penfound, W. T., & Earle, T. T. (1948). The biology of the water hyacinth. Ecological Monographs, 447-472.
- Yan, S. H., Song, W., & Guo, J. Y. (2017). Advances in management and utilization of invasive water hyacinth (Eichhornia crassipes) in aquatic ecosystems–a review. Critical reviews in biotechnology, 37(2), 218-228. [CrossRef]
- Howard, G. W.; Harley, K. L. S. How do floating aquatic weeds affect wetland conservation and development? How can these effects be minimised?. Wetlands Ecology and Management, v. 5, n. 3, p. 215-225, 1997. [CrossRef]
- Spencer, D. F.; Ksander, G. G. Seasonal growth of waterhyacinth in the Sacramento/San joaquin Delta, California. 2005.
- De Lacerda, L. P. et al. Growth and differential salinity reduction between Portulaca oleracea and Eichhornia crassipes in experimental hydroponic units. Environmental technology, v.40, n.17, p. 2267-2275, 2019. [CrossRef]
- Imchen, T.; Sawant, S. S.; Ezaz, W. Exposure of Eichhornia crassipes (Mart.) Solms to salt water and its implications. Current Science, p. 439-443. 2017. [CrossRef]
- Albano Pérez, E.; Ruiz Téllez, T.; Sánchez Guzmán, J. M. Influence of physico-chemical parameters of the aquatic medium on germination of Eichhornia crassipes seeds. Plant Biology, v.13, n.4, p.643-648, 2011.
- Venter, N. et al. The amphibious invader: Rooted water hyacinth’s morphological and physiological strategy to survive stranding and drought events. Aquatic botany, v. 143, p. 41-48, 2017. [CrossRef]
- GBIF.org, Global Biodiversity Information Facility. Salvinia ×molesta D.S.Mitch.. Disponível em: <https://www.gbif.org/pt/species/2705869>. Acesso em: 18 de janeiro de 2023d. [CrossRef]
- Al-Hamdani, S. H.; Ghazal, J. J. Selected physiological responses of Salvinia minima to various temperatures and light intensities. American Fern Journal, v. 99, n. 3, p. 155-161, 2009. [CrossRef]
- Ponce, S. C. et al. Effect of solution pH on the dynamic of biosorption of Cr (VI) by living plants of Salvinia minima. Ecological Engineering, v. 74, p. 33-41, 2015. [CrossRef]
- Prado, C. et al. Differential physiological responses of two Salvinia species to hexavalent chromium at a glance. Aquatic Toxicology, v. 175, p. 213-221, 2016. [CrossRef]
- Room, P. M. Equations relating growth and uptake of nitrogen by Salvinia molesta to temperature and the availability of nitrogen. Aquatic Botany, v. 24, n. 1, p. 43-59, 1986. [CrossRef]
- Van Der Heide, T. et al. A simple equation for describing the temperature dependent growth of free-floating macrophytes. Aquatic Botany, v. 84, n. 2, p. 171-175, 2006. [CrossRef]
- Whiteman, J. B.; Room, P. M. Temperatures lethal to Salvinia molesta Mitchell. Aquatic Botany, v. 40, n. 1, p. 27-35, 1991. [CrossRef]
- Oliver, J. D. A review of the biology of giant Salvinia. 1993.
- Paudel, S.; Milleville, A.; Battaglia, L. L. Responses of native and invasive floating aquatic plant communities to salinity and desiccation stress in the southeastern US coastal floodplain forests. Estuaries and Coasts, v. 41, n. 8, p. 2331-2339, 2018. [CrossRef]
- Kriticos, D. J. et al. CliMond: global high-resolution historical and future scenario climate surfaces for bioclimatic modelling. Methods in Ecology and Evolution, v. 3, n. 1, p. 53-64, 2012. [CrossRef]
- Hossain, M. S.; Das, N. G. GIS-based multi-criteria evaluation to land suitability modelling for giant prawn (Macrobrachium rosenbergii) farming in Companigonj Upazila of Noakhali, Bangladesh. Computers and electronics in agriculture, v. 70, n. 1, p. 172-186, 2010. [CrossRef]
- Marinoni, O. Implementation of the analytical hierarchy process with VBA in ArcGIS. Computers & Geosciences, v. 30, n. 6, p. 637-646, 2004. https://doi-org.ez36.periodicos.capes.gov.br/10.1016/j.cageo.2004.03.010.
- Ohta, K. et al. Analysis of the geographical accessibility of neurosurgical emergency hospitals in Sapporo city using GIS and AHP. International journal of geographical information science, v. 21, n. 6, p. 687-698, 2007. [CrossRef]
- Marinoni, O. et al. The multiple criteria analysis tool (MCAT): A new software tool to support environmental investment decision making. Environmental Modelling & Software, v. 24, n. 2, p. 153-164, 2009. [CrossRef]
- Saaty, T. L. A scaling method for priorities in hierarchical structures. Journal of mathematical psychology, v. 15, n. 3, p. 234-281, 1977. [CrossRef]
- Saaty, T. L.; Vargas, L. G. Prediction, projection and forecasting: applications of the analytic hierarchy process in economics, finance, politics, games and sports. Boston: Kluwer Academic Publishers, 1991.
- Kumar, M.; Shaikh, V. R. Site suitability analysis for urban development using GIS based multicriteria evaluation technique. Journal of the Indian Society of Remote Sensing, v. 41, n. 2, p. 417-424, 2013. https://doi-org.ez36.periodicos.capes.gov.br/10.1007/s12524-012-0221-8.
- Lehner, B.; Döll, P. Development and validation of a global database of lakes, reservoirs and wetlands. Journal of hydrology, v. 296, n. 1-4, p. 1-22, 2004. [CrossRef]
- Carniatto, N., Cunha, E. R., Thomaz, S. M., Quirino, B. A., & Fugi, R. (2020). Feeding of fish inhabiting native and non-native macrophyte stands in a Neotropical reservoir. Hydrobiologia, 847(6), 1553-1563. [CrossRef]
- Morrone, O., & Zuloaga, F. O. (2006). Novedades para la flora del nordeste de la Argentina. Hickenia, 3, 9-29.
- Gaibor Litardo, J. R. (2020). Análisis de fuentes nitrogenadas en los pastos Brachiaria en el cantón Babahoyo (Bachelor's thesis, BABAHOYO: UTB, 2020).
- Herrera, A. M., Martínez, N., Herrera, P., Colmenares, O., & Birbe, B. (2009). Consumo de heno y producción de leche en vacas doble propósito suplementadas con bloques multinutricionales. Zootecnia Tropical, 27(4), 465-473.
- Perozo-Bravo, A., González, B., Ortega-Alcalá, J., Fuenmayor, A., & Pirela, M. (2013). Evaluación de la presión de pastoreo en tanner (Urochloa arrecta) y la suplementación estratégica en mautas mestizas en bosque húmedo tropical y suelos ácidos. Revista Científica, 23(2), 150-156.
- Vonbank, J. A. et al. Water hyacinth (Eichhornia crassipes) invasion and establishment in a temperate river system. River Research and Applications, v. 34, n. [CrossRef]
- Gettys, L. A.; Thayer, K. L.; Sigmon, J. W. Phytotoxic Effects of Acetic Acid and d-limonene on Four Aquatic Plants. HortTechnology, v. 32, n. 2, p. 110-118, 2022. [CrossRef]
- Parys, K. A.; Johnson, S. J. Biological control of common Salvinia (Salvinia minima) in Louisiana using Cyrtobagous salviniae (Coleoptera: Curculionidae). Florida Entomologist, v. 96, n. 1, p. 10-18, 2013. [CrossRef]
- Rowe, C. A.; Hauber, D. P.; Wolf, P. G. Genomic variation of introduced Salvinia minima in southeastern United States. Aquatic Botany, v. 151, p. 38-42, 2018. [CrossRef]
- Jacono, C.C.; Davern, T. R.; Center, T. D. The adventive status of Salvinia minima and S. molesta in the southern United States and the related distribution of the weevil Cyrtobagous salviniae. Castanea, p. 214-226, 2001.
- Murphy, K. et al. World distribution, diversity and endemism of aquatic macrophytes. Aquatic Botany, v. 158, p. 103127, 2019. [CrossRef]
- Köppen, W.; Geiger, R. Klimate der Erde. Gotha: Verlag Justus Perthes. 1928.
- Fleming, J. P.; Dibble, E. D. Ecological mechanisms of invasion success in aquatic macrophytes. Hydrobiologia, v. 746, n. 1, p. 23-37, 2015. [CrossRef]
- Leal, R. P. et al. The success of an invasive Poaceae explained by drought resilience but not by higher competitive ability. Environmental and Experimental Botany, v. 194, p. 104717, 2022. [CrossRef]
- Bianco, S.et al. Crescimento e nutrição mineral de Urochloa arrecta. Planta Daninha, v. 33, p. 33-40, 2015.
- Lukács, B. A., Sramkó, G., & Molnár, A. (2013). Plant diversity and conservation value of continental temporary pools. Biological Conservation, 158, 393-400. [CrossRef]
- Lawlor, D. W. Genetic engineering to improve plant performance under drought: physiological evaluation of achievements, limitations, and possibilities. Journal of experimental botany, v. 64, n. 1, p. 83-108, 2013. [CrossRef]
- Villamagna, A. M.; Murphy, B. R. Ecological and socio-economic impacts of invasive water hyacinth (Eichhornia crassipes): a review. Freshwater biology, v. 55, n. 2, p. 282-298, 2010. [CrossRef]
- EPPO. European and mediterranean plant protection organization organisation europeenne et mediterraneenne pour la protection des plantes. Report of a Pest Risk Analysis: Eichhornia crassipes. OEPP/EPPO Boletim 38: 441–449, 2008.
- Coetzee, J. A. Into Africa: Salvinia minima Baker (Salviniaceae) invades South Africa. BioInvasions Records, v. 11, n. 4, p. 1011-1018, 2022. [CrossRef]
- Tipping, P. W. et al. Ecology of common salvinia, Salvinia minima Baker, in southern Florida. Aquatic botany, v. 102, p. 23-27, 2012. [CrossRef]
- Long, R.W.; Lakela, O. Flora of tropical Florida. Fla., University of Miami Press, 1971.
- Abdul Aziz, N. I. H. et al. Phytoremediation of TSS, NH3-N and COD from Sewage Wastewater by Lemna minor L., Salvinia minima, Ipomea aquatica and Centella asiatica. Applied Sciences, v. 10, n. 16, p. 5397, 2020.
- Prado, C. et al. Uptake of chromium by Salvinia minima: effect on plant growth, leaf respiration and carbohydrate metabolism. Journal of Hazardous Materials, v. 177, n. 1-3, p. 546-553, 2010. [CrossRef]
- Castro-Longoria, E. et al. Biosynthesis of lead nanoparticles by the aquatic water fern, Salvinia minima Baker, when exposed to high lead concentration. Colloids and Surfaces B: Biointerfaces, v. 114, p. 277-283, 2014. [CrossRef]
- Iha, D. S., E Bianchini Jr, I. Phytoremediation of Cd, Ni, Pb and Zn by Salvinia minima. International journal of phytoremediation, v. 17, n. 10, p. 929-935, 2015.
- Guimarães, F. P. et al. Potential of macrophytes for removing atrazine from aqueous solution. Planta daninha, v. 29, p. 1137-1147, 2011. [CrossRef]
- Shabani, F.; Kumar, L.; Esmaeili, A. Future distributions of Fusarium oxysporum f. spp. in European, Middle Eastern and North African agricultural regions under climate change. Agriculture, ecosystems & environment, v. 197, p. 96-105, 2014. [CrossRef]
- IPCC, 2018. Framing and Context. In: Global Warming of 1.5°C. An IPCC Special Report on the impacts of global warming of 1.5°C above pre-industrial levels and related global greenhouse gas emission pathways, in the context of strengthening the global response to the threat of climate change, sustainable development, and efforts to eradicate poverty. Disponível em: <https://www.ipcc.ch/sr15/>. Acesso em: 22 de dezembro de 2022.
- Hondzo, M., & Stefan, H. G. (1991). Three case studies of lake temperature and stratification response to warmer climate. Water Resources Research, 27(8), 1837-1846. [CrossRef]
- Alahuhta, J. et al. Climate change and the future distributions of aquatic macrophytes across boreal catchments. Journal of Biogeography, v. 38, n. 2, p. 383-393, 2011. [CrossRef]
- Chandrasena, N. et al. How will weed management change under climate change? Some perspectives. Journal of Crop and Weed, v. 5, n. 2, p. 95-105, 2009.
- Maberly, S. C., O’Donnell, R. A., Woolway, R. I., Cutler, M. E., Gong, M., Jones, I. D., ... & Tyler, A. N. (2020). Global lake thermal regions shift under climate change. Nature Communications, 11(1), 1232. [CrossRef]
- Bellard, C. et al. Will climate change promote future invasions?. Global change biology, v. 19, n. 12, p. 3740-3748, 2013. [CrossRef]
- Lacoul, P.; Freedman, B. Environmental influences on aquatic plants in freshwater ecosystems. Environmental Reviews, v. 14, n. 2, p. 89-136, 2006. [CrossRef]
- Kundzewicz, Z. W. et al. The implications of projected climate change for freshwater resources and their management. Hydrological Sciences Journal, v. 53, n. 1, p. 3-10, 2008. [CrossRef]
- Johnson, P. T. J.; Olden, J. D.; Vander Zanden, M. J. Dam invaders: Impoudments facilitate biological invasions into freshwaters. Frontiers in Ecology and the Environment, n. 7, p. 357-363, 2008.
- Ruhi, A. et al. Understanding the nexus between hydrological alteration and biological invasions. In: Multiple stressors in river ecosystems. Elsevier, 2019. p. 45-64. [CrossRef]
- Havel, J. E.; Lee, C. E.; Vander Zanden, J. M. Do reservoirs facilitate invasions into landscapes?. BioScience, v. 55, n. 6, p. 518-525, 2005. [CrossRef]
- CEMIG. Macrófitas Aquáticas. Caracterização e importância em reservatórios hidrelétricos. Disponível em: < https://www.cemig.com.br/wp-content/uploads/2021/03/livro-macrofitas-cemig-2021.pdf>. Acesso em 28 de setembro de 2022.
- ANA. Catálogo de metadados da Agência nacional de Águas. Disponível em: <https://metadados.snirh.gov.br/geonetwork/srv/api/records/56ac7cb5-aa22-4081-a135-c7fc0938a449>. Acesso em: 15 de novembro de 2022.
| Parameters | Index | Unit. | US | EC | SM |
|---|---|---|---|---|---|
| Lower temperature threshold | DV0 | ºC | 4 | 0.5 | 5 |
| Lower optimum temperature | DV1 | ºC | 22 | 25 | 23 |
| Upper optimum temperature | DV2 | ºC | 35 | 30 | 30 |
| Upper optimum threshold | DV3 | ºC | 39 | 36 | 39 |
| Lower soil moisture threshold | SM0 | -- | 0 | 0 | 0.1 |
| Lower optimum soil moisture | SM1 | -- | 0.1 | 0.1 | 0.2 |
| Upper optimum soil moisture | SM2 | -- | 8 | 8 | 8 |
| Upper soil moisture threshold | SM3 | -- | 10 | 10 | 10 |
| Cold stress temperature threshold | TTCS | ºC | 4 | 0.5 | 5 |
| Cold stress temperature rate | THCS | Week-1 | -0.001 | -0.0003 | -0.0003 |
| Cold stress degree-day threshold | DTCS | ºC day | 4 | ---- | ---- |
| Cold stress degree-day rate | DHCS | Week-1 | -0.01 | ---- | ---- |
| Heat Stress Temperature threshold | TTHS | ºC | 40 | 37 | 39 |
| Heat Stress Temperature rate | THHS | week-1 | 0.01 | 0.001 | 0.1 |
| Heat Stress Threshold | DTHS | ºC dia | 39 | ---- | 35 |
| Heat Stress Degree-day rate | DHHS | week-1 | 0.01 | ---- | 0.1 |
| Dry Stress Threshold | SMDS | -- | 0.1 | 0.02 | ---- |
| Dry Stress rate | HDS | week-1 | 0.005 | -0.005 | |
| Degree-days threshold | PPD | ºC dia | ---- | 1916 | ---- |
| Criteria | ||
|---|---|---|
| Criterion | Description | |
| Criterion 1 | Ecological niche for U. subquadripara | |
| Criterion 2 | Ecological niche for E. crassipes | |
| Criterion 3 | Ecological niche for S. mínima | |
| Criteria Classes | ||
| Description | Classe | Normalized value |
| EI = 0 | 0 | 0 |
| 0>EI>30 | 1 | 0.5 |
| EI>30 | 2 | 1 |
| Criterion 1 | Criterion 2 | Criterion 3 | |
|---|---|---|---|
| Criterion 1 | 1 | 5 | 5 |
| Criterion 2 | 0.2 | 1 | 1 |
| Criterion 3 | 0.2 | 1 | 1 |
| Criterion | Description | Weight* |
|---|---|---|
| Criterion 1 | Ecological Niche para U. subquadripara | 0.714 |
| Criterion 2 | Ecological Niche para E. crassipes | 0.143 |
| Criterion 3 | Ecological Niche para S. minima | 0.143 |
Disclaimer/Publisher’s Note: The statements, opinions and data contained in all publications are solely those of the individual author(s) and contributor(s) and not of MDPI and/or the editor(s). MDPI and/or the editor(s) disclaim responsibility for any injury to people or property resulting from any ideas, methods, instructions or products referred to in the content. |
© 2023 by the authors. Licensee MDPI, Basel, Switzerland. This article is an open access article distributed under the terms and conditions of the Creative Commons Attribution (CC BY) license (http://creativecommons.org/licenses/by/4.0/).


