
Submitted:
17 July 2023
Posted:
19 July 2023
You are already at the latest version
Abstract
At 100% penetration, intermittent renewable energy causes outages. To flatten the leaping supply and demand curves of renewable energy, an energy storage medium and carrier are required. The Hydrogen energy stotrage system (HydESS), which combines a proton exchange membrane (PEM)-based water electrolysis (WE) system and a fuel cell (FC), has the quickest response time, the longest duration, and the greatest storage capacity. HOMER tools for techno-economic analysis are used to evaluate the HydESS hybrid system. Kyiv, Ukraine, is appealing due to its spatial-temporal wind speed, solar irradiance, and energy security. With an LCOE of $0.245 kWh−1 and 9.3% fuel cell power output, the most feasible solution is onshore wind turbine-coupled PEMFC HydESS. As a result 1,000-kW wind power, 250-kW PEMFC, 250-kW PEMWE, and 441-kW BESS are optimized to serve a 3,900 kWh day academic residence load. When compared to a diesel generator and a BESS, the hybrid HydESS reduces CO2 emissions by 4,132 tons over a 25-year period. The LCOE of a hybrid HydESS system is determined by the SOFC lifetime rather than the PEMFC's 2% difference between 40,000 and 50,000 h with the same rated power. This study recommends accelerating PEMFC development with fluctuation-endurable materials and design.
Keywords:
techno-economic analysis
; hybrid optimization of multiple energy resources (HOMER)
; hybrid energy storage system (HESS)
; hydrogen energy storage system (HydESS)
; levelized cost of energy (LCOE)
; battery energy storage system (BESS)
Highlights
- Kyiv has considerable potent solar and wind energy for green hydrogen production.
- HOMER evaluates the techno-economic feasibility of a hybrid HydESS for renewables.
- The lowest LCOE is 0.245 $ kWh−1 from the Wind-HydESS-BESS hybrid system.
- The HydESS system consists of a 250-kW PEM fuel cell and a 250-kW electrolyzer.
- An additional benefit of HydESS is a reduction of CO2 to 4,132 tons for 25 yrs.
- The lifetime sensitivity of proton exchange membrane fuel cells is reduced, but the on-off time of 600 seconds is anticipated to be more severe.
1. Introduction
The utilization of fossil fuels by humanity for the advancement of civilization has led to a swift escalation in the atmospheric concentration of CO2. The aforementioned circumstances have given rise to climate crises, including global warming and atypical climate patterns. Consequently, the expeditious resolution of these issues has become an urgent imperative in order to safeguard both biodiversity and humanity. Among environmentally friendly alternative fuel candidates, hydrogen has a low carbon footprint, a high energy density, and a long-term storage capacity. Additionally, it has the advantage of energy storage due to its high energy density of 142 MJ kg−1 (higher heating value, HHV) [1]. Renewable energy-coupled water electrolysis minimizes CO2 emission during hydrogen production compared to steam methane reforming and grid-connected water electrolysis. Hybrid system from renewable energy and energy storage system (ESS) provides benefits such as self-sufficiency, expandability with grid connection, and climate adaptability from diverse power sources [2]. Among the ESS, the Hydrogen storage method has three distinct advantages compared to other energy storage systems. The advantages of hydrogen as an energy medium are high-volume storage, mid-long term load shifting, and clean energy in transportation or power generation applications [3].
As regulations and constraints on CO2 address the global climate crisis, a new global order to safeguard nationalism in energy trade is emerging. After Russia’s attack, EU urgently revised the hydrogen and renewable energy roadmap through the ‘REPower EU’ policy [4]. An outpost of neo cold war, Ukraine need to accelerate the energy self-sufficient transition for decarbonization claiming by International Renewable Energy Agency (IRENA) [5] and US National Renewable Energy Laboratory (NREL) [6]. The target is 68% reduction of total greenhouse gas (GHG) emissions from a thermal plant by 2050, based on the data of renewable energy trends and demand in Ukraine [7] and the sector management plan [8]. Accordingly, Ukraine build more onshore wind farm after war crisis as reported in Washington post in 2023 to commit the EU renewable energy policy [9].
The renewable energy potential of Ukraine is highly feasible due to its beneficial geometrical features. Most of the territory is flat plain suitable for agriculture. Furthermore, Kudria et al. [10] proposed the renewable energy potential from wind–hydrogen system in Ukraine due to the high wind speed compared to the other region. According to the study [10], the wind has 688 GW nominal capacity and 2174 TWh (2.174 PWh) annually on its territory and 43 million tons of green hydrogen (capacity factor: 24.04~54.55%). This wind-hydrogen potential of Ukraine territory is higher than in Japan, the United Kingdom, and Norway. Furthermore, a positive outlook is anticipated for market expansion to require the decarbonized energy demand [10]. Therefore, accurate scale and feasibility of renewable hydrogen in Kyiv should be evaluated by the technoeconomic analysis.
The establishment of renewable energy infrastructure and power utilities necessitates substantial financial resources and is perceived as a formidable undertaking, necessitating public and governmental authorizations prior to conducting technical economic evaluations. These evaluations encompass various stages such as engineering, procurement, and construction (EPC) processes, which are essential for the implementation of these systems. HOMER, a technoeconomic engineering tool known as Hybrid Optimization of Multiple Energy Resources, stands out as a highly accessible program for optimizing renewable energy systems and grids [11]. Its invention by the NREL further enhances its credibility and significance in the field. As climate crisis float on the surface of main objective in this era, the rate of growth in systematic analysis findings has exhibited a notable acceleration over the past triennium (2019-2021). Specifically, within the corpus of recent bibliometric research compilations, approximately 14 instances have been recorded wherein HOMER was employed as a tool for technoeconomic investigation out of a total of 120 papers [12].
Renewable energy shows significant flexibility and volatility, hence the distribution and storage problem restricts its deployment. There are several energy storage system options such as battery, flywheel, and hydrogen energy for distributing electricity spatially and temporarily for any system on and off grid with renewables [13]. Among the systems, the hydrogen energy storage system (HydESS) is possible to 100% decarbonize energy transfer compared to other technologies [12]. As the land scape, the onshore wind and photovoltaic (PV) have some advantages of geometrical proximity in electricity providers for metropolitan regions [14]. Moreover, distributed renewable energy systems could reduce infrastructural investment costs due to hydrogen pipelines or high-voltage cables for electricity transmission [15]. Heat and water utilization of renewable hydrogen system could be more effective to supplying buildings and small industrial facilities near cities [16]. Research facilities need backup power to prepare for research facility shutdowns that may occur due to power outages. In addition to the power supplied from the well-developed power grid in the city center or suburbs, it is a necessary item as an energy independent research facility to be able to store and use power from new and renewable energy.
The present study evaluates the economics of hydrogen, including production, storage, and usage in a stand-alone distributed power system, from two perspectives. First, A cost-effectiveness analysis of the HESS model, which included solid oxide fuel cell (SOFC) for stationary use and PEM water electrolysis (PEMWE) were also conducted. The installation region was identified using HOMER software, actual climatic data were established, and equipment was set up. After the optimized system design was calculated, the LCOE and other indices were obtained, compared, and assessed. Second, capital and operation cost sensitivity analysis of fuel cells, water electrolysis, and commercial loads linked to the system was used to check the distribution range of LCOE as Net present cost (NPC) This work provided a quick overview of the cost-effectiveness and specific directions for future system and component development initiatives.
2. Methodology
2.1. Research framework & Flow
Figure 1.
Schematices of Technoeconomic analysis using HOMER platform.
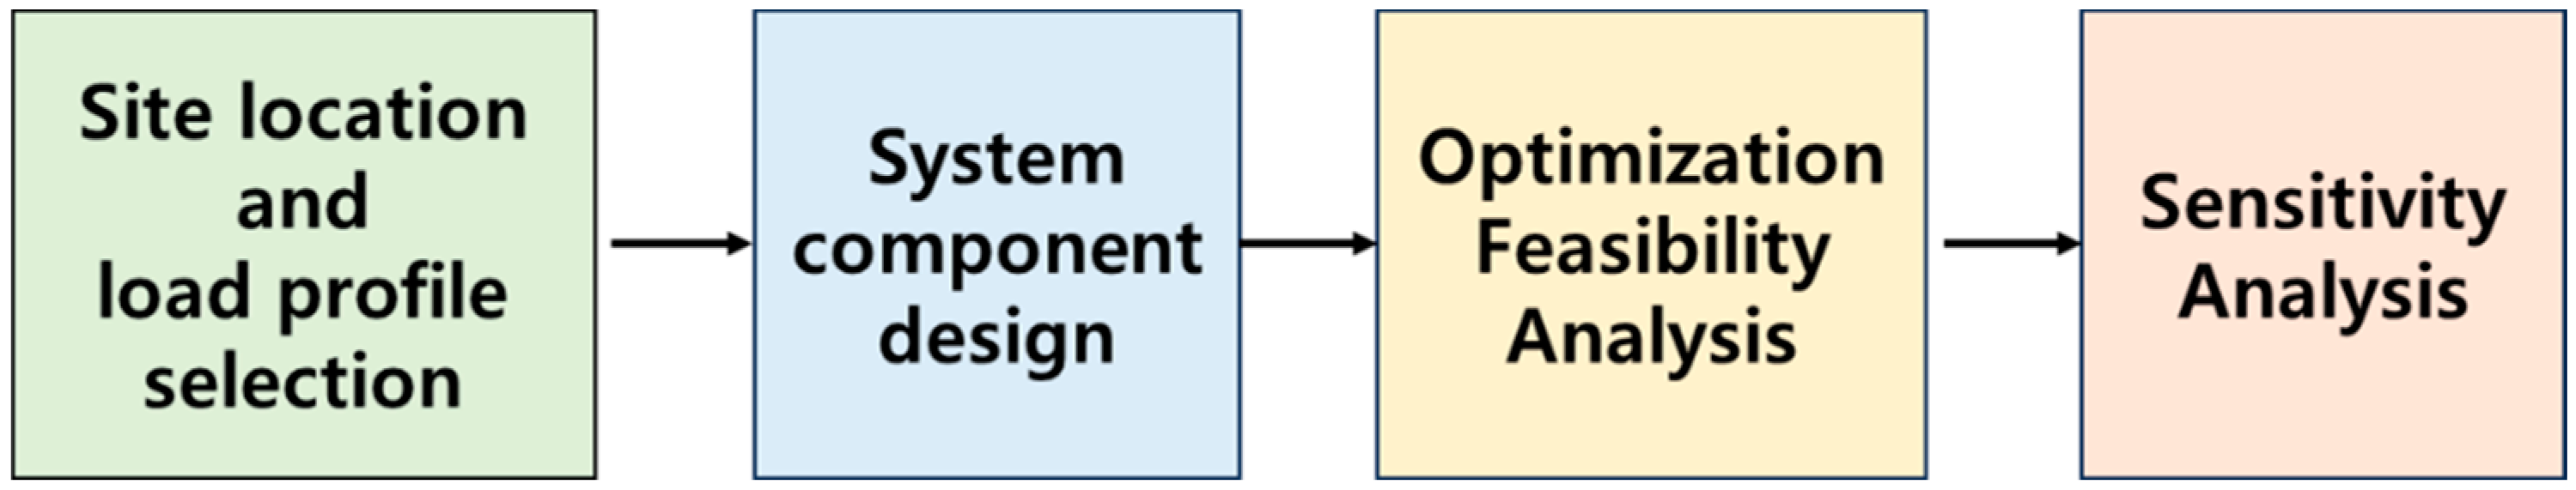
To analyzing the techno-economic research for hydrogen society, many approaches were applicated to quantification for hydrogen technologies. NREL invented the software HOMER for public research. It provides accurate climate data from the satellite in the specific region. The foremost advantage of the tool was the proposal of an optimized energy system via techno-economic analysis. The techno-economic study was carried out using HOMER to examine PEMWE’s LCOH for renewable energy-linked operation as well as LCOH change relied on system unit costs.
2.2. Literature Review
The carbon emission of thermal plants (Diesel power plant), including systems, exclude the plant in the literature survey. In any case, the benefit is mainly GHGs reduction, which is unsuitable energy storage compared to this work. The location of renewable energy generation site was limited to land and onshore due to the city. Offshore wind or floating PV were possible to transfer electricity, but the additional infrastructure cost could be added. There are many literature reviews including “Homer”, “hydrogen”, “Fuel cell” “electrolyzer”, “PV”, and “wind” in previous bibliometric analysis. By Scopus, total19 literatures were listed and then excluded the system containing diesel plant, and the finalized as six papers (17-22) are tabulated in Table 2.

Table 1.
Summary of publications conducting the technoeconomic analysis of energy storage systems including hydrogen using HOMER.
Table 1.
Summary of publications conducting the technoeconomic analysis of energy storage systems including hydrogen using HOMER.
| Ref |
Item | COE | NPC | PV | Wind | BESS | PEMWE | PEMFC | H2 tank | Region | AC load or Hydrogen demand |
| Objective | $ kWh−1 | $ | kW | kW | kW | kW | kW | kg | kWh day−1 kgH2 day−1 |
||
| [17] | BESS vs. HydESS comparison |
1.208 | 75,428 | 4 | 2 | 0 | 3 | 2 | 1 | Saudi Arabia | 14 kWh day−1 |
| [18] | BESS vs. HydESS comparison |
0.52 | 7,160,000 | 469 | 1500 | 396 | 350 | 100 | 500 | USA | 70 kgH2 day−1 |
| [19] | HydESS feasibility | 0.8399 | 1,006,293 | 120 | - | - | 60 | 13 | 20 | Spain | 200 kWh day−1 |
| [20] | HydESS case study |
1.901 | 910,415 | 1 | 1 | - | 150 | 1 | 100 | Oman | 12 kWh day−1 |
| [21] | PV vs. Wind comparison |
0.374 | 2,990,000 | 69 | 88 | 581 | 250 | 450 | 700 | Canada | 125 kgH2 day−1 |
| [22] | PV vs. Wind comparison |
0.366 | 5,276,069 | 900 | 700 | 1088 | 300-kW | 100 | 300 | Korea | 2187.6 kWh day−1 |
| This work |
BESS vs. HydESS comparison |
0.245 | 4,508,672 | 0 | 1,000 | 441 | 250 | 250 | 700 | Ukraine | 3,900 kWh day−1 |
Al-Sharafi et al. [17] evaluated the economic factor, LCOE as 1.208 $ kWh−1 in Abha area for the hydrogen production storage system, In the reference, the result of System #6 exhibits the minimum LCOE with 1.208 $ kWh−1 and LCOH is 43.3 $ kg−1. The optimum configuration has 4 kW PV array, two wind turbines, 2 kW converter, 2 kW fuel cell, 3 kW electrolyzer and 1 kg hydrogen tank. Another case by Abdin et al. [18] calculates the minimum COE as 0.5 $ kWh−1 for Golden Colorado equipped with 400 kg H2 tank. Peláez-Peláez et al. [19] simulated the LOCE as 0.8399 $ kWh−1 containing 20kg tank with PV coupled electrolyzer and fuel cell. Okonkwo et al. [20] conceptualized the system as PV, wind, fuel cell and hydrogen tank with LCOE, 1.901 $ kWh−1 in Oman and the hydrogen storage capacity was set to 100 kg tank. Babaei et al. [21] acquired LCOE 0.374 $ kWh−1 with the hydrogen based microgrid composed with PV, wind, fuel cell, hydrogen tank, and batteries in Saint Pierre Island caseRecently, Zhang et al. [22] optimized the off-grid hybrid energy system in Ui island. The system was composed of 990-kW PV panels, 700-kW wind turbines, a 1088-kWh Li-ion battery bank, 534-kW converter, 300-kW PEMWE system, 300-kg hydrogen tank, and 100-kW PEMFC. The total NPC of the system is $5,276,069, and the LCOE is 0.366 $ kWh−1. This case study proved that the self-sufficient energy system in isolated area for community demand without any auxillary power supply, and the hypotheses of the simulation results are limited by the low capacity factor of electrolyser. And the system showed the good feasibility compared to diesel plant, but the fuel cell was adopted as PEM type with 40,000 lifetime span. Moreover, the Battery cost is increased within a few years up to 596 $ kWh [23].
2.3. System and site outline
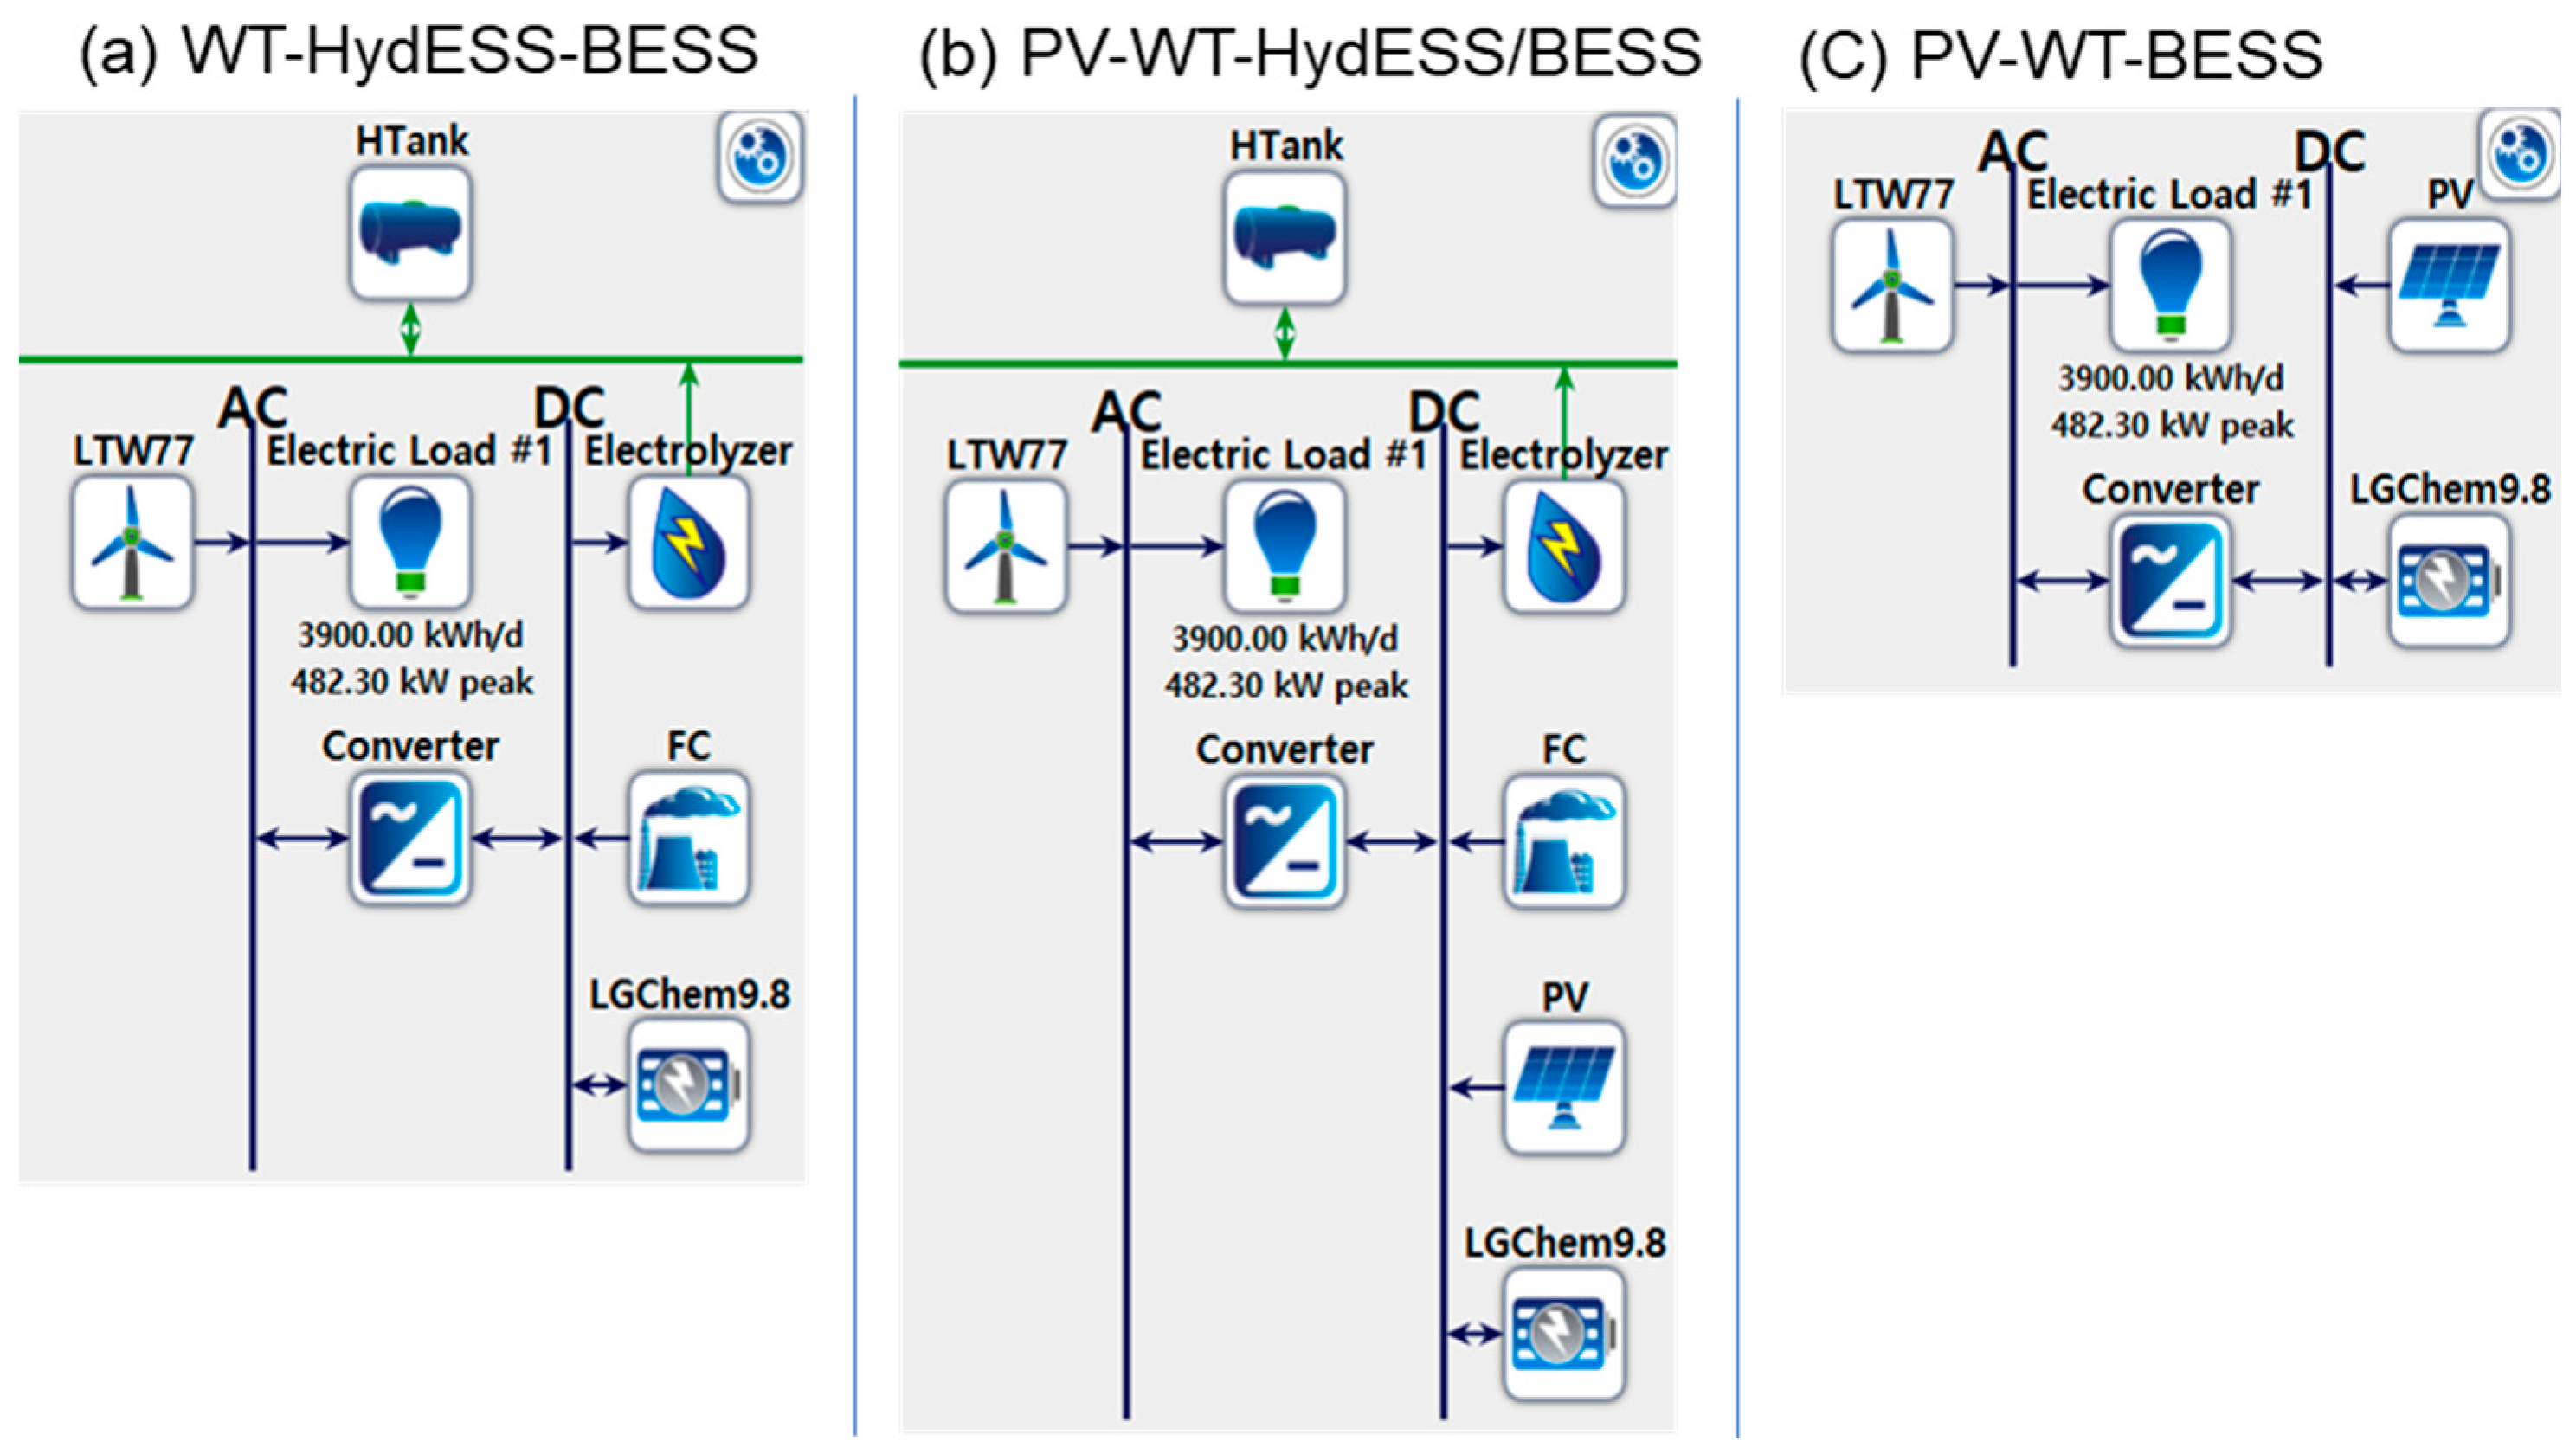
In this study, the optimum specifications of water electrolysis capacity and other ancillary devices were derived based on the system’s actual operation results, including the 1,000 kW-class wind turbine power generation. As simulation results, the NPC and the levelized cost of electricity (LCOE) were calculated. The optimized system result is resulted in Figure 2 from system (a) to system (c). The difference between system (a) and (b) is photovoltaic panel and the difference between (a, b) and (c) is HydESS usage. The most optimized system is (a), and it will be discussed in result and discussion section.
Figure 2.
Basic hybrid hydrogen energy storage system (HydESS) and battery energy storage system(BESS) configuration with renewable energy sources, PV, wind turbine.
Figure 2.
Basic hybrid hydrogen energy storage system (HydESS) and battery energy storage system(BESS) configuration with renewable energy sources, PV, wind turbine.
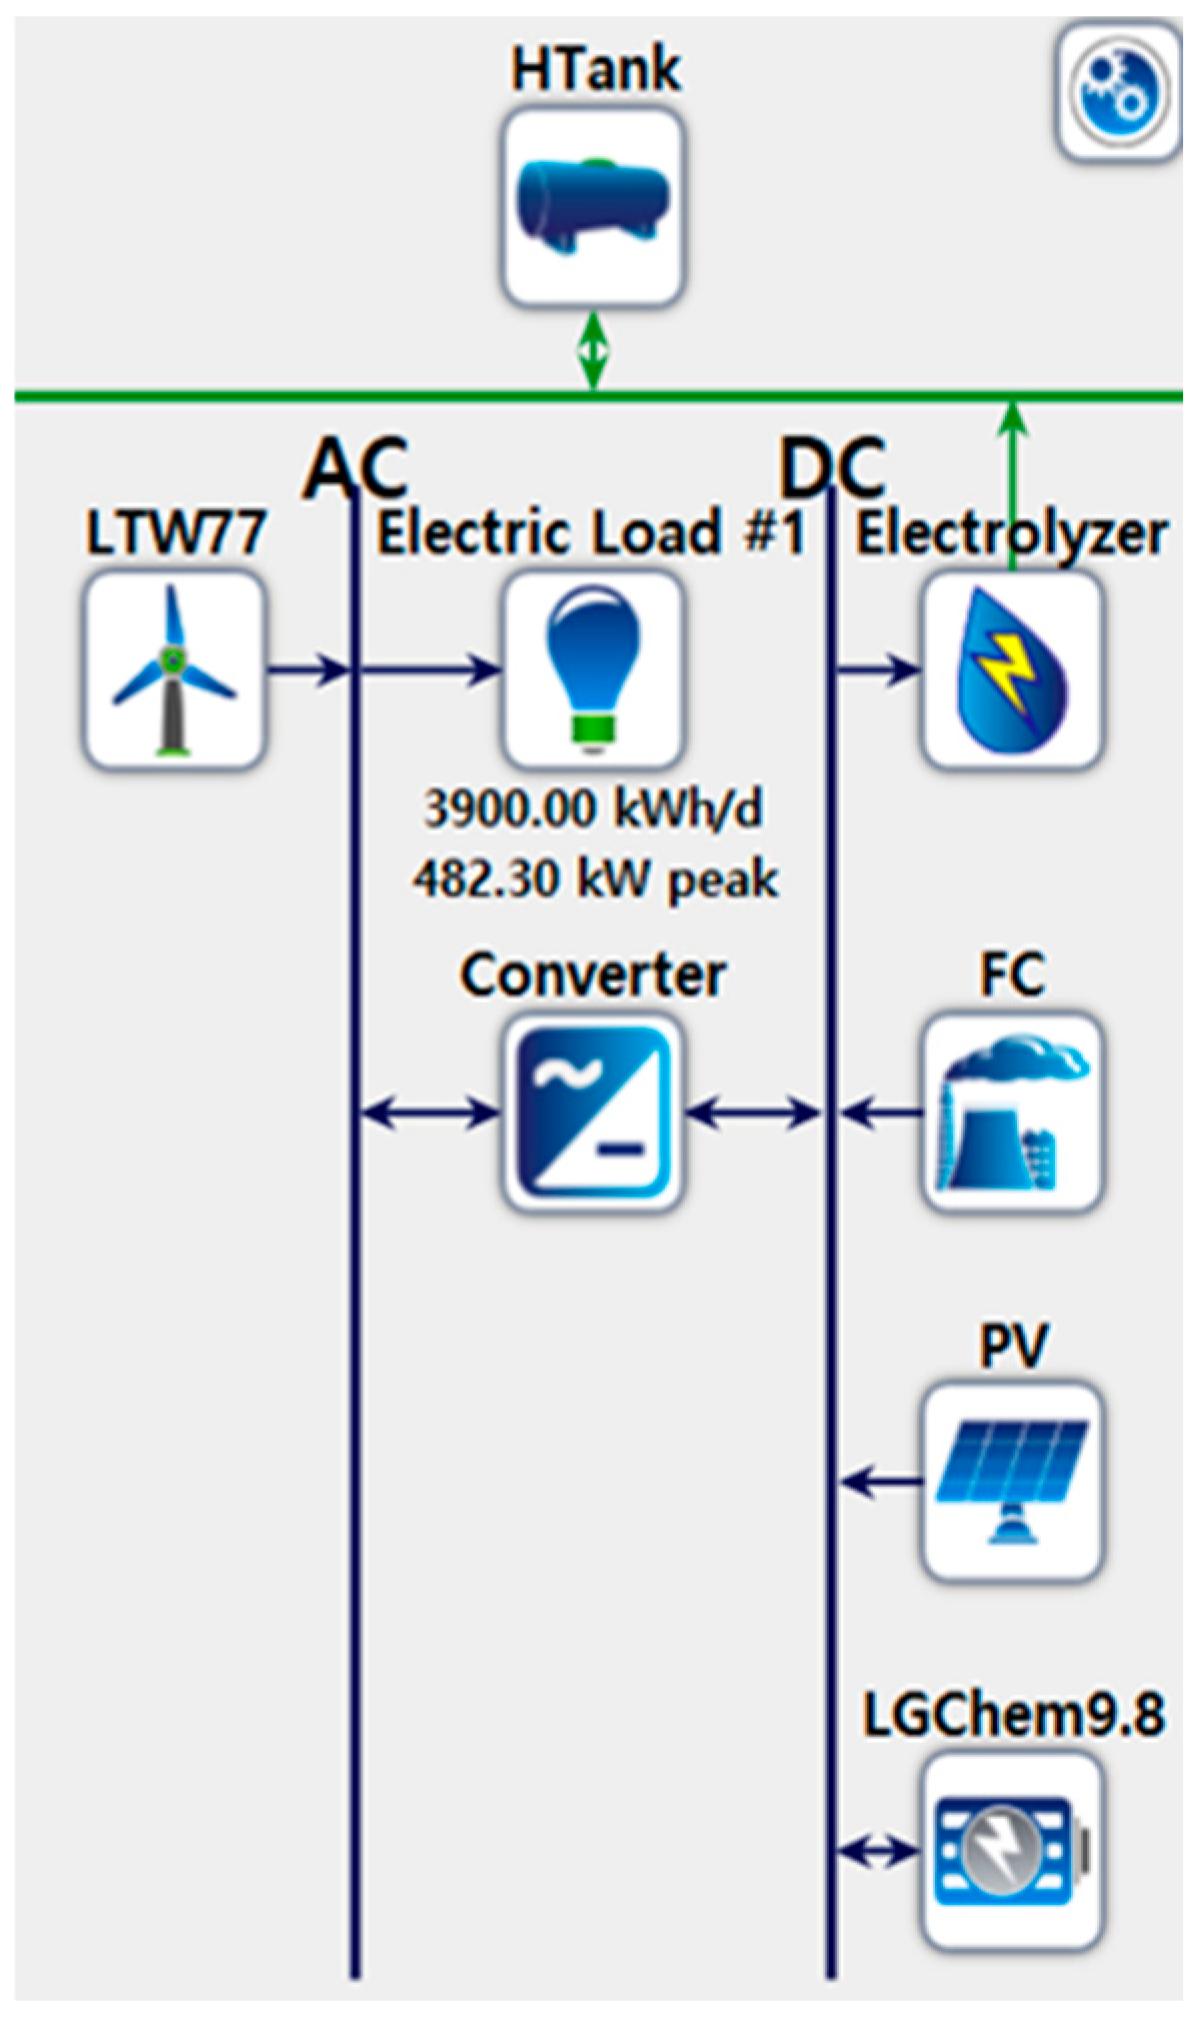
Figure 3.
Location of Igor Sikorsky Kyiv polytechnic institute in Kyiv, Ukraine (50°40.0’N, 30°59.5’E), (a) load view, (b) arial view, and (c) Igor Sikorsky Kyiv polytechnic institute building.
Figure 3.
Location of Igor Sikorsky Kyiv polytechnic institute in Kyiv, Ukraine (50°40.0’N, 30°59.5’E), (a) load view, (b) arial view, and (c) Igor Sikorsky Kyiv polytechnic institute building.
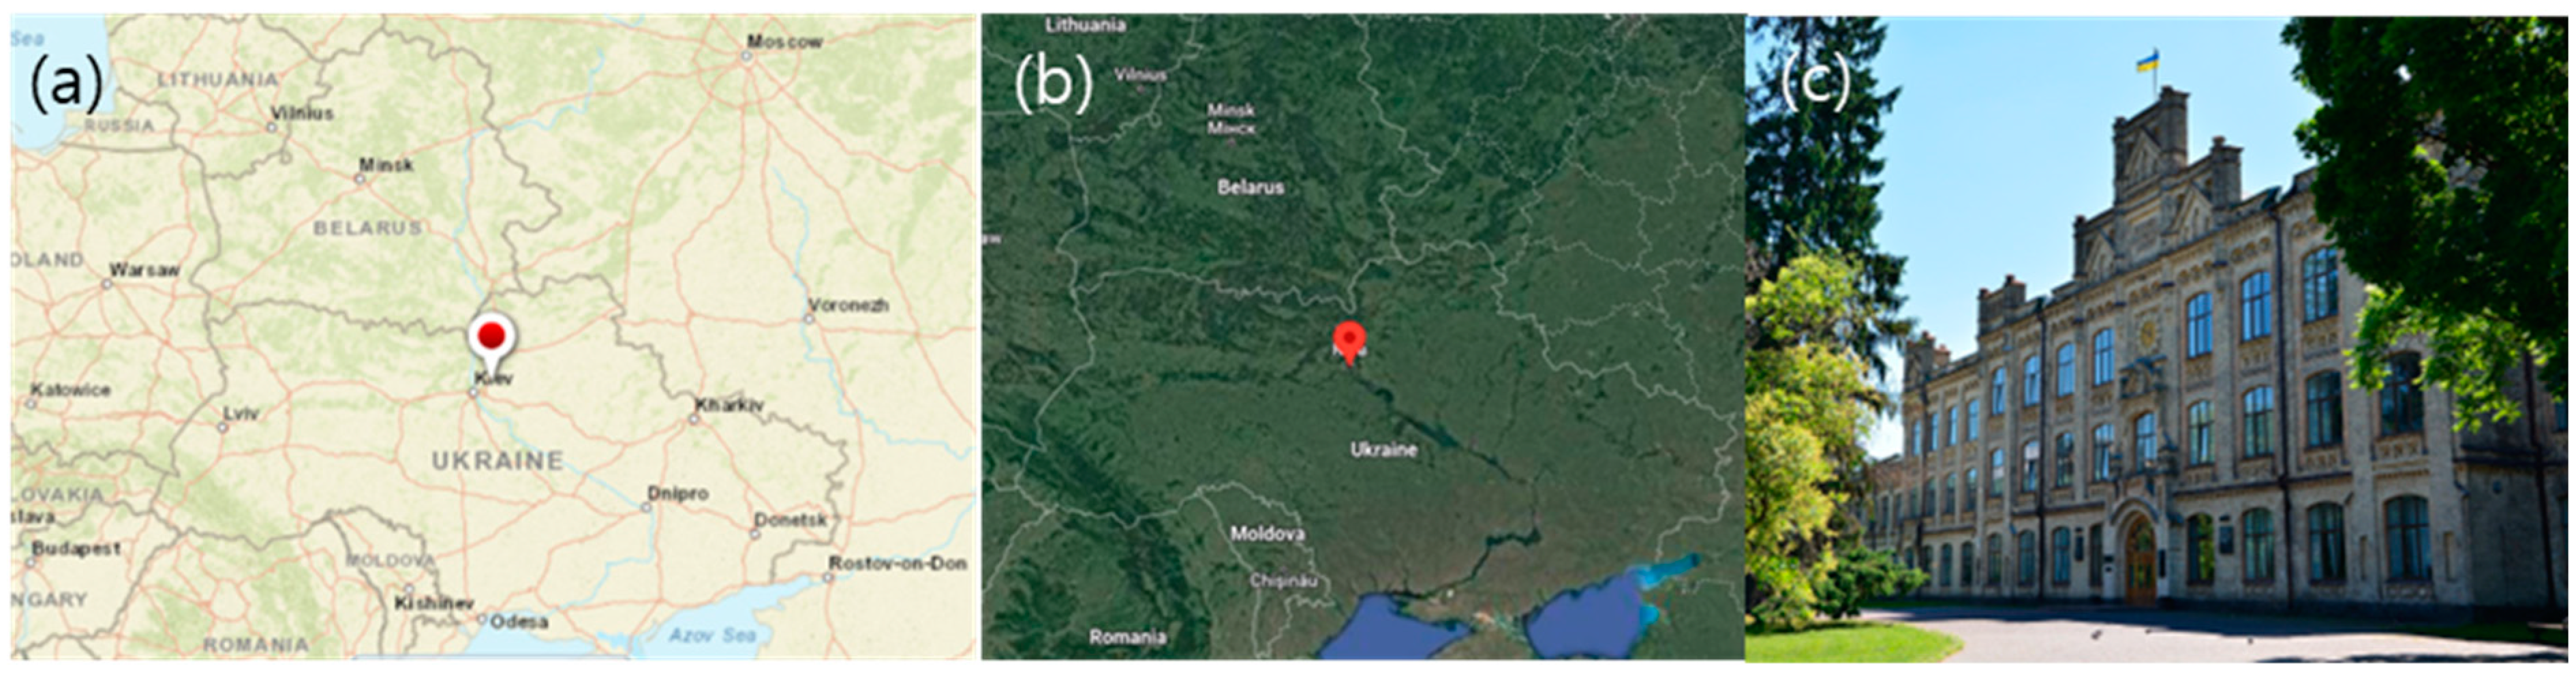
The capital city of Ukraine, Kyiv (50°40.0’N, 30°59.5’E) is studied as the subject of the analysis in Figure 4. This study limited on local area point is technoeconomic comparison between HydESS and BESS for renewable energy storage in Kyiv, capital of Ukraine, as center of culture and economy. The NASA satellite data was used to obtain statistics on average solar radiation and wind speed during a one-year period. According to Figure 4a, the yearly average solar radiation on Kyiv is 3.10 kWh m−2day−1. Additionally, clearness nearly cloudy independent on the season, from 0.367 in November and 0.496 in Aug. Referring to Figure 4b, the average wind speed was around 6.20 m s−1 when the wind turbine was erected at the height of 65 m above sea level. Temperature is coldest in January as −6.14 ℃ and hottest as 20.83 ℃ in July as shown in Figure 4c.
Figure 4.
Climate profile of Kyiv, (a) daily solar radiation and clearness index per month, (b) wind speed, and (c) temperature of Kyiv, Igor Sikorsky Kyiv Polytechnic Institute location in Ukraine.
Figure 4.
Climate profile of Kyiv, (a) daily solar radiation and clearness index per month, (b) wind speed, and (c) temperature of Kyiv, Igor Sikorsky Kyiv Polytechnic Institute location in Ukraine.
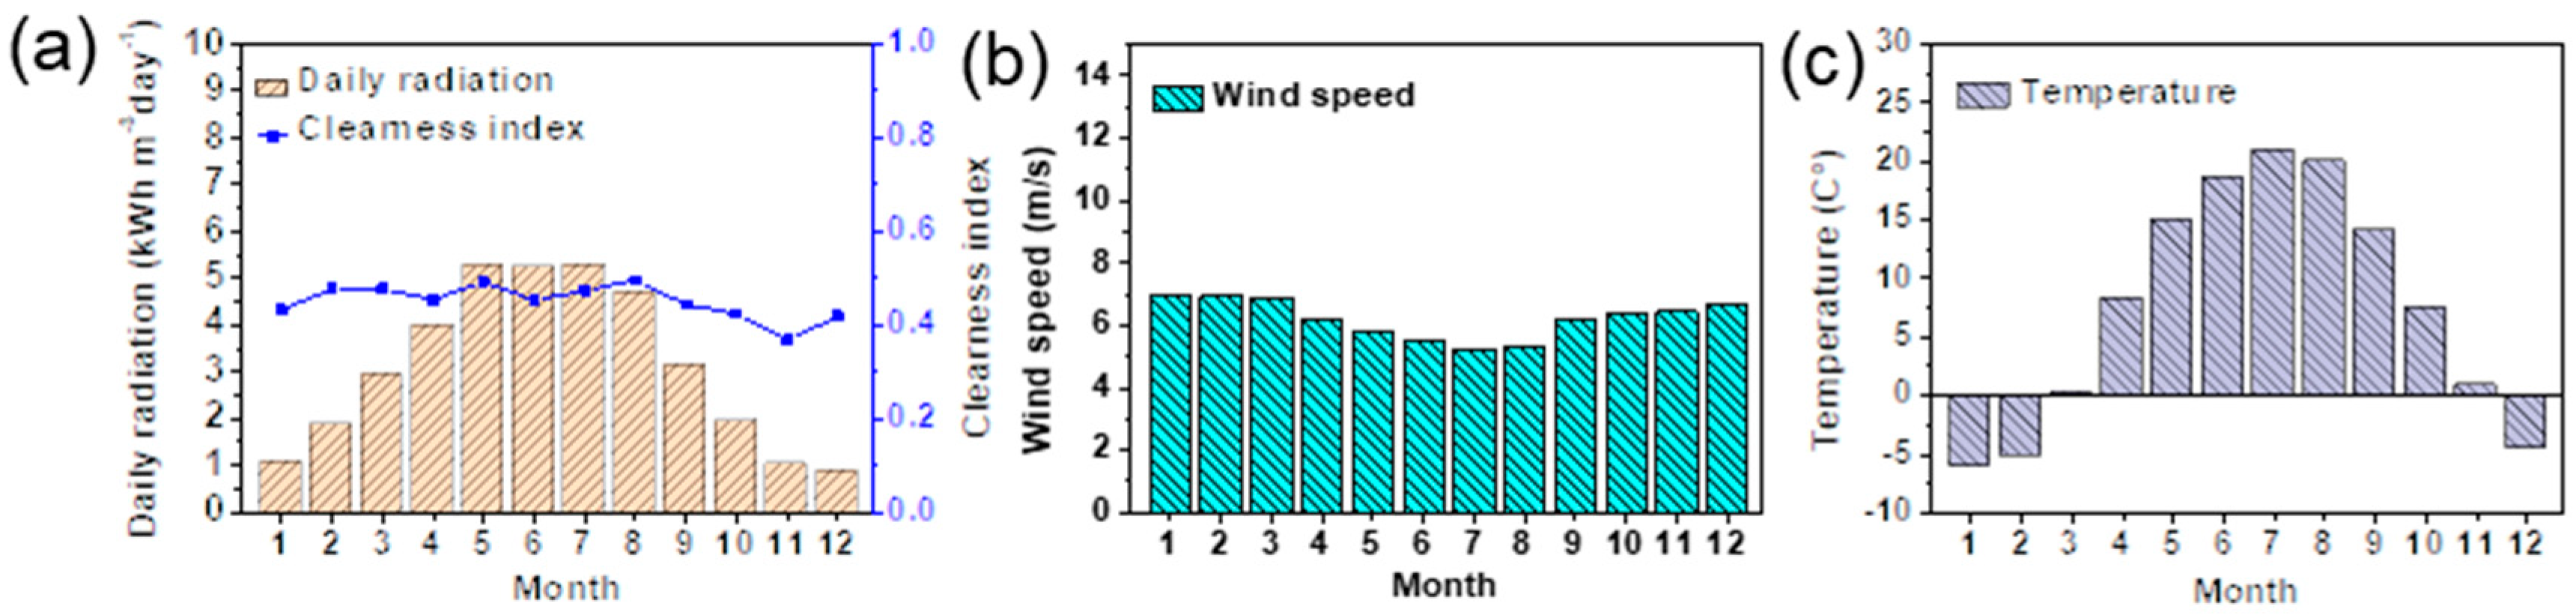
Figure 5.
AC Primary load profiles of Kyiv, (a) daily, (b) monthly, and (c) yearly of Kyiv, Igor Sikorsky Kyiv Polytechnic Institute location in Ukraine.
Figure 5.
AC Primary load profiles of Kyiv, (a) daily, (b) monthly, and (c) yearly of Kyiv, Igor Sikorsky Kyiv Polytechnic Institute location in Ukraine.
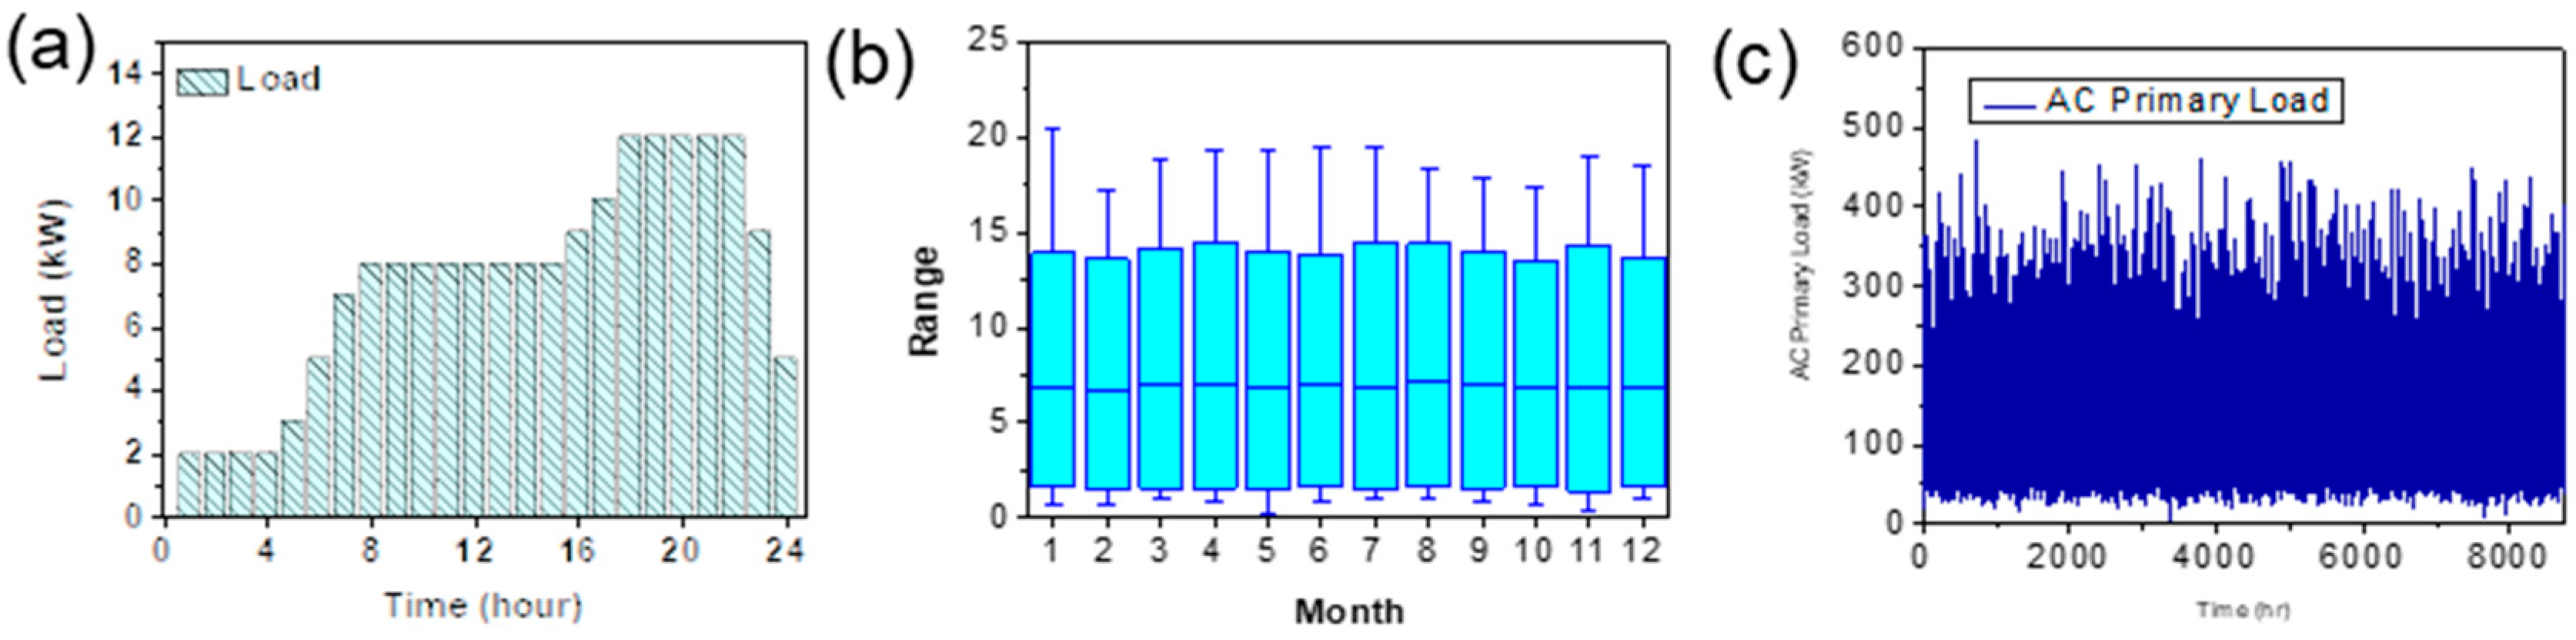
Power demand was set as a residence load provided as a sample case from HOMER to select the AC (alternating current) electric load scale size. As shown in Figure 4, the total daily load of 3,900 kWh day−1, and the maximum peak load is 482.3 kW and load factor is 0.34. This AC load is calculated from the average electricity consumption per capita data and capacity of dormitory building . Average power (electricity) consumption per capita in Ukraine is 2,844 kWh year−1 , 7.8 kWh−1 according to world data [24]. Recently opened dormitory in Igor Sikorsky Kyiv Polytechnic Institute about 500 students and staffs are capable to residence in 2021 [25].
Table 3.
Energy storage system components cost, technical data, and lifetime.
| System data | ||
| PV Unit | ||
| Capital expenditure | 1252 | $ kW−1 |
| Operation and maintenance expenditure | 18 | $ y−1 kW−1 |
| Lifetime | 25 | years |
| Derating factor | 85 | % |
| Wind turbine system | ||
| Capital expenditure | 1500 | $ kW−1 |
| Operation and maintenance expenditure | 50 | $ y−1 kW−1 |
| Lifetime | 25 | years |
| Batteries (100 kWh Li BESS) | ||
| Nominal voltage | 480 | V |
| Nominal catacity | 90.7 | kWh |
| Maximum capacity | 189 | Ah |
| Captial expenditure | 415 | $ kWh−1 |
| Replacement expenditure | 280 | $ kWh−1 |
| Operation and maintenance expenditure | 25 | $ y−1 kWh−1 |
| Lifetime | 10 | years |
| Converter | ||
| Capital expenditure | 90 | $ kW−1 |
| Replacement c expenditure | 90 | $ kW−1 |
| Operation and maintenance expenditure | 0 | $ y−1 |
| Lifetime | 15 | years |
| Efficiency | 95 | % |
| Electrolyzer | ||
| Capital expenditure | 1400 | $ kW−1 |
| Replacement expenditure | 650 | $ kW−1 |
| Operation and maintenance expenditure | 60 | $ y−1 |
| Lifetime | 25 | years |
| Storage tank (High pressure) | ||
| Capital expenditure | 635 | $ kg−1 |
| Operation and maintenance expenditure | 3 | $ y−1 |
| Lifetime | 25 | years |
| Fuel cell | ||
| Capital expenditure | 4800 | $ kW−1 |
| Replacement expenditure | 3800 | $ kW−1 |
| Operation and maintenance expenditure | $ y−1 | |
| Lifetime | 5 | years |
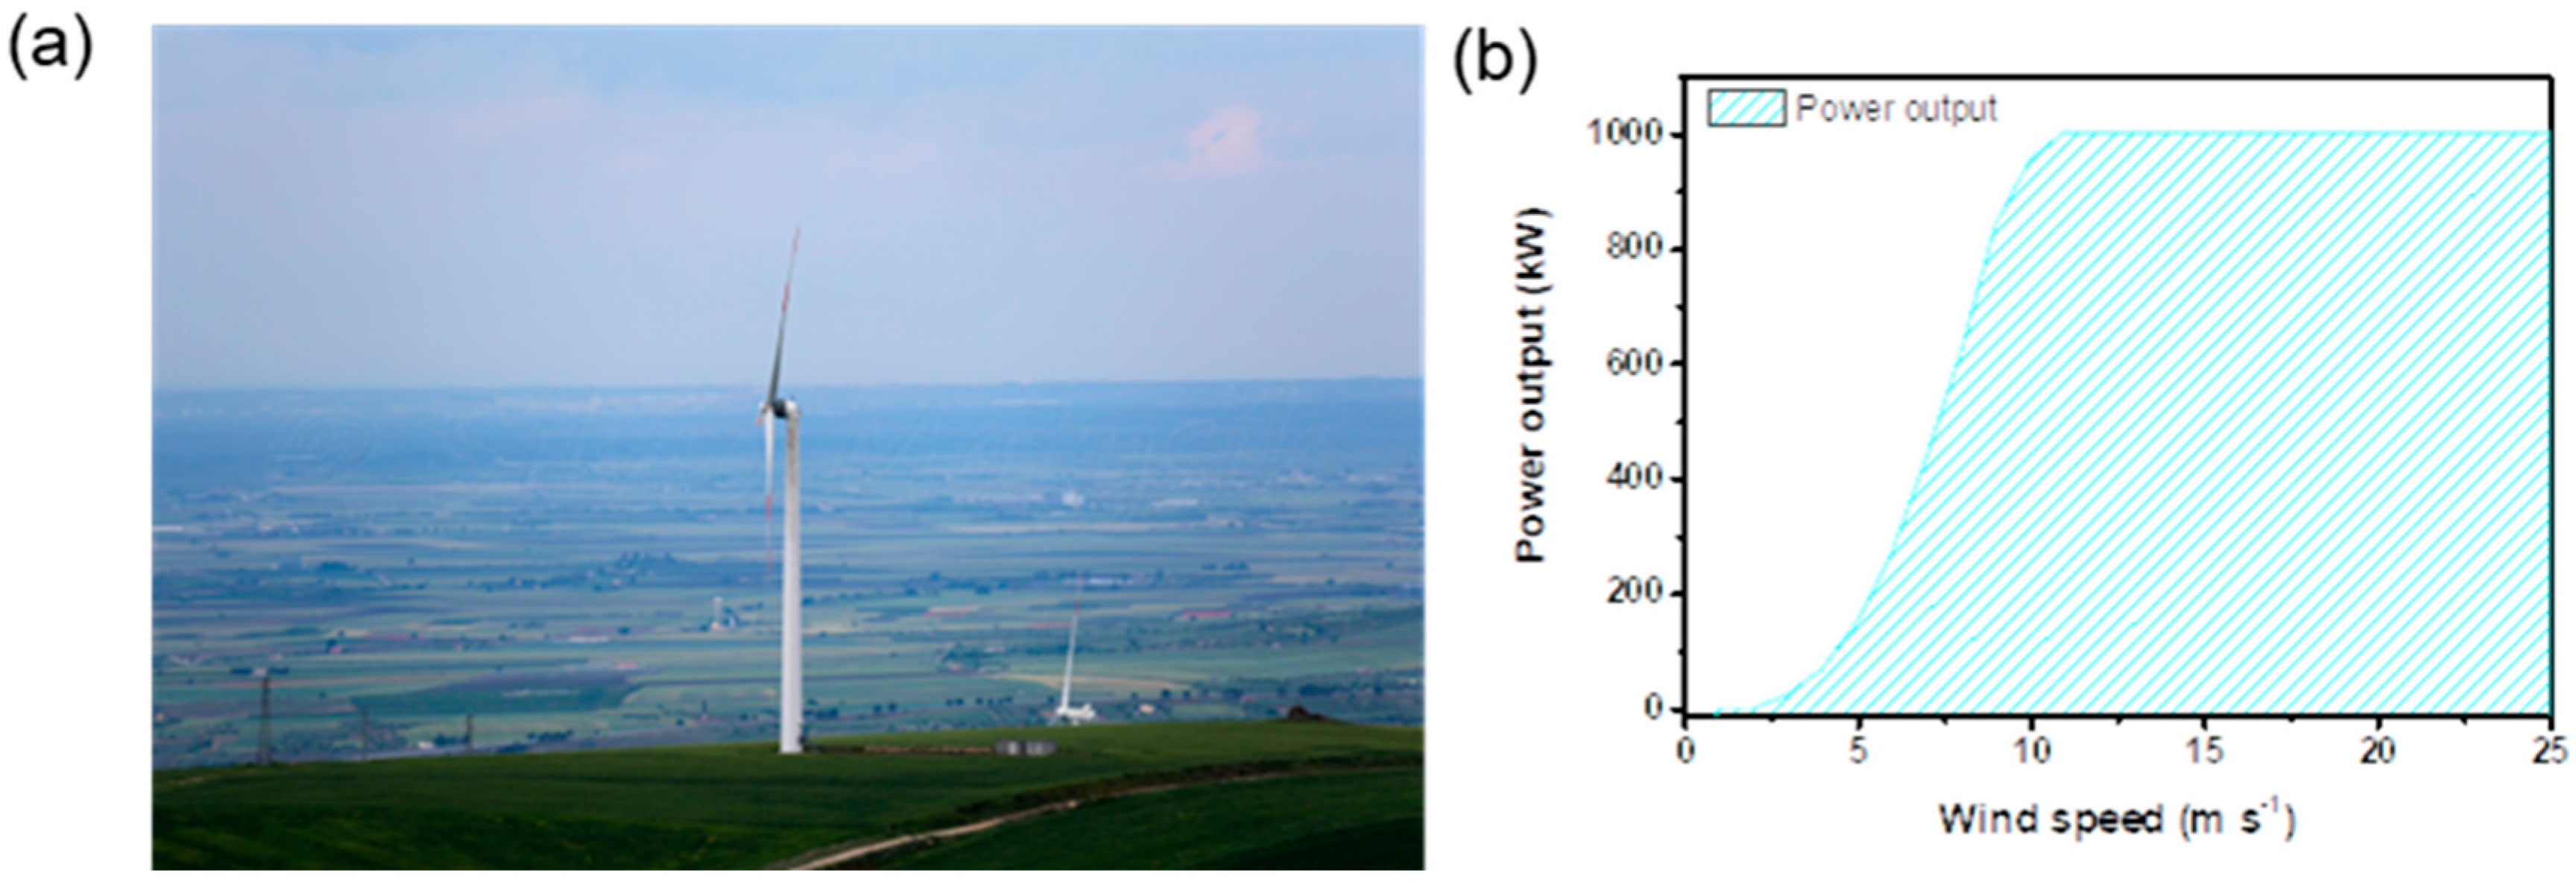
The cost information of system components is listed in Table 2. The cost of new PV is estimated as $ 1,252 kW−1 and the annual OPEX is estimated as18 $ kW−1 from the reference [26]. The panel lifetime is expected to be 25 years and the derating factor is set to 85%. The wind turbine is the Leitwind LTW77 1,000 kW model used in the existing literature, and the cut in speed is around 11~12 m s−1 [27]. It can be seen from Figure 6; the manufacturer provided the wind turbine’s power curve and the capital expenditure (CAPEX) is $ 1,500 kW−1. The operation and maintenance expenditure (OPEX) cost is annually $ 50 kW−1 and the total lifetime is 25 years.
Figure 6.
Wind turbine (a) Leitwind AG / Leitwind LTW77 / 1000 kW wind turbine generator / Melfi, Italy (maker‘s web site), (b) Power curve of wind turbine LWT77 from Leitwind 1,000 kW model.
Figure 6.
Wind turbine (a) Leitwind AG / Leitwind LTW77 / 1000 kW wind turbine generator / Melfi, Italy (maker‘s web site), (b) Power curve of wind turbine LWT77 from Leitwind 1,000 kW model.
BESS adopted the Li ion battery such as LG Energy Solution, the 10-kWh class model [23]. The nominal voltage and capacity are 48 V and 9.8 kWh and the maximum capacity is 189 Ah. CAPEX is $ 596 kWh−1 [28] and replacement expenditure is $ 280 kWh−1, O&M cost is $ 23.3 kWh−1 [29]. The battery lifespan is 10 years [30]. The CAPEX of converter is $ 80 kW−1 form NREL’s report for grid energy storage technology cost [29]. The efficiency is 95% and the lifetime of converter is expected to 15 years. The converter system and installation cost is estimated as 90 $ kW−1 and the replacement cost is identical to CAPEX. Operation and mainternance cost of the converter is 0 in practically according to other research [31].
The water electrolyzer is adopted as PEM type in this study, easily operable compared to other electrolysis, counting on the relatively high capital expenditure as 1,400 $ kW−1 [32] and the OPEX is estimated as 2% of CAPEX [33]. Solid oxide fuel cell (SOFC) is chosen for its highest efficiency and adaptability for stationary applications. The specific power generation is 27.52 kWh kg−1H2, if the voltage efficiency of SOFC is 79.3% from the reference [34]. And the specific fuel consumption is calculated in HOMER following the procedure [35]. The capital cost and maintenance expenditures become more higher c.a. 4,800 $ kW−1 [36,37] than that of PEM fuel cell, 3,300 $ kW−1 [22]. The capital and maintenance cost of Hydrogen tank is referenced by NREL’s previous report [38]. Life time span of SOFC is based on the literature as 40,000 hrs [39,40] and expected optimum value as 50,000 hrs [41].
2.4. Calculation
Homer software simulate the cost-effective system configuration by calculating the minimum NPC. The NPC is defined as total annual cost during project years normalizing with unit cost recovery factor as presented in Eq. 1. These definitions and calculations of indices for technoeconomic analysis are referenced from Homer manual [32].
NPC = total Cannual / CRF
The capital recovery factor (CRF) was calculated by Eq. 2 suggested by handbook and manual [42,43] Using an interest rate i, auuity, n , the capital recovery factor is :
CRF = i (1+i)n/ ((1+i)n−1)
Annual cost of plant is reduced as the facility is operated considering the depreciation, where d denotes discount rate,
where n is the number of annuities received. This is related to the annuity formula, which gives the present value in terms of the annuity, the interest rate, and the number of annuities. The capital recovery factor is a fraction determined as indicated above where overnight capital cost is expressed as dollars per installed kilowatt ($ kW−1). O&M expenses are divided into fixed costs per kilowatt-year ($ kW−1-yr) and variable costs per kilowatt-hour ($ kW−1). In the denominator 8,760 is the number of hours in a year and capacity factor is a fraction between 0 and 1 representing the portion of a year that the power plant is generating power. Fuel cost is optional since some generating technologies like solar and wind do not have fuel costs. In this work, the fuel cost is only applied in the diesel BESS comparison case, while other HydESS systems use hydrogen as fuel cost, 0.
Cannual ($ y−1) = Cplant∙d ∙ (1+d)n/ ((1+d)n−1)
Levelized Cost of Energy (LCOE, also called Levelized Energy Cost or LEC) is a cost of generating energy (usually electricity) for a particular system. It is an economic assessment of the cost of the energy-generating system including all the costs over its lifetime: initial investment, operations and maintenance, cost of fuel, cost of capital. A NPC calculation is performed and solved in such a way that for the value of the LCOE chosen, the project’s NPC becomes zero. The following formula is used to compute the levelized simple cost of energy. In this case, the LCOE follows the off grid system type without disel generator according to other reference [44].
LCOE ($/kWh) = Cannual / Eserved
The LCOH was calculated by dividing the yearly capital expenditure (CAPEX) and the operating expenditure (OPEX) cost of the system by the amount of hydrogen production, as illustrated in the following equation[45]. LCOH[18] in HOMER was where Cann tot , is the total annualized cost, velec is the value of electricity, Eprim is the primary electrical load, Edef is the deferrable load, E grid sales ,is the total energy sold to the grid and MH2 is the total hydrogen production.
LCOH ($/kg) = Cann,total-νelec(Eprim, AC + Eprim, DC + Edef + Egrid, sales) / MH2
The efficiency of the water electrolysis system (εWE) was calculated as follows. As of this time, the HHV (High heating value of hydrogen, 39.4 kWh kg H2−1) was 1.48 V.
MH2=εWE / HHV∙H2
As shown in Figure 5, the system configuration was evaluated for a water electrolysis system connected with a renewable energy source. With an assumption, a hydrogen storage tank (1,000 kg capacity) was added for the minimum system requirement, and a lead-acid battery was added to store surplus power and supply it back to the system. The cost of a hydrogen tank is obtained from [46].
The system was designed with size as feasible as renewable energy without compromising the streaming factor for 1 MWh water electrolysis. The power for water electrolysis was supplied to the electrolyzer through an inverter from the DC solar panel in series and a converter of AC wind turbine in parallel. As a result, the minimum operating capacity for water electrolysis was deduced as 10%, and the voltage efficiency of the water electrolysis system was set to 80%. The performance of the water electrolysis system was calculated through voltage efficiency, and the calculation formula was as follows. The 80% system performance means that the stack driving voltage was 1.85 V at the current target density. In this circumstance, the power consumption was 49.3 kWh kgH2−1.
Voltage efficiency (%)=Vop/HHV
The economic analysis model combined the renewable energy sources, water electrolysis, and hydrogen refueling stations was entered by referring to the evaluation setting values in the previous literature [18]. Each system unit cost and lifespan were entered into the software, as shown below. As shown in Table 1, the solar panel specifications, wind turbine, battery, and converter to run the system were applied. Based on these fundamental unit values, in the existing system, the result of direct optimization in the system was used as it is without adding a scaled factor or setting the capacity. The inflation rate and discount rate are set to 2% and 8%, respectively, as adopted in other researches [47,48].
3. Results and Discussion
3.1. Optimized system configuration
According to Table 4, the NPC for the optimized system is $4,584,704, and the LCOE is 0.245 $ kWh−1 (Figure 7a). Without PV, the full system consists of WT, HydESS, and BESS. Additionally, PEMFC fuel cells with a lifespan of 50,000 hours have been programmed into the system. Due to the low PV power of the system in Figure 7b, the LCOE and NPC are very similar to those in Figure 7a.
Table 4.
Simulated optimization system with different fuel cell type as proton exchange membrane fuel cell and solid oxide fuel cell and different life time.
Table 4.
Simulated optimization system with different fuel cell type as proton exchange membrane fuel cell and solid oxide fuel cell and different life time.
| Case | FC type | Lifetime | Levelized cost of energy (LCOE) | Total net present cost (NPC) | PV | Wind turbine | FC | Li-ion battery | Converter | PEMWE |
| Units | - | hrs | $/kWh−1 | $ | kW | kW | kW | kWh | kW | kW |
| (a) HydESS-1 | PEMFC | 40,000 | 0.249 | 4,584704 | 0 | 1,000 | 250 | 499.8 | 474 | 250 |
| PEMFC | 50,000 | 0.245 | 4,508,672 | 0 | 1,000 | 250 | 441 | 464 | 250 | |
| SOFC | 40,000 | 0.369 | 6,794770 | 0 | 1000 | 250 | 2,274 | 632 | 250 | |
| SOFC | 50,000 | 0.289 | 5,316,831 | 0 | 1,000 | 250 | 911 | 481 | 250 | |
| (b) HydESS-2 |
PEMFC | 40,000 | 0.250 | 4,591,366 | 1 | 1000 | 250 | 509.6 | 466 | 250 |
| PEMFC | 50,000 | 0.246 | 4,526,294 | 2 | 1,000 | 250 | 450.8 | 524 | 250 | |
| SOFC | 40,000 | 0.348 | 6406074 | 140 | 1000 | 250 | 1,744 | 500 | 250 | |
| SOFC | 50,000 | 0.282 | 5,179,203 | 10 | 1,000 | 250 | 755 | 573 | 250 | |
| (c) BESS |
none | - | 0.516 | 9,483,948 | 518 | 2,000 | - | 3,959.2 | 677 | - |
Figure 7.
System configurations, target configuration consist of hybrid ESS with BESS and HydESS, (a) optimized system with WT-HydESS-BESS (b) second optimized system with PV-WT-HydESS-BESS, and (c) comparison configuration including BESS.
Figure 7.
System configurations, target configuration consist of hybrid ESS with BESS and HydESS, (a) optimized system with WT-HydESS-BESS (b) second optimized system with PV-WT-HydESS-BESS, and (c) comparison configuration including BESS.
On the other hand, the presence or absence of PV has a greater effect on the LCOE difference when using SOFC than when using PEMFC. A system with 140 kW of PV was calculated to be the most cost-effective over a 40,000-hour lifetime at 0.348 $ kWh−1 versus a 0.369 $ kWh−1 in without PV system.
Only the BESS system without HydESS, as shown in Figure 7c, has the highest LCOE of 0.516 $ kWh1 and NPC of 9,483,948 $. The renewable energy sources, which include PV and WT, have been optimized to the maximum size of 518 kW PV and 2,000 kW WT. Furthermore, the Li ion BESS has the largest capacity of 3,959 kW. Too large a Li ESS usually causes thermal runaway and fire problems, so minimizing risk is critical when installing and operating BESS [49].
3.2. Electricity production
The total electricity produced by system configuration (a), lowest LCOE, 0.245 $ kWh−1 is 3,895,029 kWh yr−1 with 9.25% of PEMFC and 90.8% WT plant as shown in Figure 8a. At the point of excess electricity, the excess fraction is 45.0% of total production, as 1,754,632 kWh yr−1. The PEMFC with 50,000 hrs lifetime shows 189 kW mean electrical output. And the hydrogen production is 13,349 kg per year and the 12,751 kg hydrogen is supplied to fuel cell. The electrolyzer exhibits the mean output as 75.1 kW with capacity factor 30.1 % equal to 3,612 hrs operation per year.
Figure 8.
Electricity production from optimized system HydESS-BESS and BESS adopting PEMFC and 50,000 hrs life time, (a) Monthly production profile with WT-HydESS-BESS, (b) hourly production profile with WT-HydESS-BESS, (c) monthly profile with with PV-WT-HydESS-BESS, and (d) hourly production profile with PV-WT-HydESS-BESS, (e) Monthly production profile with BESS, and (f) hourly production profile with PV-WT-BESS.
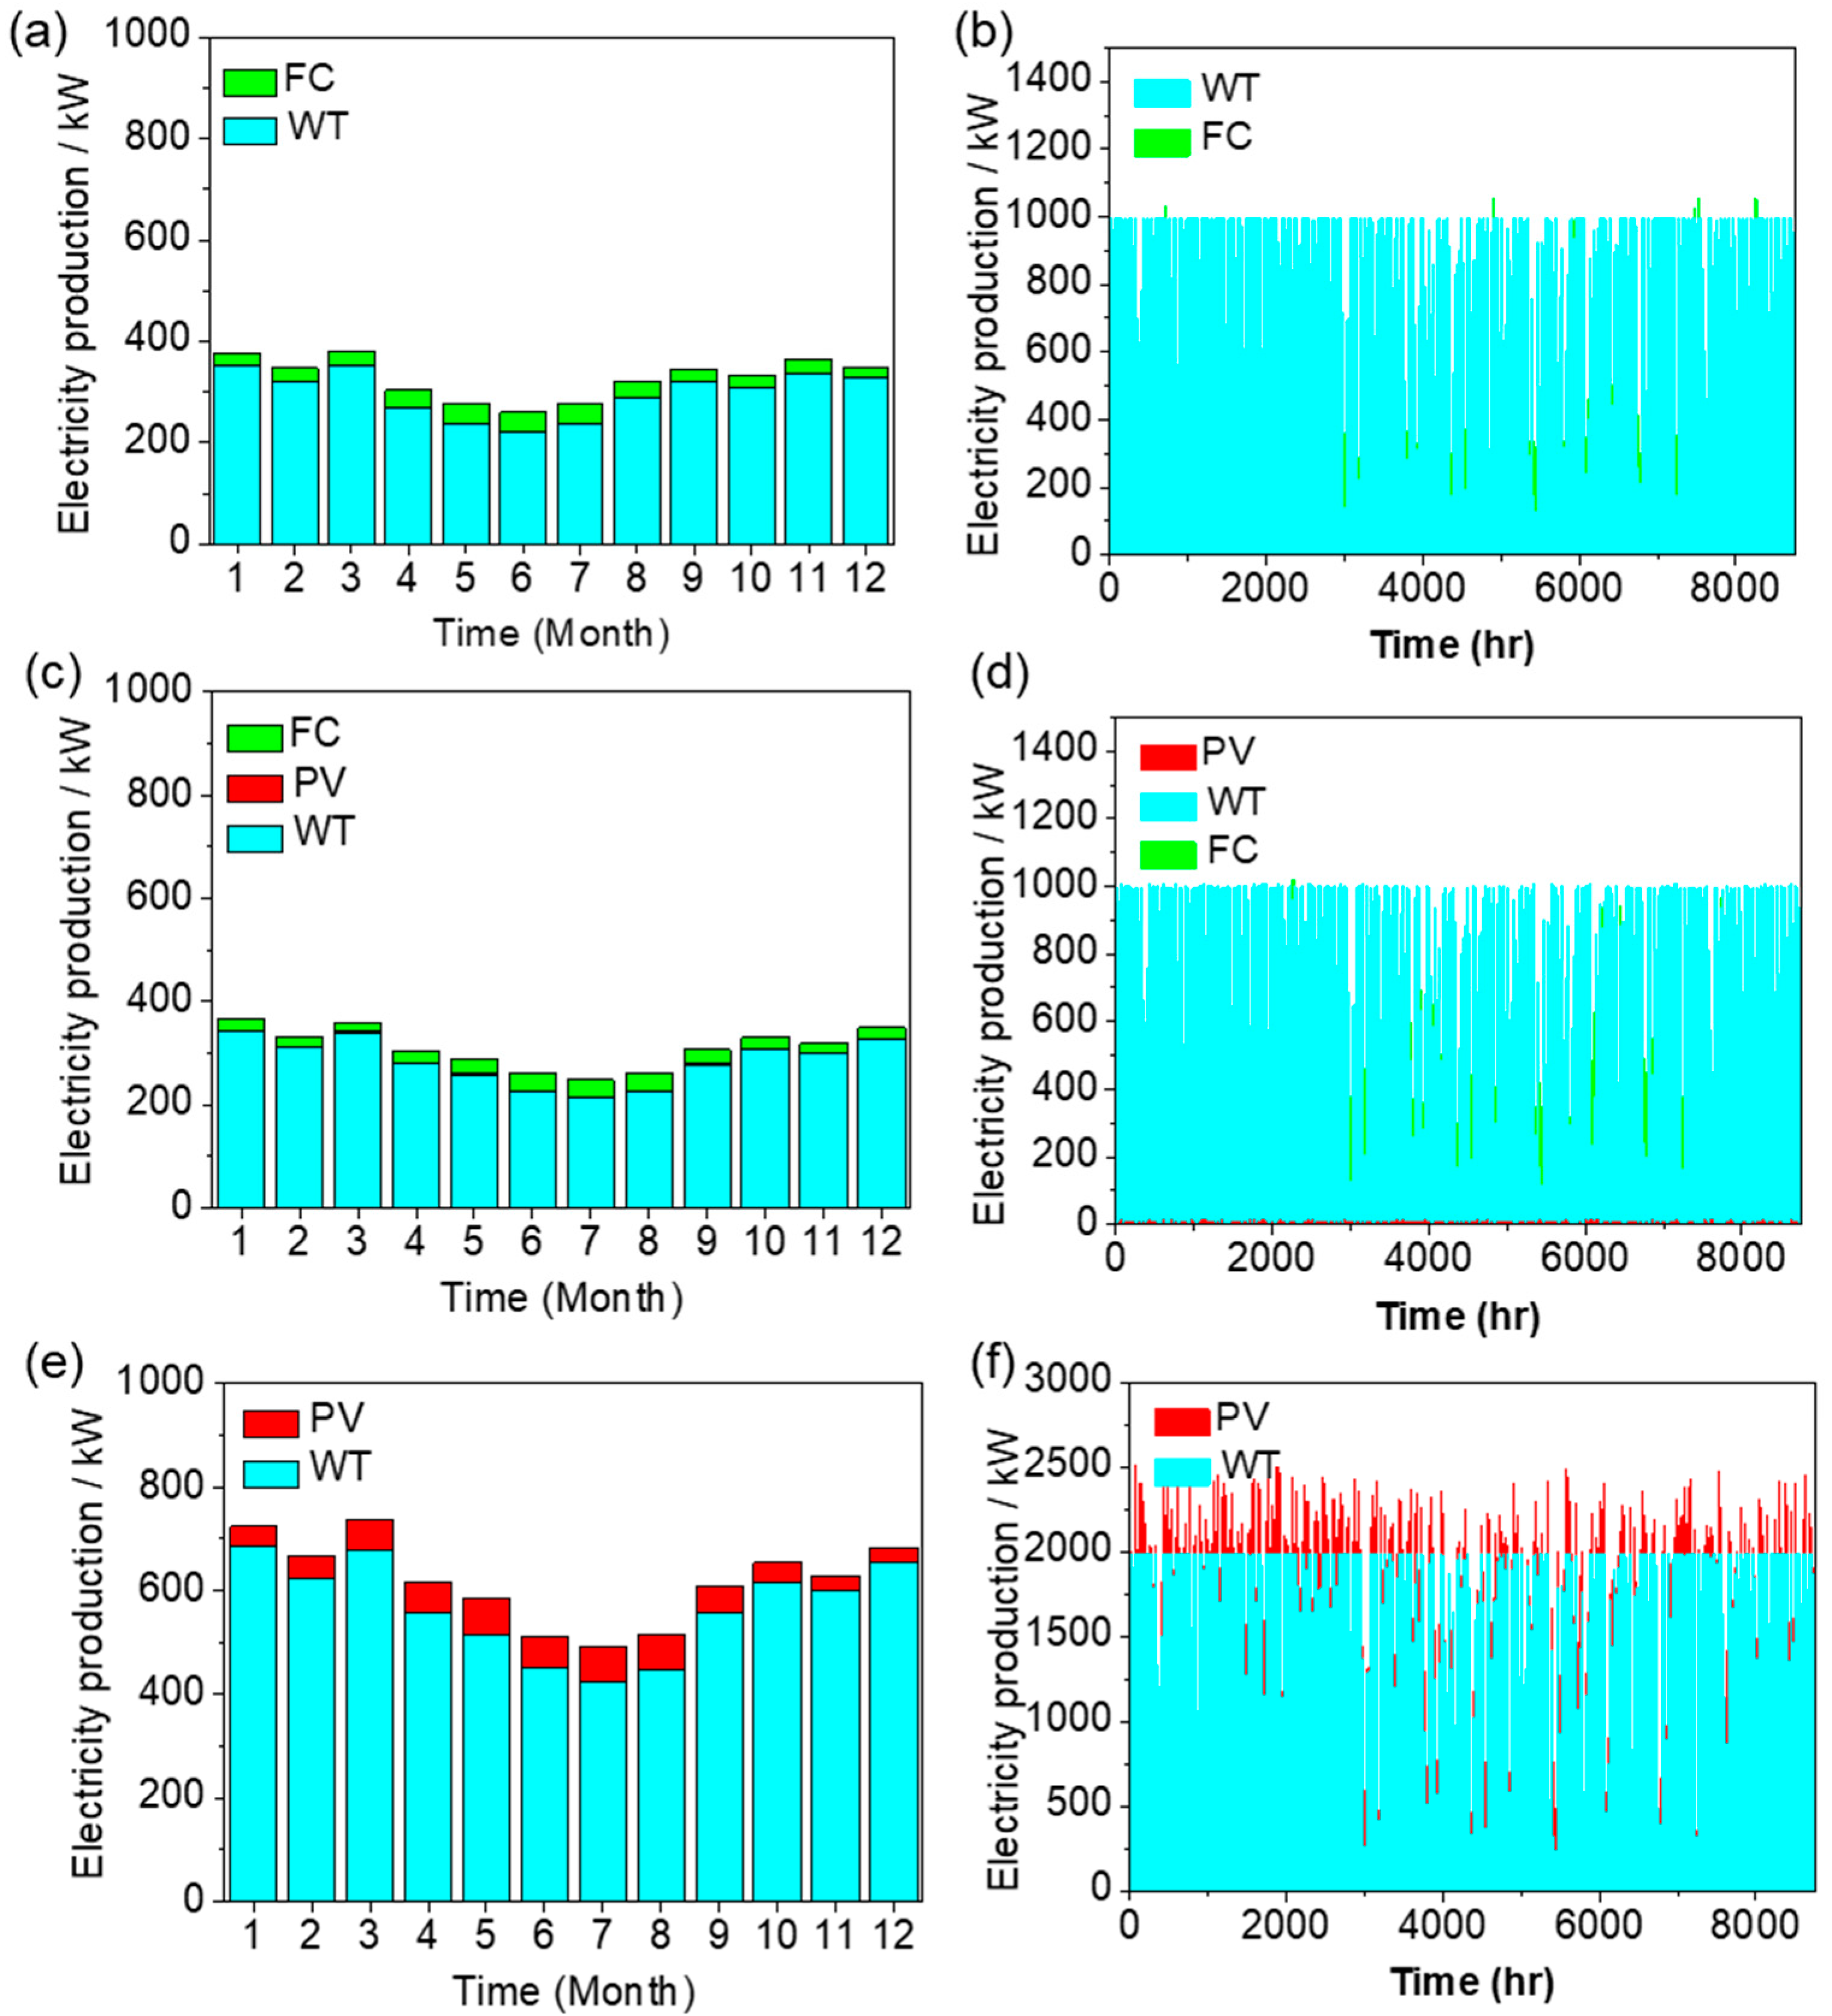
Secondly optimized system as shown in Figure 7b, the PV generates 0.04% electricity, and FC takes 9.18% and WT produces 90.8% electricity as total 3,893,588 kWh yr−1. And the excess electricity 1,758,397 kWh yr−1 is equal to 45.2% of total electricity production.
In contrast, the BESS system in Figure 7c generates electricity with 8.14% PV power and 91.9% WT power for a total of 7,418,136 kWh yr−1 as displayed in Figure 8 c and d. The excess electricity of 5,960,755 kWh yr−1 (80.4% of total electricity generation) is roughly 3.4 times that of HydESS, implying that the system’s rated power is over-specified.
Figure 8 depicts a monthly profile of production, showing that higher wind speeds in January and March result in greater output compared to June and July. The pattern is identical in all system configurations such as a, b, and c because wind power accounts for 90% of total production.
Table 5.
Electrolyzer operation results.
| Quantity | Case 1 WT-HydESS-BESS |
Case 2 PV-WT-HydESS-BESS |
Units |
| Rated capacity | 250 | 250 | kW |
| Mean input | 75.1 | 74.6 | kW |
| Total input energy | 658,185 | 653,062 | kWh yr−1 |
| Capacity Factor | 30.1 | 29.8 | % |
| Hours of operation | 3,612 | 3,657 | hr yr−1 |
3.3. Operation strategy
Figure 9.
Day operation profiles for the cycle charging dispatch strategy with WT-HydESS-BESS system.
Figure 9.
Day operation profiles for the cycle charging dispatch strategy with WT-HydESS-BESS system.
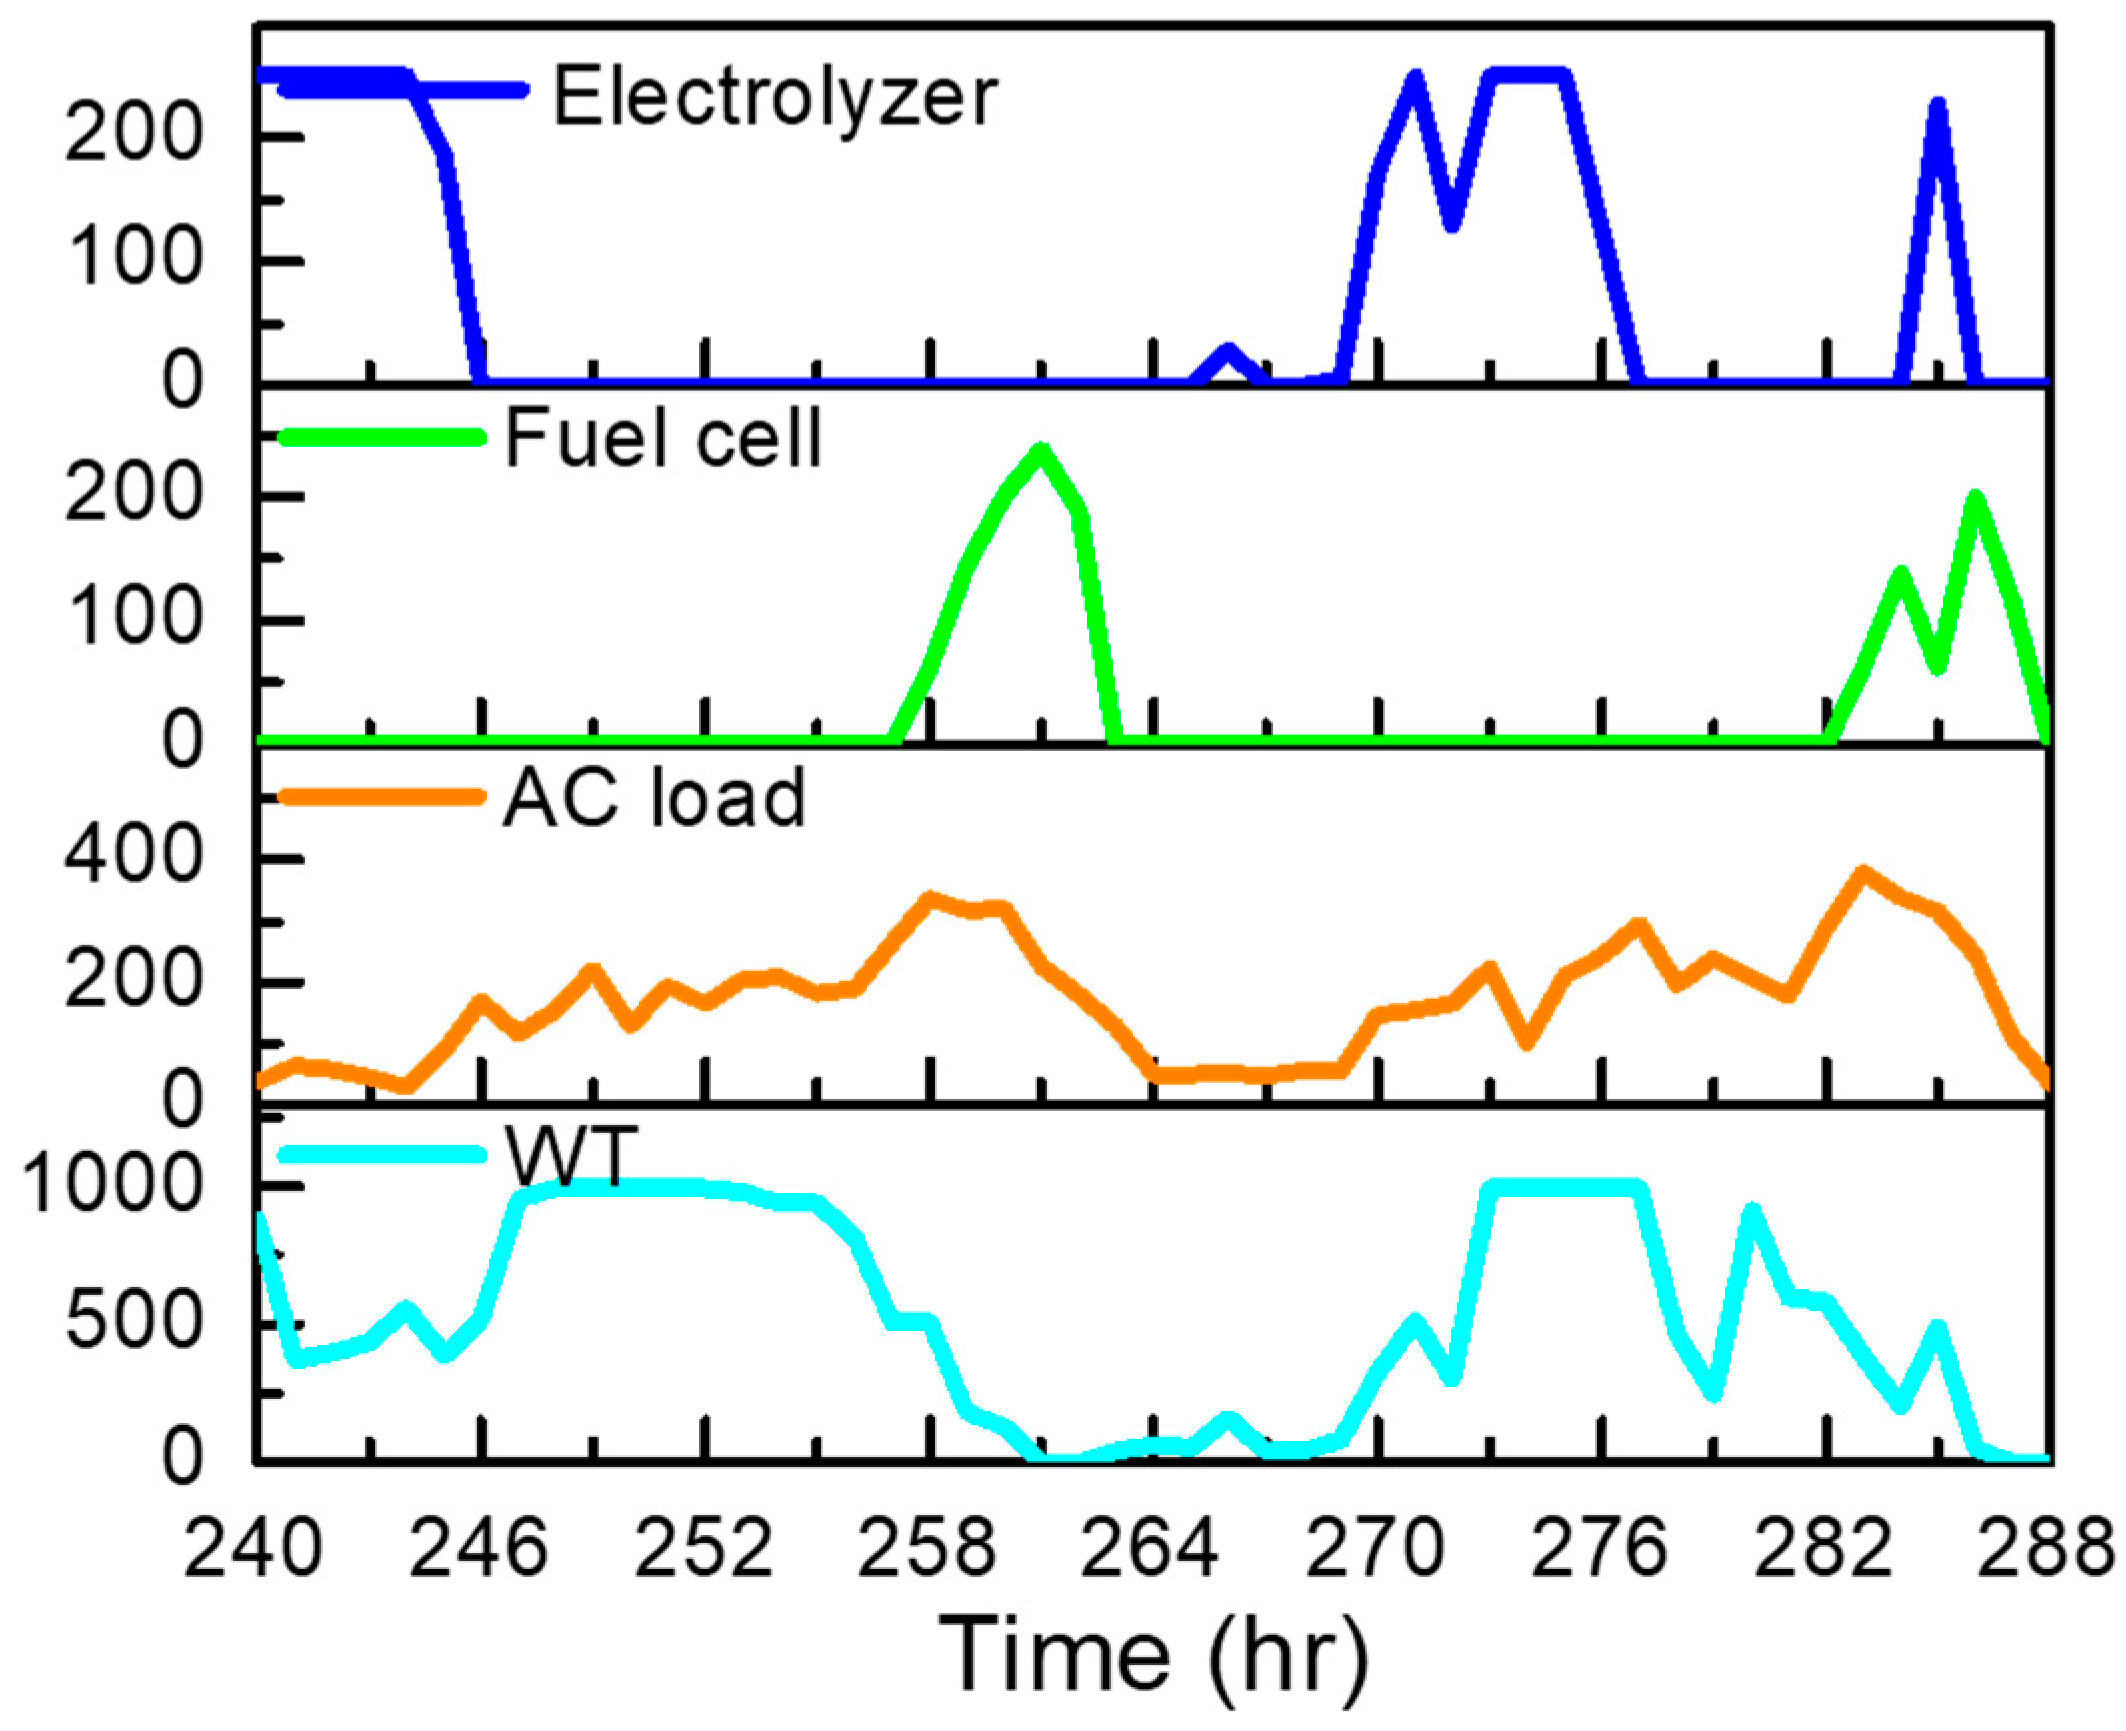
The most optimized result is adapted the charge cycling (CC) mode rather than load following (LF) mode. The CC mode, power generator is always operated to meet the primary AC load in priority, and then the excess power is dispatched in electrolyzer, battery, and flywheel etc. Therefore, the maximum output power of generator is set to meet the average AC load on demand side.
As shown in Figure 8, the AC load requirement increases during day 1 from 240 hr to 264 hr, but the WT power supply is insufficient. Same operation pattern is observed in 264 hr to 288 hr in day 2. The fuel cell will then begin to produce insufficient electricity for the residence. The electrolyzer, on the other hand, typically operated at night and early morning with excess WT power to produce hydrogen for fuel cell operation. The daily profile of hydrogen production and utilization demonstrates a suitable ESS system for variable wind energy.
3.4. CO2 Emissions
From an economic perspective, this can be elucidated as a significant cost reduction, taking into account the prevailing European market value of CO2, which stands at approximately 7 € ton−1 [50]. This aspect will exhibit greater significance in the foreseeable future due to the anticipated implementation of CO2 taxation. 94.66 $ ton−1 of CO2eq total carbon tax during the project period will be 528,295 $ as depicted in Table 6.
Table 6.
Emission data comparison between Diesel generator (DG)-BESS and HydESS-1.
| Material | DG-BESS | HydESS-1 | Units |
| Carbon dioxide | 223,297 | 0 | kg yr−1 |
| Carbon monoxide | 1,408 | 2.61 | kg yr−1 |
| Unburned hydrocarbons | 61.4 | 0 | kg yr−1 |
| Particle matter | 8.53 | 0 | kg yr−1 |
| Sulfur dioxide | 547 | 0 | kg yr−1 |
| Nitrogen oxides | 1,322 | 0.261 | kg yr−1 |
Oxygen cost is based on the literature 168.55 $ ton−1 [51]. The optimized system WT-HydESS-BESS produces 13.349 ton of H2 annually, so the O2 produces auxiliary 6.675 ton annually. During the project years, the total O2 production sales is expected to 28,124 $ with 250-kW PEMFC and PEMWE configuration.
5. Conclusion
The economic feasibility of the hydrogen-based hybrid energy storage system is evaluated through the utilization of the HOMER program. This program adopted actual climate data that is specific to Kyiv, the capital city of Ukraine, which is recognized for its challenging conditions. The unit AC load is set to adequate academic residence building in the city centre for approximately 500 students and staffs commodity. The technoeconomic feasibility of an energy vector as hydrogen is evaluated by comparing it to or without a hydrogen ESS configuration (HydESS). And a cost analysis is performed for various fuel cell types and life times, such as proton exchange membrane and solid oxide, with 40,000 and 50,000 hrs, respectively.
The least LCOE optimal configuration is 0.245 $ kWh−1 with PV-WT-HydESS-BESS system using 50,000 hrs endurable PEM FC and WE system as HydESS. The system is consists of 1,000 kW Wind turbine, 250 kW PEMFC, 250 kW PEMWE, 700 kg H2 tank, 441 kWh Li ion BESS, and 464 kW converter. As shown in system component, the best optimized system is economical to use only wind power.
(1) As a result of economic analysis of the optimal system configuration through HOMER, the LCOE of the stand-alone PV-WT-HydESS (water electrolysis/fuel cell)-BESS model centered on Kyiv can reach a final 0.245 kWh−1 configuration scenario has been derived.
(2) The LCOE in the case of the lowest case was found to be $0.245 , which is a result of almost no economic feasibility of electricity production unit cost at the current system CAPEX and OPEX levels.
(3) PEMFC life time of 50,000 hours is economically recommended during the project period of 25 years with capacity factor 16.4% and 630 starts per year.
(4) When compared to diesel plant-BESS systems, hydrogen-based ESS systems prevent approximately 5,582 tons of CO2 emission during the project period, accelerating the transition to a carbon-neutral economy.
Acknowledgments
This research was supported by the KU-KIST Graduate School Project. This research was supported by the BK21 FOUR (Fostering Outstanding Universities for Research) funded by the Ministry of Education (MOE, Korea) and National Research Foundation of Korea (NRF).
References
- 1. Jain I, Lal C, Jain A. Hydrogen storage in Mg: a most promising material. International Journal of Hydrogen Energy 2010;35(10):5133-44. https://doi.org/10.1016/j.ijhydene.2009.08.088. [CrossRef]
- Olatomiwa L, Mekhilef S, Ismail MS, Moghavvemi M. Energy management strategies in hybrid renewable energy systems: A review. Renewable and Sustainable Energy Reviews 2016;62:821-35. https://doi.org/10.1016/j.rser.2016.05.040. [CrossRef]
- He T, Pachfule P, Wu H, Xu Q, Chen P. Hydrogen carriers. Nature Reviews Materials 2016;1(12):1-17. [CrossRef]
- Lambert LA, Tayah J, Lee-Schmid C, Abdalla M, Abdallah I, Ali AH, Esmail S, Ahmed W. The EU’s natural gas Cold War and diversification challenges. Energy Strategy Reviews 2022;43:100934. https://doi.org/10.3929/ethz-b-000551952. [CrossRef]
- Ścigan M, Gonul G, Türk A, Frieden D, Prislan B, Gubina A. Cost-Competitive Renewable Power Generation: Potential across South East Europe. Citation: IRENA, Joanneum Research and University of Ljubljana (2017), Cost-Competitive Renewable Power Generation: Potential across South East Europe, International Renewable Energy Agency (IRENA), Abu Dhabi.: IRENA; 2017.
- Arent D, Sullivan P, Heimiller D, Lopez A, Eurek K, Badger J, Jorgensen HE, Kelly M, Clarke L, Luckow P. Improved offshore wind resource assessment in global climate stabilization scenarios. National Renewable Energy Lab.(NREL), Golden, CO (United States); 2012. https://doi.org/https://dx.doi.org/10.2172/1055364. [CrossRef]
- Kuzior A, Lobanova A, Kalashnikova L. Green energy in Ukraine: State, public demands, and trends. Energies 2021;14(22):7745. [CrossRef]
- Sabishchenko O, Rębilas R, Sczygiol N, Urbański M. Ukraine energy sector management using hybrid renewable energy systems. Energies 2020;13(7):1776. [CrossRef]
- in,.
- Kudria S, Ivanchenko I, Tuchynskyi B, Petrenko K, Karmazin O, Riepkin O. Resource potential for wind-hydrogen power in Ukraine. International Journal of Hydrogen Energy 2021;46(1):157-68. [CrossRef]
- Lilienthal P. HOMER® micropower optimization model. National Renewable Energy Lab.(NREL), Golden, CO (United States); 2005.
- Arsad A, Hannan M, Al-Shetwi AQ, Mansur M, Muttaqi K, Dong Z, Blaabjerg F. Hydrogen energy storage integrated hybrid renewable energy systems: A review analysis for future research directions. International Journal of Hydrogen Energy 2022;47(39):17285-312. [CrossRef]
- Nadeem TB, Siddiqui M, Khalid M, Asif M. Distributed energy systems: A review of classification, technologies, applications, and policies: Current Policy, targets and their achievements in different countries (continued). Energy Strategy Reviews 2023;48:101096. [CrossRef]
- Singlitico A, Ústergaard J, Chatzivasileiadis S. Onshore, offshore or in-turbine electrolysis? Techno-economic overview of alternative integration designs for green hydrogen production into Offshore Wind Power Hubs. Renewable and Sustainable Energy Transition 2021;1:100005. [CrossRef]
- Voronova A, Kim HJ, Jang JH, Park HY, Seo B. Effect of low voltage limit on degradation mechanism during high-frequency dynamic load in proton exchange membrane water electrolysis. International Journal of Energy Research 2022:11867–78. https://doi.org/10.1002/er.7953. [CrossRef]
- Mottaghizadeh P, Jabbari F, Brouwer J. Integrated solid oxide fuel cell, solar PV, and battery storage system to achieve zero net energy residential nanogrid in California. Applied Energy 2022;323:119577. [CrossRef]
- Al-Sharafi A, Sahin AZ, Ayar T, Yilbas BS. Techno-economic analysis and optimization of solar and wind energy systems for power generation and hydrogen production in Saudi Arabia. Renewable and Sustainable Energy Reviews 2017;69:33-49. [CrossRef]
- Abdin Z, Mérida W. Hybrid energy systems for off-grid power supply and hydrogen production based on renewable energy: A techno-economic analysis. Energy Conversion and management 2019;196:1068-79. [CrossRef]
- Peláez-Peláez S, Colmenar-Santos A, Pérez-Molina C, Rosales A-E, Rosales-Asensio E. Techno-economic analysis of a heat and power combination system based on hybrid photovoltaic-fuel cell systems using hydrogen as an energy vector. Energy 2021;224:120110. [CrossRef]
- Okonkwo PC, Barhoumi EM, Mansir IB, Emori W, Uzoma PC. Techno-economic analysis and optimization of solar and wind energy systems for hydrogen production: a case study. Energy Sources, Part A: Recovery, Utilization, and Environmental Effects 2022;44(4):9119-34. [CrossRef]
- Babaei R, Ting DS, Carriveau R. Optimization of hydrogen-producing sustainable island microgrids. International Journal of Hydrogen Energy 2022;47(32):14375-92. [CrossRef]
- Zhang X, Wei QS, Oh BS. Cost analysis of off-grid renewable hybrid power generation system on Ui Island, South Korea. International Journal of Hydrogen Energy 2022;47(27):13199-212. [CrossRef]
- Steinbach A. Low-Cost, High-Performance Catalyst Coated Membranes for PEM Water Electrolyzers NREL; 2022. DOE-3M-0008425. https://doi.org/10.2172/1863440. [CrossRef]
- in,.
- in,.
- Zhao S, Stocks A, Rasimick B, More K, Xu H. Highly active, durable dispersed iridium nanocatalysts for PEM water electrolyzers. J. Electrochem. Soc. 2018;165(2):F82-F89. https://doi.org/10.1149/2.0981802jes. [CrossRef]
- Park S, Shviro M, Hartmann H, Mayer J, Carmo M, Stolten D. Cation-Exchange Method Enables Uniform Iridium Oxide Nanospheres for Oxygen Evolution Reaction. ACS Applied Nano Materials 2022;5(3):4062-71. [CrossRef]
- in,.
- Viswanathan V, Mongird K, Franks R, Baxter R. 2022 Grid Energy Storage Technology Cost and Performance Assessment. Energy 2022;2022.
- in,.
- Hoarcă IC, Bizon N, Șorlei IS, Thounthong P. Sizing design for a hybrid renewable power system using HOMER and iHOGA simulators. Energies 2023;16(4):1926. [CrossRef]
- Irena GHCR. Scaling up Electrolysers to Meet the 1.5 ⁰C Climate Goal. International Renewable Energy Agency, Abu Dhabi 2020.
- Lee B, Heo J, Choi NH, Moon C, Moon S, Lim H. Economic evaluation with uncertainty analysis using a Monte-Carlo simulation method for hydrogen production from high pressure PEM water electrolysis in Korea. International journal of hydrogen energy 2017;42(39):24612-19. [CrossRef]
- Iora P, Taher M, Chiesa P, Brandon N. A novel system for the production of pure hydrogen from natural gas based on solid oxide fuel cell–solid oxide electrolyzer. International journal of hydrogen energy 2010;35(22):12680-87. [CrossRef]
- Yu W, Xie H. A review on nanofluids: preparation, stability mechanisms, and applications. Journal of nanomaterials 2012;2012. https://doi.org/10.1155/2012/435873. [CrossRef]
- Maestre V, Ortiz A, Ortiz I. Challenges and prospects of renewable hydrogen-based strategies for full decarbonization of stationary power applications. Renewable and Sustainable Energy Reviews 2021;152:111628. [CrossRef]
- Zhao Y, Jing R, Zhang Z, Feasibility of solid oxide fuel cell stationary applications in China’s building sector and relevant progress, in: Design and Operation of Solid Oxide Fuel Cells, Elsevier, 2020, pp. 359-93. [CrossRef]
- Parks G, Boyd R, Cornish J, Remick R. Hydrogen station compression, storage, and dispensing technical status and costs: Systems integration. National Renewable Energy Lab.(NREL), Golden, CO (United States); 2014. [CrossRef]
- IEEE, Analysis of the influence of SOFC degradation on system State and performance. IEEE; 2021.
- Chou Y-S, Stevenson JW, Choi J-P. Long-term evaluation of solid oxide fuel cell candidate materials in a 3-cell generic short stack fixture, Part II: sealing glass stability, microstructure and interfacial reactions. Journal of Power Sources 2014;250:166-73. [CrossRef]
- Yokokawa H. Report of five-year NEDO project on durability/reliability of SOFC stacks. ECS Transactions 2013;57(1):299. [CrossRef]
- Turton R, Bailie RC, Whiting WB, Shaeiwitz JA. Analysis, synthesis and design of chemical processes. Pearson Education; 2008. https://doi.org/10.1002/cite.330711124. [CrossRef]
- Short W, Packey DJ, Holt T. A manual for the economic evaluation of energy efficiency and renewable energy technologies. National Renewable Energy Lab.(NREL), Golden, CO (United States); 1995. https://doi.org/10.2172/35391. [CrossRef]
- Moon HE, Ha YH, Kim KN. Comparative Economic Analysis of Solar PV and Reused EV Batteries in the Residential Sector of Three Emerging Countries—The Philippines, Indonesia, and Vietnam. Energies 2022;16(1):311. [CrossRef]
- Leland Blank P, Anthony Tarquin P. Engineering economy. 7 ed.: Oxford, New York; 2014.
- Mayer T, Semmel M, Morales MaG, Schmidt KM, Bauer A, Wind J. Techno-economic evaluation of hydrogen refueling stations with liquid or gaseous stored hydrogen. International Journal of Hydrogen Energy 2019;44(47):25809-33. https://doi.org/10.1016/j.ijhydene.2019.08.051. [CrossRef]
- Kim J-H, Kim G-E, Yoo S-H. A valuation of the restoration of Hwangnyongsa temple in South Korea. Sustainability 2018;10(2):369. https://doi.org/10.3390/su10020369. [CrossRef]
- in,.
- Sebastian R. A review of fire mitigation methods for li-ion battery energy storage system. Process Safety Progress 2022;41(3):426-29. [CrossRef]
- in,.
- Bellotti D, Rivarolo M, Magistri L. Economic feasibility of methanol synthesis as a method for CO2 reduction and energy storage. Energy Procedia 2019;158:4721-28. [CrossRef]
Disclaimer/Publisher’s Note: The statements, opinions and data contained in all publications are solely those of the individual author(s) and contributor(s) and not of MDPI and/or the editor(s). MDPI and/or the editor(s) disclaim responsibility for any injury to people or property resulting from any ideas, methods, instructions or products referred to in the content. |
© 2023 by the authors. Licensee MDPI, Basel, Switzerland. This article is an open access article distributed under the terms and conditions of the Creative Commons Attribution (CC BY) license (http://creativecommons.org/licenses/by/4.0/).
Copyright: This open access article is published under a Creative Commons CC BY 4.0 license, which permit the free download, distribution, and reuse, provided that the author and preprint are cited in any reuse.


