Preprint
Article

Impact of COVID-19 Restrictions on Inhalable Particles in the Atmosphere of Western Macedonia

Altmetrics

Downloads

110

Views

42

Comments

0

A peer-reviewed article of this preprint also exists.

Submitted:

13 July 2023

Posted:

14 July 2023

You are already at the latest version

Alerts
Abstract
The lockdown implemented to tackle the spread of the COVID-19 pandemic had a positive impact on air quality. Globally, studies have shown that the air pollutants levels reduced temporally during the restriction measures. In this study, we evaluated the impact of COVID-19 restrictions on the air quality of Western Macedonia, Greece, using the hourly concentrations of PM2.5 and PM10 along with meteorological data from the Air Quality Monitoring Stations (AQMS) operated by the Lignite Center of Western Macedonia. In Western Macedonia, previous studies have identified that there is a general reduction in air pollutants levels during the last decade due to coal phase-out plan for power generation. During the lockdown the levels of PM2.5 and PM10 decreased further. However, reduced emissions from the local mining activities and lignite-fired power plant electricity generation, as well as the weather conditions seems to contribute to improving air quality.
Keywords: 
Subject: Environmental and Earth Sciences  -   Environmental Science

1. Introduction

The coronavirus SARS-CoV-2 that causes COVID-19 first emerged in Wuhan in 2019 and spread rapidly across the globe causing serious public health issues. It was declared a pandemic by the World Health Organization (WHO) in March 2020. In order to manage the pandemic, countries across the world implemented a range of stringent government policies, including stay-at-home restrictions, face coverings, restrictions and cancellation of events and public gatherings, school and workplace closures, restrictions on international, domestic travel and public transport [1]. Consequently, the pandemic affected the labour markets, enterprises, industries and the business activities in general. As the economic activities were largely disrupted, the electricity consumption which is an indicator of economic growth, dropped during the lockdown periods [2,3]. Based on International Energy Agency (IEA) reports related to COVID-19 pandemic impacts on the energy system, the global electricity demand growth dropped at 2% in 2020, while in the first quarter of 2020 the electricity demand dropped by more than 3% due to stringent lockdowns in China and the mild winter in the northern hemisphere [2,3]. In the European Union (EU), the drop in electricity demand was not only related to the lockdowns but also due to the higher renewable energy production [3].
In Greece, the Independent Power Transmission Operator (IPTO or ADMIE) reports confirm the general decreasing trends in energy sectors [4]. As for December 2020, the monthly energy bulletins of IPTO recorded a drop in energy demand in comparison to the corresponding month of the previous year, especially in high voltage consumers [4]. In addition, the production from mines decreased significantly [4]. These decline trends in lignite production are mainly consequences of the energy transition and phase out of coal-powered electricity production, but were also augmented by the pandemic.
Besides the impacts on energy systems and electricity consumption, the pandemic had a great impact on air quality, which is a consequence of strict pandemic-driven policies that interrelated with the economic growth. In February 2020, NASA and European Space Agency (ESA) pollution monitoring satellites detected significant decreases in mean tropospheric nitrogen dioxide (NO2) density over China compared to a reference period [5]. The reduction in NO2 and air pollutants concentrations generally were initially evident near Wuhan, China, but eventually spread across the globe. Scientific studies from India, China, Europe and the US have confirmed that pandemic restrictions improved air quality [6,7]. In general, significant reductions have occurred mainly in NOx concentrations, as demonstrated by ground-based and satellite observations, while for PM concentrations the reductions have been less pronounced, either variable or unevenly distributed [6,7]. The reduction in PM levels appears to be a combination of meteorology and emissions reduction, as well as several other factors such as the chemical composition of PM [6,7]. In Greece, Varotsos et al. (2021) studied the levels of NO2, O3, PM2.5 and PM10 concentrations during the lockdown period in Athens, Thessaloniki, Volos and Larissa based on the observations recorded at the air quality monitoring stations belonging to the National Atmospheric Pollution Monitoring Network (NAPM) [8]. The results showed that in most cases, the change in air pollutants is not statistically significant, while the long-range transport seemed to be an important mechanism for particle pollution episodes [8]. Similarly, Avdoulou et al. (2023) showed that the PM10 are highly affected by the weather conditions as well as the long-range transport of African dust [9].
Scientific studies regarding the effects of lockdown on ambient air quality mainly focus on urban areas where the major human mobility restriction policies were implemented [7,8,9]. Also, areas with industrial, electricity generation and coal-mining activities experienced a temporary reduction in their operations as a consequence of lockdown with possible impact on air quality [10,11]. In Poland, where the coal dominates in electricity production, its share in power production during the pandemic was reduced by 24% [10]. Filonchyk et al. (2021) analyzed the PM2.5, PM10, SO2 and NO2 concentrations in Polish cities during March–April 2020 and attributed their reductions to reduced activity of power plants, among other restriction policies [10]. Arregocés et al. (2021) studied the effects of lockdown on particle air pollution at Cerrejón mine which is Latin America’s largest open-pit coal mine and found increasing trends in their concentrations mainly attributed to weather conditions [11]. Ranjan et al. (2020) investigated the changes in Aerosol Optical Depth (AOD) level during lockdown phases over urban and mining regions in India. Primarily, they reported positive AOD in different coalfields throughout the lockdown periods due to on-going coal mining operations, while negative AOD anomaly was reported in a minor number of mines when operating in reduced capacity [12].
In this study, we focus on Western Macedonia, Greece which is largely dominated by lignite mining, lignite-fired power plants, and district heating systems [13,14,15,16,17,18,19,20,21,22,23,24,25,26]. These activities are a significant part of the local and national economy, but also contribute to the environmental pollution in the region. As demonstrated by previous studies, the air pollution in Western Macedonia is highly correlated with the activities in the lignite centre of the region and the power generation [13,14,15,16,17,18,19,20,21,22,23,24,25,26]. Skoulidou et al. (2021) studied the NOx emissions over Western Macedonia based on the observations from satellite instruments as well as surface measurements of NO2 from the AQMS operating in the region [27]. Their analysis revealed a strong decrease in emissions and concentrations in summer of 2018 and 2019, which are supported by similar decreases in the energy production of the power plants [27]. In addition, studies that used PM concentrations data from the ground-based AQMS reported an overall air quality improvement and downward trends of PM concentrations over the decade 2011–2020. [Pavloudakis et al., 2022]. These trends follow the gradual decrease in both lignite production and total excavations volumes that are consequences of the goal of complete decarbonization and Just Transition Development Plan of lignite areas in Greece [Pavloudakis et al., 2020, Tranoulidis et al. (2022)]
In this study we analyze the impact of COVID-19 restrictions measures on air quality in a “coal region” in the era of energy transition based on air pollution data of a dense network of AQMS in the Lignite Center of Western Macedonia. The specific research objectives are 1) to identify the temporal and spatial distribution of both PM2.5 and PM10 in the region pre-, during and post- lockdown period, 2) to unveil the contribution of coal-phase out policies in air pollutants concentrations and 2) to find the associations of air pollutants with the meteorological parameters.

2. Materials and Methods

2.1 Study location

Western Macedonia, located in North-western Greece, is divided into the regional units of Florina, Grevena, Kastoria, and Kozani, with a total population of 255,056 inhabitants. The area mostly comprises of mountainous and semi-mountainous land, while it is also the largest concentration of surface water in the country. The economy of Western Macedonia is heavily based on the extraction and use of lignite in thermal power plants [21,22,23,24]. These operations began in September 1956, when LIPTOL SA (Ptolemaida Lignite Mines) signed an agreement with the German company KHD regarding the construction of the first thermal power station operating on lignite [28]. The exploitation of lignite deposits for power generation covered for decades the majority of the electricity production in Greece. As an example, in the years 2001–2004, the lignite production in Western Macedonia exceeded 55 million tons per year [24] Ziouzios et al., 2021].

2.2 Data and Statistical Analysis

In this study, we used the data from PM2.5, PM10, NO, NO2, NOx and SO2 concentrations registered on an hourly basis from ten Air Quality Monitoring Stations (AQMS) in the region under study for a 13-year period (from the 1st of January 2010 to the 31st of December 2022). The concentrations of PM10 and PM2.5 were detected by Grimm Aerosol Technik, model EDM180 [18]. At each AQMS the air temperature (°C), relative humidity (%), wind speed (m/sec) and direction are measured. The spatial coverage of AQMS includes different locations in the region. Most of the AQMS located in villages and towns in the proximity of the Power Stations.
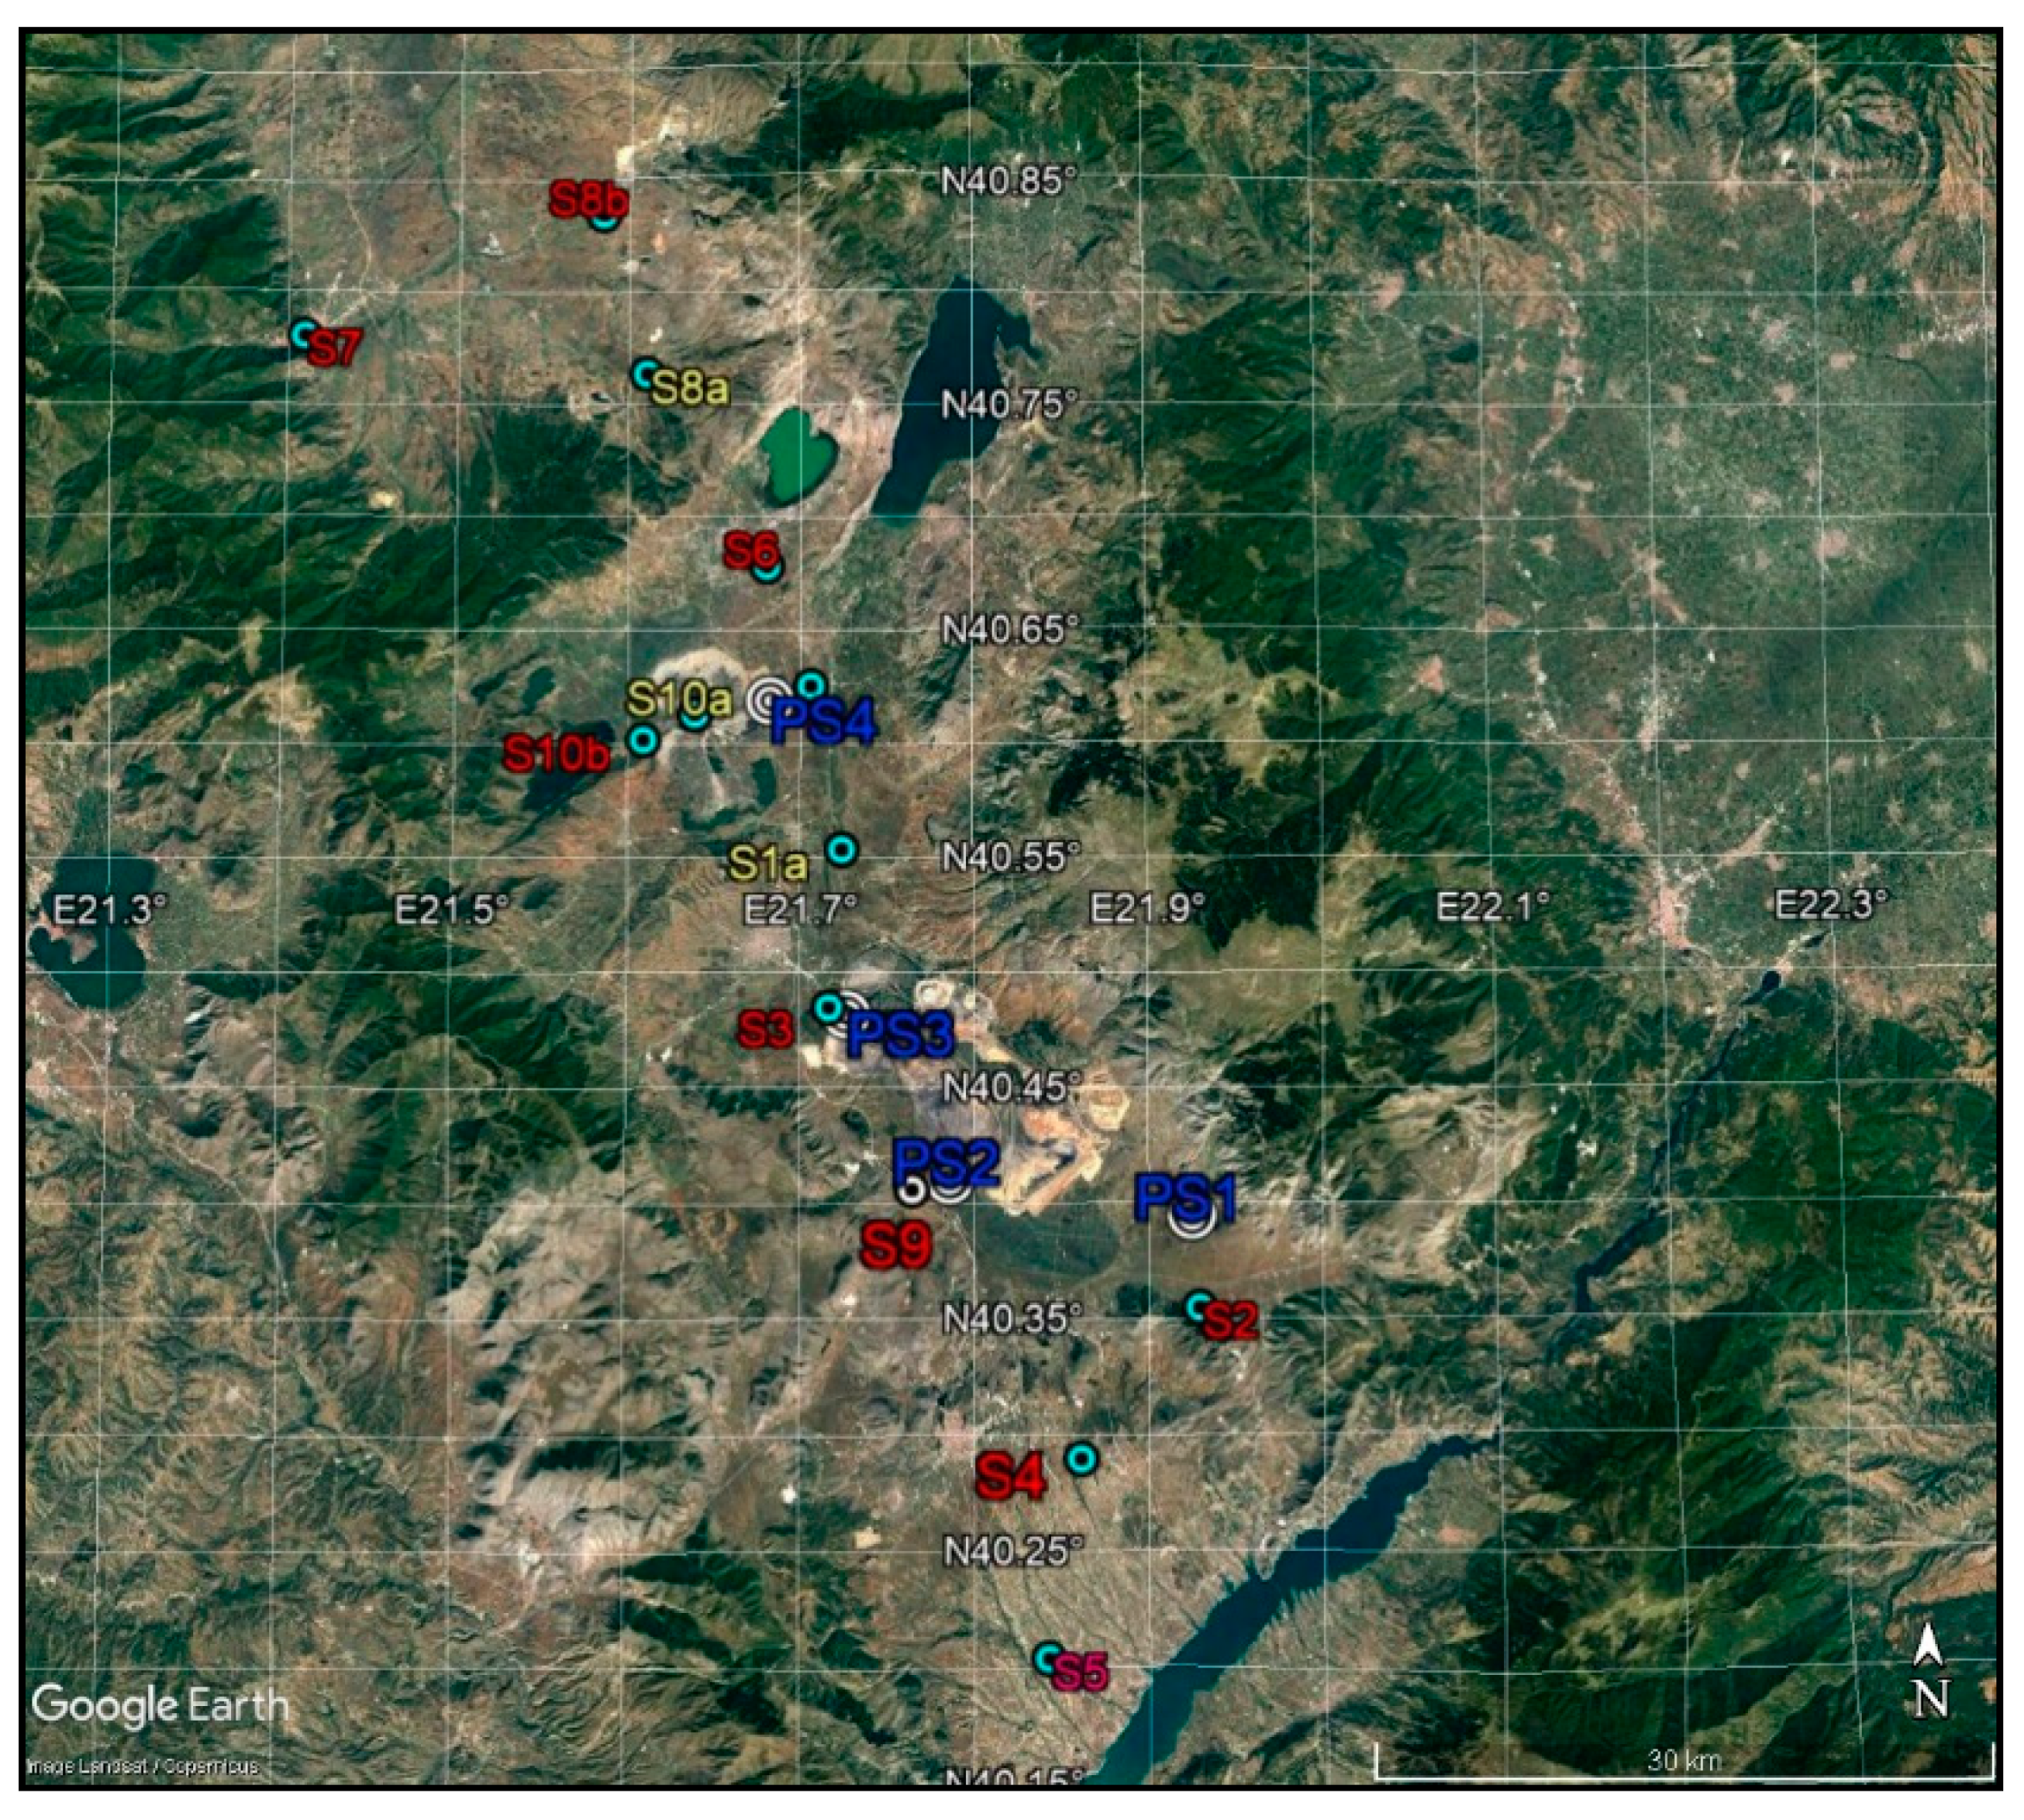
The location of the AQMS and their coordinates are presented in Figure 1 and Table 1, respectively. The measurements are available for all AQMS over the 13-year period, except for the AQMS S3, where measurements are available for the period from 1 January 2010 to 28 November 2019. So, the AQMS S3 was excluded from the analysis. For the statistical analysis of the air pollution and meteorological data we used the packages “corrplot”, “PerformanceAnalytics” and “openair” in R software.
We also use the time series of precipitation data for the period 2010-2020 for Florina from the automatic weather stations of NOAAN network of the National Observatory of Athens [29]. The data are available on-line at: https://data.climpact.gr/el/dataset/497dc26d-45e0-4ad5-b8f3-5f8890f65129.
The Materials and Methods should be described with sufficient details to allow others to replicate and build on the published results. Please note that the publication of your manuscript implicates that you must make all materials, data, computer code, and protocols associated with the publication available to readers. Please disclose at the submission stage any restrictions on the availability of materials or information. New methods and protocols should be described in detail while well-established methods can be briefly described and appropriately cited.
Research manuscripts reporting large datasets that are deposited in a publicly available database should specify where the data have been deposited and provide the relevant accession numbers. If the accession numbers have not yet been obtained at the time of submission, please state that they will be provided during review. They must be provided prior to publication.
Interventionary studies involving animals or humans, and other studies that require ethical approval, must list the authority that provided approval and the corresponding ethical approval code.

3. Results

3.1 PM2.5 concentrations at the AQMS in Western Macedonia

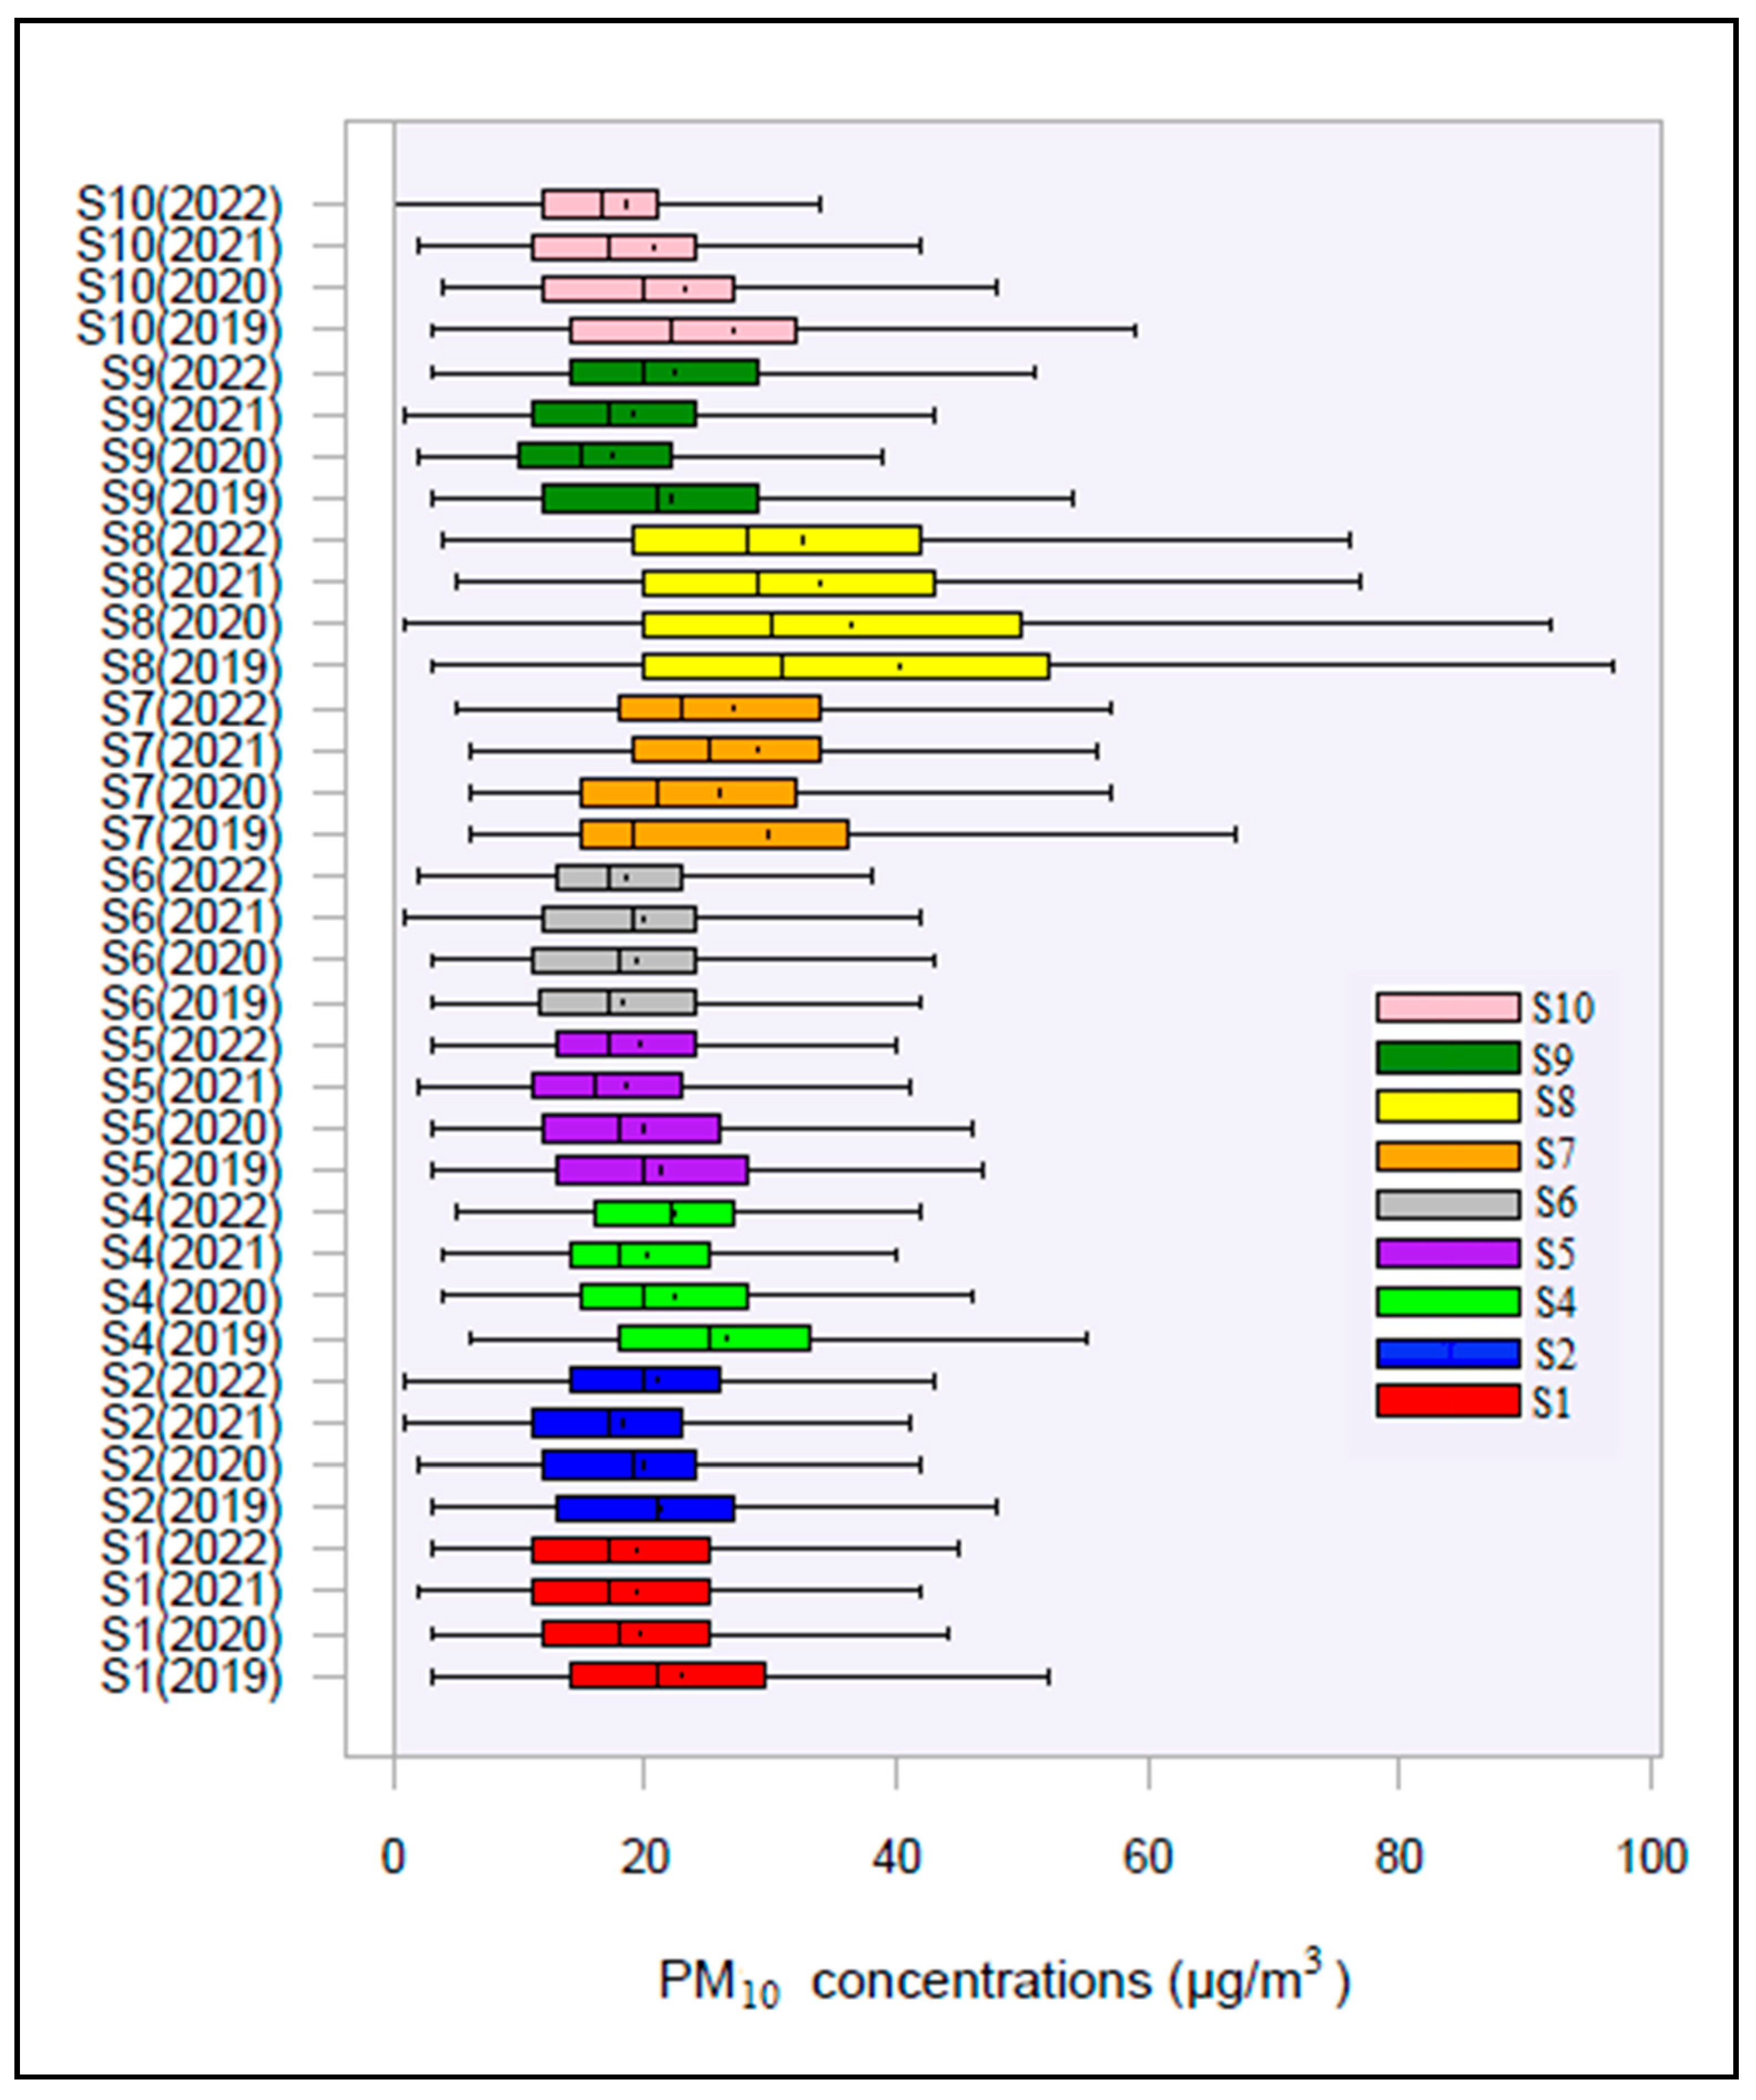
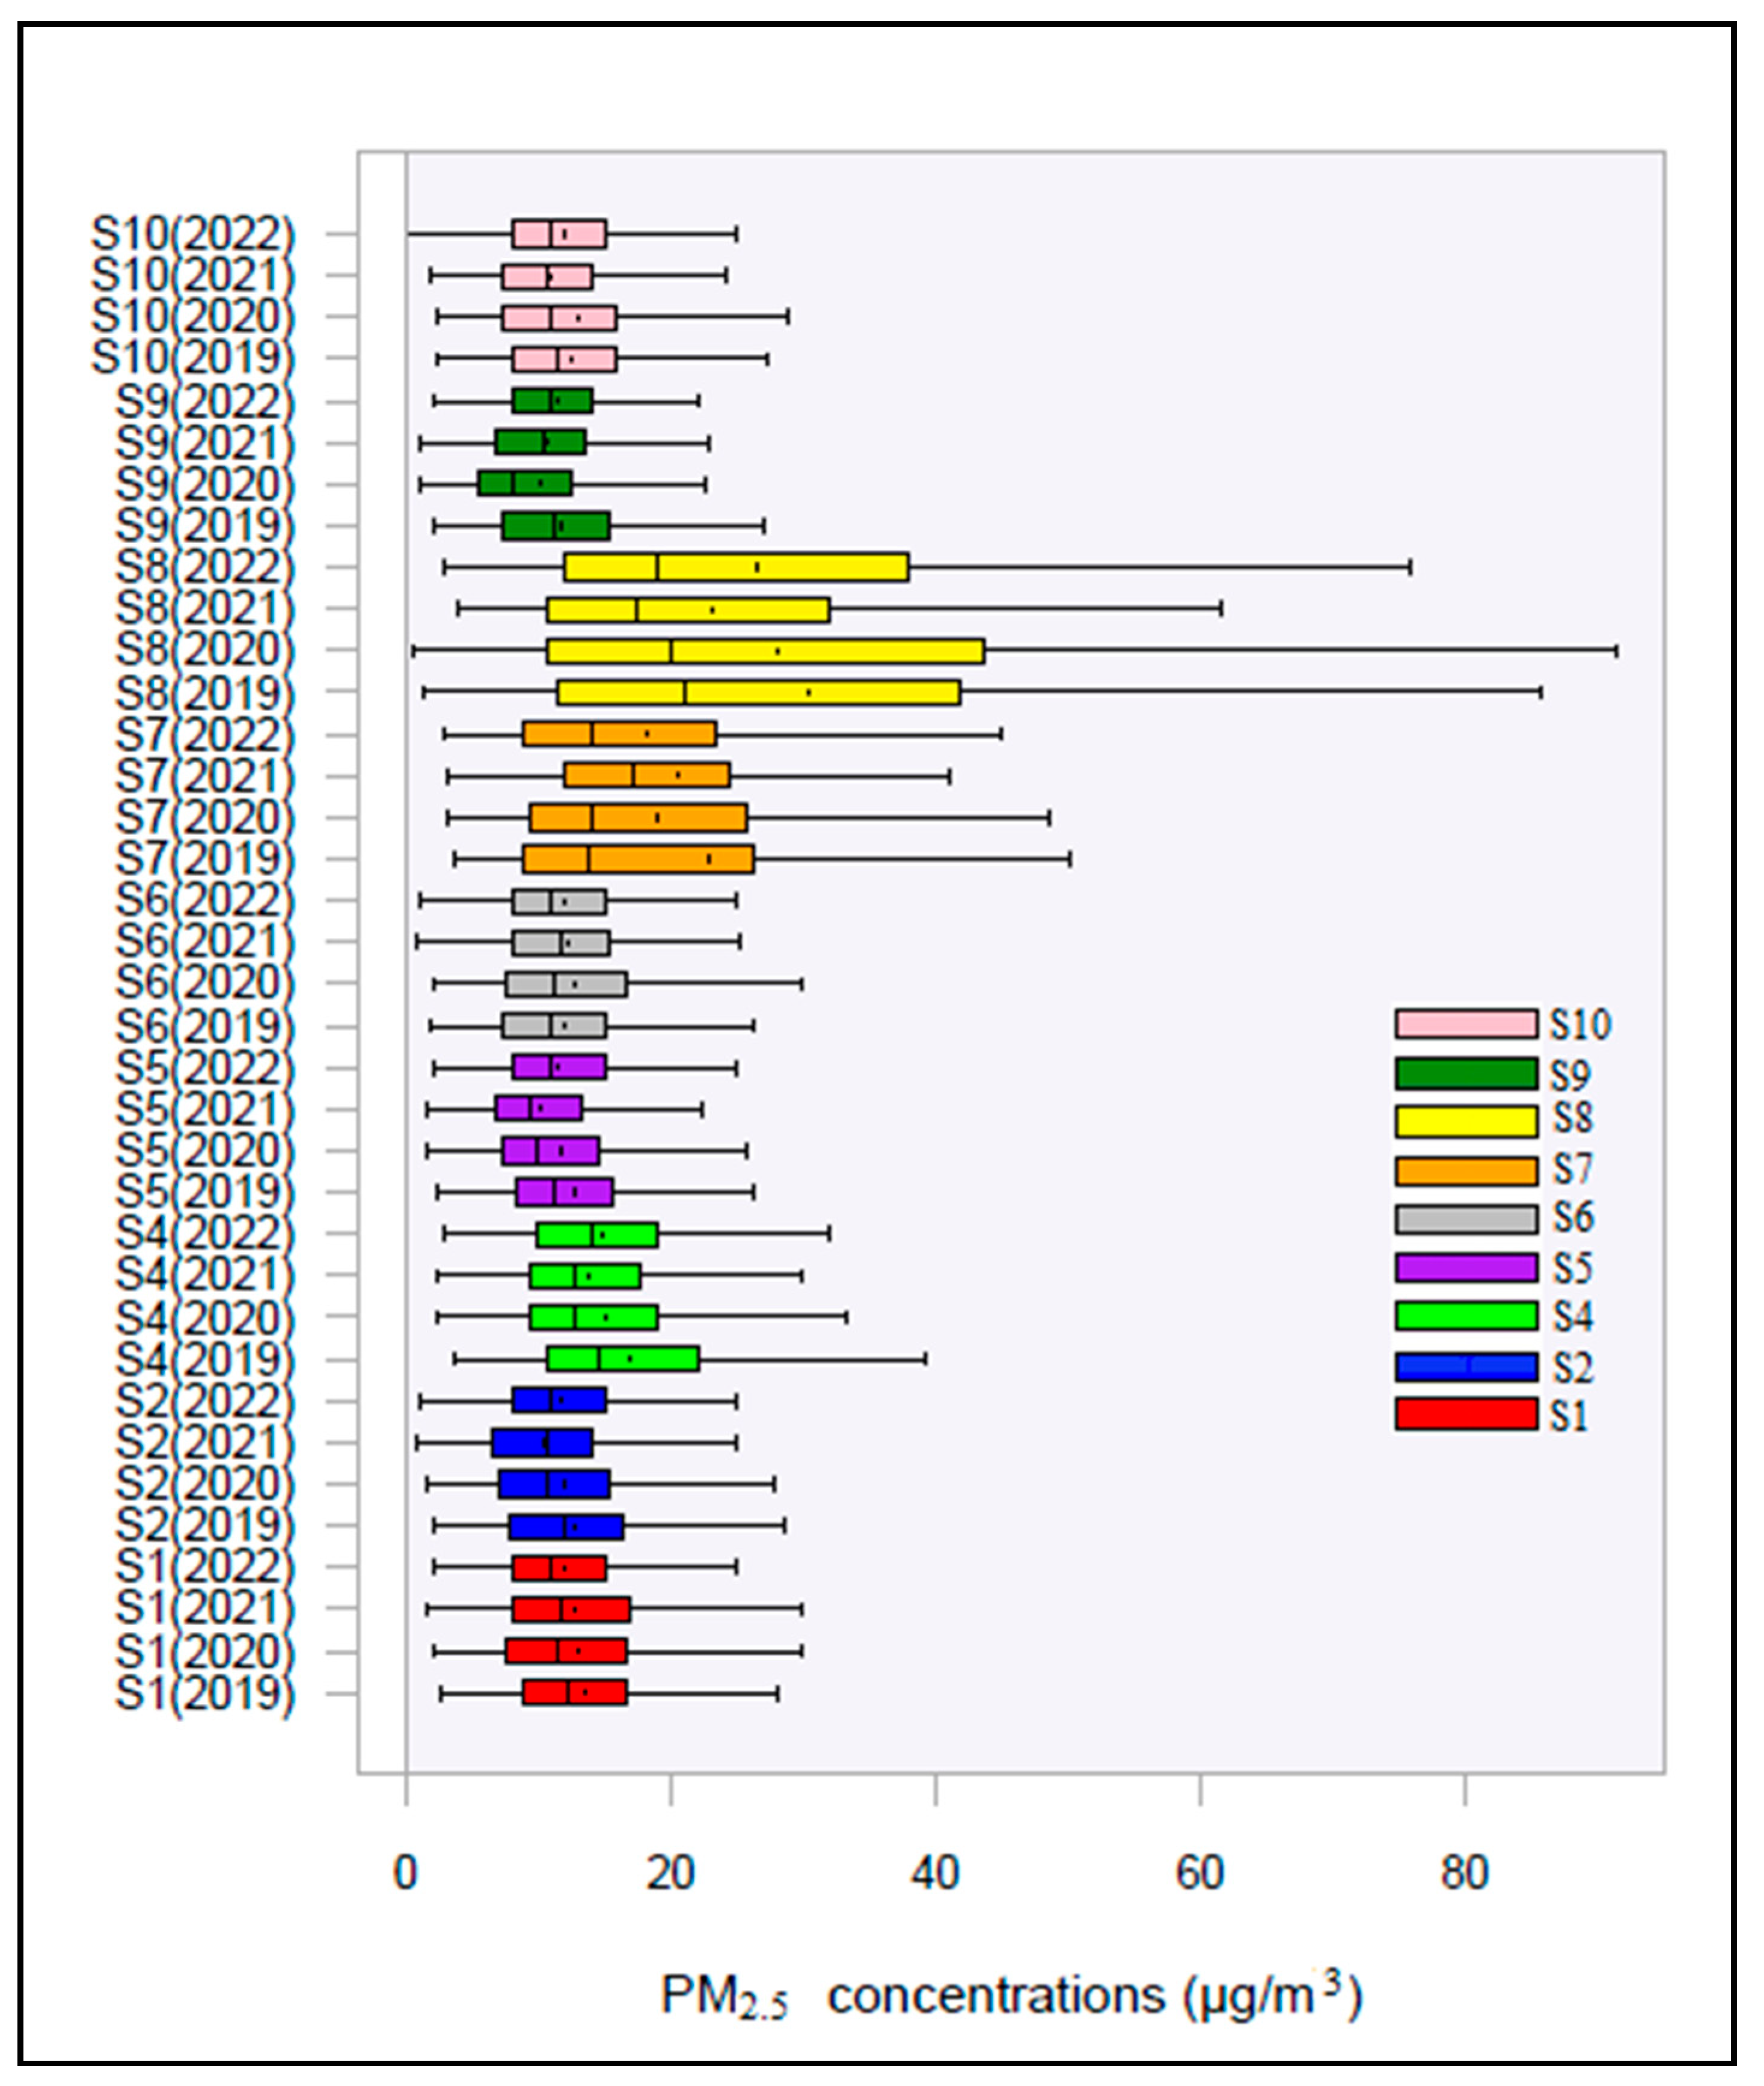
Figure 2 and Figure 3 illustrate the box plots of the annual mean PM2.5 and PM10 concentrations, as registered by the AQMS in the region of Western Macedonia Lignite Center for the years 2019, 2020, 2021 and 2022. The concentrations of PM2.5 and PM10 varied among the AQMS. Notably, AQMS S7 and S8 registering the highest PM2.5 values. As for the years 2020 and 2021 when the lockdown restrictions were implemented, there is a general decrease in the mean, median and interquartile range of PM2.5 concentrations at all the AQMS expect for AQMS S6 and S10 where a slight increase is detected in 2020. Similarly, mean, median and interquartile range of PM10 concentrations generally decreased in 2020 at all the AQMS expect for AQMS S6.
In Figure 2 the box-plots of PM2.5 concentrations for the years 2019, 2020, 2021 and 2022 for the AQMS S1, S2, S4, S5, S6, S7, S8, S9 and S10 are shown. In 2019, the mean annual PM2.5 concentrations were 13.7 μg/m3, 12.8 μg/m3, 17.0 μg/m3, 12.7 μg/m3, 11.9 μg/m3, 22.9 μg/m3, 30.5 μg/m3, 11.9 μg/m3 and 12.5 μg/m3 for the AQMS S1, S2, S4, S5, S6, S7, S8, S9, S10, respectively. In 2020, the mean PM2.5 concentrations were 12.9 μg/m3, 11.9 μg/m3, 15.2 μg/m3, 11.6 μg/m3, 12.8 μg/m3, 18.9 μg/m3, 28.0 μg/m3, 10.2 μg/m3 and 12.9 μg/m3 for the AQMS S1, S2, S4, S5, S6, S7, S8, S9, S10, respectively. A minor decreasing trend followed in the year 2021. In 2021, the mean PM2.5 concentrations were 12.8 μg/m3, 10.6 μg/m3, 13.7 μg/m3, 10.3 μg/m3, 12.2 μg/m3, 20.5 μg/m3, 23.3 μg/m3, 10.8 μg/m3, 11.0 μg/m3 for the AQMS S1, S2, S4, S5, S6, S7, S8, S9, S10, respectively. In 2022, a slight increase in PM2.5 concentrations was detected which is not apparent at all AQMS. Specifically, the mean PM2.5 concentrations in 2022 were 12.0 μg/m3, 11.7 μg/m3, 14.9 μg/m3, 11.6 μg/m3, 12.0 μg/m3, 18.2 μg/m3, 26.6 μg/m3 , 11.4 μg/m3 and 12.0 μg/m3 for the AQMS S1, S2, S4, S5, S6, S7, S8, S9, S10, respectively.
As we mentioned above the AQMS S7 and S8 were constantly recording the highest values. The AQMS S8 was located in Meliti for the years under study after its relocation from Vevi in 2018, while the AQMS S7 was located in Florina. In both of these areas, district heating networks are currently not available. This means that traditional heating systems such as fireplaces and wood burning in stoves are prevalent, which of course are major source for air pollution in these areas [12]. It is well-known that combustion appliances that burn fossil fuels, wood or biomass emit a large number of air pollutants (CO, PM, NOx, Volatile Organic Compounds (VOCs) and Polycyclic Aromatic Hydrocarbons (PAHs)) as well as CO2 emissions [32]Bari et al., 2011; [33]Fameli et al., 2021.
Given that the amounts of energy needed for heating applications depends on the prevailing weather conditions and that due to its geographic location, the cold period in Western Macedonia is longer in comparison to the rest of the country, the region is the most energy-consuming region in Greece, in terms of Heating Degree-Days [30]. According to Zoras et al. (2007) the climatological monthly mean temperature in Kozani and Florina ranged from values below 3 °C in January to almost 24 °C in July, while the precipitation amounts are higher in November and December [16].
In contrast to Florina, Kozani, Ptolemaida, Amyntaio and Filotas are equipped with district heating networks that utilize the thermal load of the neighbouring lignite-fired power stations [37] Pitoska et al., 2021]. The district energy systems have the advantage to produce heat and/or power with limited environmental impacts and reduced CO2 and other GHG (Greenhouse Gas) emissions. As well as they have economic benefits given that they are highly efficient systems and minimize energy wastes [36] Margaritis et al., 2015]. Pitoska et al. (2021) conducted a questionnaire survey in the city of Ptolemaida and found that the participants recognize the high efficiency of district heating in reducing pollutants and protecting the environment [37].
Figure 3 displays the box-plots of PM10 concentrations for the years 2019, 2020, 2021 and 2022 for the AQMS S1, S2, S4, S5, S6, S7, S8, S9 and S10. In 2019, the mean annual PM10 concentrations were 22.9 μg/m3, 21.1 μg/m3, 26.4 μg/m3, 21.2 μg/m3, 18.2 μg/m3, 29.9 μg/m3, 40.1 μg/m3, 22.2 μg/m3 and 27.0 μg/m3 for the AQMS S1, S2, S4, S5, S6, S7, S8, S9, S10, respectively. In 2020, the mean PM10 concentrations were 19.5 μg/m3, 19.8 μg/m3, 22.4 μg/m3, 20.0 μg/m3, 19.3 μg/m3, 25.9 μg/m3, 36.5 μg/m3, 17.4 μg/m3 and 23.1 μg/m3 for the AQMS S1, S2, S4, S5, S6, S7, S8, S9, S10, respectively. In most of the AQMS, there was a decrease in annual mean and median PM10 concentrations in 2021 followed by elevated values in 2022. Specifically, the mean PM10 concentrations in 2021 were 19.5 μg/m3, 18.3 μg/m3, 20.0 μg/m3, 18.6 μg/m3, 20.0 μg/m3, 28.9 μg/m3, 33.8 μg/m3, 19.0 μg/m3 and 20.7 μg/m3 for the AQMS S1, S2, S4, S5, S6, S7, S8, S9, S10, respectively. The mean PM10 concentrations in 2022 were 19.3 μg/m3, 20.9 μg/m3, 22.4 μg/m3, 19.5 μg/m3, 18.4 μg/m3, 26.9 μg/m3, 32.6 μg/m3, 22.4 μg/m3 and 18.5 μg/m3 for the AQMS S1, S2, S4, S5, S6, S7, S8, S9, S10, respectively.
In general, the air pollutants in the region of Western Macedonia exhibit clear seasonality patterns with their highest values during the winter months and their lowest values during the summer period. The great variations in the air pollutant values were largely affected by the emissions sources in the region and the meteorological conditions. As previously mentioned, Western Macedonia is largely dominated by the mining activities and the electricity generation in the lignite-fired power plants. The activities in the open-pit lignite mines such as mining, transportation of soil and coal, movement of trucks on unpaved roads are major sources of PM10 in the region [13,14,15,17,19,20]. Prior studies have identified the role of these activities in the overall air quality in the region [13,14,15,16,17,18,19,20].
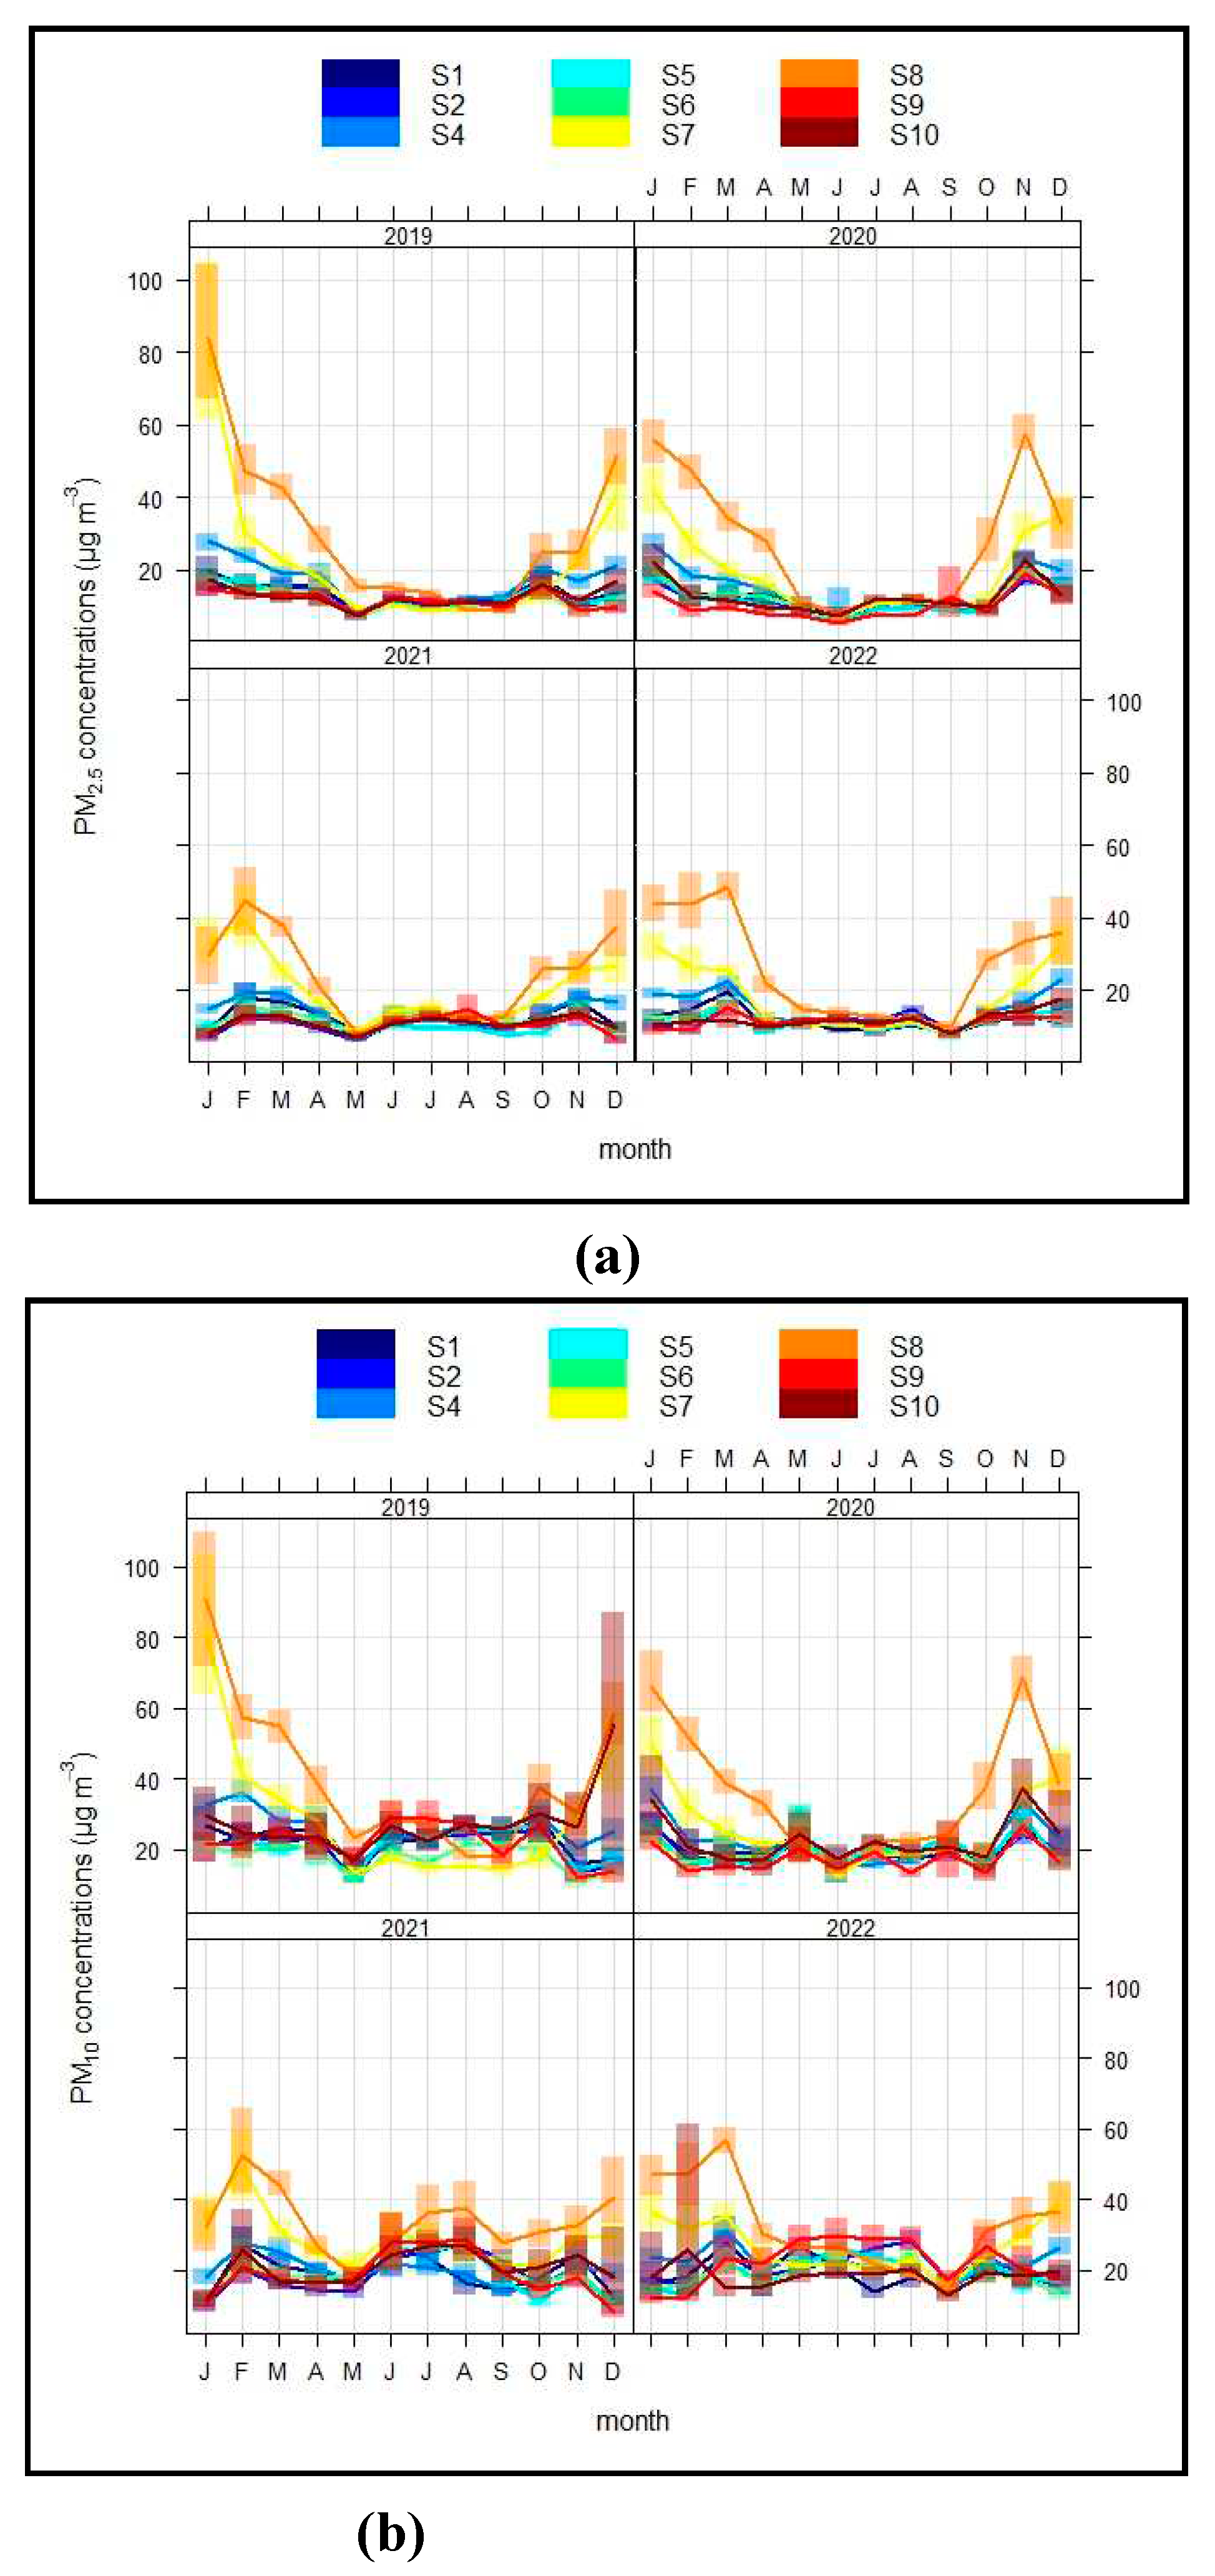
Figure 4a and 4b show the mean monthly variation in PM2.5 and PM10 concentrations and the 95% confidence interval in the mean for the AQMS S1, S2, S4, S5, S6, S7, S8, S9 and S10 for the years 2019, 2020, 2021 and 2022.
The higher mean monthly PM2.5 concentrations were detected during the cold period (October to April) while the warm period (May to September) the lowest mean monthly concentrations PM2.5 concentrations were observed (Figure 4a). As a general trend for the period 2019-2022, the mean monthly PM2.5 values among the AQMS S1, S2, S4, S5, S6, S7, S8, S9 and S10 varied greatly. The highest mean monthly PM2.5 concentrations observed at AQMS S7 and S8. In March, April and May of 2020, the mean monthly PM2.5 were 19.8 ± 7.1 μg/m3, 16.5 ± 7.3 μg/m3 and 9.5 ± 4.3 μg/m3 for the AQMS S7 and 34.5 ± 11.0 μg/m3, 28.0 ± 9.5 μg/m3 and 11.2 ± 6.0 μg/m3 for the AQMS S8. For the corresponding period of 2019 the mean monthly PM2.5 concentrations are generally higher. Specifically, the corresponding values in March, April and May 2019 for the AQMS S7 were 22.6 ± 8.0 μg/m3, 18.1 ± 7.6 μg/m3 and 9.2 ± 3.6 μg/m3, and for the AQMS S8 were 42.7 ± 11.4 μg/m3, 28.4 ± 9.1 μg/m3 and 15.5 ± 6.1 μg/m3.
As expected, there is a significant decrease in PM2.5 concentrations in 2020 compared to 2019 (Figure 4a). As for the AQMS S1, S2, S4, S5, S6, S9 and S10, the mean monthly PM2.5 concentrations were also decreased in March and April of 2020 compared to March and April of 2019. However, for the majority of the AQMS, in May of 2020 there was an increase in PM2.5 concentrations in terms of monthly values, compared to the previous year. Specifically, the mean monthly PM2.5 concentrations in May 2020 were 10.9 ± 5.8 μg/m3, 9.0 ± 4.5μg/m3, 10.2 ± 4.1μg/m3, 9.0 ± 4.5 μg/m3, 10.0 ± 5.6 μg/m3, 9.5 ± 4.3 μg/m3, 11.2 ± 6.0 μg/m3, 7.3 ± 4.3μg/m3 and 9.1 ± 4.7 μg/m3 for the AQMS S1, S2, S4, S5, S6, S7, S8, S9 and S10, respectively. In contrast, in May 2019 the mean monthly values were 8.1 ± 3.1 μg/m3, 6.9 ± 2.4 μg/m3, 8.3 ± 2.9 μg/m3, 7.1 ± 2.9 μg/m3, 7.0 ± 2.5 μg/m3, 9.2 ± 3.6 μg/m3, 15.5 ± 6.1 μg/m3, 7.9 ± 3.2 μg/m3 and 7.5 ± 2.7 μg/m3, for the AQMS S1, S2, S4, S5, S6, S7, S8, S9 and S10, respectively. The slight increase in concentrations could be attributed to the fact that from 4 May 2020, after the lockdown period of March and April 2020, the restrictions on movement and business activity began to be gradually lift.
As for PM10 concentrations, the mean monthly values exhibit spatial heterogeneity and no seasonality patterns can be detected at all AQMS. Solely, AQMS S7 and S8 exhibit clear seasonality patterns with the highest PM concentrations in winter period and the lowest concentrations in summer period. As mentioned above PM concentrations in Meliti and Florina are highly dependent on heating systems. Also, high PM10 concentrations during the winter period are detected at AQMS S4.
In general, researches on air quality in Western Macedonia prior to COVID-19 pandemic have also found that the highest PM10 concentrations registered in the warm period of the year [13,14,15,19,20]. For instance, Triantafyllou (2000) studied the PM10 concentrations in the southern part of the Eordea Basin from January 1991 to December 1994 and found that PM10 concentrations are higher during summer and early autumn and lower during spring [13]. This pattern in PM10 concentrations could be attributed to multiple causes including seasonal changes in the atmospheric dispersion characteristics and the absence of scavenging by precipitation [13,14,15,19,20]. Also, the wind-induced resuspension is a secondary source of PM10 in the open-pit coal mines during the warm period [19,20].
As we can see from Figure 4(b) at all the AQMS the mean monthly PM10 concentrations were decreased in March and April of 2020 compared to March and April of 2019. In detail, the mean monthly PM10 concentrations in March 2020 were 19.2 ± 10.6 μg/m3, 18.1 ± 11.3 μg/m3, 22.3 ± 8.10 μg/m3, 17.5 ± 9.25 μg/m3, 18.6 ± 11.8 μg/m3, 24.6 ± 10.2 μg/m3, 38.6 ± 11.6 μg/m3, 15.5 ± 9.0 μg/m3, 17.3 ± 9.8 μg/m3 for the AQMS S1, S2, S4, S5, S6, S7, S8, S9 and S10, respectively. In April 2020, the mean monthly PM10 concentrations were 18.70 ± 9.9 μg/m3, 16.20 ± 8.3 μg/m3, 19.30 ± 5.7 μg/m3, 14.90 ± 7.1 μg/m3, 17.70 ± 7.9 μg/m3, 21.30 ± 7.9 μg/m3, 33.00 ± 10.6 μg/m3, 14.33 ± 6.8 μg/m3 and 17.07 ± 8.2 μg/m3 for the AQMS S1, S2, S4, S5, S6, S7, S8, S9 and S10, respectively. As for March and April of 2019, the mean monthly PM10 concentrations were considerably higher. The mean monthly PM10 in March 2019, were 26.2 ± 8.20 μg/m3, 22.5 ± 8.6 μg/m3, 28.2 ± 9.9 μg/m3, 20.7 ± 8.1 μg/m3, 21.4 ± 7.5 μg/m3, 34.1 ± 11.1 μg/m3, 55.0 ± 13.7 μg/m3, 25.7 ± 10.7 μg/m3 and 23.3 ± 7.84 μg/m3, and in April 2019 were 24.70 ± 16.5 μg/m3, 23.34±14.0 μg/m3, 27.90 ± 12.8 μg/m3, 20.30 ± 14.2 μg/m3, 20.43 ± 14.6 , 28.50 ± 15.7 μg/m3, 38.60 ± 15.5 μg/m3, 22.40 ± 14.1 μg/m3, and 24.00 ± 16.7 μg/m3 for the AQMS S1, S2, S4, S5, S6, S7, S8, S9 and S10, respectively.
On the other hand, at all the AQMS the mean monthly PM10 concentrations in May of 2020 were increased compared to May of 2019. In May 2019, the mean monthly PM10 concentrations were 15.3 ± 6.0 μg/m3 , 11.7 ± 4.0 μg/m3, 15.0 ± 3.9 μg/m3 , 12.0 ± 3.6 μg/m3 , 10.9 ± 3.7 μg/m3 , 13.7 ± 3.9 μg/m3 , 23.4 ± 7.1 μg/m3 , 18.1 ± 8.2 μg/m3 and 17.0 ± 7.7 μg/m3, while in May 2020, the mean monthly PM10 concentrations were 24.2 ± 19.5 μg/m3, 22.7 ± 16.8 μg/m3, 23.1 ± 13.3 μg/m3, 24.4 ± 17.5 μg/m3, 23.5 ± 20.8 μg/m3, 22.7 ± 18.2 μg/m3, 19.9 ± 13.4 μg/m3, 20.4 ± 15.3 μg/m3 and 24.5 ± 19.6 μg/m3 for the AQMS S1, S2, S4, S5, S6, S7, S8, S9 and S10, respectively.
As for the years 2021 and 2022, it seems that the concentrations of PM remained at the levels of 2020 (Figures 2, 3, 4a and 4b). This could not be attributed merely to the COVID-19 pandemic, but also on other factors. In the period between the end of 2019 and mid-2020, the units I and II of the Power Station Kardia and the units I and II of the Power Station Amyntaio seized to operate. The closure of these units had an obvious effect on the air quality improvement in the region in the last decade, as reported in prior studies [19,20]. Sachanidis et al. (2022) reported that the improvement in ambient air quality in the Western Macedonia Lignite Center is correlated with the reduction on the excavated rock volumes and the lignite amount produced [25]. Importantly, they highlighted that the overall better air quality is measured higher in terms of the number of exceedances of PM limit values. The PM exceedances are mainly correlated with air pollution episodes attributed to the lignite mining activities, prevailing meteorological conditions and the long-range dust transport seasonal phenomena [25]. The emissions from the combustion of lignite in the power stations, the mining activities of the lignite coal and the transport of fugitive dust sources and fly ash cause local air pollution phenomena [14].
As for the air quality improvement during the lockdown in Greece, previous studies have also reported a decrease in air pollutants concentrations, but additional factors also have an effect on air pollutants concentrations. Kotsiou et al. (2021) examined air quality during the pandemic in Volos, a coastal port city in Greece with almost 86,000 inhabitants, in accordance with the national census data of 2021 [31]. They found that the lockdown resulted in 37.4% reduction in mean daily PM2.5 in 2020 compared to 2019 levels but during the strictest lockdown (from 23 March to 4 May), the occurrence of high levels of PM2.5 were not avoided, even there were restrictions in human activity patterns [31].
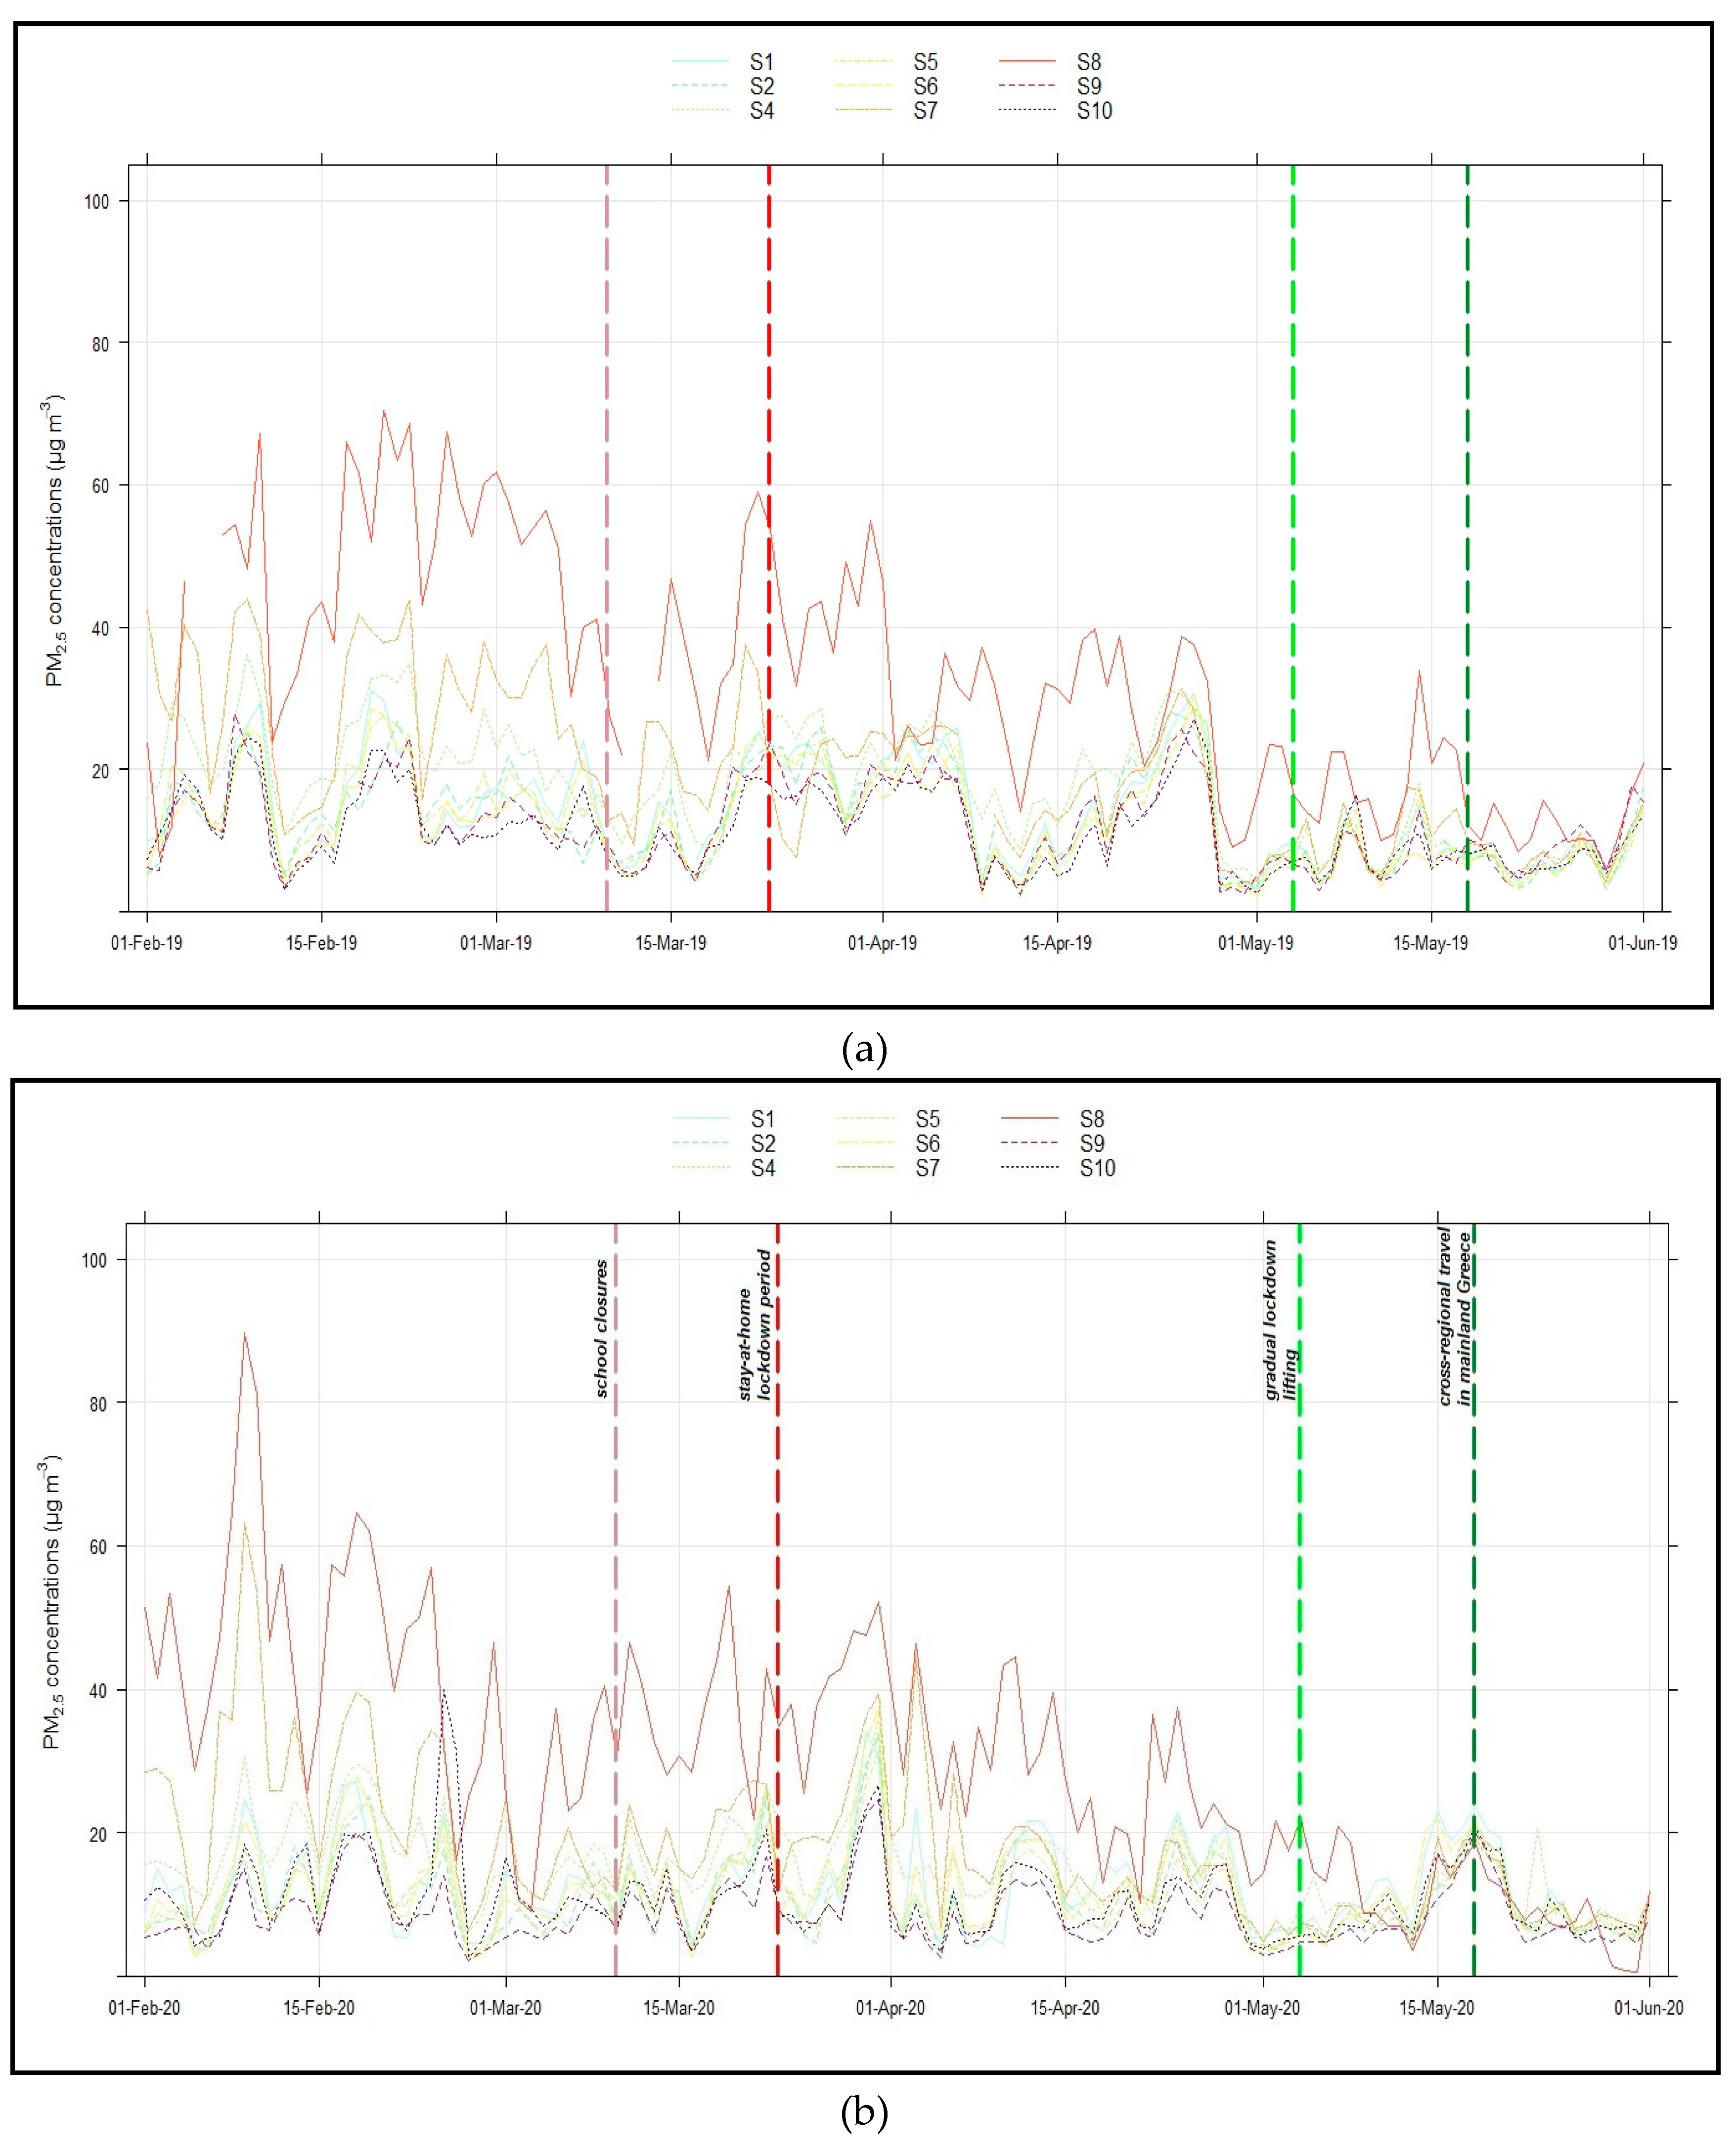
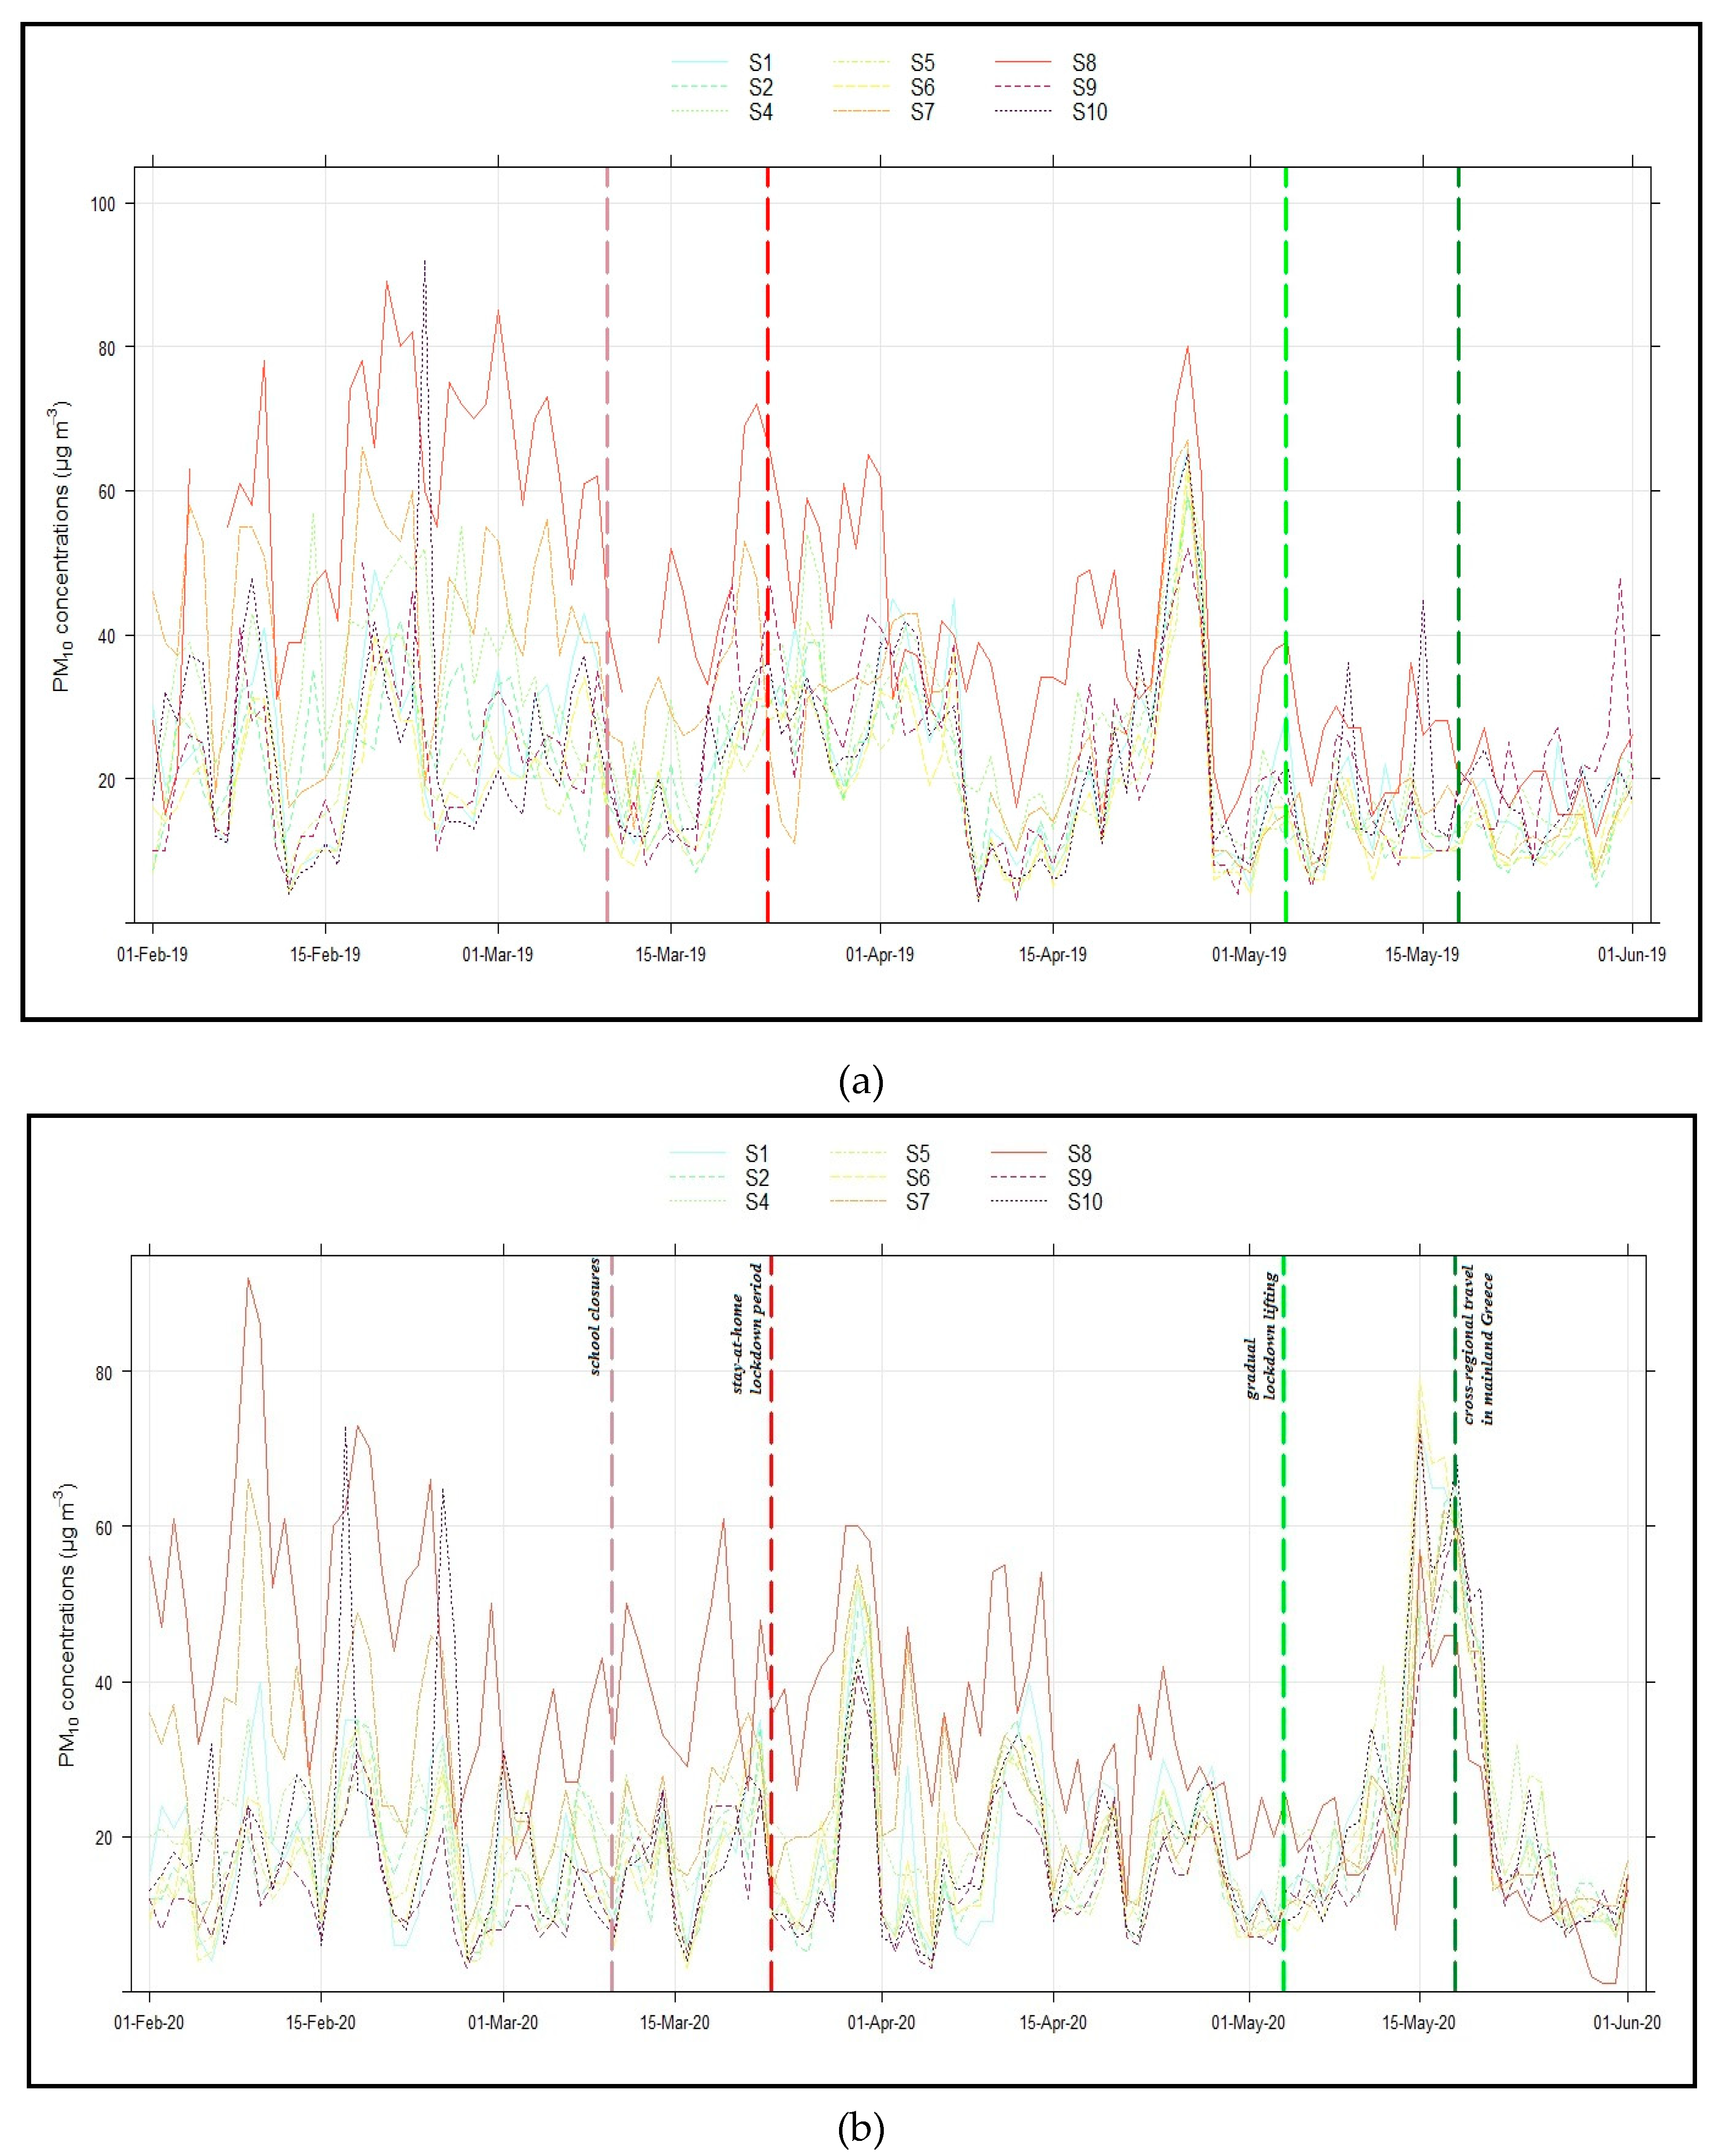
In our study, the period of the first national lockdown that began on the 23rd of March 2020 and ended in the first days of May 2020 is shown in Figure 5 and Figure 6. More specifically, Figure 5a shows the daily mean PM2.5 concentrations for the AQMS S1, S2, S4, S5, S6, S7, S8, S9 and S10 for the period from the 1st of February 2019 to the 1st of June 2019 and Figure 5b shows the corresponding period in 2020. Similarly, Figure 6a and 6b show the daily mean PM10 concentrations for the AQMS S1, S2, S4, S5, S6, S7, S8, S9 and S10 for the above mentioned periods.
During the first lockdown period (from 23 March to 4 May 2020) the daily PM2.5 concentrations reduced. Reductions in daily mean PM2.5 concentrations were observed at all AQMS in the weeks before the lockdown and during the 6-week lockdown (from 23 March to 4 May 2020) (Figure 5b). During the 6-week lockdown the mean PM2.5 concentrations were 13.1 μg/m3, 11.6 μg/m3, 15.0 μg/m3, 10.7 μg/m3, 12.9 μg/m3, 17.1 μg/m3, 29.8 μg/m3, 8.6 μg/m3, 10.0 μg/m3 for the AQMS S1, S2, S4, S5, S6, S7, S8, S9 and S10, respectively. In this period there was a decrease of -16%, -27%, -21%, -25, -9%, -1%, -3%, -36% and -19% in the mean PM2.5 concentrations for the AQMS S1, S2, S4, S5, S6, S7, S8, S9 and S10, respectively. During the corresponding period in 2019 the mean PM2.5 concentrations were 15.6 μg/m3,15.8 μg/m3, 19.1 μg/m3, 14.3 μg/m3, 14.2 μg/m3, 17.2 μg/m3, 30.9 μg/m3, 13.5 μg/m3 and 12.4 μg/m3 for the AQMS S1, S2, S4, S5, S6, S7, S8, S9 and S10, respectively.
Specifically, during the period from the 23rd of March 2019 to the 4th of May 2019, the maximum daily PM2.5 concentrations were above 25 μg/m3, while the daily PM2.5 concentrations reached up to maximum daily values of 55 μg/m3 at the AQMS S8. In 2020, high levels of PM2.5 concentrations were also observed, with the daily maximum PM2.5 reaching up to 44.1 μg/m3 and 52.2 μg/m3 at the AQMS S7 and S8.
As we can see in Figures 6a and 6b, the daily mean PM10 concentrations during the first lockdown period (from 23 March to 4 May 2020) also reduced. During the 6-week lockdown the average PM10 concentrations were 18.7 μg/m3, 16.9 μg/m3, 20 μg/m3, 15.6 μg/m3, 18.2 μg/m3, 21.9 μg/m3, 34.4 μg/m3, 14.5 μg/m3 and 16.8 μg/m3 for the AQMS S1, S2, S4, S5, S6, S7, S8, S9 and S10, respectively. In this 6-week period there was a decrease of -25%, -28%, -30%, -26, -13%, -18%, -17%, -40% and 30% in the average PM10 concentrations for the AQMS S1, S2, S4, S5, S6, S7, S8, S9 and S10, respectively. During the corresponding period in 2019 the mean PM10 concentrations were 24.9 μg/m3, 23.4 μg/m3, 28.4 μg/m3, 21.2 μg/m3, 20.9 μg/m3, 26.6 μg/m3, 41.6 μg/m3, 24.3 μg/m3, 24.0 μg/m3 for the AQMS S1, S2, S4, S5, S6, S7, S8, S9 and S10, respectively. However, it is worth mentioned that in April 2019 there was a 5-day period of extremely high PM10 values with spatial homogeneity (Figure 6a). From the 24th of April to the 27th of April 2019 the PM10 concentrations gradually increased at all the AQMS under study. This event that occurred in the second half of April 2019 is attributed to a large-scale Saharan dust episode over Greece and Europe [34] Peshev et al. (2022)]. In Greece dust episode are generally common phenomena during spring and autumn that mainly affect the southern part of Greece. Similarly, a long-lasting Saharan dust episode occurred in Greece from the 14th of May to the 20th of May 2020 with high values of PM10 concentrations at all the AQMS under study (Figure 6b) [35] Kokkalis et al, 2021]. As has been mentioned above long-range transport is an important mechanism for particle pollution episodes [8].

3.2 PM concentrations in correlation with meteorological parameters and air pollutants

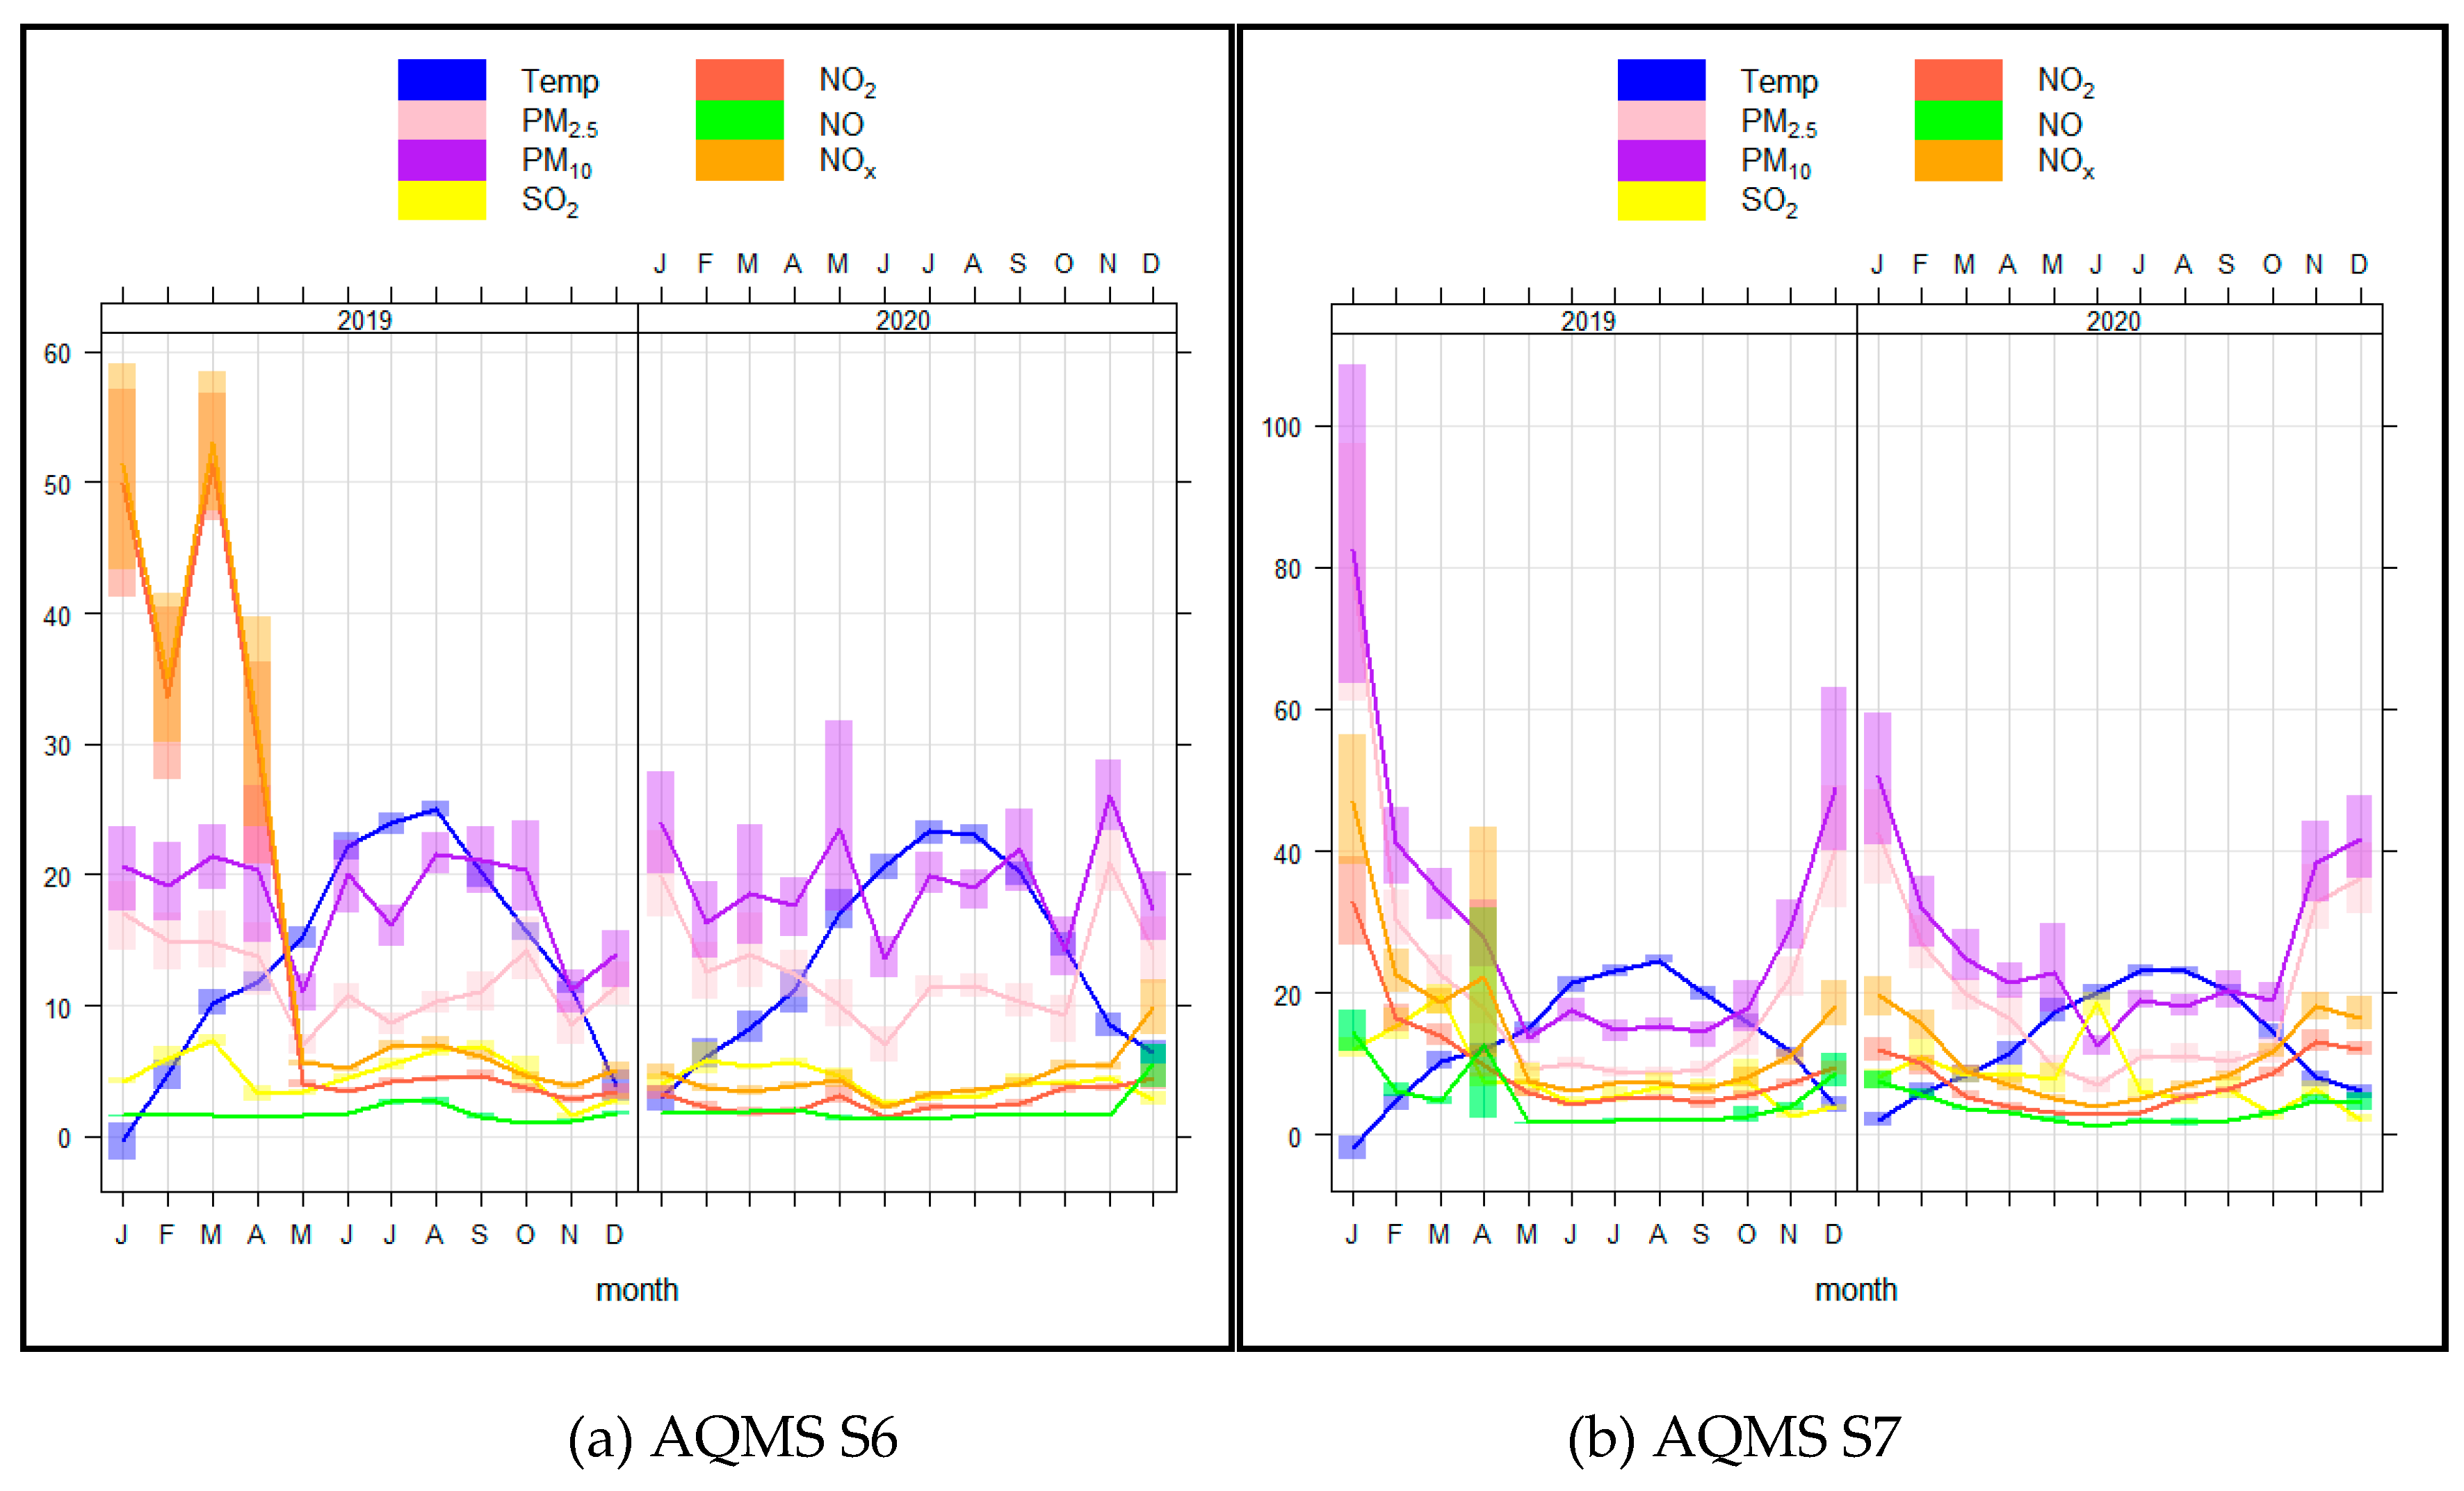
Figure 7a and 7b show the mean monthly variations in daily PM2.5 , PM10 , SO2, NO2, NO and NOx concentrations (μg/m3) along with the mean air temperature (°C) for the AQMS S6 and S7 for the year of 2019 and 2020. AQMS S6 is located in Amyntaio which is a town with 4,348 inhabitants and AQMS S7 is located in Florina, which is a town with a population 17,188 inhabitants [38].
As we previously discussed, the AQMS S7 registered high PM2.5 and PM10 concentrations because it is highly affected from the local sources of air pollution from the traditional heating systems. The highest air pollutants concentrations were observed during the winter months when the lowest air temperatures were observed. For example, in January of 2019 the mean air temperature was below 0°C (Tmean=-1.8° C ± 4.2°C), while PM10 and PM2.5 reached up to 82.6 μg/m3 and 80 μg/m3, respectively. The PM2.5/PM10 ratio reached the value of 1.0 indicating the major contribution of fine particles attributable to anthropogenic air pollution sources. Based on previous studies the high ratios which have been found in Florina indicate the great contribution of the individual household heating systems (e.g., fireplaces and woodstoves) and biomass burning [20]. In March and April of 2020, the air temperature was lower compared to of the same months in 2019. The monthly mean air temperature was 8.4°C±3.4°C and 11.4°C±5.0°C in March and April of 2020, 10.4°C±3.4°C and 12.1°C±2.3°C, for the same months in 2019. However, the PM concentrations were lower in 2020 compared to 2019 indicating that lockdown restrictions had an effect on air pollutant concentrations. As we have previously mentioned, PM10 concentrations in March and April of 2020 were considerably lower compared to the corresponding months in 2019. The mean monthly SO2, NO2, NO, NOx concentrations were 19.6 μg/m3, 4.80 μg/m3, 13.9 μg/m3 and 18.7 μg/m3 in March of 2019, and 7.59 μg/m3, 12.6 μg/m3, 9.80 μg/m3 and 22.4 μg/m3in April of 2019, respectively. In 2020 the air pollutants concentrations are lower. In detail, in March 2020 the mean monthly SO2, NO2, NO, NOx concentrations were 8.28 μg/m3, 3.54 μg/m3, 5.46 μg/m3 and 9.00 μg/m3, while in April 2020 8.55 μg/m3, 3.19 μg/m3, 3.88 μg/m3 and 7.07 μg/m3, respectively.
At the AQMS S6 the mean monthly SO2, NO2, NO, NOx concentrations were 7.23 μg/m3, 1.61 μg/m3, 51.4 μg/m3 and 53.0 μg/m3 in March 2019, and 3.24 μg/m3, 1.40 μg/m3, 29.7 μg/m3 and 31.1 μg/m3 in April 2019. Specifically, the mean monthly concentrations decreased sharply from May 2019 onwards to average monthly SO2, NO2, NO, NOx concentrations of 3.35 µg/m3, 1.62 µg/m3, 3.98 µg/m3 and 5.60 µg/m3, respectively.
In March of 2020 the concentrations of SO2, NO2, NO, NOx were 5.33 µg/m3, 1.87 µg/m3, 1.81 µg/m3 and 3.38 µg/m3, while in April of 2020 the concentrations of SO2, NO2, NO, NOx were 5.65 µg/m3, 2.05 μg/m3, 1.97 µg/m3 and 3.85 µg/m3, respectively. Both PM2.5 and PM10 concentrations were relative lower in 2020 compared to 2019 but no major differences were detected.
As for the meteorological conditions at the AQMS S6, the air temperature in relative low but at higher levels compared to AQMS S7. The monthly mean air temperature in January of 2019 was also below 0 °C, while in March and April of 2019 was at 10.2°C ± 2.95°C and 11.8°C ± 2.25°C, respectively. During the lockdown period in 2020, the monthly mean air temperature in March and April was 8.23°C ± 3.53°C and 11.2°C ± 4.94°C, respectively.
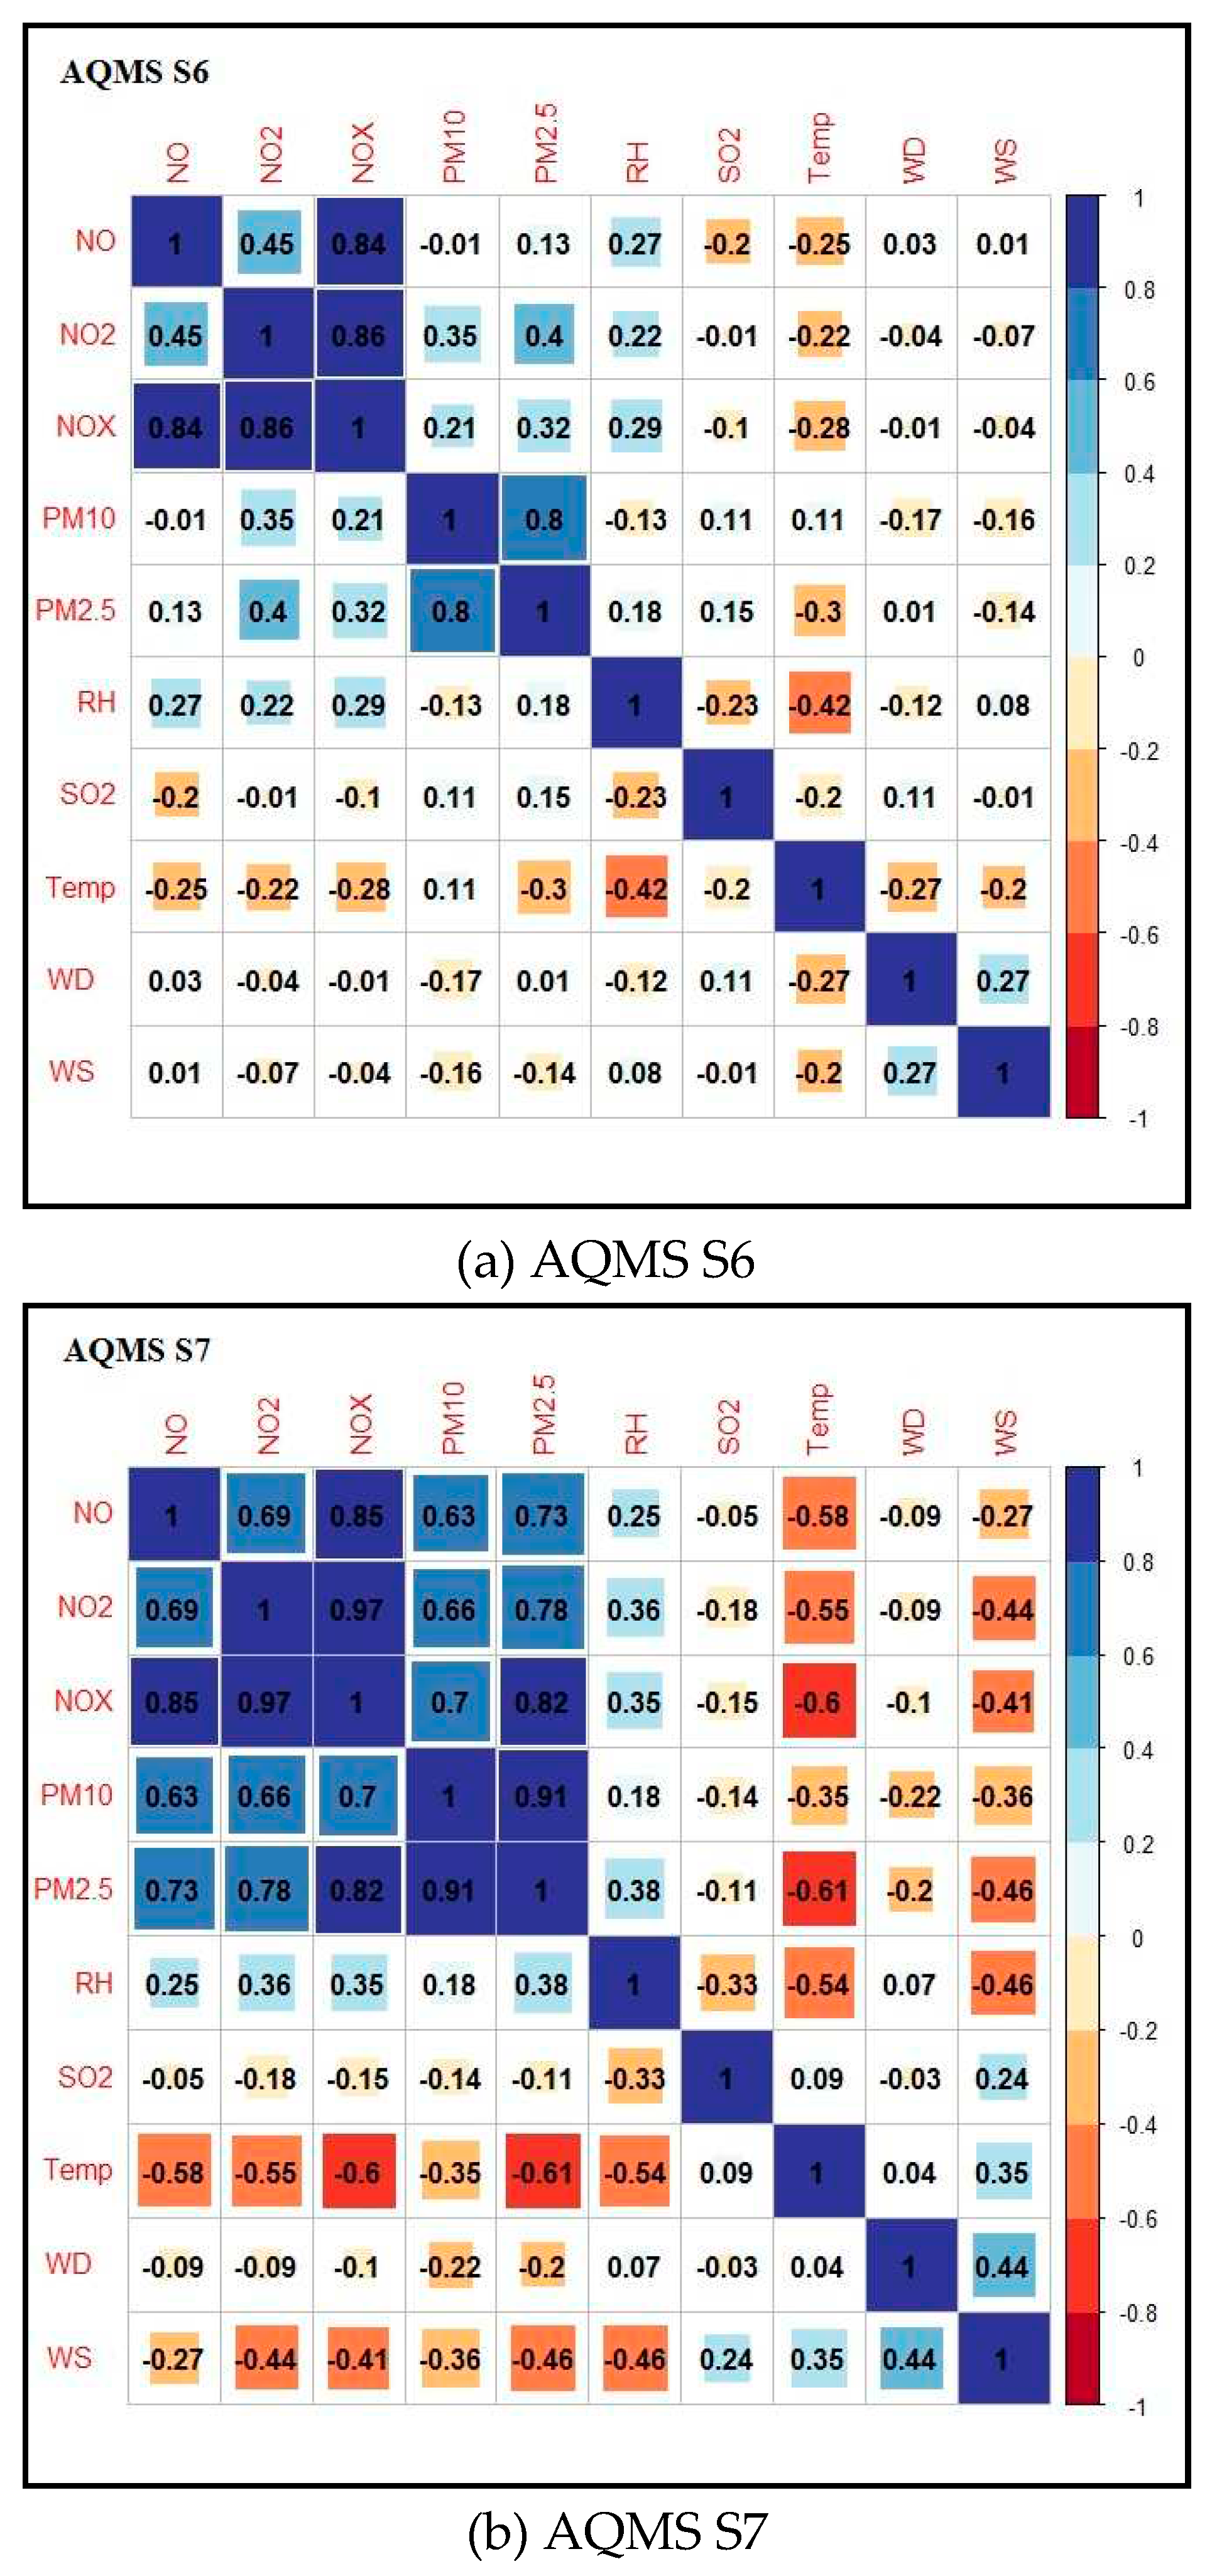
Figure 8(a) and 8(b) show the correlation coefficients between the daily air pollutants concentrations and meteorological parameters for the AQMS S6 and S7 for the year 2020. At AQMS S6 high positive correlations were found for PM2.5 and PM10 (r=0.8), while moderate or even negative correlations were found for both PM2.5 and PM10 with NOx, NO2, NO and SO2 (Figure 7(a)). As for the meteorological parameters, PM10 concentrations were positive correlated with air temperature (r=0.11) and negative with wind speed (r=-0.16). This also explains the fact that PM10 concentrations are higher during the warm period when the temperature are higher. In contrast, PM2.5 concentrations were negative correlated with air temperature (r=-0.3).
At AQMS S7 the PM concentrations have positive correlation with the air pollutants (PM, NOx, NO2 and NO) and relative humidity but negative correlation with SO2, wind speed, wind direction, and temperature (Figure 7 (b)). The highest values of correlation coefficient were found for PM2.5 and PM10 (r=0.91), PM2.5 and NOx (r=0.82), PM2.5 and NO2 (r=0.66), PM2.5 and NO (r=0.73), while moderate correlation coefficient were found for PM2.5 and RH (r=0.38). The highest negative correlation were found for PM2.5 and temperature (r=-0.61), and PM2.5 and wind speed (r=-0.36). Similarly, PM10 were highly correlated with NOx (r=0.70), NO2 (r=0.66) and NO (r=0.63), while negative correlations were found with SO2 (r=-0.14), wind speed (r=-0.36), wind direction (r=-0.22), and temperature (r=-0.35). The correlation coefficients at the AQMS S7 also explain the high dependence of PM with meteorological conditions.
4. Conclusions

In this study, we evaluate the impact of COVID-19 restrictions on the air quality of Western Macedonia, Greece based on air pollution and meteorological data from the AQMS network operated by the Lignite Center of Western Macedonia. In Western Macedonia, there is a general reduction in air pollutants levels during the last decade due to coal phase-out and energy transition. During the lockdown the levels of air pollutants decreased further. The analysis showed that the mean monthly PM2.5 concentrations decreased in 2020 and 2021 during the periods of lockdown at all the AQMS, while a moderate increase in the PM2.5 concentrations have been identified in 2022. During the period of the strictest lockdown (23 March to 4 May), the daily PM2.5 concentrations decreased but generally remained at high levels.

Author Contributions

Paraskevi Begou; Data Curation, Formal analysis, Software, Writing-original draft,Evagelopoulos Vasilios; Conceptualization, Supervision, Resources, Investigation, Data Curation, Project administration, Writing-Review & Editing, Nikolaos Charisiou; Validation, Writing-Review & Editing. All authors have read and agreed to the published version of the manuscript.

Funding

This research received no external funding.

Institutional Review Board Statement

Not applicable.

Informed Consent Statement

Not applicable.

Data Availability Statement

The datasets generated during and/or analysed during the current study are available from the corresponding author on reasonable request.

Conflicts of Interest

The authors declare no conflict of interest.

References

  1. Mathieu, E.; Ritchie, H.; Rodés-Guirao, L.; Appel, C.; Giattino, C.; Hasell, J.; Macdonald, B.; Dattani, S.; Beltekian, D.; Ortiz-Ospina, E. Coronavirus Pandemic (COVID-19). Our world in data 2020.
  2. IEA (2020), Electricity Market Report - 20, IEA, Paris https://www.iea.org/reports/electricity-market-report-december-2020, License: CC BY 4. 20 December.
  3. Covid-19 impact on electricity. Available online: https://www.iea.org/reports/covid-19-impact-on-electricity (accessed on 11 July 2023).
  4. Monthly Energy Reports. Available online: https://www.admie.gr/en/market/reports/monthly-energy-balance (accessed on 11 July 2023).
  5. Airborne Nitrogen Dioxide Plummets Over China. Available online: https://earthobservatory.nasa.gov/images/146362/airborne-nitrogen-dioxide-plummets-over-china (accessed on 11 July 2023).
  6. Concawe Review. Available online: https://www.concawe.eu/wp-content/uploads/Concawe-Review-30-1.pdf. (accessed on 11 July 2023).
  7. Hammer, M.S.; Van Donkelaar, A.; Martin, R.V.; McDuffie, E.E.; Lyapustin, A.; Sayer, A.M.; Hsu, N.C.; Levy, R.C.; Garay, M.J.; Kalashnikova, O.V. Effects of COVID-19 Lockdowns on Fine Particulate Matter Concentrations. Science Advances 2021, 7, eabg7670. [Google Scholar] [CrossRef] [PubMed]
  8. Varotsos, C.; Christodoulakis, J.; Kouremadas, G.A.; Fotaki, E.-F. The Signature of the Coronavirus Lockdown in Air Pollution in Greece. Water, Air, & Soil Pollution 2021, 232, 1–12. [Google Scholar]
  9. Avdoulou, M.M.; Golfinopoulos, A.G.; Kalavrouziotis, I.K. Monitoring Air Pollution in Greek Urban Areas During the Lockdowns, as a Response Measure of SARS-CoV-2 (COVID-19). Water, Air, & Soil Pollution 2023, 234, 13. [Google Scholar]
  10. Filonchyk, M.; Hurynovich, V.; Yan, H. Impact of Covid-19 Lockdown on Air Quality in the Poland, Eastern Europe. Environmental Research 2021, 198, 110454. [Google Scholar] [CrossRef]
  11. Arregocés, H.A.; Rojano, R.; Restrepo, G. Effects of Lockdown Due to the COVID-19 Pandemic on Air Quality at Latin America’s Largest Open-Pit Coal Mine. Aerosol and Air Quality Research 2021, 21, 200664. [Google Scholar] [CrossRef]
  12. Ranjan, A.K.; Patra, A.K.; Gorai, A.K. Effect of Lockdown Due to SARS COVID-19 on Aerosol Optical Depth (AOD) over Urban and Mining Regions in India. Science of The Total Environment 2020, 745, 141024. [Google Scholar] [CrossRef]
  13. Triantafyllou, A.G. Patterns and Concentrations of PM10 in a Mountainous Basin Region. Journal of the Air & Waste Management Association 2000, 50, 1017–1022. [Google Scholar]
  14. Triantafyllou, A. G., Kiros, E. S., Evagelopoulos, V. G. (2002). Respirable particulate matter at an urban and nearby industrial location: concentrations and variability and synoptic weather conditions during high pollution episodes. Journal of the Air & Waste Management Association (1995), 52(3), 287–296. [CrossRef]
  15. Triantafyllou, A.; Zoras, S.; Evagelopoulos, V. Particulate Matter over a Seven Year Period in Urban and Rural Areas within, Proximal and Far from Mining and Power Station Operations in Greece. Environmental monitoring and assessment 2006, 122, 41–60. [Google Scholar] [CrossRef]
  16. Zoras, S.; Evagelopoulos, V.; Pytharoulis, I.; Kallos, G. Development and Validation of a Novel-Based Combination Operational Air Quality Forecasting System in Greece. Meteorology and atmospheric physics 2010, 106, 127–133. [Google Scholar] [CrossRef]
  17. Syrakos, A., Sfetsos, A., Politis, M., Efthimiou, G., & Bartzis, J. G. (2008). An evaluation of the UoWM MM5-smoke-CMAQ modeling system for Western Macedonia. Hrvatski meteorološki časopis, 43(43/1), 88-92.
  18. Evagelopoulos, V.; Charisiou, N.D.; Zoras, S. Dataset of Inhalable Particulate Matter Concentrations in the Region of West Macedonia, Greece for an 11-Year Period. Data in Brief 2022, 41, 107883. [Google Scholar] [CrossRef]
  19. Evagelopoulos, V.; Begou, P.; Zoras, S. In-Depth Study of PM2.5 and PM10 Concentrations over a 12-Year Period and Their Elemental Composition in the Lignite Center of Western Macedonia, Greece. Atmosphere 2022, 13, 1900. [Google Scholar] [CrossRef]
  20. Evagelopoulos, V.; Begou, P.; Kassomenos, P.; Zoras, S. Investigation of the Particulate Air Pollution and the Ratio of PM 2.5 to PM 10 Concentrations in the Atmosphere over the Lignite Mining and Lignite-Fired Power Plants Region of Western Macedonia, Greece. IOP Conf. Ser.: Earth Environ. Sci. 2022, 1123, 012077. [Google Scholar] [CrossRef]
  21. Pavloudakis, F.; Karlopoulos, E.; Roumpos, C. Just Transition Governance to Avoid Socio-Economic Impacts of Lignite Phase-out: The Case of Western Macedonia, Greece. The Extractive Industries and Society 2023, 14, 101248. [Google Scholar] [CrossRef]
  22. Pavloudakis, F.; Sachanidis, C.; Roumpos, C. The Effects of Surface Lignite Mines Closure on the Particulates Concentrations in the Vicinity of Large-Scale Extraction Activities. Minerals 2022, 12, 347. [Google Scholar] [CrossRef]
  23. Pavloudakis, F.; Roumpos, C.; Karlopoulos, E.; Koukouzas, N. Sustainable Rehabilitation of Surface Coal Mining Areas: The Case of Greek Lignite Mines. Energies 2020, 13, 3995. [Google Scholar] [CrossRef]
  24. Ziouzios, D.; Karlopoulos, E.; Fragkos, P.; Vrontisi, Z. Challenges and Opportunities of Coal Phase-Out in Western Macedonia. Climate 2021, 9, 115. [Google Scholar] [CrossRef]
  25. Sachanidis, C.; Pavloudakis, F.; Roumpos, C. Correlation of Ambient Air Quality with the Sudden Reduction in Mining Activity in a Complex of Lignite Mines. In Proceedings of the International Conference on Raw Materials and Circular Economy; MDPI, January 17 2022; p. 102. [Google Scholar]
  26. Tranoulidis, A.; Sotiropoulou, R.-E.P.; Bithas, K.; Tagaris, E. Decarbonization and Transition to the Post-Lignite Era: Analysis for a Sustainable Transition in the Region of Western Macedonia. Sustainability 2022, 14, 10173. [Google Scholar] [CrossRef]
  27. Skoulidou, I.; Koukouli, M.-E.; Segers, A.; Manders, A.; Balis, D.; Stavrakou, T.; Van Geffen, J.; Eskes, H. Changes in Power Plant NOx Emissions over Northwest Greece Using a Data Assimilation Technique. Atmosphere 2021, 12, 900. [Google Scholar] [CrossRef]
  28. Roadmap for the transition of the Western Macedonia region to a post-lignite era. Available online: https://www.contentarchive.wwf.gr/images/pdfs/Roadmap_PostLignite_EN.pdf (accessed on 11 July 2023).
  29. Lagouvardos, K.; Kotroni, V.; Bezes, A.; Koletsis, I.; Kopania, T.; Lykoudis, S.; Mazarakis, N.; Papagiannaki, K.; Vougioukas, S. The Automatic Weather Stations NOANN Network of the National Observatory of Athens: Operation and Database. Geosci. Data J. 2017, 4, 4–16. [Google Scholar] [CrossRef]
  30. Matzarakis, A.; Balafoutis, C. Heating Degree-Days over Greece as an Index of Energy Consumption. Int. J. Climatol. 2004, 24, 1817–1828. [Google Scholar] [CrossRef]
  31. Kotsiou, O.S.; Saharidis, G.K.D.; Kalantzis, G.; Fradelos, E.C.; Gourgoulianis, K.I. The Impact of the Lockdown Caused by the COVID-19 Pandemic on the Fine Particulate Matter (PM2.5) Air Pollution: The Greek Paradigm. IJERPH 2021, 18, 6748. [Google Scholar] [CrossRef] [PubMed]
  32. Bari, Md.A.; Baumbach, G.; Kuch, B.; Scheffknecht, G. Air Pollution in Residential Areas from Wood-Fired Heating. Aerosol Air Qual. Res. 2011, 11, 749–757. [Google Scholar] [CrossRef]
  33. Fameli, K.-M.; Papagiannaki, K.; Kotroni, V. Optimizing the Knowledge on Residential Heating Characteristics in Greece via Crowd-Sourcing Approach. Atmosphere 2021, 12, 1178. [Google Scholar] [CrossRef]
  34. Peshev, Z.; Deleva, A.; Vulkova, L.; Dreischuh, T. Large-Scale Saharan Dust Episode in April 2019: Study of Desert Aerosol Loads over Sofia, Bulgaria, Using Remote Sensing, In Situ, and Modeling Resources. Atmosphere 2022, 13, 981. [Google Scholar] [CrossRef]
  35. Kokkalis, P.; Soupiona, O.; Papanikolaou, C.-A.; Foskinis, R.; Mylonaki, M.; Solomos, S.; Vratolis, S.; Vasilatou, V.; Kralli, E.; Anagnou, D.; et al. Radiative Effect and Mixing Processes of a Long-Lasting Dust Event over Athens, Greece, during the COVID-19 Period. Atmosphere 2021, 12, 318. [Google Scholar] [CrossRef]
  36. Margaritis, N.; Rakopoulos, D.; Mylona, E.; Grammelis, P. Introduction of Renewable Energy Sources in the District Heating System of Greece. International Journal of Sustainable Energy Planning and Management 2015, 43-56 Pages. [CrossRef]
  37. Electra, E. P., Liana, A., & Araviadis, L. (2021). Social And Economic Dimensions Of District Heating: A Case Study. Economy & Business Journal, 15(1), 298-305.
  38. Hellenic Statistical Authority. Available online: https://www.statistics.gr/el/2021-census-res-pop-results (accessed on 11 July 2023).
Figure 1. Location of Stations (S) and Power Stations (PS) in Western Macedonia (Figure adopted by Evagelopoulos et al. (2022) [19]).
Preprints 79409 g001
Figure 2. Box-plots of PM2.5 concentrations for the years 2019, 2020, 2021 and 2022 for the AQMS S1, S2, S4, S5, S6, S7, S8, S9 and S10. The outliers in box-plots were excluded.
Preprints 79409 g002
Figure 3. Box-plots of PM10 concentrations for the years 2019, 2020, 2021 and 2022 for the AQMS S1, S2, S4, S5, S6, S7, S8, S9 and S10. The outliers in box-plots were excluded.
Preprints 79409 g003
Figure 4. (a) Mean monthly PM2.5 concentrations and (b) mean monthly PM10 concentrations for the years 2019, 2020, 2021 and 2022 at AQMS S1, S2, S4, S5, S6, S7, S8, S9 and S10.
Preprints 79409 g004
Figure 5. Daily mean PM2.5 concentrations for the AQMS S1, S2, S4, S5, S6, S7, S8, S9 and S10 for the period (a) from the 1st of February 2019 and the 1st of June 2019 and (b) from the 1st of January 2020 and the 1st of June 2020.
Preprints 79409 g005
Figure 6. Daily mean PM10 concentrations for the AQMS S1, S2, S4, S5, S6, S7, S8, S9 and S10 for the period (a) from the 1st of February 2019 and the 1st of June 2019 and (b) from the 1st of January 2020 and the 1st of June 2020.
Preprints 79409 g006
Figure 7. Monthly variations in PM2.5, PM10, SO2, NO2, NO, NOx concentrations (μg/m3) and Temperature (°C) for the AQMS (a) S6 and (b) S7 for the year of 2019 and 2020.
Preprints 79409 g007
Figure 8. Correlation between the air pollutants concentrations and meteorological parameters for the (a) AQMS S6 and (b) AQMS S7 for the year 2020.
Preprints 79409 g008
Table 1. Coordinates of Stations (S) and Power Stations (PS) in Western Macedonia (Table adopted by Evagelopoulos et al. (2022) [19]).
Name Location Latitude Longitude Altitude (m)
S1 Filotas 40,626056 21,707554 568
S2 Koilada 40,355725 21,930784 686
S3 Oikismos 40,485181 21,718224 673
S4 Petrana 40,290150 21,863800 614
S5 Komi 40,203969 21,843391 415
S6 Amyntaio 40,678970 21,681830 628
S7 Florina 40,782096 21,410366 659
S8 Vevi-Meliti 40,835500 21,586800 677
S9 Pontokomi 40,406530 21,768110 702
S10 Anargyroi 40,602222 21,610000 611
PS1 Agios Demetrios 40.393542 21.925377 680
PS2 Kardia 40.408991 21.786542 693
PS3 Ptolemaida 40.480864 21.727385 641
PS4 Amyntaio 40.618154 21.682730 665
Disclaimer/Publisher’s Note: The statements, opinions and data contained in all publications are solely those of the individual author(s) and contributor(s) and not of MDPI and/or the editor(s). MDPI and/or the editor(s) disclaim responsibility for any injury to people or property resulting from any ideas, methods, instructions or products referred to in the content.
Copyright: This open access article is published under a Creative Commons CC BY 4.0 license, which permit the free download, distribution, and reuse, provided that the author and preprint are cited in any reuse.
Prerpints.org logo

Preprints.org is a free preprint server supported by MDPI in Basel, Switzerland.

Subscribe

© 2024 MDPI (Basel, Switzerland) unless otherwise stated