Submitted:
12 July 2023
Posted:
13 July 2023
You are already at the latest version
Abstract
Alzheimer’s disease (AD) is the leading cause of dementia, characterised by beta-amyloid plaques, neurofibrillary tangles, and oxidative stress. Iron is suspected to enhance disease progression, and chelation may be a potential treatment. We propose that Aloysia citrodora Paláu (AC), a plant in the Verbenaceae family, can act as a moderate chelator of iron. It may reduce the effect of iron on beta-amyloid 1-42 (Aβ1-42) aggregation. Cyclic voltammetry (CV) and differential pulse voltammetry (DPV) were used to demonstrate that AC can interact with iron (II) and iron (III), the two most abundant forms of iron within the body. DPV was also used to characterise Aβ1-42 aggregation, and two main features were obtained. The first is the tyrosine peak (~0.6 V) decreased in magnitude over time, which is a sign of aggregation and folding. The other is a conglomerate of peaks at ~0 V, whose identity is unknown. Furthermore, iron (II) increased the rate of tyrosine peak depreciation, and the addition of AC negated this induced effect. This implied that iron (II) increases Aβ1-42 aggregation into higher order, and AC may be an effective countermeasure.
Keywords:
Beta-amyloid
; Aloysia Citrodora
; Cyclic Voltammetry
; Differential Pulse Voltammetry
1. Introduction
Iron possesses a pivotal role in Alzheimer’s disease (AD). Iron is absent in the brain at birth, and the brain-iron content correlates with age, even in healthy brains [1] Ramos et al. demonstrated that this correlation was most profound in the caudate nucleus, putamen and globus pallidus [2]. The same conclusion was reached by several other studies, including a study performed by McAllum et al., examining ten different regions of healthy post-mortem brains [3]. Iron overload was also found to be more severe in the dentate nucleus, caudate nucleus, and putamen in the brains of patients with mild cognitive impairment than in the corresponding regions in the healthy controls [4]. This indicates that iron overloading may be an early event in the pathology of PDD (Parkinsons with dementia) and AD, and contributes to cognitive decline symptoms. However, the brain-iron content in the red nucleus seems to be less in the AD patient relative to the healthy brain, suggesting that the pathology of AD is characterised by the dysregulation of iron rather than iron overloading alone [5].
Interestingly, the hallmarks of AD (beta-amyloid accumulation, neurofibrillary tangles [NFTs], and oxidative damage) all involve iron. Firstly, iron may increase NFT production. NFTs are the result of tau protein hyperphosphorylation and iron has been seen to colocalise with tau in NFTs [6], [7]. Ferric iron was shown to induce the aggregation of hyperphosphorylated tau and increased its tendency to form NFTs [8]. Electrochemical data also show that both ferrous, and ferric iron can bind to tau and the binding process causes structural changes to tau [9]. Iron can also indirectly interact with tau by increasing the activity of respective kinases which hyperphosphorylate tau and the eventual formation of NFTs [7].
Secondly, iron (mainly ferrous iron) can initiate the Fenton reaction, which generates reactive oxygen species (ROS). High level ROS production can subsequently lead to lipid peroxidation, and DNA and protein damage. Indeed, studies on the brains of AD patients revealed extensive oxidative damage to proteins, lipids, and nucleic acids [10,11].
Finally, iron can, directly and indirectly, influence beta-amyloid production and or aggregation. Beta-amyloid 1-42 (Aβ1-42) possesses amino acids that can act as ligand donors for iron, permitting interactions between the two species. It has been proposed that Aβ can bind to and stabilise iron via three histidine residues and one tyrosine residue, both found on the N-terminal of the peptide [12]. The actual redox state of iron that interacts with Aβ and the mode of interaction is still widely discussed, but it is reported that Aβ can bind to both ferric and ferrous iron [13,14]. In vitro, during the aggregation process, Aβ can bind to ferric iron stored in ferritin and reduce it into ferrous iron, which suggests that it possesses a higher affinity for ferric iron than ferritin [6,15]. The binding of Aβ to ferric iron can reduce ferric iron into the more reactive ferrous state and undergo the Fenton reaction to generate ROS [10].
Through electrochemical studies that tyrosine has been shown to be the primary residue that bound ferric iron [16]. Methionine (35th residue) contributed to reducing ferric iron whilst being oxidised itself. The histidine residues were deduced not to be directly involved in the binding of Aβ1-42 to ferric iron. On the other hand, ferrous iron has been speculated to bind to histidine residues, perhaps in conjunction with asparagine, glutamine, and or tyrosine [17]. In general, it is widely thought that the polar/charged N-terminal region of Aβ1-42 contains the metal-binding site whilst the hydrophobic C-terminal region contains the lipid-binding region [18].
Due to the relevance of iron in AD, many iron chelators have been developed in the past. These include desferrioxamine (DFO), deferasirox, and deferiprone, all approved by the food and drug administration (FDA) for iron-overload diseases [12]. Furthermore, there are ongoing clinical trials involving deferiprone, to determine whether it can delay dementia [19]. Other trials tested deferiprone’s effectiveness in treating early-stage Parkinson’s disease [20]. Overall, this signifies the important role of iron chelation in AD and other neurodegenerative diseases. However, the drugs listed above are all situationally effective in chelating iron, and have serious associated side effects that make them undesirable.
DFO, deferasirox, and deferiprone are all inspired by the siderophore (molecules that aid iron uptake for microorganisms) of the bacterial species Streptomyces pilosus [21]. DFO, approved the earliest (1968), is a hexadentate ligand that can bind iron in a 1:1 ratio; deferasirox is a tridentate ligand that binds iron in a 2:1 ratio; deferiprone is a bidentate ligand that binds iron in a 3:1 ratio [21]. As a hexadentate ligand, DFO binds ferric iron with high affinity, but it can only be administered via subcutaneous injections. It also possesses a short half-life which means regular intake is needed, causing the patient compliance rate to be very low [22]. It has shown promising results in inhibiting the β-sheet formation of Aβ1-42 as well as reducing iron-induced tau phosphorylation. However, the drug cannot cross the BBB easily, making its relevance in AD less significant [12,22]. Usage is also accompanied by severe side effects that include iron deficiency, systemic toxicity, and hypersensitivity of the skin [21,22]. Many other iron chelators and modifications are continually explored to increase efficacy and reduce toxicity and off-target effects. One of the issues associated with many chelators is that, like DFO, they possess a very high affinity for iron. Long-term usage can lead to iron deficiencies in the body. Fundamentally, the problem in AD is related to iron dysregulation as opposed to iron overload [5]. Chelation in brain regions where iron is already scarce can lead to many issues, one of which is oligodendrocytes not receiving sufficient iron needed to synthesise myelin.
We chose to explore the applications of Aloysia citrodora Paláu (AC), a plant in the Verbenaceae family, because this plant has been associated with antioxidant and iron-binding capabilities [23]. Iron chelation together with an antioxidant property has proven to be more effective in treating iron-induced aggregation of Aβ than iron chelation alone [24]. Based on this, we investigated further the binding characteristics between AC and iron (II)/(III). The effect of iron on Aβ aggregation and the effect of AC on iron-induced Aβ aggregation were also both explored. Iron (II) and iron (III) were investigated because iron can exist in many oxidation states, and it is unknown which oxidative state/s of iron are causing the symptoms. MRI is often used in the most current human experiments because it allows the brain-iron levels to be detected in vivo. However, it cannot distinguish different species of iron [3,12]. The most abundant forms of iron within the brain are ferrous iron (Fe (II)) and ferric iron (Fe (III)), with a concentration of up to 1 mM (variable depending on the region of the brain) [6,25].
In this work, we primarily use cyclic and differential pulse voltammetry to assess and confirm binding interactions between AC and iron (II)/(III). The changes in the structure of Aβ1-42, from a lower state to a higher oligomeric state, were also monitored using mainly differential pulse voltammetry.
2. Materials and Methods
2.1. Cyclic and differential pulse voltammetry
Experiments involving cyclic voltammetry (CV) and differential pulse voltammetry (DPV) used an electrochemical cell with three electrodes. The reference electrode used for all experiments was Ag/AgCl (3.5 M KCl), which acts as a pseudo-reference. Platinum flag electrode was used as the counter electrode (area of electrode surface was larger than the working electrode). The working electrode used was carbon-based; glassy carbon (MF-2012 from Alvatek, 3.0 mm surface area) was used for all experiments that did not involve Aβ1-42, and carbon paste electrode (MF-2010 from Alvatek, 2.87 mm surface area) was used for all experiments involving Aβ1-42. The reason for the use of different working electrodes was due to the tendency for Aβ1-42 to adhere to the surface. The carbon paste electrode can be cleaned effectively. All electrodes were cleansed via sonication in ethanol, followed by deionized water. Furthermore, the working electrode was cleaned using silica solution and emery paper.
Two types of electrochemical methods were used. One used the solution as the medium, where the analyte is freely diffusing within the medium. Solutions of appropriate concentrations and components were made and the working electrode used was the glassy carbon. The other method used was surface adsorption, where the sample Aβ1-42 was put onto the surface of the carbon paste electrode. The sample was given time to dry and then inserted into the solution to complete the electrochemical cell.
The following parameters were used for the CV and DPV experiments: equilibration time = 5 s (CV) and 10 s (DPV), starting potential = −0.2 V (CV and DPV), end potential = 1.0 V (CV and DPV), potential step = 0.005 V (CV and DPV), scan rate = 0.1 V/s (CV) and 0.005 V/s (DPV).
Any experiments with altered parameters with be highlighted.
2.2. Iron (II/III) chloride solutions
Iron (III) chloride (FeCl3, purity ≥ 99.99%, from Merck Life Science UK Ltd) was dissolved in Dulbecco’s phosphate buffered saline (DPBS, pH 7.0–7.3) to the required concentrations. Similarly, iron (II) chloride (FeCl2, purity 98%, from Merck Life Science UK Ltd) was dissolved to the appropriate concentrations for experiments that required it.
2.3. Aloysia citrodora water extract: LC-MS analysis
Aloysia citrodora aerial parts (leaves and stems) were collected from the Living Collection at the Royal Botanic Gardens Kew in September 2017. The fresh plant material (reference 2014-527) was freeze-dried and 400 g was extracted in ethanol at room temperature for 24 hours, prior to filtration. The filtered extract was dried using a rotary evaporator prior to partition of 10 g extract between butanol and water. The two phases were separated and dried using a rotary evaporator (butanol fraction) or by freeze-drying (water fraction); the latter is designated as AC hereafter. AC was reconstituted in 100% water prior to centrifugation and LC-MS analysis of the supernatant. Analysis was performed on a Thermo Scientific system consisting of an ‘Accela’ U-HPLC unit with a photodiode array detector and an ‘LTQ Orbitrap XL’ mass spectrometer fitted with an electrospray source (Thermo Scientific, Waltham, MA, USA). Chromatography was performed with a 5 µL sample injection onto a 150 mm x 3 mm, 3 µm Luna C-18 column (Phenomenex, Torrance, CA, USA) using the following 400 µL/min mobile phase gradient of CH3OH/H2O/CH3CN + 1% HCOOH: 0:90:10 (0 min), 90:0:10 (20 min), 90:0:10 (30 min); 0:90:10 (32 min), 0:90:10 (35 min). The ESI source was operated with polarity switching and the mass spectrometer was set to record high resolution (30 k resolution) MS1 spectra (m/z 125–2000) in positive mode using the orbitrap and low resolution MS1 spectra (m/z 125–2000) in negative mode and data dependent MS2 and MS3 spectra in both modes using the linear ion trap. Detected compounds were assigned by comparison of accurate mass data (based on ppm), and by available MS/MS data, with reference to the published compound assignment system and with supportive UV spectra [26]. Prior to assay, the AC extract was weighed and dissolved in DPBS to a stock of 10 mg/mL, from which dilutions were made.
2.4. Differential pulse voltammetry of Aβ1-42
Lyophilized Aβ1-42 (human, 1 mg, lyophilised powder, purity > 95%, from Discovery peptides) was dissolved in deionized water to a stock concentration of 250 µM. The stock was diluted to 50 and 100 µM, and the samples were stored at -20 °C. Before use, the stock was sonicated for 40 minutes at 36–42 °C to break up preformed aggregates. 40 µL of the sample (50 µM or 100 µM) was added onto the surface of the carbon paste electrode. The time allowed for adsorption was 10 minutes. The carbon paste electrode was then added to the beaker to complete the electrochemical cell. The solution (consisting of either buffer, AC, ferrous iron, ferric iron, or a combination of them) used varied depending on the experiment, to test the effect of iron and or AC had on Aβ1-42 aggregation. The temperature of the solutions tested was maintained at 37 °C, and DPV was performed in 30-minute intervals for 300 minutes.
3. Results
This section may be divided by subheadings. It should provide a concise and precise description of the experimental results, their interpretation, as well as the experimental conclusions that can be drawn.
3.1. AC composition
Compounds detected in AC by LC-MS analysis are presented in Table 1 and from their observed [M+H]+ ions, include those assigned as the phenylethanoid glycosides verbascoside and acetylverbascoside, and derivatives of the flavones luteolin and apigenin.
3.2. AC as an iron chelator
CV and DPV experiments show that AC has a distinct oxidative current peak at ∼0.2 V. The peak size is concentration-dependent; a decrease in peak amplitude signifies a decrease in concentration. This phenomenon is consistent with the Randles-Sevcik equation.
3.3. AC with iron (III)
Ferric iron was then introduced to the solution so that the relative concentration (in mg/mL) ratios between ferric iron and AC ranged from 1:1 to 10:1. The AC peak decreased in size as the ratio of iron to AC increased. This is indicative of AC interacting with ferric iron. We propose that the interaction between AC and iron caused the AC concentration to decrease, thereby decreasing the peak current size (ipC0).
Further, the increase in the ferric iron:AC ratio led to the eventual shift in peak position. One plausible explanation for this is related to the Linganes-derived equation, where is the difference between the half potential of the metal and the complex; R is the universal gas constant; T is the absolute temperature; Kd is the dissociation constant of the metal-ligand complex; n is the number of electrons transferred; F is the Faraday constant; [X] is the concentration of the ligand X; p is the coordination number of the complex [31]. This equation suggests that the shift in half-potential is due to the complexation between AC and ferric iron.
Linganes-derived equation:
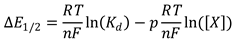
Figure 1.
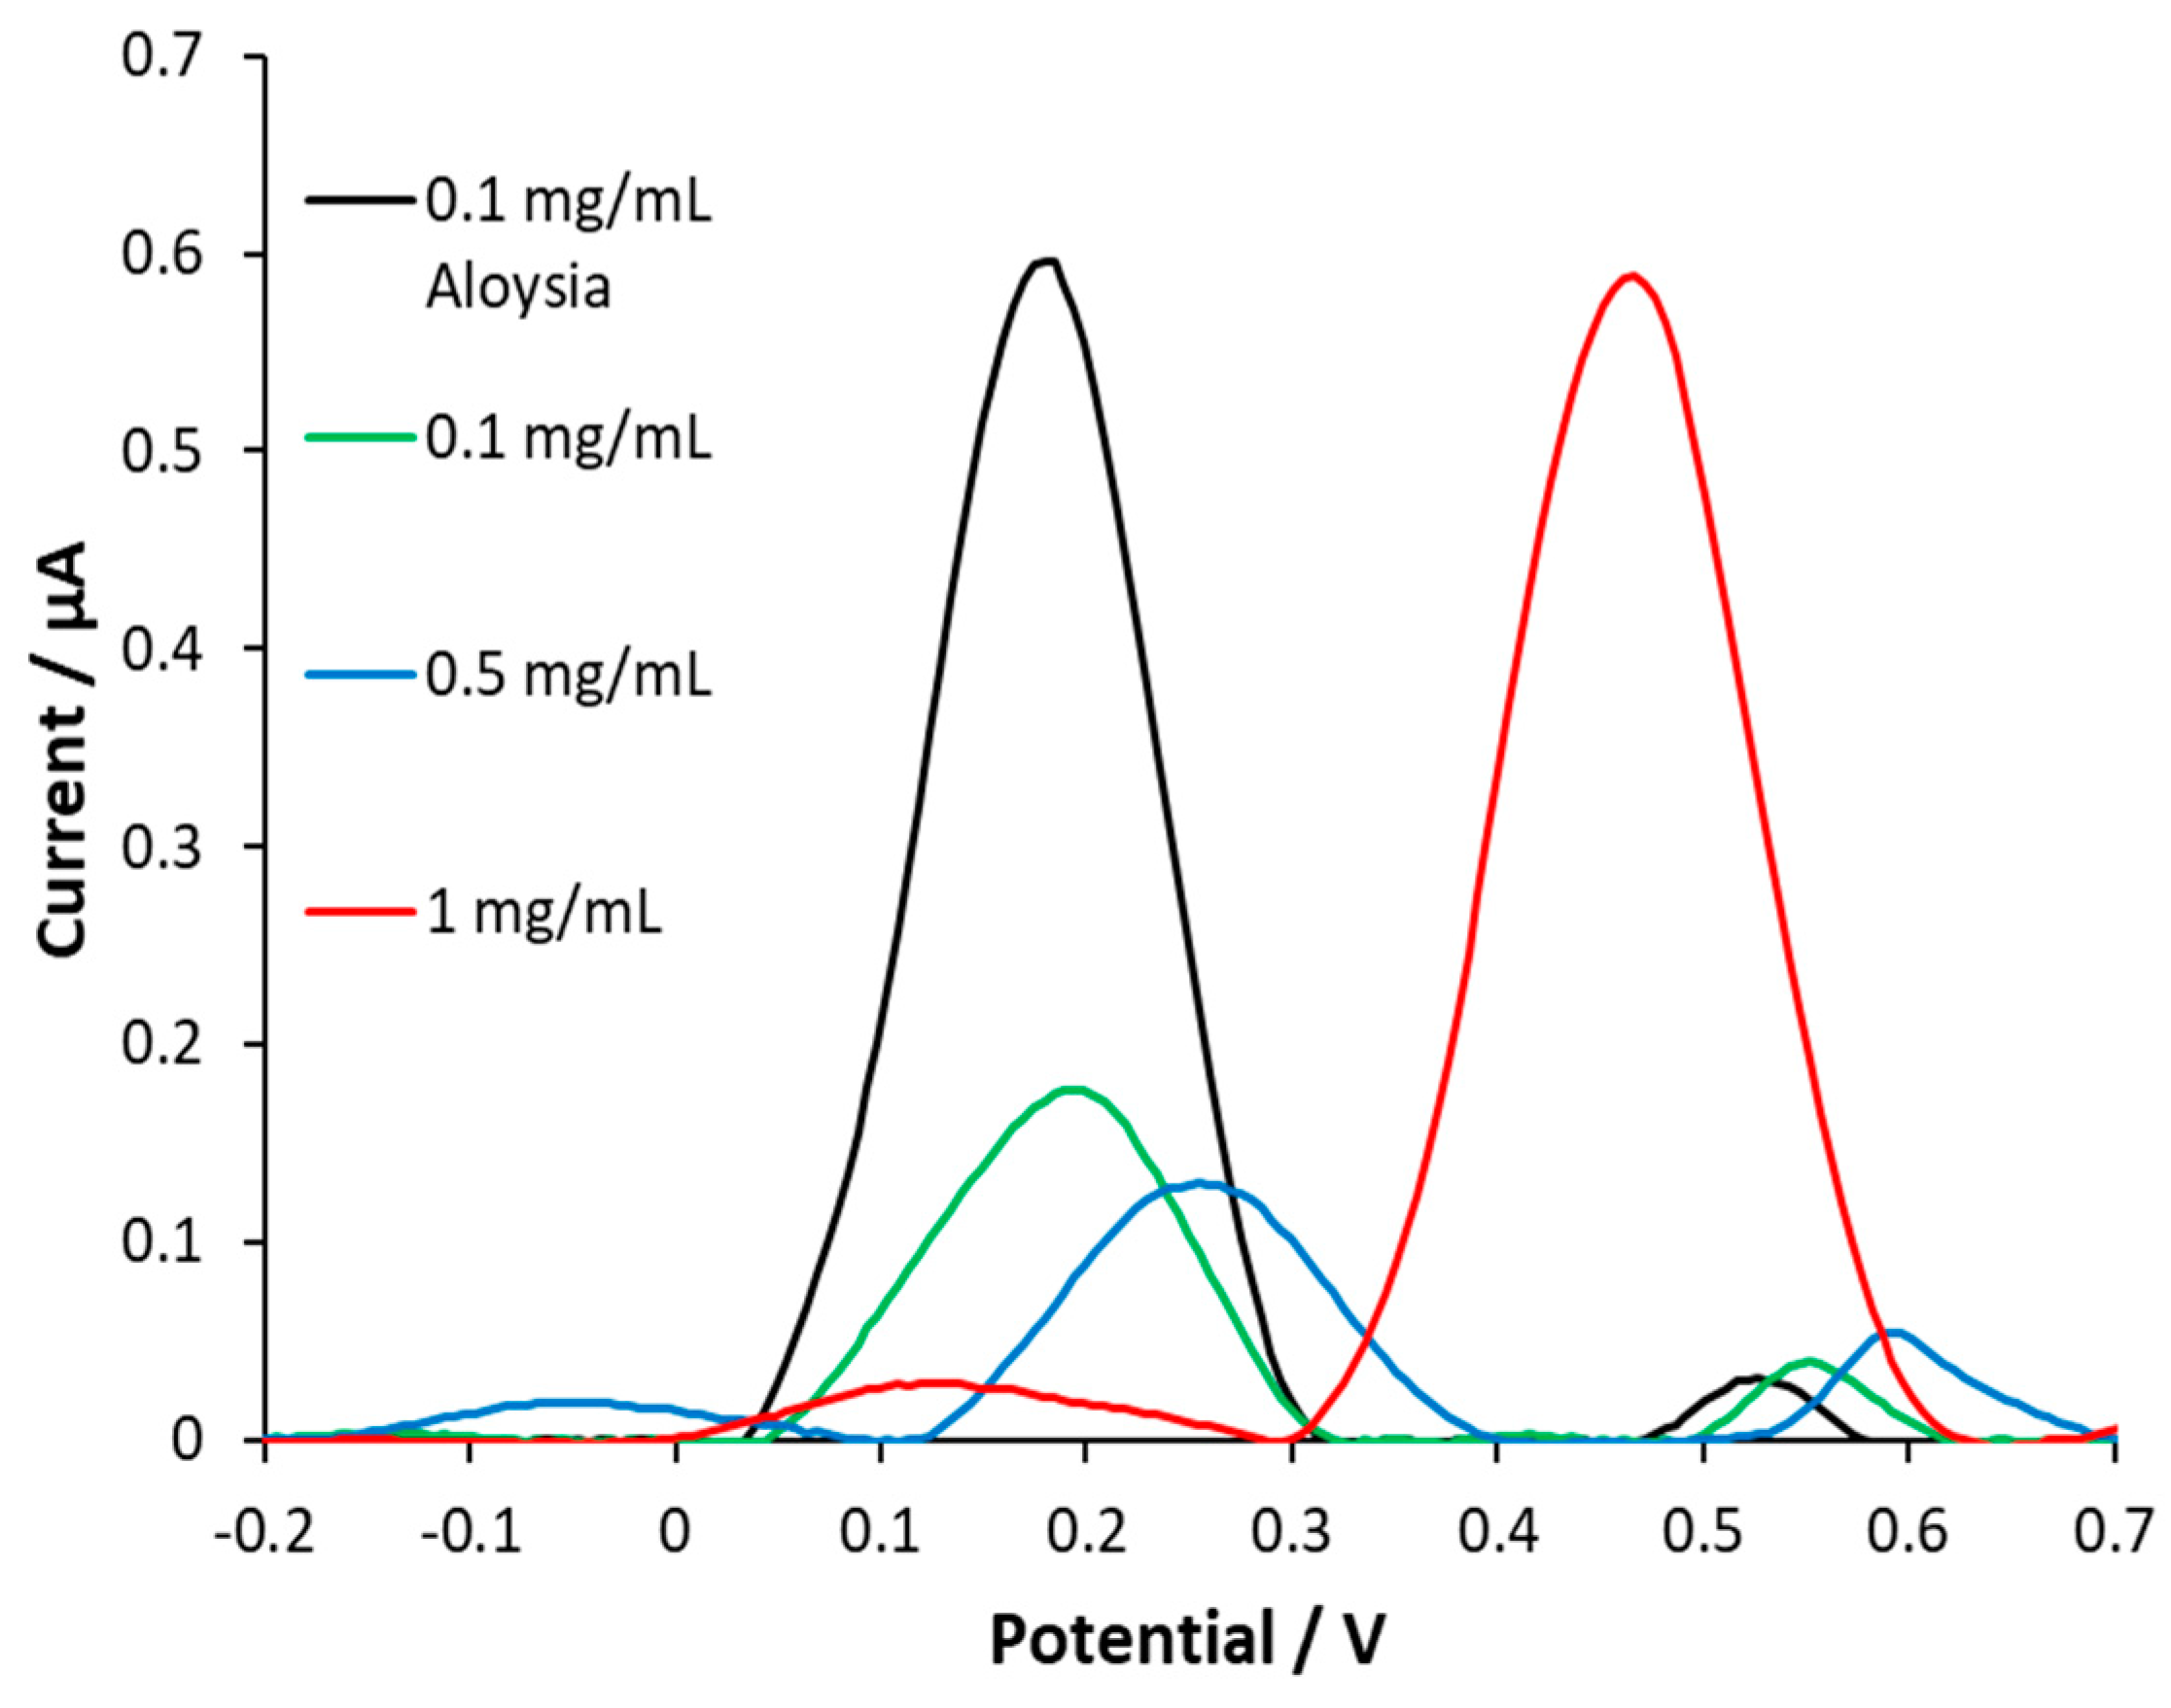
Investigation of the effect of ferric iron on the electrochemical properties of Aloysia citrodora (AC). Differential pulse voltammetry was performed on a range of samples that all contained a concentration of 0.1 mg/mL AC, but the ferric iron concentration was varied across the samples, from 0–1 mg/mL in 0.1 mg/mL increments (the concentration of ferric iron is indicated by the figure legends). The graph of 0.1 mg/mL AC shows the DPV of AC alone, without any ferric iron. The current peak intensity of the AC (~0.2 V) was observed to decrease when the ferric concentration in the solution increased, implicating binding between AC and ferric iron, which decreased the concentration of the AC. A peak potential shift was also observed when the ratio of ferric to AC increased, which occurs due to complexation (predicted by the Linganes-derived equation).
Figure 1.
Investigation of the effect of ferric iron on the electrochemical properties of Aloysia citrodora (AC). Differential pulse voltammetry was performed on a range of samples that all contained a concentration of 0.1 mg/mL AC, but the ferric iron concentration was varied across the samples, from 0–1 mg/mL in 0.1 mg/mL increments (the concentration of ferric iron is indicated by the figure legends). The graph of 0.1 mg/mL AC shows the DPV of AC alone, without any ferric iron. The current peak intensity of the AC (~0.2 V) was observed to decrease when the ferric concentration in the solution increased, implicating binding between AC and ferric iron, which decreased the concentration of the AC. A peak potential shift was also observed when the ratio of ferric to AC increased, which occurs due to complexation (predicted by the Linganes-derived equation).
3.4. AC with iron(II)
Similarly, ferrous iron was mixed with AC in DPBS. Likewise, the AC current peak decreased when the ferrous:AC ratio increased. Further ratio increase led to peak shift.
Figure 2.
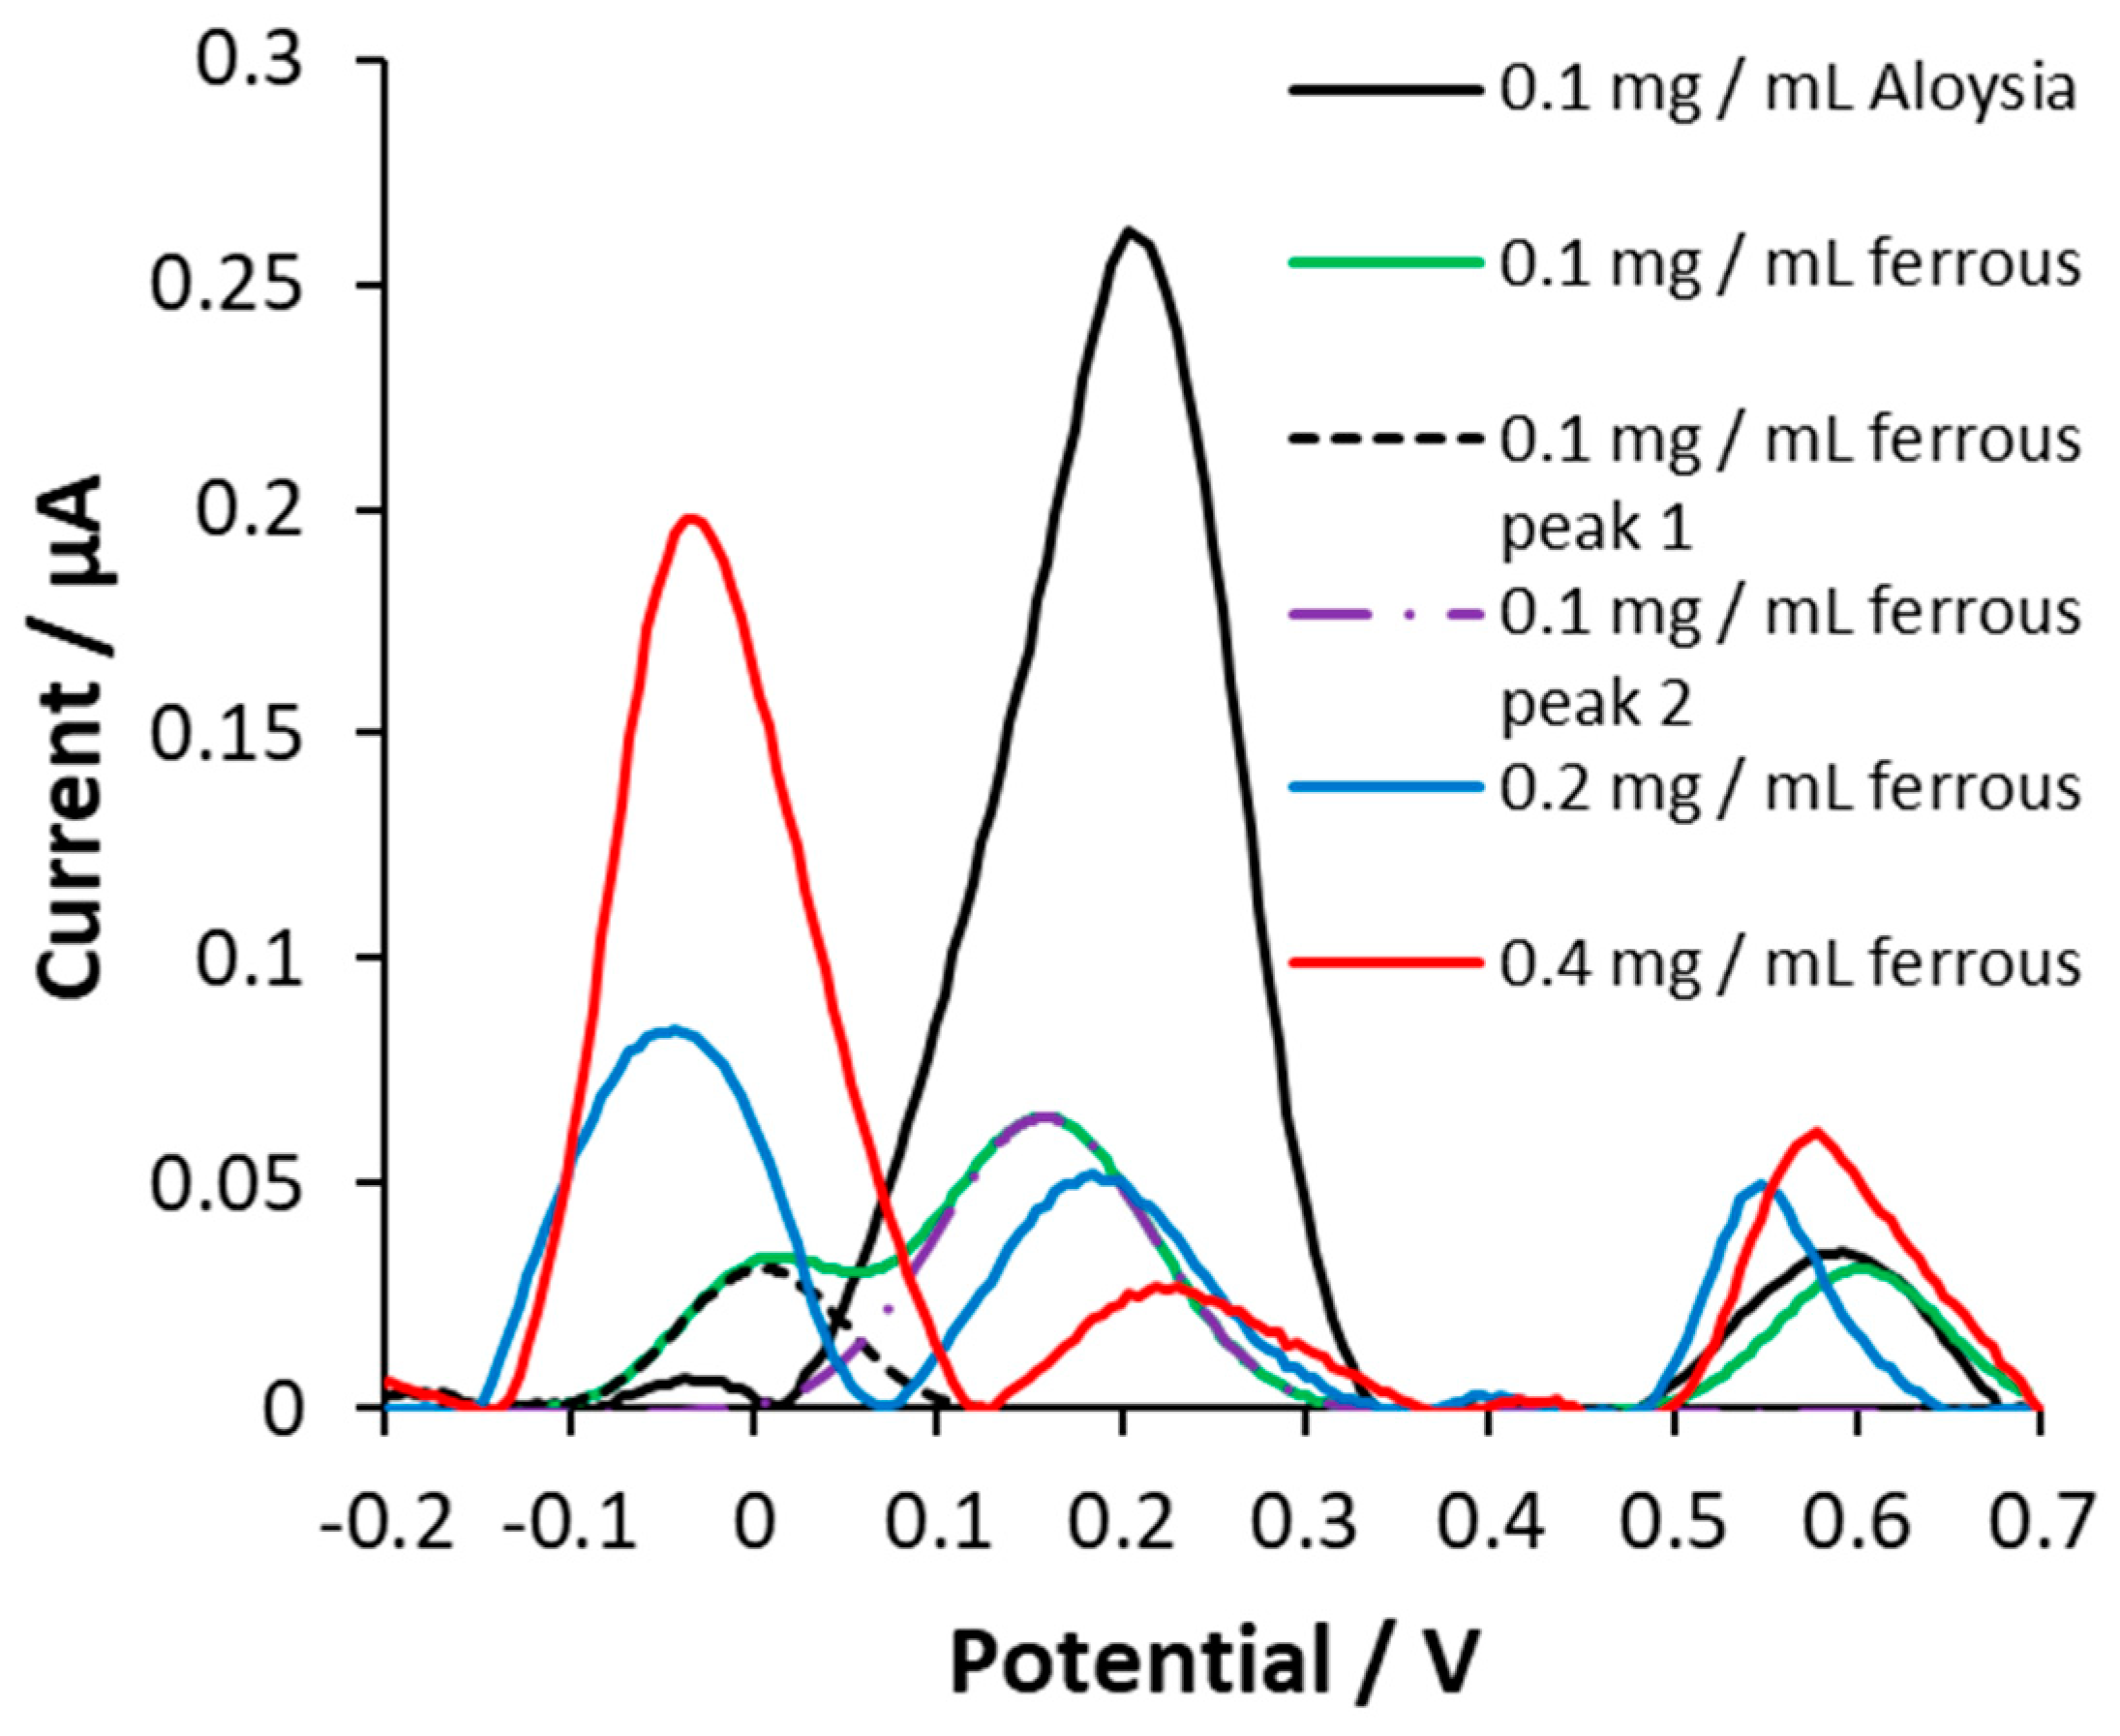
Aloysia citrodora (AC) concentration decreased when ferrous iron was added, in a concentration-dependent manner. Differential pulse voltammetry was performed on a range of samples that all contained a concentration of 0.1 mg/mL AC, but the ferrous iron concentration was varied across the samples, from 0–1 mg/mL in 0.1 mg/mL increments (the concentration of ferric iron is indicated by the figure legends). The graph of 0.1 mg/mL AC shows the DPV of AC alone, without any ferrous iron. The current peak intensity of the water-distilled AC (~0.2 V) was observed to decrease when the ferrous concentration in the solution increased, implicating binding between the water distilled AC and ferrous iron which decreased the concentration of water-distilled AC. A peak potential shift was also observed when the ratio of ferrous to water-distilled AC increased, which occurs due to complexation (predicted by the Linganes-derived equation).
Figure 2.
Aloysia citrodora (AC) concentration decreased when ferrous iron was added, in a concentration-dependent manner. Differential pulse voltammetry was performed on a range of samples that all contained a concentration of 0.1 mg/mL AC, but the ferrous iron concentration was varied across the samples, from 0–1 mg/mL in 0.1 mg/mL increments (the concentration of ferric iron is indicated by the figure legends). The graph of 0.1 mg/mL AC shows the DPV of AC alone, without any ferrous iron. The current peak intensity of the water-distilled AC (~0.2 V) was observed to decrease when the ferrous concentration in the solution increased, implicating binding between the water distilled AC and ferrous iron which decreased the concentration of water-distilled AC. A peak potential shift was also observed when the ratio of ferrous to water-distilled AC increased, which occurs due to complexation (predicted by the Linganes-derived equation).
3.5. Monitoring Aβ1-42 aggregation using DPV
Differential pulse voltammetry of Aβ1-42 was performed using the method listed, with DPBS as the buffer solution. The resultant differential pulse voltammogram is shown in Figure 3.
The peak at ~0.65 V is the tyrosine peak. This was confirmed by conducting CV and DPV experiments on the amino acid L-tyrosine; the peak region for tyrosine was identical. Multiple studies also verify that tyrosine is located around 0.6–0.7 V region [32,33,34].
There are likely multiple peaks in the −0.1–0.1 V region disguised as only one peak. Peak separation was seen at 300 minutes. Histidine and methionine are the only electroactive amino acid residues present on the Aβ1-42 peptides. L-histidine and L-methionine were dissolved in DPBS, and CV and DPV were performed. The resultant voltammograms did not yield any peaks in the −0.2–1.2 V potential window. However, reports indicate that the 35th zwitterionic methionine residue of beta-amyloid possesses an oxidation potential of −0.057 V (versus Ag/AgCl reference) [35].
3.6. AC potentially ameliorates Aβ aggregation induced by iron (II)
Differential pulse voltammetry of Aβ1-42 was performed using the method listed. The solution in the electrochemical cell for which each experiment was carried out differed. The composition of the solutions used are as follows: 1. DPBS buffer; 2. iron (II) in DPBS (50 µM); 3. iron (II) in DPBS (100 µM); 4. iron (II) and AC in DPBS (50 µM and 0.001 mg/mL respectively). The resultant differential pulse voltammograms were compared and the rate of the tyrosine peak decreased was compared (Figure 4). The size of the peaks was normalised and plotted against time. This revealed that iron (II) exacerbated the decline in tyrosine peak rate. The addition of AC seemingly mitigates this iron (II)-induced effect.
4. Discussion
4.1. AC can bind to ferrous and ferric iron
The CV and DPV of AC with both forms of iron (iron (II) and iron (III)) indicate an interaction between AC and iron. The addition of iron to the solution lowers the current peak of AC. The Randles-Sevcik equation interprets this as the concentration of AC in the bulk solution has decreased, likely due to iron interacting with AC. Peak shifts were also seen when excess iron was added to the AC solution. The shift in peak position may be due to the complexation between iron and AC. This relationship is expressed via the Linganes-derived equation [31]. Further, CV experiments were done, varying only the scan rate. The resultant peak shift is proportional to the scan rate, which may be a result of surface adsorption or electrochemical quasi-reversibility.
Potentiometric titration was also performed. The resultant curves were analysed using the Gran method to determine an approximate pKa between AC and iron (Figure 5) [36]. The pKa for AC and iron (II) was 0.799, and the pK a for AC and iron (III) was 1.056. These values suggest a relatively moderate binding affinity between AC and iron. The moderate binding may alleviate issues concerning excess chelation, and the problems associated with it.
The binding of AC to iron was expected as it contains many phenolic compounds that are known to bind iron. In particular, the functional groups of luteolin- and apigenin-derivatives, as well as verbascoside have demonstrated iron-binding capabilities (Figure 6) [23,37,38]. The catechol moiety of luteolin and verbascoside (red aromatic structures from Figure 5) have been shown to bind iron and are theorised to be the most prolific iron-binding sites [37]. Aside from that, the hydroxyl group highlighted in red also makes contributions toward the binding of iron [37]. Computational studies have shown that some of the other oxygen-containing sites may also facilitate iron-binding, but the contributions are dependent on the electronic and steric interactions [39]. The phenolic groups on these molecules are also great quenchers of radicals and can offer protection against ROS-mediated damage [40].
It is uncertain which of these chemical components is responsible for iron chelation in this study, although catechol groups are known chelating sites, indicating that compounds assigned as verbascoside, acetylverbascoside, luteloin 7-diglucuronide and di-O-galloylcrenatin in AC could have contributed to the observed chelation [41]. Furthermore, these components could also have a combinatorial effect. Determining the active species to improve efficacy and reduce potential toxicity should be considered. In addition, in a clinical context, the bioavailability and pharmacokinetics of the AC constituents, and whether AC constituents or their metabolites can cross the blood-brain barrier should also be considered. For example, flavonoids may undergo metabolism after oral ingestion, while certain phenylethanoid glycosides are reported to permeate the intestinal epithelial membrane to some extent, or be hydrolysed by gastrointestinal tract enzymes; although of particular relevance is that both compound classes, or their metabolites, may mediate effects on the central nervous after ingestion [42,43].
Elucidation into the binding mechanisms and constants should be emphasised as a holistic understanding will allow predictions on whether AC can effectively bind iron in a physiological context. There should also be a comprehensive study on AC and other transition metals. Whilst chelation of other metals can have serendipitous effects in the context of Alzheimer’s disease, it is essential that there is some specificity of chelation so off-target effects can be prevented.
4.2. Electrochemical changes in the Aβ1-42 structure
The next focus was to determine whether AC had any effects on some of the hallmarks of AD. Aβ1-42 was chosen to be the subject, for two main reasons.
Firstly, Aβ1-42 possesses amino acids that can undergo reduction-oxidation reactions (namely, tyrosine, histidine, and methionine) within our potential window. This makes changes regarding the Aβ1-42 easy to monitor using electrochemical methods. Secondly, despite the recent controversies on the amyloid hypothesis, Aβ1-42 is still relevant in the context of AD. Aβ1-42 may not hold as significant importance as tauopathy-related symptoms, but there is unexplained correlation between Aβ accumulation and AD. Especially, recent findings suggest that the small oligomeric Aβ1-42 structures are more toxic than the plaques that would be found in later stages [44,45]. Oligomers have high surface hydrophobicity, which allows them to interact with lipids and cholesterol [46,47]. This interaction aggregates Aβ and perhaps disrupts normal membrane function. The interaction between Aβ and lipid membrane is also suggested to generate reactive oxygen species (ROS), which can react with nearby biomolecules and causes damage [48]. Abuhamdah et al. showed that AC essential oil can protect against peroxide induced POS production [23]. Our extract is more refined and simpler in composition. We also wanted to compare whether our extract, AC, had similar effects to the chemically distinct iron-chelating Aloysia Citrodora essential oil (composed primarily of mono-and sesqui- terpenoids), to expand the understanding of the active chemical constituents of this plant species [23].
We tried to monomerise the Aβ samples to determine whether the AC extract can slow or disrupt oligomerisation. The experiments were also conducted at 37 °C to mimic physiological conditions. The aggregation and or oligomerisation of Aβ1-42 was monitored using DPV, for 300 minutes. Oxidation peaks were seen primarily in two regions, −0.1 V –0.1 V and ~0.6 V. Aβ1-42 only contains 5 electroactive amino acids (tyrosine-10, methionine-35, histidine-6, histidine-13, and histidine-14) [49]. The peak at ~0.65 V is the tyrosine peak [32,33,34]. This was also confirmed by conducting CV and DPV experiments on the amino acid L-tyrosine; the peak region for tyrosine was identical. There are likely multiple peaks in the −0.1–0.1 V region overlapped as only one peak. Peak separation was seen within 300 minutes. Histidine and methionine are the only other electroactive amino acid residues present on the Aβ1-42 peptides. Experiments were initiated to confirm whether these peaks were histidine or methionine; L-histidine and L-methionine were dissolved in DPBS, and CV and DPV were performed. The resultant voltammograms did not yield any peaks in the −0.2–1.2 V potential window. However, some reports indicate that the 35th zwitterionic methionine residue of beta-amyloid possesses an oxidation potential of −0.057 V (versus Ag/AgCl reference) [35]. Further, the preparation for the CV and DPV of L-histidine and L-methionine was acheived by dissolving them using DPBS. This meant that it was a mass transport process, whereas the beta-amyloid experiment was a surface-adsorption process, which may account for the difference in peak current position.
In general, the trend observed was that the tyrosine peak depreciated in intensity as time proceeded. The decrease in intensity is due to a decrease in the apparent concentration of tyrosine, as the current is proportional to the concentration of the species (Randles-Sevcik equation). As the Aβ peptide folded and aggregated, the tyrosine residue became increasingly shielded from the electrode surface by other amino acid residues, resulting in an ineffective contribution to the oxidation current [32]. The rate at which the tyrosine peak depreciates in intensity has been known to indicate the rate at which the Aβ folds; a swifter decrease equates to more aggregation [32,33,50]. On the contrary, the peaks in the region −0.1 V to 0.1 V increased in size over time, until eventual separation, though the significance of this observation is not currently known.
4.3. Iron can induce changes in Aβ1-42 aggregation and AC can offer potential mitigation
Aβ1-42 aggregation in the presence of various solutions (37 °C, pH ~7) was monitored and compared using DPV via the proxy of tyrosine peak decline (Figure 4). The rate of aggregation was increased in the presence of iron (II). Interestingly, the addition of AC slowed the rate of aggregation caused by iron (II). This suggests that AC may possess a role in delaying aggregation and oligomerisation of Aβ1-42 monomers in vivo. However, this phenomenon was not seen with iron (III). There weren’t any comprehensible patterns to the tyrosine peak when iron (III) was added (Supplementary Data). This implies that iron (III) does not affect the aggregation rate of Aβ1-42. However, there was a noticeable difference between Aβ1-42 in the presence and absence of iron (III). In the presence of iron (III), the peaks (in the −0.1–0.1 V region) separate much earlier.
This could represent a shift in Aβ structure to a higher order as kinetic analysis using surface plasmon resonance revealed that the rate of aggregation of Aβ was much higher in the presence of iron [51]. Further, the fact that the addition of AC prevented the early separation event should be considered, as the peak separation is a certain event. Although it is uncertain as to what the peaks in the −0.1 V to 0.1 V region could represent, we speculate that it is due to the change in the environment of the electroactive amino acids within Aβ1-42 . When DPV readings of Aβ1-42 were taken over days, it was observed that the peaks all shifted position and intensity. This could indicate the change in the relative positions of the amino acids as the beta-amyloid aggregated.
Another possibility is that the peak separation occurred as a result of oxidation of the amino acid/s. For example, di-tyrosine has been observed in the presence of oxidation [52]. Ferric iron may have increased the formation of the oxidised forms of the amino acids indirectly by generating ROS, which may be the reason for the earlier peak split. This is plausible as the addition of AC seemed to prevent the early separation. As AC is an antioxidant, perhaps it scavenged the oxidative radicals induced by iron (III). However, the precise role of AC and iron in Aβ1-42 aggregation cannot be deciphered by CV and DPV alone. Other experiments should be used in conjunction (for example, atomic force microscopy for visual information, circular dichroism for structural information, and Western blot for aggregation status on Aβ in cellular studies) to cross-validate.
5. Conclusions
Iron regulation is essential in brain homeostasis. Dysregulation of iron within the brain is often associated with neurodegenerative diseases. Brain regions where iron is lacking cannot operate normally as there are many iron-dependent processes. On the contrary, areas with excess iron can lead to tauopathy, ROS production, and beta-amyloid accumulation, amongst other issues. A delicate balance of brain iron content is therefore essential. We investigated an extract of AC and established that it is a moderate chelator. The moderate affinity between AC and iron means that it shouldn’t chelate iron excessively. It was also determined that iron (II) can accelerate the aggregation of beta-amyloid. The addition of the AC extract mitigated this induced effect, likely due to the chelation and antioxidation capabilities. Iron (III) also exerts an effect on Aβ1-42 aggregation during the early stages. However, it is not certain what the precise effect or mechanism is. Nonetheless, the effects induced by iron (III) seemed to subside when AC is present, signifying the role of AC. This preliminary study highlights AC as a potential iron chelator, as well as an antioxidant, that may hold value in the context of AD and PDD. It also highlights the usefulness of electrochemical techniques in monitoring changes in electroactive biological/chemical species.
6. Patents
There are n petents relating to this study.
Supplementary Materials
The following supporting information can be downloaded at the website of this paper posted on Preprints.org., Figure S1: title; Table S1: title; Video S1: title.
Acknowledgments
We gratefully acknowledge financial contribution towards this study by Make Me Better. We also thank Robin Battison for preparing the Aloysia citrodora extract studied.
References
- Drayer, B.; Burger, P.; Darwin’, R.; Riederer’, S.; Herfkens’, R.; Johnson’, G.A. Magnetic Resonance Imaging of Brain Iron. American Journal of Neuroradiology, 1986, 7, 373–380. [Google Scholar]
- Ramos, P.; Santos, A.; Pinto, N.R.; Mendes, R.; Magalhães, T.; Almeida, A. Iron levels in the human brain: A post-mortem study of anatomical region differences and age-related changes. J. Trace Elements Med. Biol. 2014, 28, 13–17. [Google Scholar] [CrossRef] [PubMed]
- McAllum, E.J.; Hare, D.J.; Volitakis, I.; McLean, C.A.; Bush, A.I.; Finkelstein, D.I.; Roberts, B.R. Regional iron distribution and soluble ferroprotein profiles in the healthy human brain. Prog. Neurobiol. 2020, 186, 101744. [Google Scholar] [CrossRef] [PubMed]
- Gao, L.; Jiang, Z.; Cai, Z.; Cai, M.; Zhang, Q.; Ma, Y.; Li, G.; Zhao, F.; Ma, Q. Brain iron deposition analysis using susceptibility weighted imaging and its association with body iron level in patients with mild cognitive impairment. Mol. Med. Rep. 2017, 16, 8209–8215. [Google Scholar] [CrossRef] [PubMed]
- Du, L.; Zhao, Z.; Cui, A.; Zhu, Y.; Zhang, L.; Liu, J.; Shi, S.; Fu, C.; Han, X.; Gao, W.; et al. Increased Iron Deposition on Brain Quantitative Susceptibility Mapping Correlates with Decreased Cognitive Function in Alzheimer’s Disease. ACS Chem. Neurosci. 2018, 9, 1849–1857. [Google Scholar] [CrossRef] [PubMed]
- Gleason, A.; Bush, A.I. Iron and Ferroptosis as Therapeutic Targets in Alzheimer’s Disease. Neurotherapeutics 2021, 18, 252–264. [Google Scholar] [CrossRef]
- Rao, S.S.; Adlard, P.A. Untangling Tau and Iron: Exploring the Interaction Between Iron and Tau in Neurodegeneration. Front. Mol. Neurosci. 2018, 11, 276. [Google Scholar] [CrossRef]
- Yamamoto, A.; Shin, R.-W.; Hasegawa, K.; Naiki, H.; Sato, H.; Yoshimasu, F.; Kitamoto, T. Iron (III) induces aggregation of hyperphosphorylated τ and its reduction to iron (II) reverses the aggregation: implications in the formation of neurofibrillary tangles of Alzheimer’s disease. J. Neurochem. 2002, 82, 1137–1147. [Google Scholar] [CrossRef]
- Ahmadi, S.; Ebralidze, I.I.; She, Z.; Kraatz, H.-B. Electrochemical studies of tau protein-iron interactions—Potential implications for Alzheimer’s Disease. Electrochimica Acta 2017, 236, 384–393. [Google Scholar] [CrossRef]
- Maynard, C.J.; Bush, A.I.; Masters, C.L.; Cappai, R.; Li, Q.-X. Metals and amyloid-β in Alzheimer’s disease. Int. J. Exp. Pathol. 2005, 86, 147–159. [Google Scholar] [CrossRef]
- Everett, J.; Brooks, J.; Collingwood, J.F.; Telling, N.D. Nanoscale chemical speciation of β-amyloid/iron aggregates using soft X-ray spectromicroscopy. Inorg. Chem. Front. 2021, 8, 1439–1448. [Google Scholar] [CrossRef]
- Liu, J.-L.; Fan, Y.-G.; Yang, Z.-S.; Wang, Z.-Y.; Guo, C. Iron and Alzheimer’s Disease: From Pathogenesis to Therapeutic Implications. Front. Neurosci. 2018, 12, 632. [Google Scholar] [CrossRef]
- Everett, J.; Céspedes, E.; Shelford, L.R.; Exley, C.; Collingwood, J.F.; Dobson, J.; van der Laan, G.; Jenkins, C.A.; Arenholz, E.; Telling, N.D. Ferrous iron formation following the co-aggregation of ferric iron and the Alzheimer’s disease peptide β-amyloid (1–42). J. R. Soc. Interface 2014, 11, 20140165. [Google Scholar] [CrossRef]
- Bousejra-ElGarah, F.; Bijani, C.; Coppel, Y.; Faller, P.; Hureau, C. Iron(II) Binding to Amyloid-β, the Alzheimer’s Peptide. Inorg. Chem. 2011, 50, 9024–9030. [Google Scholar] [CrossRef]
- Balejcikova, L.; Siposova, K.; Kopcansky, P.; Safarik, I. Fe(II) formation after interaction of the amyloid β-peptide with iron-storage protein ferritin. J. Biol. Phys. 2018, 44, 237–243. [Google Scholar] [CrossRef]
- Zhang, G.; Huo, Z.; Zhou, Y.; Zhu, X.; Wang, H.; Liang, Y.; Xu, M. Electrochemical Monitoring of Reduction and Binding of Iron Amyloid-β Complexes at Boron-Doped Diamond Electrode. Int. J. Electrochem. Sci. 2012, 7, 10027–10037. [Google Scholar] [CrossRef]
- Wärmländer, S.K.T.S.; Österlund, N.; Wallin, C.; Wu, J.; Luo, J.; Tiiman, A.; Jarvet, J.; Gräslund, A. Metal binding to the amyloid-β peptides in the presence of biomembranes: potential mechanisms of cell toxicity. JBIC J. Biol. Inorg. Chem. 2019, 24, 1189–1196. [Google Scholar] [CrossRef]
- Srivastava, A.K.; Pittman, J.M.; Zerweck, J.; Venkata, B.S.; Moore, P.C.; Sachleben, J.R.; Meredith, S.C. β-Amyloid aggregation and heterogeneous nucleation. Protein Sci. 2019, 28, 1567–1581. [Google Scholar] [CrossRef] [PubMed]
- Deferiprone to Delay Dementia (The 3D Study) - Full Text View - ClinicalTrials.gov. (n.d.). Retrieved , from. 30 January. Available online: https://clinicaltrials.gov/ct2/show/NCT03234686?term=deferiprone&draw=2&rank=4.
- Study of Parkinson’s Early Stage With Deferiprone - Full Text View - ClinicalTrials.gov. (n.d.). Retrieved , from. 30 January. Available online: https://clinicaltrials.gov/ct2/show/NCT02728843?term=deferiprone&draw=3&rank=19.
- Raines, D.; Sanderson, T.; Wilde, E.; Duhme-Klair, A.-K. Siderophores. Reference Module in 89 Chemistry, Molecular Sciences and Chemical Engineering. 2015. Available online: https://doi.org/10.1016/b978-0-12-409547-2.11040-6. [CrossRef]
- Farr, A. C.; Xiong, M. P. Challenges and Opportunities of Deferoxamine Delivery for Treatment of Alzheimer’s Disease, Parkinson’s Disease, and Intracerebral Hemorrhage. Molecular Pharmaceutics 2021, 18, 593–609. [Google Scholar] [CrossRef] [PubMed]
- Abuhamdah, S.; Abuhamdah, R.; Howes, M.-J.R.; Al-Olimat, S.; Ennaceur, A.; Chazot, P.L. Pharmacological and neuroprotective profile of an essential oil derived from leaves of A loysia citrodora Palau. J. Pharm. Pharmacol. 2015, 67, 1306–1315. [Google Scholar] [CrossRef] [PubMed]
- Sripetchwandee, J.; Wongjaikam, S.; Krintratun, W.; Chattipakorn, N.; Chattipakorn, S.C. A combination of an iron chelator with an antioxidant effectively diminishes the dendritic loss, tau-hyperphosphorylation, amyloids-β accumulation and brain mitochondrial dynamic disruption in rats with chronic iron-overload. Neuroscience 2016, 332, 191–202. [Google Scholar] [CrossRef] [PubMed]
- Kim, N.; Lee, H.J. Redox-Active Metal Ions and Amyloid-Degrading Enzymes in Alzheimer’s Disease. Int. J. Mol. Sci. 2021, 22, 7697. [Google Scholar] [CrossRef] [PubMed]
- Schymanski, E.L.; Jeon, J.; Gulde, R.; Fenner, K.; Ruff, M.; Singer, H.P.; Hollender, J. Identifying Small Molecules via High Resolution Mass Spectrometry: Communicating Confidence. Environ. Sci. Technol. 2014, 48, 2097–2098. [Google Scholar] [CrossRef]
- Carnat, A.; Carnat, A.-P.; Chavignon, O.; Heitz, A.; Wylde, R.; Lamaison, J.-L. Luteolin 7-Diglucuronide, the Major Flavonoid Compound fromAloysia triphyllaandVerbena officinalis. Planta Medica 1995, 61, 490–490. [Google Scholar] [CrossRef]
- Fraisse, D.; Degerine-Roussel, A.; Bred, A.; Ndoye, S.F.; Vivier, M.; Felgines, C.; Senejoux, F. A Novel HPLC Method for Direct Detection of Nitric Oxide Scavengers from Complex Plant Matrices and Its Application to Aloysia triphylla Leaves. Molecules 2018, 23, 1574. [Google Scholar] [CrossRef]
- Marchetti, L.; Pellati, F.; Graziosi, R.; Brighenti, V.; Pinetti, D.; Bertelli, D. Identification and determination of bioactive phenylpropanoid glycosides of Aloysia polystachya (Griseb. et Moldenke) by HPLC-MS. J. Pharm. Biomed. Anal. 2019, 166, 364–370. [Google Scholar] [CrossRef]
- Quirantes-Piné, R.; Arráez-Román, D.; Segura-Carretero, A.; Fernández-Gutiérrez, A. Characterization of phenolic and other polar compounds in a lemon verbena extract by capillary electrophoresis-electrospray ionization-mass spectrometry. J. Sep. Sci. 2010, 33, 2818–2827. [Google Scholar] [CrossRef] [PubMed]
- Iwunze, M.O. Characterization of Cr-Curcumin Complex by Differential Pulse Voltammetry and UV-Vis Spectrophotometry. ISRN Anal. Chem. 2014, 2014, 1–6. [Google Scholar] [CrossRef]
- Chiorcea-Paquim, A.-M.; Enache, T.A.; Oliveira-Brett, A.M. Electrochemistry of Alzheimer Disease Amyloid Beta Peptides. Curr. Med. Chem. 2018, 25, 4066–4083. [Google Scholar] [CrossRef]
- Chiorcea-Paquim, A.-M.; Oliveira-Brett, A.M. Amyloid beta peptides electrochemistry: A review. Curr. Opin. Electrochem. 2022, 31, 100837. [Google Scholar] [CrossRef]
- Hassan, Q.; Kerman, K. Electrochemical approaches for the detection of amyloid-β, tau, and α-synuclein. Curr. Opin. Electrochem. 2019, 14, 89–95. [Google Scholar] [CrossRef]
- Prabhulkar, S.; Piatyszek, R.; Cirrito, J.R.; Wu, Z.-Z.; Li, C.-Z. Microbiosensor for Alzheimer’s disease diagnostics: detection of amyloid beta biomarkers. J. Neurochem. 2012, 122, 374–381. [Google Scholar] [CrossRef] [PubMed]
- Harris, D. C. , & Lucy, C. A. (2019). Quantitative chemical analysis. W H Freeman & Co.
- Wang, X.; Li, Y.; Han, L.; Li, J.; Liu, C.; Sun, C. Role of Flavonoids in the Treatment of Iron Overload. Front. Cell Dev. Biol. 2021, 9. [Google Scholar] [CrossRef]
- Korshavn, K.J.; Jang, M.; Kwak, Y.J.; Kochi, A.; Vertuani, S.; Bhunia, A.; Manfredini, S.; Ramamoorthy, A.; Lim, M.H. Reactivity of Metal-Free and Metal-Associated Amyloid-β with Glycosylated Polyphenols and Their Esterified Derivatives. Sci. Rep. 2015, 5, 17842. [Google Scholar] [CrossRef]
- Ren, J.; Meng, S.; Lekka, C.E.; Kaxiras, E. Complexation of Flavonoids with Iron: Structure and Optical Signatures. J. Phys. Chem. B 2008, 112, 1845–1850. [Google Scholar] [CrossRef]
- Zhao, C.; Dodin, G.; Yuan, C.; Chen, H.; Zheng, R.; Jia, Z.; Fan, B.-T. “In vitro” protection of DNA from Fenton reaction by plant polyphenol verbascoside. Biochim. et Biophys. Acta (BBA) - Gen. Subj. 2005, 1723, 114–123. [Google Scholar] [CrossRef]
- Marković, J. M. D. , Marković, Z. S., Brdarić, T. P., Pavelkić, V. M., Jadranin, M. B.. Iron complexes of dietary flavonoids: Combined spectroscopic and mechanistic study of their free radical scavenging activity. Food Chemistry, 2011, 129, 1567–1577. Available online: https://www.academia.edu/6159653/Iron_complexes_of_dietary_flavonoids_Combined_spectroscopic_and_mechanistic_study_of_their_free_radical_scavenging_activity. [CrossRef]
- Howes, M.R.; Perry, N.S.; Vásquez-Londoño, C.; Perry, E.K. Role of phytochemicals as nutraceuticals for cognitive functions affected in ageing. Br. J. Pharmacol. 2020, 177, 1294–1315. [Google Scholar] [CrossRef]
- Vásquez-Londoño CA, H. M.-J. C. G. A. G. R.-C. M. (2023). Scutellaria incarnata Vent. root extract and isolated phenylethanoid glycosides are neuroprotective against C2-ceramide toxicity.. Journal of Ethnopharmacology.
- Taneja, V.; Verma, M.; Vats, A. Toxic species in amyloid disorders: Oligomers or mature fibrils. Ann. Indian Acad. Neurol. 2015, 18, 138–45. [Google Scholar] [CrossRef]
- Tolar, M.; Hey, J.; Power, A.; Abushakra, S. Neurotoxic Soluble Amyloid Oligomers Drive Alzheimer’s Pathogenesis and Represent a Clinically Validated Target for Slowing Disease Progression. Int. J. Mol. Sci. 2021, 22, 6355. [Google Scholar] [CrossRef]
- Na Zhao, L.; Long, H.W.; Mu, Y.; Chew, L.Y. The Toxicity of Amyloid ß Oligomers. Int. J. Mol. Sci. 2012, 13, 7303–7327. [Google Scholar] [CrossRef] [PubMed]
- Wells, C.; Brennan, S.; Keon, M.; Ooi, L. The role of amyloid oligomers in neurodegenerative pathologies. Int. J. Biol. Macromol. 2021, 181, 582–604. [Google Scholar] [CrossRef] [PubMed]
- Canevari, L.; Abramov, A.Y.; Duchen, M.R. Toxicity of Amyloid β Peptide: Tales of Calcium, Mitochondria, and Oxidative Stress. Neurochem. Res. 2004, 29, 637–650. [Google Scholar] [CrossRef] [PubMed]
- Enache, T.A.; Chiorcea-Paquim, A.-M.; Oliveira-Brett, A.M. Amyloid–β peptides time-dependent structural modifications: AFM and voltammetric characterization. Anal. Chim. Acta 2016, 926, 36–47. [Google Scholar] [CrossRef]
- Suprun, E.V.; Radko, S.P.; Kozin, S.A.; Mitkevich, V.A.; Makarov, A.A. Application of electrochemical method to a comparative study of spontaneous aggregation of amyloid-β isoforms. J. Electroanal. Chem. 2020, 861. [Google Scholar] [CrossRef]
- Hu, W.-P.; Chang, G.-L.; Chen, S.-J.; Kuo, Y.-M. Kinetic analysis of β-amyloid peptide aggregation induced by metal ions based on surface plasmon resonance biosensing. J. Neurosci. Methods 2006, 154, 190–197. [Google Scholar] [CrossRef]
- Figueroa, J.D.; Zárate, A.M.; Fuentes-Lemus, E.; Davies, M.J.; López-Alarcón, C. Formation and characterization of crosslinks, including Tyr–Trp species, on one electron oxidation of free Tyr and Trp residues by carbonate radical anion. RSC Adv. 2020, 10, 25786–25800. [Google Scholar] [CrossRef]
Figure 3.
Electrochemical changes that accompany aggregation of beta-amyloid 1-42 (Aβ1-42). Differential pulse voltammetry was used to monitor the progress of Aβ1-42 at 37 °C, pH 7-7.3 DPBS. The peak at ~0.6 V represents tyrosine, and it decreased in magnitude over time due to aggregation of Aβ1-42. The aggregation shielded the amino acid from the electrode surface and made electron transfer between tyrosine and the electrode more difficult. Peaks in the region −0.1 to 0.1 V evolved over time. The identities of these peaks are not known but are speculated to be histidine, di-tyrosine, and or interactions between the amino acids. The peaks in this region separated at around 300 minutes.
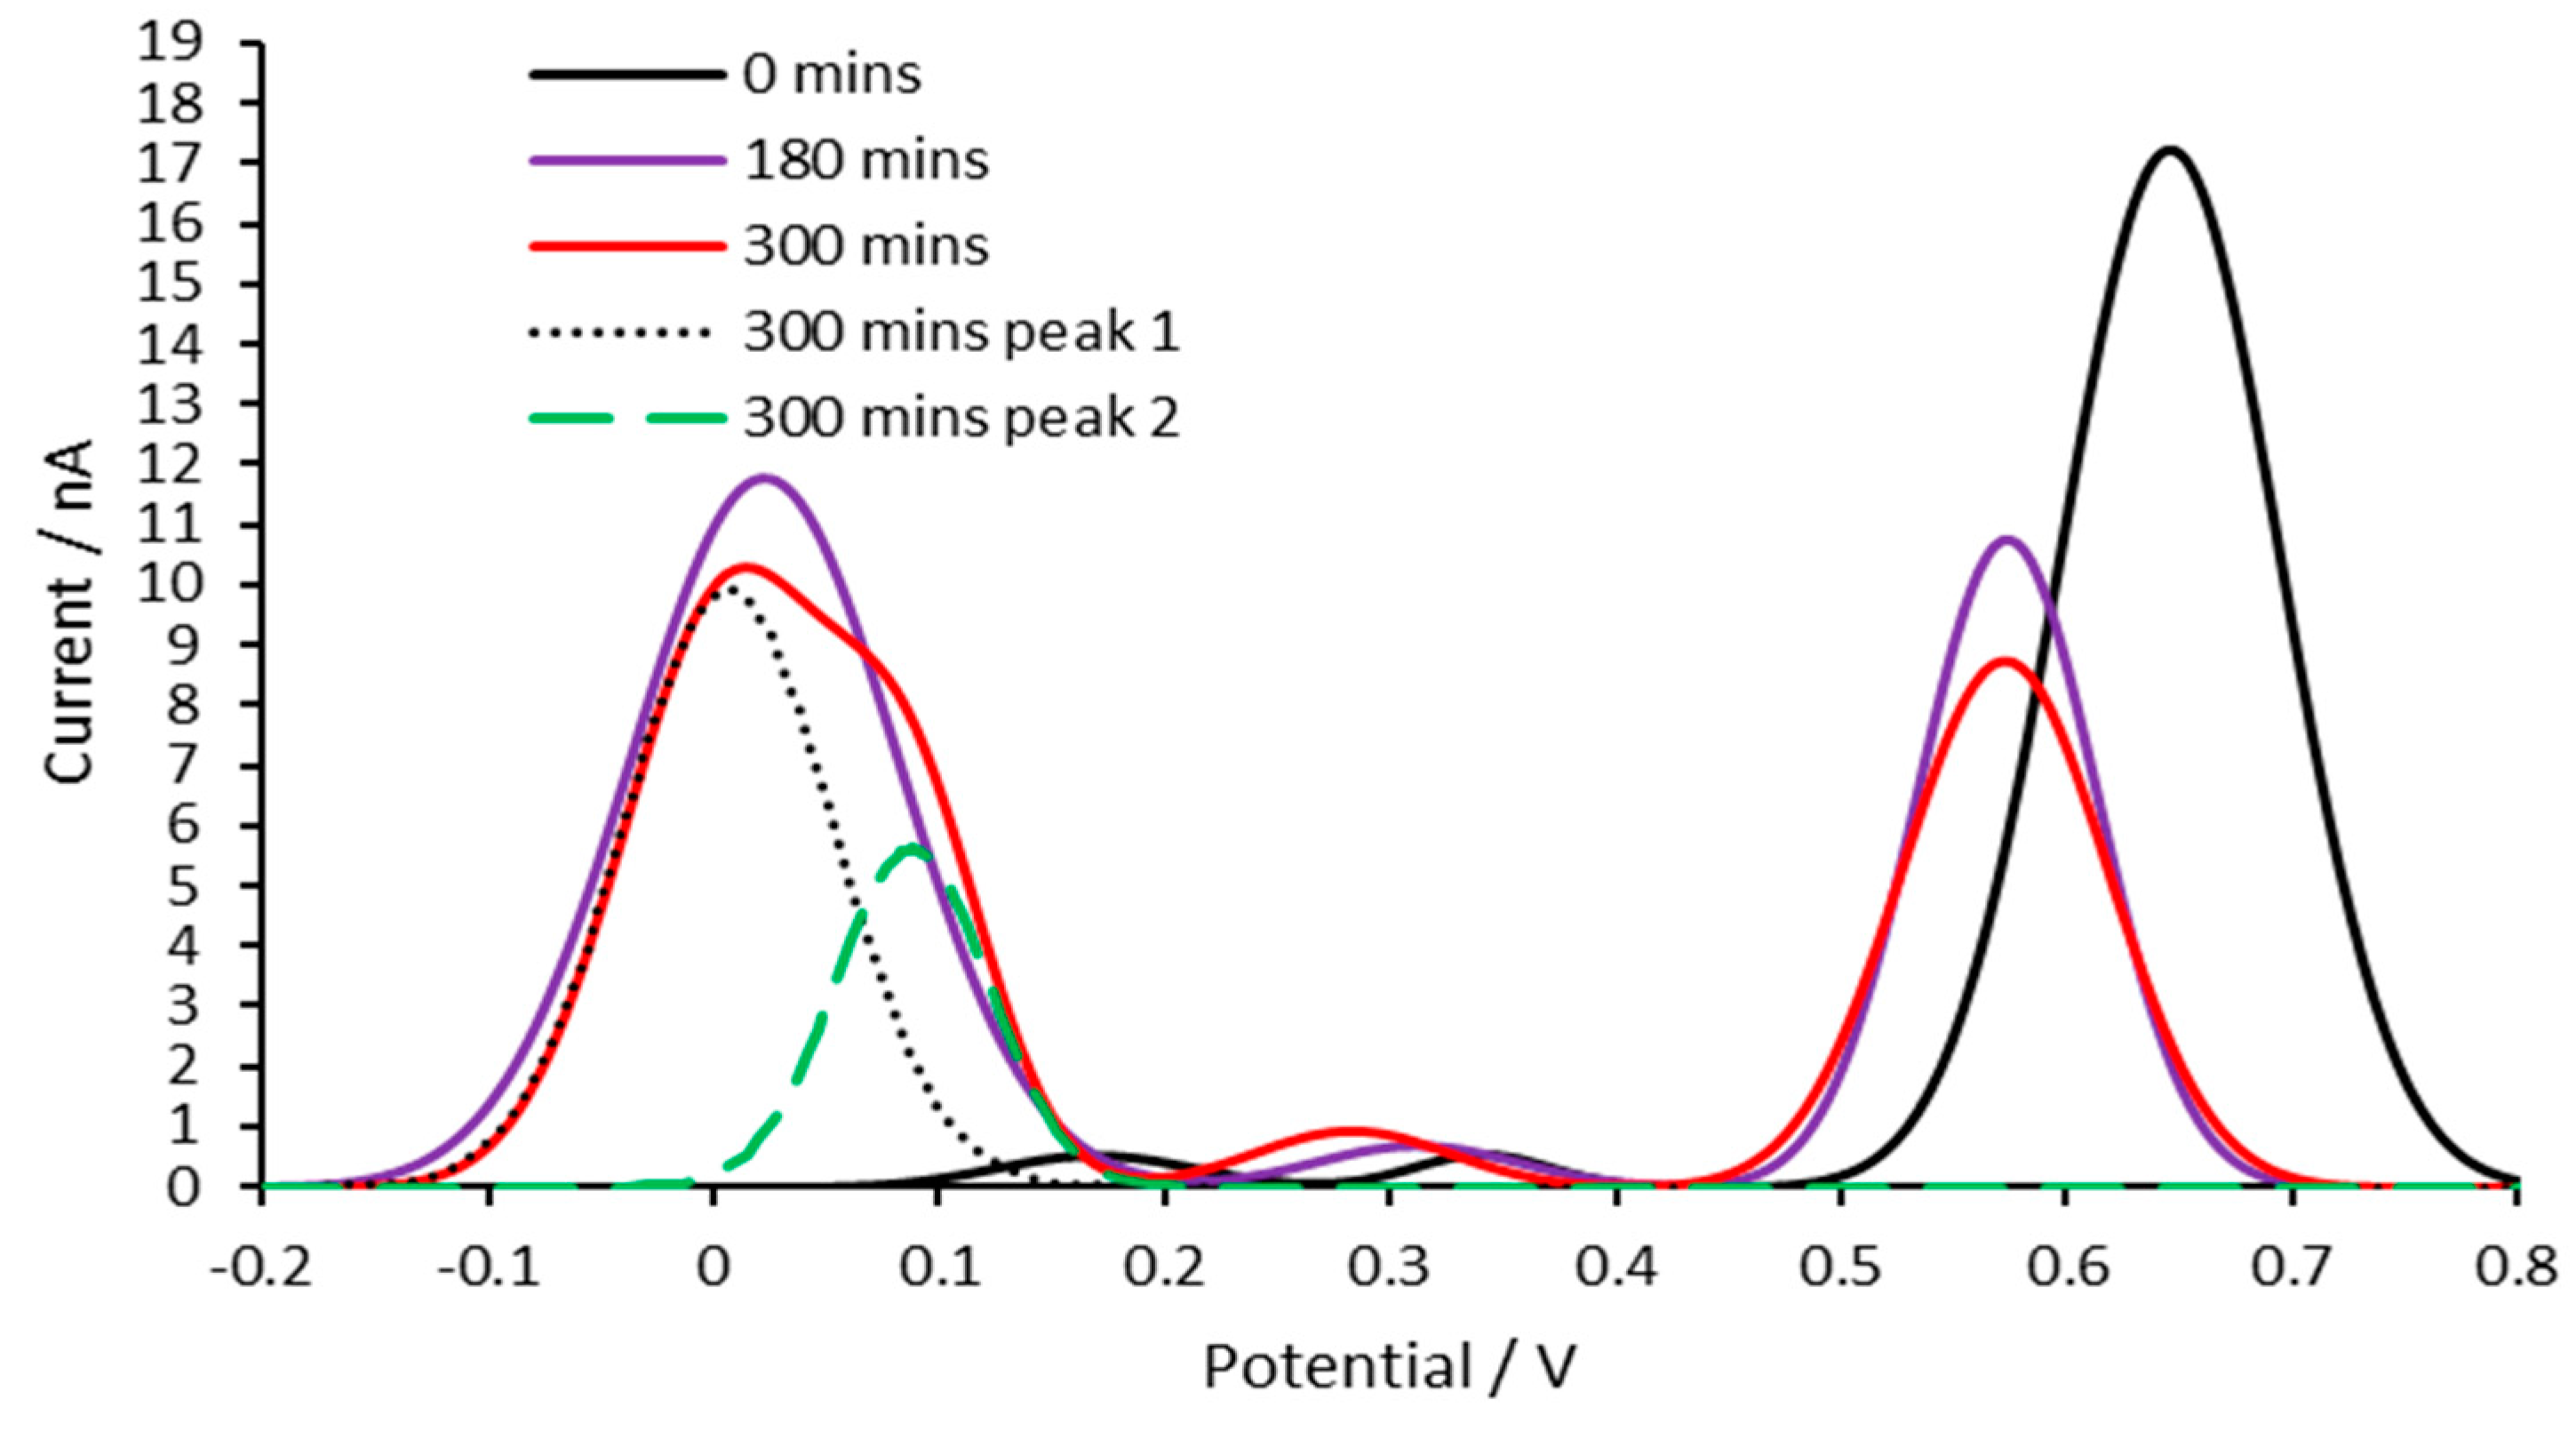
Figure 4.
Determination of the influences of ferrous iron and AC has on the rate of aggregation of Aβ1-42. The rate of decrease of the tyrosine peaks is directly associated with aggregation rate of Aβ1-42. The faster the decrease in tyrosine peaks, the faster the aggregation. The difference between the normalised peak size of each sample and the control (Aβ1-42, 50 µM) is plotted for each interval. The identity of the samples is shown by the figure legends.
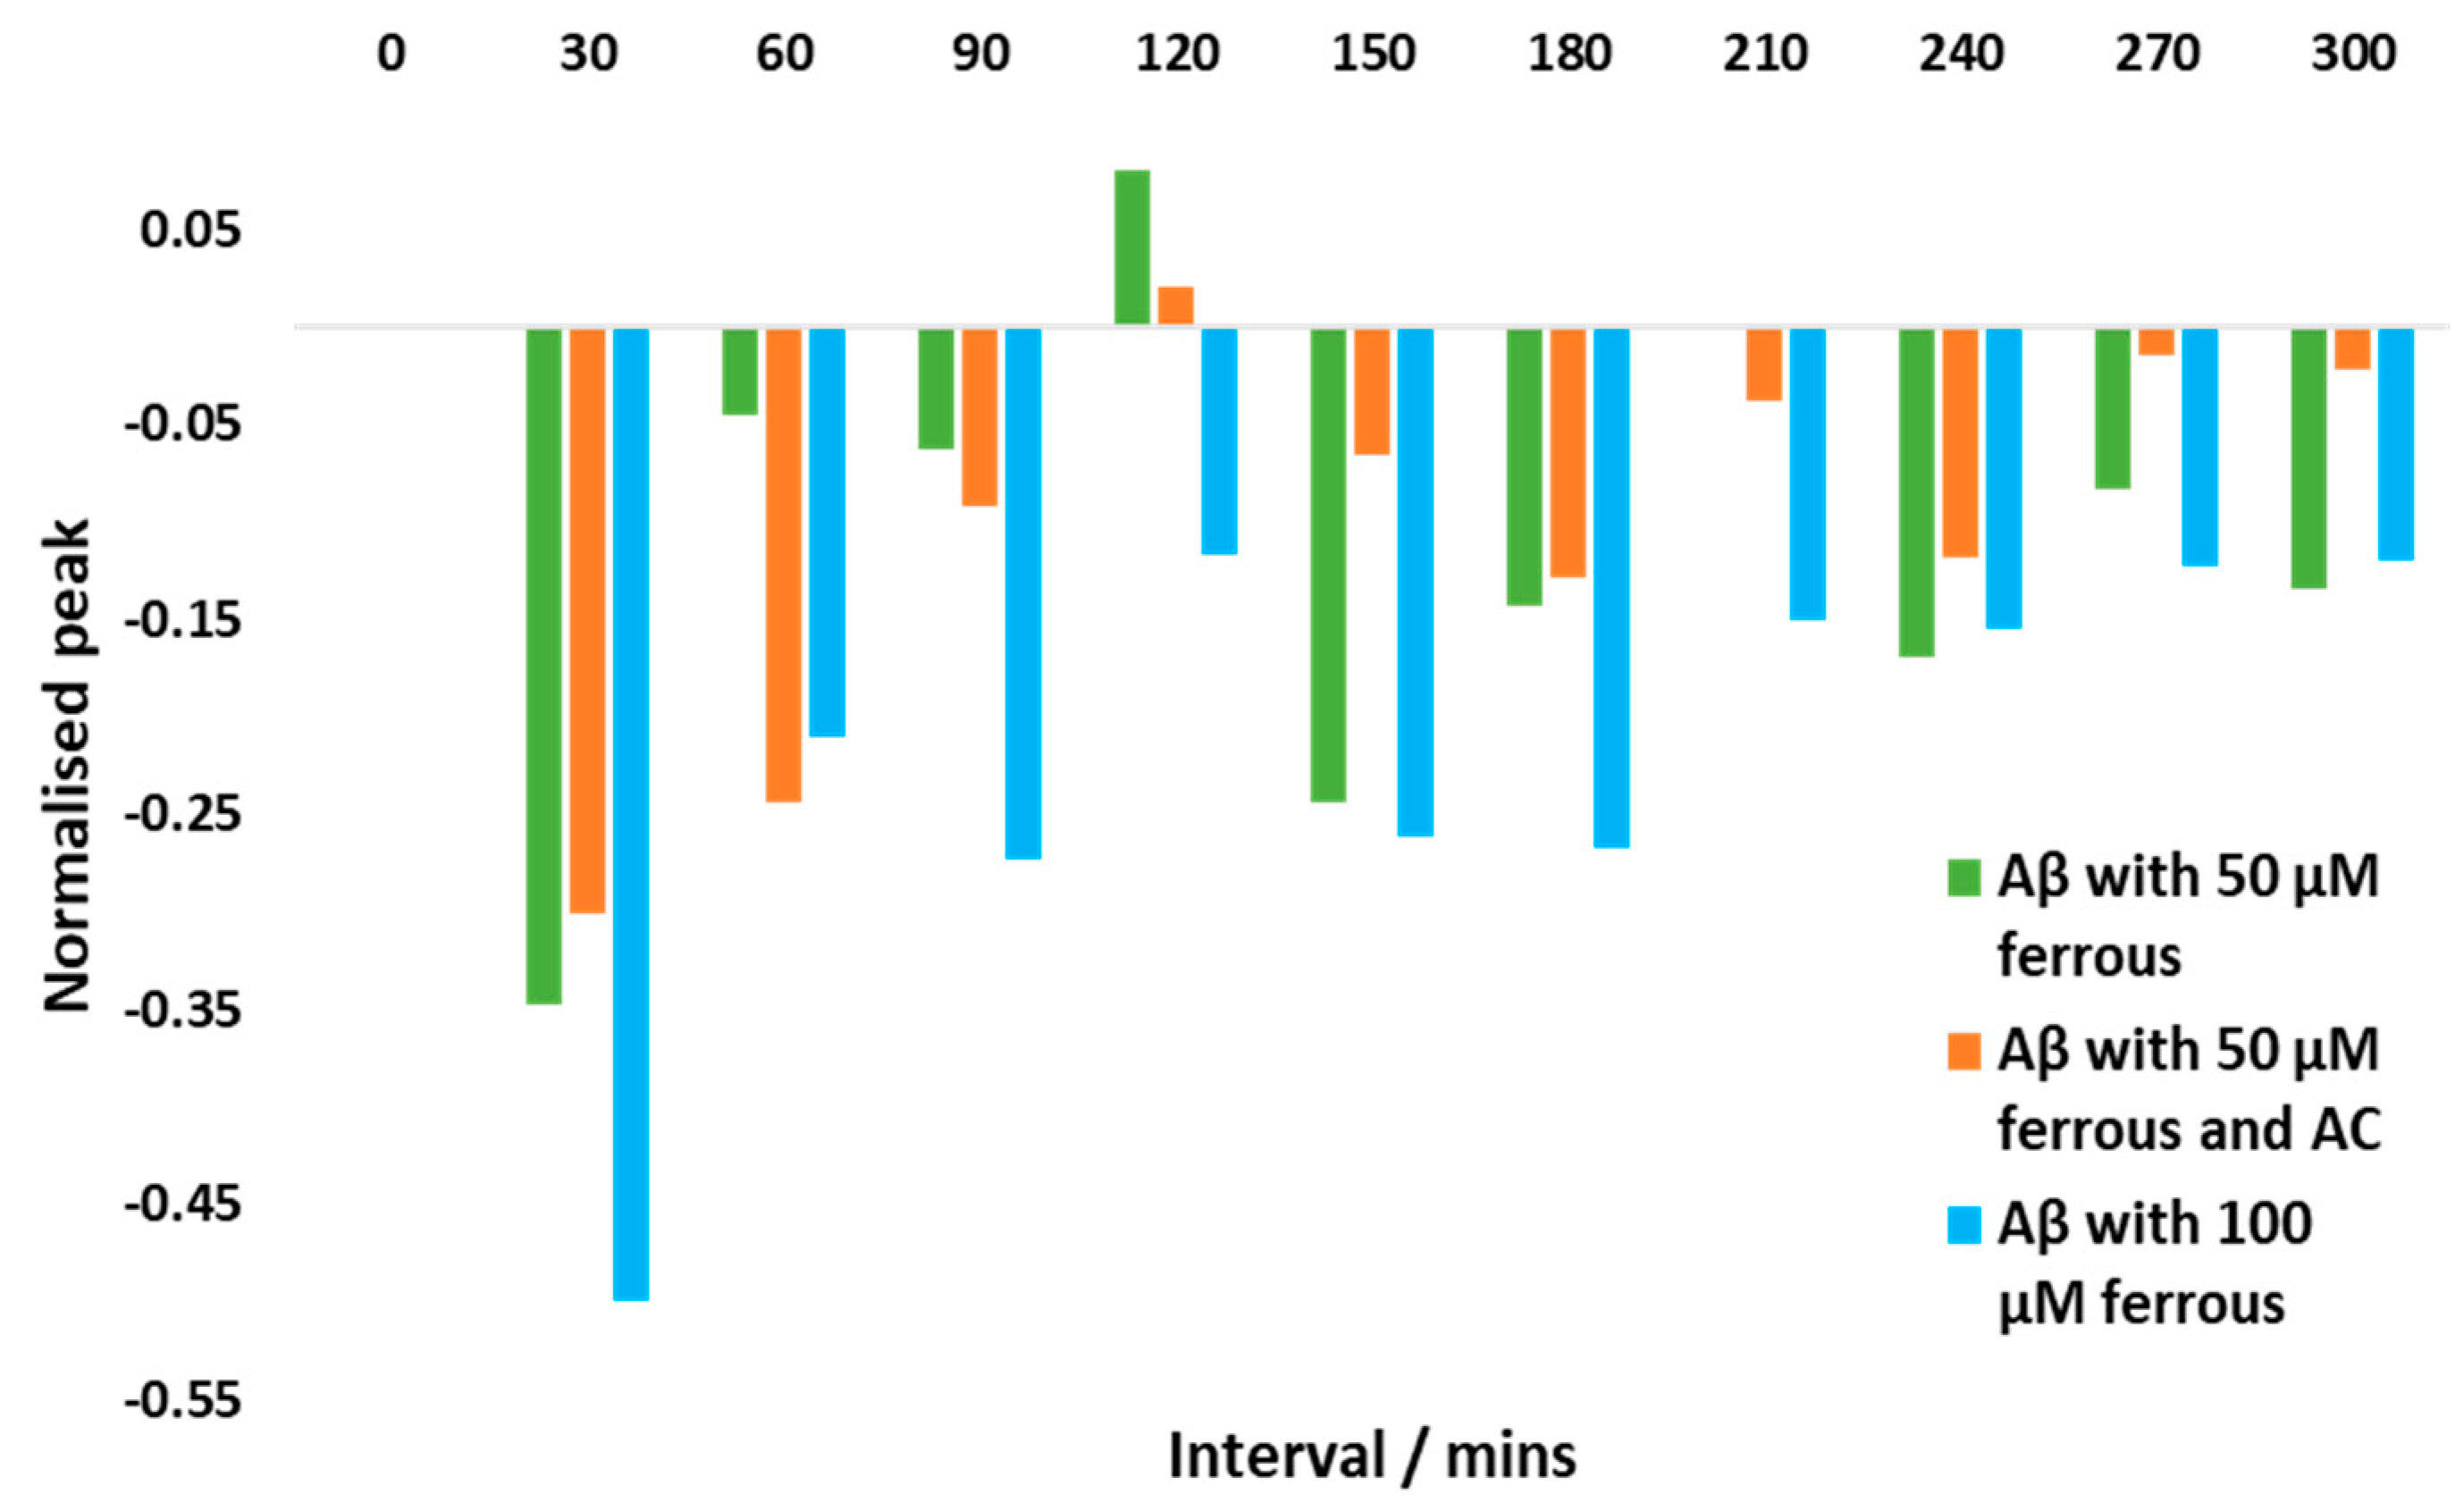
Figure 5.
Determination of the association constant (Ka) using the Gran method. The last 10% of the data leading up to the equivalence point was used to determine the association constant. (a) Potentiometric titration of AC and ferric iron; the Ka was 0.0879. (b) Potentiometric titration of AC and ferrous iron; the Ka was 0.159.
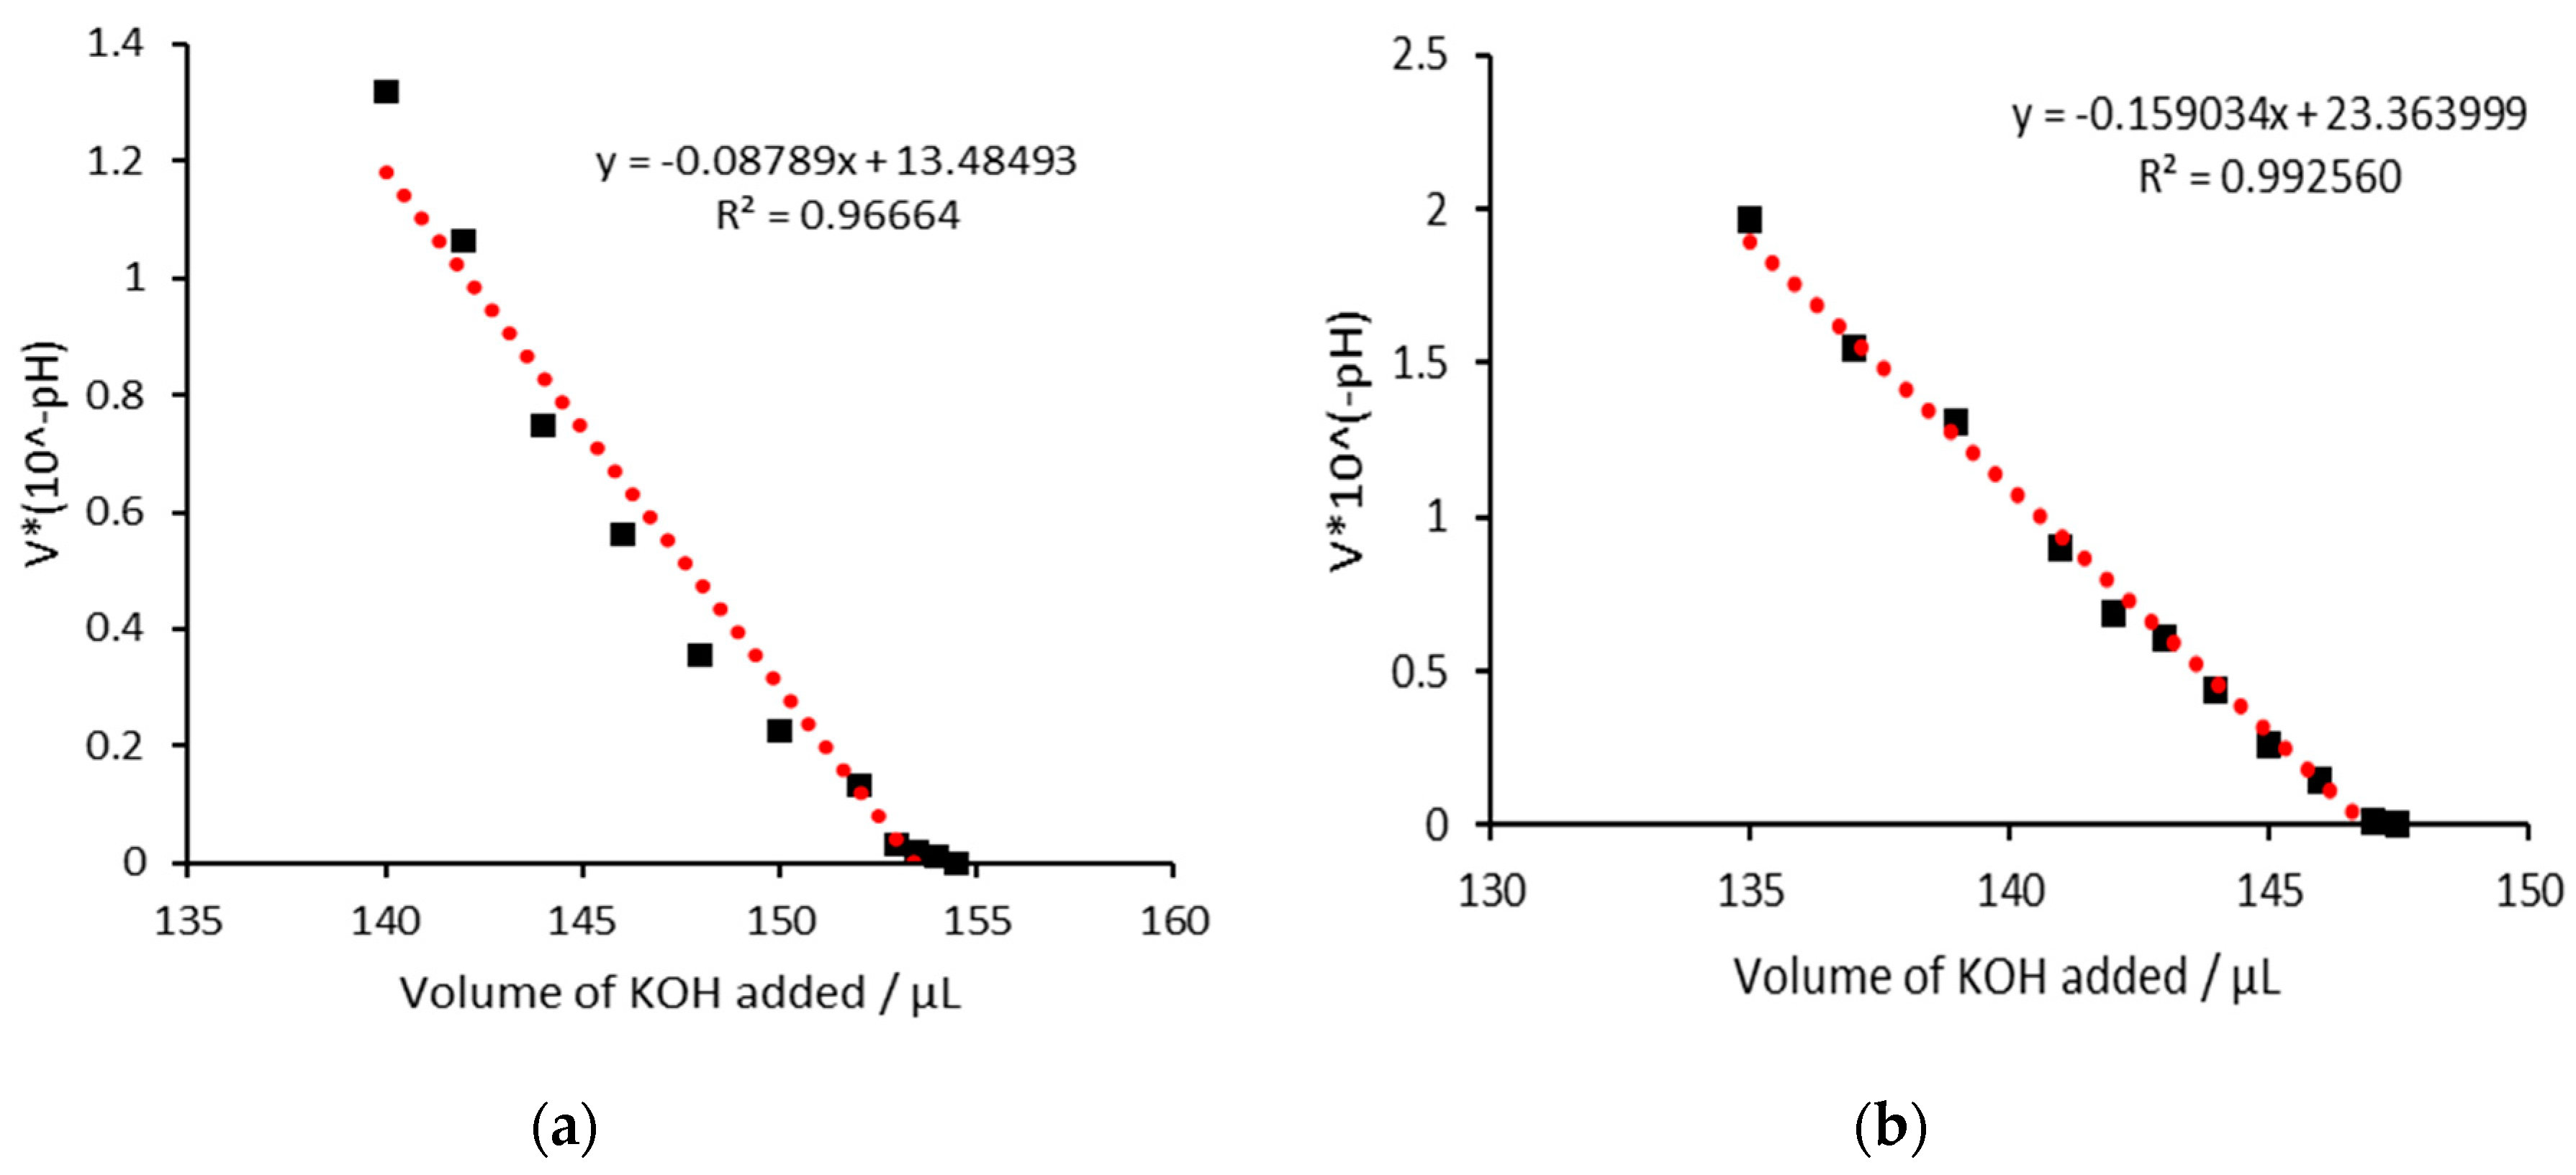
Figure 6.
2-Dimensional chemical structures of luteolin, apigenin, and verbascoside. The potential iron chelation sites are highlighted in red. However, all oxygen atoms within each structure may act as a ligand donor, provided that electronic and steric interactions permit it.
Figure 6.
2-Dimensional chemical structures of luteolin, apigenin, and verbascoside. The potential iron chelation sites are highlighted in red. However, all oxygen atoms within each structure may act as a ligand donor, provided that electronic and steric interactions permit it.
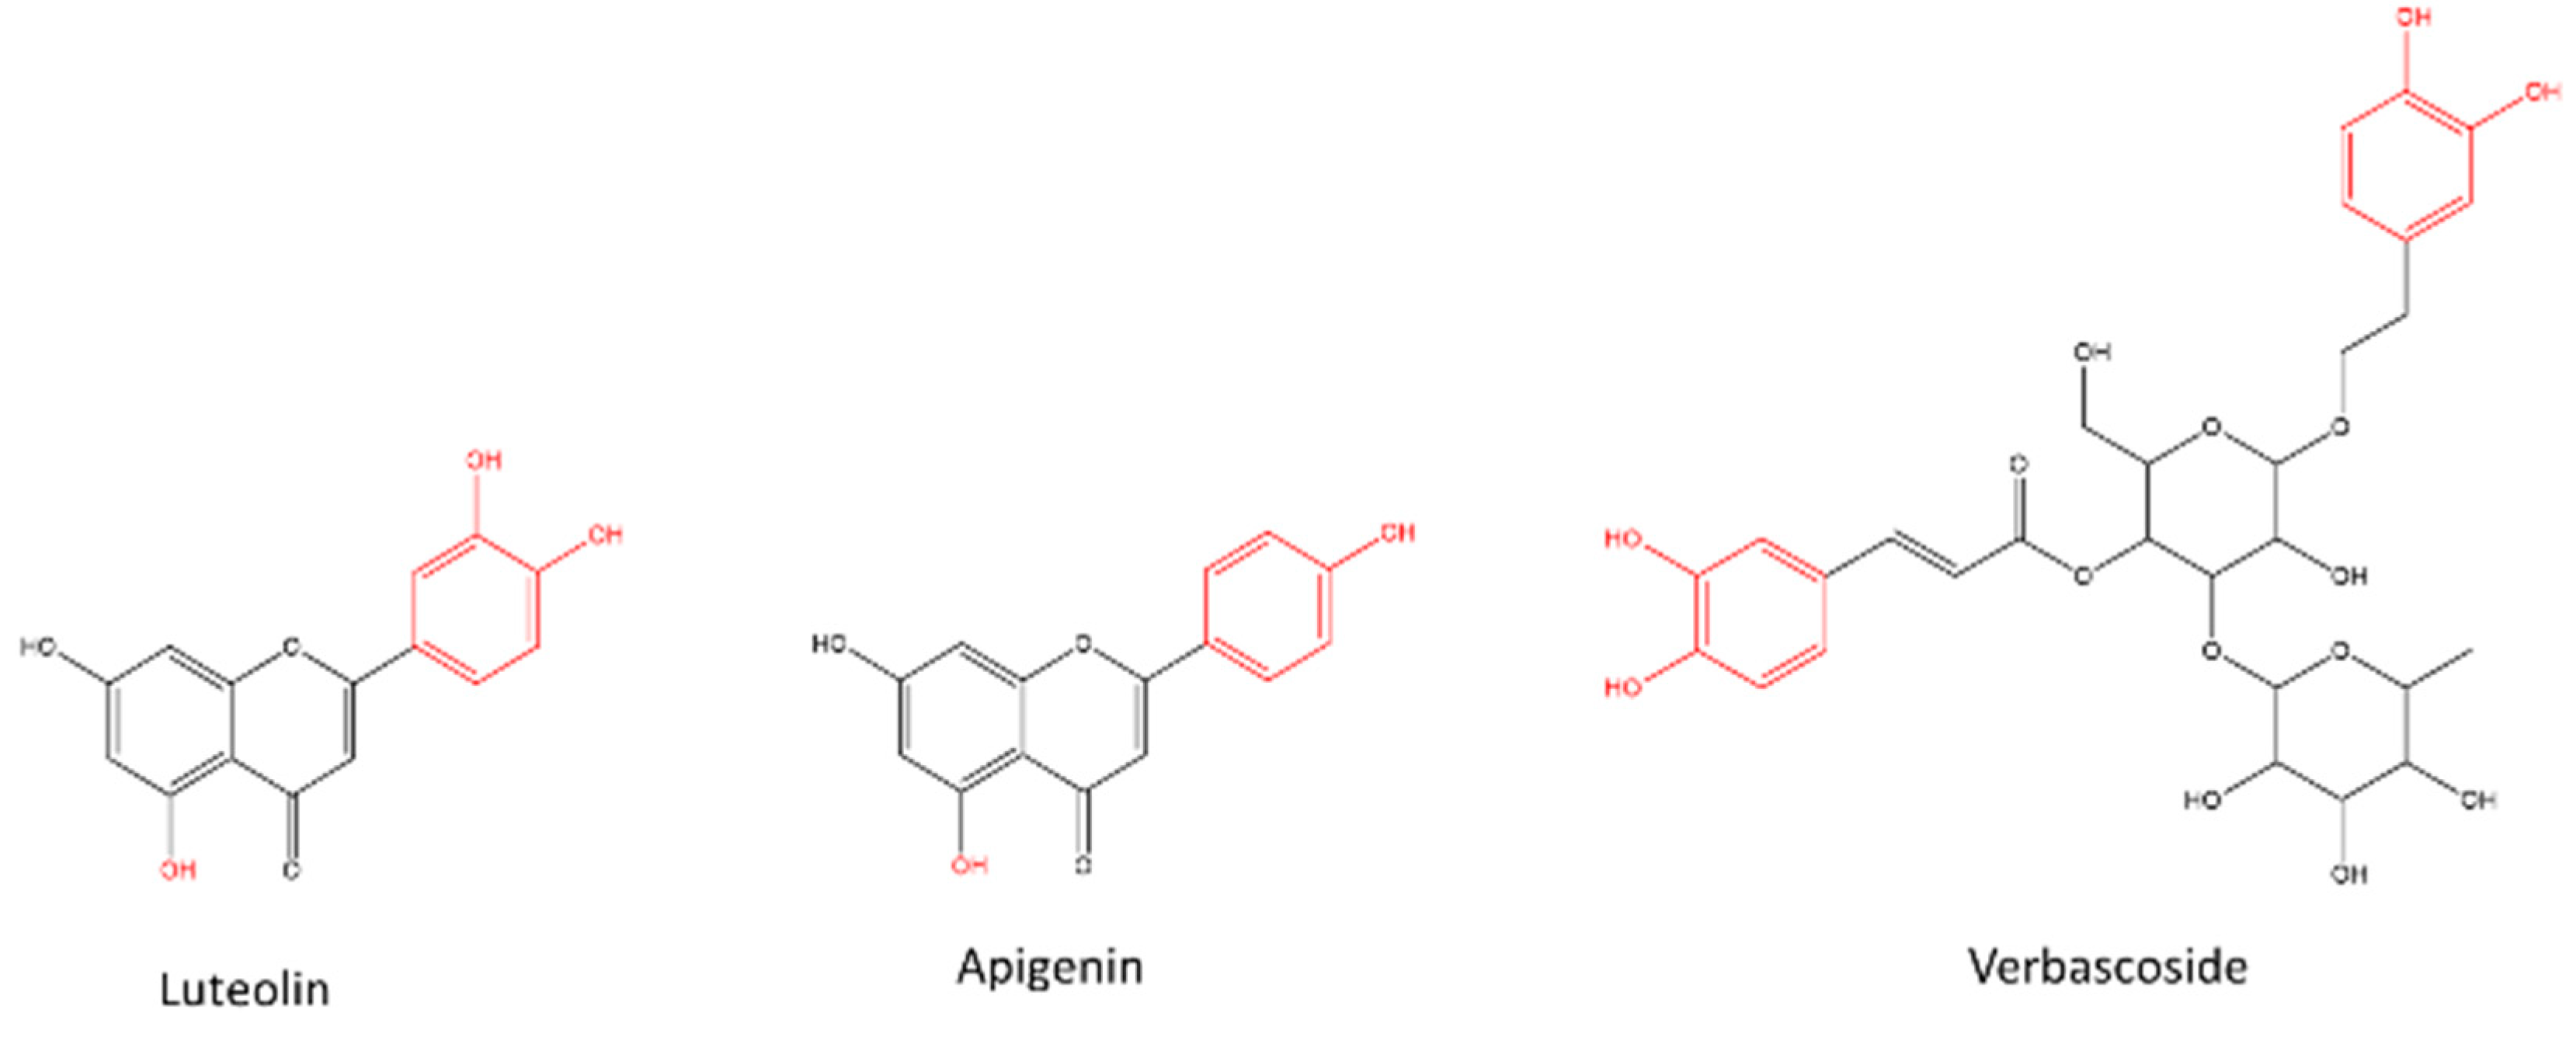

Table 1.
Compounds assigned in the Aloysia citrodora aqueous extract by LC-MS analysis. All compounds assigned by comparison of accurate mass data (based on ppm#), and by interpretation of available MS/MS and/or UV spectra. *Reported to occur in Aloysia species [27,28,29,30].
| Assigned compound (or isomer) |
Retention time (min) | Molecular formula | m/z | Ion | ppm# |
|---|---|---|---|---|---|
| Luteolin 7-diglucuronide* | 8.3 | C27H26O18 | 639.1193 | [M + H]+ | 0.109 |
| Di-O-galloylcrenatin or isomer | 9.5 | C27H26O17 | 623.1242 | [M + H]+ | 0.105 |
| Diosmetin 7-diglucuronide* | 9.9 | C28H28O18 | 653.1357 | [M + H]+ | 1.378 |
| Verbascoside* | 10.3 | C29H36O15 | 625.2143 | [M + H]+ | 2.548 |
| Acetylverbascoside | 10.6 | C31H38O16 | 667.2246 | [M + H]+- | 1.931 |
| 6-Hydroxyluteolin 4’-methyl ether 6-O-glucuronide | 10.8 | C22H20O13 | 493.0985 | [M + H]+ | 1.649 |
| 6-Hydroxyapigenin 4’-methyl ether 6-O-glucuronide | 12.0 | C22H20O12 | 477.1042 | [M + H]+ | 3.013 |
| Apigenin 4’-methyl ether 7-diglucuronide* | 12.1 | C28H28O17 | 637.1407 | [M + H]+ | 1.200 |
| Hydroxy-megastigmenone malonyl-hexoside | 12.7 | C22H34O10 | 459.2229 | [M + H]+ | 0.928 |
| Hydroxy-megastigmenone malonyl-hexoside | 13.1 | C22H34O10 | 459.2237 | [M + H]+ | 2.583 |
Disclaimer/Publisher’s Note: The statements, opinions and data contained in all publications are solely those of the individual author(s) and contributor(s) and not of MDPI and/or the editor(s). MDPI and/or the editor(s) disclaim responsibility for any injury to people or property resulting from any ideas, methods, instructions or products referred to in the content. |
© 2023 by the authors. Licensee MDPI, Basel, Switzerland. This article is an open access article distributed under the terms and conditions of the Creative Commons Attribution (CC BY) license (http://creativecommons.org/licenses/by/4.0/).
Copyright: This open access article is published under a Creative Commons CC BY 4.0 license, which permit the free download, distribution, and reuse, provided that the author and preprint are cited in any reuse.


