Submitted:
12 July 2023
Posted:
13 July 2023
You are already at the latest version
Abstract
Keywords:
1. Introduction
2. Materials and Methods
2.1. Human samples
2.2. Virus strains
2.3. Cell cultures
2.4. Microscopy assay
2.5. Detection and quantification of cytokines
2.6. Detection and quantification of SARS-CoV-2 by RT-PCR
2.7. Modeling
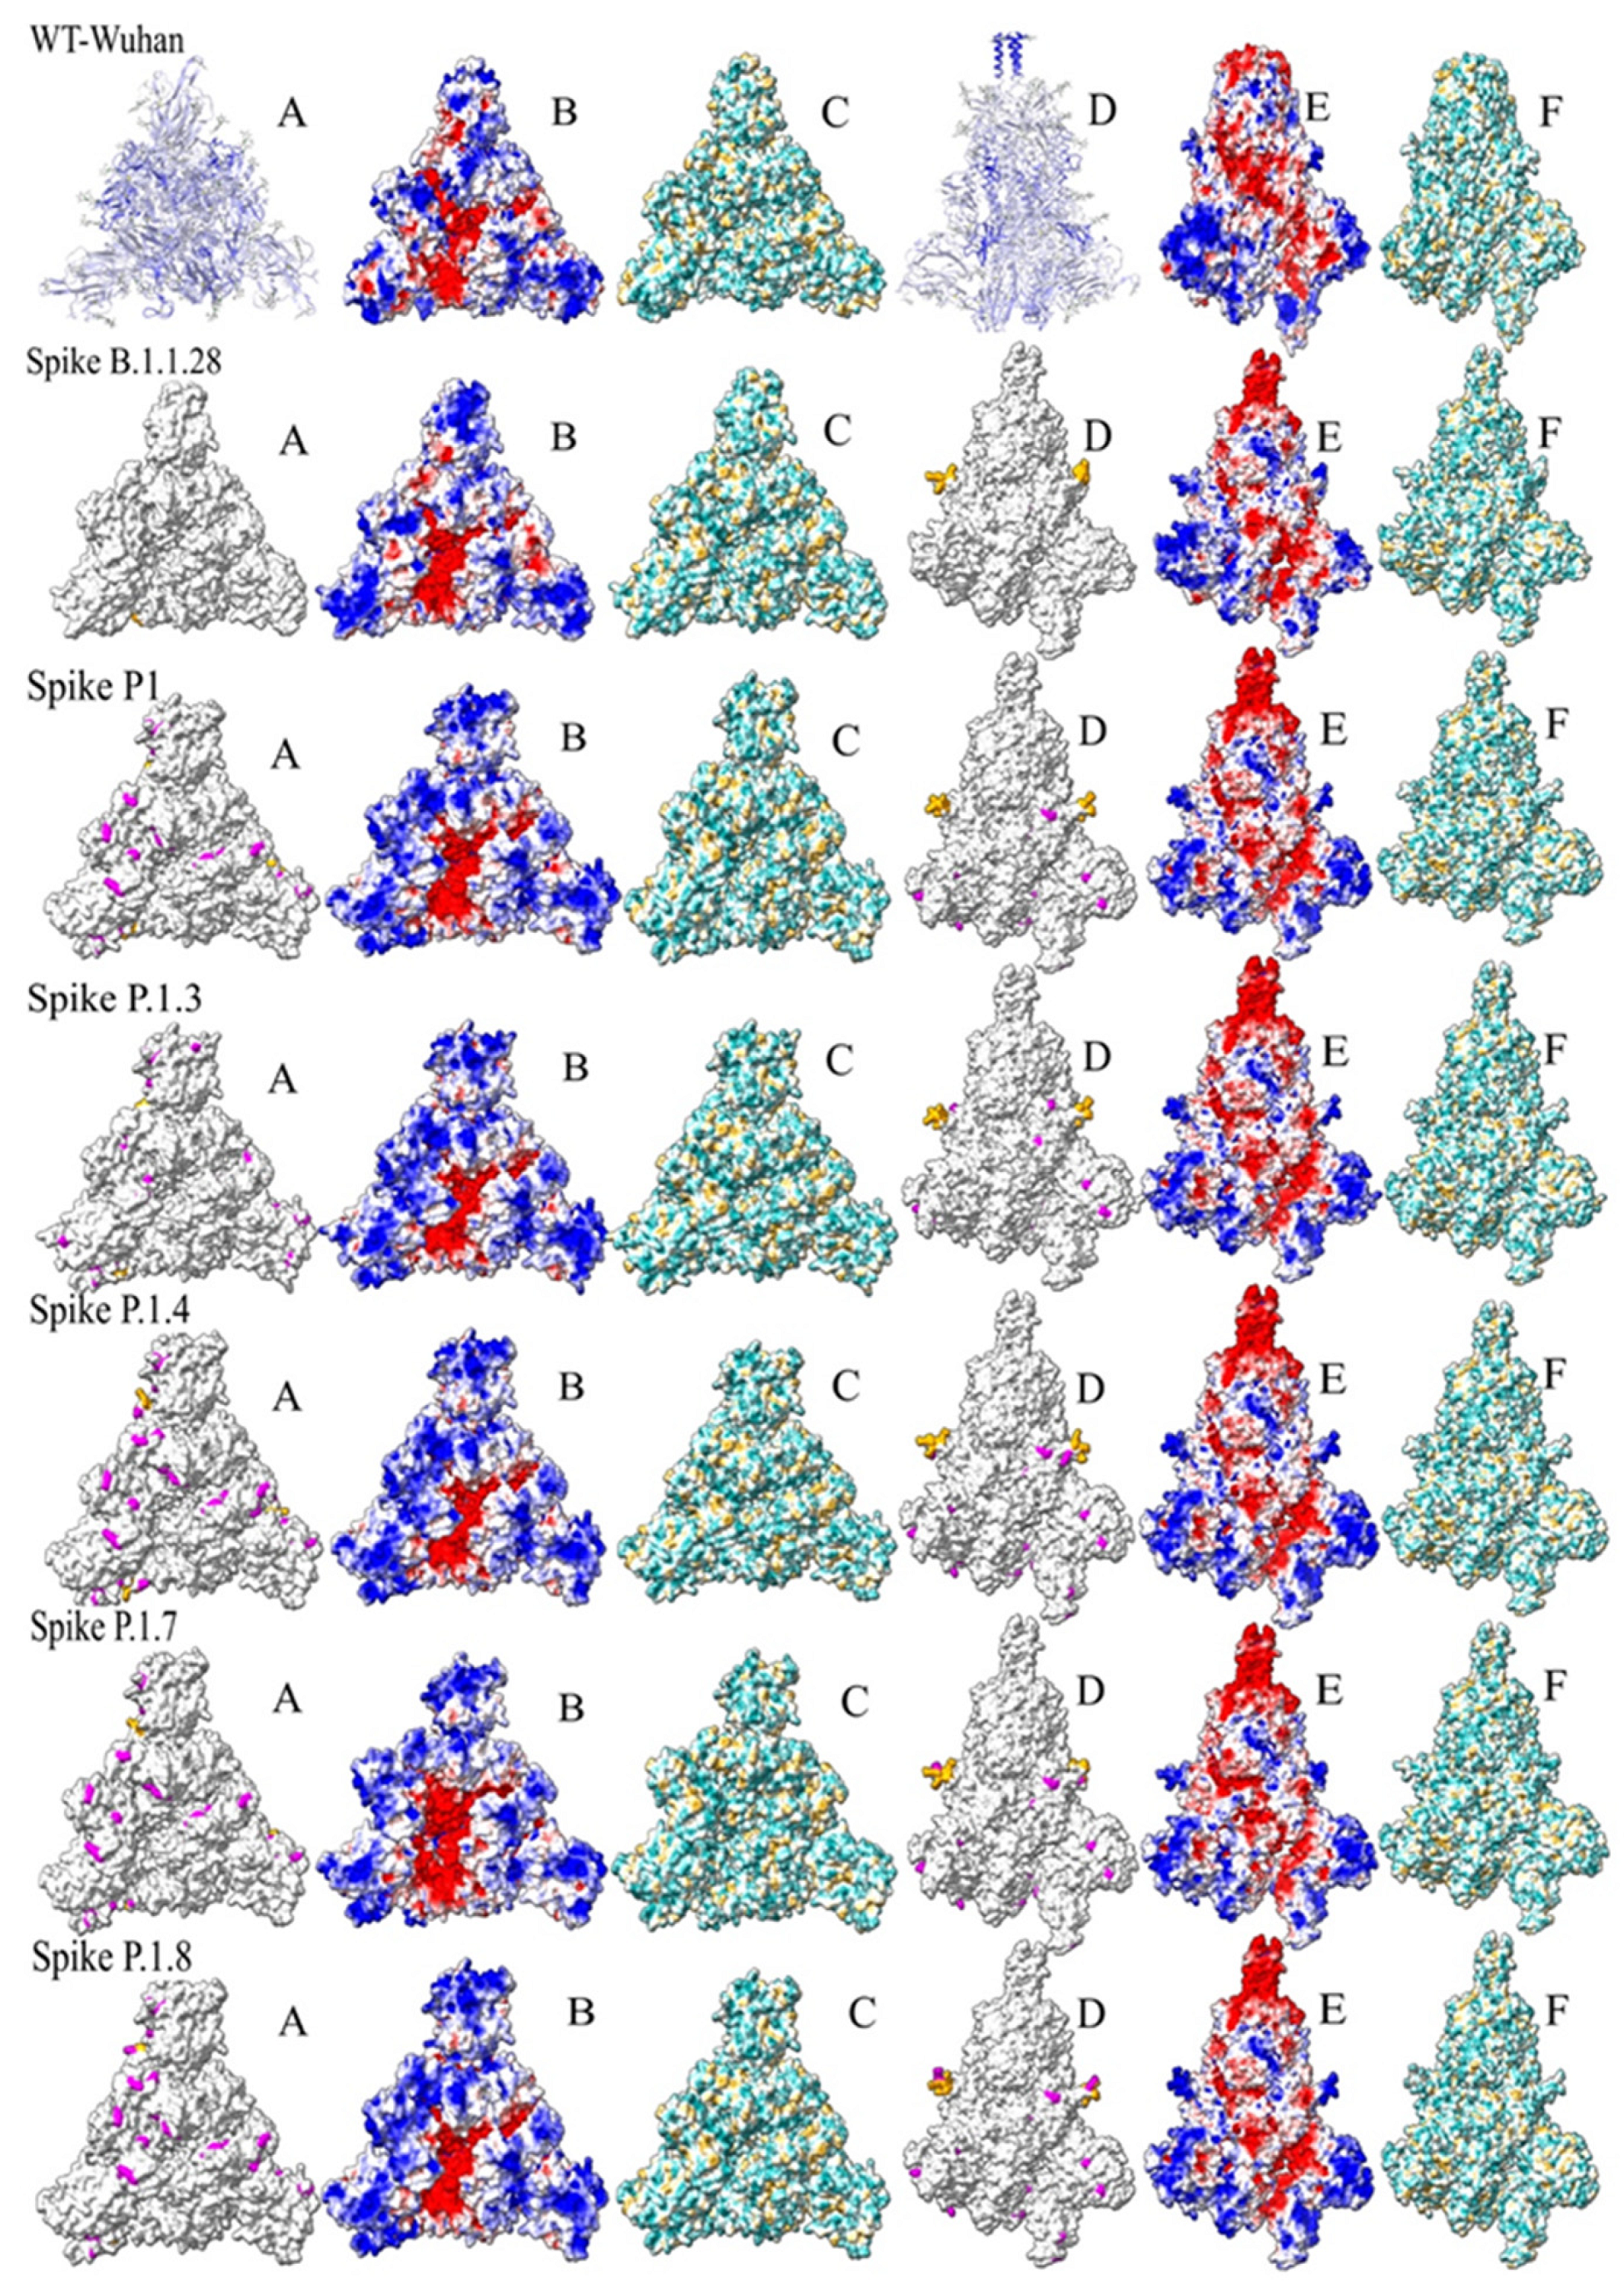
2.8. Calculation of electrostatic potential and solvent accessible surface
2.9. Figures with the epitope location frequencies (Immunogenicity Scale)
2.10. Statistical analysis
3. Results
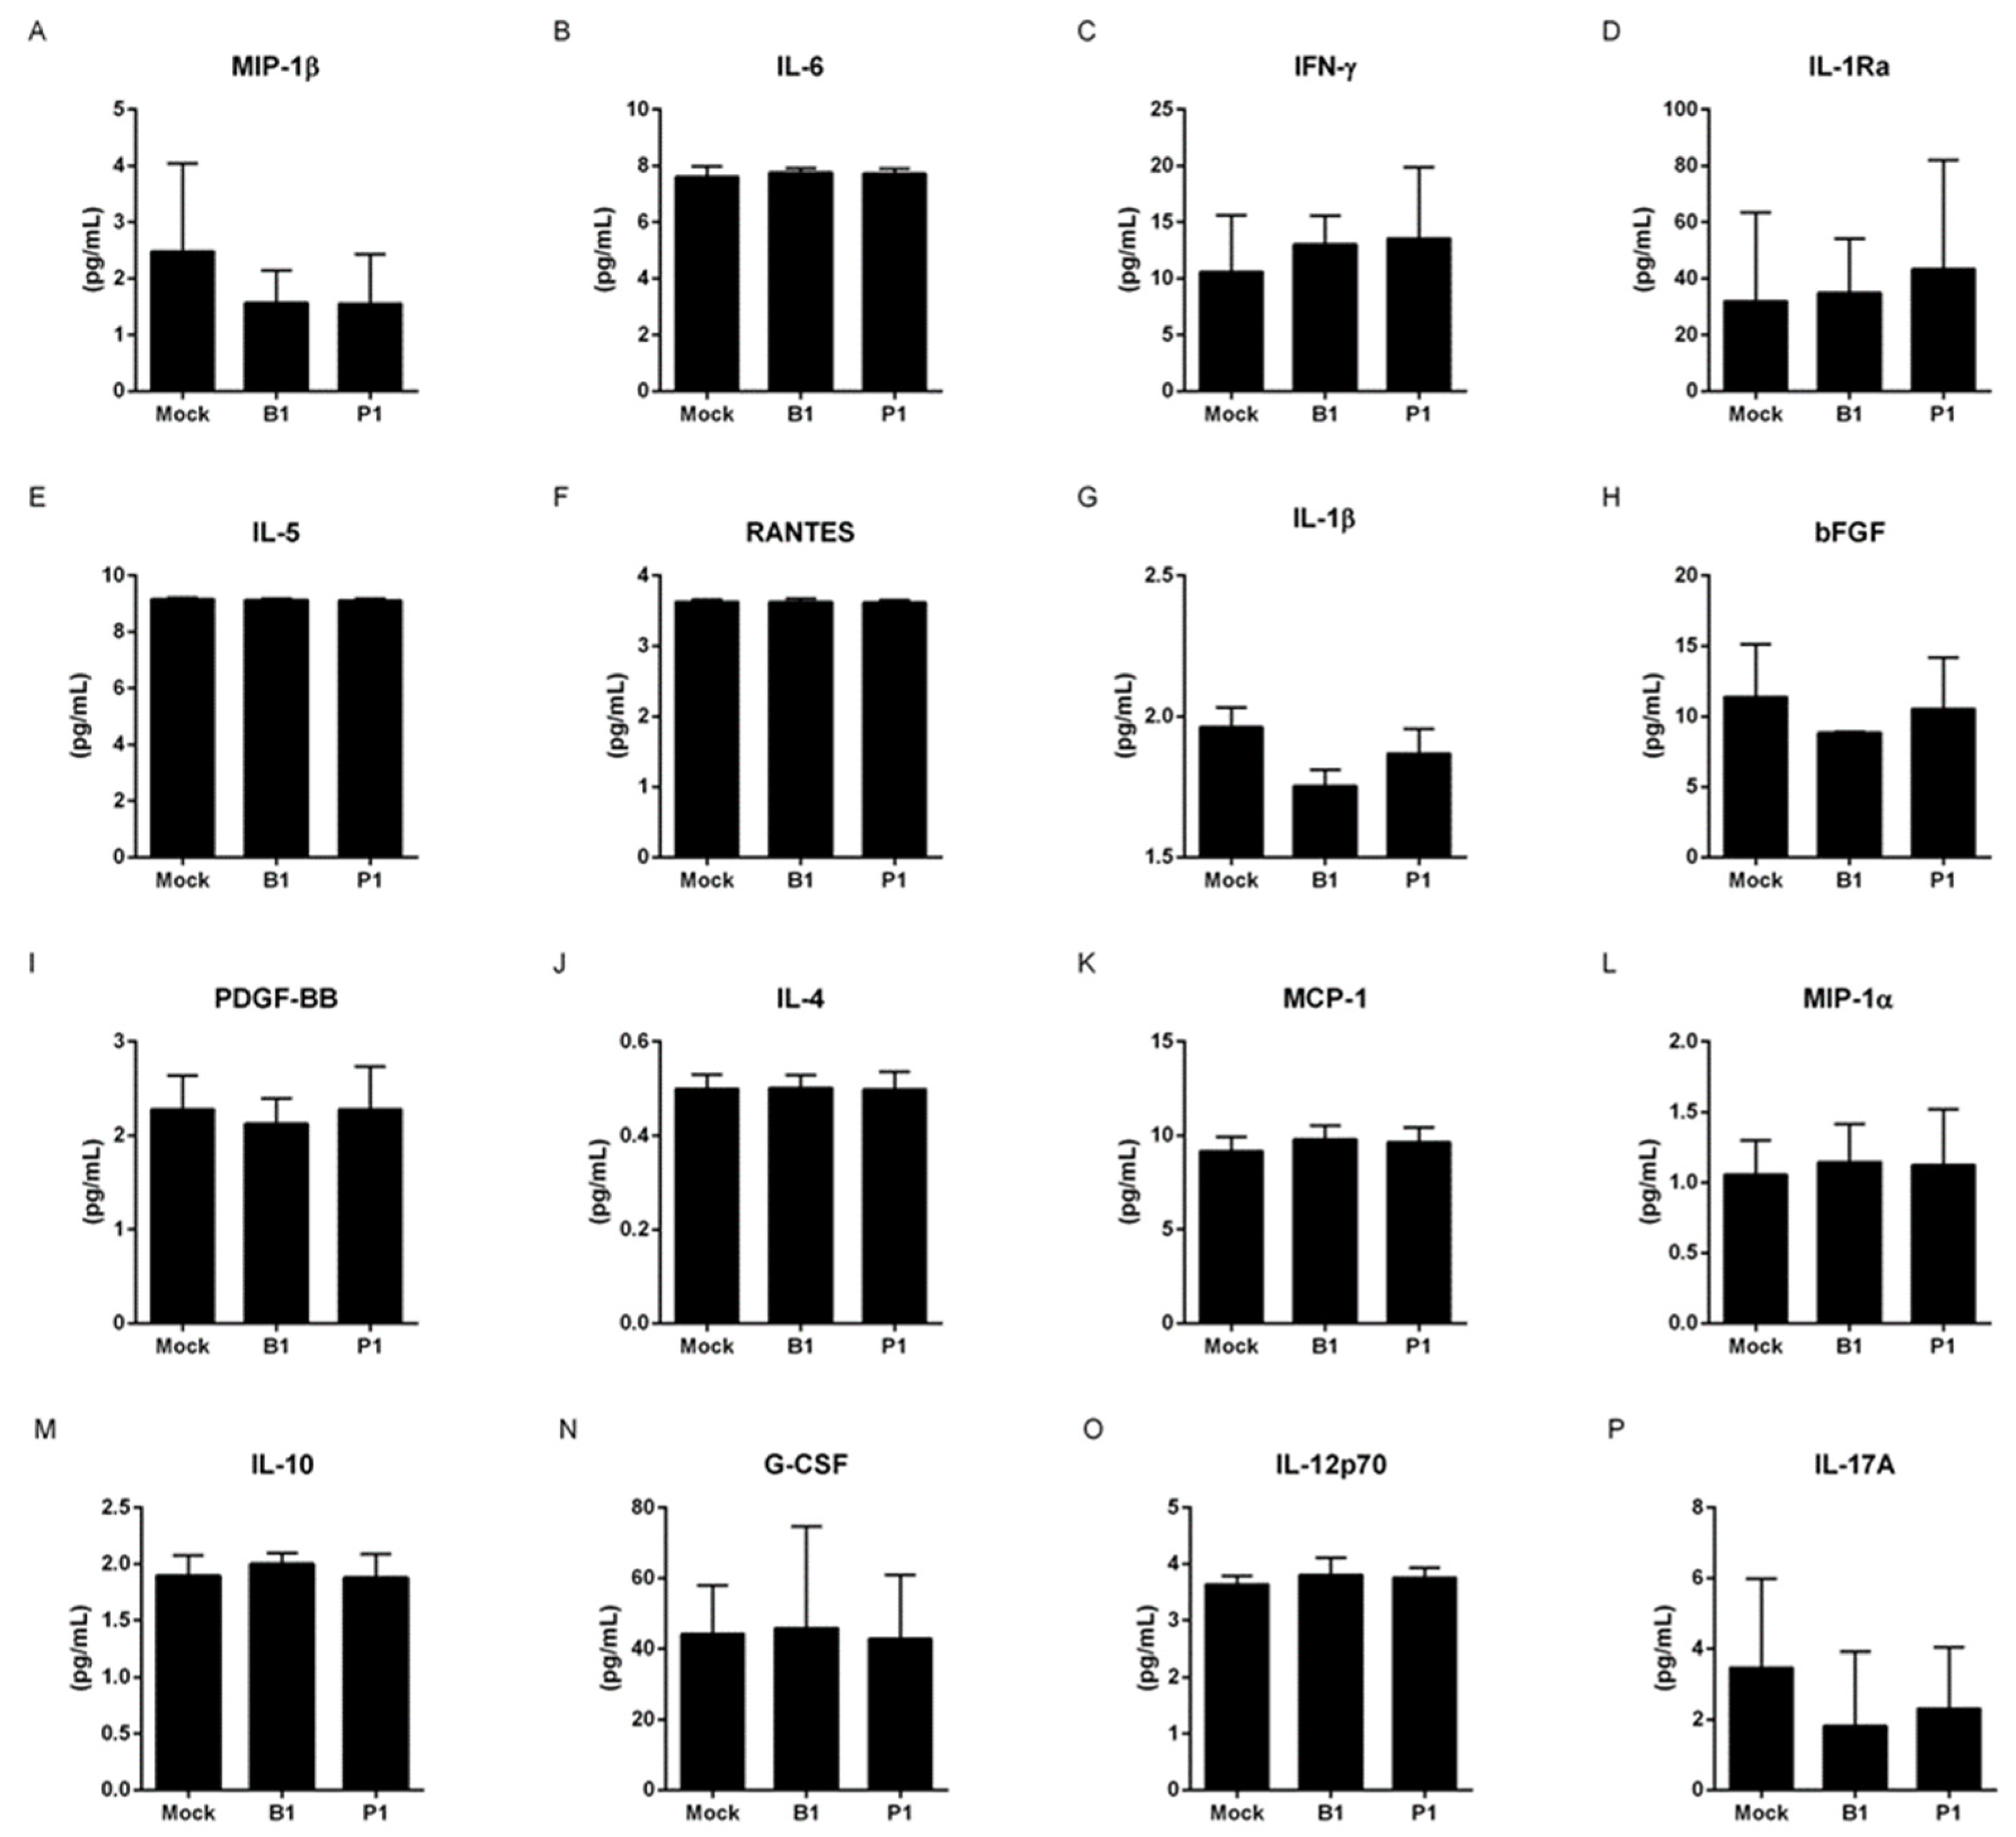
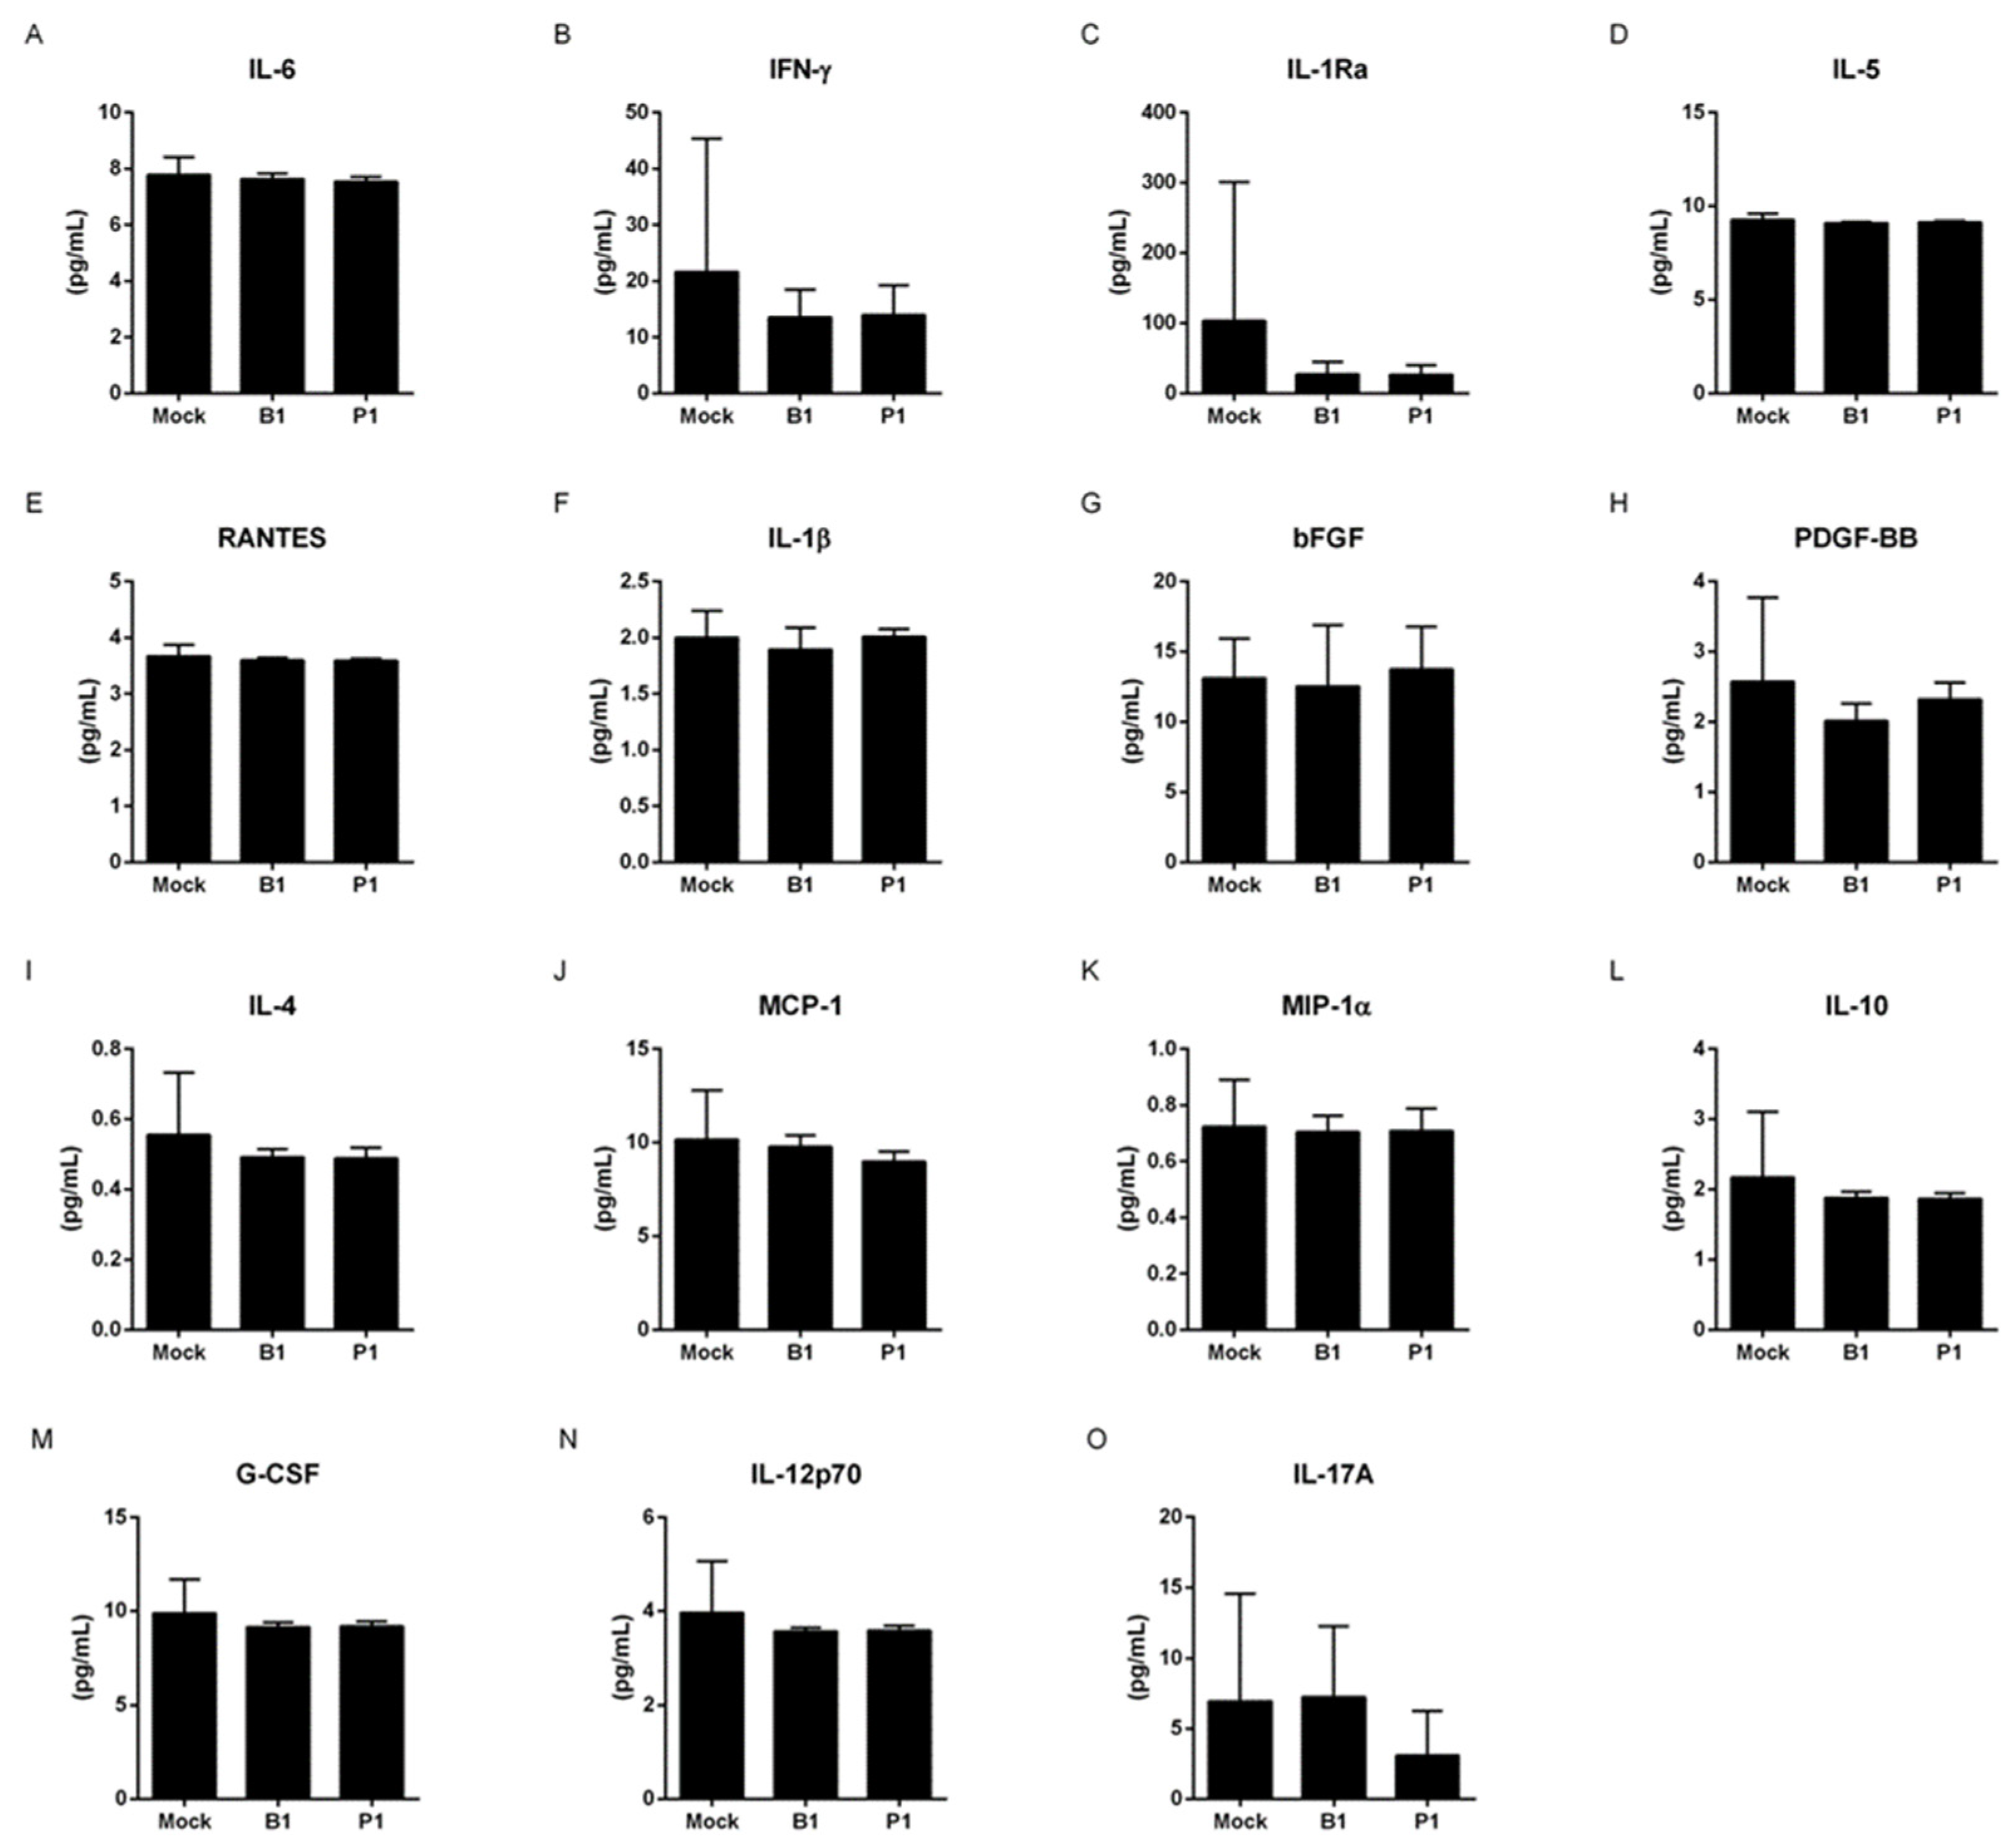
3.1. Both variants do not change the cytokine profile of macrophages and neutrophils
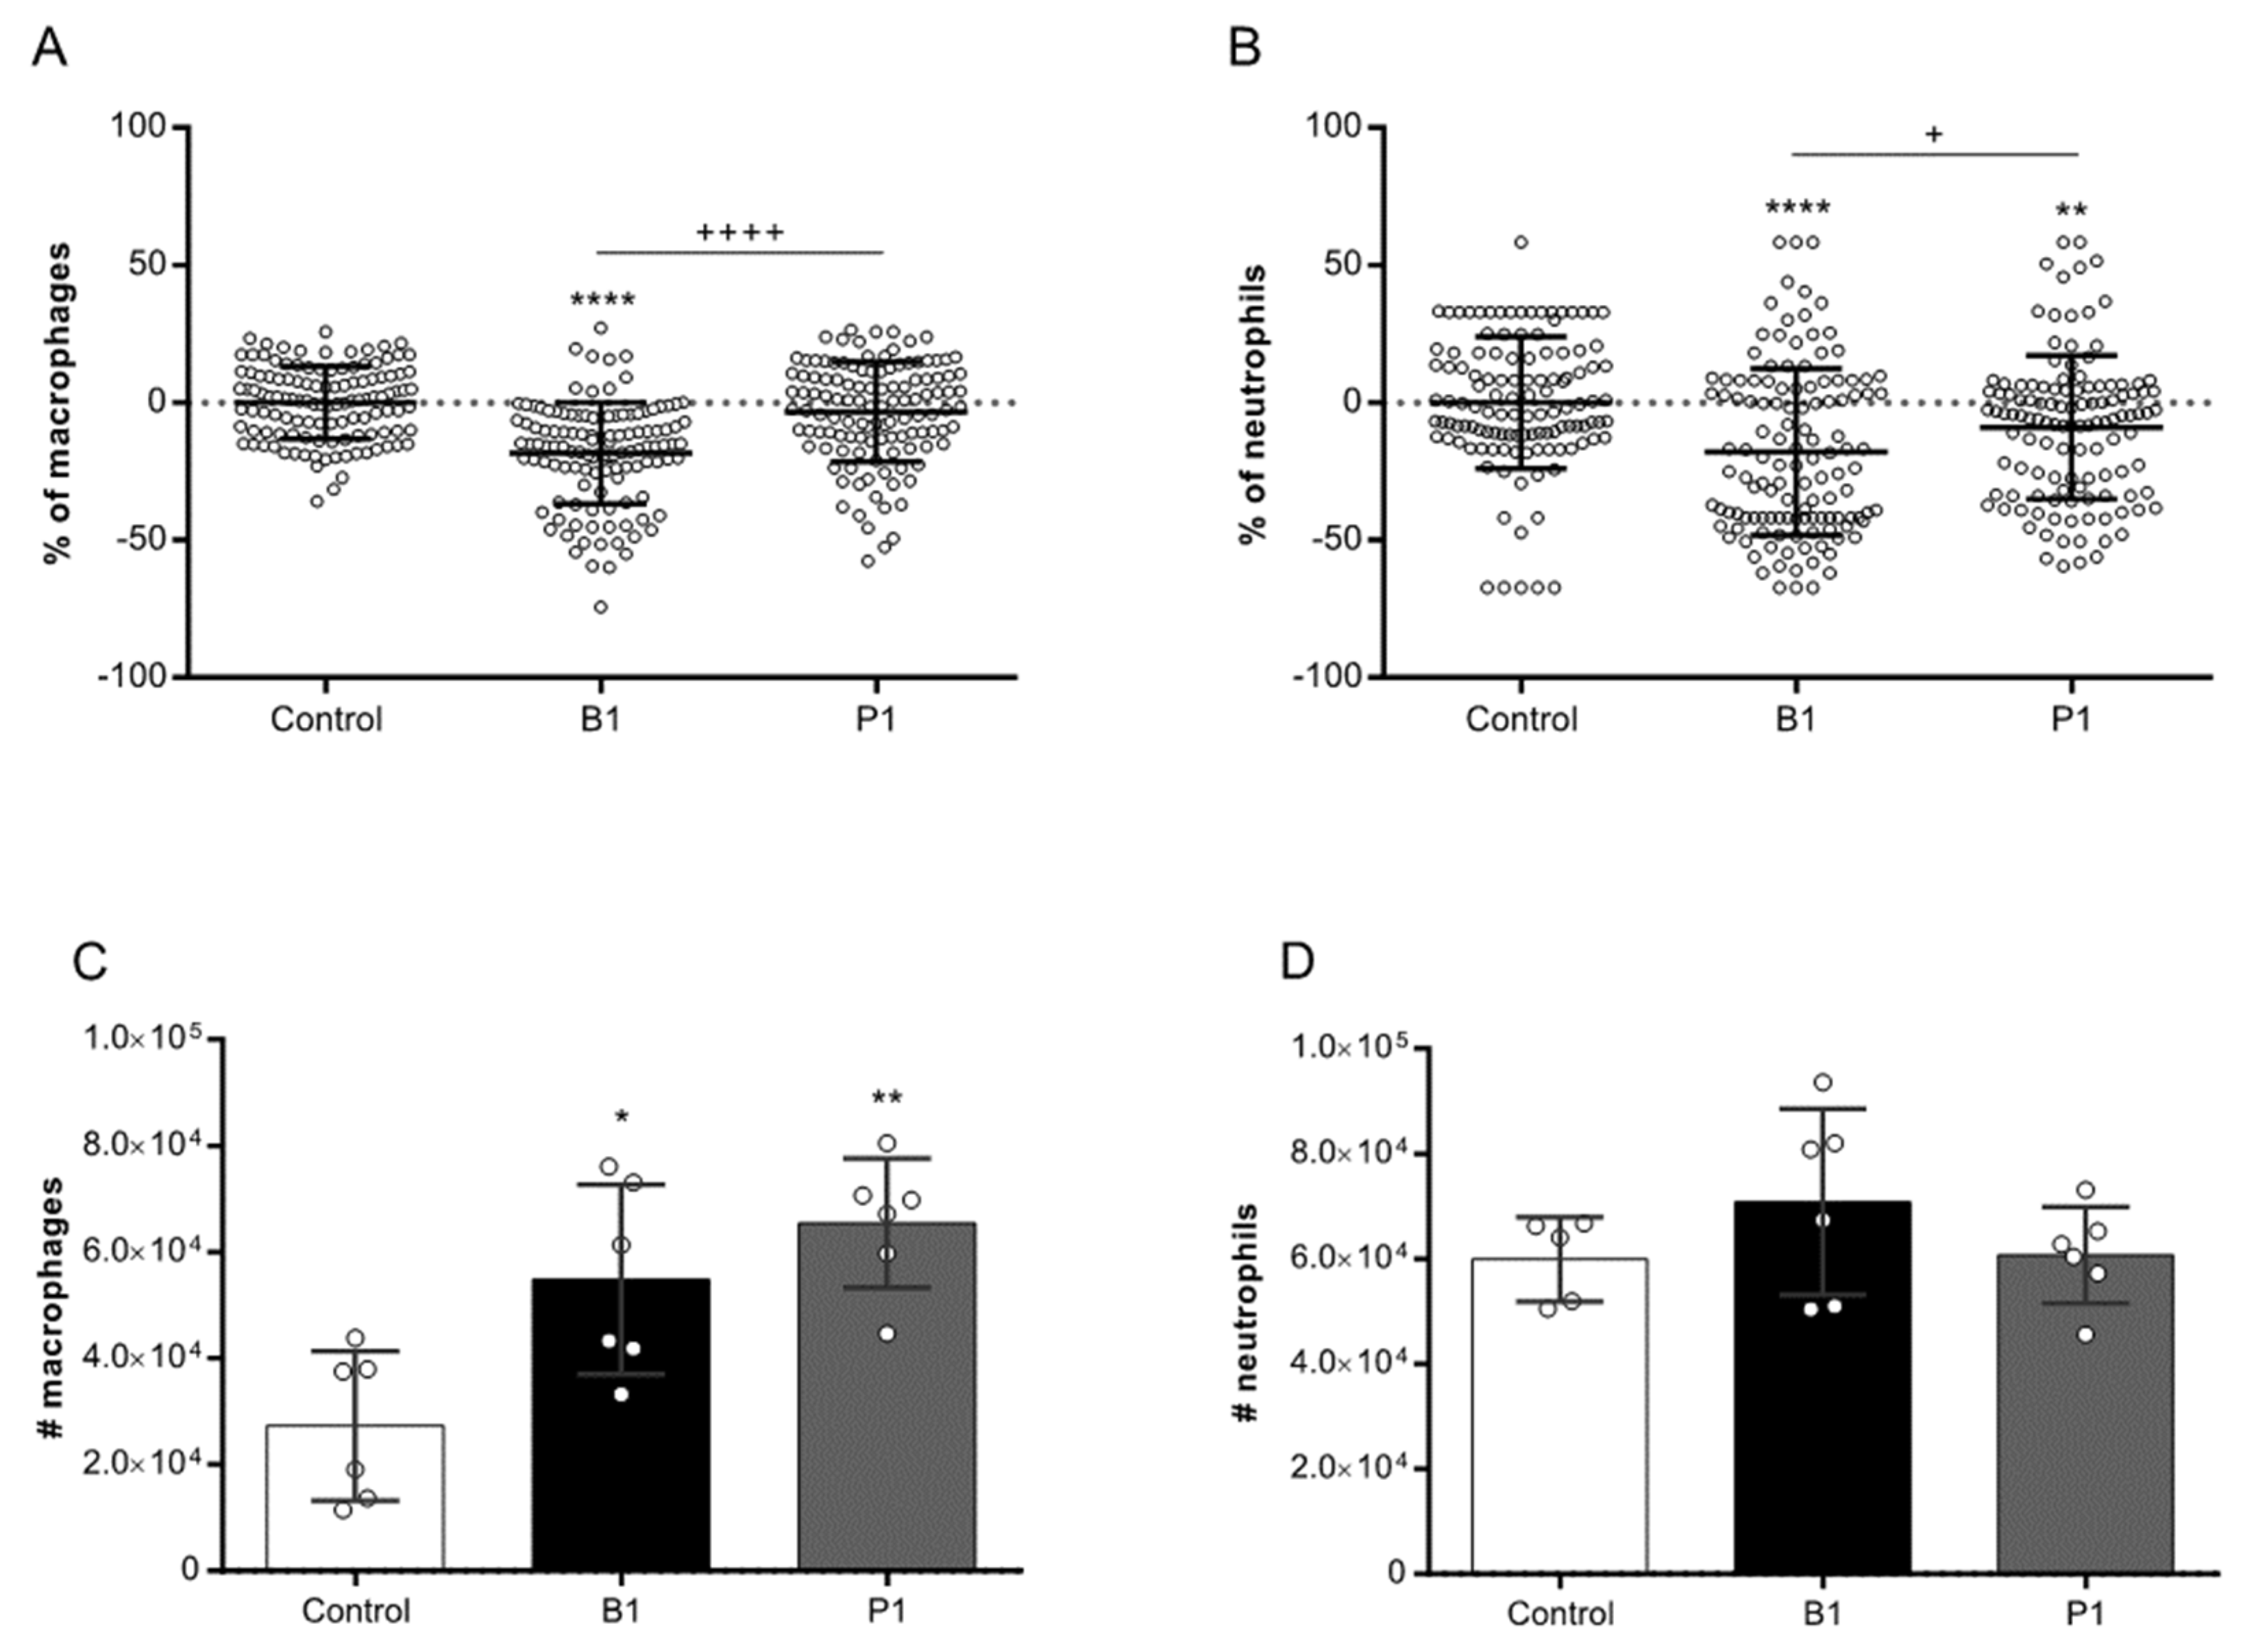
3.2. B.1 variant shows more cytopathogenic than the P.1 variant
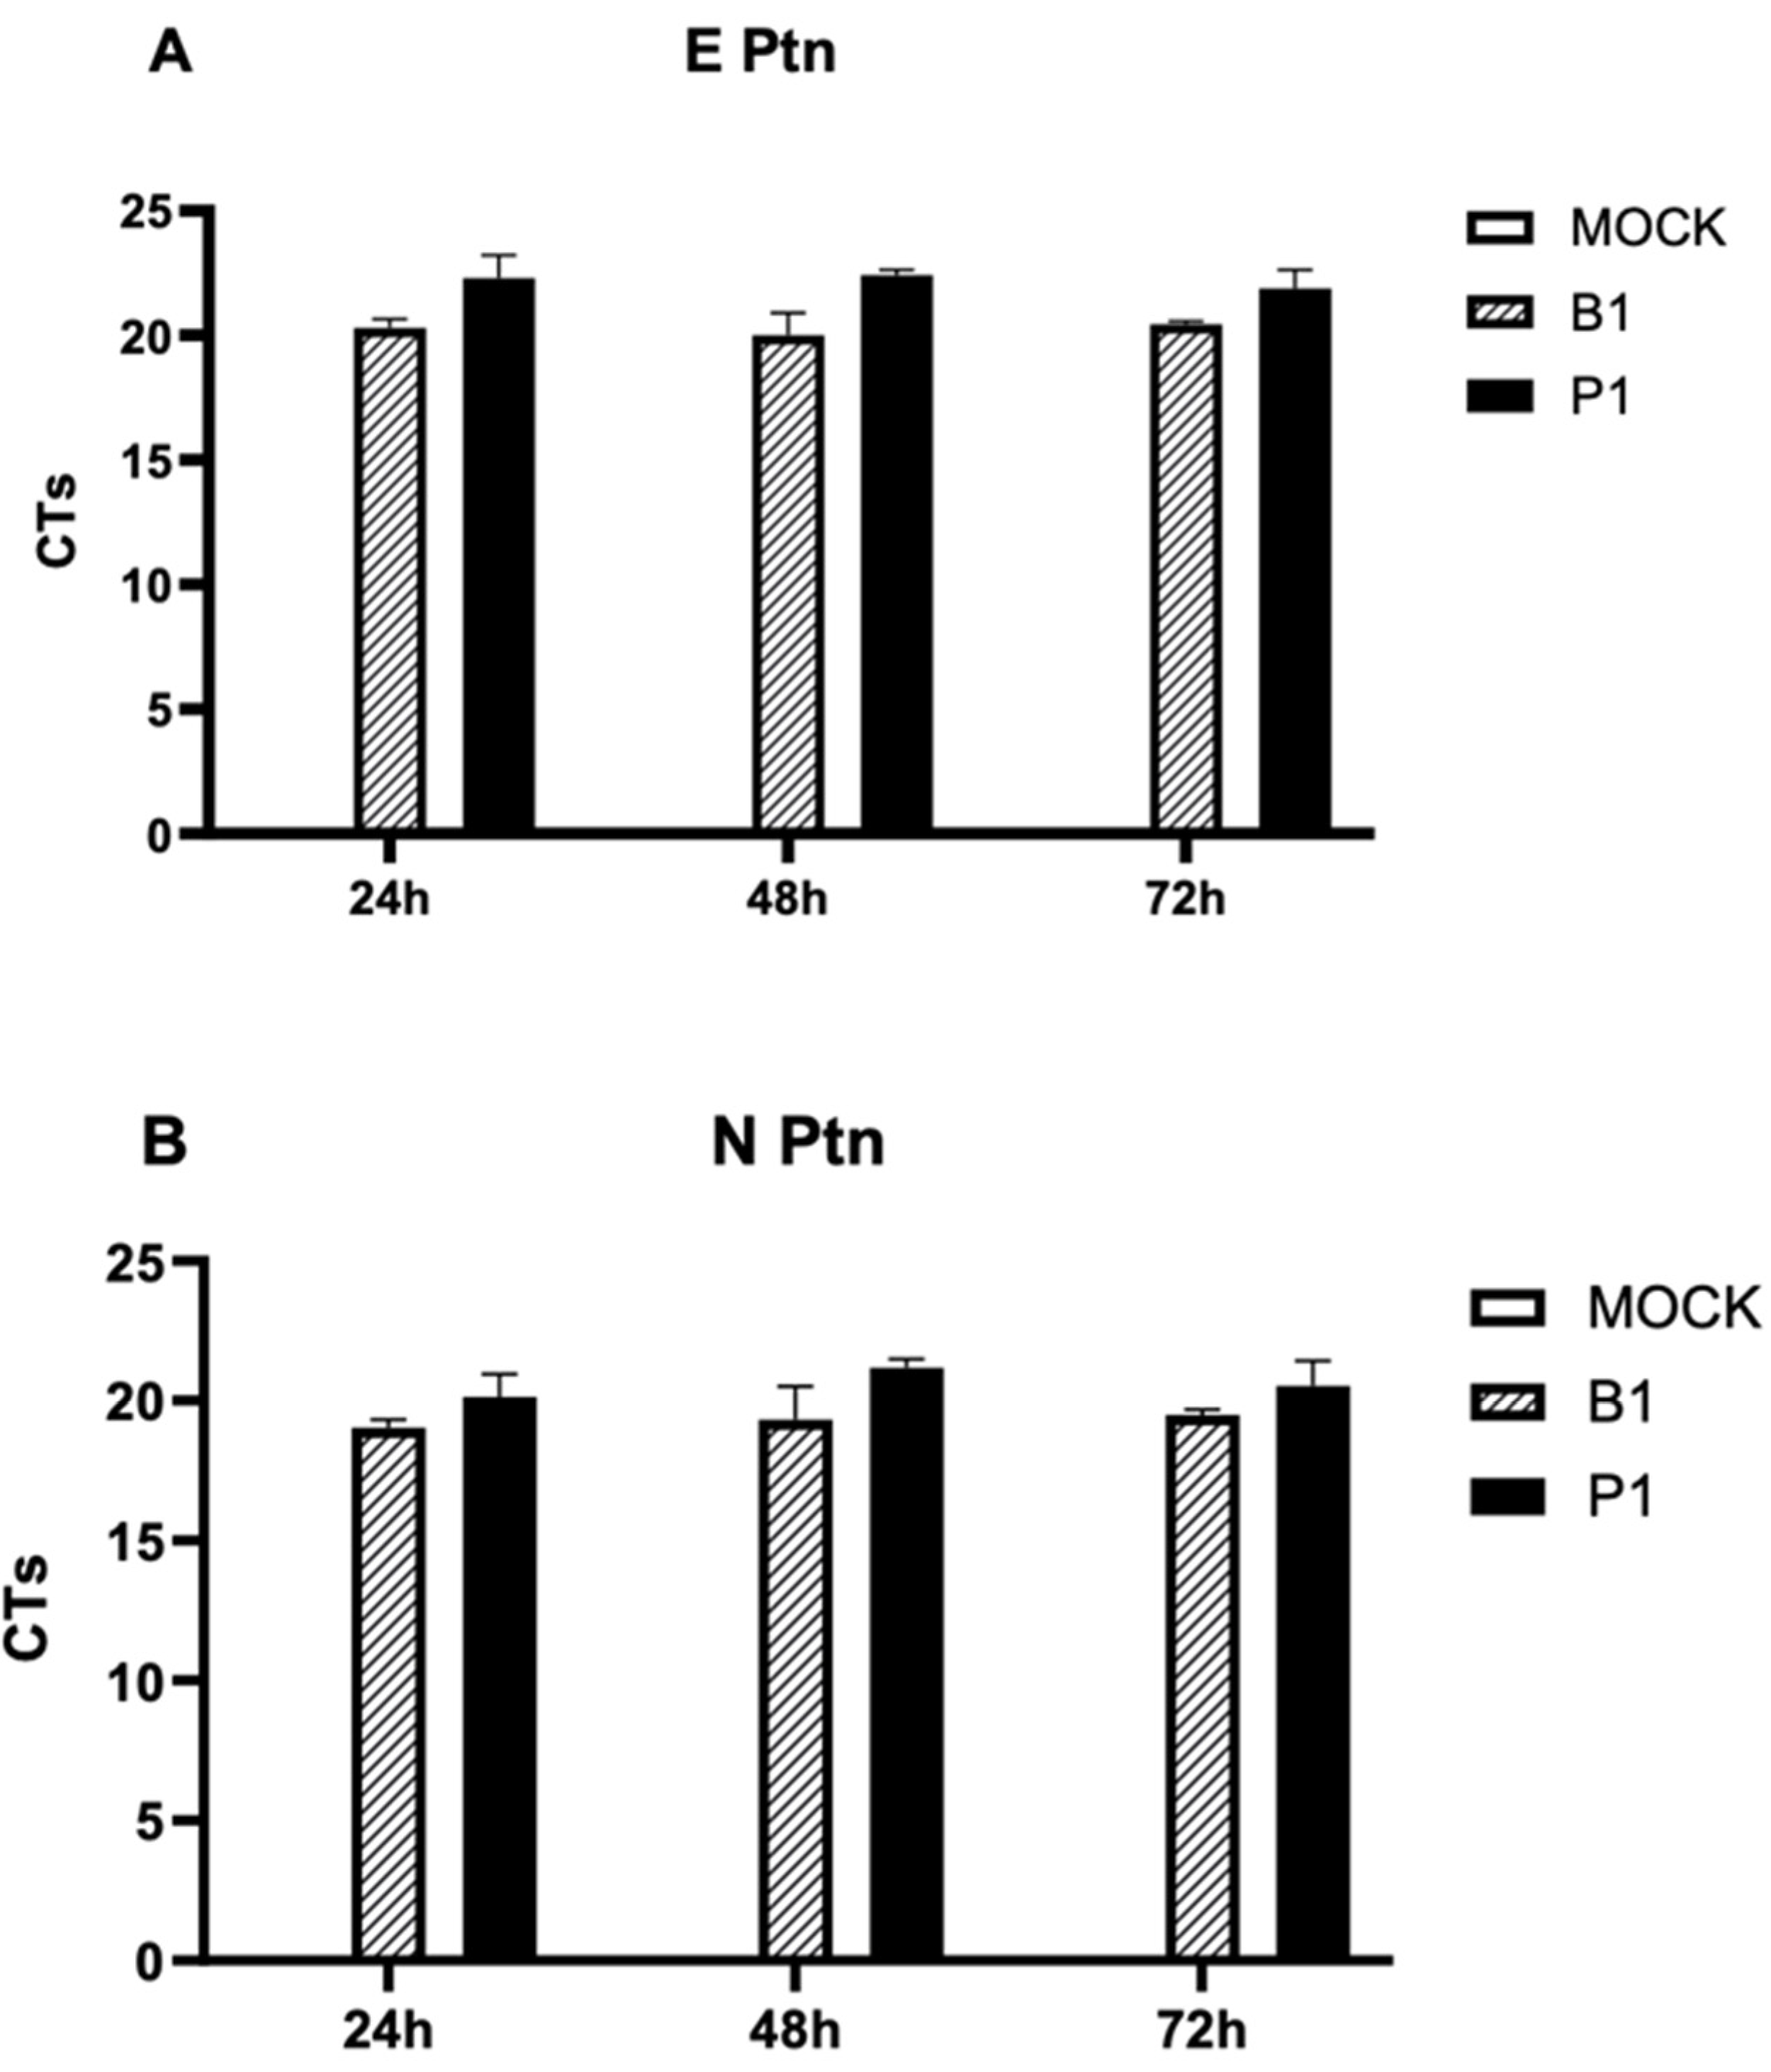
3.3. There is absence of viral replication within macrophage cells for both SARS-CoV-2 variants
3.4. Spike protein structure
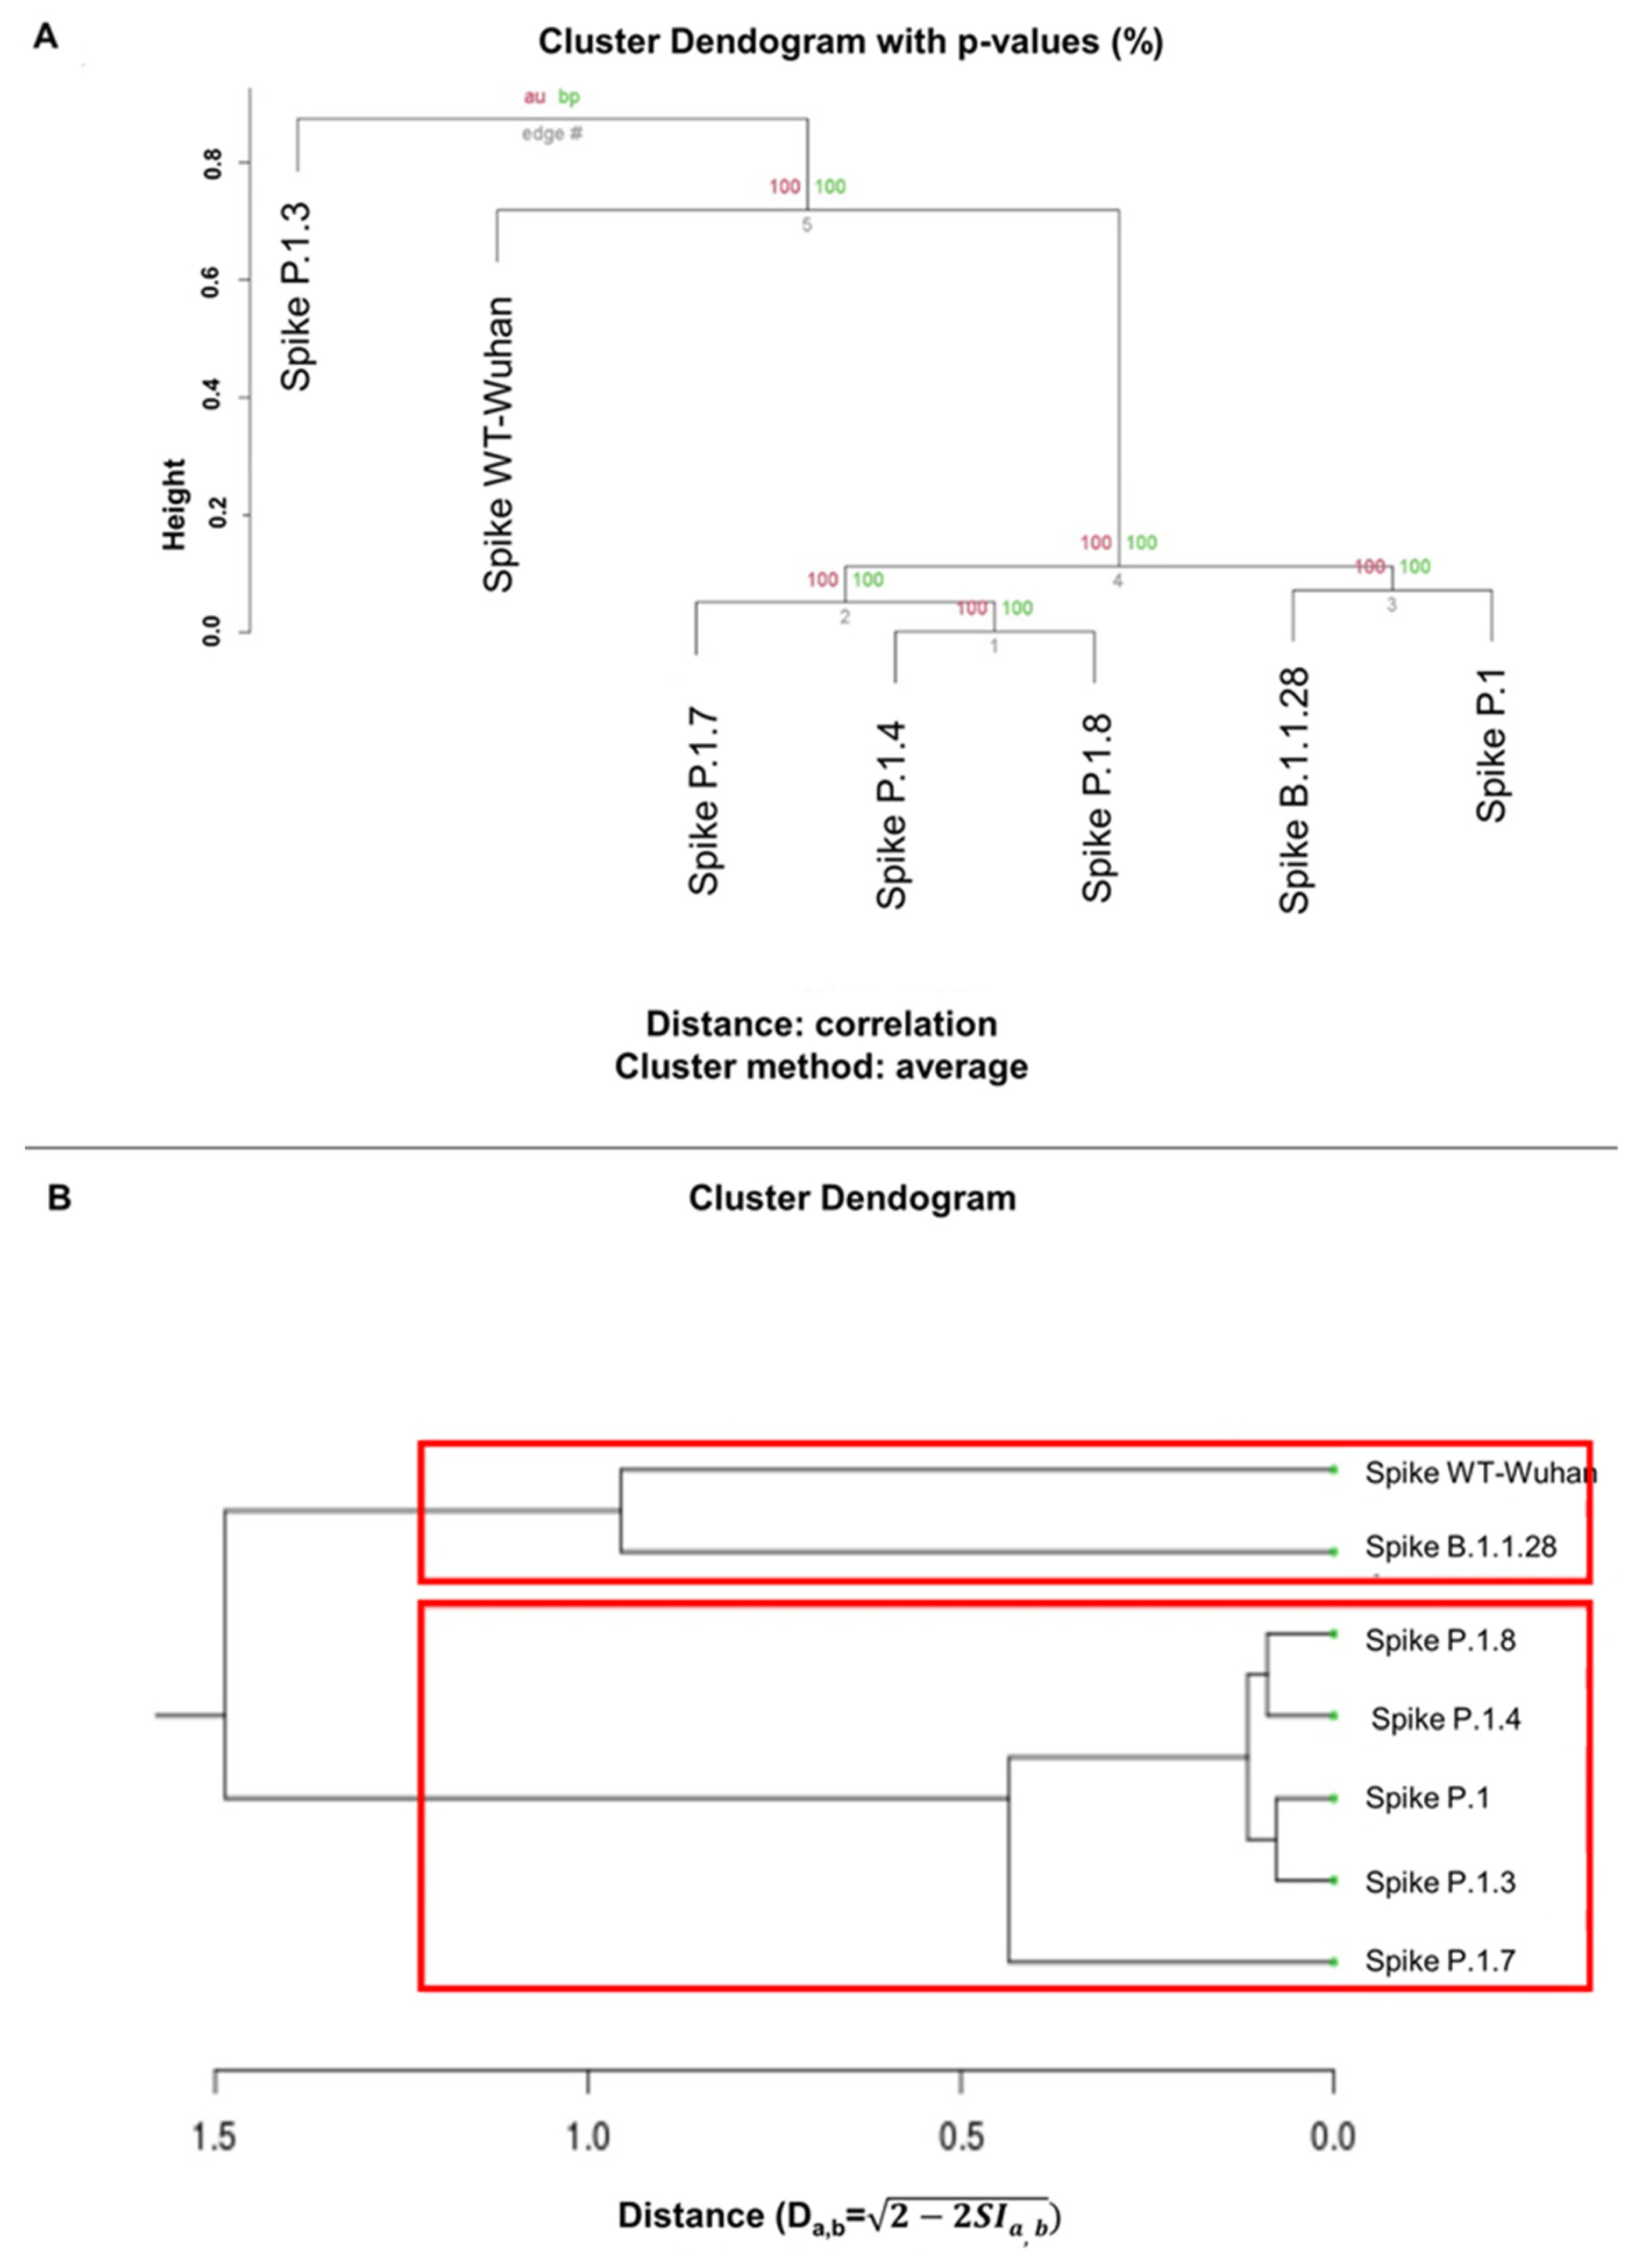
3.5. Clustering of the analysis of ASA and hydrophobicity of Spike proteins
4. Discussion
Author Contributions
Funding
Informed Consent Statement
Data Availability Statement
Conflicts of Interest
References
- Viruses, C.S.G.o.t.I.C.o.T.o. The species Severe acute respiratory syndrome-related coronavirus: classifying 2019-nCoV and naming it SARS-CoV-2. Nat Microbiol 2020, 5, 536–544. [Google Scholar] [CrossRef]
- Wang, D.; Hu, B.; Hu, C.; Zhu, F.; Liu, X.; Zhang, J.; Wang, B.; Xiang, H.; Cheng, Z.; Xiong, Y.; et al. Clinical Characteristics of 138 Hospitalized Patients With 2019 Novel Coronavirus-Infected Pneumonia in Wuhan, China. JAMA 2020, 323, 1061–1069. [Google Scholar] [CrossRef] [PubMed]
- Liu, Y.; Chen, D.; Hou, J.; Li, H.; Cao, D.; Guo, M.; Ling, Y.; Gao, M.; Zhou, Y.; Wan, Y.; et al. An inter-correlated cytokine network identified at the center of cytokine storm predicted COVID-19 prognosis. Cytokine 2021, 138, 155365. [Google Scholar] [CrossRef] [PubMed]
- Pacha, O.; Sallman, M.A.; Evans, S.E. COVID-19: a case for inhibiting IL-17? Nat Rev Immunol 2020, 20, 345–346. [Google Scholar] [CrossRef] [PubMed]
- Zizza, A.; Recchia, V.; Aloisi, A.; Guido, M. Clinical features of COVID-19 and SARS epidemics. A literature review. J Prev Med Hyg 2021, 62, E13–E24. [Google Scholar] [CrossRef] [PubMed]
- Lu, R.; Zhao, X.; Li, J.; Niu, P.; Yang, B.; Wu, H.; Wang, W.; Song, H.; Huang, B.; Zhu, N.; et al. Genomic characterisation and epidemiology of 2019 novel coronavirus: implications for virus origins and receptor binding. Lancet 2020, 395, 565–574. [Google Scholar] [CrossRef] [PubMed]
- Mousavizadeh, L.; Ghasemi, S. Genotype and phenotype of COVID-19: Their roles in pathogenesis. J Microbiol Immunol Infect 2021, 54, 159–163. [Google Scholar] [CrossRef] [PubMed]
- Hoffmann, M.; Kleine-Weber, H.; Schroeder, S.; Krüger, N.; Herrler, T.; Erichsen, S.; Schiergens, T.S.; Herrler, G.; Wu, N.H.; Nitsche, A.; et al. SARS-CoV-2 Cell Entry Depends on ACE2 and TMPRSS2 and Is Blocked by a Clinically Proven Protease Inhibitor. Cell 2020, 181, 271–280.e278. [Google Scholar] [CrossRef]
- Hu, B.; Guo, H.; Zhou, P.; Shi, Z.L. Characteristics of SARS-CoV-2 and COVID-19. Nat Rev Microbiol 2021, 19, 141–154. [Google Scholar] [CrossRef]
- Kim, Y.M.; Shin, E.C. Type I and III interferon responses in SARS-CoV-2 infection. Exp Mol Med 2021, 53, 750–760. [Google Scholar] [CrossRef]
- Lei, X.; Dong, X.; Ma, R.; Wang, W.; Xiao, X.; Tian, Z.; Wang, C.; Wang, Y.; Li, L.; Ren, L.; et al. Activation and evasion of type I interferon responses by SARS-CoV-2. Nat Commun 2020, 11, 3810. [Google Scholar] [CrossRef] [PubMed]
- Fajgenbaum, D.C.; June, C.H. Cytokine Storm. N Engl J Med 2020, 383, 2255–2273. [Google Scholar] [CrossRef] [PubMed]
- Liu, Y.; Du, X.; Chen, J.; Jin, Y.; Peng, L.; Wang, H.H.X.; Luo, M.; Chen, L.; Zhao, Y. Neutrophil-to-lymphocyte ratio as an independent risk factor for mortality in hospitalized patients with COVID-19. J Infect 2020, 81, e6–e12. [Google Scholar] [CrossRef] [PubMed]
- Muir, R.; Osbourn, M.; Dubois, A.V.; Doran, E.; Small, D.M.; Monahan, A.; O’Kane, C.M.; McAllister, K.; Fitzgerald, D.C.; Kissenpfennig, A.; et al. Innate Lymphoid Cells Are the Predominant Source of IL-17A during the Early Pathogenesis of Acute Respiratory Distress Syndrome. Am J Respir Crit Care Med 2016, 193, 407–416. [Google Scholar] [CrossRef] [PubMed]
- WHO. Tracking SARS-CoV-2 variants.
- Fujino, T.; Nomoto, H.; Kutsuna, S.; Ujiie, M.; Suzuki, T.; Sato, R.; Fujimoto, T.; Kuroda, M.; Wakita, T.; Ohmagari, N. Novel SARS-CoV-2 Variant in Travelers from Brazil to Japan. Emerg Infect Dis 2021, 27. [Google Scholar] [CrossRef] [PubMed]
- Volz, E.; Mishra, S.; Chand, M.; Barrett, J.C.; Johnson, R.; Geidelberg, L.; Hinsley, W.R.; Laydon, D.J.; Dabrera, G.; O’Toole, Á.; et al. Assessing transmissibility of SARS-CoV-2 lineage B.1.1.7 in England. Nature 2021, 593, 266–269. [Google Scholar] [CrossRef] [PubMed]
- Starr, T.N.; Greaney, A.J.; Hilton, S.K.; Ellis, D.; Crawford, K.H.D.; Dingens, A.S.; Navarro, M.J.; Bowen, J.E.; Tortorici, M.A.; Walls, A.C.; et al. Deep Mutational Scanning of SARS-CoV-2 Receptor Binding Domain Reveals Constraints on Folding and ACE2 Binding. Cell 2020, 182, 1295–1310.e1220. [Google Scholar] [CrossRef]
- Villoutreix, B.O.; Calvez, V.; Marcelin, A.G.; Khatib, A.M. In Silico Investigation of the New UK (B.1.1.7) and South African (501Y.V2) SARS-CoV-2 Variants with a Focus at the ACE2-Spike RBD Interface. Int J Mol Sci 2021, 22. [Google Scholar] [CrossRef]
- Janik, E.; Niemcewicz, M.; Podogrocki, M.; Majsterek, I.; Bijak, M. The Emerging Concern and Interest SARS-CoV-2 Variants. Pathogens 2021, 10. [Google Scholar] [CrossRef]
- Singh, J.; Samal, J.; Kumar, V.; Sharma, J.; Agrawal, U.; Ehtesham, N.Z.; Sundar, D.; Rahman, S.A.; Hira, S.; Hasnain, S.E. Structure-Function Analyses of New SARS-CoV-2 Variants B.1.1.7, B.1.351 and B.1.1.28.1: Clinical, Diagnostic, Therapeutic and Public Health Implications. Viruses 2021, 13. [Google Scholar] [CrossRef]
- Ramesh, S.; Govindarajulu, M.; Parise, R.S.; Neel, L.; Shankar, T.; Patel, S.; Lowery, P.; Smith, F.; Dhanasekaran, M.; Moore, T. Emerging SARS-CoV-2 Variants: A Review of Its Mutations, Its Implications and Vaccine Efficacy. Vaccines (Basel) 2021, 9. [Google Scholar] [CrossRef] [PubMed]
- Levi, J.E.; Oliveira, C.M.; Croce, B.D.; Telles, P.; Lopes, A.C.W.; Romano, C.M.; Lira, D.B.; de Resende, A.C.M.; Lopes, F.P.; Ruiz, A.A.; et al. Dynamics of SARS-CoV-2 Variants of Concern in Brazil, Early 2021. Front Public Health 2021, 9, 784300. [Google Scholar] [CrossRef] [PubMed]
- Faria, N.R.; Mellan, T.A.; Whittaker, C.; Claro, I.M.; Candido, D.D.S.; Mishra, S.; Crispim, M.A.E.; Sales, F.C.S.; Hawryluk, I.; McCrone, J.T.; et al. Genomics and epidemiology of the P.1 SARS-CoV-2 lineage in Manaus, Brazil. Science 2021, 372, 815–821. [Google Scholar] [CrossRef] [PubMed]
- Naveca, F.G.; Nascimento, V.; Souza, V.; Corado, A.L.; Nascimento, F.; Silva, G.; Mejía, M.C.; Brandão, M.J.; Costa, Á.; Duarte, D.; et al. Spread of Gamma (P.1) Sub-Lineages Carrying Spike Mutations Close to the Furin Cleavage Site and Deletions in the N-Terminal Domain Drives Ongoing Transmission of SARS-CoV-2 in Amazonas, Brazil. Microbiol Spectr 2022, 10, e0236621. [Google Scholar] [CrossRef] [PubMed]
- Planas, D.; Veyer, D.; Baidaliuk, A.; Staropoli, I.; Guivel-Benhassine, F.; Rajah, M.M.; Planchais, C.; Porrot, F.; Robillard, N.; Puech, J.; et al. Reduced sensitivity of SARS-CoV-2 variant Delta to antibody neutralization. Nature 2021, 596, 276–280. [Google Scholar] [CrossRef] [PubMed]
- McCarthy, K.R.; Rennick, L.J.; Nambulli, S.; Robinson-McCarthy, L.R.; Bain, W.G.; Haidar, G.; Duprex, W.P. Recurrent deletions in the SARS-CoV-2 spike glycoprotein drive antibody escape. Science 2021, 371, 1139–1142. [Google Scholar] [CrossRef] [PubMed]
- Wang, R.; Zhang, Q.; Ge, J.; Ren, W.; Zhang, R.; Lan, J.; Ju, B.; Su, B.; Yu, F.; Chen, P.; et al. Analysis of SARS-CoV-2 variant mutations reveals neutralization escape mechanisms and the ability to use ACE2 receptors from additional species. Immunity 2021, 54, 1611–1621.e1615. [Google Scholar] [CrossRef] [PubMed]
- Liu, Y.; Liu, J.; Johnson, B.A.; Xia, H.; Ku, Z.; Schindewolf, C.; Widen, S.G.; An, Z.; Weaver, S.C.; Menachery, V.D.; et al. Delta spike P681R mutation enhances SARS-CoV-2 fitness over Alpha variant. Cell Rep 2022, 39, 110829. [Google Scholar] [CrossRef] [PubMed]
- Saito, A.; Irie, T.; Suzuki, R.; Maemura, T.; Nasser, H.; Uriu, K.; Kosugi, Y.; Shirakawa, K.; Sadamasu, K.; Kimura, I.; et al. Enhanced fusogenicity and pathogenicity of SARS-CoV-2 Delta P681R mutation. Nature 2022, 602, 300–306. [Google Scholar] [CrossRef]
- Mlcochova, P.; Kemp, S.A.; Dhar, M.S.; Papa, G.; Meng, B.; Ferreira, I.A.T.M.; Datir, R.; Collier, D.A.; Albecka, A.; Singh, S.; et al. SARS-CoV-2 B.1.617.2 Delta variant replication and immune evasion. Nature 2021, 599, 114–119. [Google Scholar] [CrossRef]
- Challen, R.; Brooks-Pollock, E.; Read, J.M.; Dyson, L.; Tsaneva-Atanasova, K.; Danon, L. Risk of mortality in patients infected with SARS-CoV-2 variant of concern 202012/1: matched cohort study. BMJ 2021, 372, n579. [Google Scholar] [CrossRef] [PubMed]
- Davies, N.G.; Jarvis, C.I.; Edmunds, W.J.; Jewell, N.P.; Diaz-Ordaz, K.; Keogh, R.H.; Group, C.C.-W. Increased mortality in community-tested cases of SARS-CoV-2 lineage B.1.1.7. Nature 2021, 593, 270–274. [Google Scholar] [CrossRef] [PubMed]
- Ong, S.W.X.; Chiew, C.J.; Ang, L.W.; Mak, T.M.; Cui, L.; Toh, M.P.H.S.; Lim, Y.D.; Lee, P.H.; Lee, T.H.; Chia, P.Y.; et al. Clinical and virological features of SARS-CoV-2 variants of concern: a retrospective cohort study comparing B.1.1.7 (Alpha), B.1.315 (Beta), and B.1.617.2 (Delta). Clin Infect Dis 2021. [Google Scholar] [CrossRef]
- Loconsole, D.; Centrone, F.; Morcavallo, C.; Campanella, S.; Accogli, M.; Sallustio, A.; Peccarisi, D.; Stufano, A.; Lovreglio, P.; Chironna, M. Changing Features of COVID-19: Characteristics of Infections with the SARS-CoV-2 Delta (B.1.617.2) and Alpha (B.1.1.7) Variants in Southern Italy. Vaccines (Basel) 2021, 9. [Google Scholar] [CrossRef] [PubMed]
- Shoji, K.; Akiyama, T.; Tsuzuki, S.; Matsunaga, N.; Asai, Y.; Suzuki, S.; Iwamoto, N.; Funaki, T.; Ohmagari, N. Comparison of the clinical characteristics and outcomes of COVID-19 in children before and after the emergence of Delta variant of concern in Japan. J Infect Chemother 2022, 28, 591–594. [Google Scholar] [CrossRef] [PubMed]
- Hu, Z.; Huang, X.; Zhang, J.; Fu, S.; Ding, D.; Tao, Z. Differences in Clinical Characteristics Between Delta Variant and Wild-Type SARS-CoV-2 Infected Patients. Front Med (Lausanne) 2021, 8, 792135. [Google Scholar] [CrossRef] [PubMed]
- Funk, T.; Pharris, A.; Spiteri, G.; Bundle, N.; Melidou, A.; Carr, M.; Gonzalez, G.; Garcia-Leon, A.; Crispie, F.; O’Connor, L.; et al. Characteristics of SARS-CoV-2 variants of concern B.1.1.7, B.1.351 or P.1: data from seven EU/EEA countries, weeks 38/2020 to 10/2021. Euro Surveill 2021, 26. [Google Scholar] [CrossRef] [PubMed]
- Fisman, D.N.; Tuite, A.R. Evaluation of the relative virulence of novel SARS-CoV-2 variants: a retrospective cohort study in Ontario, Canada. CMAJ 2021, 193, E1619–E1625. [Google Scholar] [CrossRef]
- Veneti, L.; Seppälä, E.; Larsdatter Storm, M.; Valcarcel Salamanca, B.; Alnes Buanes, E.; Aasand, N.; Naseer, U.; Bragstad, K.; Hungnes, O.; Bøås, H.; et al. Increased risk of hospitalisation and intensive care admission associated with reported cases of SARS-CoV-2 variants B.1.1.7 and B.1.351 in Norway, December 2020 -May 2021. PLoS One 2021, 16, e0258513. [Google Scholar] [CrossRef]
- Cantón, R.; De Lucas Ramos, P.; García-Botella, A.; García-Lledó, A.; Gómez-Pavón, J.; González Del Castillo, J.; Hernández-Sampelayo, T.; Martín-Delgado, M.C.; Martín Sánchez, F.J.; Martínez-Sellés, M.; et al. New variants of SARS-CoV-2. Rev Esp Quimioter 2021, 34, 419–428. [Google Scholar] [CrossRef]
- Bouzid, D.; Visseaux, B.; Kassasseya, C.; Daoud, A.; Fémy, F.; Hermand, C.; Truchot, J.; Beaune, S.; Javaud, N.; Peyrony, O.; et al. Comparison of Patients Infected With Delta Versus Omicron COVID-19 Variants Presenting to Paris Emergency Departments : A Retrospective Cohort Study. Ann Intern Med 2022. [Google Scholar] [CrossRef] [PubMed]
- Maslo, C.; Friedland, R.; Toubkin, M.; Laubscher, A.; Akaloo, T.; Kama, B. Characteristics and Outcomes of Hospitalized Patients in South Africa During the COVID-19 Omicron Wave Compared With Previous Waves. JAMA 2022, 327, 583–584. [Google Scholar] [CrossRef] [PubMed]
- Wolter, N.; Jassat, W.; Walaza, S.; Welch, R.; Moultrie, H.; Groome, M.; Amoako, D.G.; Everatt, J.; Bhiman, J.N.; Scheepers, C.; et al. Early assessment of the clinical severity of the SARS-CoV-2 omicron variant in South Africa: a data linkage study. Lancet 2022, 399, 437–446. [Google Scholar] [CrossRef] [PubMed]
- Modes, M.E.; Directo, M.P.; Melgar, M.; Johnson, L.R.; Yang, H.; Chaudhary, P.; Bartolini, S.; Kho, N.; Noble, P.W.; Isonaka, S.; et al. Clinical Characteristics and Outcomes Among Adults Hospitalized with Laboratory-Confirmed SARS-CoV-2 Infection During Periods of B.1.617.2 (Delta) and B.1.1.529 (Omicron) Variant Predominance - One Hospital, California, July 15-September 23, 2021, and December 21, 2021-January 27, 2022. MMWR Morb Mortal Wkly Rep 2022, 71, 217–223. [Google Scholar] [CrossRef] [PubMed]
- Houhamdi, L.; Gautret, P.; Hoang, V.T.; Fournier, P.E.; Colson, P.; Raoult, D. Characteristics of the first 1119 SARS-CoV-2 Omicron variant cases, in Marseille, France, November-December 2021. J Med Virol 2022, 94, 2290–2295. [Google Scholar] [CrossRef]
- Kim, M.K.; Lee, B.; Choi, Y.Y.; Um, J.; Lee, K.S.; Sung, H.K.; Kim, Y.; Park, J.S.; Lee, M.; Jang, H.C.; et al. Clinical Characteristics of 40 Patients Infected With the SARS-CoV-2 Omicron Variant in Korea. J Korean Med Sci 2022, 37, e31. [Google Scholar] [CrossRef] [PubMed]
- Zhang, J.; Chen, N.; Zhao, D.; Hu, Z.; Tao, Z. Clinical Characteristics of COVID-19 Patients Infected by the Omicron Variant of SARS-CoV-2. Front Med (Lausanne) 2022, 9, 912367. [Google Scholar] [CrossRef] [PubMed]
- Imai, M.; Halfmann, P.J.; Yamayoshi, S.; Iwatsuki-Horimoto, K.; Chiba, S.; Watanabe, T.; Nakajima, N.; Ito, M.; Kuroda, M.; Kiso, M.; et al. Characterization of a new SARS-CoV-2 variant that emerged in Brazil. Proc Natl Acad Sci U S A 2021, 118. [Google Scholar] [CrossRef]
- Arcanjo, A.; Logullo, J.; Menezes, C.C.B.; de Souza Carvalho Giangiarulo, T.C.; Dos Reis, M.C.; de Castro, G.M.M.; da Silva Fontes, Y.; Todeschini, A.R.; Freire-de-Lima, L.; Decoté-Ricardo, D.; et al. The emerging role of neutrophil extracellular traps in severe acute respiratory syndrome coronavirus 2 (COVID-19). Sci Rep 2020, 10, 19630. [Google Scholar] [CrossRef]
- Coperchini, F.; Chiovato, L.; Rotondi, M. Interleukin-6, CXCL10 and Infiltrating Macrophages in COVID-19-Related Cytokine Storm: Not One for All But All for One! Front Immunol 2021, 12, 668507. [Google Scholar] [CrossRef]
- Khare, S.; Gurry, C.; Freitas, L.; Schultz, M.B.; Bach, G.; Diallo, A.; Akite, N.; Ho, J.; Lee, R.T.; Yeo, W.; et al. GISAID’s Role in Pandemic Response. China CDC Wkly 2021, 3, 1049–1051. [Google Scholar] [CrossRef] [PubMed]
- Vanderbeke, L.; Van Mol, P.; Van Herck, Y.; De Smet, F.; Humblet-Baron, S.; Martinod, K.; Antoranz, A.; Arijs, I.; Boeckx, B.; Bosisio, F.M.; et al. Monocyte-driven atypical cytokine storm and aberrant neutrophil activation as key mediators of COVID-19 disease severity. Nat Commun 2021, 12, 4117. [Google Scholar] [CrossRef] [PubMed]
- Niles, M.A.; Gogesch, P.; Kronhart, S.; Ortega Iannazzo, S.; Kochs, G.; Waibler, Z.; Anzaghe, M. Macrophages and Dendritic Cells Are Not the Major Source of Pro-Inflammatory Cytokines Upon SARS-CoV-2 Infection. Front Immunol 2021, 12, 647824. [Google Scholar] [CrossRef] [PubMed]
- Percivalle, E.; Sammartino, J.C.; Cassaniti, I.; Arbustini, E.; Urtis, M.; Smirnova, A.; Concardi, M.; Belgiovine, C.; Ferrari, A.; Lilleri, D.; et al. Macrophages and Monocytes: "Trojan Horses" in COVID-19. Viruses 2021, 13. [Google Scholar] [CrossRef] [PubMed]
- Boumaza, A.; Gay, L.; Mezouar, S.; Bestion, E.; Diallo, A.B.; Michel, M.; Desnues, B.; Raoult, D.; La Scola, B.; Halfon, P.; et al. Monocytes and Macrophages, Targets of Severe Acute Respiratory Syndrome Coronavirus 2: The Clue for Coronavirus Disease 2019 Immunoparalysis. J Infect Dis 2021, 224, 395–406. [Google Scholar] [CrossRef] [PubMed]
- Lin, L.; Liu, Y.; Tang, X.; He, D. The Disease Severity and Clinical Outcomes of the SARS-CoV-2 Variants of Concern. Front Public Health 2021, 9, 775224. [Google Scholar] [CrossRef]
- Schulte-Schrepping, J.; Reusch, N.; Paclik, D.; Baßler, K.; Schlickeiser, S.; Zhang, B.; Krämer, B.; Krammer, T.; Brumhard, S.; Bonaguro, L.; et al. Severe COVID-19 Is Marked by a Dysregulated Myeloid Cell Compartment. Cell 2020, 182, 1419–1440.e1423. [Google Scholar] [CrossRef]
- Chevrier, S.; Zurbuchen, Y.; Cervia, C.; Adamo, S.; Raeber, M.E.; de Souza, N.; Sivapatham, S.; Jacobs, A.; Bachli, E.; Rudiger, A.; et al. A distinct innate immune signature marks progression from mild to severe COVID-19. Cell Rep Med 2021, 2, 100166. [Google Scholar] [CrossRef]
- Burnett, C.E.; Okholm, T.L.H.; Tenvooren, I.; Marquez, D.M.; Tamaki, S.; Munoz Sandoval, P.; Willmore, A.; Hendrickson, C.M.; Kangelaris, K.N.; Langelier, C.R.; et al. Mass cytometry reveals a conserved immune trajectory of recovery in hospitalized COVID-19 patients. Immunity 2022, 55, 1284–1298.e1283. [Google Scholar] [CrossRef]
- Ferrante, L.; Duczmal, L.; Steinmetz, W.A.; Almeida, A.C.L.; Leão, J.; Vassão, R.C.; Tupinambás, U.; Fearnside, P.M. How Brazil’s President turned the country into a global epicenter of COVID-19. J Public Health Policy 2021, 42, 439–451. [Google Scholar] [CrossRef]
- Yang, N.; Wang, C.; Huang, J.; Dong, J.; Ye, J.; Fu, Y.; Xu, D.; Cao, G.; Qian, G. Clinical and Pulmonary CT Characteristics of Patients Infected With the SARS-CoV-2 Omicron Variant Compared With Those of Patients Infected With the Alpha Viral Strain. Front Public Health 2022, 10, 931480. [Google Scholar] [CrossRef] [PubMed]
- Gupta, R. SARS-CoV-2 Omicron spike mediated immune escape and tropism shift. Res Sq 2022. [Google Scholar] [CrossRef]
- Halfmann, P.J.; Iida, S.; Iwatsuki-Horimoto, K.; Maemura, T.; Kiso, M.; Scheaffer, S.M.; Darling, T.L.; Joshi, A.; Loeber, S.; Singh, G.; et al. SARS-CoV-2 Omicron virus causes attenuated disease in mice and hamsters. Nature 2022, 603, 687–692. [Google Scholar] [CrossRef] [PubMed]
- Hui, K.P.Y.; Ho, J.C.W.; Cheung, M.C.; Ng, K.C.; Ching, R.H.H.; Lai, K.L.; Kam, T.T.; Gu, H.; Sit, K.Y.; Hsin, M.K.Y.; et al. SARS-CoV-2 Omicron variant replication in human bronchus and lung ex vivo. Nature 2022, 603, 715–720. [Google Scholar] [CrossRef] [PubMed]
- Rego, N.B.; Xi, E.; Patel, A.J. Identifying hydrophobic protein patches to inform protein interaction interfaces. Proc Natl Acad Sci U S A 2021, 118. [Google Scholar] [CrossRef] [PubMed]
- Shashikala, H.B.M.; Chakravorty, A.; Alexov, E. Modeling Electrostatic Force in Protein-Protein Recognition. Front Mol Biosci 2019, 6, 94. [Google Scholar] [CrossRef]
- Vascon, F.; Gasparotto, M.; Giacomello, M.; Cendron, L.; Bergantino, E.; Filippini, F.; Righetto, I. Protein electrostatics: From computational and structural analysis to discovery of functional fingerprints and biotechnological design. Comput Struct Biotechnol J 2020, 18, 1774–1789. [Google Scholar] [CrossRef]
- Peacock, T.P.; Goldhill, D.H.; Zhou, J.; Baillon, L.; Frise, R.; Swann, O.C.; Kugathasan, R.; Penn, R.; Brown, J.C.; Sanchez-David, R.Y.; et al. The furin cleavage site in the SARS-CoV-2 spike protein is required for transmission in ferrets. Nat Microbiol 2021, 6, 899–909. [Google Scholar] [CrossRef]
- Alizon, S.; Sofonea, M.T. SARS-CoV-2 virulence evolution: Avirulence theory, immunity and trade-offs. J Evol Biol 2021, 34, 1867–1877. [Google Scholar] [CrossRef]
- Nicolete, V.C.; Rodrigues, P.T.; Fernandes, A.R.J.; Corder, R.M.; Tonini, J.; Buss, L.F.; Sales, F.C.; Faria, N.R.; Sabino, E.C.; Castro, M.C.; et al. Epidemiology of COVID-19 after Emergence of SARS-CoV-2 Gamma Variant, Brazilian Amazon, 2020-2021. Emerg Infect Dis 2022, 28, 709–712. [Google Scholar] [CrossRef]
Disclaimer/Publisher’s Note: The statements, opinions and data contained in all publications are solely those of the individual author(s) and contributor(s) and not of MDPI and/or the editor(s). MDPI and/or the editor(s) disclaim responsibility for any injury to people or property resulting from any ideas, methods, instructions or products referred to in the content. |
© 2023 by the authors. Licensee MDPI, Basel, Switzerland. This article is an open access article distributed under the terms and conditions of the Creative Commons Attribution (CC BY) license (https://creativecommons.org/licenses/by/4.0/).


