Submitted:
11 July 2023
Posted:
13 July 2023
You are already at the latest version
Abstract
Emotions play a vital role in understanding human behavior and interpersonal relationships. The ability to recognize emotions through Electroencephalogram (EEG) signals offers an alternative to traditional methods, such as questionnaires, enabling the identification of emotional states in a non-intrusive manner. Automatic emotion recognition holds great potential, eliminating the need for clinical examinations or physical visits, thereby contributing significantly to the advancement of Brain-Computer Interface (BCI) technology. However, one of the key challenges lies in effectively selecting and extracting relevant features from the EEG signal to establish meaningful distinctions between different emotional states. The process of feature selection is often time-consuming and demanding. In this research, we propose a groundbreaking approach for automatically identifying three emotional states (positive, negative, and neutral) by leveraging auditory stimulation of EEG signals. Our novel method directly applies the raw EEG signal to a Convolutional Neural Network-Long Short Term Memory (CNN-LSTM) architecture, bypassing the conventional feature extraction and selection steps. This unconventional approach offers a significant departure from existing literature. Our proposed network architecture comprises ten convolutional layers, followed by three LSTM layers and two fully connected layers. Through extensive simulations and evaluations on 12 active channels, our algorithm demonstrates exceptional performance, achieving an accuracy of 97.42\% and 95.23\% for the binary classification of negative and positive emotions, as well as a Cohen's Kappa coefficient of 0.96 and 0.93 for the three-class classification (negative, neutral, and positive), respectively. These promising results highlight the efficacy of our novel methodology and its potential implications in advancing emotion recognition using EEG signals.
Keywords:
emotion recognition
; auditory stimulation
; EEG signals
; convolutional neural network (CNN)
; long short term memory (LSTM)
; brain-computer interface (BCI)
This work was not supported by any organization.
1. Introduction
Emotions play a significant role in human life. Despite extensive research into the nature of emotions, there is still no general consensus on what emotions are and how they can be displayed. Paul Ekman has proposed a relatively comprehensive definition of emotions. He considers emotions to be the result of interactions between mental factors, environmental factors, and neural and hormonal processes in the body [1,2,3]. Emotion is a physiological and brain-related mental state that is associated with a wide range of feelings, behaviors, and thoughts.
Therefore, feeling can be considered a subset of emotion, and this study focuses on emotion recognition[4]. Emotions, in a way, shape various aspects of human life, such as daily experiences, perception, and the performance of daily tasks such as learning, communication, and even daily decision-making. Emotion recognition has played a crucial role in human life, and most traditional and ancient studies in this field have relied on physical parameters such as facial expressions and body movements. Over time and with the advancement of science and technology, conditions have been created to directly obtain information from the brain. There are various options for obtaining brain information, including functional magnetic resonance imaging (fMRI), electroencephalography (EEG), and near-infrared spectroscopy (NIRS). Among these, the use of EEG signals is more common due to its advantages over other signal acquisition methods. EEG has two main advantages: high temporal resolution and low cost of measurement equipmentdimensions[5].
Understanding emotions through EEG signals enables the detection of emotional states without traditional methods such as questionnaires, making it possible to express emotions in individuals without clinical examinations and visits, which plays a crucial role in completing the puzzle of brain-computer interaction (BCI)[5]. There are various methods for inducing emotions in humans. Watching emotional films, viewing emotional images, mental imagery, and emotional music are some of the methods of inducing emotions[6].
In the field of emotion recognition through EEG, there is generally not much agreement on the suitability of features, and only a few studies have compared different sets of features. For example, in a study [7], five individuals were tested using emotionally evocative stimuli presented through images. Each image was shown to the participants for 6 seconds from a distance of 5 meters using a display screen. Considering a 15-second interval between the induction of emotional states and a 2-second interval between image presentations, the total recording time was 20 minutes, during which three emotions (pleasantness, neutrality, and unpleasantness) were examined. Additionally, in this study, two sets of features were compared, and using Fast Fourier Transform and extracting several statistical features with Support Vector Machine (SVM) as a classifier for both sets, a correct recognition rate of 66% was reported.
In [8], two emotional classes were tested in a calm state with open eyes. Data segmentation and linear regression were used to extract features in this study. The experiment was conducted on 43 participants. Then, by normalizing the signal and using fuzzy clustering [9,10,11,12,13,14,15,16,17,18,19,20,21,22,23] in different frequency bands, quantitative results were obtained. In [24], feature extraction [25,26,27,28,29] for emotion recognition through 64-channel EEG signals was performed, comparing them with each other and selecting important features in the domain of cognition using machine learning techniques. In this article, features in three domains (time, frequency, and time-frequency) were extracted from data composed of 7 females and 9 males. The data included 5 emotional states (joy, curiosity, anger, discomfort, and calmness) and were presented using IAPS images in 8 segments of 30 seconds for each emotional class, validated by self-assessment manikin (SAM). In the signal processing stage, the data related to 5 participants were excluded due to low signal quality, and the average of 11 individuals with 6 different feature extractions and using Quadratic Discriminant Analysis (QDA) as a classifier yielded reported emotion recognition accuracies between 34% and 36%.
In[30], deep learning networks (DLN) [31] were used for emotion recognition through EEG signals. In this study, recordings were conducted on 32 participants with 32 channels. Additionally, Principle Component Analysis (PCA) was applied to extract important features. An interesting point in this study was the separate extraction and classification of features for arousal and valence dimensions. The results were evaluated using SVM and Bayes classifiers.
According to the reports, the DLN network performed better than SVM. In this study, the feature extraction part was considered fixed, and four different and combined algorithms were used in the classification part. To assess the performance of the proposed method, three common quantitative measures were used. For this purpose, the sensitivity [32,33], accuracy, and specificity measures were calculated. Sensitivity represents the relative ratio of positive cases correctly marked as positive. Specificity represents the relative ratio of negative cases correctly marked as negative, and accuracy represents the number of correct diagnoses of the two classes relative to all correct and incorrect diagnoses of the two classes. The classification results of this study reported accuracies of 53.42% with a standard deviation of 64% for valence dimension and 52% with a standard deviation of 75% for arousal dimension.
In [34], three categories of features in emotion recognition were compared with each other based on video stimuli using a custom recorded dataset. Then, the resulting feature matrix was classified using SVM. The sampling frequency in this study was 100 Hz. The final results of this article, considering the diversity of the used features and applying a feature normalization stage, reported an accuracy of 87% for classification. Yan and colleagues [35] used a correlation-based model for feature extraction from EEG signals to classify different emotions (calmness, joy, sadness, and grief) in 8 participants. They employed BP, SVM, LDA, and C4.5 classifiers and concluded that the C4.5 classifier performed better in emotion recognition than the others. Y.hou and colleagues [36] used a parallel fuzzy cascade for predicting the emotional content of EEG signals.
These researchers used musical stimuli on 15 participants in their experiment. They also compared their proposed model with several common algorithms. The reported error of their proposed model for the classification of 2 emotions was approximately 0.089. Panaio and colleagues [37] employed deep neural networks for detecting two types of emotions using EEG signals.
These researchers used 12 participants in their experiment. The architecture of their proposed network consisted of 6 convolution layers. They compared their proposed model with SVM and concluded that their proposed model performed better in emotion detection. Yang and colleagues [38] used a recurrent neural network for automatic identification of emotions from EEG signals. These researchers used a dataset based on video stimuli in their experiments. Additionally, in their proposed method, they transformed one-dimensional EEG signals into two-dimensional frames for network training. Their reported accuracies for both valence and arousal classes were 90% and 91%, respectively. Chen and colleagues [39] used EEG signals for automatic classification of two-class emotions. These researchers used parallel recurrent neural networks in their proposed algorithm.
The final reported accuracies for classifying valence and arousal based on their proposed algorithm were 93.64% and 93.26%, respectively. Wei and colleagues[40] used dual-tree wavelet transform for extracting desired features from EEG signals for emotion recognition. Additionally, after extracting the desired features, they utilized recurrent units to train their model. Ultimately, they achieved reported accuracies of 85%, 84%, and 87% for positive, negative, and neutral emotions, respectively.
The main challenge in emotion recognition algorithms from EEG signals is the selection of distinct features for different emotional stages. In most previous studies, conventional statistical and processing methods were used to extract features, and then feature selection was performed using dimensionality reduction techniques. Manual feature extraction introduces computational complexity in classifying different emotional stages. Furthermore, features that are desirable and optimal [41,42,43,44] for one problem may not be optimal for another problem [45].
Therefore, it is necessary to use a method that can learn suitable features based on the type of problem and data. This issue is a key point in this research. In this article, a fully automatic classification algorithm (without the need for manual feature selection and extraction) has been designed for the detection of 3 emotional stages (positive, negative, and neutral) using EEG signals. The algorithm utilizes deep learning and a CNN network to process the raw input signals for feature learning and automatic identification of different emotional stages with high accuracy and prediction speed.
The following continuation of the paper is structured as follows. In Section 2, we delve into the analysis of the recorded experimental data obtained through musical stimulation. Additionally, we provide a detailed explanation of the Convolutional Neural Network (CNN) in conjunction with the Long Short-Term Memory (LSTM) network. Moving on to Section 3, we present the architecture of our proposed method, which is based on the combination of CNN and LSTM, denoted as CNN-LSTM. In Section 4, we present and discuss the results obtained from our simulations. Finally, in Section 5, we summarize our findings and draw conclusions based on the outcomes of our study.
2. Materials and Methods
In this section, we first describe the collected EEG data, followed by the investigation of deep neural networks.
2.1. EEG Signal Acquisition
For the purpose of emotion recognition based on EEG signals, a database was created for three emotions: positive, negative, and neutral. To evaluate the two emotions of positivity and negativity, the Self-Assessment Manikin (SAM) test was used in a paper-based format with a 9-point scale. In this test, scores below 3 were considered low, and scores above 6 were considered high[24]. Prior to EEG signal acquisition, participants were instructed to meet certain criteria, including not having a history of mental illness, not having any neurological disorders, not using psychiatric medications, having sufficient sleep before the test, avoiding fatty foods and caffeine prior to the experiment, and refraining from intense physical activity or consuming any mood-altering substances before the test. Participants were asked to read and sign a consent form if they wished to participate.
Subsequently, they were requested to complete a questionnaire. After the completion of a 20-item questionnaire on current depressive mood, according to psychological standards, participants who scored above 21 on the test were excluded from further processing and analysis. For EEG signal acquisition, a total of 16 individuals (6 females and 10 males) aged between 20 and 28 years were invited to participate. EEG signals of individuals were recorded while they were listening to music. All recordings were performed in controlled [46,47] lighting and temperature conditions, at a constant temperature of 24 degrees Celsius, between 9 a.m. and 2 p.m., to ensure that participants did not feel fatigued. Comfortable seating arrangements were provided to ensure better induction and minimize motion artifacts. Additionally, to prevent EOG artifacts, all participants were asked to keep their eyes closed throughout the recording process. The Encephalan device from Medicom with 21 channels was used for EEG signal acquisition. The standard 10-20 international system for electrode placement on the scalp was employed. The sampling frequency during recording was 250 Hz, with an impedance matching of 10 kilo-ohms. The device used for signal recording had 21 electrodes, and during the processing stage, 19 channels were utilized in accordance with standard practices using MATLAB software.
To ensure the comfort and stability of electrode placement on the scalp, conductive paste was applied. Details of the emotion induction validation results with the self-assessment questionnaire are presented in Table 1. For instance, according to Table 1, participant number 3 was excluded from further processing due to the lack of response conformity in the control question of the SAM test . The results of emotion induction validation using the Self-Assessment Manikin (SAM) test for participant 1 are presented in Figure 1. Based on Figure 1 and Table 1, participant 1 exhibited an average positive emotion induction score greater than 6, indicating a significant positive emotional response. Moreover, the average negative emotion induction score was less than 3, indicating a relatively low negative emotional response. The participant’s overall emotional capacity, based on the calculated scores, was 16, which is less than 21, indicating successful completion of the processing phase. To induce positive and negative emotions in participants, musical stimuli were used. Each musical piece was played for one minute, and a 15-second silence (neutral state) was provided between each piece to prevent emotional carryover. It is worth mentioning that the use of speakers was avoided to improve induction, and headphones with minimal artifacts were used for music playback. The theme and mood of music have a general and physiological impact, which varies depending on individuals’ cognitive and emotional mechanisms. However, the magnitude and intensity of this impact depend on the state of neural cells, previous mental conditions, and individual sensitivity. In the conducted experiments, for the induction of positive and negative emotions, a sad theme[48] was used for eliciting negative emotions, and a passionate (hysterical) theme was used for eliciting positive emotions. Table 2 provides details of the selected music for each theme, and Figure 2 illustrates the order and presentation format of the musical stimuli for the participants. The abbreviations "N" and "P" in accordance with Figure 2 refer to negative and positive emotions, respectively.
The optimization of energy consumption patterns involves adopting and implementing methods and policies to optimize the use of electrical energy. Residential buildings are significant consumers of electrical energy. The introduction of intelligent management systems in residential buildings has the potential to optimize the consumption of electrical energy to some extent.
2.2. Convolutional neural networks (CNNs)
Convolutional Neural Networks (CNNs) are a type of neural network that have been improved over traditional neural networks[49]. In a CNN, multiple layers with powerful filters are trained together. This method has proven to be highly effective and has become a leading approach in various machine learning applications.
Similar to Artificial Neural Networks (ANNs), CNNs also have two stages for training: the forward propagation stage and the backpropagation stage(BP)[50]. In the forward propagation stage, the input data is passed through the network, which involves applying a dot product operation on the input and the parameters of each neuron, followed by the convolution operation in each layer, and ultimately computing the network’s output. During training, the network’s parameters are adjusted based on the output results to calculate the network’s error. This is done by comparing the network’s output with the expected output using an error function. The backpropagation method calculates the gradients of the error with respect to the weights. The backpropagated error signal is used to update the weights. In the next stage, called the backpropagation phase, the gradients for each parameter are calculated based on a predefined rule, and all parameters are updated according to their impact on the generated error.
After updating the parameters, the next forward propagation phase begins. This process continues for a certain number of iterations until the network’s training is completed. In this network, the output of each layer represents the features that the network has learned from the original data. In general, a convolutional neural network (CNN) consists of several layers, including the convolutional layer, pooling layer, fully connected (FC) layer[49], dropout layer, and batch normalization layer, among others.
The convolutional layer applies filters (kernels) to the input EEG signal. Each kernel is a matrix that convolves with the input EEG signal, performing the convolution operation using the kernel to extract features. The output of the convolutional layer represents the learned features. The convolution operation can be represented as:
 Where x is the input signal, h is the filter, N is the number of elements in x, and y is the resulting output.
The pooling layer, also known as the downsampling layer, reduces the sample size and dimensionality of the output neurons from the convolutional layer, reducing computations and preventing overfitting. In this research, the maximum pooling layer is used, which selects the maximum value in each pooling window, reducing the number of output neurons.
The FC layer, or fully connected layer, is connected to all activations in the previous layer. It aggregates the features learned from the previous layers and produces the final output.
The dropout layer is used to mitigate overfitting[50]. In each training iteration, a certain probability of neurons is randomly dropped out, resulting in a reduced network.
The batch normalization layer is used to normalize the data within the network[51]. It improves the convergence speed and prevents internal covariance shift. The normalization transformation can be represented as:
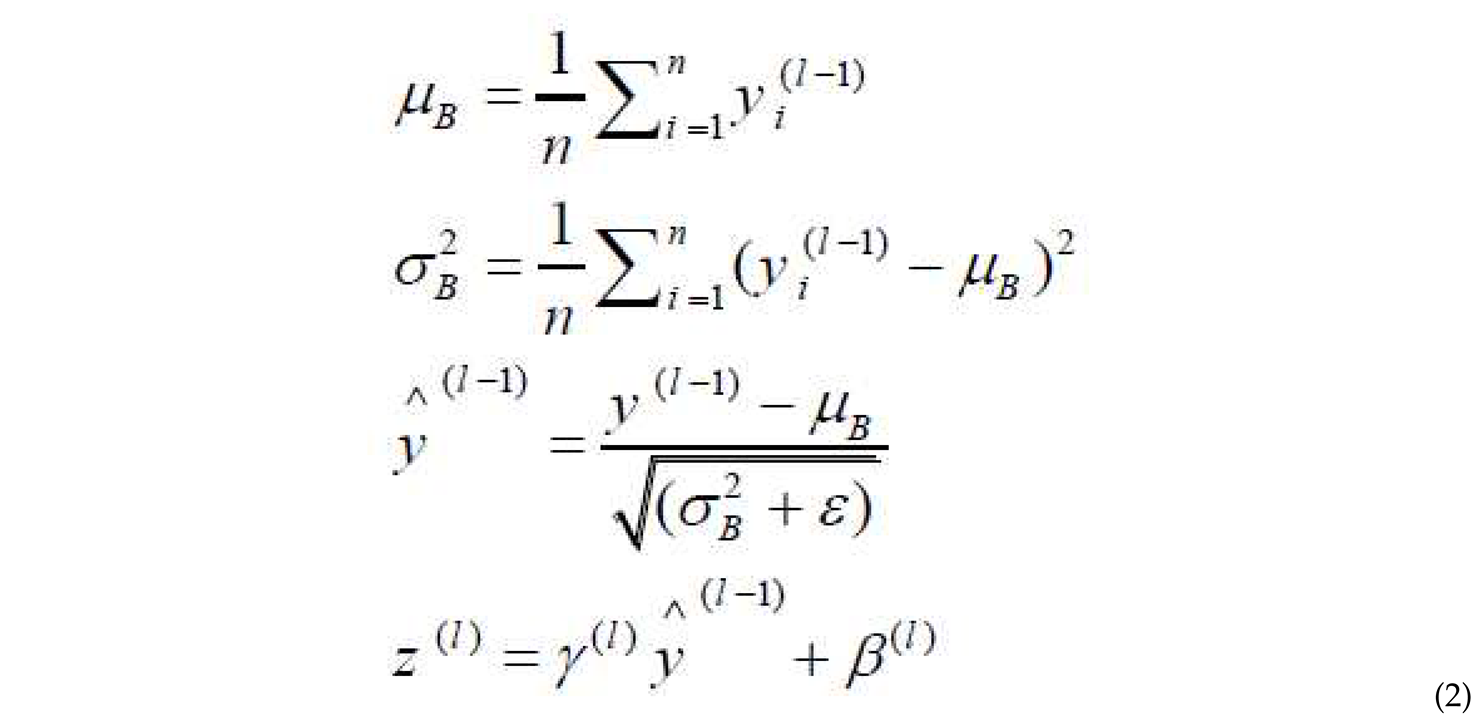 where and are the mean and variance of the batch, is a small constant for numerical stability, I layer number, input vector to the normalization layer, output vector from normalization to a neuron, and are parameters for scaling and shifting the normalized output.
It’s important to note that these descriptions provide a general overview of the layers in a CNN, but the specific configurations and parameters can vary depending on the network architecture and the task at hand Activation Function: After each convolutional layer, an activation function is applied. An activation function maps the output to a set of values and is used to introduce non-linearity in the network structure[52]. In this research, the LeakyReLU activation function is used in each layer. LeakyReLU has the property of non-linearity and sparsity, which helps in preserving the network structure against minor input variations. The LeakyReLU function is defined as follows where in the normal case .

Softmax Function: This function is used to compute the probabilities of classes in a 32-class softmax function layer. In the final fully connected layer, the softmax function is used to predict which class the input signal corresponds to, whether positive, negative, or neutral. The softmax function is defined as:
 where x is the input to the network and p is the output vector representing the probabilities between 0 and 1, with their sum equal to 1.
where x is the input to the network and p is the output vector representing the probabilities between 0 and 1, with their sum equal to 1.2.2.1. Long Short-Term Memory Network(LSTM)
LSTM (Long Short-Term Memory) is a type of recurrent neural network (RNN) that addresses the limitations of traditional RNNs, such as the vanishing gradient problem. Unlike traditional recurrent networks, which struggle with capturing long-term dependencies, LSTM networks are specifically designed to maintain balanced signals and incorporate memory cells.
An LSTM unit computes and passes the input signals through activation functions. Each LSTM unit utilizes a memory cell, denoted as Ct, at time step t. The output of an LSTM unit is defined by the following equation:

In which is the output gate, serving as a controller for determining the amount of content to be presented from the memory. The output gate is calculated using the following equation.

Using the weight matrix and the sigmoid activation function , where is an input matrix, the memory cell is updated. The relative ratio of the new memory to the previous memory and the addition of new content are calculated through eq.7. The content of the new memory is obtained using eq.8.


The amount of memory that needs to be forgotten from the current memory is controlled by the forget gate, and the portion of the new memory that should be added to the memory cell is determined by the input gate . This operation is performed through eq.9 and eq.10[53,54].


Researchers aim to combine CNNs with LSTM networks in their proposed method to enhance stability and reduce noise in the architecture.
3. Proposed method
In this section, the proposed method of the paper is presented. Figure 3 illustrates the overall structure of the proposed approach.
3.1. Data Preprocessing
Initially, the data were preprocessed using the Max-Min normalization method to normalize them between 0 and 1. Then, a notch filter was applied to remove the power line frequency of 50 Hz, followed by a Butterworth filter of order 1 with low-pass frequencies of 0.15 Hz and 45 Hz on the data [38,39,40]. Considering that one of the objectives of this research is to propose an algorithm based on a minimum number of physiological signal channels, according to the study [34,35,36], the channels Fp1,Fp2,F7,F3,Fz,F4,F8,T3,C3,C4,T4 and Pz were selected. Figure 4 illustrates the selected channels for the simulation.
In this work, two different scenarios were considered. In the first scenario, two emotional states (positive and negative) were taken into account. In this scenario, initially, a 5-minute (300 seconds) segment of the signal was selected for both positive and negative emotional states, resulting in two sets of data with a length of 75,000 samples (sampling frequency of 250 Hz). Then, to prevent any artifacts, the data were divided into 8-second intervals. The selected segment of length 75,000 (300 seconds) was divided into segments of 2000 samples (8 seconds) with a shift of 200 samples (0.8 seconds) and an overlap of 90 %. Therefore, for each electrode samples, we had:
Since we have 7 electrodes and 2 conditions, the final dimensions of the input matrix for the first scenario will be:
Similarly, for the second scenario, with three emotional states (positive, neutral, and negative), the dimensions of the input matrix will be:
The data processing steps are illustrated in Figure 5.
3.2. Proposed Deep Neural Network Architecture
In the proposed deep neural network architecture, a 1D convolutional layer and three LSTM layers were utilized. The Keras library in Python was used to implement the convolutional neural network. The architecture of the proposed deep neural network is as follows:
1)Input Layer: Random Dropout 2)Convolutional Layer: A convolutional layer with a non-linear activation function (LeakyReLU) and maximum poolingis applied. 3)Previous Stage Architecture: The architecture from the previous stage is repeated nine times. 4)Connection to LSTM Layers: The output from the previous architecture is connected to three LSTM layers with a non-linear activation function (LeakyReLU). The connections are concatenated sequentially. 5)Output Layer: The output from the previous architecture is reshaped to a two-dimensional matrix. 6)Fully Connected Layers: Two fully connected layers with a non-linear activation function (LeakyReLU) are used to obtain the final output vector. 7)Softmax Activation: The final output vector is passed through a softmax activation function. Figure 6 illustrates the details of the proposed deep neural network architecture. Table 3 presents the details of the employed convolutional neural network architecture. According to Table 3, the dimensionality reduction in the penultimate layer results in a reduction from 24,000 (12x2000, initial feature dimensions) to 100. Finally, the selected feature vector is connected to fully connected layers with LeakyReLU and softmax activation functions.
3.3. Training of the Proposed Deep Neural Network
In this research, all hyperparameters of the proposed LSTM-CNN deep network have been carefully tuned to achieve the best convergence behavior. The Rmsprop optimizer with a learning rate of 0.001 and a batch size of 10 have been selected. The conventional method of 10-fold cross-validation has been employed to train the network. The total number of samples in this work for scenario one and two are 5040 and 7560, respectively. 60% of the data is randomly selected for training (3024 samples for scenario one and 4536 samples for scenario two), while the remaining 40% is held for testing (2016 samples for scenario one and 3024 samples for scenario two). Additionally, 10% of the training data is set aside for validation. Figure 7 illustrates the allocation of EEG data for training and testing in scenario one and two.
4. Results and Discussion
In this section, the results of the simulation of the proposed deep neural network for automatic emotion recognition from EEG signals are presented. Figure 8 shows the learning curves for scenario one and two.
According to Figure 8, the network error for scenario one reaches a stable state at around iteration 130, and for scenario two, it becomes almost constant at iteration 145. Figure 9 illustrates the accuracy of the proposed method for scenario one and two over 400 iterations. It can be observed from Figure 9that the performance of the proposed method in emotion classification improves significantly after 200 iterations, achieving an accuracy of 97.42% and 95.23% for scenario one and two, respectively. Figure 10 presents the confusion matrix for scenario one and two, demonstrating the promising performance of the proposed deep neural network.
Furthermore, Figure 11 displays the bar chart (including precision, Sensitivity, accuracy and specificity) for scenario one and two. It indicates the effectiveness of the proposed deep neural network. Figure 12 depicts the scatter plot of different convolutional filters for scenario one and two. Considering the scatter plot in Figure 12, the proposed method demonstrates high efficiency in data classification. However, to showcase the desirable performance of the proposed algorithm for classification, scenario two (including positive, neutral, and negative) was compared to several existing methods such as CNN, DBM, and MLP. For the CNN network, the proposed architecture from Table 3 was utilized without considering LSTM networks. For the DBM and MLP networks, three hidden layers and a learning rate of 0.001 were employed. Figure 13 illustrates the performance of the proposed LSTM-CNN method compared to CNN, DBM, and MLP networks for scenario two.
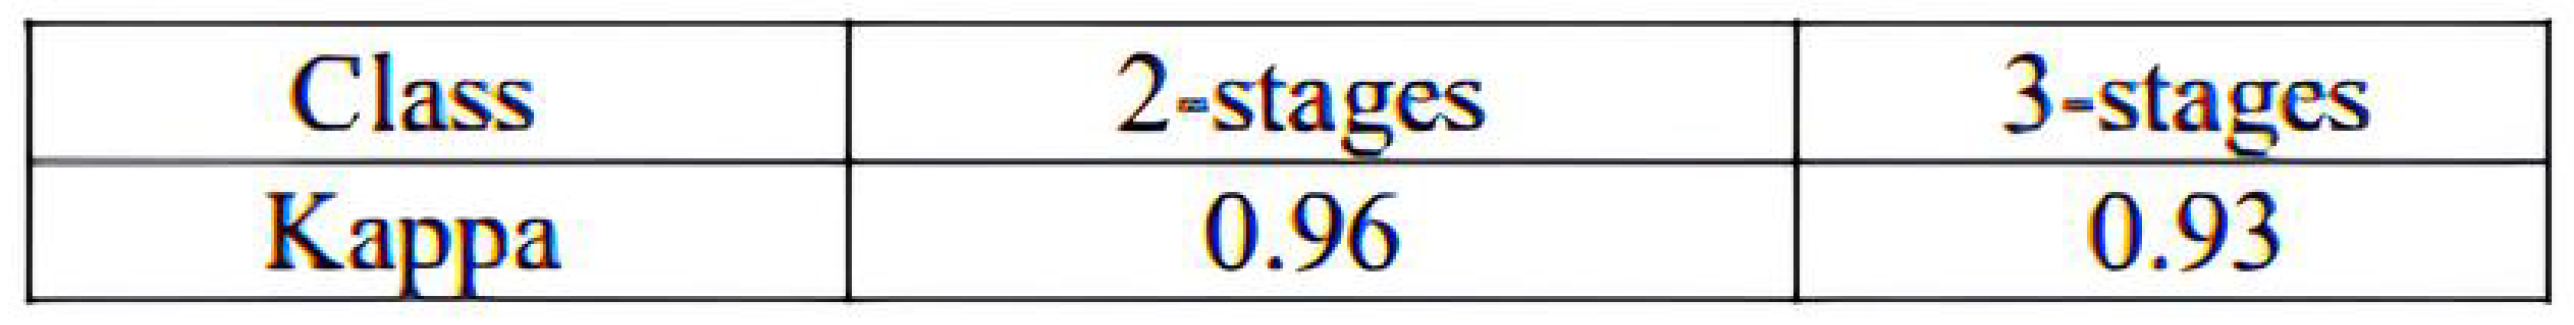
According Figure 13, the achieved accuracies for the three compared classifiers were 90%, 79%, and 73%, respectively. The proposed algorithm’s architecture, based on LSTM-CNN networks, demonstrates efficient performance in emotion classification for positive, neutral, and negative sentiments, as shown in Figure 13. However, the computational complexity for the proposed LSTM-CNN algorithm, as well as the LSTM, CNN, DBM, and MLP networks, is presented in Table 4. According to the table, the proposed algorithm has higher computational complexity compared to the other three methods but achieves the highest accuracy for both scenarios. Table 5 presents the obtained kappa values for the two scenarios to validate the achieved accuracies.
Previous studies have utilized common methods such as wavelet transform (WT), empirical mode decomposition (EMD), and other feature selection and extraction techniques to extract meaningful features from EEG signals. These methods involve selecting parameters like the mother wavelet type, decomposition levels, and feature extraction algorithms. In contrast, the proposed method eliminates the need for conventional feature selection methods and directly focuses on emotion detection from EEG signals without utilizing feature extraction algorithms. In order to evaluate the performance of the proposed algorithm in noisy environments, white Gaussian noise with signal-to-noise ratio (SNR) ranging from -4 to 20 dB was added to the recorded EEG signals. The classification accuracy for scenario two was compared with the baseline methods for each SNR spectrum, as shown in Figure 14. The obtained results are presented in Figure 14.
According to Figure 14, the classification performance of the proposed algorithm is significantly superior and more robust compared to the baseline methods across a wide range of SNR levels. The proposed algorithm demonstrates remarkable resistance to the degrading effects of noise in comparison to the compared methods.
5. Conclusion
This study delved into the challenging task of emotion recognition and explored the selection of discriminative features for classification. Traditional approaches typically involved integrating feature selection with various classification methods, leading to diverse outcomes. However, this paper proposed a novel method that eliminated the need for complex classification techniques by bypassing the feature selection step and sidestepping common feature extraction techniques. Instead, it leveraged the raw EEG signals directly for emotion recognition, achieving remarkable accuracy rates of over 90% across two different scenarios.
The key innovation of the proposed model lay in its adoption of a hierarchical structure comprising seven convolutional layers, three LSTM layers, and two fully connected layers. This architecture was designed to identify and prioritize features that exhibited the highest discrimination power among different emotions. Through rigorous experimentation, the results convincingly demonstrated that the proposed model was capable of extracting and utilizing these crucial features effectively. Consequently, it achieved exceptional accuracy in accurately categorizing emotions.
The implications of such a high-performing algorithm are significant, particularly in the domain of Brain-Computer Interface (BCI) systems. BCI technology aims to establish direct communication channels between the human brain and external devices, enabling individuals to control machines using their thoughts. By incorporating the proposed model into BCI systems, it holds the potential to enhance the accuracy and efficiency of emotion recognition, consequently enabling more seamless and intuitive interactions between users and computer interfaces. This advancement opens up exciting avenues for applications in fields such as healthcare, virtual reality, gaming, and beyond. The prospect of a streamlined and robust emotion recognition algorithm paves the way for exciting advancements in human-machine interaction.
References
- Rad, N.F.; Yousefi-Koma, A.; Tajdari, F.; Ayati, M. Design of a novel three degrees of freedom ankle prosthesis inspired by human anatomy. 2016 4th International Conference on Robotics and Mechatronics (ICROM). IEEE, 2016, pp. 428–432. [CrossRef]
- Paydarfar, S.; Abbasi, M.A.; Hashemi, A.; Taheri, S.; Bandehpour, M.; Mosaffa, N. Serum Level of Antibodies Against Novel Acinetobacter Baumannii OmpA-selected Peptides in ICU Staff: Promise for the Future of Vaccine Development. Iranian Journal of Allergy, Asthma and Immunology 2023, pp. 1–13. [CrossRef]
- Paydarfar, S.; Hashemi, A.; Abbasi, M.A.; Bakhtiari, A.; Tajik, F.; Mosaffa, N.; others. Investigation of preformed design Acinetobacter Baumannii outer membrane protein A peptide vaccine candidate in reaction with serum antibodies from ICU staffs members. Research in Medicine: Journal of Research in Medical Sciences 2020, 44. [Google Scholar]
- Hu, L.; Zhang, Z. EEG signal processing and feature extraction; Springer, 2019. [CrossRef]
- Sanei, S. Adaptive processing of brain signals; John Wiley & Sons, 2013.
- Scherer, K.R. What are emotions? And how can they be measured? Social science information 2005, 44, 695–729. [Google Scholar] [CrossRef]
- Schaaff, K.; Schultz, T. Towards emotion recognition from electroencephalographic signals. 2009 3rd international conference on affective computing and intelligent interaction and workshops. IEEE, 2009, pp. 1–6. [CrossRef]
- Murugappan, M.; Rizon, M.; Nagarajan, R.; Yaacob, S.; Zunaidi, I.; Hazry, D. EEG feature extraction for classifying emotions using FCM and FKM. International journal of Computers and Communications 2007, 1, 21–25. [Google Scholar]
- Tajdari, M.; Pawar, A.; Li, H.; Tajdari, F.; Maqsood, A.; Cleary, E.; Saha, S.; Zhang, Y.J.; Sarwark, J.F.; Liu, W.K. Image-based modelling for adolescent idiopathic scoliosis: mechanistic machine learning analysis and prediction. Computer methods in applied mechanics and engineering 2021, 374, 113590. [Google Scholar] [CrossRef]
- Ghaffari, A.; Khodayari, A.; Kamali, A.; Tajdari, F.; Hosseinkhani, N. New fuzzy solution for determining anticipation and evaluation behavior during car-following maneuvers. Proceedings of the Institution of Mechanical Engineers, Part D: Journal of automobile engineering 2018, 232, 936–945. [Google Scholar] [CrossRef]
- Khodayari, A.; Ghaffari, A.; Kamali, A.; Tajdari, F. A new model of car following behavior based on lane change effects using anticipation and evaluation idea. Iranian Journal of Mechanical Engineering Transactions of the ISME 2015, 16, 26–38. [Google Scholar]
- Tajdari, F.; Kabganian, M.; Rad, N.F.; Khodabakhshi, E. Robust control of a 3-dof parallel cable robot using an adaptive neuro-fuzzy inference system. 2017 Artificial Intelligence and Robotics (IRANOPEN). IEEE, 2017, pp. 97–101. [CrossRef]
- Tajdari, F.; Toulkani, N.E.; Zhilakzadeh, N. Intelligent optimal feed-back torque control of a 6dof surgical rotary robot. 2020 11th Power Electronics, Drive Systems, and Technologies Conference (PEDSTC). IEEE, 2020, pp. 1–6. [CrossRef]
- Tajdari, F.; Ghaffari, A.; Khodayari, A.; Kamali, A.; Zhilakzadeh, N.; Ebrahimi, N. Fuzzy control of anticipation and evaluation behaviour in real traffic flow. 2019 7th International Conference on Robotics and Mechatronics (ICRoM). IEEE, 2019, pp. 248–253. [CrossRef]
- Tajdari, F.; Ebrahimi Toulkani, N. Implementation and intelligent gain tuning feedback–based optimal torque control of a rotary parallel robot. Journal of Vibration and Control 2022, 28, 2678–2695. [Google Scholar] [CrossRef]
- Tajdari, F.; Tajdari, M.; Rezaei, A. Discrete time delay feedback control of stewart platform with intelligent optimizer weight tuner. 2021 IEEE International Conference on Robotics and Automation (ICRA). IEEE, 2021, pp. 12701–12707. [CrossRef]
- Tajdari, F.; Toulkani, N.E.; Nourimand, M. Intelligent architecture for car-following behaviour observing lane-changer: Modeling and control. 2020 10th International Conference on Computer and Knowledge Engineering (ICCKE). IEEE, 2020, pp. 579–584. [CrossRef]
- Tajdari, F.; Golgouneh, A.; Ghaffari, A.; Khodayari, A.; Kamali, A.; Hosseinkhani, N. Simultaneous intelligent anticipation and control of follower vehicle observing exiting lane changer. IEEE Transactions on Vehicular Technology 2021, 70, 8567–8577. [Google Scholar] [CrossRef]
- Rad, N.F.; Ayati, M.; Basaeri, H.; Yousefi-Koma, A.; Tajdari, F.; Jokar, M. Hysteresis modeling for a shape memory alloy actuator using adaptive neuro-fuzzy inference system. 2015 3Rd RSI international conference on robotics and mechatronics (ICROM). IEEE, 2015, pp. 320–324. [CrossRef]
- Tajdari, F. Adaptive time-delay estimation and control of optimized Stewart robot. Journal of Vibration and Control, 1077. [Google Scholar] [CrossRef]
- Tajdari, M.; Tajdari, F.; Shirzadian, P.; Pawar, A.; Wardak, M.; Saha, S.; Park, C.; Huysmans, T.; Song, Y.; Zhang, Y.J.; others. Next-generation prognosis framework for pediatric spinal deformities using bio-informed deep learning networks. Engineering with Computers 2022, 38, 4061–4084. [Google Scholar] [CrossRef]
- Tajdari, F.; Huysmans, T.; Song, Y. Non-rigid registration via intelligent adaptive feedback control. IEEE transactions on visualization and computer graphics 2023. [Google Scholar] [CrossRef]
- Tajdari, F. ; others. Optimal and adaptive controller design for motorway traffic with connected and automated vehicles 2023. [Google Scholar]
- Jenke, R.; Peer, A.; Buss, M. Feature extraction and selection for emotion recognition from EEG. IEEE Transactions on Affective computing 2014, 5, 327–339. [Google Scholar] [CrossRef]
- Tajdari, F.; Huysmans, T.; Yang, Y.; Song, Y. Feature preserving non-rigid iterative weighted closest point and semi-curvature registration. IEEE Transactions on Image Processing 2022, 31, 1841–1856. [Google Scholar] [CrossRef] [PubMed]
- Yang, Y.; Yuan, T.; Huysmans, T.; Elkhuizen, W.S.; Tajdari, F.; Song, Y. Posture-invariant three dimensional human hand statistical shape model. Journal of Computing and Information Science in Engineering 2021, 21, 031006. [Google Scholar] [CrossRef]
- Tajdari, F.; Eijck, C.; Kwa, F.; Versteegh, C.; Huysmans, T.; Song, Y. Optimal position of cameras design in a 4D foot scanner. International design engineering technical conferences and computers and information in engineering conference. American Society of Mechanical Engineers, 2022, Vol. 86212, p. V002T02A044. [CrossRef]
- Tajdari, F.; Kwa, F.; Versteegh, C.; Huysmans, T.; Song, Y. Dynamic 3d mesh reconstruction based on nonrigid iterative closest-farthest points registration. International design engineering technical conferences and computers and information in engineering conference. American Society of Mechanical Engineers, 2022, Vol. 86212, p. V002T02A051. [CrossRef]
- Tajdari, M.; Tajdari, F.; Pawar, A.; Zhang, J.; Liu, W.K. 2D to 3D volumetric reconstruction of human spine for diagnosis and prognosis of spinal deformities. Conference: 16th US national congress on computational mechanics, 2021.
- Jirayucharoensak, S.; Pan-Ngum, S.; Israsena, P.; others. EEG-based emotion recognition using deep learning network with principal component based covariate shift adaptation. The Scientific World Journal 2014, 2014. [Google Scholar] [CrossRef]
- Tajdari, F.; Huysmans, T.; Yao, X.; Xu, J.; Song, Y. 4D Feet: Registering Walking Foot Shapes Using Attention Enhanced Dynamic-Synchronized Graph Convolutional LSTM Network. Computer Vision, 2023, pp. 1–10. [CrossRef]
- Tajdari, F.; Roncoli, C.; Papageorgiou, M. Feedback-based ramp metering and lane-changing control with connected and automated vehicles. IEEE Transactions on Intelligent Transportation Systems 2020, 23, 939–951. [Google Scholar] [CrossRef]
- Tajdari, F. Online set-point estimation for feedback-based traffic control applications. IEEE Transactions on Intelligent Transportation Systems 2023. [Google Scholar] [CrossRef]
- Wang, X.W.; Nie, D.; Lu, B.L. Emotional state classification from EEG data using machine learning approach. Neurocomputing 2014, 129, 94–106. [Google Scholar] [CrossRef]
- Bo, H.; Ma, L.; Liu, Q.; Xu, R.; Li, H. Music-evoked emotion recognition based on cognitive principles inspired EEG temporal and spectral features. International journal of machine learning and cybernetics 2019, 10, 2439–2448. [Google Scholar] [CrossRef]
- Hou, Y.; Chen, S.; others. Distinguishing different emotions evoked by music via electroencephalographic signals. Computational intelligence and neuroscience 2019, 2019. [Google Scholar] [CrossRef]
- Keelawat, P.; Thammasan, N.; Numao, M.; Kijsirikul, B. Spatiotemporal emotion recognition using deep CNN based on EEG during music listening. arXiv preprint arXiv:1910.09719, arXiv:1910.09719 2019. [CrossRef]
- Yang, Y.; Wu, Q.; Qiu, M.; Wang, Y.; Chen, X. Emotion recognition from multi-channel EEG through parallel convolutional recurrent neural network. 2018 international joint conference on neural networks (IJCNN). IEEE, 2018, pp. 1–7. [CrossRef]
- Yang, H.; Han, J.; Min, K. A multi-column CNN model for emotion recognition from EEG signals. Sensors 2019, 19, 4736. [Google Scholar] [CrossRef] [PubMed]
- Chen, J.; Jiang, D.; Zhang, Y.; Zhang, P. Emotion recognition from spatiotemporal EEG representations with hybrid convolutional recurrent neural networks via wearable multi-channel headset. Computer Communications 2020, 154, 58–65. [Google Scholar] [CrossRef]
- Tajdari, F.; Roncoli, C.; Bekiaris-Liberis, N.; Papageorgiou, M. Integrated ramp metering and lane-changing feedback control at motorway bottlenecks. 2019 18th European Control Conference (ECC). IEEE, 2019, pp. 3179–3184. [CrossRef]
- Tajdari, F.; Ramezanian, H.; Paydarfar, S.; Lashgari, A.; Maghrebi, S. Flow metering and lane-changing optimal control with ramp-metering saturation. 2022 CPSSI 4th International Symposium on Real-Time and Embedded Systems and Technologies (RTEST). IEEE, 2022, pp. 1–6. [CrossRef]
- Tajdari, F.; Roncoli, C. Adaptive traffic control at motorway bottlenecks with time-varying fundamental diagram. IFAC-PapersOnLine 2021, 54, 271–277. [Google Scholar] [CrossRef]
- Tajdari, F.; Khodabakhshi, E.; Kabganian, M.; Golgouneh, A. Switching controller design to swing-up a two-link underactuated robot. 2017 IEEE 4th International Conference on Knowledge-Based Engineering and Innovation (KBEI). IEEE, 2017, pp. 0595–0599. [CrossRef]
- Minnoye, A.L.; Tajdari, F.; Doubrovski, E.L.; Wu, J.; Kwa, F.; Elkhuizen, W.S.; Huysmans, T.; Song, Y. Personalized product design through digital fabrication. International Design Engineering Technical Conferences and Computers and Information in Engineering Conference. American Society of Mechanical Engineers, 2022, Vol. 86212, p. V002T02A054. [CrossRef]
- Tajdari, F.; Kabganian, M.; Khodabakhshi, E.; Golgouneh, A. Design, implementation and control of a two-link fully-actuated robot capable of online identification of unknown dynamical parameters using adaptive sliding mode controller. 2017 Artificial Intelligence and Robotics (IRANOPEN). IEEE, 2017, pp. 91–96. [CrossRef]
- Tajdari, F.; Toulkani, N.E.; Zhilakzadeh, N. Semi-real evaluation, and adaptive control of a 6dof surgical robot. 2020 11th Power Electronics, Drive Systems, and Technologies Conference (PEDSTC). IEEE, 2020, pp. 1–6. [CrossRef]
- Koen, B.D. Devotional music and healing in Badakhshan, Tajikistan: Preventive and curative practices; The Ohio State University, 2003.
- Goodfellow, I.; Bengio, Y.; Courville, A. Deep learning. Book in preparation for MIT Press. URL!` http://www. deeplearningbook. org 2016, 1. [Google Scholar]
- Hinton, G.E.; Srivastava, N.; Krizhevsky, A.; Sutskever, I.; Salakhutdinov, R.R. Improving neural networks by preventing co-adaptation of feature detectors. arXiv preprint arXiv:1207.0580, arXiv:1207.0580 2012. [CrossRef]
- Ioffe, S.; Szegedy, C. Batch normalization: Accelerating deep network training by reducing internal covariate shift. International conference on machine learning. pmlr, 2015, pp. 448–456.
- Konar, A. Computational intelligence: principles, techniques and applications; Springer Science & Business Media, 2006.
- Phan, H.; Andreotti, F.; Cooray, N.; Chén, O.Y.; De Vos, M. Automatic sleep stage classification using single-channel eeg: Learning sequential features with attention-based recurrent neural networks. 2018 40th annual international conference of the IEEE engineering in medicine and biology society (EMBC). IEEE, 2018, pp. 1452–1455. [CrossRef]
- Hochreiter, S.; Schmidhuber, J. Long short-term memory. Neural computation 1997, 9, 1735–1780. [Google Scholar] [CrossRef] [PubMed]
Figure 1.
The result of SAM validation regarding the level of effective elicitation of emotional stimuli (10 musical pieces) for the first subject
Figure 1.
The result of SAM validation regarding the level of effective elicitation of emotional stimuli (10 musical pieces) for the first subject
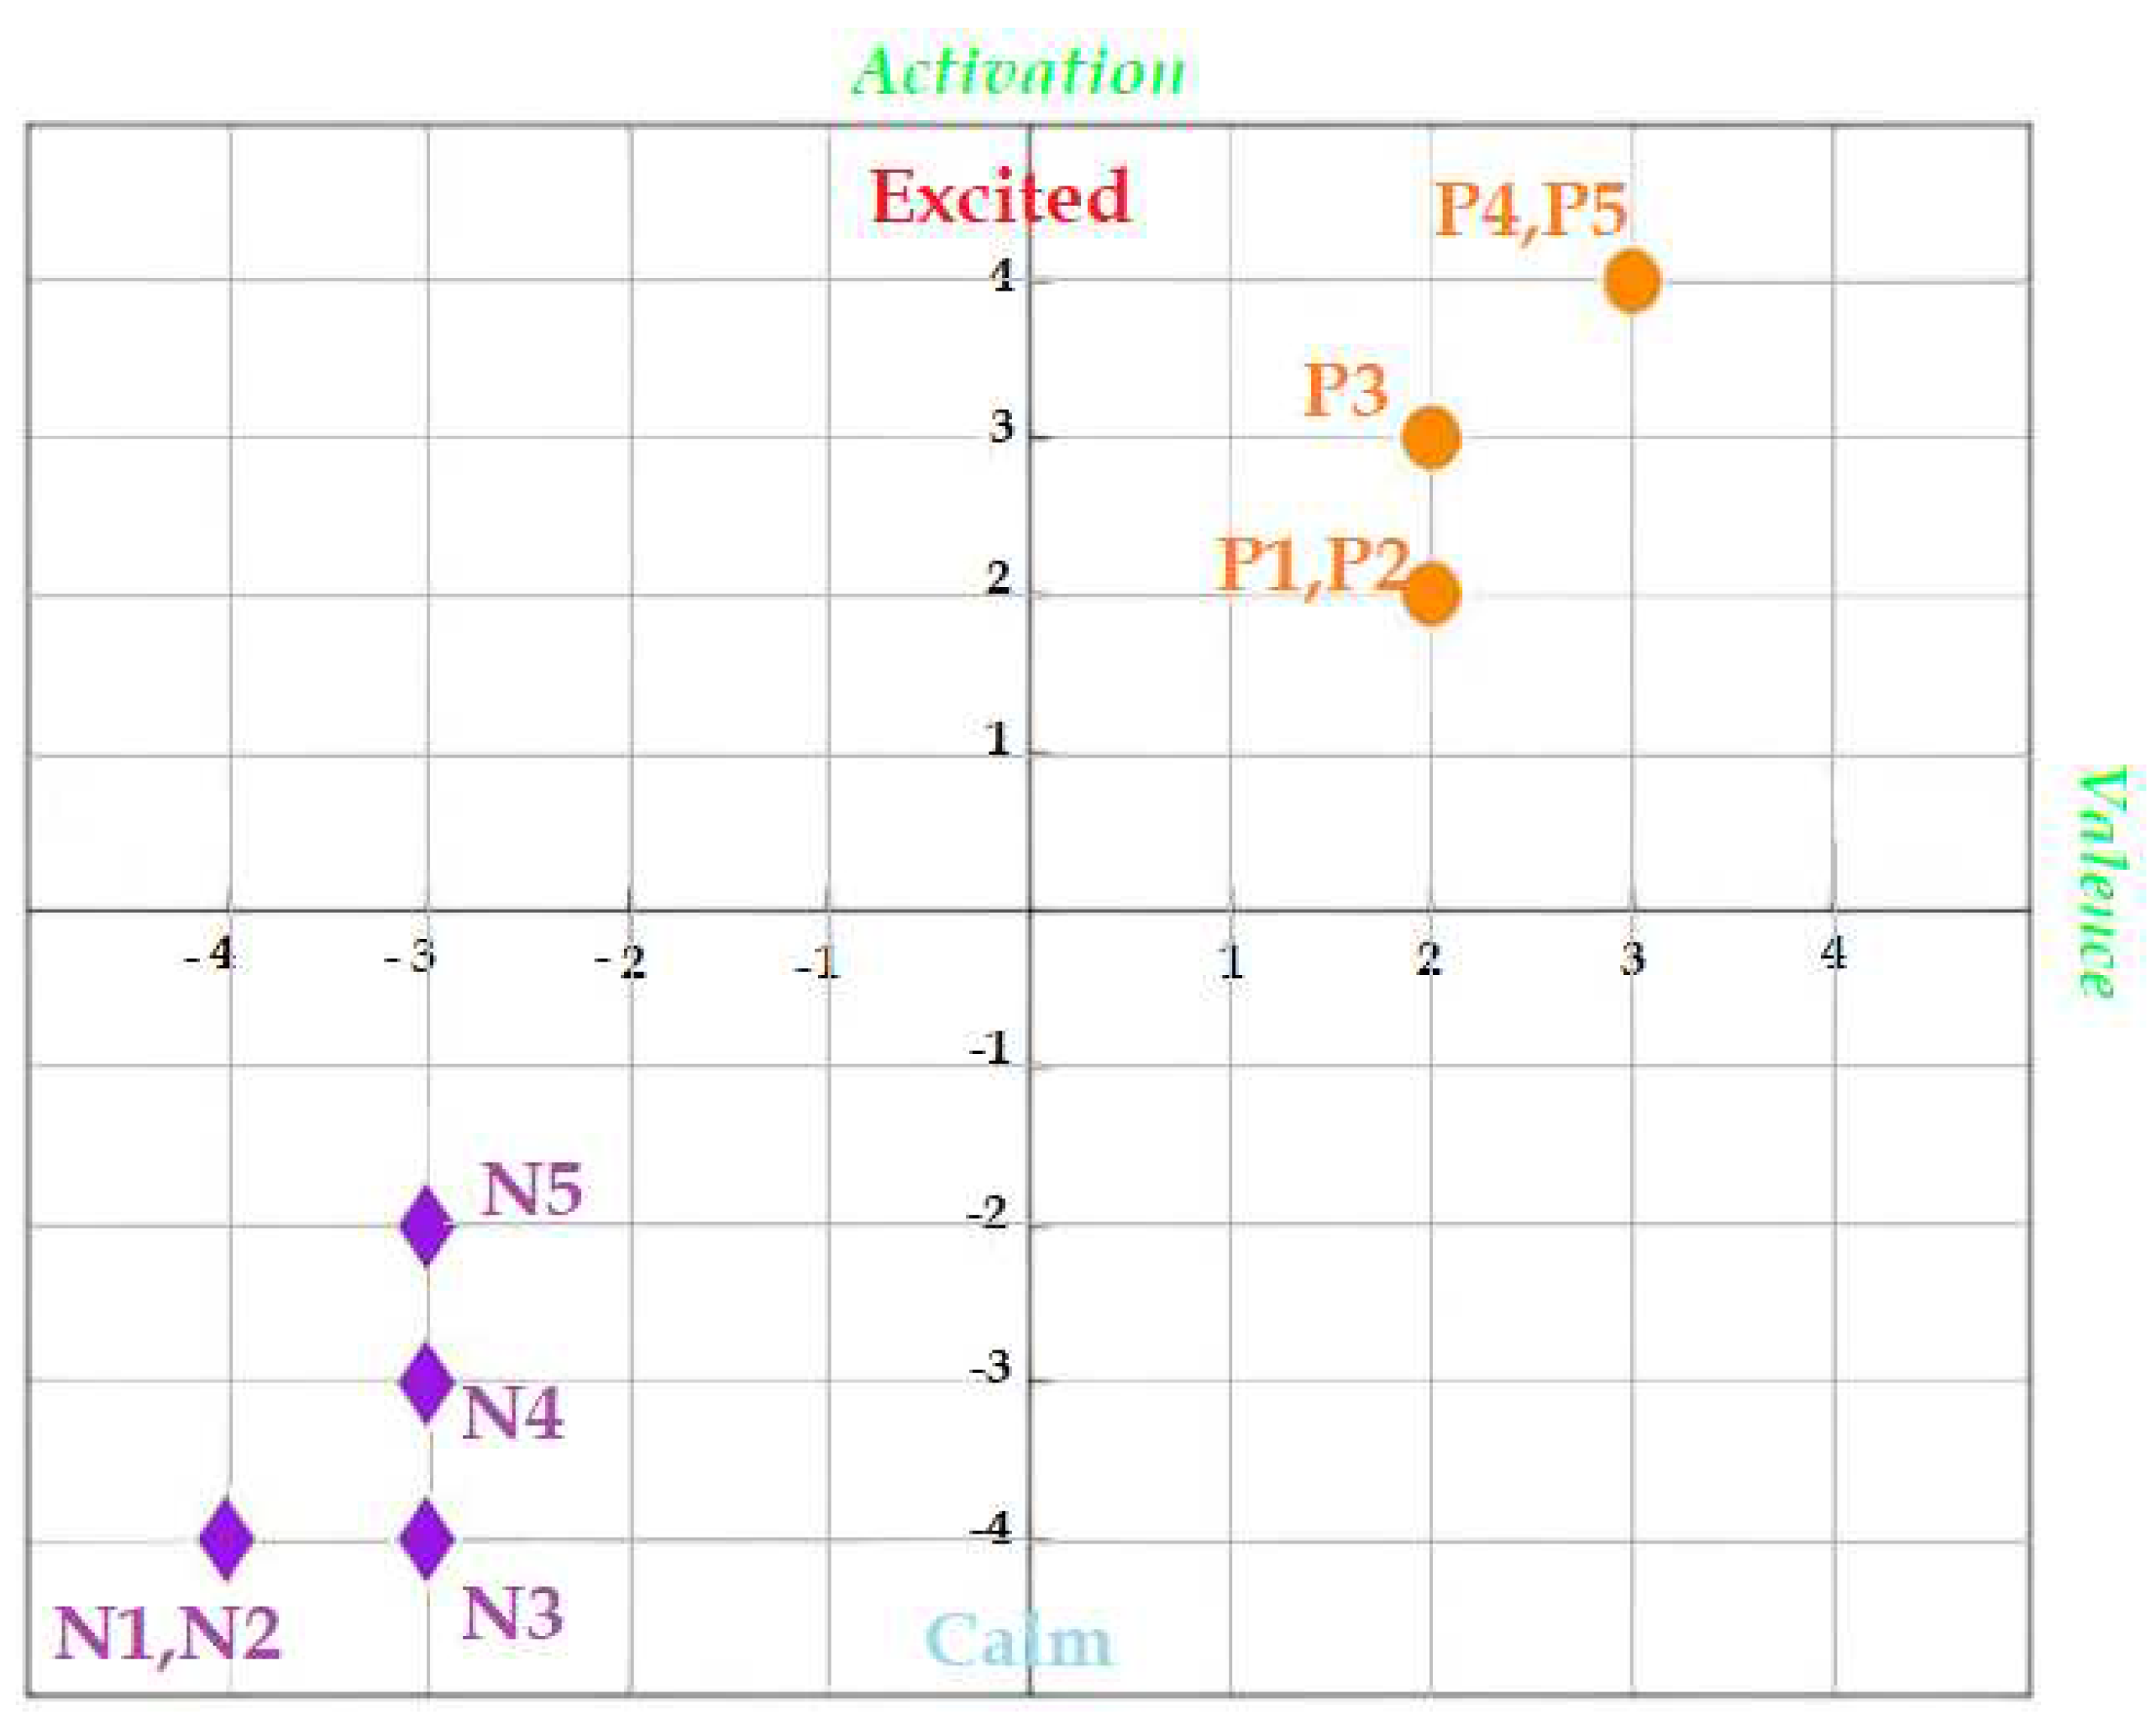
Figure 2.
The order of music playback for the participants
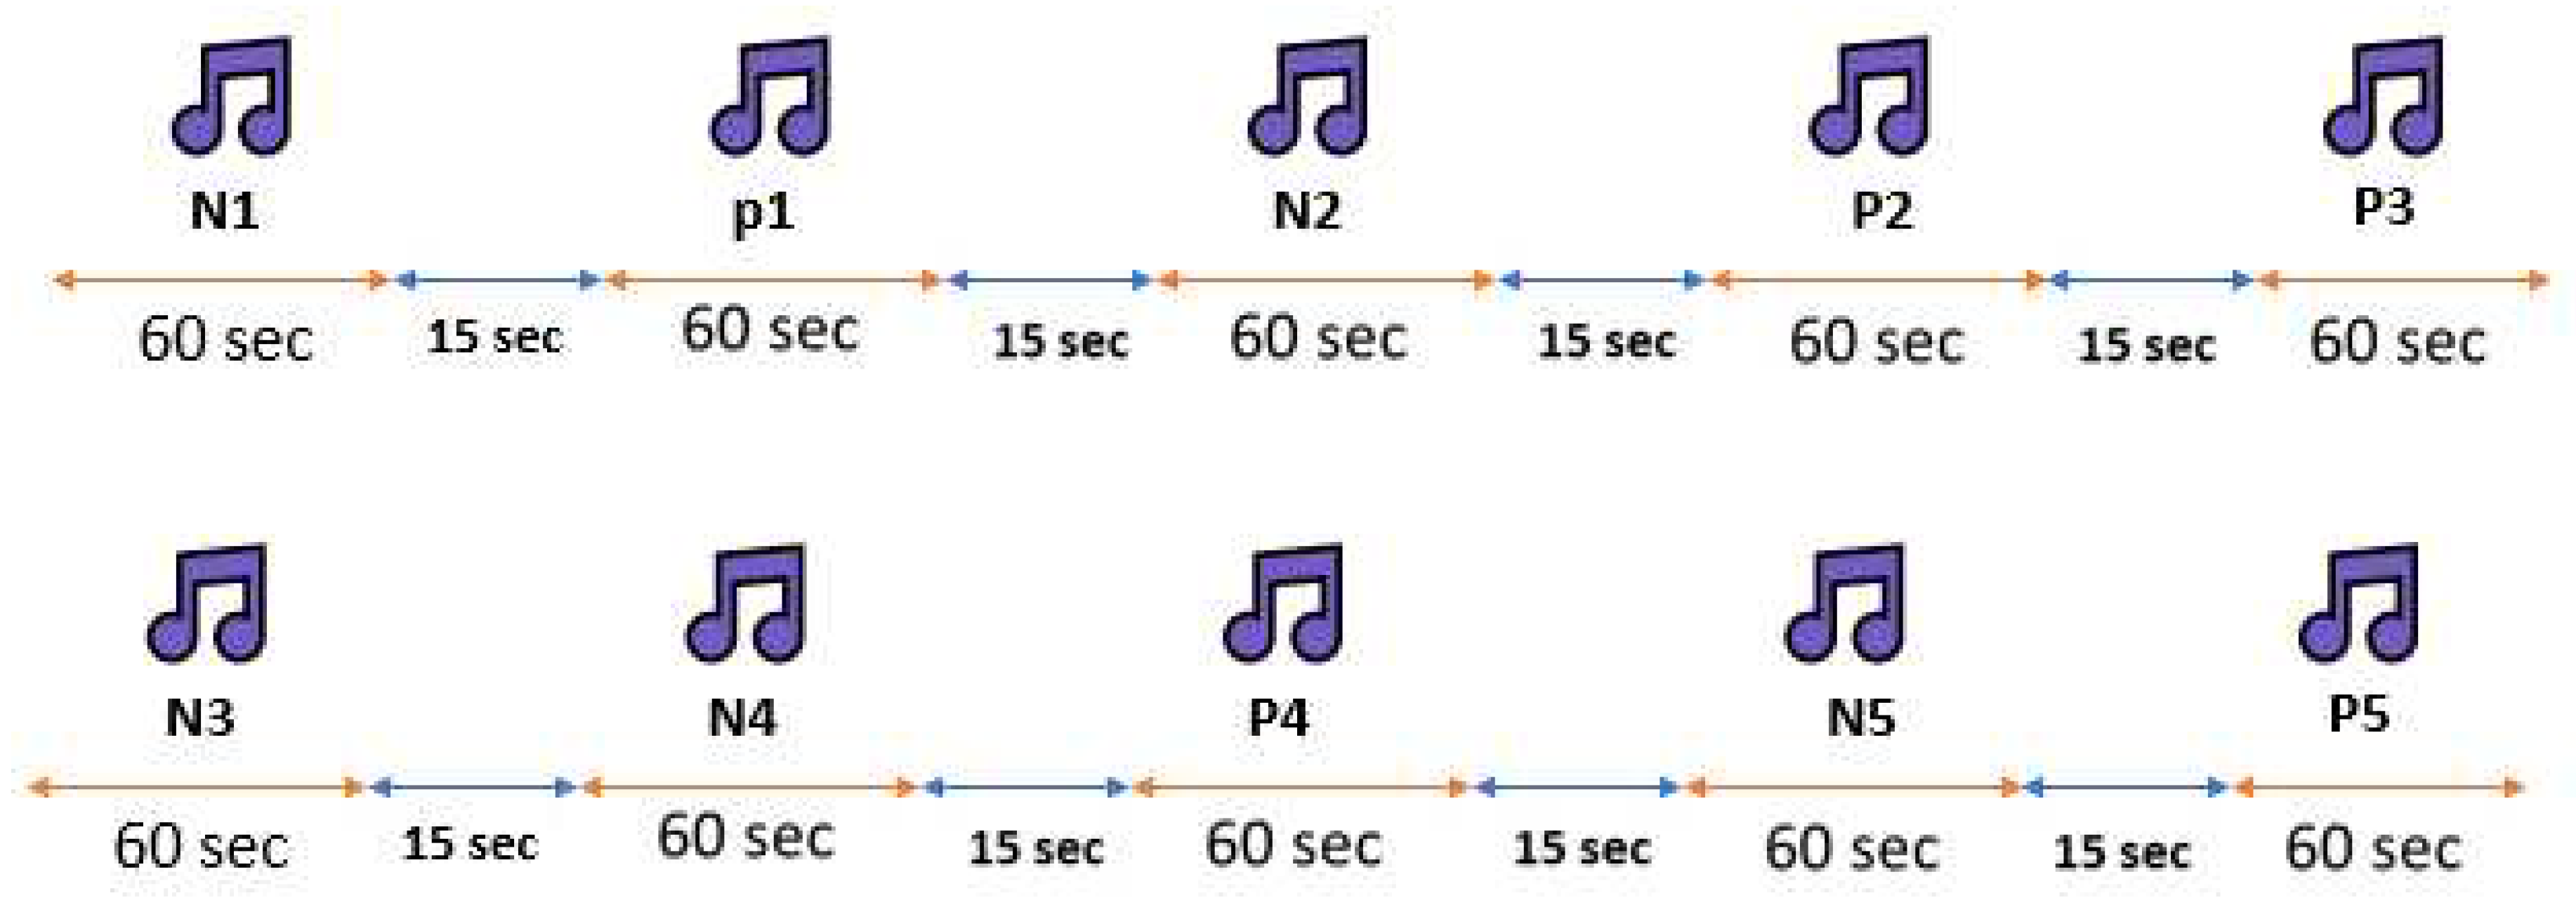
Figure 3.
Block diagram of the proposed algorithm
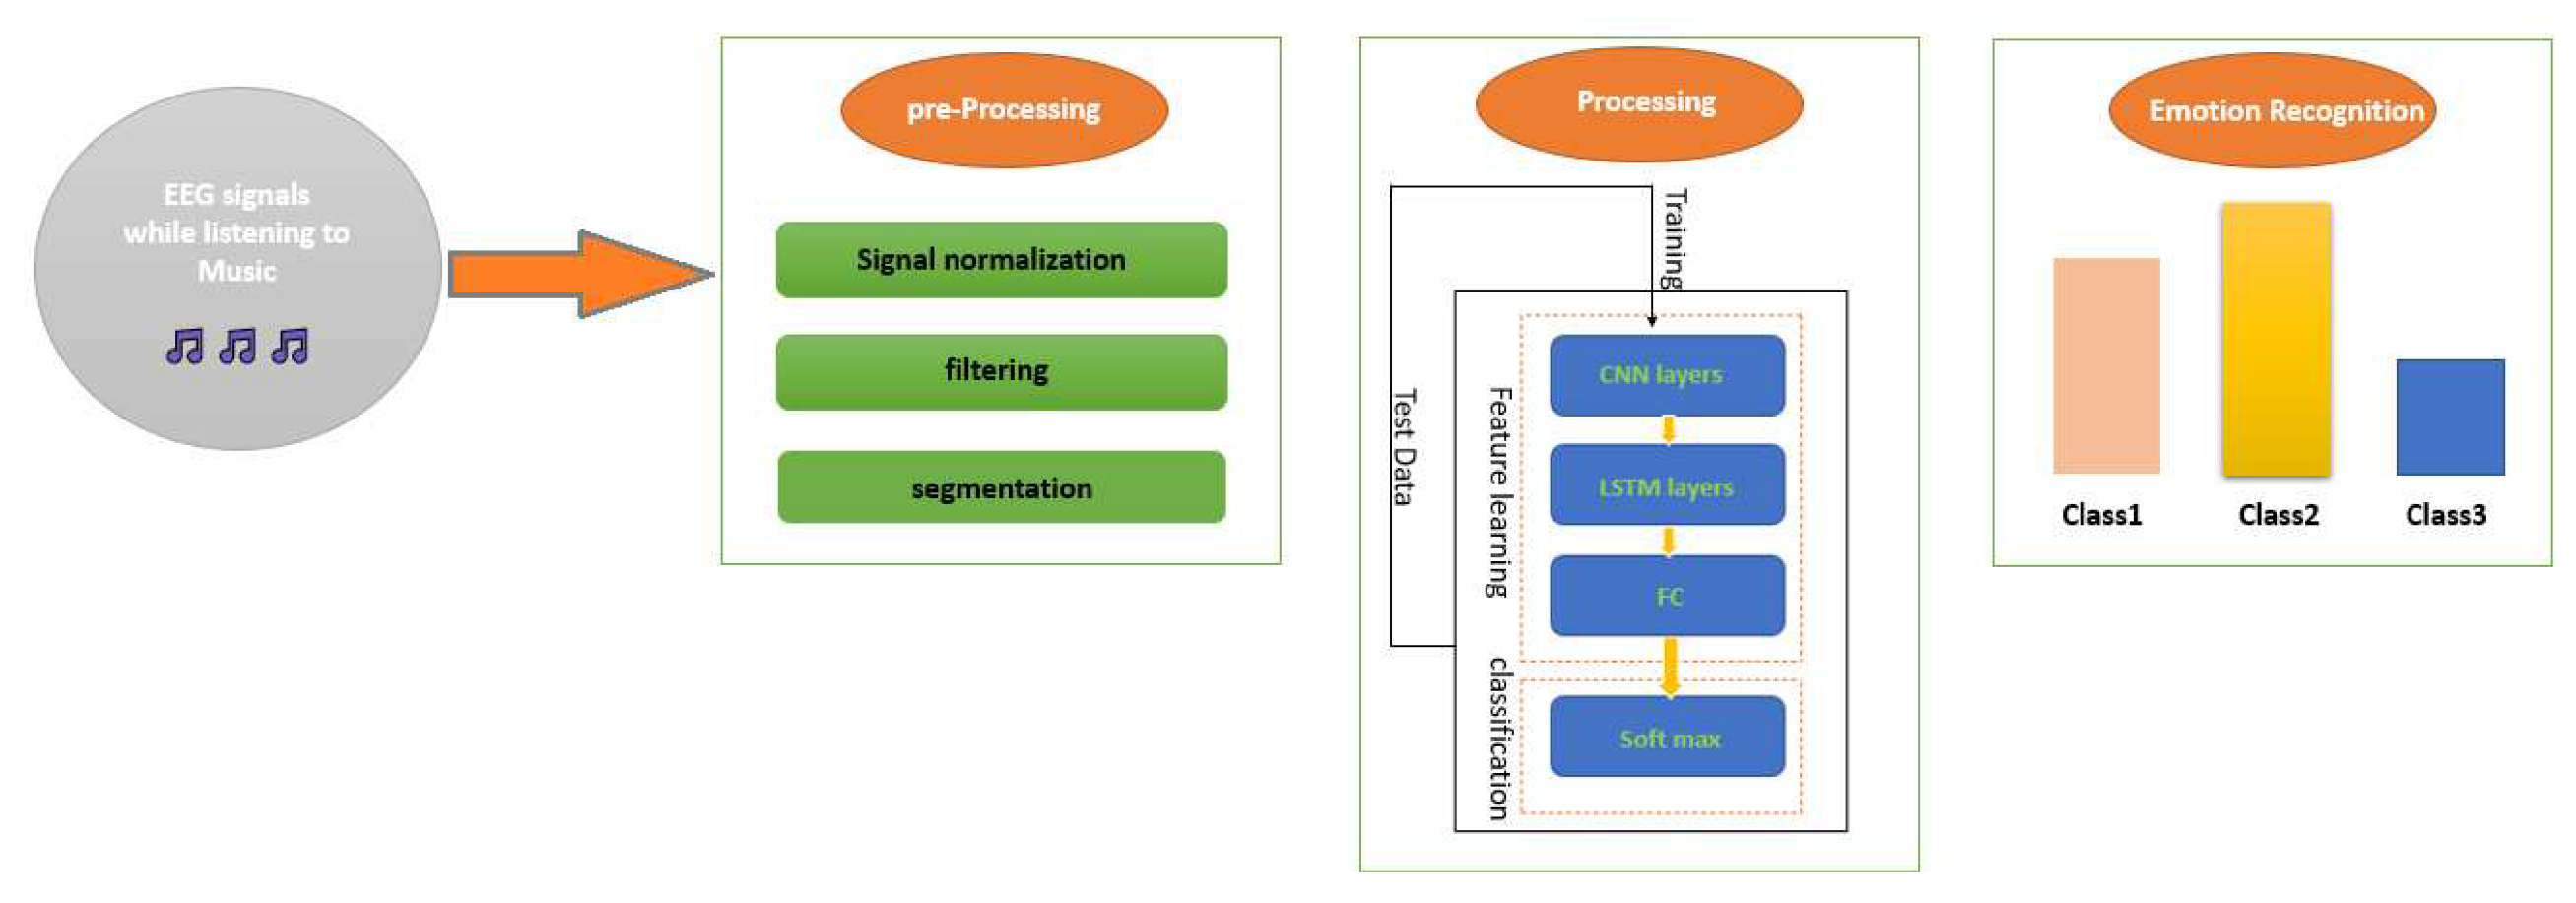
Figure 4.
Selected channels in the simulation
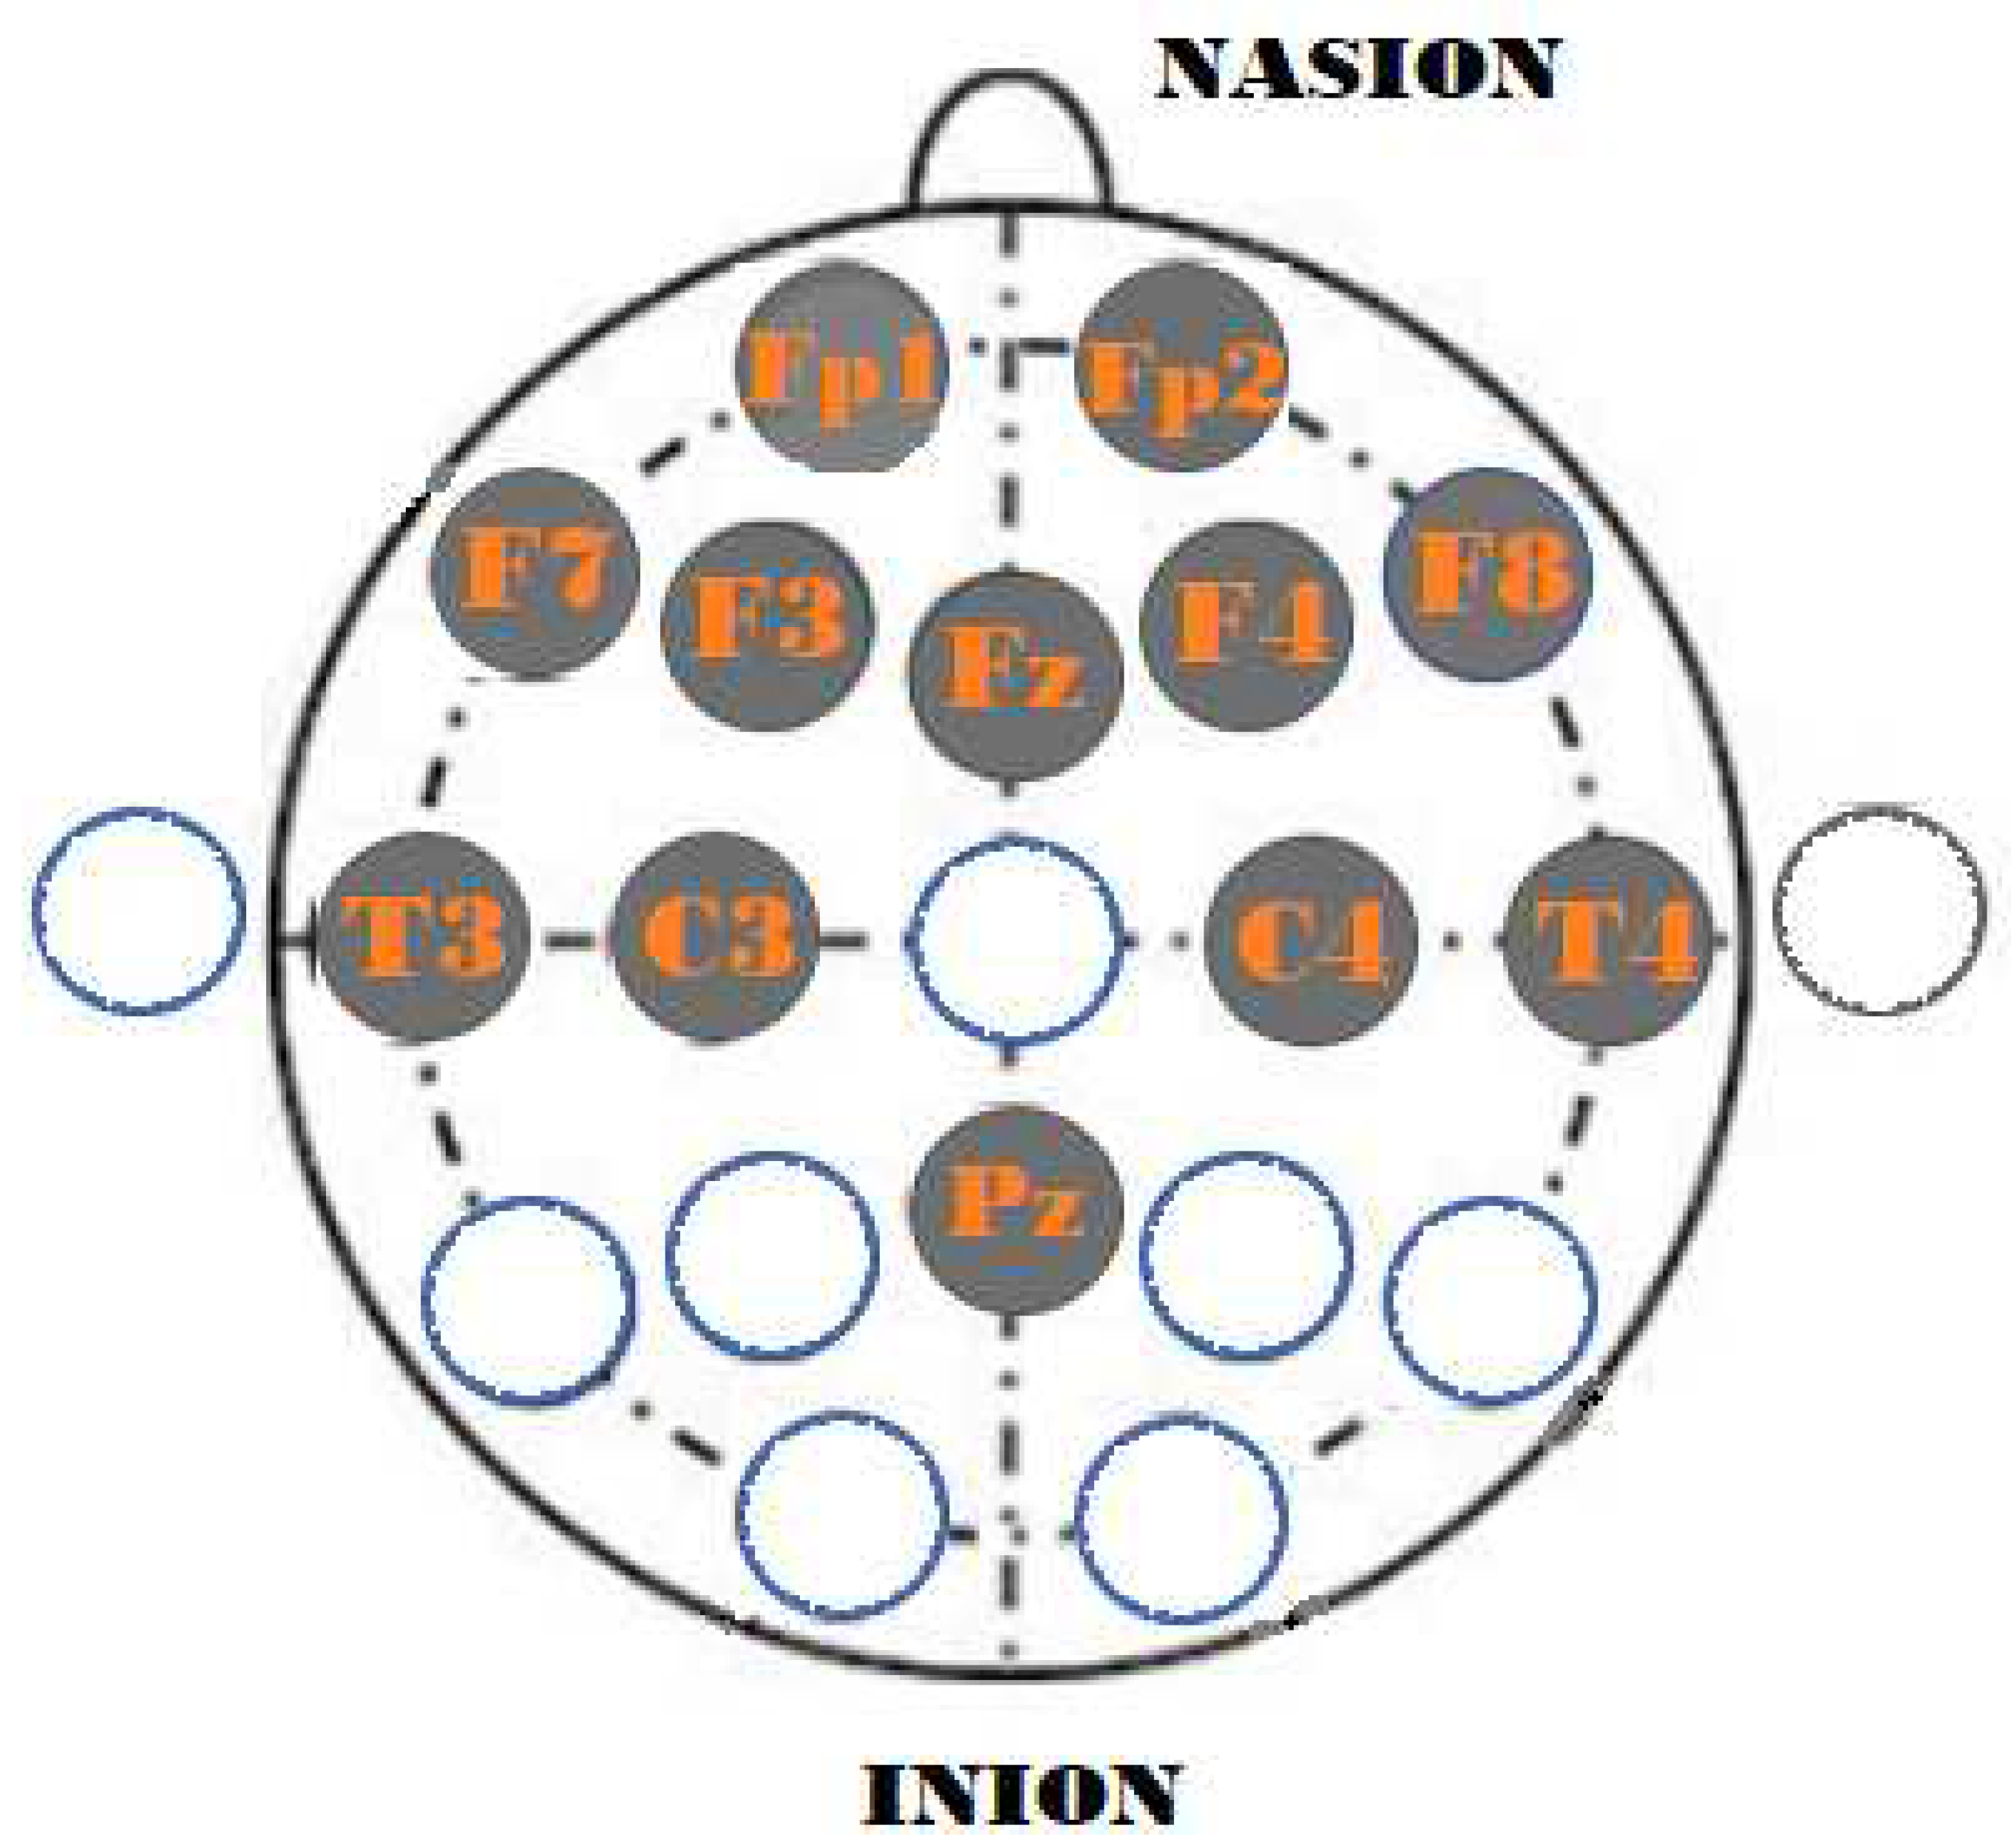
Figure 5.
Convolution operation (overlap) on the recorded signal
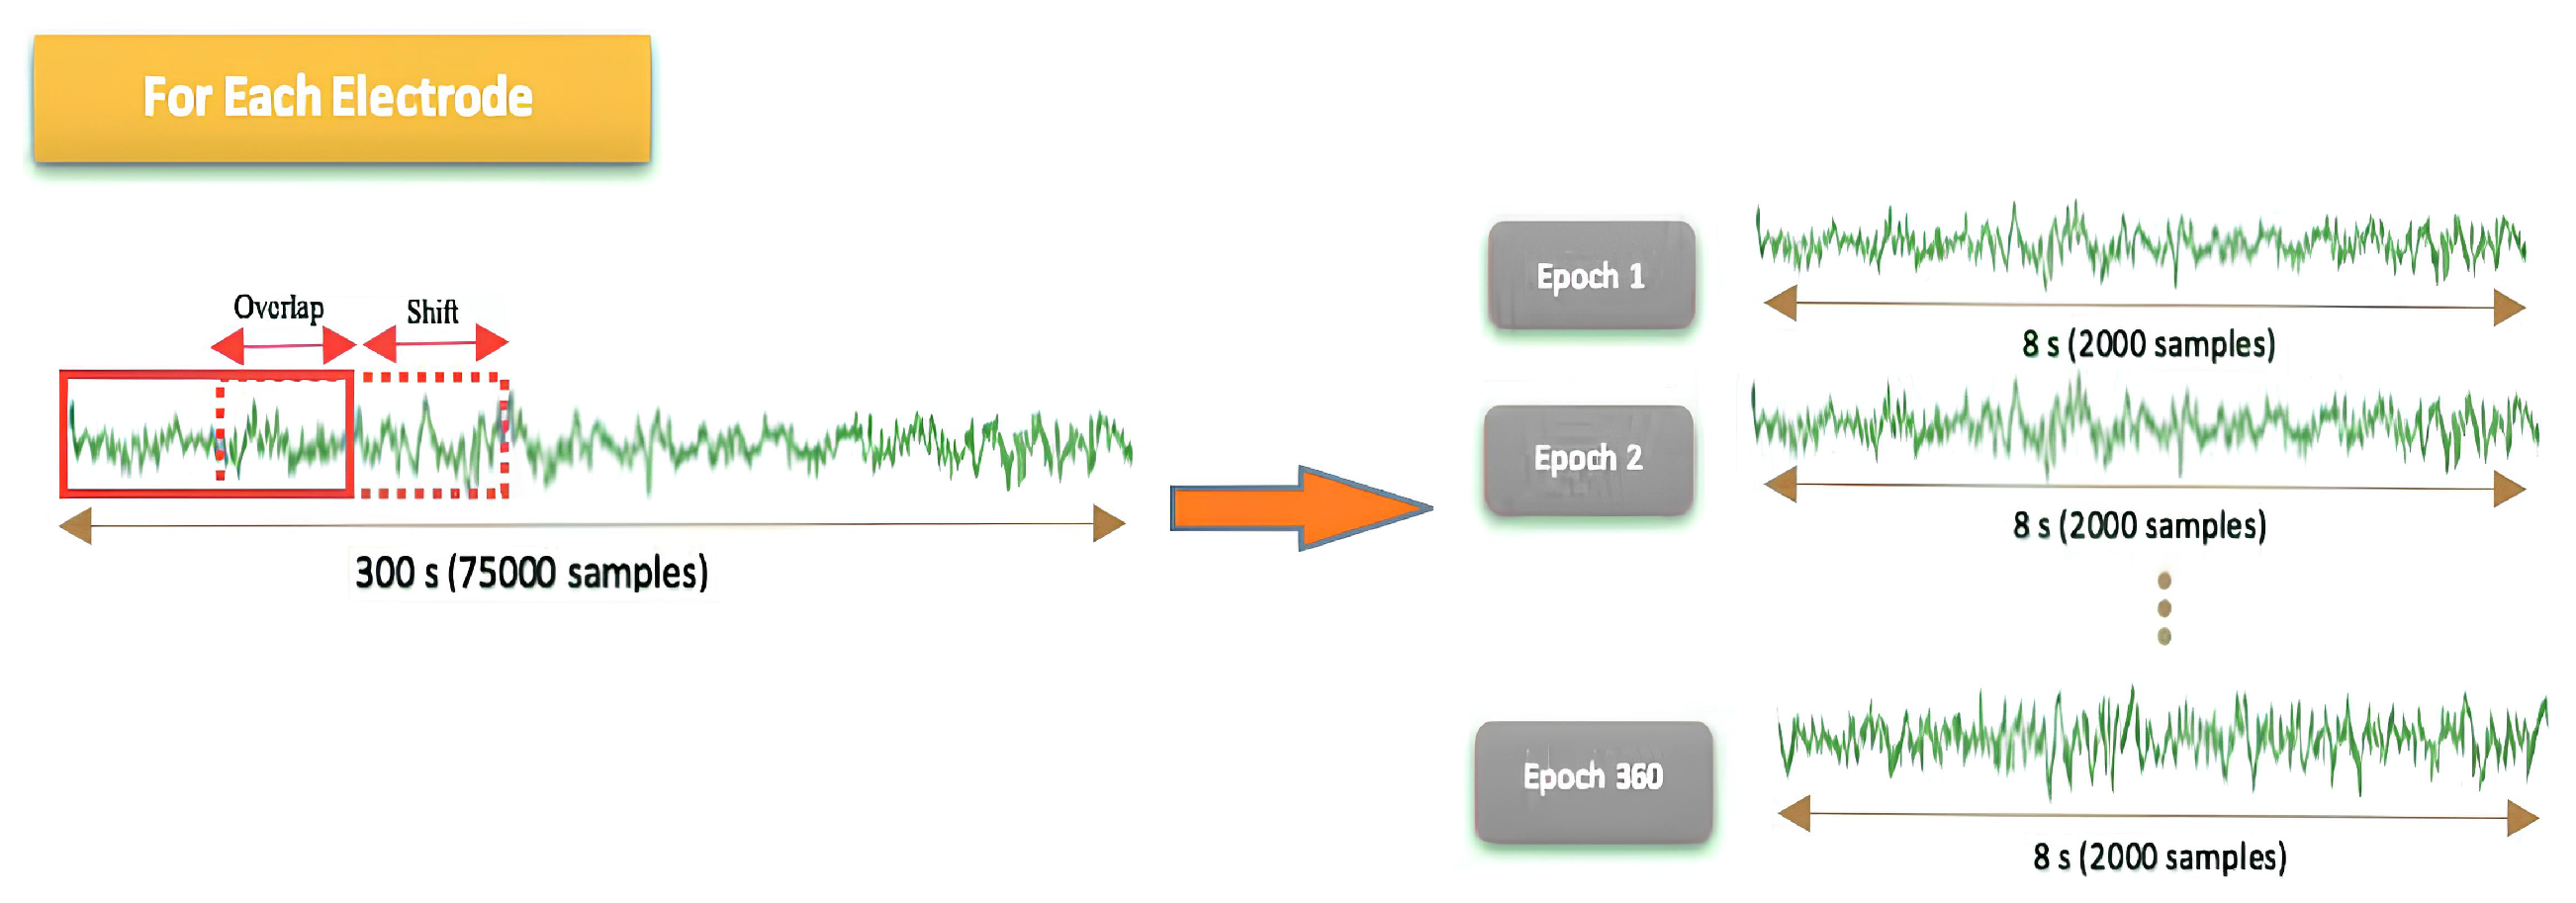
Figure 6.
Details of the proposed deep neural network (CNN-LSTM)
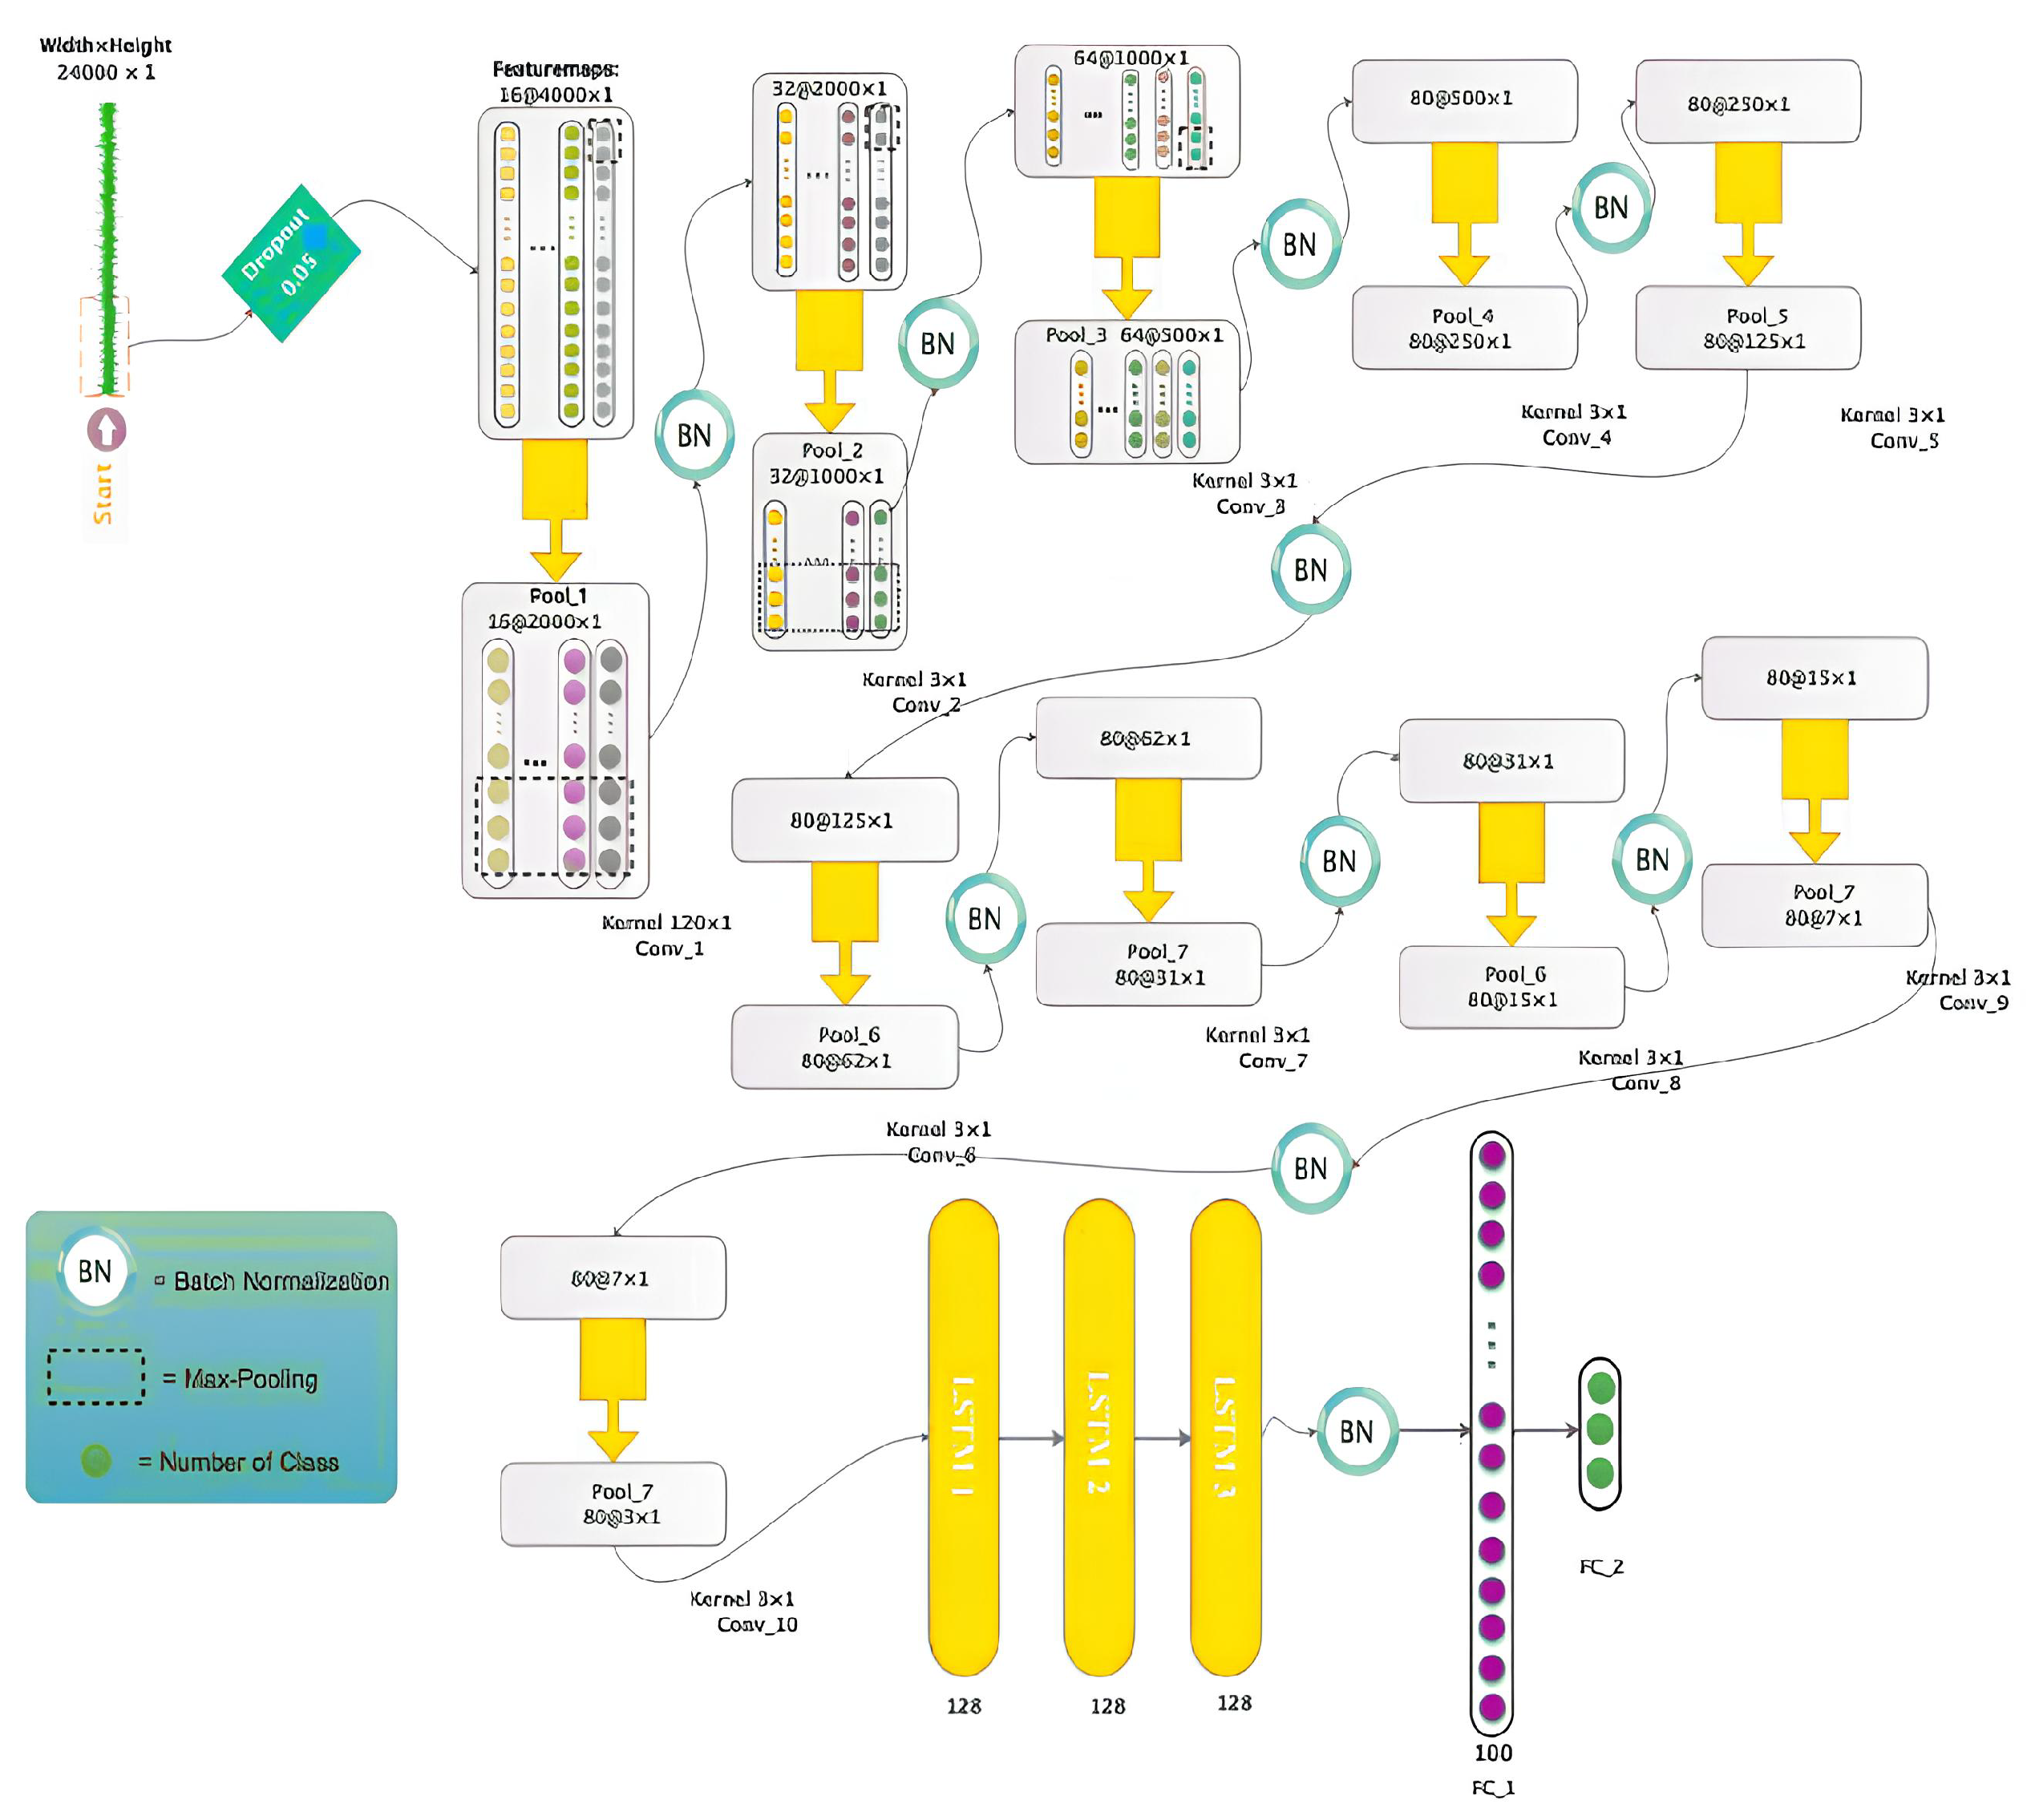
Figure 7.
Allocation of EEG signal data related to the first and second scenarios
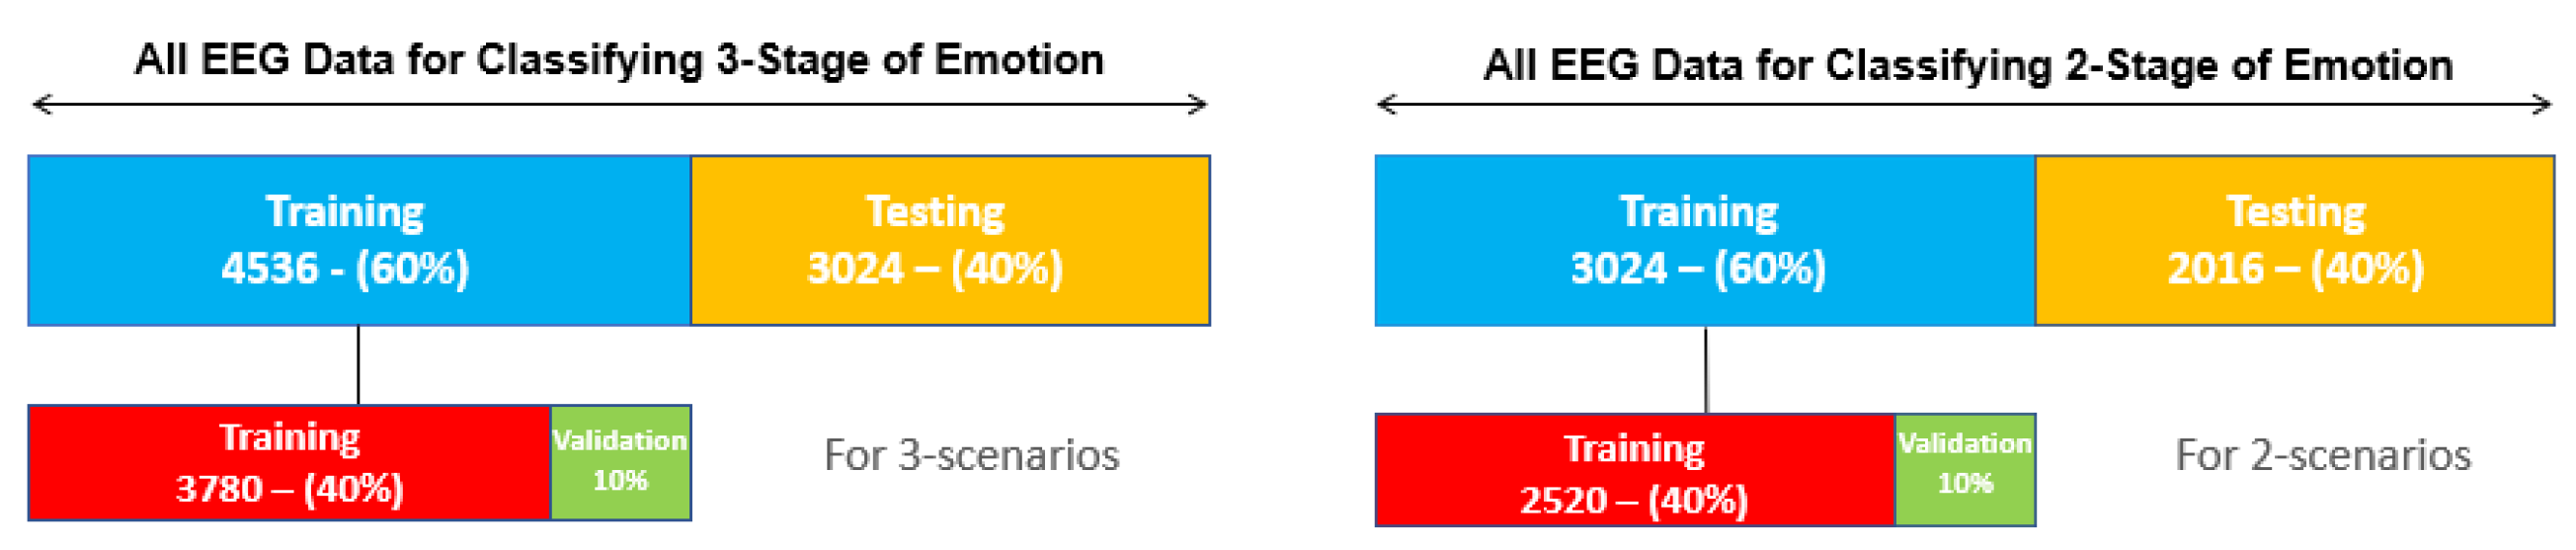
Figure 8.
Error graph for subfigure(a). First scenario (Positive and negative emotions) and subfigure(b). Second scenario (Positive, neutral, and negative emotions)
Figure 8.
Error graph for subfigure(a). First scenario (Positive and negative emotions) and subfigure(b). Second scenario (Positive, neutral, and negative emotions)
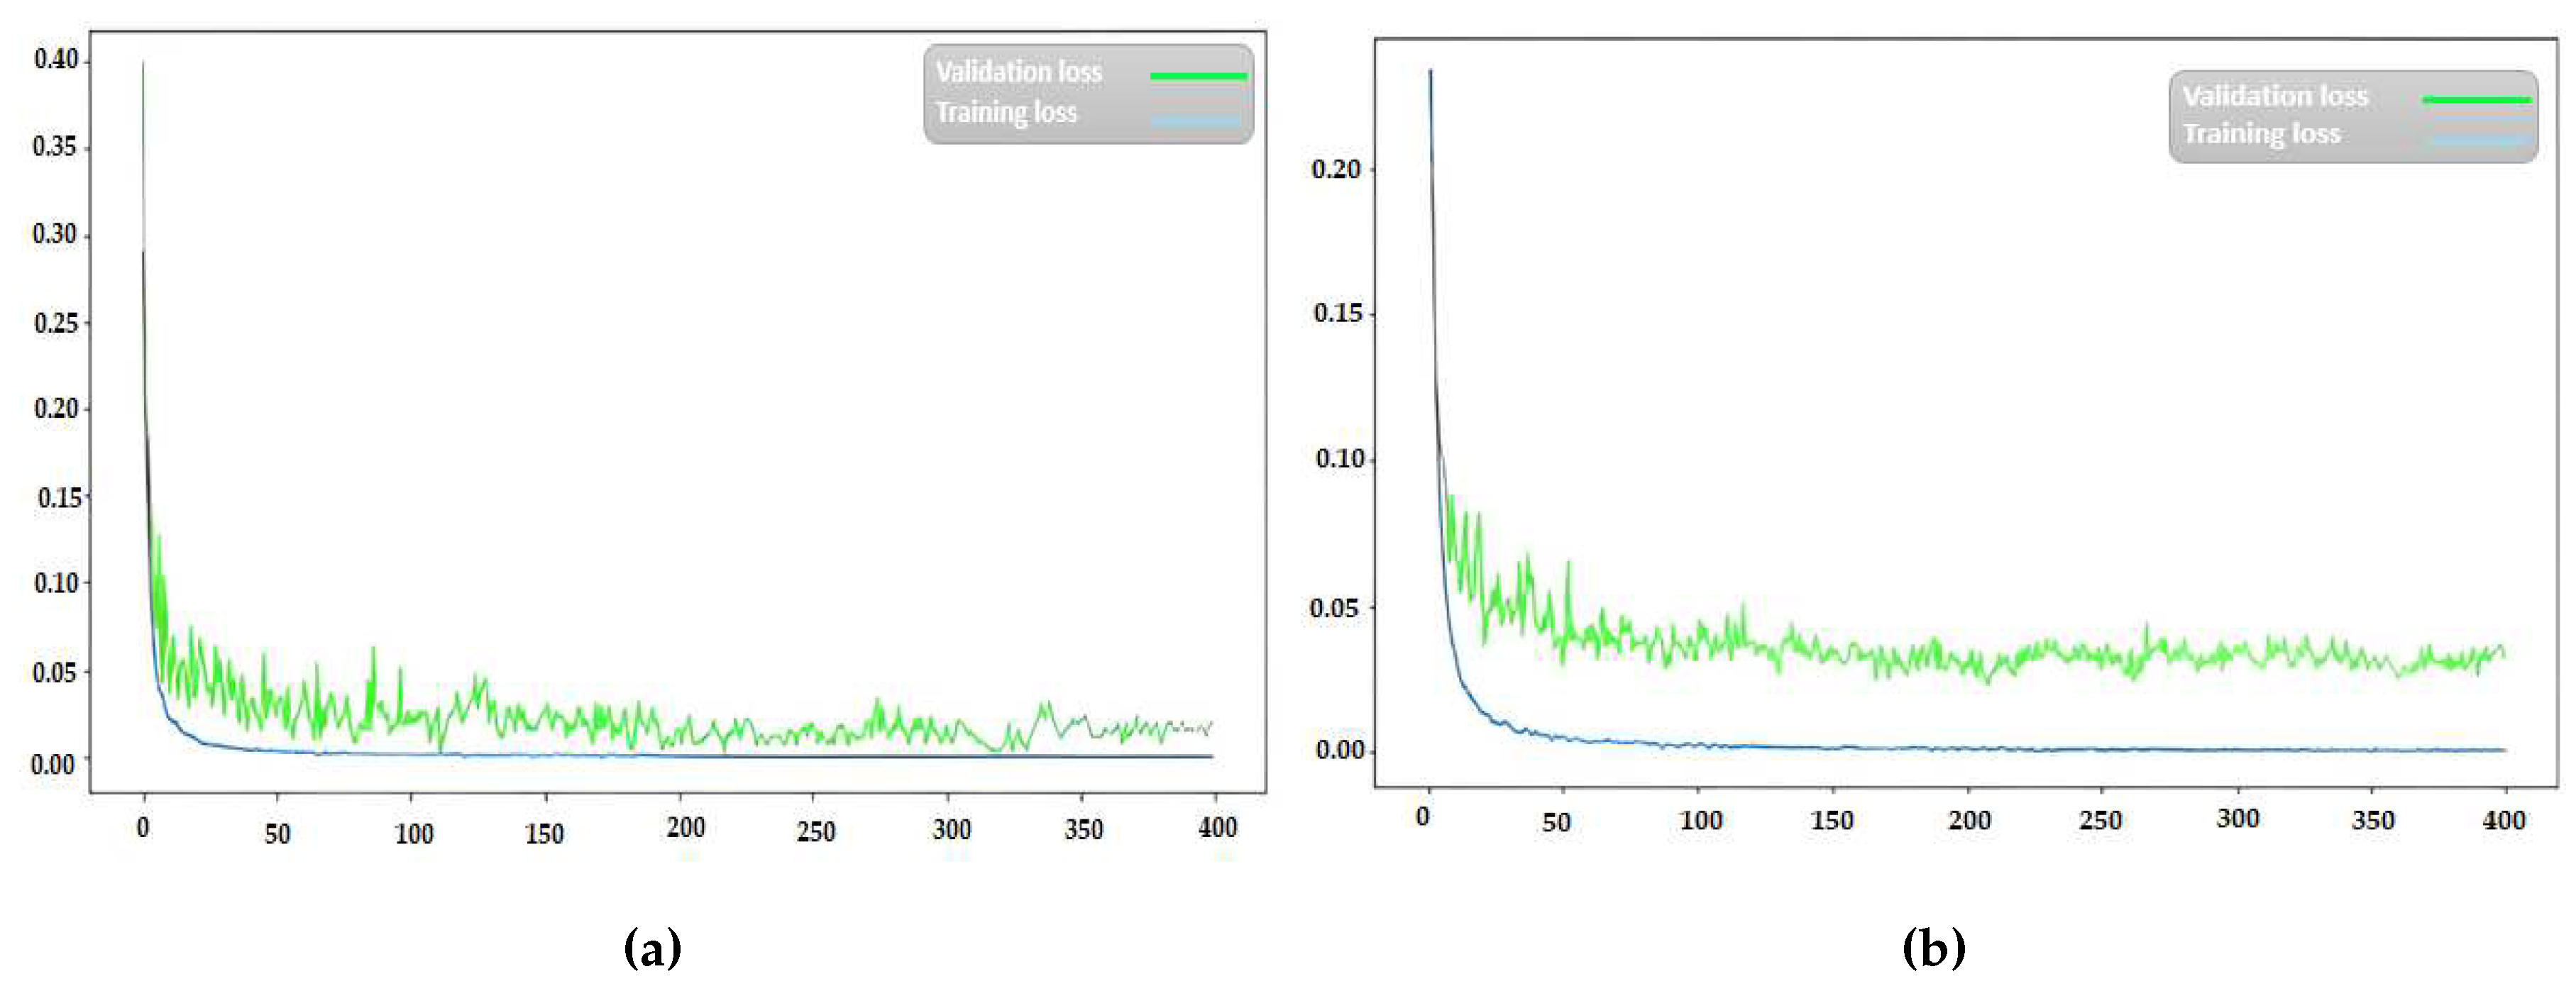
Figure 9.
Accuracy graph subfigure(a). First scenario (Positive and negative emotions) and subgigure(b). Second scenario (Positive, neutral, and negative emotions)
Figure 9.
Accuracy graph subfigure(a). First scenario (Positive and negative emotions) and subgigure(b). Second scenario (Positive, neutral, and negative emotions)
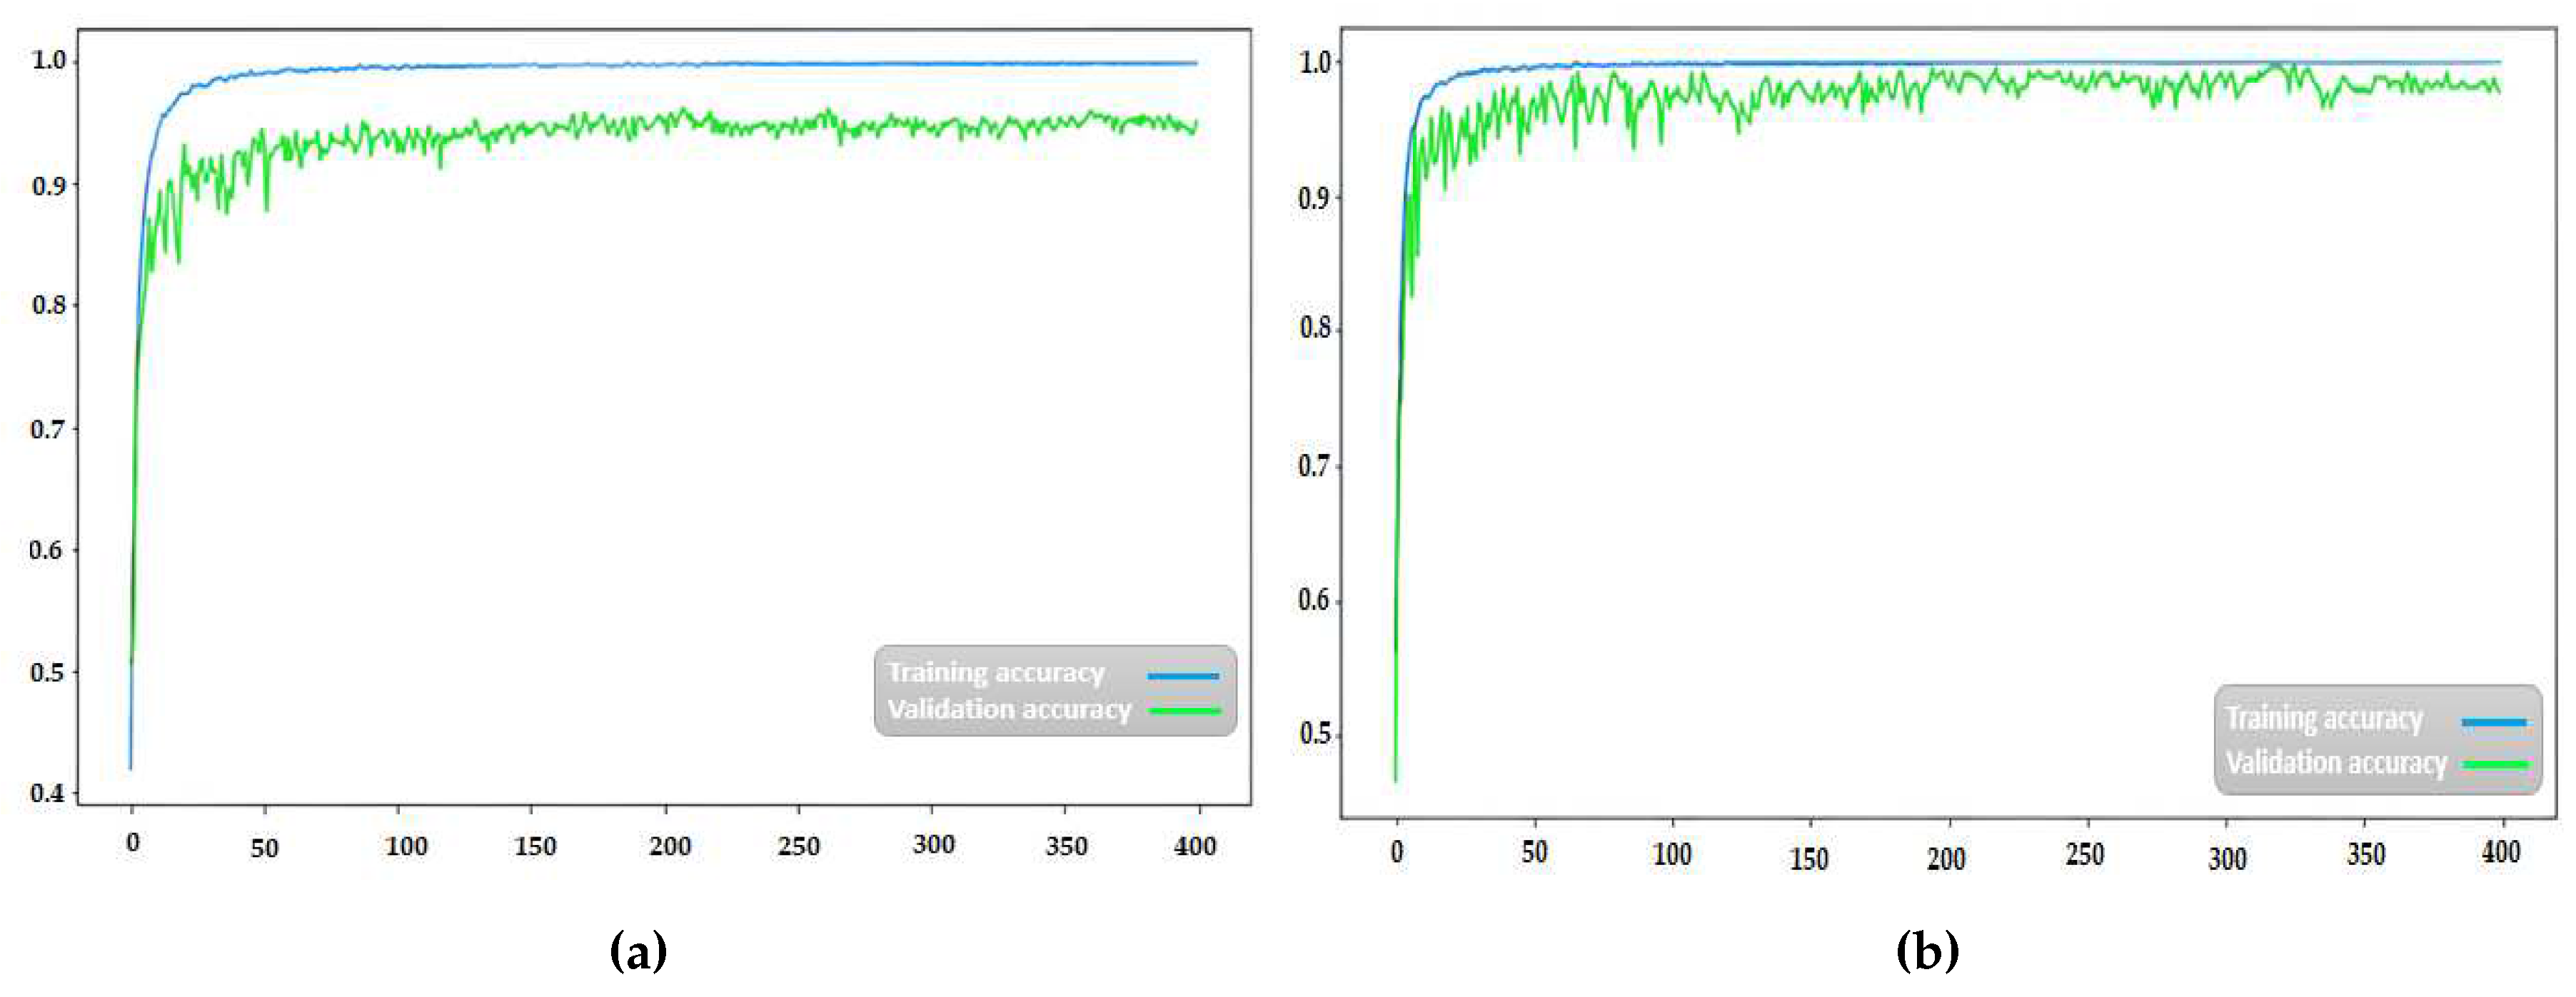
Figure 10.
Confusion matrix for subfigure(a). First scenario (Positive and negative emotions) and sunfigure(b). Second scenario (Positive, neutral, and negative emotions).
Figure 10.
Confusion matrix for subfigure(a). First scenario (Positive and negative emotions) and sunfigure(b). Second scenario (Positive, neutral, and negative emotions).
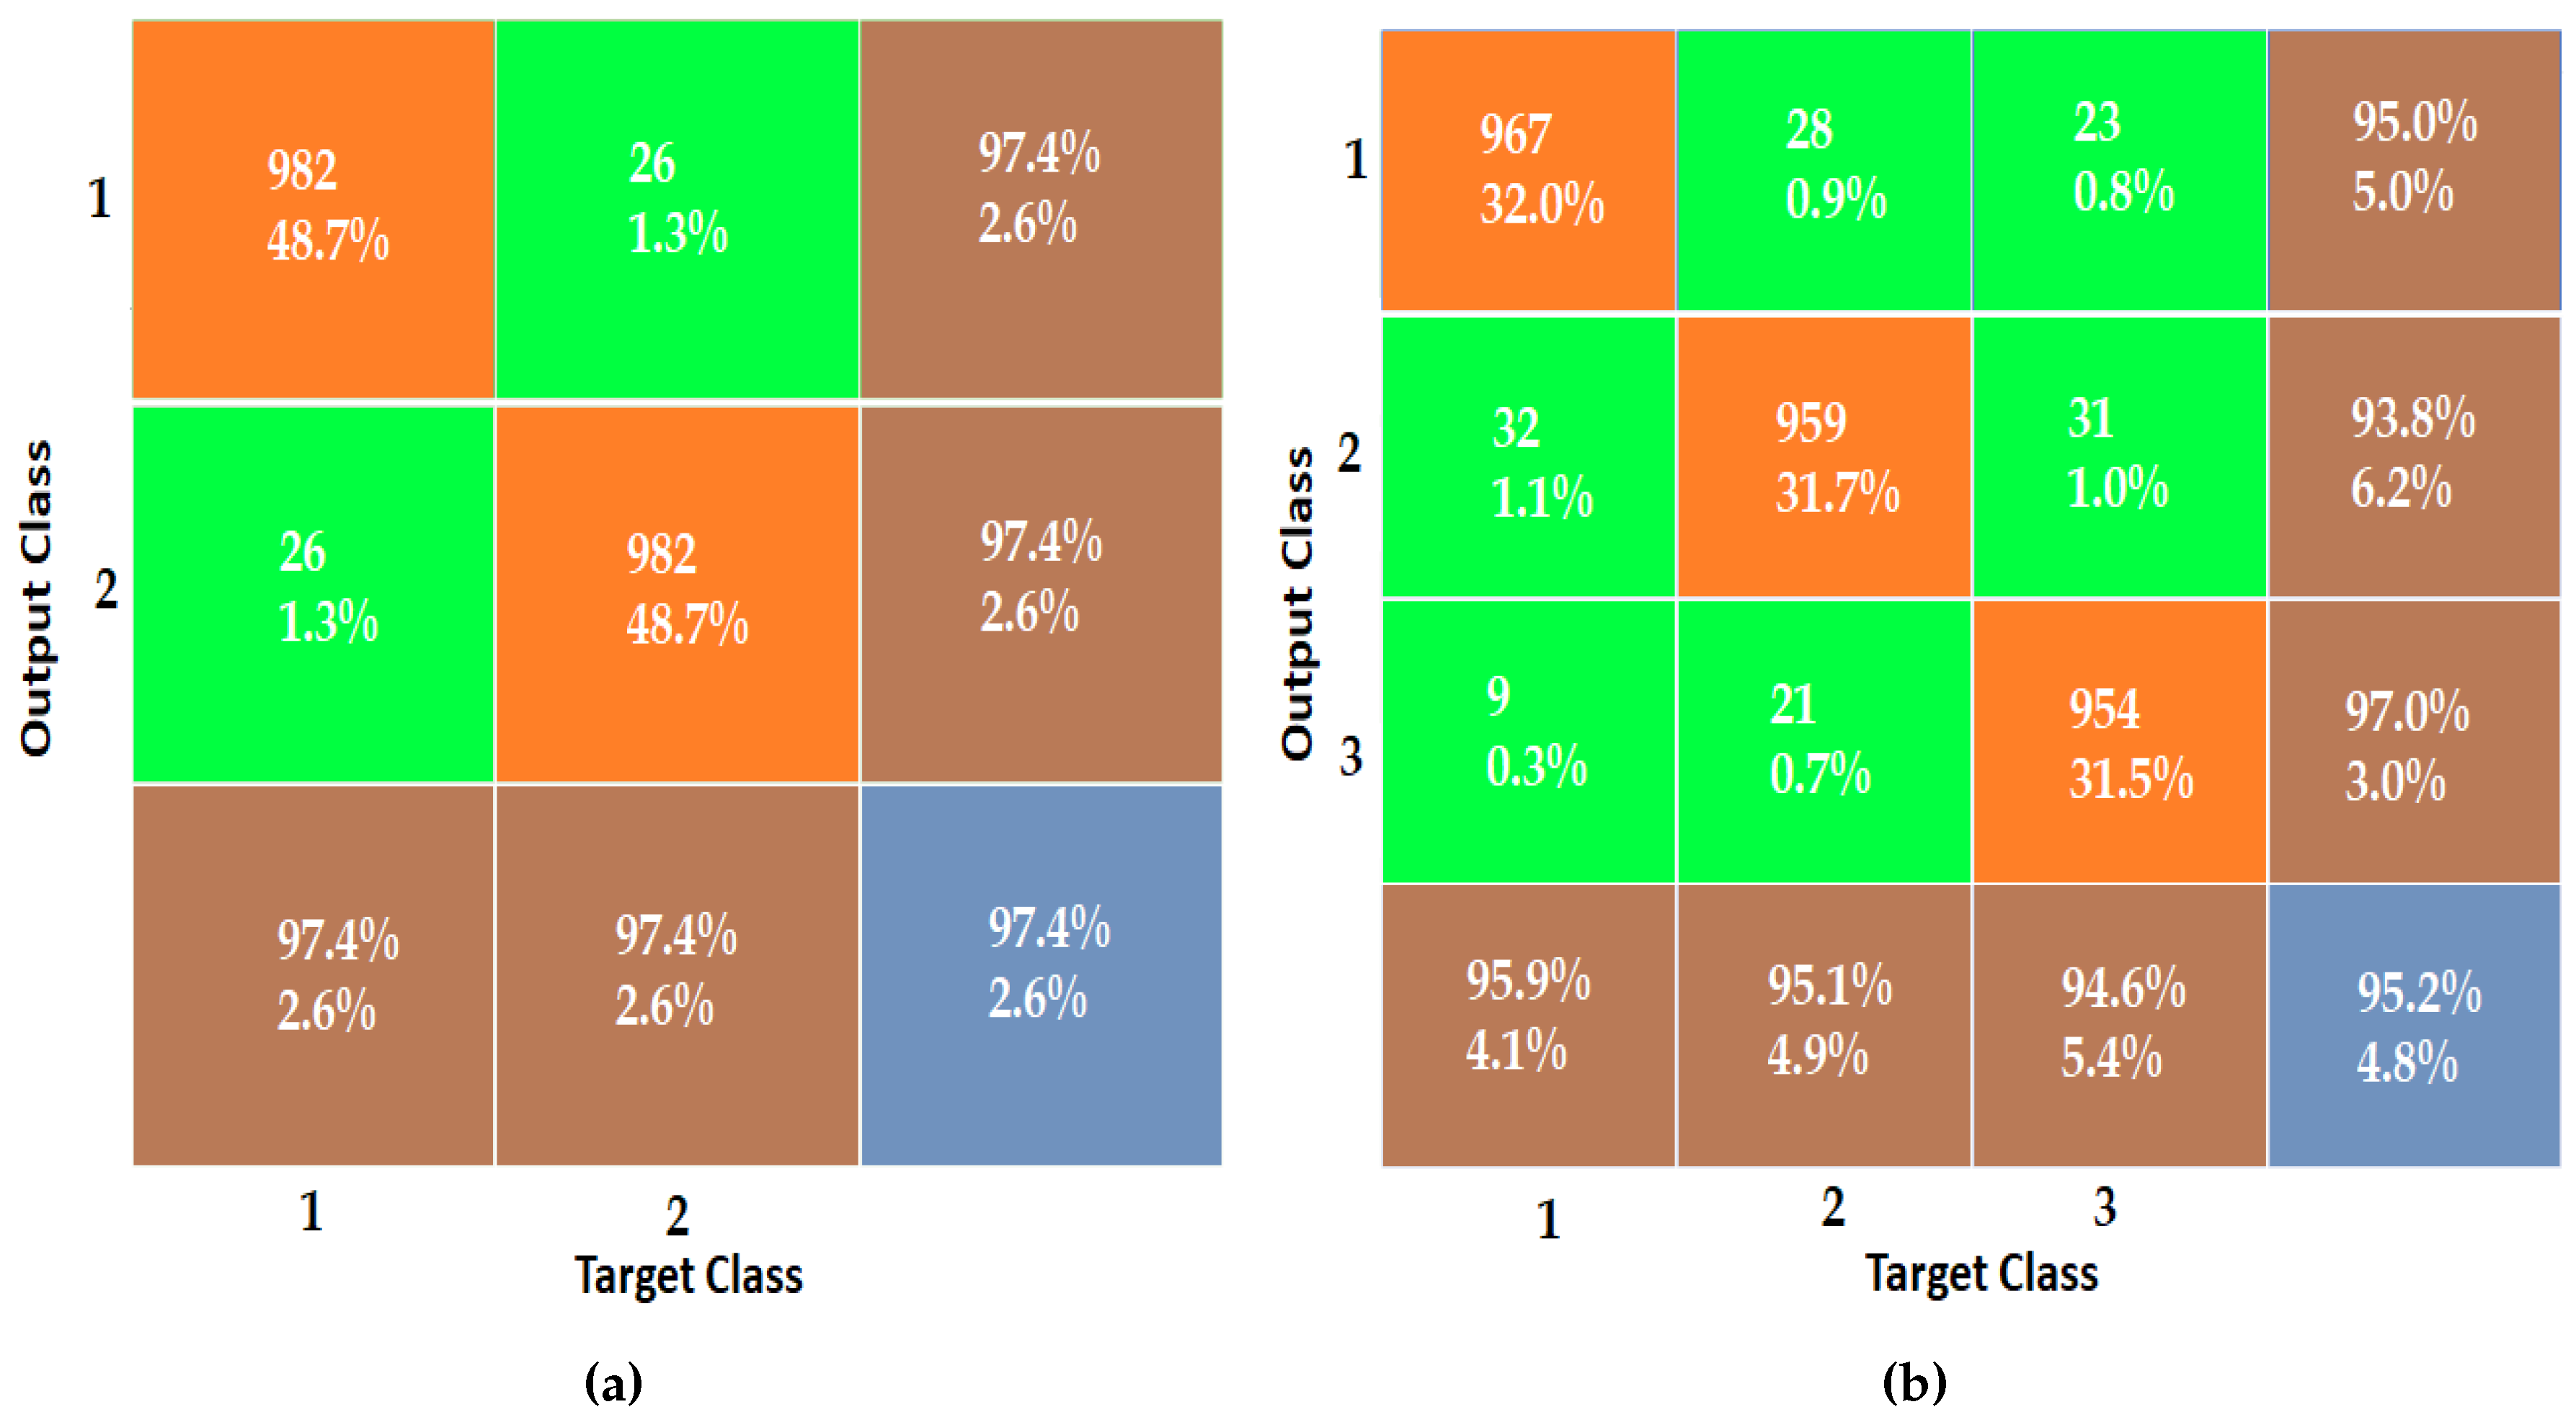
Figure 11.
Bar chart (including accuracy, sensitivity, specificity, and precision) for the first scenario and the second scenario
Figure 11.
Bar chart (including accuracy, sensitivity, specificity, and precision) for the first scenario and the second scenario
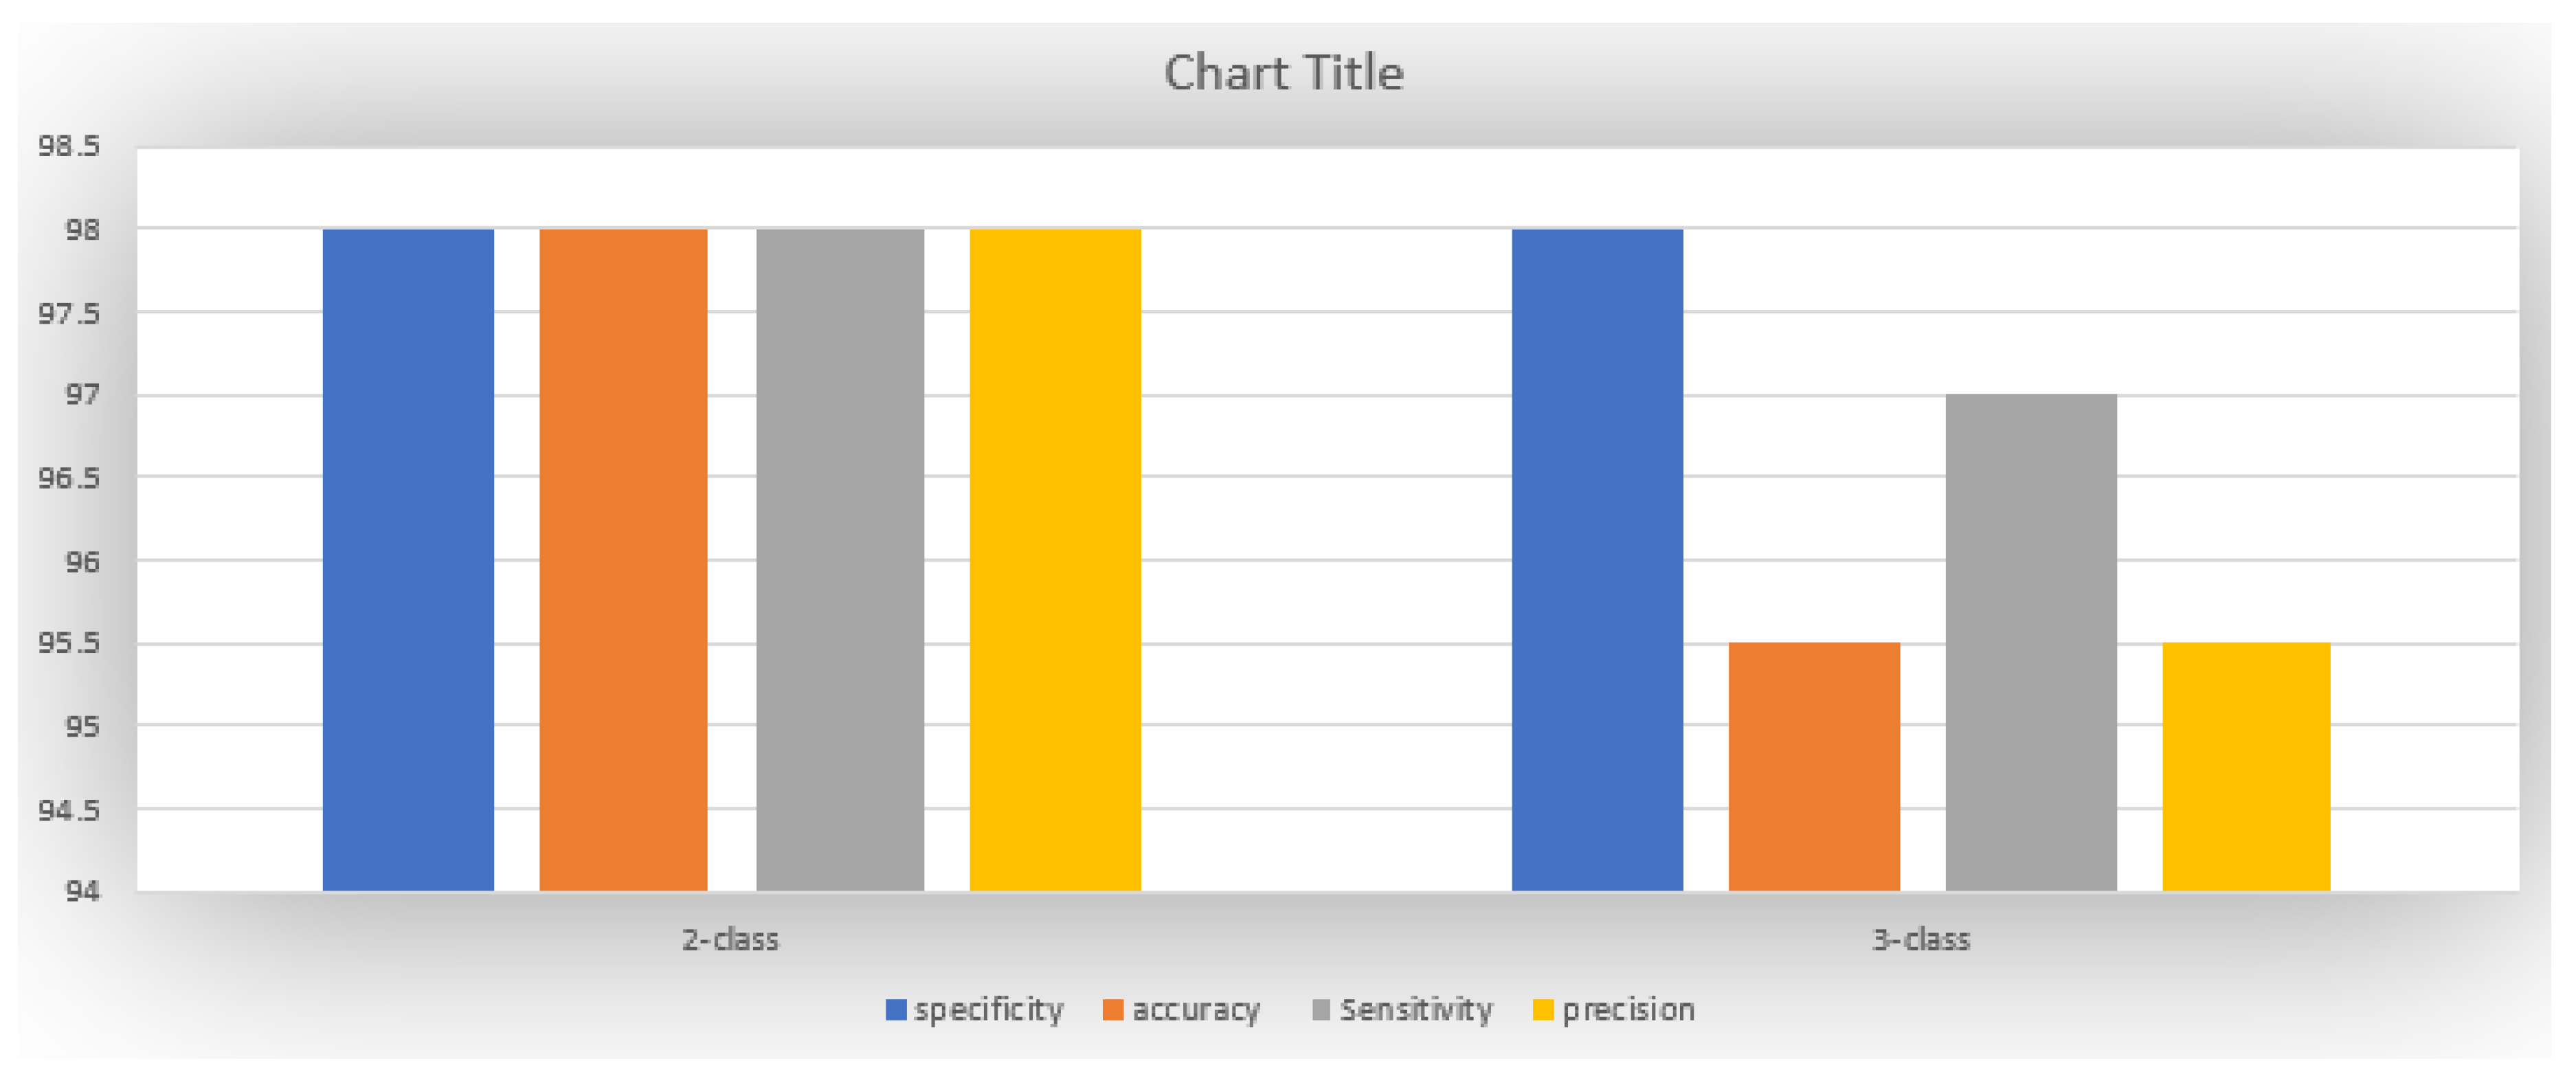
Figure 12.
t-SNE plot for different convolutional layers for subfigure A. First scenario and subfigure B. Second scenario
Figure 12.
t-SNE plot for different convolutional layers for subfigure A. First scenario and subfigure B. Second scenario
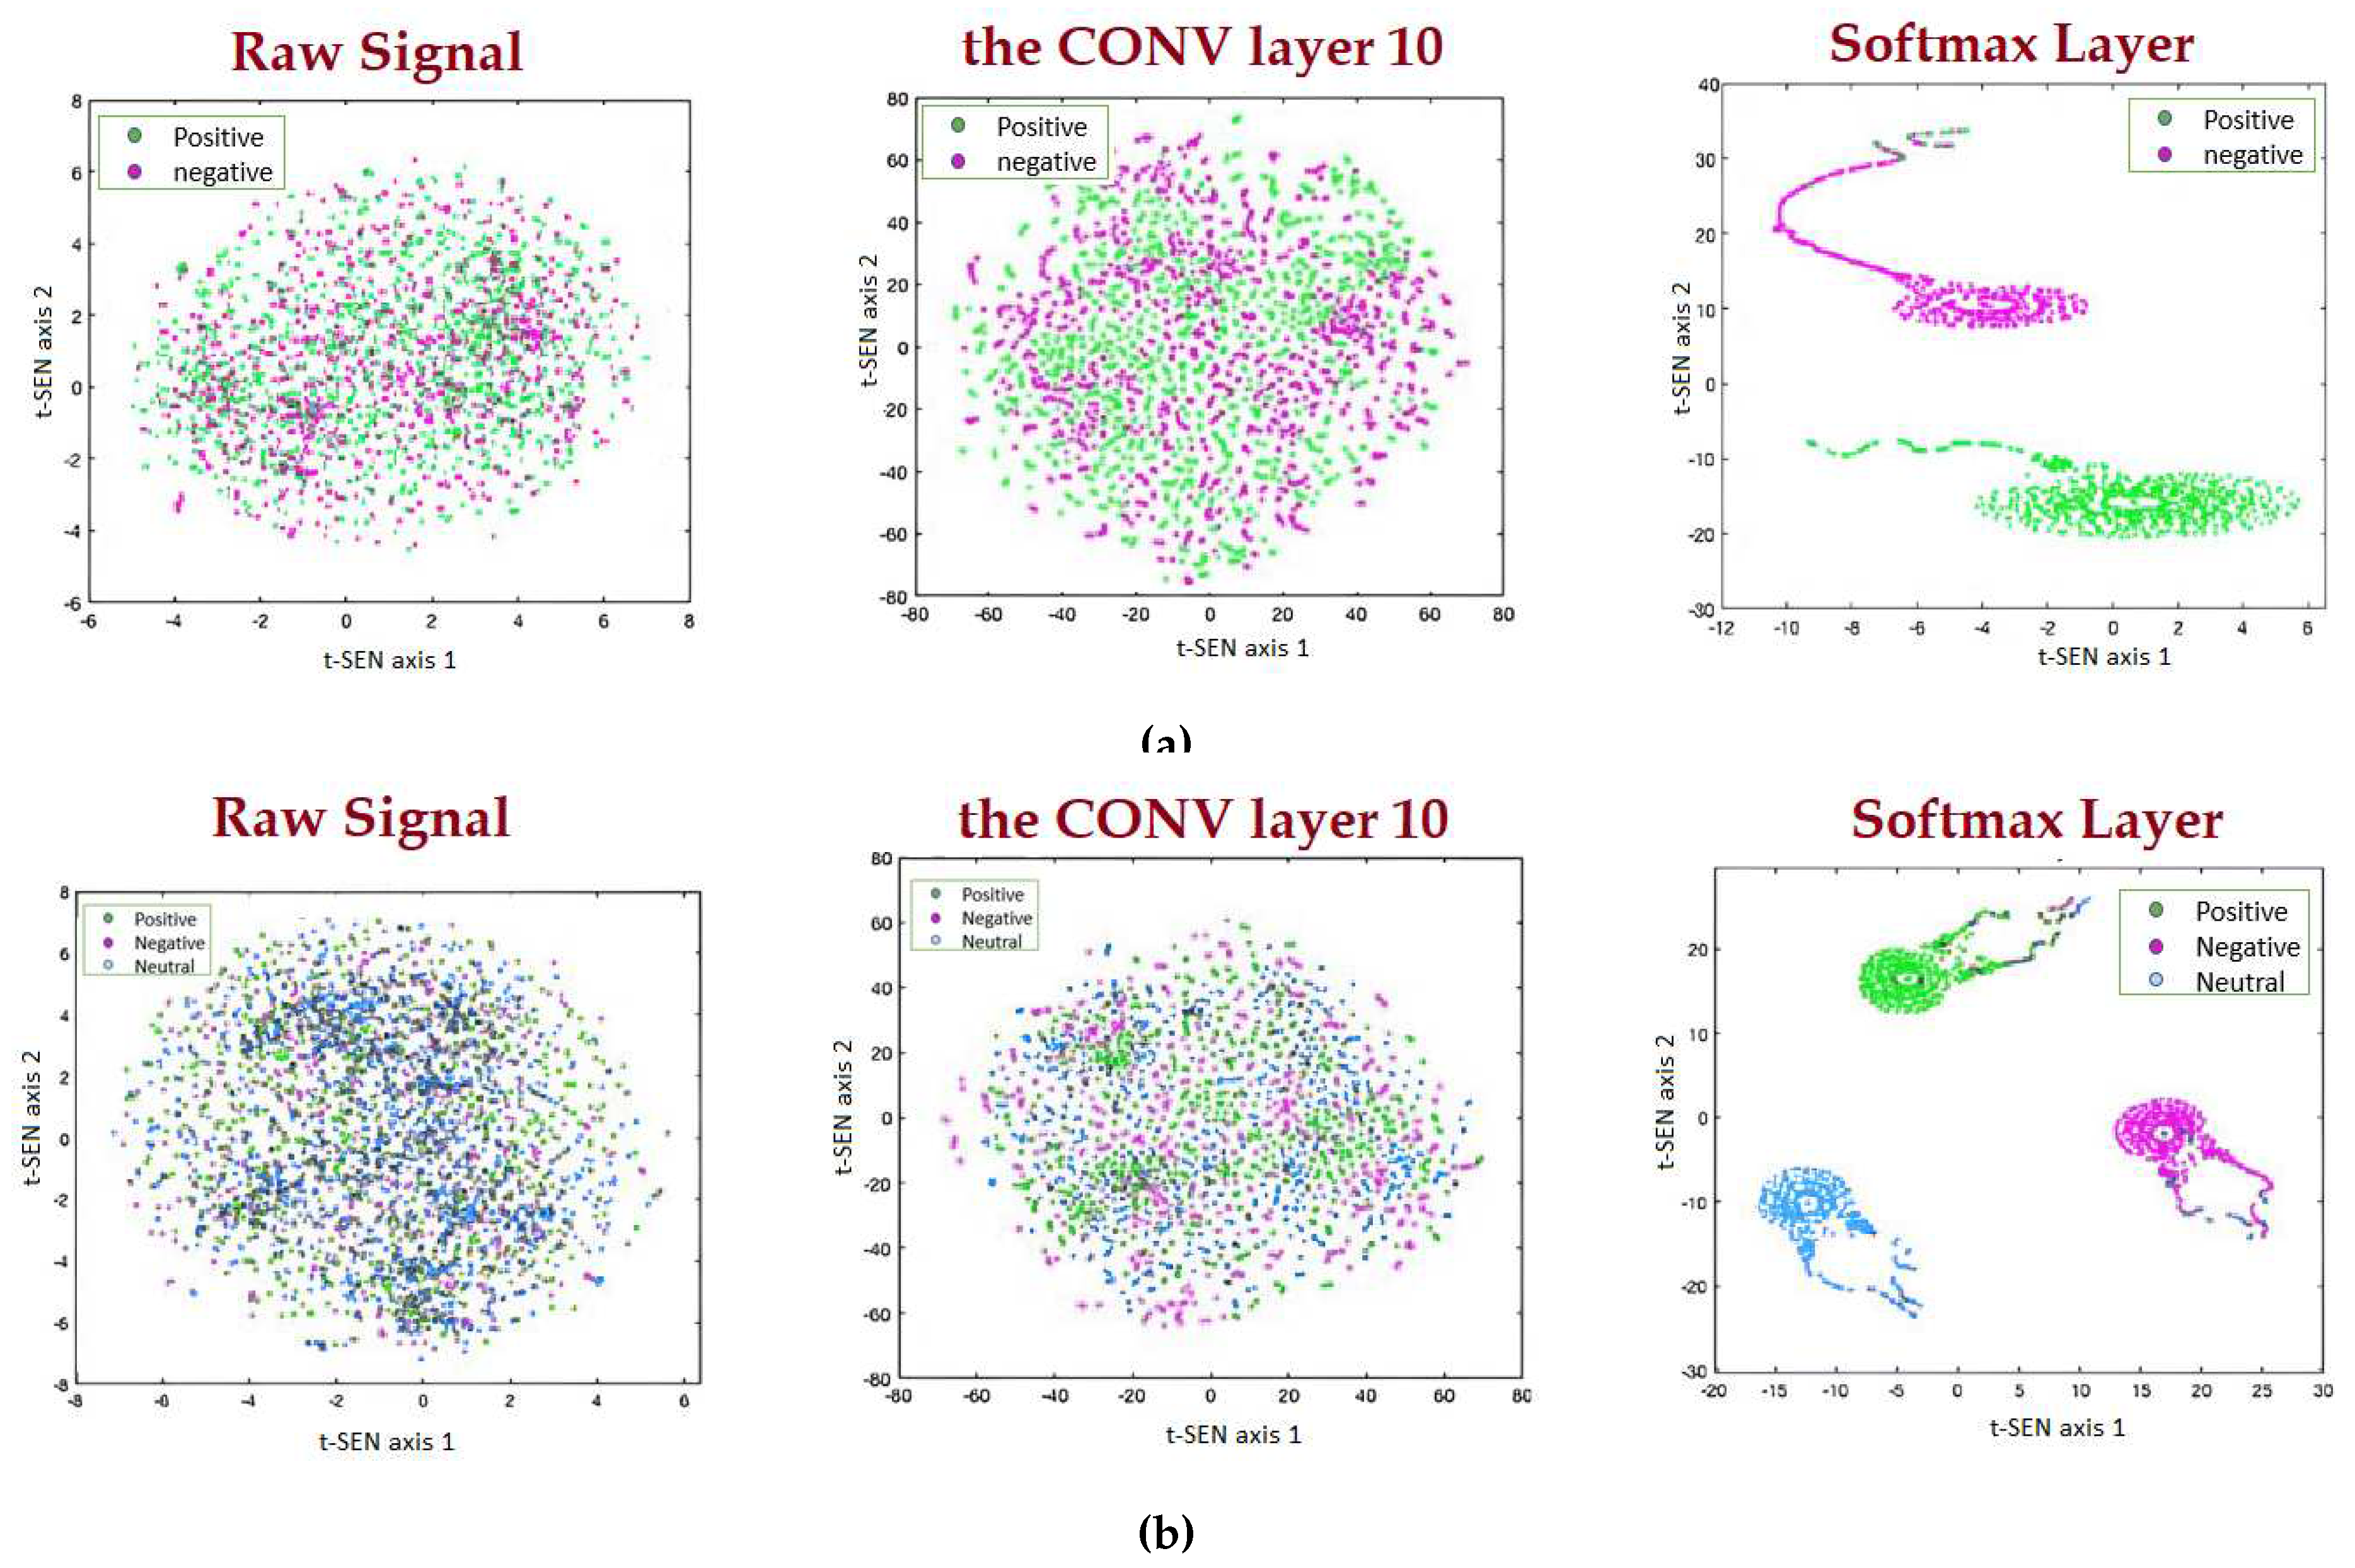
Figure 13.
Performance of the proposed deep neural network (CNN-LSTM) compared to CNN, DBM, and MLP networks for the second scenario
Figure 13.
Performance of the proposed deep neural network (CNN-LSTM) compared to CNN, DBM, and MLP networks for the second scenario
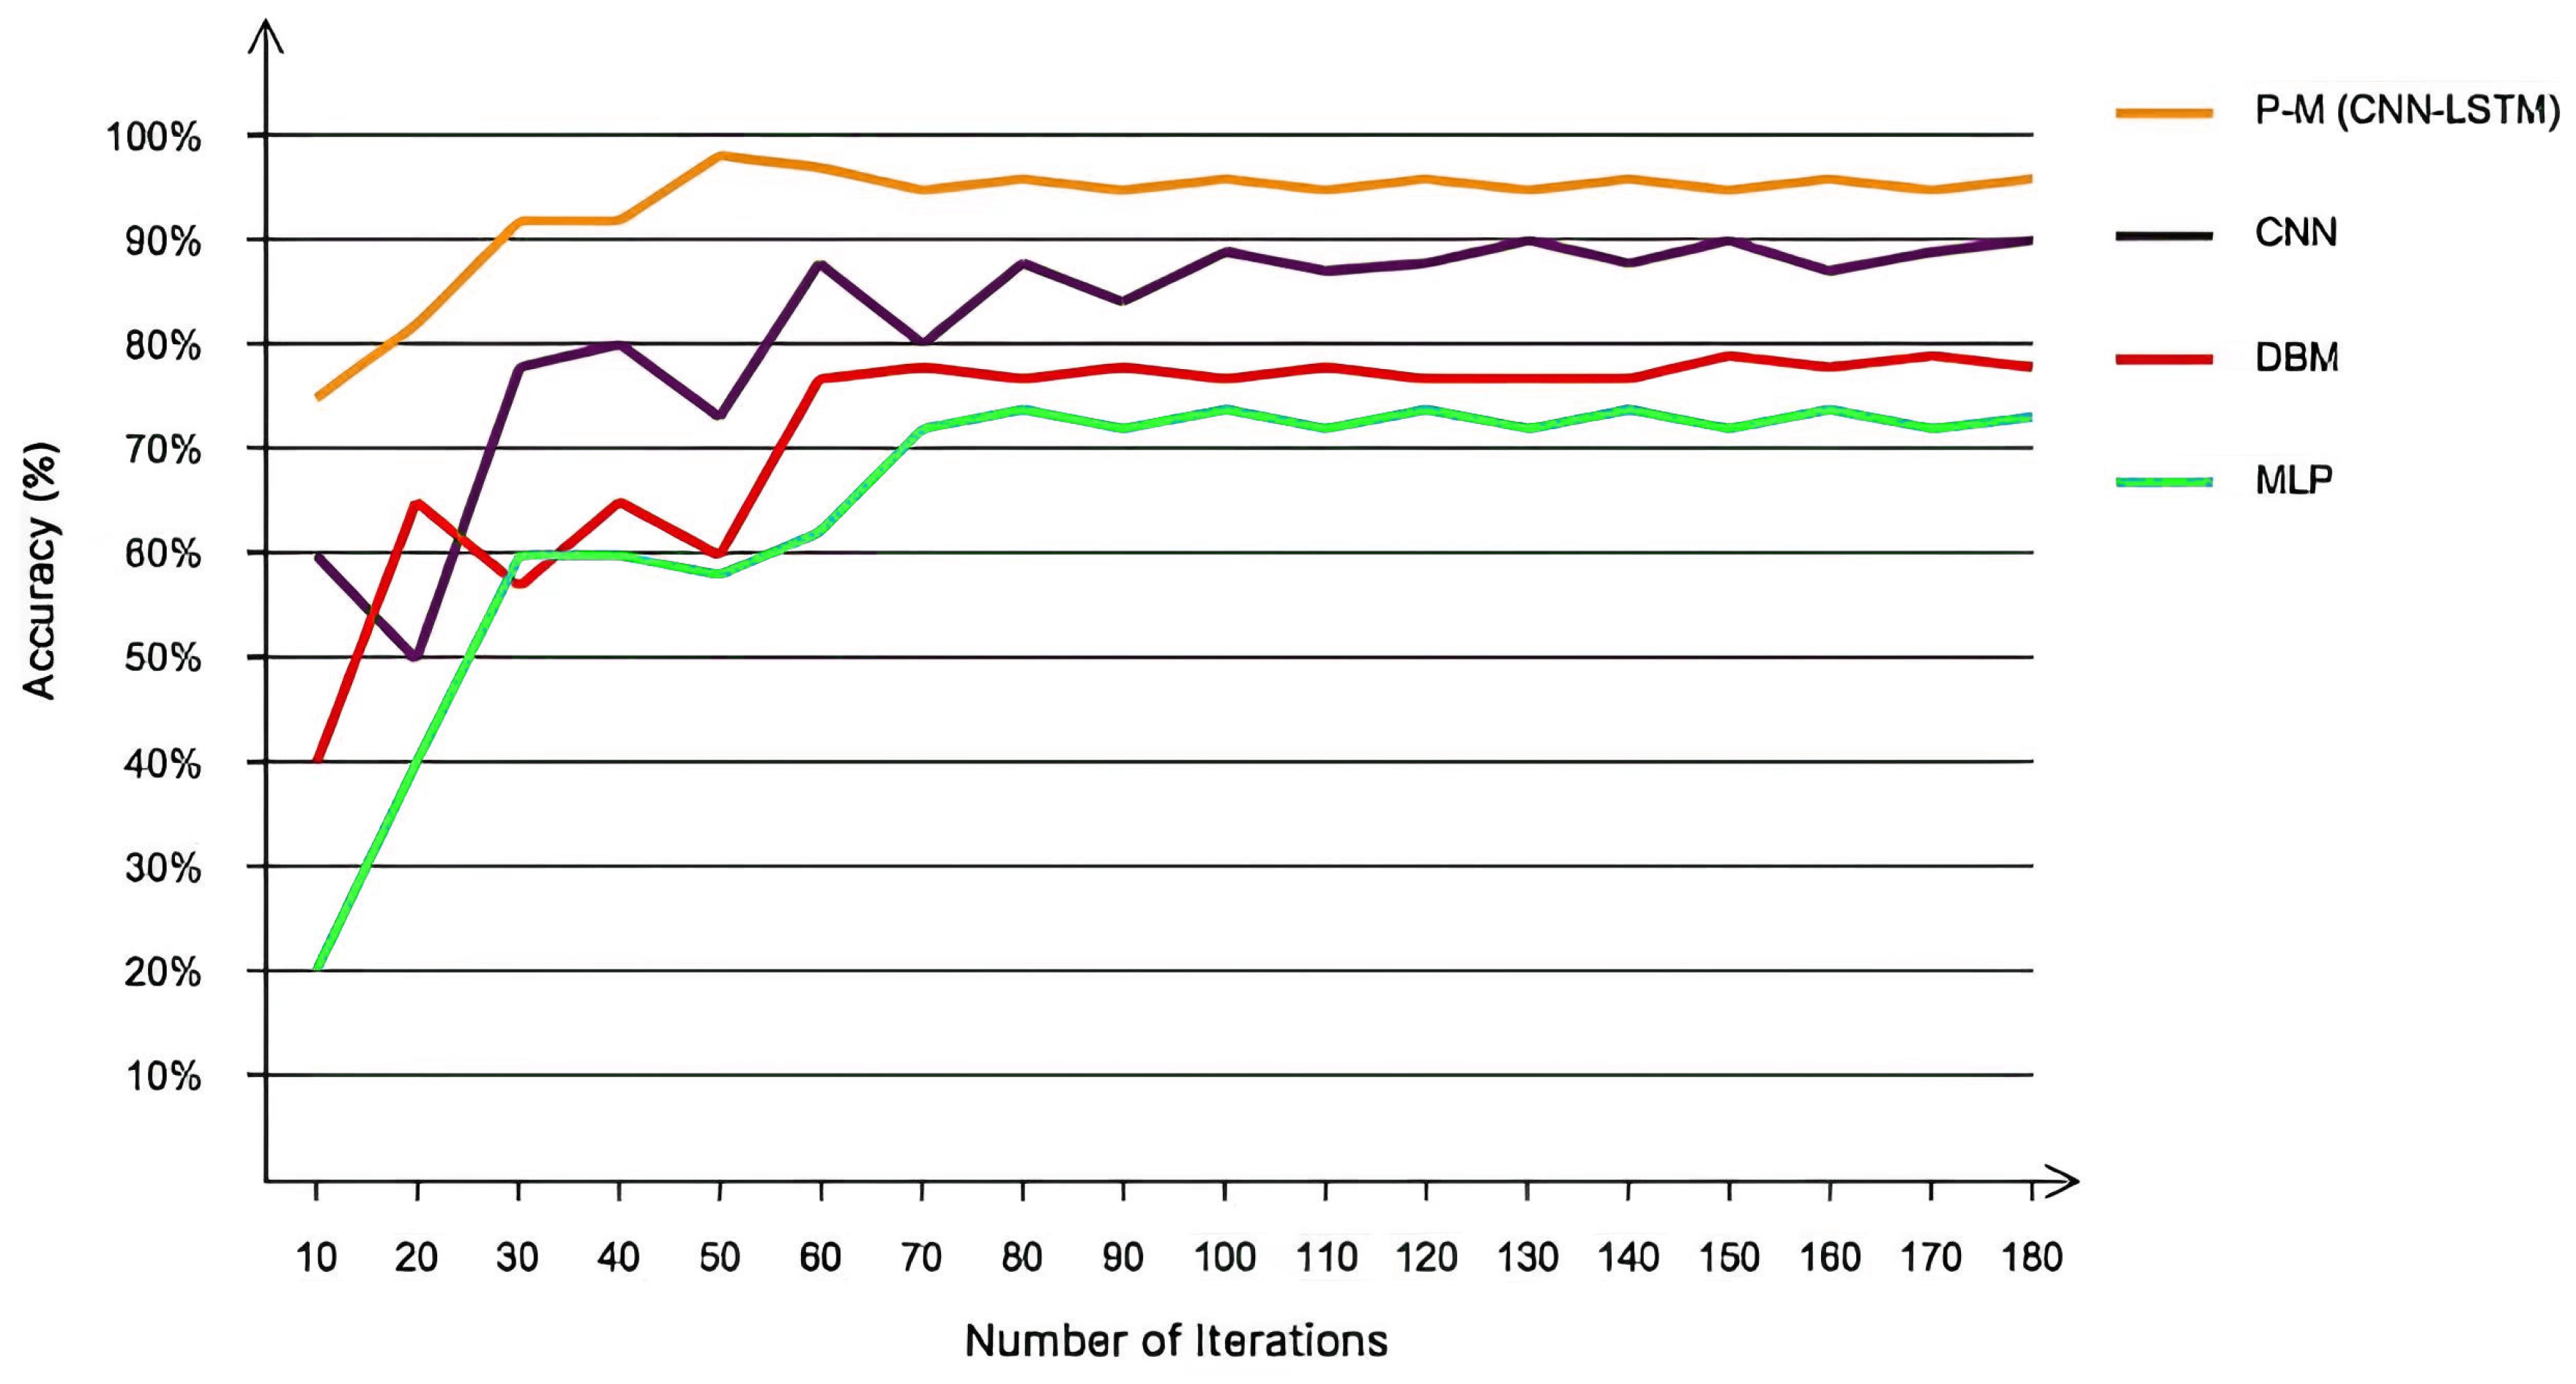
Figure 14.
Comparison of the accuracy of the proposed deep network compared to other methods in a noisy environment
Figure 14.
Comparison of the accuracy of the proposed deep network compared to other methods in a noisy environment
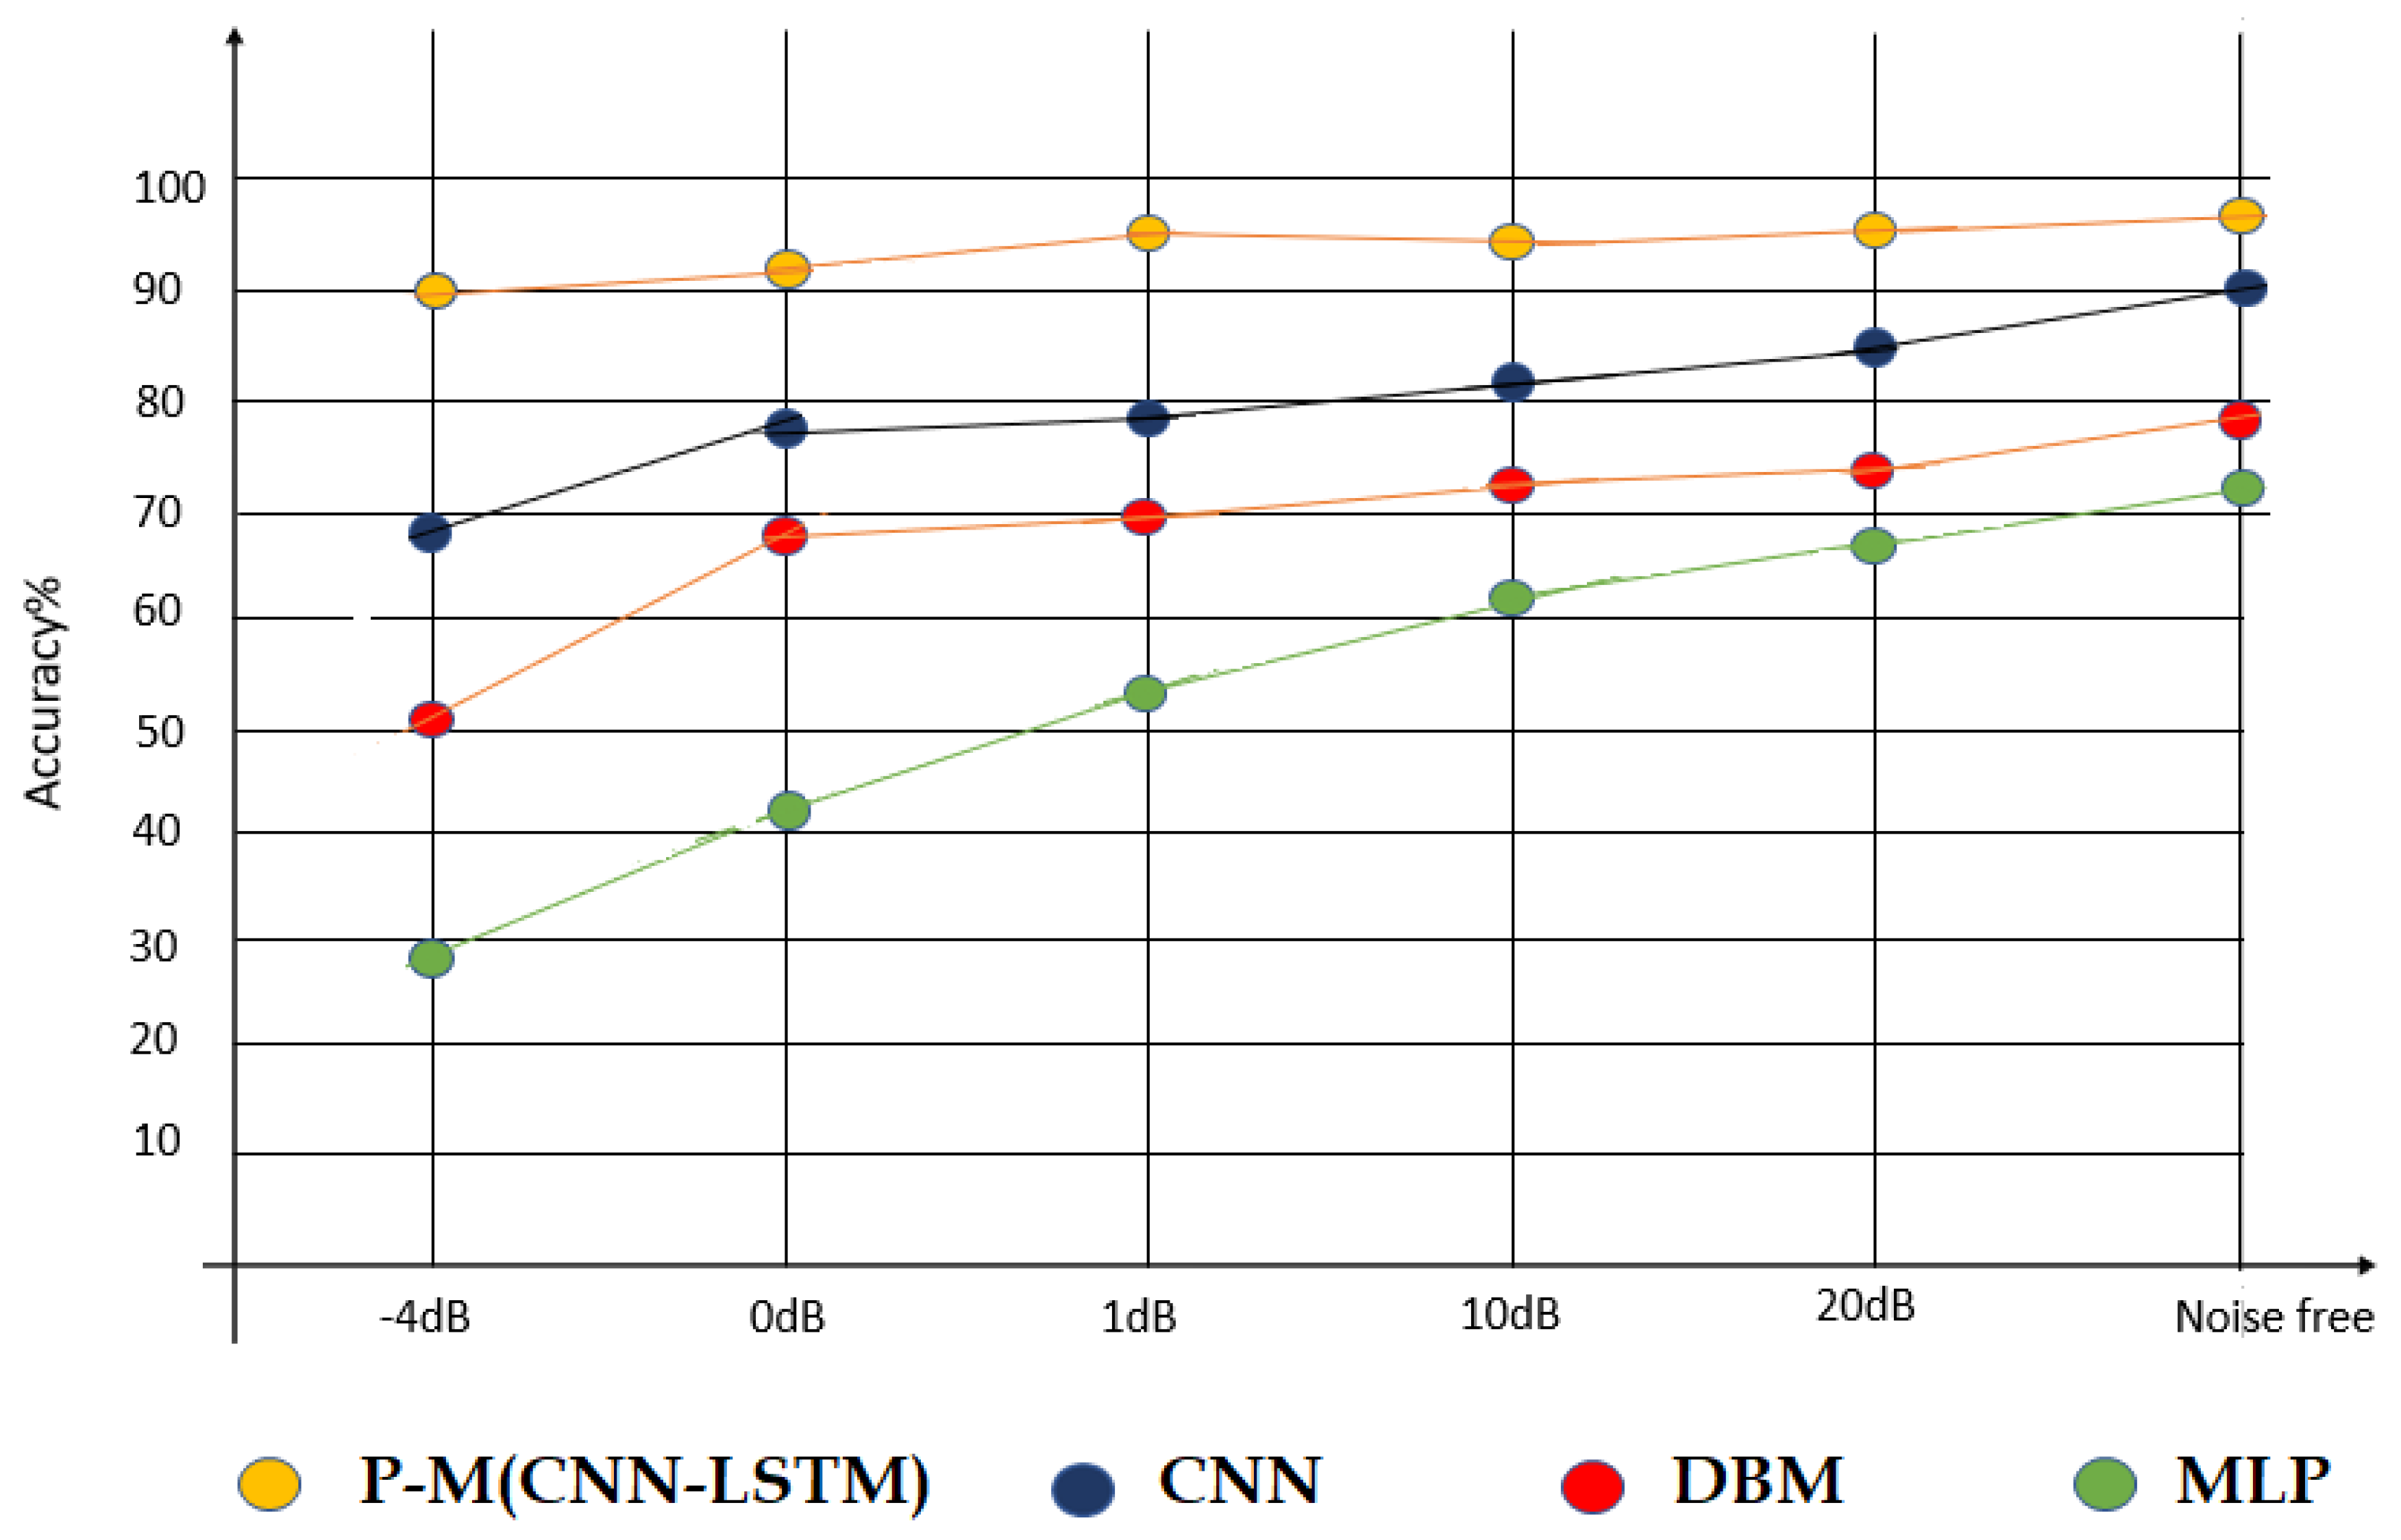

Table 1.
Validation of participants in the EEG signal recording process
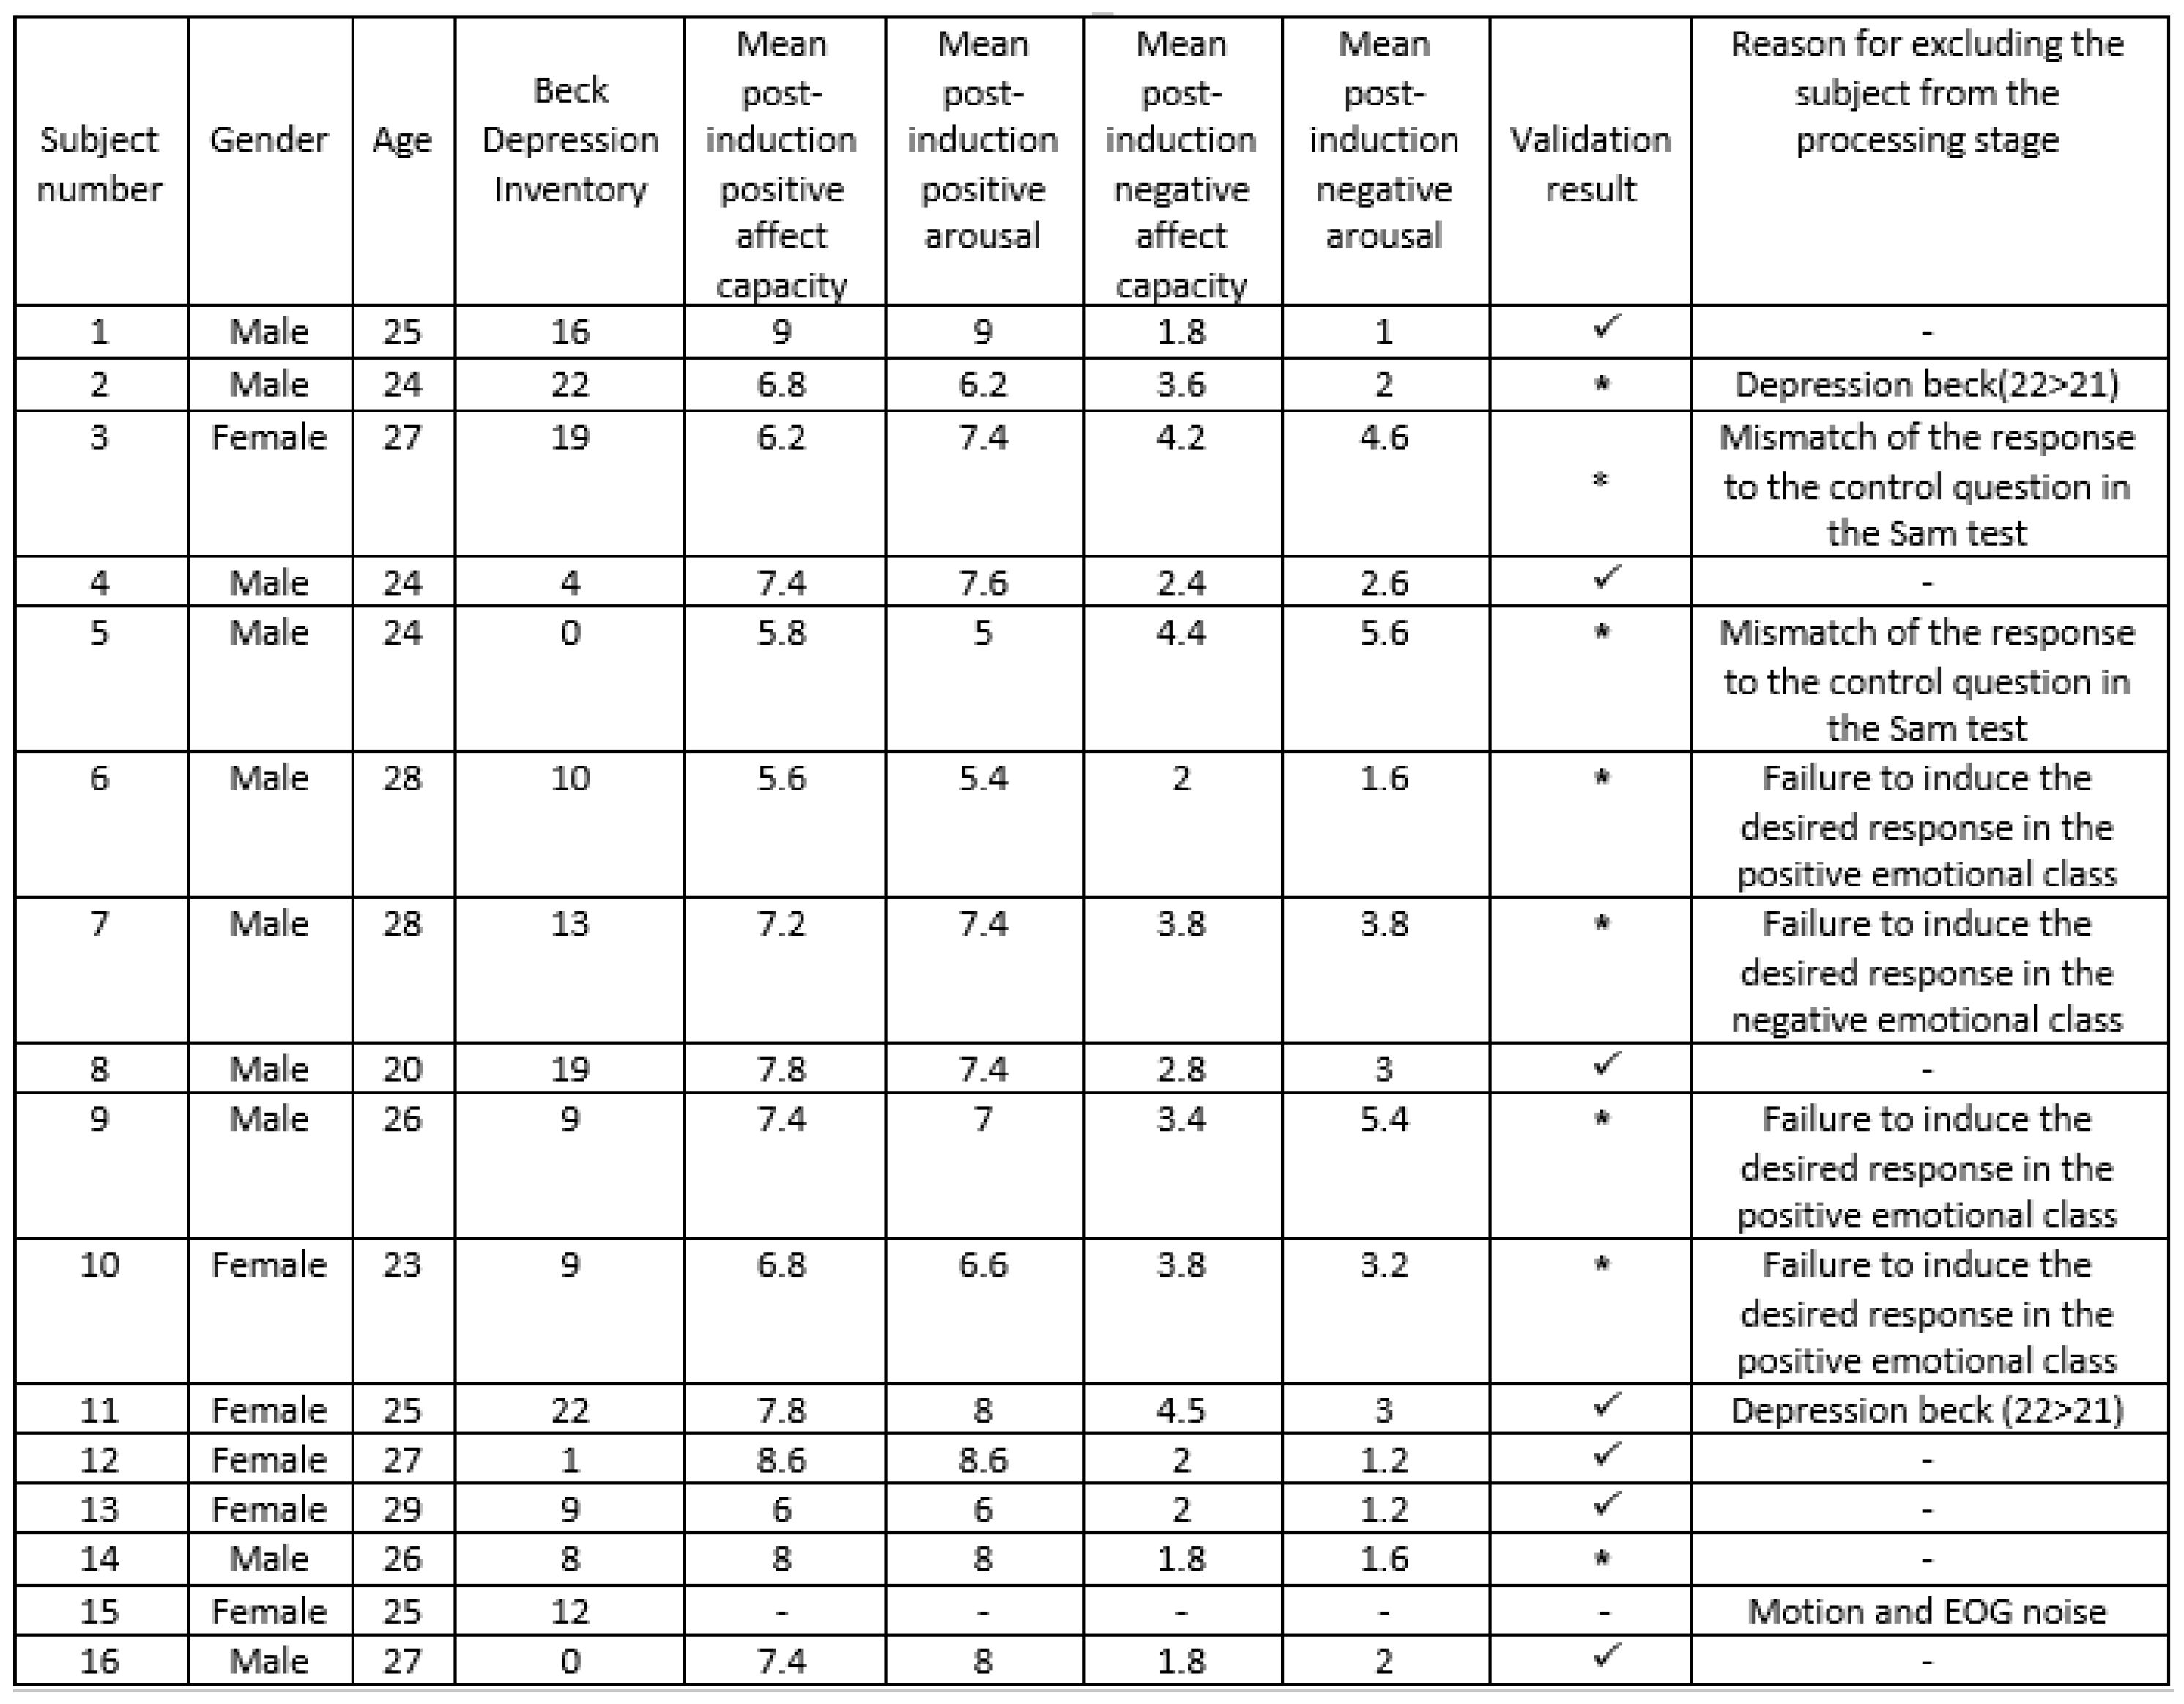 |
Table 2.
Songs used for emotion induction
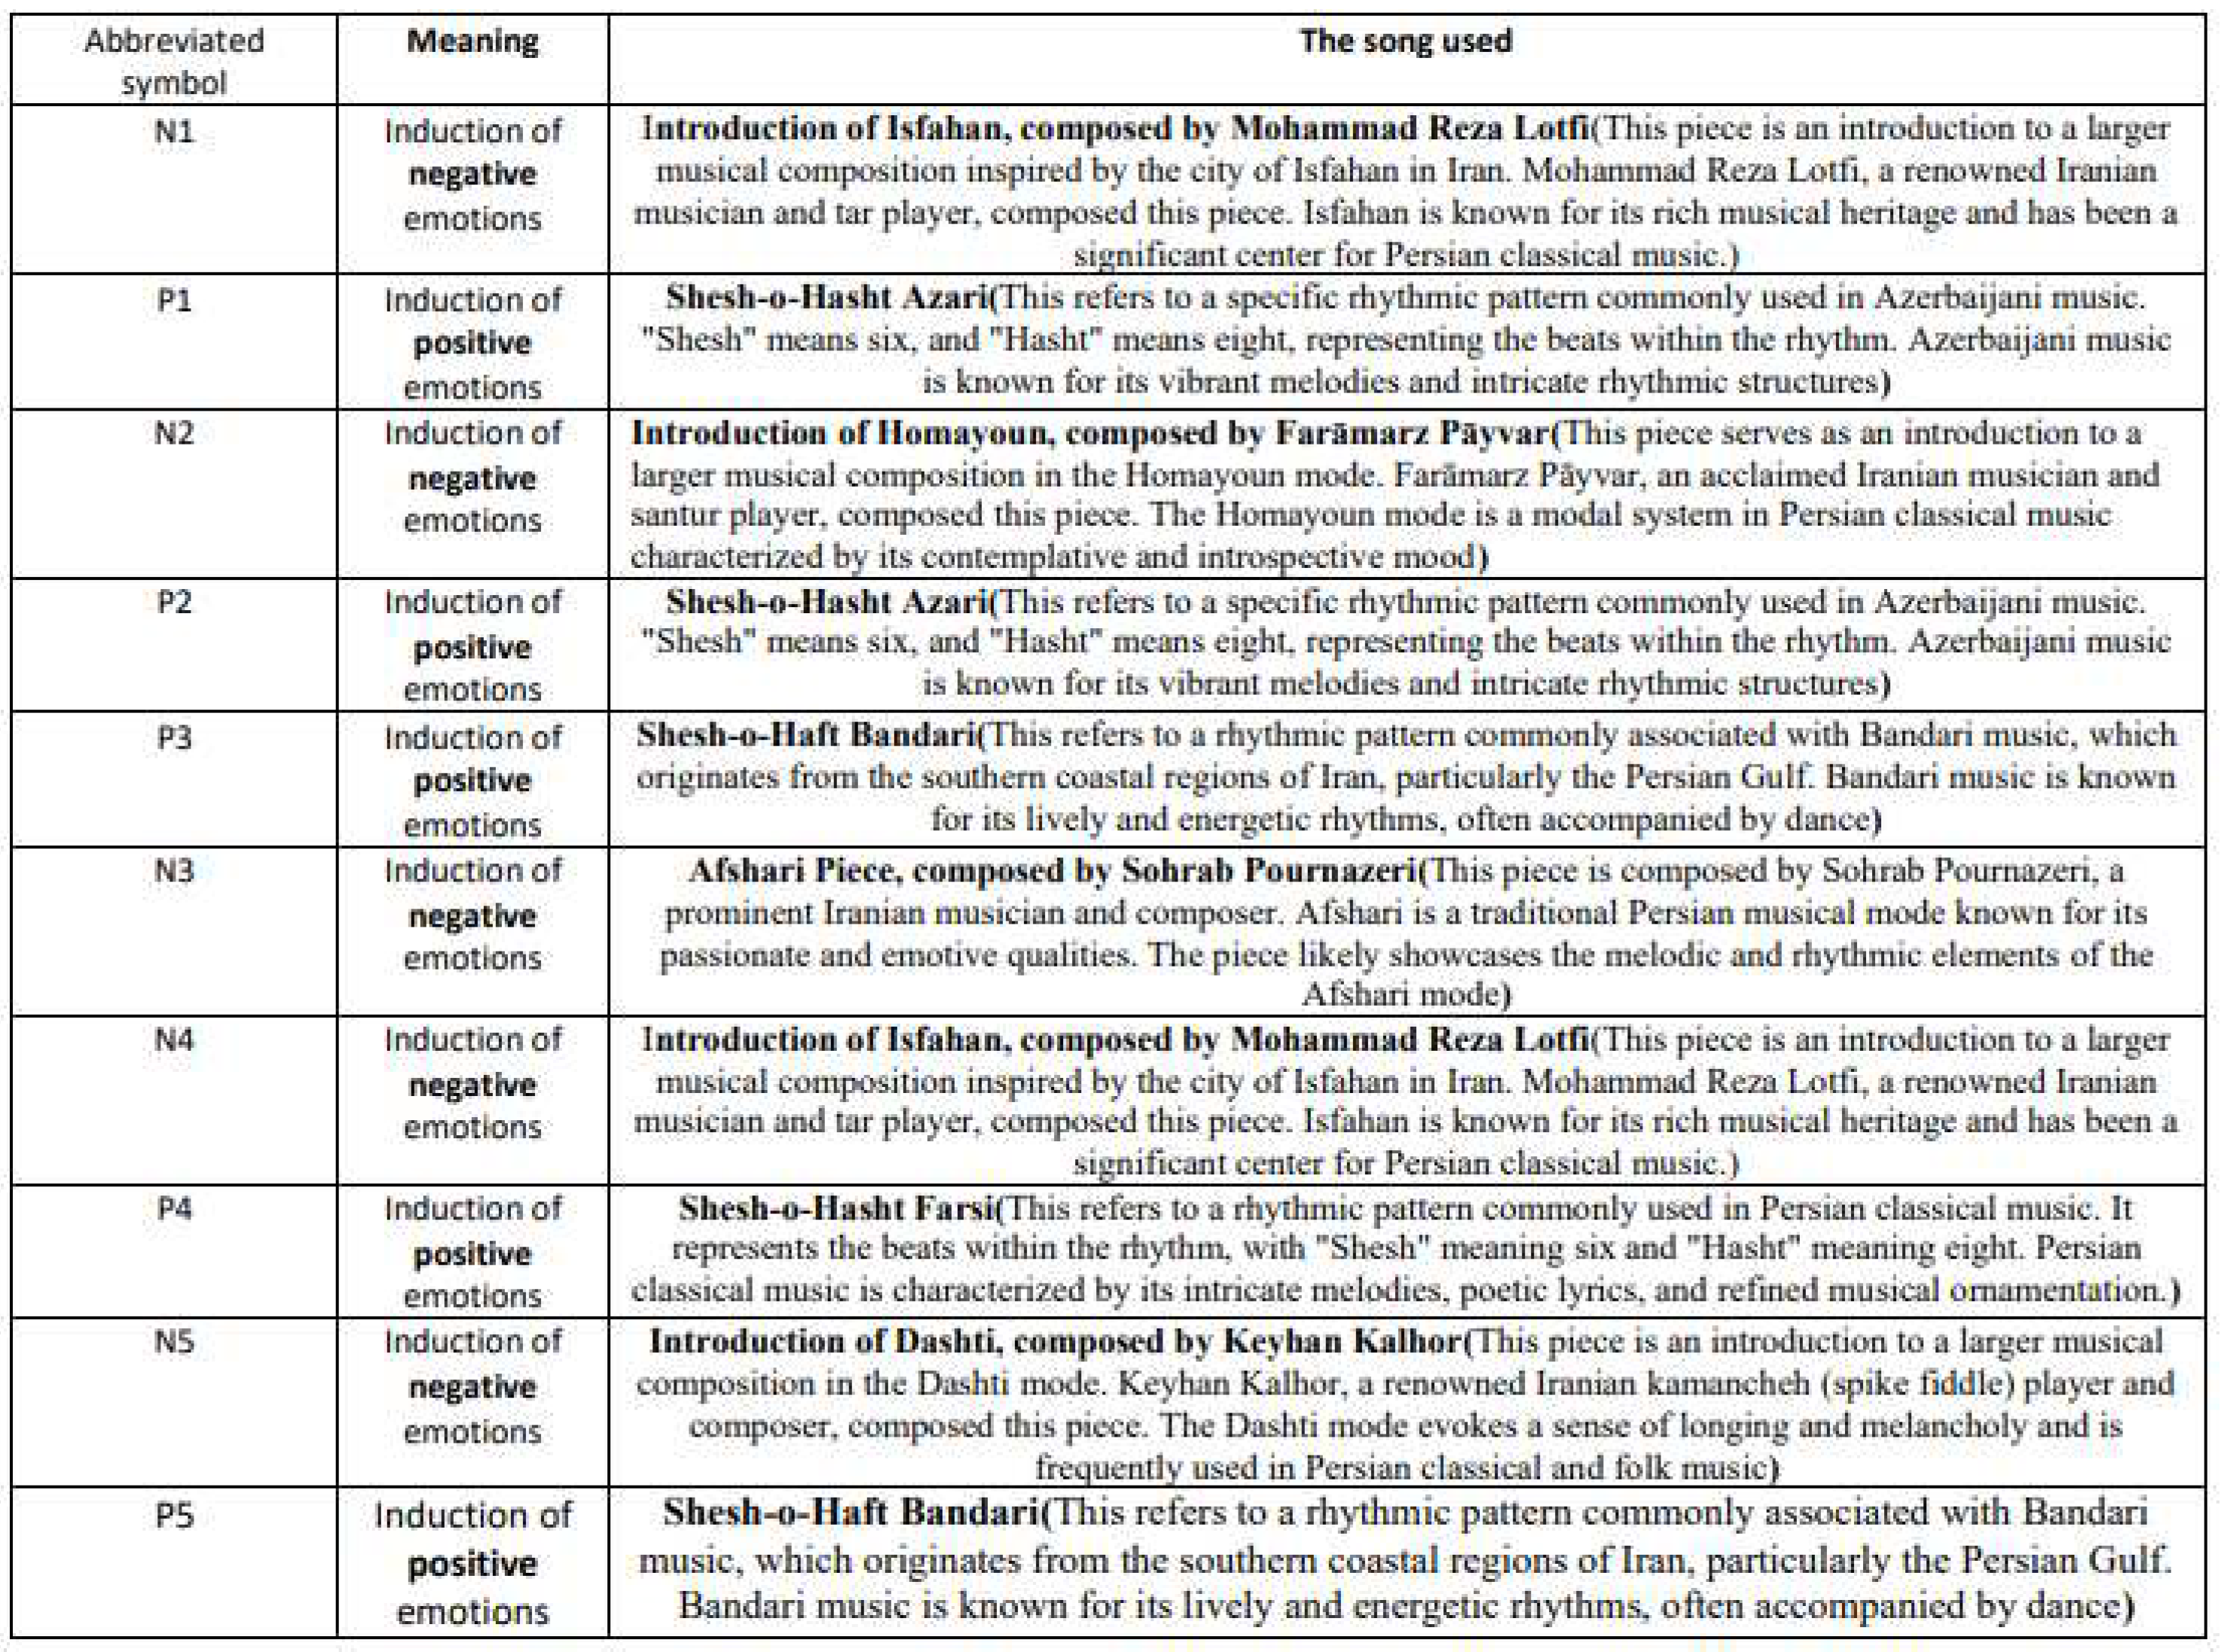 |
Table 3.
Details of the architecture and size of filters in the proposed network
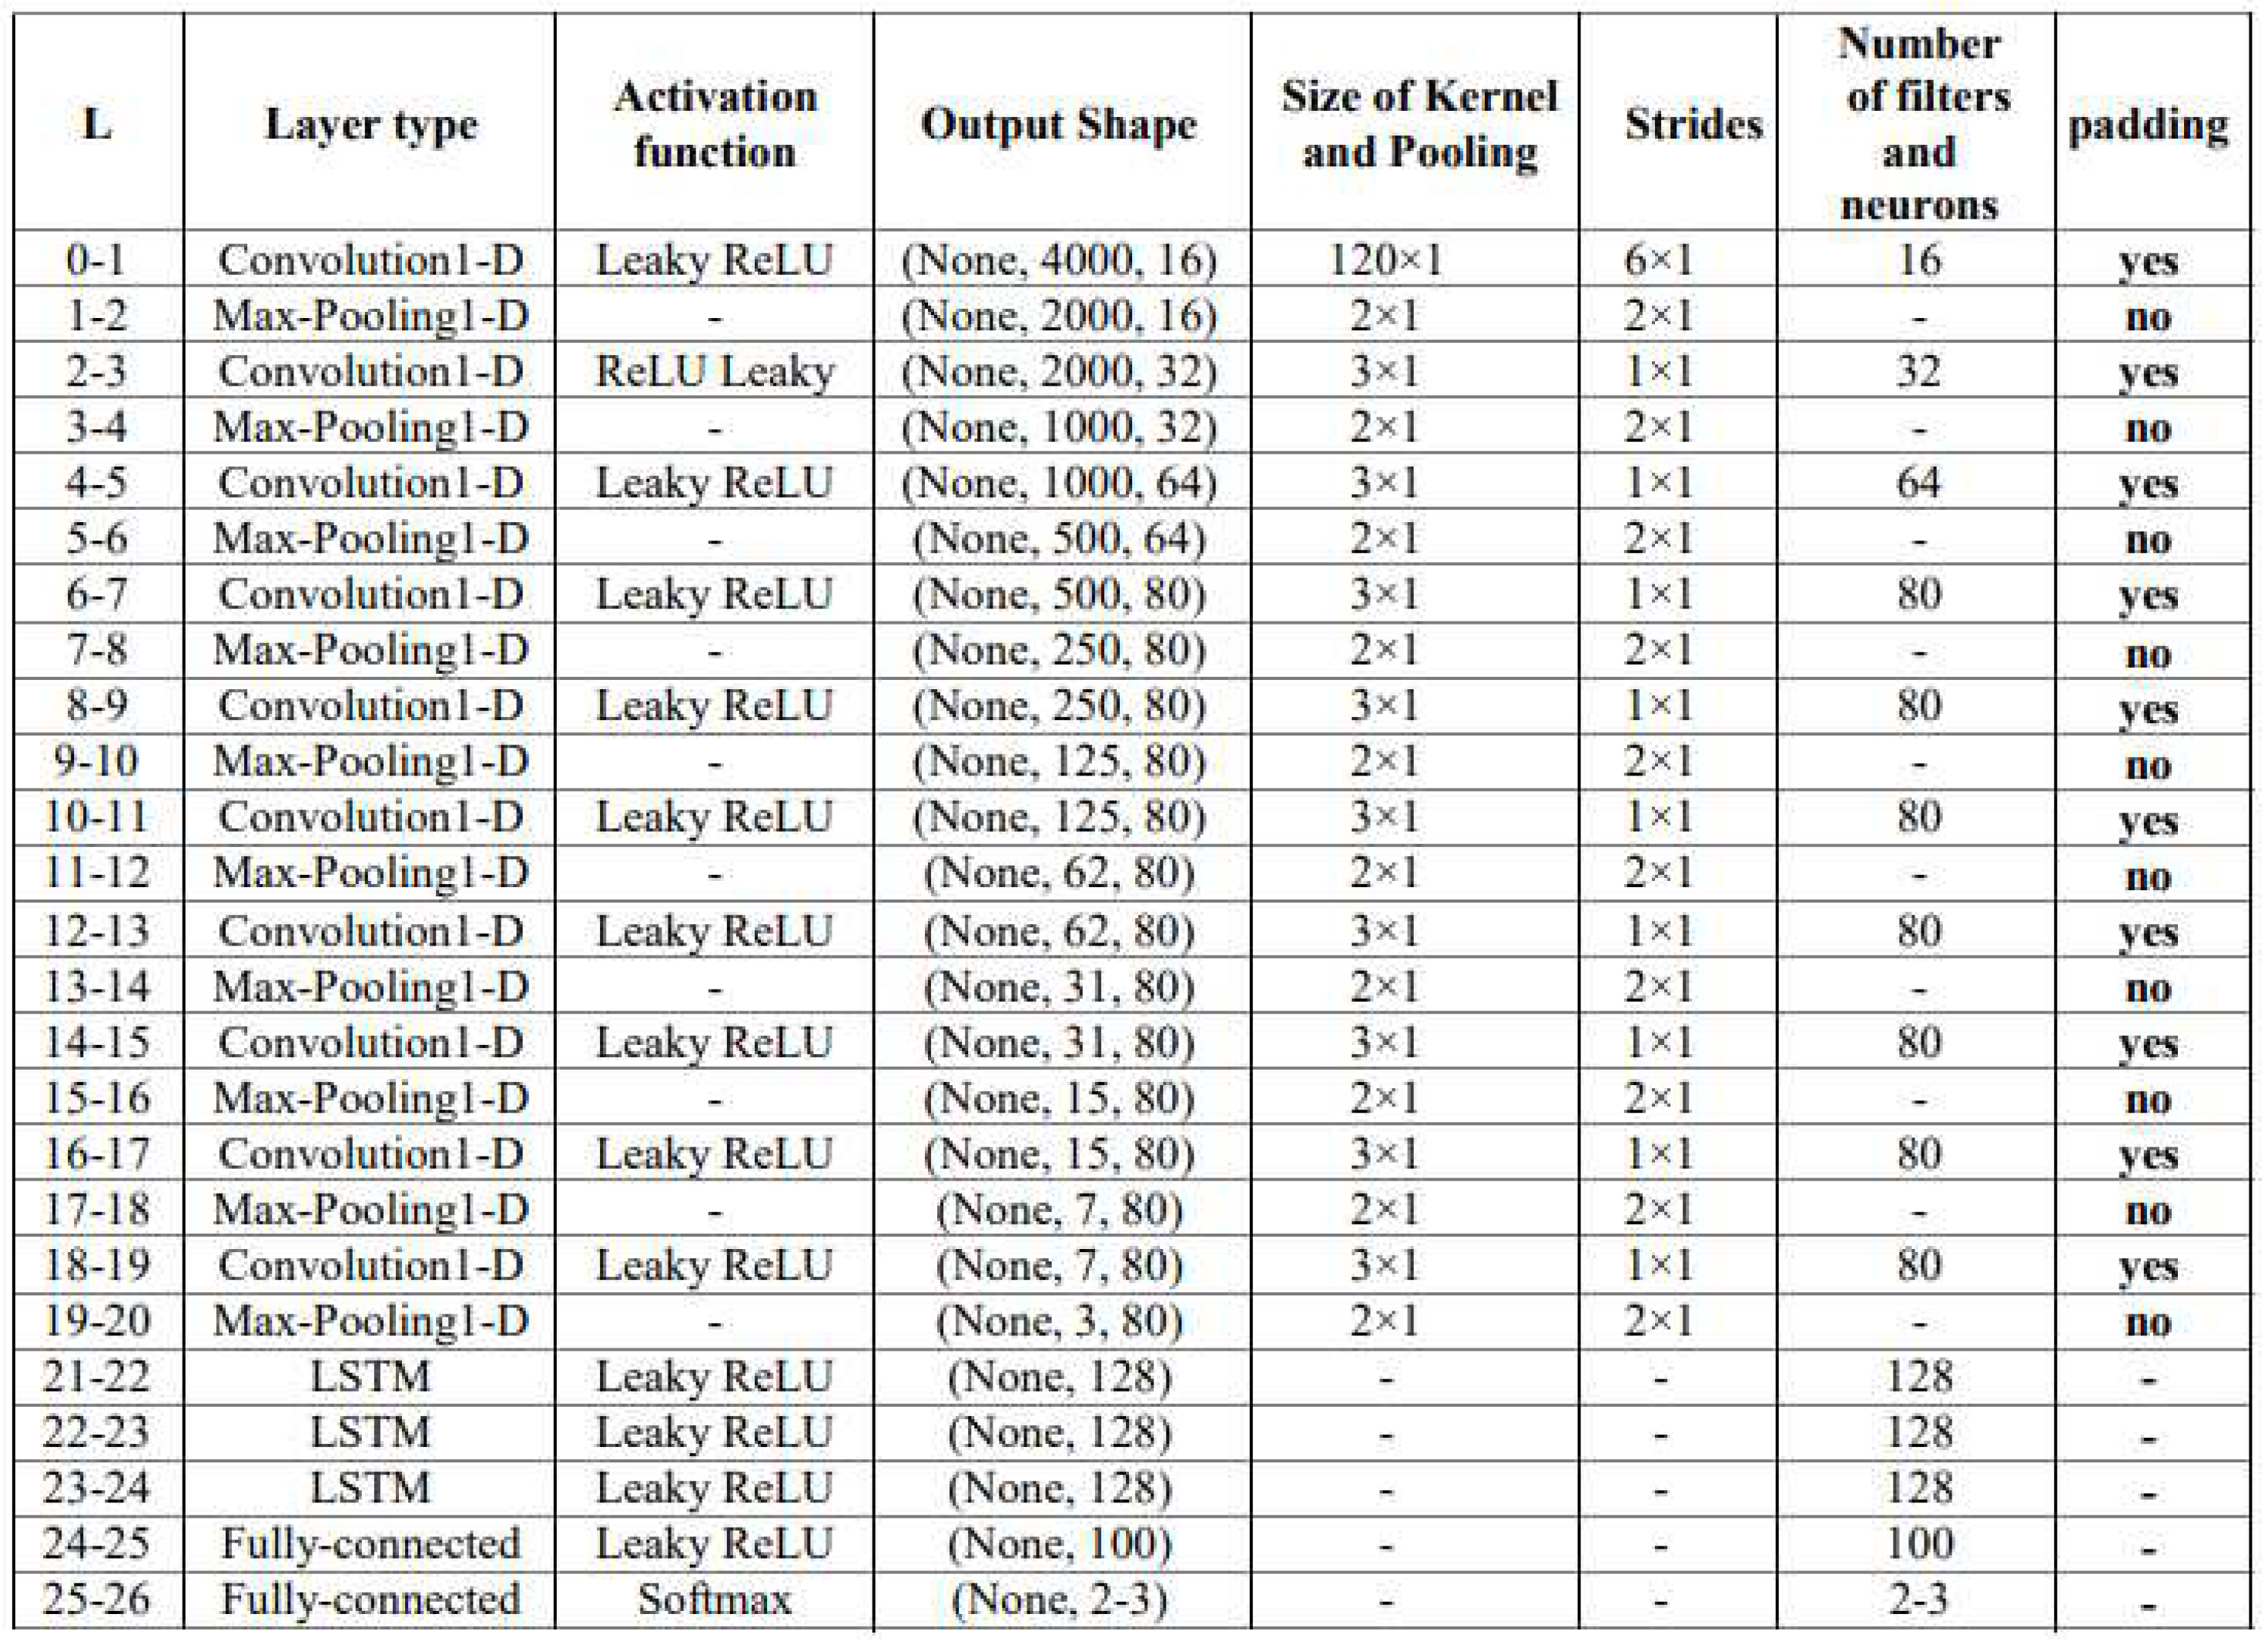 |
Table 4.
Computational complexity of the proposed algorithm compared to 3 other methods
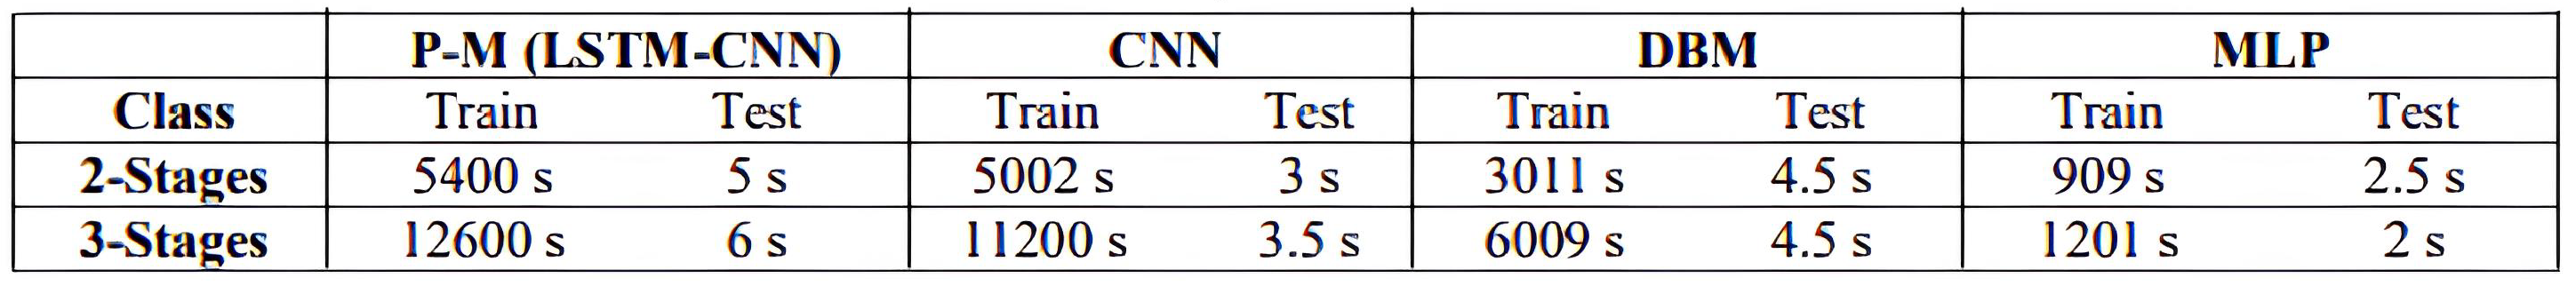 |
Table 5.
Cohen’s kappa values for the first and second scenarios.
 |
Disclaimer/Publisher’s Note: The statements, opinions and data contained in all publications are solely those of the individual author(s) and contributor(s) and not of MDPI and/or the editor(s). MDPI and/or the editor(s) disclaim responsibility for any injury to people or property resulting from any ideas, methods, instructions or products referred to in the content. |
© 2023 by the authors. Licensee MDPI, Basel, Switzerland. This article is an open access article distributed under the terms and conditions of the Creative Commons Attribution (CC BY) license (https://creativecommons.org/licenses/by/4.0/).
Copyright: This open access article is published under a Creative Commons CC BY 4.0 license, which permit the free download, distribution, and reuse, provided that the author and preprint are cited in any reuse.


