
Submitted:
05 July 2023
Posted:
07 July 2023
You are already at the latest version
Abstract
In this paper, Akbari-Ganji's and Taylor series methods are applied to find analytical solutions to nonlinear differential equations that arise in an immobilized-cell photobioreactor. Approximate analytical expressions for substrate and product concentrations and both liquid and gas phases for various parameter values are derived using both methods. Efficiency, accuracy, and convergence of the two methods relative to highly accurate numerical methods are investigated to establish reliable profiles of these two methods for solving general nonlinear equations that model various physical phenomena. Numerical simulations are presented to validate the theoretical investigations.
Keywords:
reaction-diffusion
; immobilized-cell
; mathematical modeling
; analytical solution
; Akbari-Ganji method
; Taylor series method
; electrochemical photobioreactor
1. Introduction
Nonlinear systems of equations usually present real-world physical applications. Over the past three decades, the search for efficient and reliable analytical asymptotic methods to solve these systems has intensified [1]. Of the methods have received a great attention are the perturbation method (PM) [4], homotopy perturbation method (HPM) [5,6,7,8,9,10,11], variational iteration method (VIM) [12,13,14,15,16], homotopy analysis method (HAM)[17,18,19,20], differential transform method (DTM) [21,22], Adomian decomposition method (ADM) [23,24], and Green’s function iterative method [25,26].
Two-phase flow and mass transport coupled with biochemical reactions co-occur in an operating photobioreactor. Therefore, a better understanding of the complicated transport mechanism will promote the application of electrochemical photobioreactors[28,29].This communication directs our attention to the analytical and numerical method of solving nonlinear equations in immobilized-cell photobioreactor [2,3]. A comparison study between Akbari-Ganji's method (AGM) [27,28,29] and the renowned Taylors series method (see [30,31] and the references therein are presented. We aim to derive approximate analytical expressions of the concentrations of substrate and product and both liquid and gas phases for various parameter values by using these two methods. This paper will present a profile of reliability, efficiency, and convergence of both approaches.
2. Mathematical Formulation of the Problems
An immobilized-cell photo bioreactor packed with transparent gel-granules containing immobilized PSB developed and modeled by Shirejini et al. [3] is illustrated in Figure 1(a).Figure 1(b) shows a schematic diagram of mass transfer in a single gel graule, such that the mass transfer of all reactants and products is dominated by diffusion. Using Fick’s law, the mass transport equations for substrate and the hydrogen inside the gel granules are given by[32]:
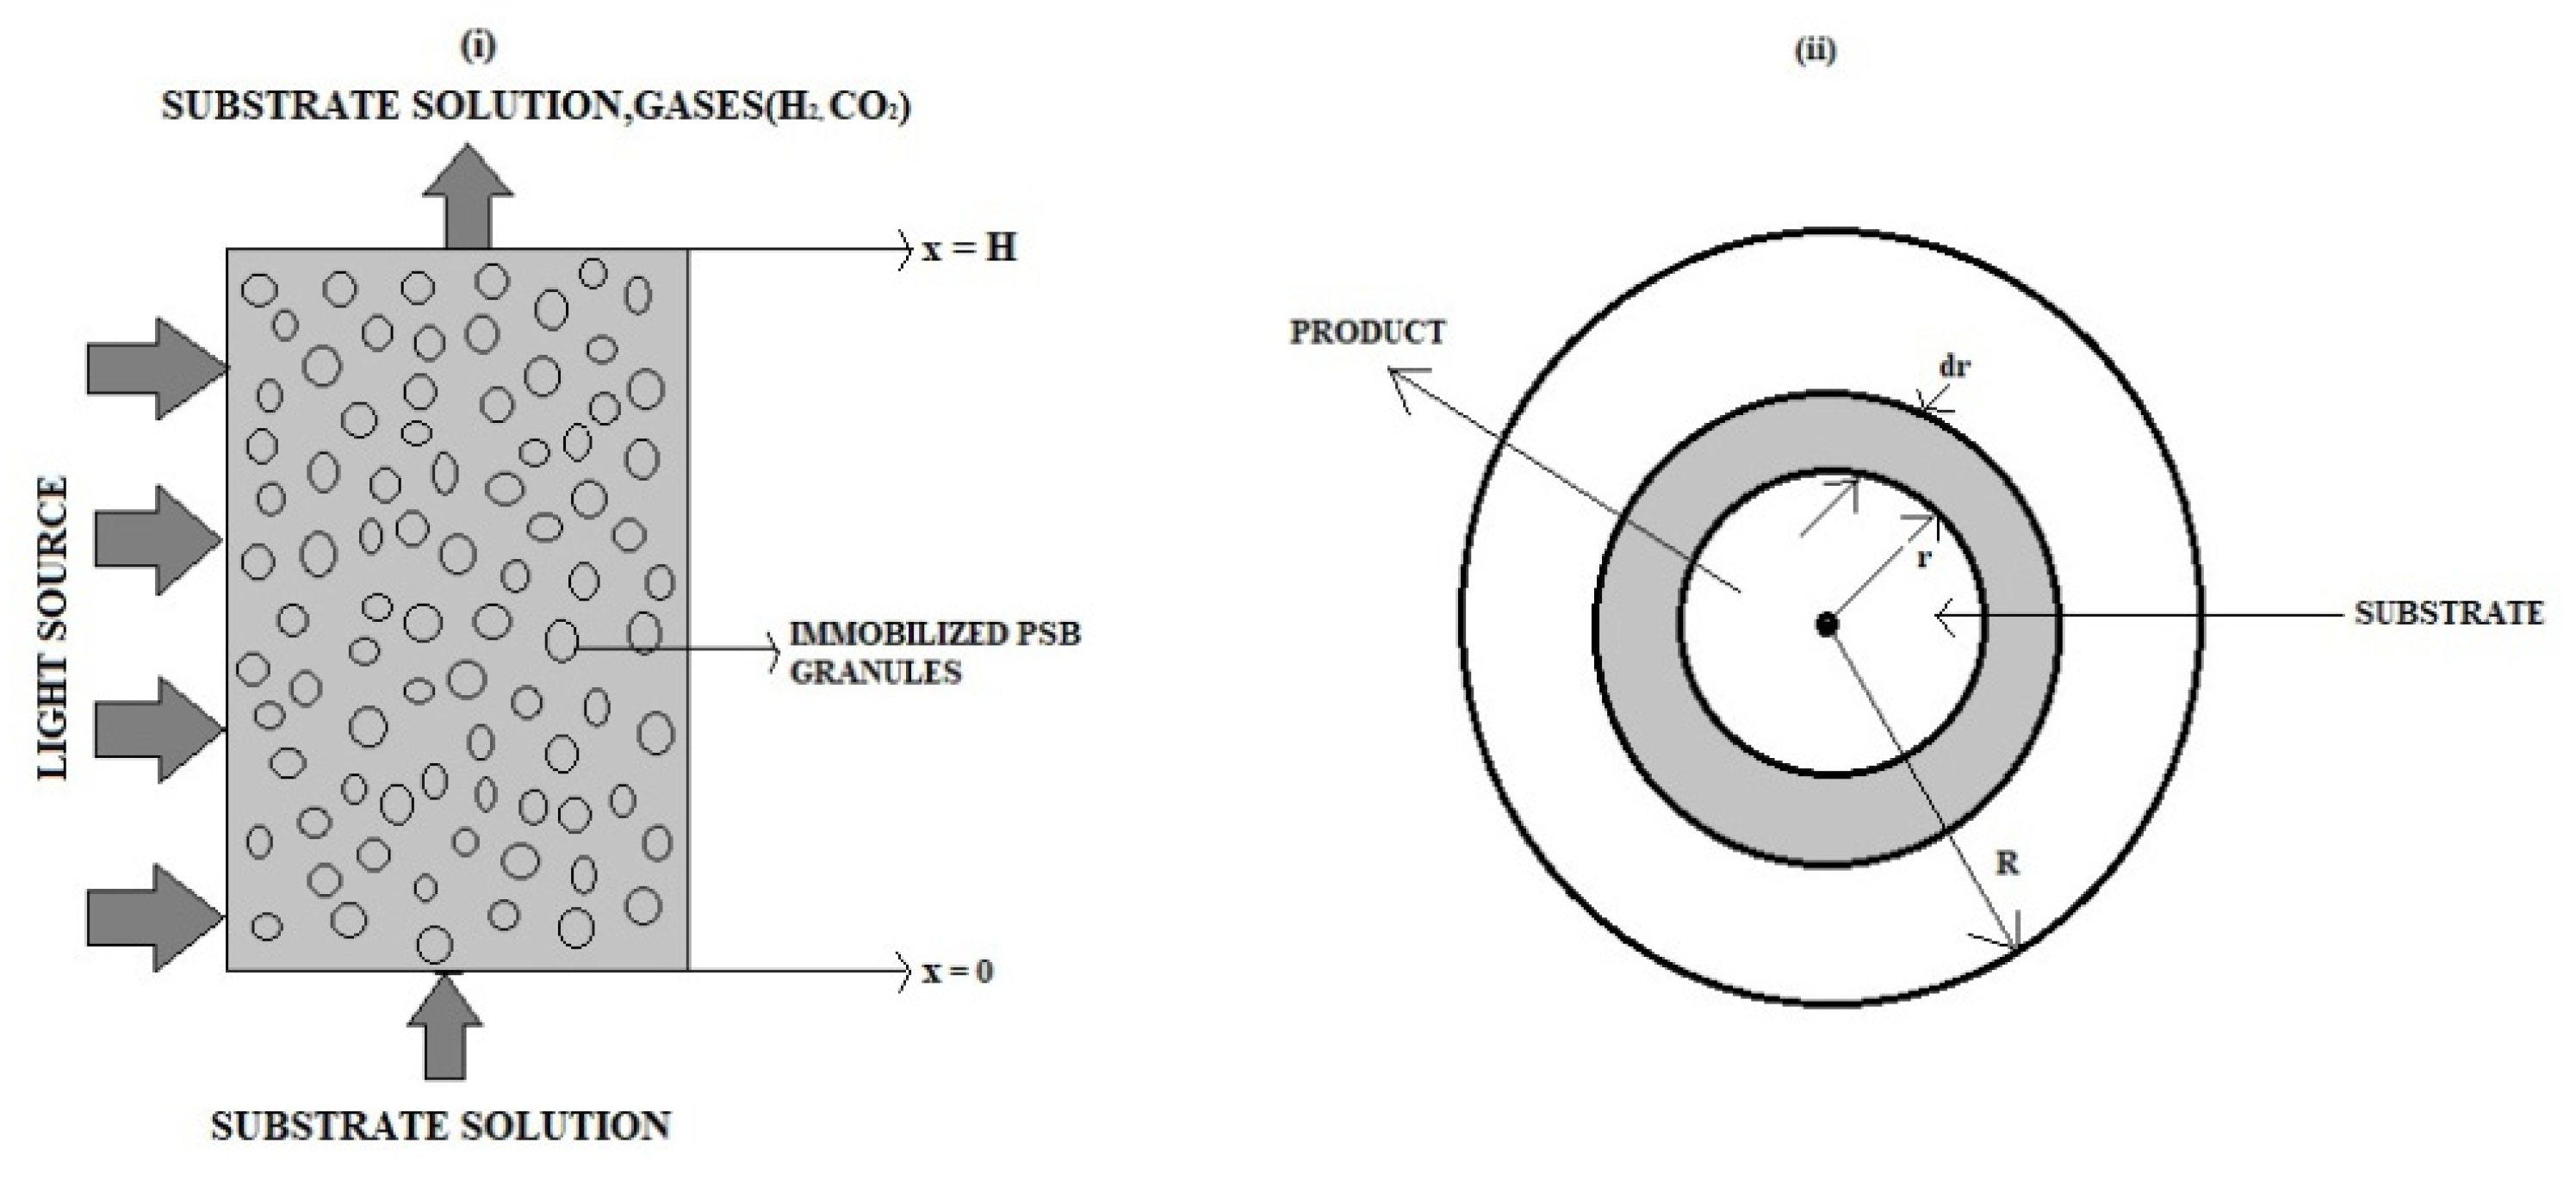 whereand are the significant diffusion coefficients of glucose and hydrogen in the gelgranule,and are the local concentrations of glucose and hydrogen inside the gel granule, is the consumption rate of glucose, is the generation rate of hydrogen. The parameter represents the growth associated kinetic constant for hydrogenproduction, is the non-growth associated kinetic constant,is the initial cell density,is the cell yield, and is a Monod constant. Furthermore, denotes the maximum specific growth rate, and is the growth rate. The boundary conditions for the above system of Equations(1) and (2) are given by
where and are bulk solutions, and is the radius of catalyst. The source termsand are defined by:
where is the specific area of the gel granule. The source terms of the liquid phase and gas phase are expressed by:
whereand are the significant diffusion coefficients of glucose and hydrogen in the gelgranule,and are the local concentrations of glucose and hydrogen inside the gel granule, is the consumption rate of glucose, is the generation rate of hydrogen. The parameter represents the growth associated kinetic constant for hydrogenproduction, is the non-growth associated kinetic constant,is the initial cell density,is the cell yield, and is a Monod constant. Furthermore, denotes the maximum specific growth rate, and is the growth rate. The boundary conditions for the above system of Equations(1) and (2) are given by
where and are bulk solutions, and is the radius of catalyst. The source termsand are defined by:
where is the specific area of the gel granule. The source terms of the liquid phase and gas phase are expressed by:
Figure 1.
Schematic of the entrapped-cell photobioreactor.
By introducing the dimensionless parameters
Equations (1) and (2),take the dimensionless forms:
with the dimensionless boundary conditions:
The normalized steady-state source terms of liquid and gas phases is given by
3. Analytical expression of the concentrations using Akbari-Ganji’s method
In this section, we use AGM to derive explicit expressions for the concentrations of glucose and hydrogen. The AGM is a semi-analytical approach that has shown efficacy in solving nonlinear equations [33,34,35]. The AGM procedure begins by assuming a solution function with unknown constant coefficients, which are determined by solving a system of algebraic equations that is constructed from the differential equations and the initial conditions.
3.1. Concentration of Glucose (substrate)
Let
be a trial solution of Equation (9), whereare constants. The boundary conditions (11) and (12) imply
Now define the function by
then
Using Equation (16) in Equation (18), gives
By substituting Equations (16) and (18) into Equation (15), the analytical expression for the substrate is
3.2. Concentration of Hydrogen (product)
Assume the following solution to Equation (10):
From boundary conditions (11) and (12), we obtain:
Define the G function by
then
Substituting Equation (22) into Equation (24) leads to
and substituting Equations (22) and (25) into Equation (16), the analytical expression for the product is
3.3. Normalized steady-state source terms of liquid and gas phases
The analytical expressions of normalized steady-state source terms of liquid and gas phases aregiven by:
4. Analytical expression of the concentrations using Taylor series method
The three-century-old Taylor series method (TSM) has been recently revived and exploited to accurately and efficiently solve many nonlinear differential equations representing nonlinear models in various sciences and engineering applications Equations [36,37]. In this section, we employ TSM to find the substrate and product concentrations.
4.1. Concentration of Glucose (substrate)
First, we assume that
whereis an unknown constant to be determined. Steady state nonlinear reaction–diffusion equations can be written in the form:
Taking the first three derivatives of Equation (30) with respect to gives
For , Equations (31)–(33) give the following identities:
The substrate concentration,using the Taylor’s series, is expressed by the expansion
where
Using the boundary conditionsin Equation (35) implies that
from which the unknown constant m can be obtained. For the fixed values of the parameters:
and , the numerical value of m is found to beand from Equation (36), we obtain and, and thus from Equation (35), we obtain the analytical expression of the substrate expressed by
4.2. Concentration of Hydrogen (product)
Similar to the approach in Section 4.1, we begin by assuming that
where l is an unknown constant to be determined and by direct differentiation of , we obtain,
Now, the product concentration is readily obtained using Taylor’s series
Using the boundary condition, in Equation (41) gives the numerical value of l. For the fixed values of the parameters, and, we obtain . The analytical expression for the product concentration takes on the form
4.3. Normalized steady-state source terms of liquid and gas phases
The analytical expression of the normalized steady-state source terms of liquid phases, , is obtained from the equation,
Using, the valuesand , we obtain . The analytical expression of normalized steady-state terms of gas phases, , is given by
where when
5. Numerical simulations and Discussion
Nonlinear equations in the immobilized-cell photobioreactor are analytically solved. The approximate analytical expressions of concentrations of glucose and hydrogen inside the gel and granule in addition to approximate analytical expressions of steady-state source terms of liquid and gas phases are derived using Taylor series (TSM) and Akbari-Ganji (AGM) methods.
The reaction-diffusion equations representing the packed bed photobioreactor with immobilized-cell were solved using the Adomian decomposition method (ADM) [2] and the homotopy perturbation method (HPM) [3]. Interstingly, the semi-analytical expressions of the concentrations of substrate and product obtained by the ADM, HPM, and AGM were identical (Equations (20) and (26)) for all values of parameters.
To examine the accuracy of the two proposed analytical approaches, we compared their results with numerical results obtained from the reliable MATLAB pdepe function (Appendix A) and with analytical results of other methods available in the literature. The approximate analytical and numerical concentrations of substrate and product for various parameters are summarized in Table 1, Table 2, Table 3, Table 4, Table 5 and Table 6. Even though both methods gave satisfactory results, TSM is notably more accurate. The maximum relative error average is 0.6% for the TSM and 5% for the AGM. Comparisons of normalized steady-state source terms of both liquid and gas phases for various values of parameters and are given in Table 7 and Table 8.
Figures 2(a)-2(c) illustrate the behavior of the biodegradation of substrate for different values of the parameters. It is noticed that as any of the parameters decreases, the substrate concentration increases. In contrast, Figure 2(d) confirms a direct relationship between the parameter and the substrate concentration.
The effects of all parameters on the hydrogen production profiles are shown in Figures 3(a)-3(g),where it is noticed that the concentration of hydrogen increases the parameters decreases or the parameter increases. However, the concentration of hydrogen is independent of any of the parameters.
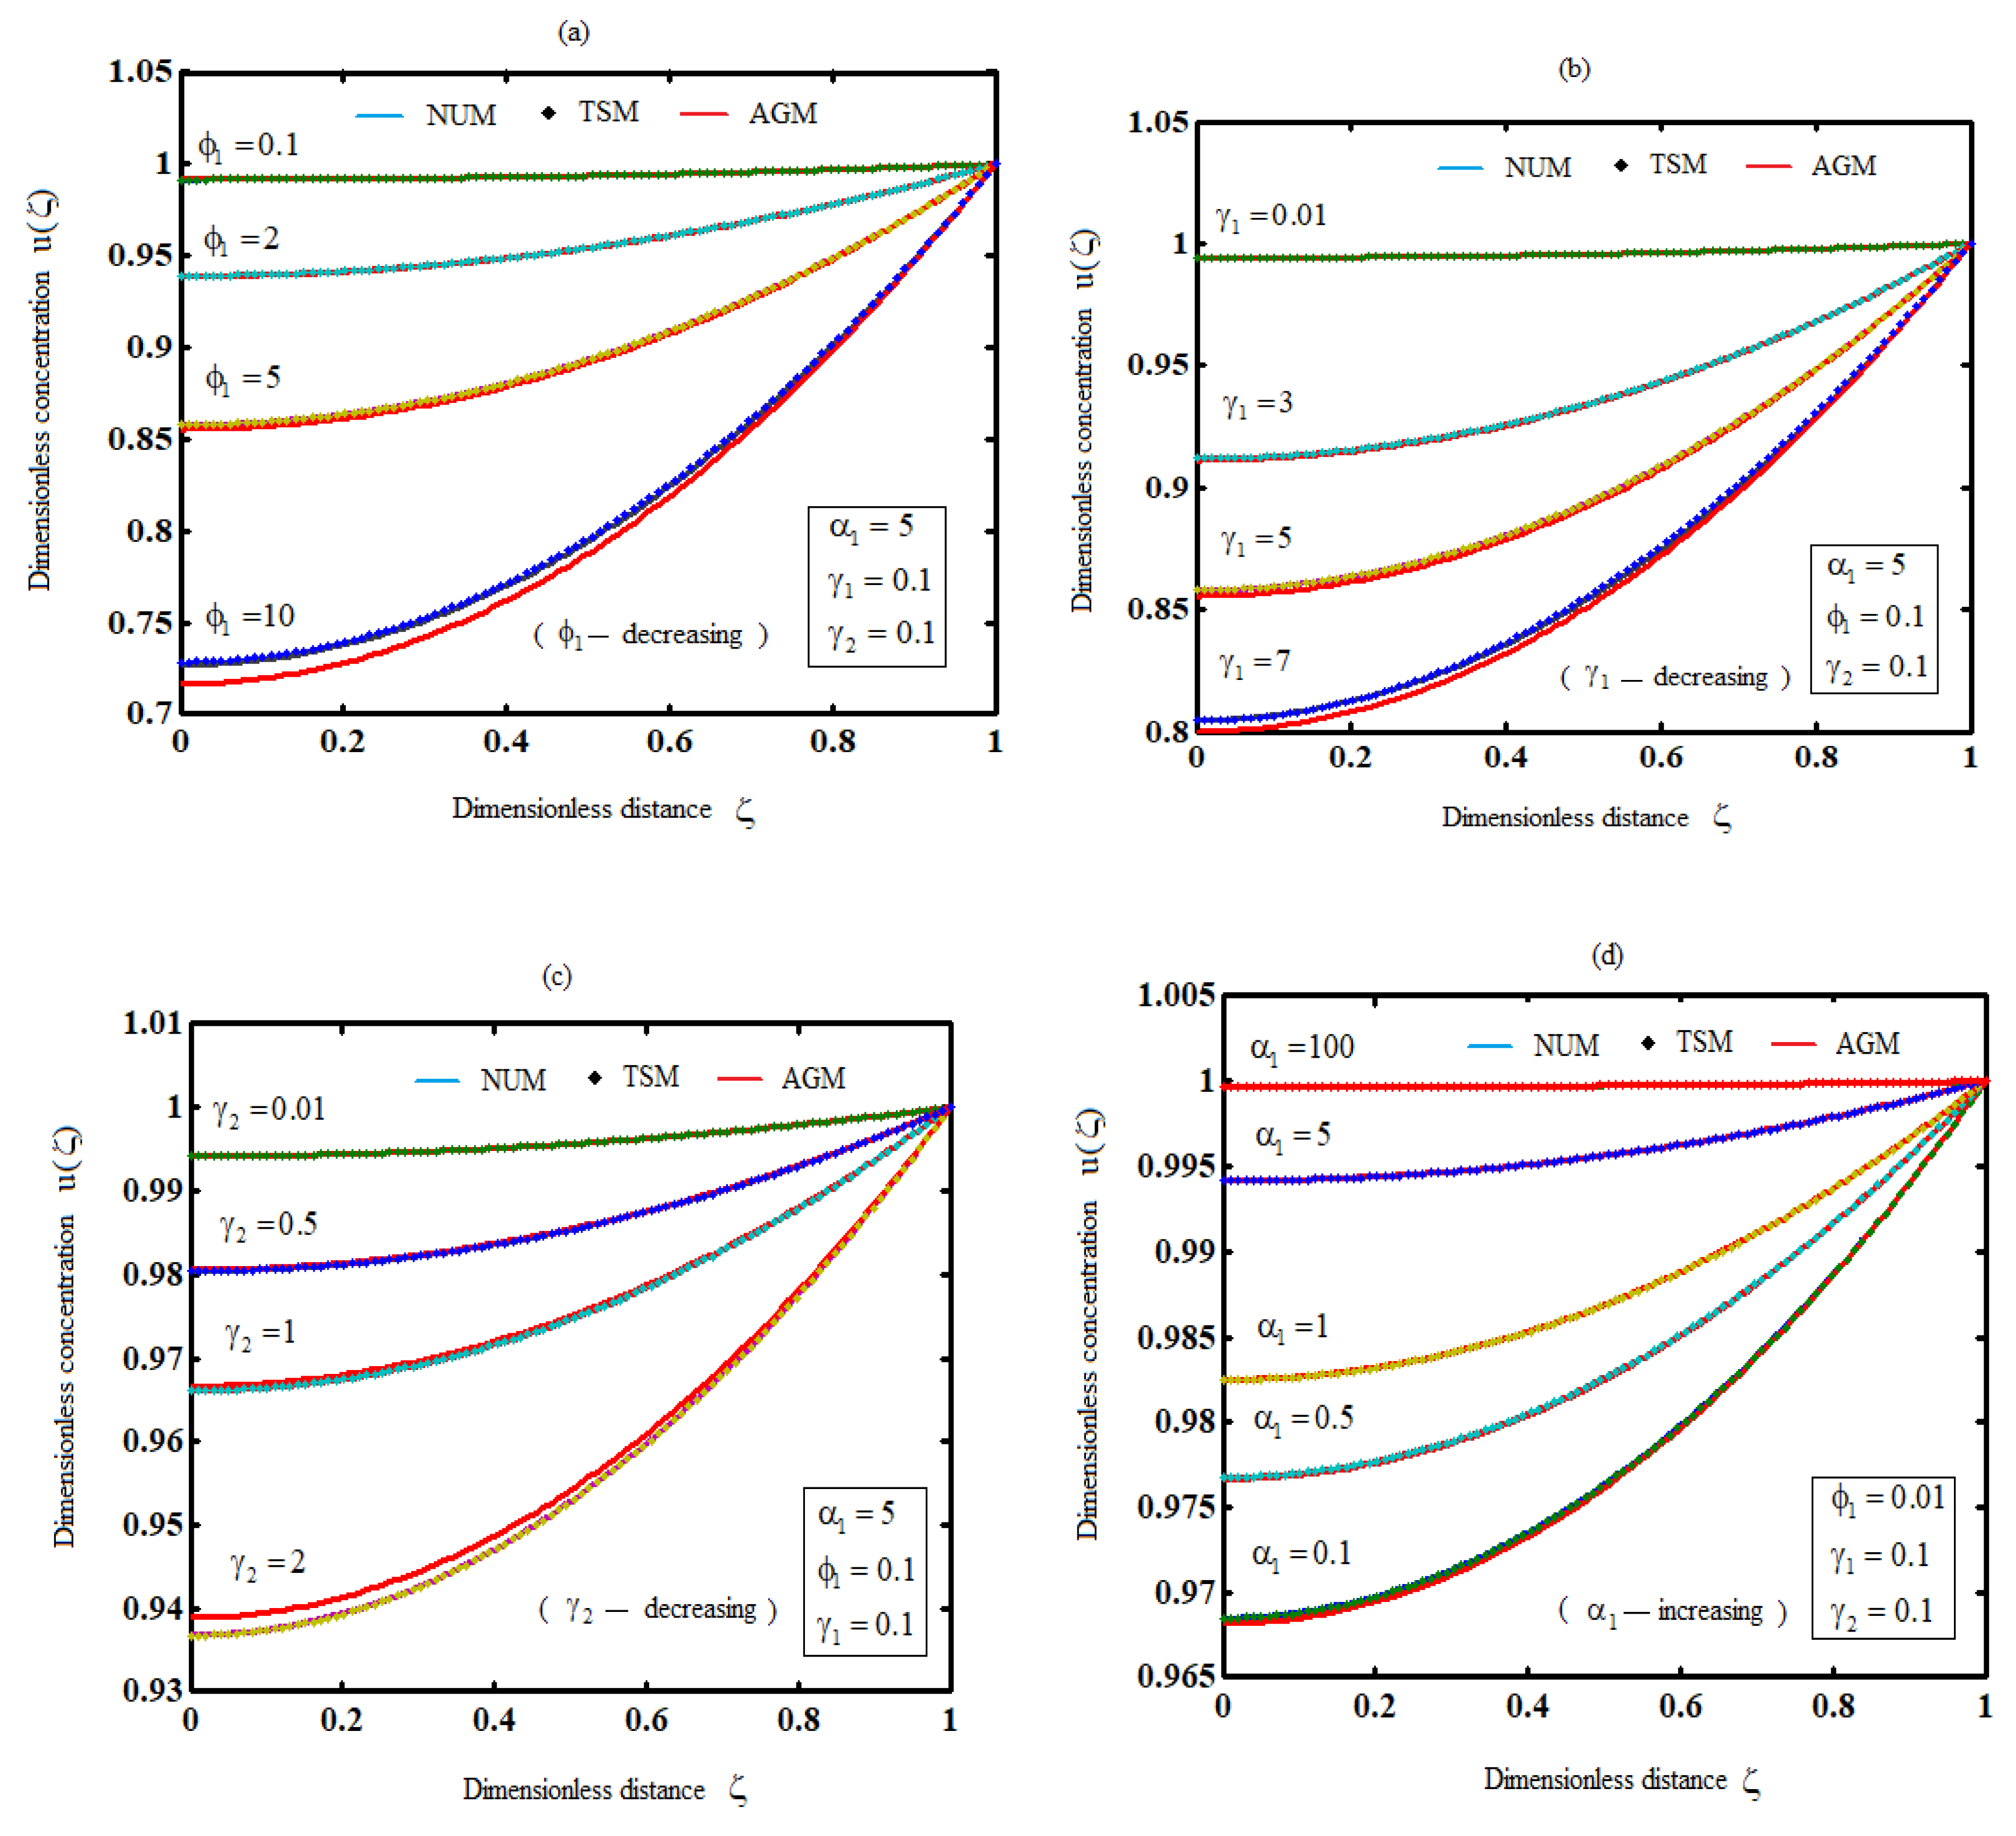
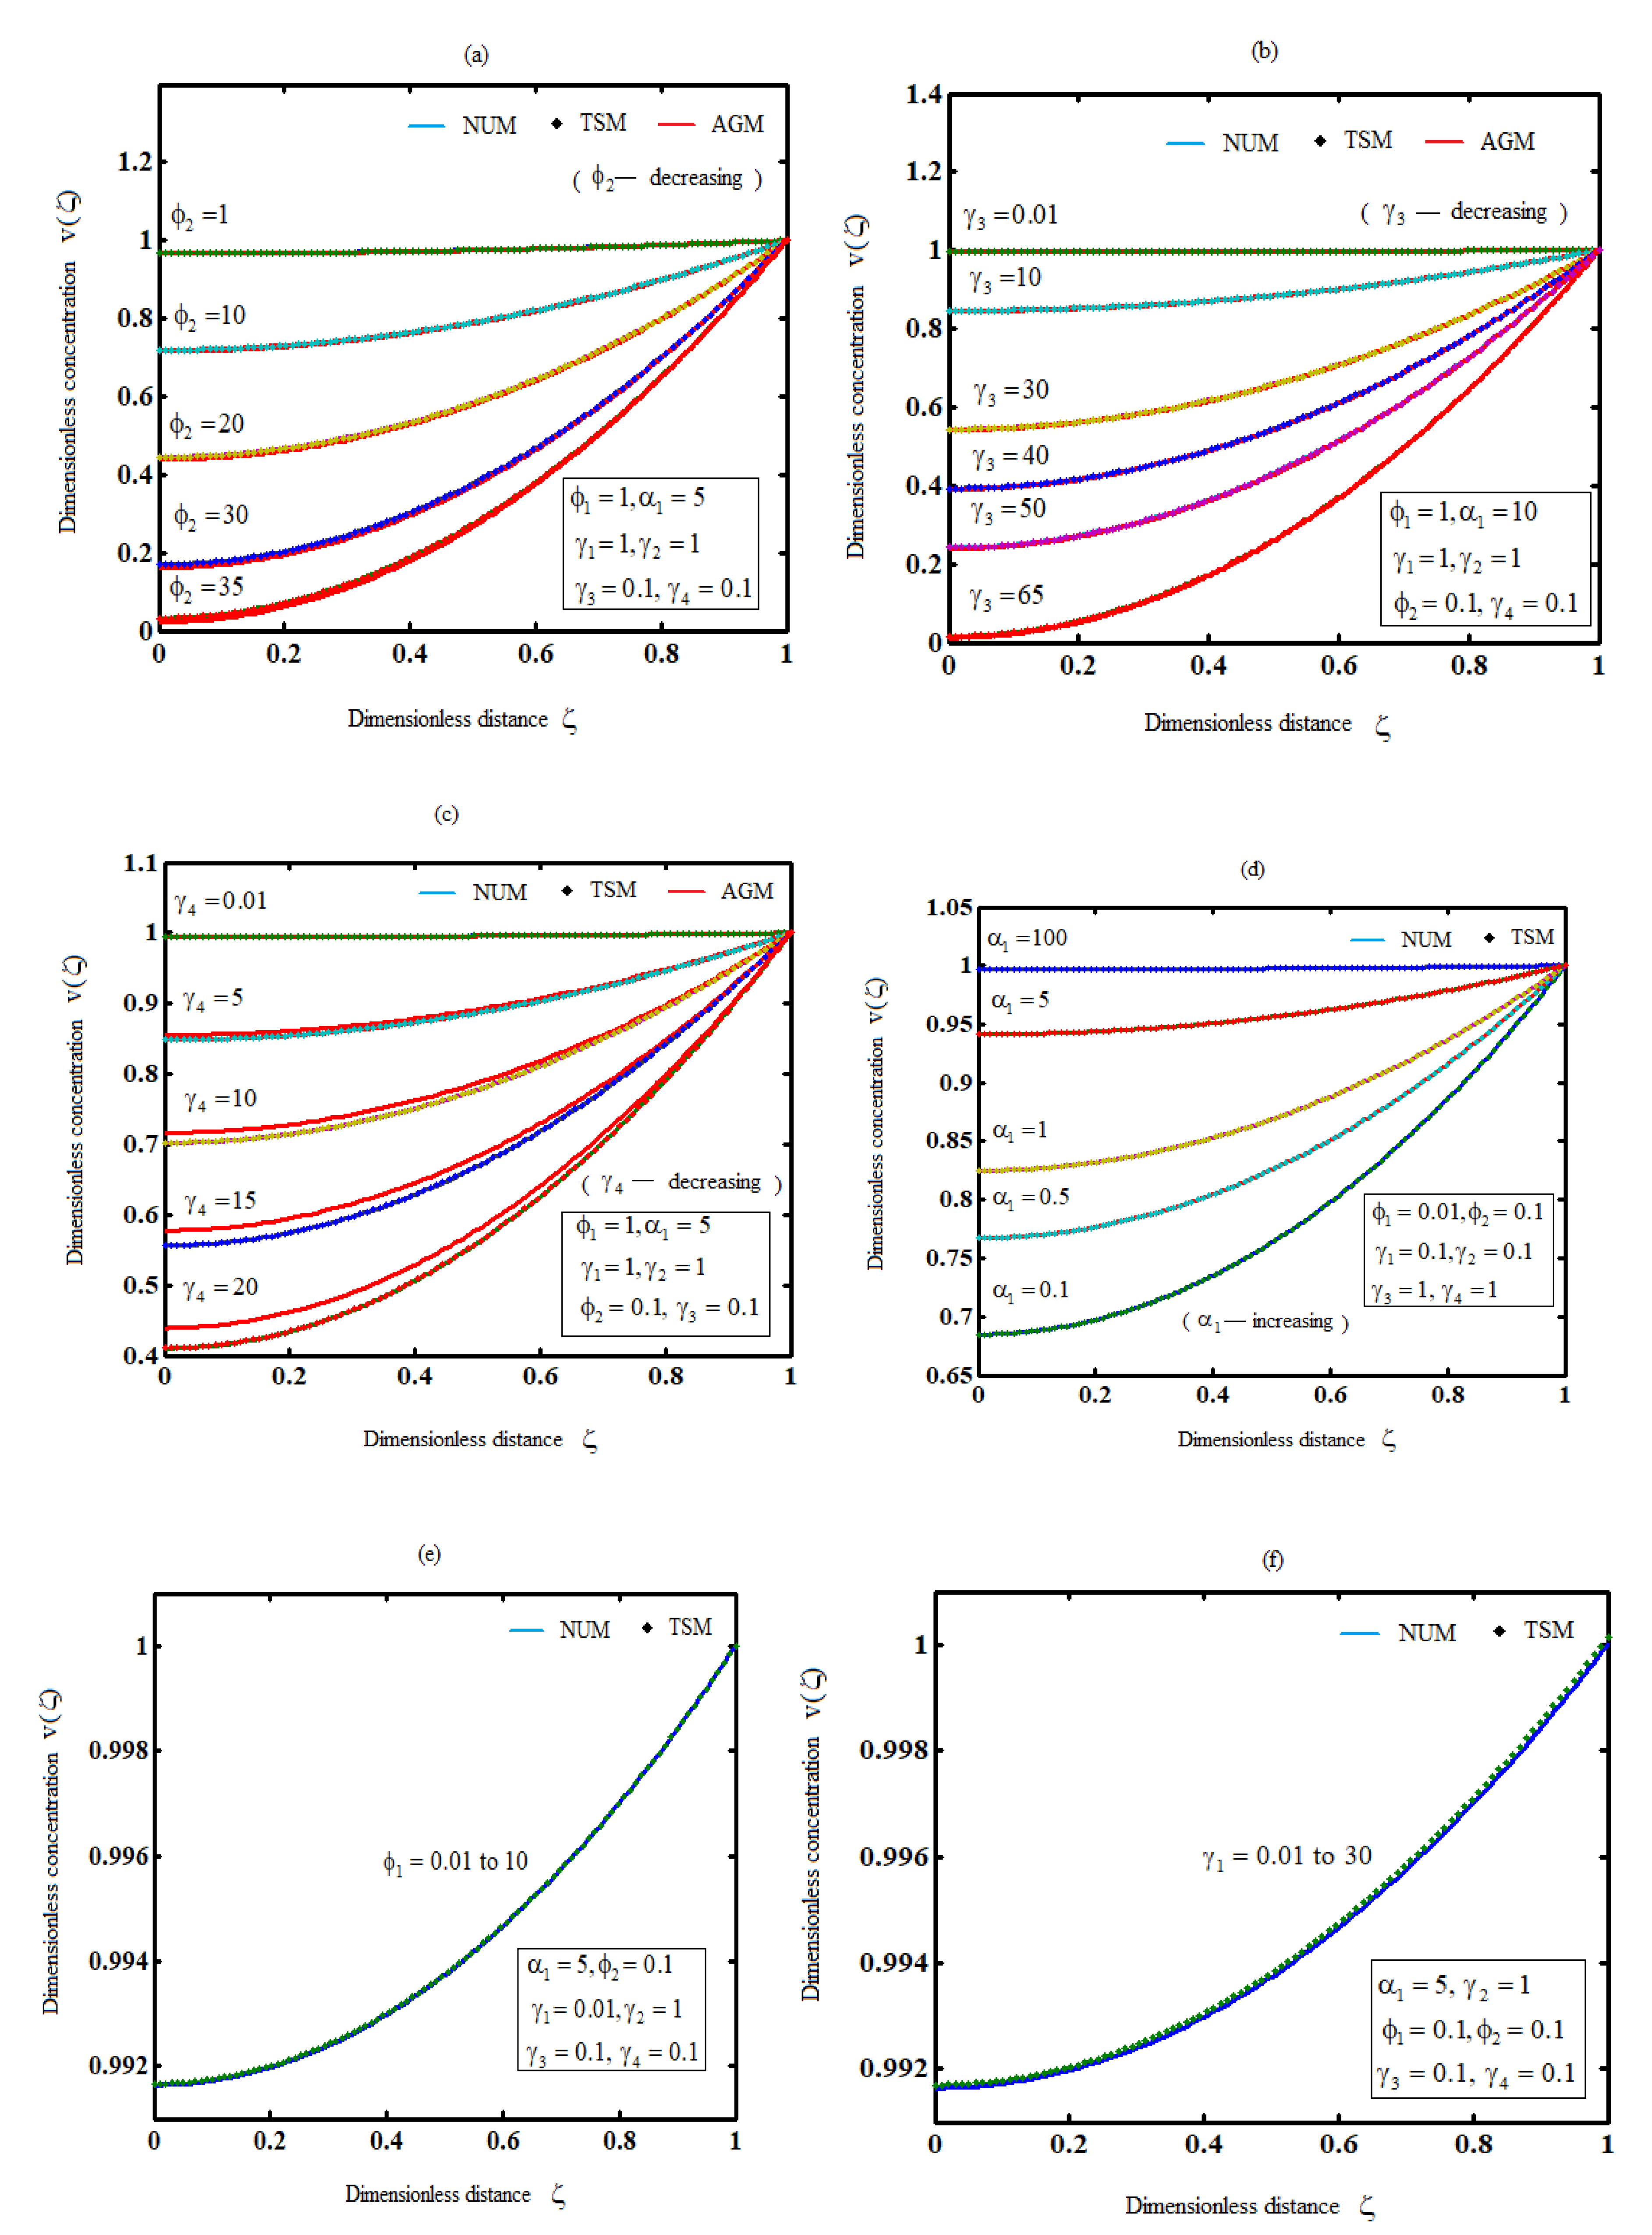
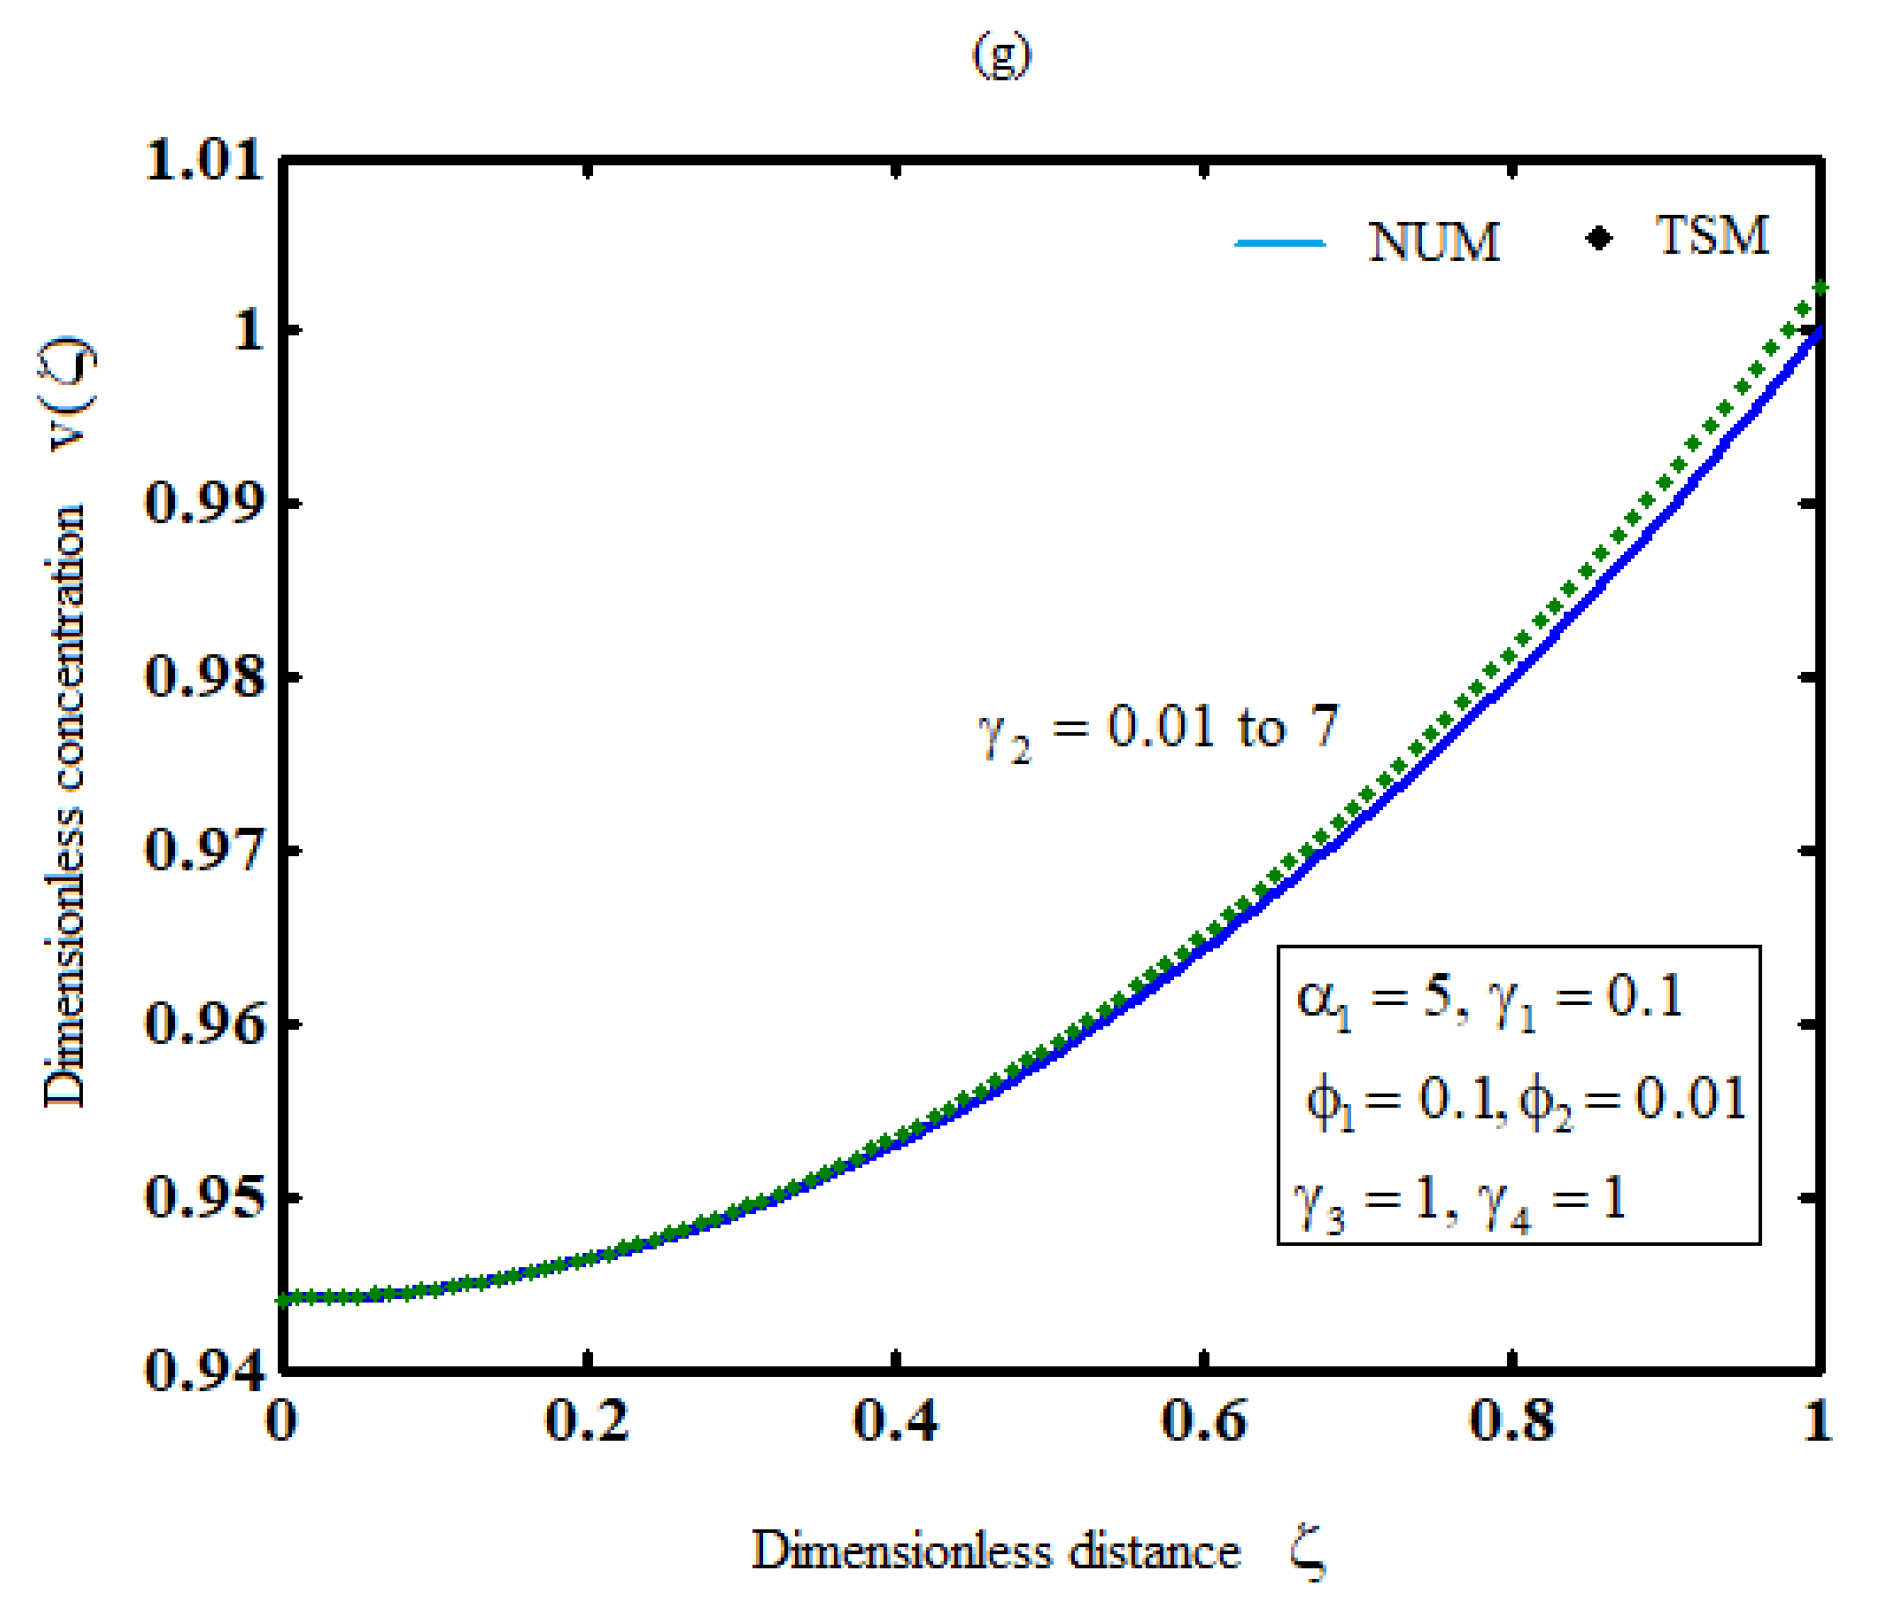
Figure 2.
Plot of substrate concentration for various values of parameters (Equations (20) and (35)).
Figure 2.
Plot of substrate concentration for various values of parameters (Equations (20) and (35)).
Figure 3.
Plot of product concentration,, for various values of the parameters and (Equations (26) and (41)).
Figure 3.
Plot of product concentration,, for various values of the parameters and (Equations (26) and (41)).

Table 1.
Comparison beteween numerical and analytical results for dimensionless concentration of substrate for various values of parameter when and.
Table 1.
Comparison beteween numerical and analytical results for dimensionless concentration of substrate for various values of parameter when and.
| Num.Equation (9) | AGMEq.(20) | TSMEq.(35) | Error % ofAGMEq.(20) | Error % of TSMEquation (35) | NumEquation (9) | AGMEq.(20) | TSMEq.(35) | Error % ofAGMEq.(20) | Error % of TSMEquation (35) | |
|---|---|---|---|---|---|---|---|---|---|---|
| 0 | 0.73 | 0.72 | 0.73 | 1.37 | 0.00 | 0.60 | 0.58 | 0.61 | 3.33 | 1.67 |
| 0.2 | 0.74 | 0.73 | 0.74 | 1.35 | 0.00 | 0.62 | 0.59 | 0.63 | 4.84 | 1.61 |
| 0.4 | 0.77 | 0.76 | 0.77 | 1.30 | 0.00 | 0.67 | 0.65 | 0.67 | 2.98 | 0.00 |
| 0.6 | 0.83 | 0.82 | 0.83 | 1.20 | 0.00 | 0.75 | 0.73 | 0.75 | 2.67 | 0.00 |
| 0.8 | 0.90 | 0.90 | 0.90 | 0.00 | 0.00 | 0.86 | 0.85 | 0.86 | 1.16 | 0.00 |
| 1 | 1.00 | 1.00 | 1.00 | 0.00 | 0.00 | 1.00 | 1.00 | 1.00 | 0.00 | 0.00 |
| Average error % | 0.87 | 0.00 | Average error % | 2.50 | 0.55 | |||||
Table 2.
Comparison beteween numerical and analytical results for dimensionless concentration of substrate for various values of parameter when and.
Table 2.
Comparison beteween numerical and analytical results for dimensionless concentration of substrate for various values of parameter when and.
| Num.Equation (9) | AGMEq.(20) | TSMEq.(35) | Error % ofAGMEq.(20) | Error % of TSMEquation (35) | NumEquation (9) | AGMEq.(20) | TSMEq.(35) | Error % ofAGMEq.(20) | Error % of TSMEquation (35) | |
|---|---|---|---|---|---|---|---|---|---|---|
| 0 | 0.80 | 0.80 | 0.80 | 0.00 | 0.00 | 0.60 | 0.58 | 0.61 | 3.33 | 1.67 |
| 0.2 | 0.81 | 0.81 | 0.81 | 0.00 | 0.00 | 0.62 | 0.59 | 0.63 | 4.84 | 1.61 |
| 0.4 | 0.84 | 0.83 | 0.84 | 1.20 | 0.00 | 0.67 | 0.65 | 0.67 | 2.98 | 0.00 |
| 0.6 | 0.88 | 0.87 | 0.88 | 1.14 | 0.00 | 0.75 | 0.73 | 0.75 | 2.67 | 0.00 |
| 0.8 | 0.93 | 0.93 | 0.93 | 0.00 | 0.00 | 0.86 | 0.85 | 0.86 | 1.16 | 0.00 |
| 1 | 1.00 | 1.00 | 1.00 | 0.00 | 0.00 | 1.00 | 1.00 | 1.00 | 0.00 | 0.00 |
| Average error % | 0.39 | 0.00 | Average error % | 2.50 | 0.55 | |||||
Table 3.
Comparison beteween numerical and analytical results for dimensionless concentration of substrate for various values of parameter when and.
Table 3.
Comparison beteween numerical and analytical results for dimensionless concentration of substrate for various values of parameter when and.
| Num.Equation (9) | AGMEquation (20) | TSMEq.(35) | Error % ofAGMEq.(20) | Error % of TSMEquation (35) | NumEquation (9) | AGMEq.(20) | TSMEq.(35) | Error % ofAGMEq.(20) | Error % of TSMEquation (35) | |
|---|---|---|---|---|---|---|---|---|---|---|
| 0 | 0.84 | 0.86 | 0.84 | 2.38 | 0.00 | 0.77 | 0.80 | 0.76 | 3.90 | 1.30 |
| 0.2 | 0.85 | 0.86 | 0.85 | 1.18 | 0.00 | 0.78 | 0.81 | 0.77 | 3.85 | 1.28 |
| 0.4 | 0.87 | 0.88 | 0.87 | 1.15 | 0.00 | 0.81 | 0.83 | 0.80 | 2.47 | 1.23 |
| 0.6 | 0.90 | 0.91 | 0.90 | 1.11 | 0.00 | 0.86 | 0.87 | 0.85 | 1.16 | 1.16 |
| 0.8 | 0.95 | 0.95 | 0.94 | 0.00 | 1.05 | 0.92 | 0.93 | 0.92 | 1.09 | 0.00 |
| 1 | 1.00 | 1.00 | 1.00 | 0.00 | 0.00 | 1.00 | 1.00 | 1.00 | 0.00 | 0.00 |
| Average error % | 0.97 | 0.17 | Average error % | 2.09 | 0.83 | |||||
Table 4.
Comparison beteween numerical and analytical results for dimensionless concentration of product for various values of parameter when and.
Table 4.
Comparison beteween numerical and analytical results for dimensionless concentration of product for various values of parameter when and.
| Num.Eq.(10) | AGMEq.(26) | TSMEq.(41) | Error% ofAGMEq.(26) | Error% ofTSMEquation (41) | NumEq.(10) | AGMEq.(26) | TSMEq.(41) | Error% ofAGMEq.(26) | Error% ofTSMEquation (41) | |
|---|---|---|---|---|---|---|---|---|---|---|
| 0 | 0.44 | 0.44 | 0.44 | 0.00 | 0.00 | 0.03 | 0.02 | 0.03 | 33.33 | 0.00 |
| 0.2 | 0.47 | 0.46 | 0.47 | 2.13 | 0.00 | 0.07 | 0.06 | 0.07 | 14.29 | 0.00 |
| 0.4 | 0.53 | 0.53 | 0.53 | 0.00 | 0.00 | 0.19 | 0.18 | 0.19 | 5.26 | 0.00 |
| 0.6 | 0.65 | 0.64 | 0.65 | 1.54 | 0.00 | 0.39 | 0.38 | 0.39 | 2.56 | 0.00 |
| 0.8 | 0.81 | 0.80 | 0.81 | 1.23 | 0.00 | 0.66 | 0.66 | 0.66 | 0.00 | 0.00 |
| 1 | 1.00 | 1.00 | 1.00 | 0.00 | 0.00 | 1.00 | 1.00 | 1.00 | 0.00 | 0.00 |
| Average error % | 0.82 | 0.00 | Average error % | 9.24 | 0.00 | |||||
Table 5.
Comparison beteween numerical and analytical results for dimensionless concentration of product for various values of parameter when and.
Table 5.
Comparison beteween numerical and analytical results for dimensionless concentration of product for various values of parameter when and.
| Num.Eq.(10) | AGMEq.(26) | TSMEq.(41) | Error % ofAGMEq.(26) | Error % of TSMEquation (41) | NumEq.(10) | AGMEq.(26) | TSMEq.(41) | Error % ofAGMEq.(26) | Error % of TSMEquation (41) | ||
|---|---|---|---|---|---|---|---|---|---|---|---|
| 0 | 0.39 | 0.39 | 0.39 | 0.00 | 0.00 | 0.01 | 0.01 | 0.01 | 0.00 | 0.00 | |
| 0.2 | 0.42 | 0.42 | 0.42 | 0.00 | 0.00 | 0.05 | 0.05 | 0.05 | 0.00 | 0.00 | |
| 0.4 | 0.49 | 0.49 | 0.49 | 0.00 | 0.00 | 0.18 | 0.17 | 0.18 | 5.55 | 0.00 | |
| 0.6 | 0.62 | 0.61 | 0.62 | 1.61 | 0.00 | 0.38 | 0.37 | 0.38 | 2.63 | 0.00 | |
| 0.8 | 0.79 | 0.79 | 0.79 | 0.00 | 0.00 | 0.66 | 0.66 | 0.66 | 0.00 | 0.00 | |
| 1 | 1.00 | 1.00 | 1.00 | 0.00 | 0.00 | 1.00 | 1.00 | 1.00 | 0.00 | 0.00 | |
| Average error % | 0.27 | 0.00 | Average error % | 1.36 | 0.00 | ||||||
Table 6.
Comparison beteween numerical and analytical results for dimensionless concentration of product for various values of parameter when and .
Table 6.
Comparison beteween numerical and analytical results for dimensionless concentration of product for various values of parameter when and .
| Num.Eq.(10) | AGMEq.(26) | TSMEq.(41) | Error % ofAGMEq.(26) | Error % of TSMEquation (41) | NumEq.(10) | AGMEq.(26) | TSMEq.(41) | Error % ofAGMEq.(26) | Error % of TSMEquation (41) | |
|---|---|---|---|---|---|---|---|---|---|---|
| 0 | 0.70 | 0.72 | 0.70 | 2.86 | 0.00 | 0.41 | 0.44 | 0.41 | 7.32 | 0.00 |
| 0.2 | 0.71 | 0.73 | 0.71 | 2.82 | 0.00 | 0.43 | 0.46 | 0.43 | 6.98 | 0.00 |
| 0.4 | 0.75 | 0.76 | 0.75 | 1.33 | 0.00 | 0.51 | 0.53 | 0.51 | 3.92 | 0.00 |
| 0.6 | 0.81 | 0.82 | 0.81 | 1.23 | 0.00 | 0.63 | 0.64 | 0.63 | 1.59 | 0.00 |
| 0.8 | 0.90 | 0.90 | 0.90 | 0.00 | 0.00 | 0.80 | 0.80 | 0.80 | 0.00 | 0.00 |
| 1 | 1.00 | 1.00 | 1.00 | 0.00 | 0.00 | 1.00 | 1.00 | 1.00 | 0.00 | 0.00 |
| Average error % | 1.37 | 0.00 | Average error % | 3.30 | 0.00 | |||||
Table 7.
Comparison between numerical and analytical normalized steady-state source terms of liquid phase for various values of parameter and when .
Table 7.
Comparison between numerical and analytical normalized steady-state source terms of liquid phase for various values of parameter and when .
| Num.Eq.(13) | AGMEq.(27) | TSMEq.(43) | Error% ofAGMEq.(27) | Error% ofTSMEquation (43) | Num.Eq.(13) | AGMEquation (27) | TSMEq.(43) | Error% ofAGMEq.(27) | Error%ofTSMEquation (43) | |
|---|---|---|---|---|---|---|---|---|---|---|
| 0 | 0.06 | 0.06 | 0.06 | 0.00 | 0.00 | 0.04 | 0.04 | 0.04 | 0.00 | 0.00 |
| 0.1 | 0.09 | 0.09 | 0.09 | 0.00 | 0.00 | 0.07 | 0.07 | 0.07 | 0.00 | 0.00 |
| 0.5 | 0.20 | 0.21 | 0.21 | 5.00 | 5.00 | 0.15 | 0.15 | 0.15 | 0.00 | 0.00 |
| 1 | 0.34 | 0.37 | 0.34 | 8.82 | 0.00 | 0.26 | 0.27 | 0.26 | 3.85 | 0.00 |
| 5 | 1.25 | 1.56 | 1.33 | 24.8 | 6.40 | 1.00 | 1.15 | 1.01 | 15.00 | 1.00 |
| 10 | 2.08 | 3.09 | 2.42 | 48.56 | 16.35 | 1.74 | 2.27 | 1.90 | 30.46 | 9.19 |
| 50 | 5.64 | 15.2 | 5.23 | 169.7 | 7.27 | 4.81 | 11.15 | 5.22 | 131.8 | 8.52 |
| 100 | 7.75 | 30.4 | 5.66 | 291.7 | 26.97 | 7.31 | 22.27 | 5.66 | 204.6 | 22.57 |
| Average error % | 68.68 | 7.75 | Average error % | 48.22 | 5.16 | |||||
Table 8.
Comparison between numerical and analytical normalized steady-state source terms of gas phase for various values of parameter and when and .
Table 8.
Comparison between numerical and analytical normalized steady-state source terms of gas phase for various values of parameter and when and .
| Num.Eq.(14) | AGMEq.(28) | TSMEq.(44) | Error % ofAGMEq.(28) | Error % of TSMEquation (44) | Num.Eq.(14) | AGMEquation (28) | TSMEquation (44) | Error % ofAGMEq.(28) | Error % of TSMEquation (44) | ||
|---|---|---|---|---|---|---|---|---|---|---|---|
| 0 | 0.08 | 0.09 | 0.09 | 12.50 | 12.50 | 0.06 | 0.07 | 0.06 | 16.67 | 0.00 | |
| 0.1 | 0.12 | 0.14 | 0.12 | 16.67 | 0.00 | 0.10 | 0.10 | 0.10 | 0.00 | 0.00 | |
| 0.5 | 0.27 | 0.32 | 0.28 | 18.52 | 3.70 | 0.22 | 0.23 | 0.22 | 4.54 | 0.00 | |
| 1 | 0.47 | 0.54 | 0.47 | 14.87 | 0.00 | 0.37 | 0.40 | 0.37 | 8.11 | 0.00 | |
| 5 | 2.02 | 2.36 | 2.03 | 16.83 | 0.49 | 1.58 | 1.73 | 1.60 | 9.49 | 1.27 | |
| 10 | 3.96 | 4.64 | 3.98 | 17.17 | 0.50 | 3.10 | 3.40 | 3.14 | 9.68 | 1.29 | |
| 50 | 19.5 | 22.8 | 19.55 | 17.21 | 0.41 | 15.26 | 16.73 | 15.42 | 9.63 | 1.05 | |
| 100 | 38.9 | 45.5 | 39.02 | 17.19 | 0.41 | 30.46 | 33.40 | 30.78 | 9.65 | 1.05 | |
| Average error % | 16.37 | 2.25 | Average error % | 8.47 | 0.58 | ||||||
7. Conclusions
The objective of this research is multi-folded. First, we successfully employed two widely used analytical methods (AGM and TSM) to solve two reaction-diffusion equations representing the packed bed photobioreactor with immobilized-cell, and derive simple semi-analytical expressions of the substrate and product concentrations and analytical expressions of steady-state source terms of liquid and gas phases. Second, we studied the effect of the reaction-diffusion parameters on the concentrations of substrate and product. Third, we added to the literature some useful information about the exploitation of some of the widely used methods, in particular the AGM and TSM. As both methods appear to be effective and reliable in solving nonlinear systems, it is noticed that the AGM is more or less a modification of the Adomian decomposition method and is likely to involve some tedious algebraic computations. The TSM, on the other hand, involves less algebraic computations, gives more accurate results, and guarantees convergence if the conditions of Taylor’s theorem are met.
Author Contributions
Conceptualization, M.A. and L.R.; methodology, M.E.G.L..; software, P.J; validation, M.A., and P.J.; formal analysis, L.R.; investigation, M.E.G.L.; resources, P.J.; data curation, P.J.; writing—original draft preparation, M.A.; writing—review and editing, P.J.; visualization, L.R; supervision, M.E.G.L.; and L.R.; project administration, M.E.G.L.; All authors have read and agreed to the published version of the manuscript.
Funding
The authors have not received any funds.
Institutional Review Board Statement
Not applicable.
Informed Consent Statement
Not applicable.
Conflicts of Interest
The author declare no conflict of interest.
List of Symbols
| Symbols | Description | Units |
| Local substrate concentration | kg/m3 | |
| Radius of the gel granule | m | |
| Diffusion coefficient | m2/s | |
| Absolute permeability | m2 | |
| Molecular weight | kg mol-1 | |
| Photobioreactor height | m | |
| Maintenance coefficient | h-1 | |
| Source item in mass conservation equation | ||
| Source item in species conservation equation | ||
| Specific area | m2/kg | |
| Growth associated kinetic constant for hydrogen production | None | |
| Non- growthassociated kinetic constant | h-1 | |
| Specific growth rate | h-1 | |
| Maximum specific growth rate | h-1 | |
| Dimensionless substrate concentration | None | |
| Dimensionless product concentration | None | |
| Dimensionless parameter | None | |
| Dimensionless parameter | None | |
| Dimensionless parameter | None | |
| Dimensionless parameter | None | |
| Dimensionless parameter | None | |
| Dimensionless distance | None | |
| Superscripts | ||
| S | Substrate | |
| H2 | Hydrogen | |
| CO2 | Carbon dioxide | |
| Subscripts | ||
| g | Gas phase | |
| l | Liquid phase |
Appendix A
function pdex4
m = 2;
x = linspace(0,1);
t=linspace(0,10);
sol = pdepe(m,@pdex4pde,@pdex4ic,@pdex4bc,x,t);
u1 = sol(:,:,1);
u2 = sol(:,:,2);
%------------------------------------------------------------------
figure
plot(x,u1(end,:))
title('u1(x,t)')
xlabel('Distance x')
ylabel('u1(x,1)')
%------------------------------------------------------------------
figure
plot(x,u2(end,:))
title('u2(x,t)')
xlabel('Distance x')
ylabel('u2(x,2)')
% -----------------------------------------------------------------
function [c,f,s] = pdex4pde(x,t,u,DuDx)
c = [1; 1];
f = [1; 1] .* DuDx;
a1=10; p1=30;p2=0.1; r1=0.1; r2=0.1;r3=0.1;r4=0.1; %
F1=-(((p1+r1)*u(1)+r2)/(1+a1*u(1)));
F2= -(((p2+r3)*u(1)+r4)/(1+a1*u(1)));
s=[F1; F2];
% -----------------------------------------------------------------
function u0 = pdex4ic(x)
u0 = [0; 0];
% -----------------------------------------------------------------
function [pl,ql,pr,qr]=pdex4bc(xl,ul,xr,ur,t)
pl = [ul(1)-0; ul(2)-0];
ql = [1; 1];
pr = [ur(1)- 1; ur(2)-1];
qr = [0; 0];
References
- Rajendran, L; Swaminathan, R; Chitra Devi, M. A Closer Look of Nonlinear Reaction-Diffusion Equations, nova publishers,2020.
- Praveen, T; Rajendran , L. Theoretical analysis through mathematical modeling of two-phase flow transport in an immobilized-cell photobioreactor, Chemical Physics Letters, 2015, 625, 193-201. [CrossRef]
- ZeibiShirejini, S; Fattahi, M. Mathematical modeling and analytical solution oftwo-phase flow transport in an immobilized-cellphotobioreactor using the homotopy perturbationmethod (HPM), Int. J Hydrogen Energy, 2016, 1-13. [CrossRef]
- Ganji, D; Hosseini, M.; Shayegh, J. Some nonlinear heat transfer equations solved by three approximate methodsInt. Commun. Heat Mass Transf, 2007, 34, 1003-1016. [CrossRef]
- He JH., Homotopy perturbation technique, Comput Methods Appl Mech Eng, 1999, 178(3–4) 257-262. [CrossRef]
- Manimegalai, B; Lyons, MEG; Rajendran, L. Transient chronoamperometric current at rotating disc electrode for second-order ECE reactions. J. Electroanal. Chem. 2021, 902: 115775. [CrossRef]
- Umadevi, R; Venugopal, K; Jeyabarathi, P; Rajendran, L; Abukhaled, M. Analytical study of nonlinear roll motion of ships: A Homotopy perturbation approach. Palestine Journal of Mathematics. 2022; 11:316-325.
- Swaminathana, R; Venugopal, K; Rasi, M; Abukhaled, M. Rajendran, L. Analytical expressions for the concentration and current in the reduction of hydrogen peroxide at a metal-dispersed conducting polymer film,Quim. Nova, 2020, 43, 1, 58-65. [CrossRef]
- Joy Salomi, R; Vinolyn Sylvia, S; Abukhaled, M; Lyons, MEG; Rajendran, L; Theoretical Analysis of Transient Responses of Amperometric Biosensor Based on the Phenol–Polyphenol Oxidase Model, Int. J. Electrochem. Sci., 2022, 17, Article Number: 22047. [CrossRef]
- Swaminathan, R; Narayanan, KL; Mohan, V; Saranya, K; Rajendran, L; Reaction/Diffusion Equation with Michaelis-Menten Kinetics in Microdisk Biosensor: Homotopy Perturbation Method Approach,Int. J. Electrochem. Sci., 2019, 14, 3777 – 3791. [CrossRef]
- Chitra Devi, M; Pirabaharan, P; Rajendran, L.; Abukhaled, M; Amperometric biosensors in an uncompetitive inhibition process: a complete theoretical and numerical analysis. React. Kinet. Mech. Catal. 2021, 133, 655-668. [CrossRef]
- He, JH. Variational iteration method for autonomous ordinary differential systems, Appl. Math. Compute, 2000, 114(2-3),115-123. [CrossRef]
- Ghafoori, S; Motevalli, M; Nejad, MG; Shakeri, F; Ganji, DD; Jalaal, M. Efficiency of differential transformation method for nonlinear oscillation: Comparison with HPM and VIM, Curr Appl Phys, 2011, 11(4), 965-971. [CrossRef]
- Rahamathunissa, G; Rajendran, L; Application of He’s variational iteration method in nonlinear boundary value problems in enzyme–substrate reaction diffusion processes: part 1. The steady-state amperometric, 2008, J. Math. Chem., 44 (3), 849-861. [CrossRef]
- Abukhaled, M. Variational iteration method for nonlinear singular two-point boundary value problems arising in human physiology, J. Math, 2013, Article ID 720134. [CrossRef]
- Eswari, A; Rajendran, L. Application of variational iteration method and electron transfer mediator/catalyst composites in modified electrodes, Nat. sci, 2010, 2 (6), 612-625. [CrossRef]
- Liao, SJ. The proposed homotopy analysis technique for the solution of nonlinear problems, Ph.D. Thesis, Shanghai Jiao Tong University, 1992.
- Liao, SJ. Beyond Perturbation: Introduction to Homotopy Analysis Method, Chapman & Hall/CRC, 2003.
- Liao, SJ. Notes on the homotopy analysis method: some definitions and theorems, Commun. Nonlinear Sci. Numer. Simul. 2009, 14, 14,983–997. [Google Scholar] [CrossRef]
- Liao, S. On the homotopy analysis method for nonlinear problems. Appl. Math. Comput. 2004, 147(2), 499–513. [Google Scholar] [CrossRef]
- Arikoglu, A.; Ozkol, I. Solution of difference equations by using differential transform method, Appl. Math. Comput, 2006, 174(2), 1216-1228. [CrossRef]
- Soltanalizadeh, B. Differential transformation method for solving one-space-dimensional telegraph equation, Comput. Appl. Math, 2011, 30(3). [CrossRef]
- Jeyabarathi, P.; Kannan,M.; Rajendran, L.Approximate analytical solutions of biofilm reactor problem in applied biotechnology. Theor. Found. Chem. Eng.2021, 55(5), 851-861. [CrossRef]
- Jeyabarathi,P.; Rajendran,L.; Abukhaled,M.; Kannan,M.; Semi-analytical expressions for the concentrations and effectiveness factor for the three general catalyst shapes. React. Kinet. Mech. Catal.2022, 1-16. [CrossRef]
- Abukhaled, M; Khuri, SA. Efficient numerical treatment of a conductive-radiative fin with temperature-dependent thermal conductivity and surface emissivity, Int J. Comput. Methods Eng. Sci. Mech, 2020, 21 (4) 159–168. [CrossRef]
- Abukhaled, M. Green’s function iterative method for Solving a class of boundary value problems arising in heat transfer, Appl. Math. Inf. Sci., 2017,11 (1) 229–234. [CrossRef]
- Sheikholeslami, M; Ganji, DD. Applications of Semi-Analytical Methods for Nanofluid Flow and Heat Transfer. Oxford: Elsevier, 2018.
- Jeyabarathi,P.; Rajendran,L.; Lyons,MEG. Reaction-diffusion in a packed-bed reactors: Enzymatic isomerization with Michaelis-Menten KineticsJ. Electroanal. Chem. 2022, 910, 116184. [CrossRef]
- Jeyabarathi, P.; Rajendran, L.; Lyons M. E., G.; Abukhaled, M. Theoretical Analysis of Mass Transfer Behavior in Fixed-Bed Electrochemical Reactors: Akbari-Ganji’s Method. Electrochem 2022, 3, 699–712. [Google Scholar] [CrossRef]
- He, CH; Shen, Y; Ji, FY; He, JH. Taylor series solution for Fractal Bratu-Type equation arising in electrospinning process, Fractals, 2020, 28, 1-8. [CrossRef]
- Lilly Clarance Mary, M.; Chitra Devi, M.; Meena, A; Rajendran, L.; Abukhaled, M. A reliable Taylor series solution to the nonlinear reaction-diffusion model representing the steady-state behaviour of a cationic glucose-sensitive membrane, J. Math. Comput. Sci. 2021, 11, 8354–8381. [CrossRef]
- Liao, Q; Liu, DM; Ye, DD; Zhu, X; Lee, DJ. Mathematical modeling of two-phase flow and transport in an immobilized-cell photobioreactor, Int. J. Hydrogen Energy, 2011,36, 13936-13948. [CrossRef]
- Akbari, MR; Ganji, DD; Nimafar, M; Ahmadi, AR. Significant progress in solution of nonlinear equations at displacement of structure and heat transfer extended surface by new AGM approach. Front. Mech. Eng, 2014, 9(4), 390–401. [CrossRef]
- Akbari, M. Nonlinear Dynamic in Engineering by Akbari-Ganji’s Method, Xlibris Corporation, 2015.
- Ganji, DD; Talarposhti, RA. Numerical and Analytical Solutions for Solving Nonlinear Equations in Heat Transfer, Hershey, PA: Technology and Engineering, IGI Global, 2017.
- AlRasheed, NN. Adaptation of Taylor’s Formula for Solving System of Differential Equations, Nonlinear Differ. Equ. App,, 2016, 4(2), 95 – 107. [CrossRef]
- El-Ajou,A; Abu Arqub, O; Al-Smadi, M. A general form of the generalized Taylor’s formula with some applications, Appl. Math. Comput., 2015, 256, 851-859. [CrossRef]
Disclaimer/Publisher’s Note: The statements, opinions and data contained in all publications are solely those of the individual author(s) and contributor(s) and not of MDPI and/or the editor(s). MDPI and/or the editor(s) disclaim responsibility for any injury to people or property resulting from any ideas, methods, instructions or products referred to in the content. |
© 2023 by the authors. Licensee MDPI, Basel, Switzerland. This article is an open access article distributed under the terms and conditions of the Creative Commons Attribution (CC BY) license (http://creativecommons.org/licenses/by/4.0/).
Copyright: This open access article is published under a Creative Commons CC BY 4.0 license, which permit the free download, distribution, and reuse, provided that the author and preprint are cited in any reuse.


