1. Introduction
Optically pumped magnetometers (OPMs) exploit the Zeeman effect in vapours of alkali atoms [
1]. These sensors rely on creation of an atomic polarization by optical pumping and optical readout of the coherent Larmor precession of atoms within the magnetic field of interest. While such OPM inherently infer the absolute value of the magnetic field vector, thus are termed to be
scalar, typical implementations suffer from the dependence of sensor orientation on the ambient magnetic field direction. On one hand, the dependence of the signal amplitude on the sensor orientation can lead to a drop in sensor sensitivity in certain configurations (“
dead zones”) [
2]. On the other hand, there are effects that lead to systematic shifts in the sensor reading in dependence on the sensor orientation. These effects, termed “
heading errors”, can emerge from (vector) light shifts (also known as ac Stark shifts) or from shifts due to the nonlinear Zeeman effect, being especially prominent in the geomagnetic field intensity range [
3,
4]. While such systematic effects might be calibrated for or even ignored in stationary applications of OPM systems requiring “
sensitivity only”, they become especially important for measurements within the Earth’s magnetic field such as in magnetic exploration [
5]. In such applications, systematic effects typically outrange the sensors’ intrinsic sensitivity by several orders of magnitude, heavily limiting the overall sensor performance.
In the past, research has been devoted to understand and reduce heading errors and dead zones of OPMs. Some approaches exploit, that the shift due to the nonlinear Zeeman effect changes sign with the helicity of the circularly polarized pumping light. This allows to cancel the heading error by the use of two alkali vapor cells (or two separated compartments), which are optically pumped (and read out) by circularly polarized light propagating in opposite directions [
6] or by light propagating collinear, but with opposite circular helicity σ
+ and σ
- [
7]. Recently, by using amplitude-modulated light and an additional rf field the asymmetric line splitting caused by the nonlinear Zeeman effect could be eliminated in a method termed “
spin locking” [
8]. However, this approach was only tested within a small range of tilting angles of about 10°. Besides this, using circularly polarized optical pumping with light alternating between σ
+ and σ
- polarization at the Larmor frequency interrupted by linear polarization in each sequence was shown to efficiently suppress dead zones [
9].
A straightforward approach to eliminate the dead zones is using combinations of multiple OPM cells with different orientations with respect to the magnetic field to be measured. For example, when using three orthogonally oriented M
z OPMs, under any orientation in the Earth’s magnetic field at least one cell gives a magnetometer signal [
10]. It was also shown, that even two OPM cells are sufficient when using collinearly propagating modulated laser beams of two perpendicular linear polarizations [
11]. Also, realizations with only one cell have been tested requiring a mechanical rotation of the light polarization orientation [
12,
13] in order to track changing magnetic field orientations.
Here, we present the concept of an omnidirectional magnetometer based on two sensor compartments using amplitude-modulated light. In the next section, we introduce our realization and discuss its basic functionality and advantages. In
Section 3, the experimental setup is described, before we subsequently discuss measurement results and draw conclusions for further work.
2. Concept of the Omnidirectional OPM
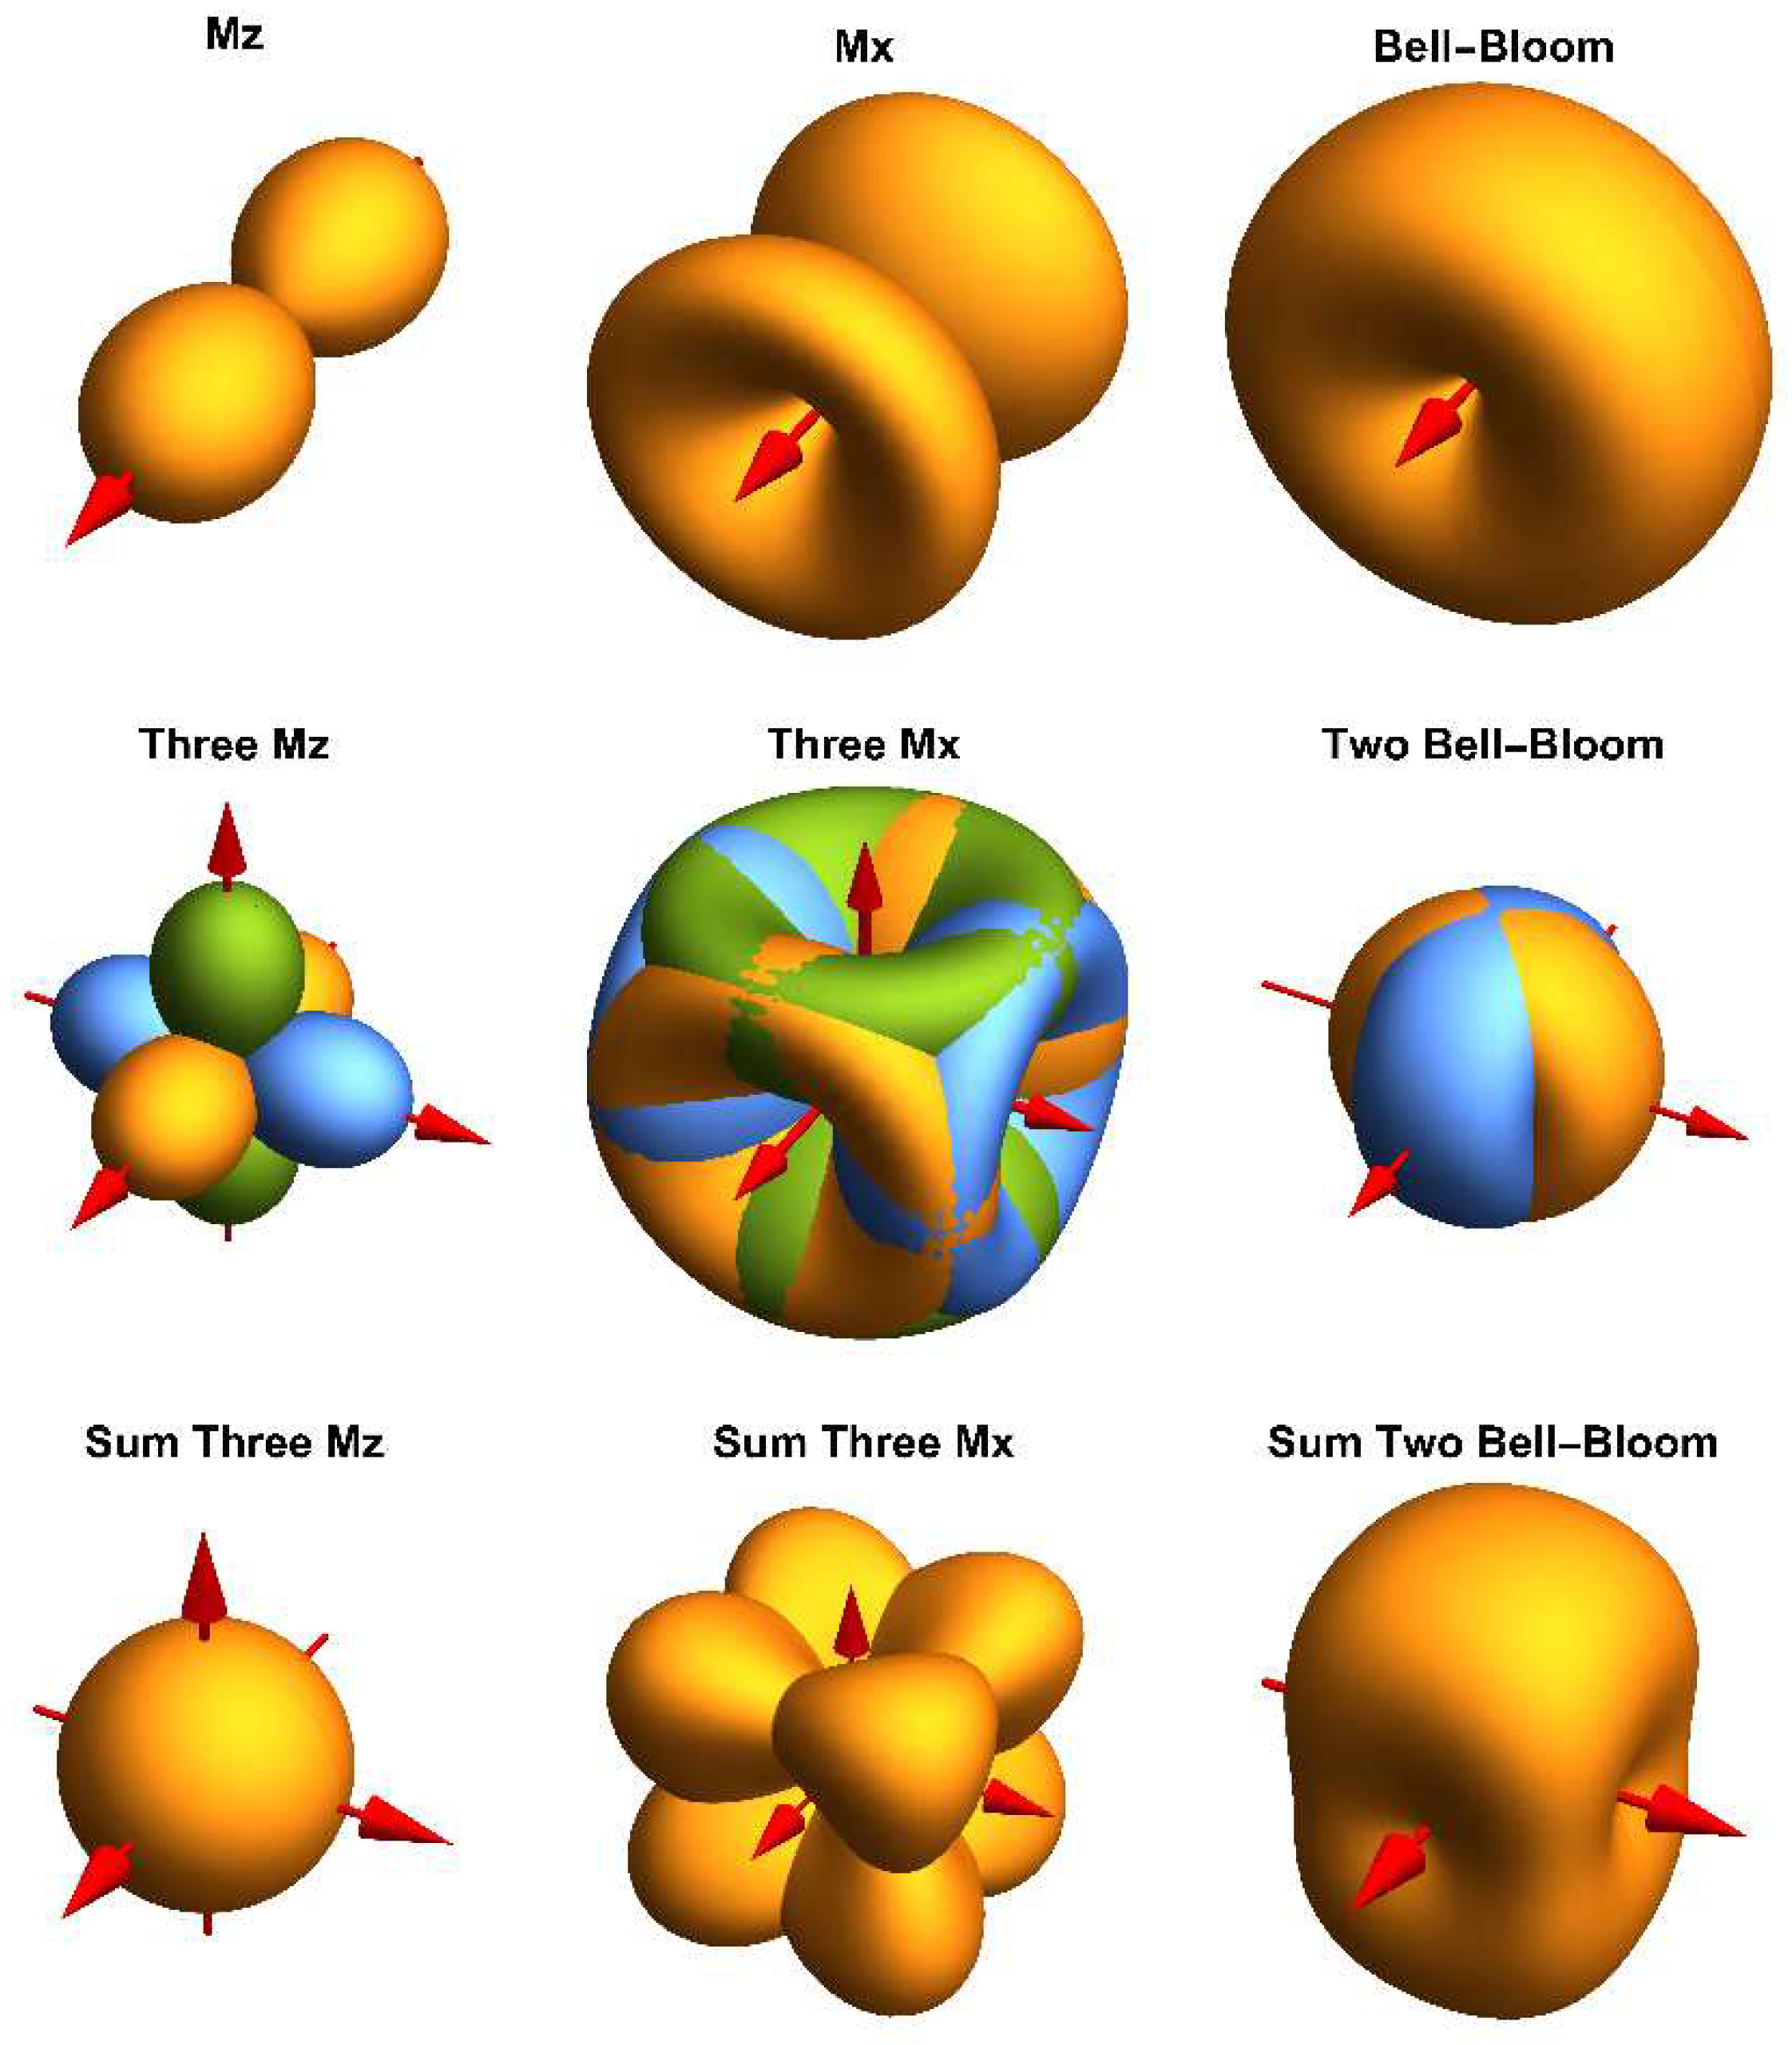
In a first analysis, we assessed the most promising operational modes for realizing an omnidirectional OPM. An overview of calculated OPM signal amplitudes with respect to the pump light orientation is given in
Figure 1.
In the often used M
x magnetometer, using a single laser beam for both optical pumping and readout of a single cell, one has the following spatial distribution of the (normalized) signal amplitude [
2]:
where ξ is the angle between light propagation direction
k and direction of the ambient magnetic field vector
B0. Even when using three mutually orthogonally arranged M
x magnetometers, sensor orientations remain where the signal amplitude vanishes due to the small funnel-shaped spatial amplitude distribution shown in
Figure 1.
The spatial amplitude distribution of the M
z magnetometer [
14]
has the form of a dumbbell and results from the projection of the magnetic field vector onto the light propagation direction
k. So, with three orthogonally arranged M
z magnetometers, explicitly written for the three coordinate axes
the spatial signal distribution of the sum signal is described by a sphere (ϕ and θ are the common spherical coordinates). Therefore, as shown in
Figure 1, such arrangement would deliver an OPM operating perfectly omnidirectionally. However, the common M
z magnetometer has inferior magnetic-field resolution as compared to M
x [
1]. Methods for strongly improved performance of M
z magnetometers [
15,
16] have been suggested and tested [
17]. However, these approaches require two cell compartments for each of the axes, pumped with two beams of circularly polarized light having opposite helicity. Hence, the effort of implementing such an omnidirectional OPM would be significant, because six laser beams with very high demands for light power and polarization balancing are required in total.
In contrast, the operation of an OPM with intensity-modulated (IM) pumping light features an even more beneficial dependence of signal amplitude on orientation angle [
18]
Such OPMs, also named Bell-Bloom (BB) magnetometers [
19] have the great advantage to be sensitive in all directions - except for the propagation direction
k of the laser light, thus covering two spatial dimensions with a single magnetometer (
Figure 1). Thus, already two perpendicularly oriented BB magnetometers can cover the full solid angle. Moreover, the BB sensor configuration avoids the use of additional rf-fields [
11,
20], thus is “magnetically silent” preventing potential inter-channel crosstalk [
21]. Moreover, under same conditions the magnetic-field resolution of the IM mode has been shown to be comparable to the common Mx magnetometer [
20].
We conclude, that a configuration with two perpendicularly arranged intensity-modulated magnetometers using only one beam for both, pumping and probing, represents the most promising approach of omnidirectional operation considering dead-zones, sensor complexity as well as expected magnetic field sensitivity.
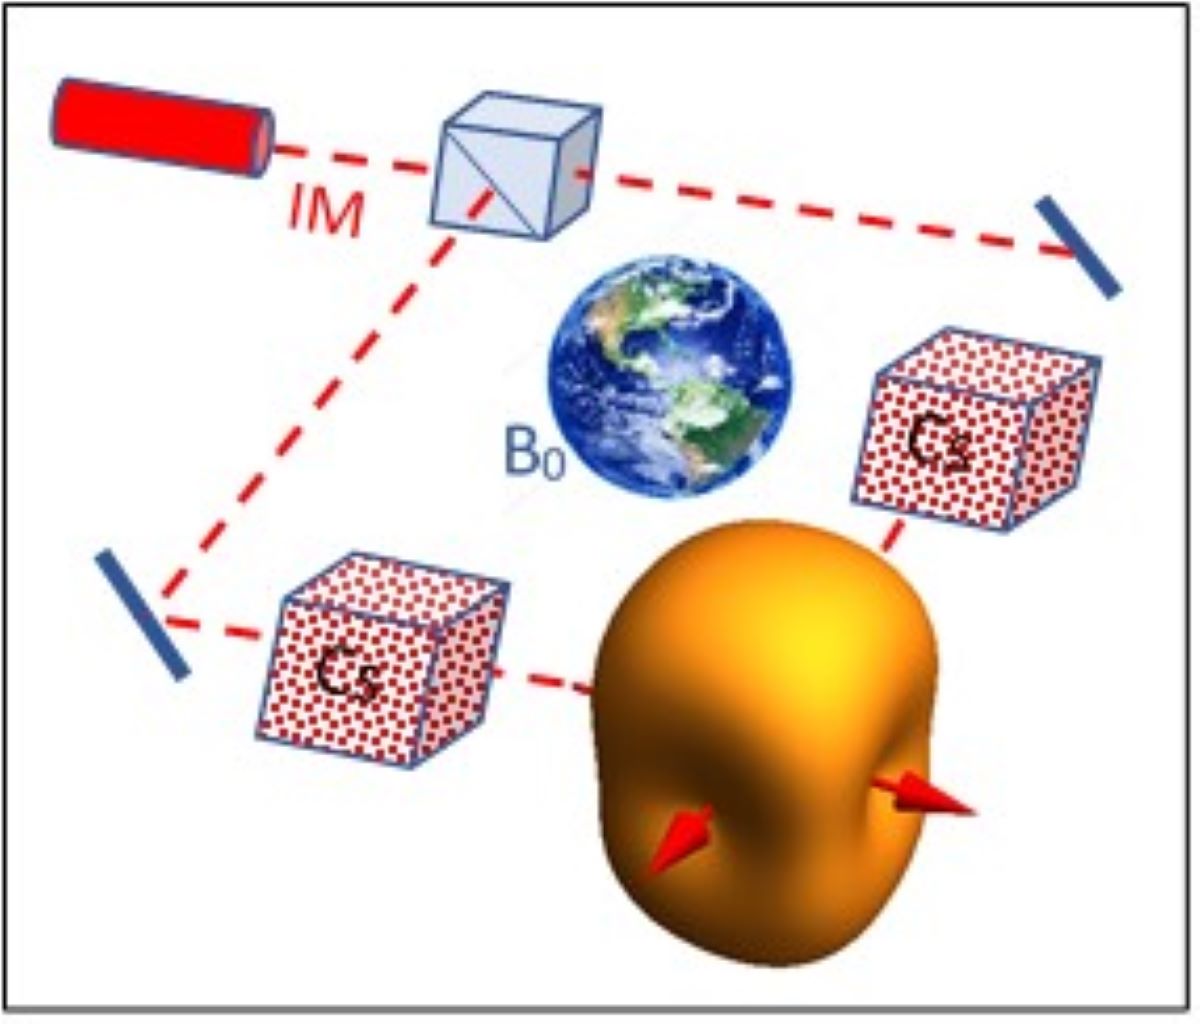
The red arrows denote the light propagation directions k of the laser beams.
3. Measurement Method
3.1. Experimental Setup
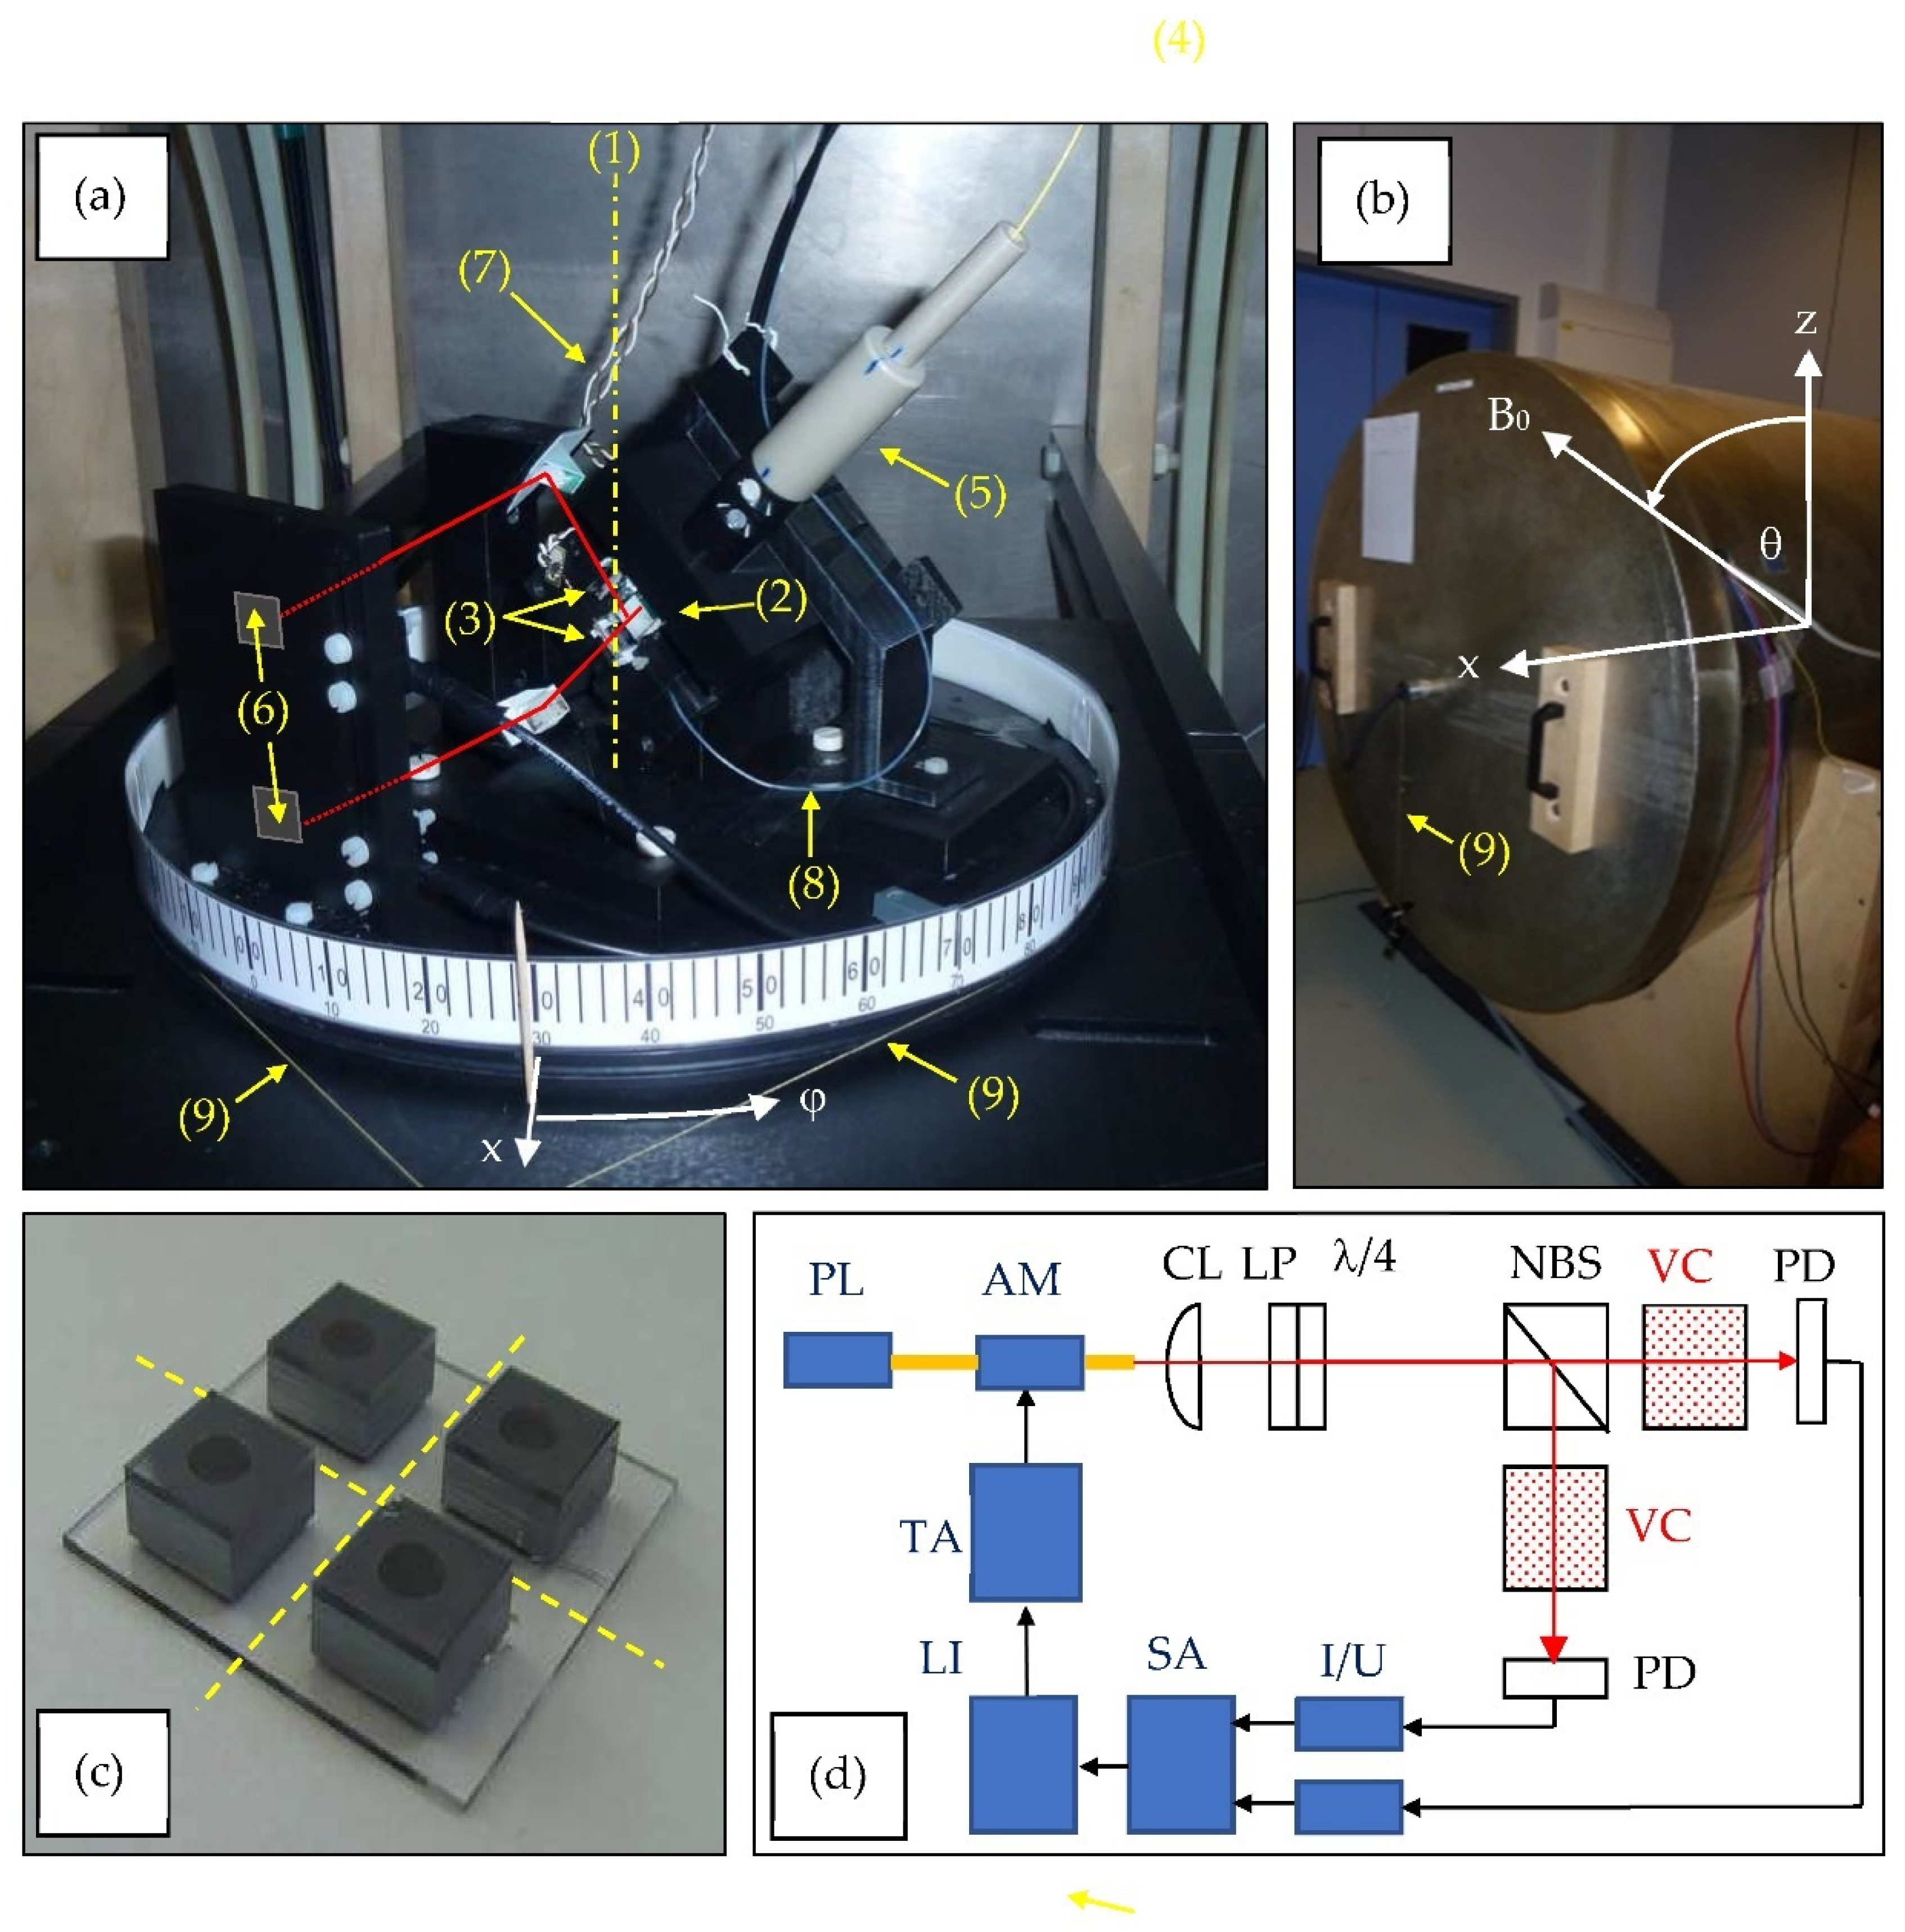
For experimental investigation of the omnidirectional configuration, we adapted a setup that has already been used for heading error investigations of OPMs [
3,
22]. It is based on a turntable on which the vapor cells and required optical components are mounted, as shown in
Figure 2a).
- (a)
Turntable inside magnetic shielding barrel. (1) rotation axis; (2) non-polarizing beam splitter; (3) the two cesium vapor cells, where the lower and upper cell are further on labelled as #1 und #2, respectively; (4) optical fiber delivering laser light; (5) light collimation and polarization conditioning with lens, linear polarizer and λ/4 wave plate; (6) two photodiodes (hidden by their plastic mount); (7) wires connecting to the thin-film heaters; (8) fiber-based temperature sensor; (9) pull strings for manual table turning. The laser beam paths are sketched in red.
- (b)
Closed magnetic shielding barrel with turntable and Helmholtz coil systems inside. The lab reference frame in spherical coordinates is sketched in white in Figures (a) and (b).
- (c)
Four cesium vapor cells on a common glass substrate [
23]. This assembly is sawed along the dashed lines in order to get the two separated vapor cells. Both are equipped with a ceramic thin-film heater on one silicon side wall. One other silicon side wall of one cell is blackened with soot, where the fiberized temperature sensor is pressed against.
- (d)
Schematic drawing of the complete measurement setup. PL: pumping laser; AM: amplitude modulator; CL: collimating lens; LP and λ/4: combination of linear polarizer and quarter wave plate; NBS: non-polarizing 50:50 beam splitter; VC: Cs vapor cells; PD: photo diodes; I/U: transimpedance preamplifiers; SA: summing amplifier; LI: lock-in amplifier with integrated generator; TA: tuneable amplifier.
The turntable is mounted inside of a three-layer magnetic shielding barrel (
Figure 2b) including a three-axis Helmholtz coil system for the application of magnetic fields in arbitrary directions [
24]. We ensured that the vapor cells are both centered on the rotational axis of the turntable by placing them inclined by ±45° with respect to the turntable
xy plane. This way, during rotation of the turntable the influence of remaining magnetic field gradients in the
xy plane is eliminated. The two vapor cells are at a distance of 15 mm in
z direction (vertical rotational axis).
The cesium cells [
23] feature nitrogen buffer gas pressures of 38 mbar (cell #1) and 28 mbar (cell #2), respectively. Thin-film heaters attached on the sides of the cells’ silicon parts are fed with an ac current of 10 kHz, well outside the expected measurement bandwidth of about 500 Hz.
The laser radiation for optical pumping and sensor readout from a distributed bragg reflector (DBR) laser (λ = 894,6 nm) is delivered using individually assembled bow-tie fibers because of their better robustness against mechanical movement and temperature changes as compared to more commonly used panda fibers. The light intensity is square-wave modulated at full modulation depth with 50% duty cycle using a fiber-coupled integrated Mach-Zehnder interferometer. The high-intensity value is varied in order to attain the best magnetic-field resolution.
In a first set of experiments, we optimized the experimental parameters for lowest shot-noise limited field resolution Bsn. A magnetic field of 10 µT is used, yielding a Larmor frequency near 35 kHz. It is applied along the x axis (θ=90°). With an initial turntable orientation of ϕ=0° the pumping light direction k is perpendicular to B0 for both OPM cells. For this case, the best shot-noise limited resolution of Bsn ≈ 100 fT/√Hz is achieved at cell temperatures of 60°C, a pumping power in front of the cells of 170 µW, and a laser frequency about 1 GHz higher than at the (buffer-gas broadened and shifted) F=4 → F’=3 hyperfine transition of the Cs D1 line. These parameters were fixed throughout all further measurements. Only the relative orientation of pumping light direction k and magnetic field B0 was varied.
3.2. Measurement Procedure
The measurements covered the complete upper hemisphere of the lab coordinate frame. Firstly, a polar angle θ from the set [0; 15; 30; 45; 60; 75; 90°] was fixed. Then, the azimuth angle ϕ was varied manually between -165° and 165° in steps of 15° (due to the connection of the pull strings, the value of angle ϕ=180° is not accessible). In order to exclude the influences of temporal parameter drifts, ϕ was increased in steps of 30° from 0° up to 150°, afterwards decreased from 165° to -165°, and finally once again increased from -150° to 0°, all once again in steps of 30°. Then, the polar angle was tuned to the next value by adjusting the magnetic field direction in the xz plane by applying different currents in x and y coils. After each such change the shielding barrel was demagnetized in order to minimize residual magnetic fields in the µ-metal shielding before the next series with varying azimuth ϕ starts. At each position given by [ϕ,θ], three resonance curves around the Larmor frequency were independently recorded for the individual magnetometers #1 and #2 as well as for their sum (in the following labelled as #12).
The measurements were carried out at fixed lock-in phase offset, determined once in the (best) sensor position when k was perpendicular to B0. This method resembles the operational mode in a real-world geophysical measurement application, when the OPM sensor will be moved and rotated within the background magnetic field. The insensitivity of the lock-in phase on the sensor orientation was checked successfully.
All relevant parameters for the valuation of the OPM operation were taken from the dispersive (
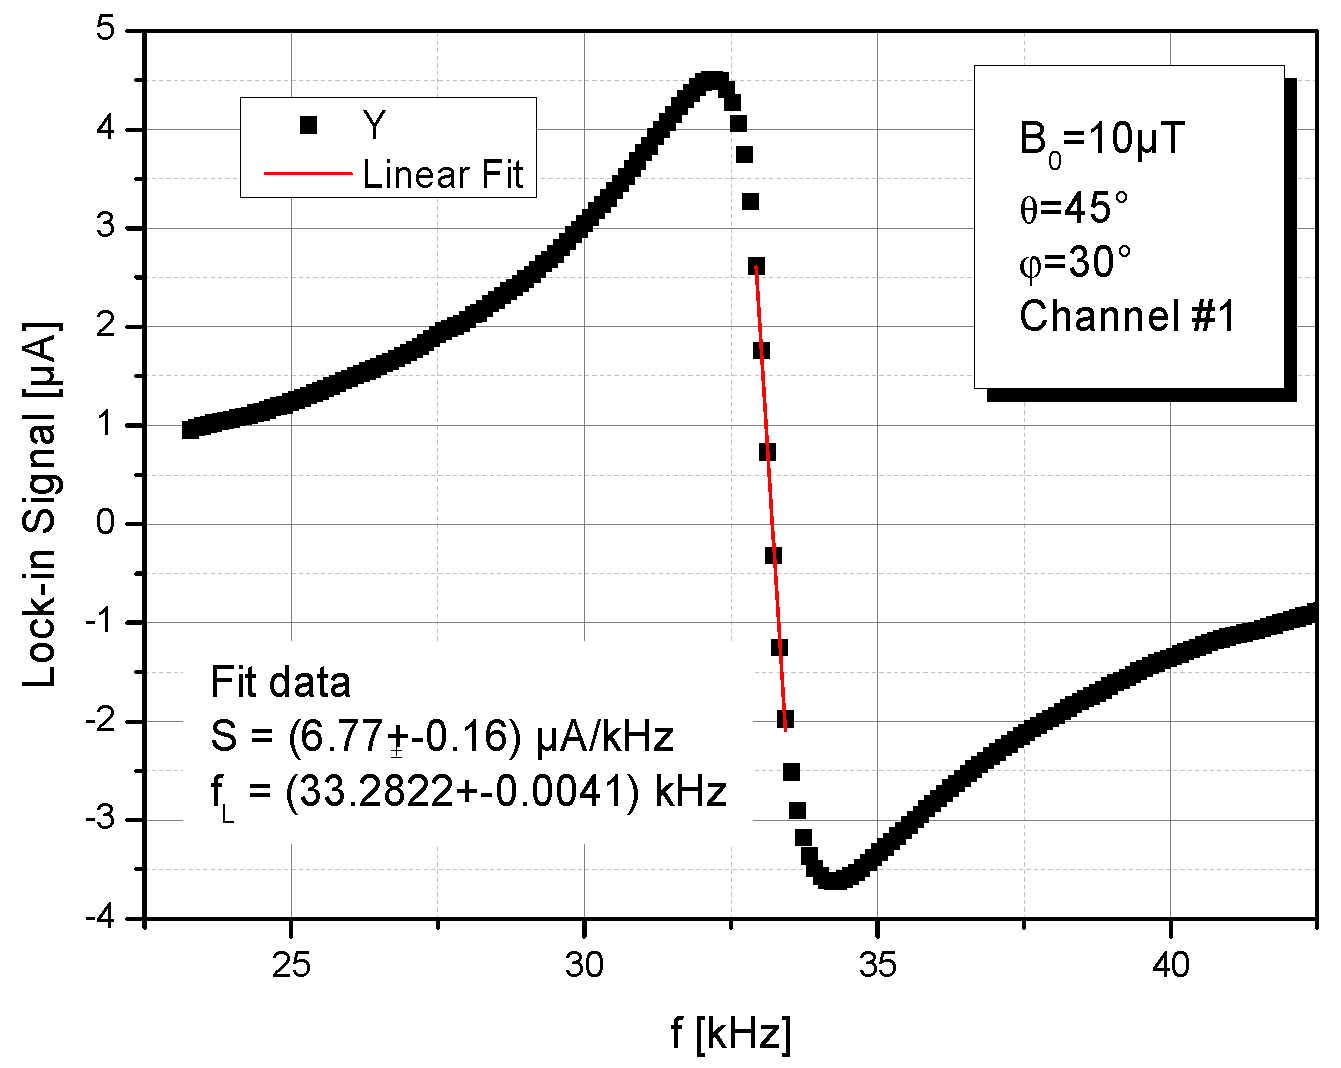
Y) lock-in signal. One example is shown in
Figure 3. The linear fit around resonance delivers the conversion factor d
Y/d
f, which is referred to as signal size
S. This is done because in IM operation of the OPM the absorptive (
X) lock-in signal shows a large amplitude offset due to the simultaneous use of the modulated laser beam for both pumping and readout [
20]. The zero crossing of the measured
Y signal deliveres the Larmor frequency
fL=γ⋅
B0 as the measure of the magnetic field
B0 (with γ = 3.5 Hz/nT being the gyromagnetic ratio of cesium).
The data variation given in the example in
Figure 3 has a typical size valid for all measurements. Resulting error bars are only shown in
Figure 5. In all subsequent diagrams they are omitted for the sake of clarity. In all cases the variances are comparable to the size of the data symbols, however.
These data were taken in the lab system with the azimuth angle ϕ and the polar angle θ. For easier interpretation, we transformed the data into the coordinates of the magnetometer system ϕ
M and θ
M. This transformation, as described in
Appendix A, is necessary due to the ±45° inclined installation of the cells (
Figure 1a). Thereby, also the derivation of the incident angle ξ
M, the angle between pumping light direction
k and magnetic field
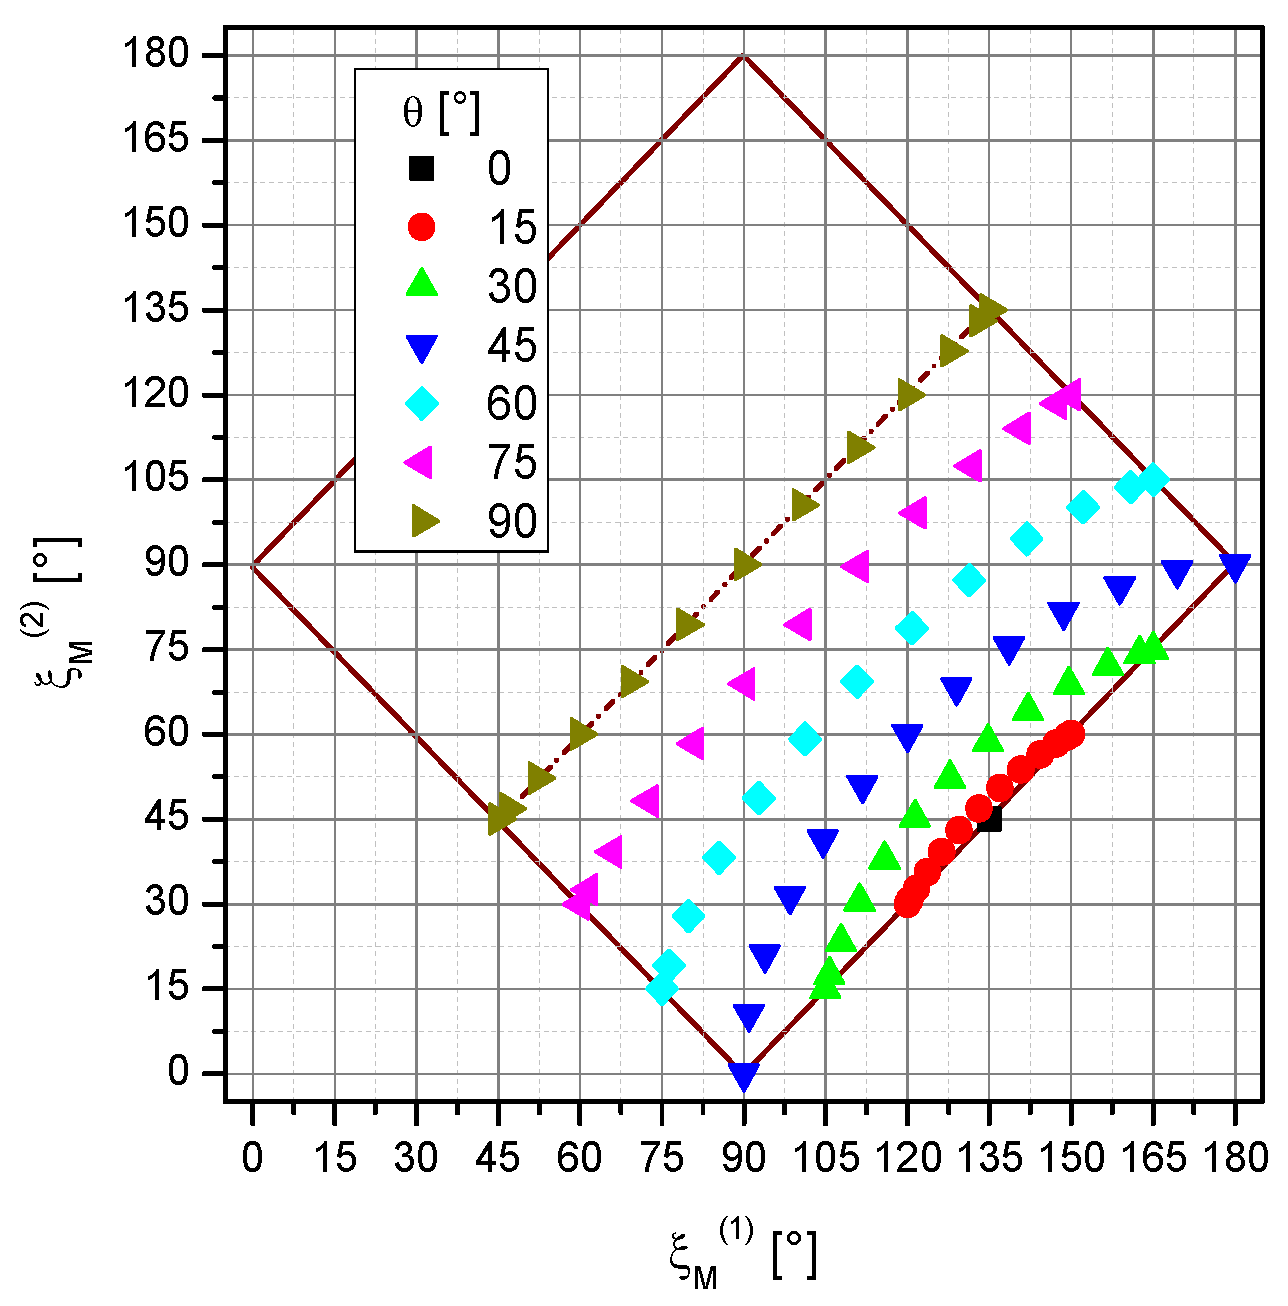
B0, is given. It is a convenient one-dimensional parameter which we will use for the interpretation of the measurement results. The detailed values of the incident angles of the two channels accessible with our measurement configuration in the lab system are shown in
Figure 4.
Figure 3.
Example for a dispersive lock-in signal Y with linear fit (red curve) of the inner range.
Figure 3.
Example for a dispersive lock-in signal Y with linear fit (red curve) of the inner range.
Figure 4.
Incident angles ξM(2) vs. ξM(1) of channels #2 and #1 which were met in the measurement situations. The different colours represent the polar angle θ. The individual data points within these series cover all the measured azimuth values ϕ. Only in the framed range pairs of incident angles exist. The part above the symmetry line, belonging to polar angles between 0° and -90°, was not covered because it is symmetrical to the measured data.
4. Results and Discussion
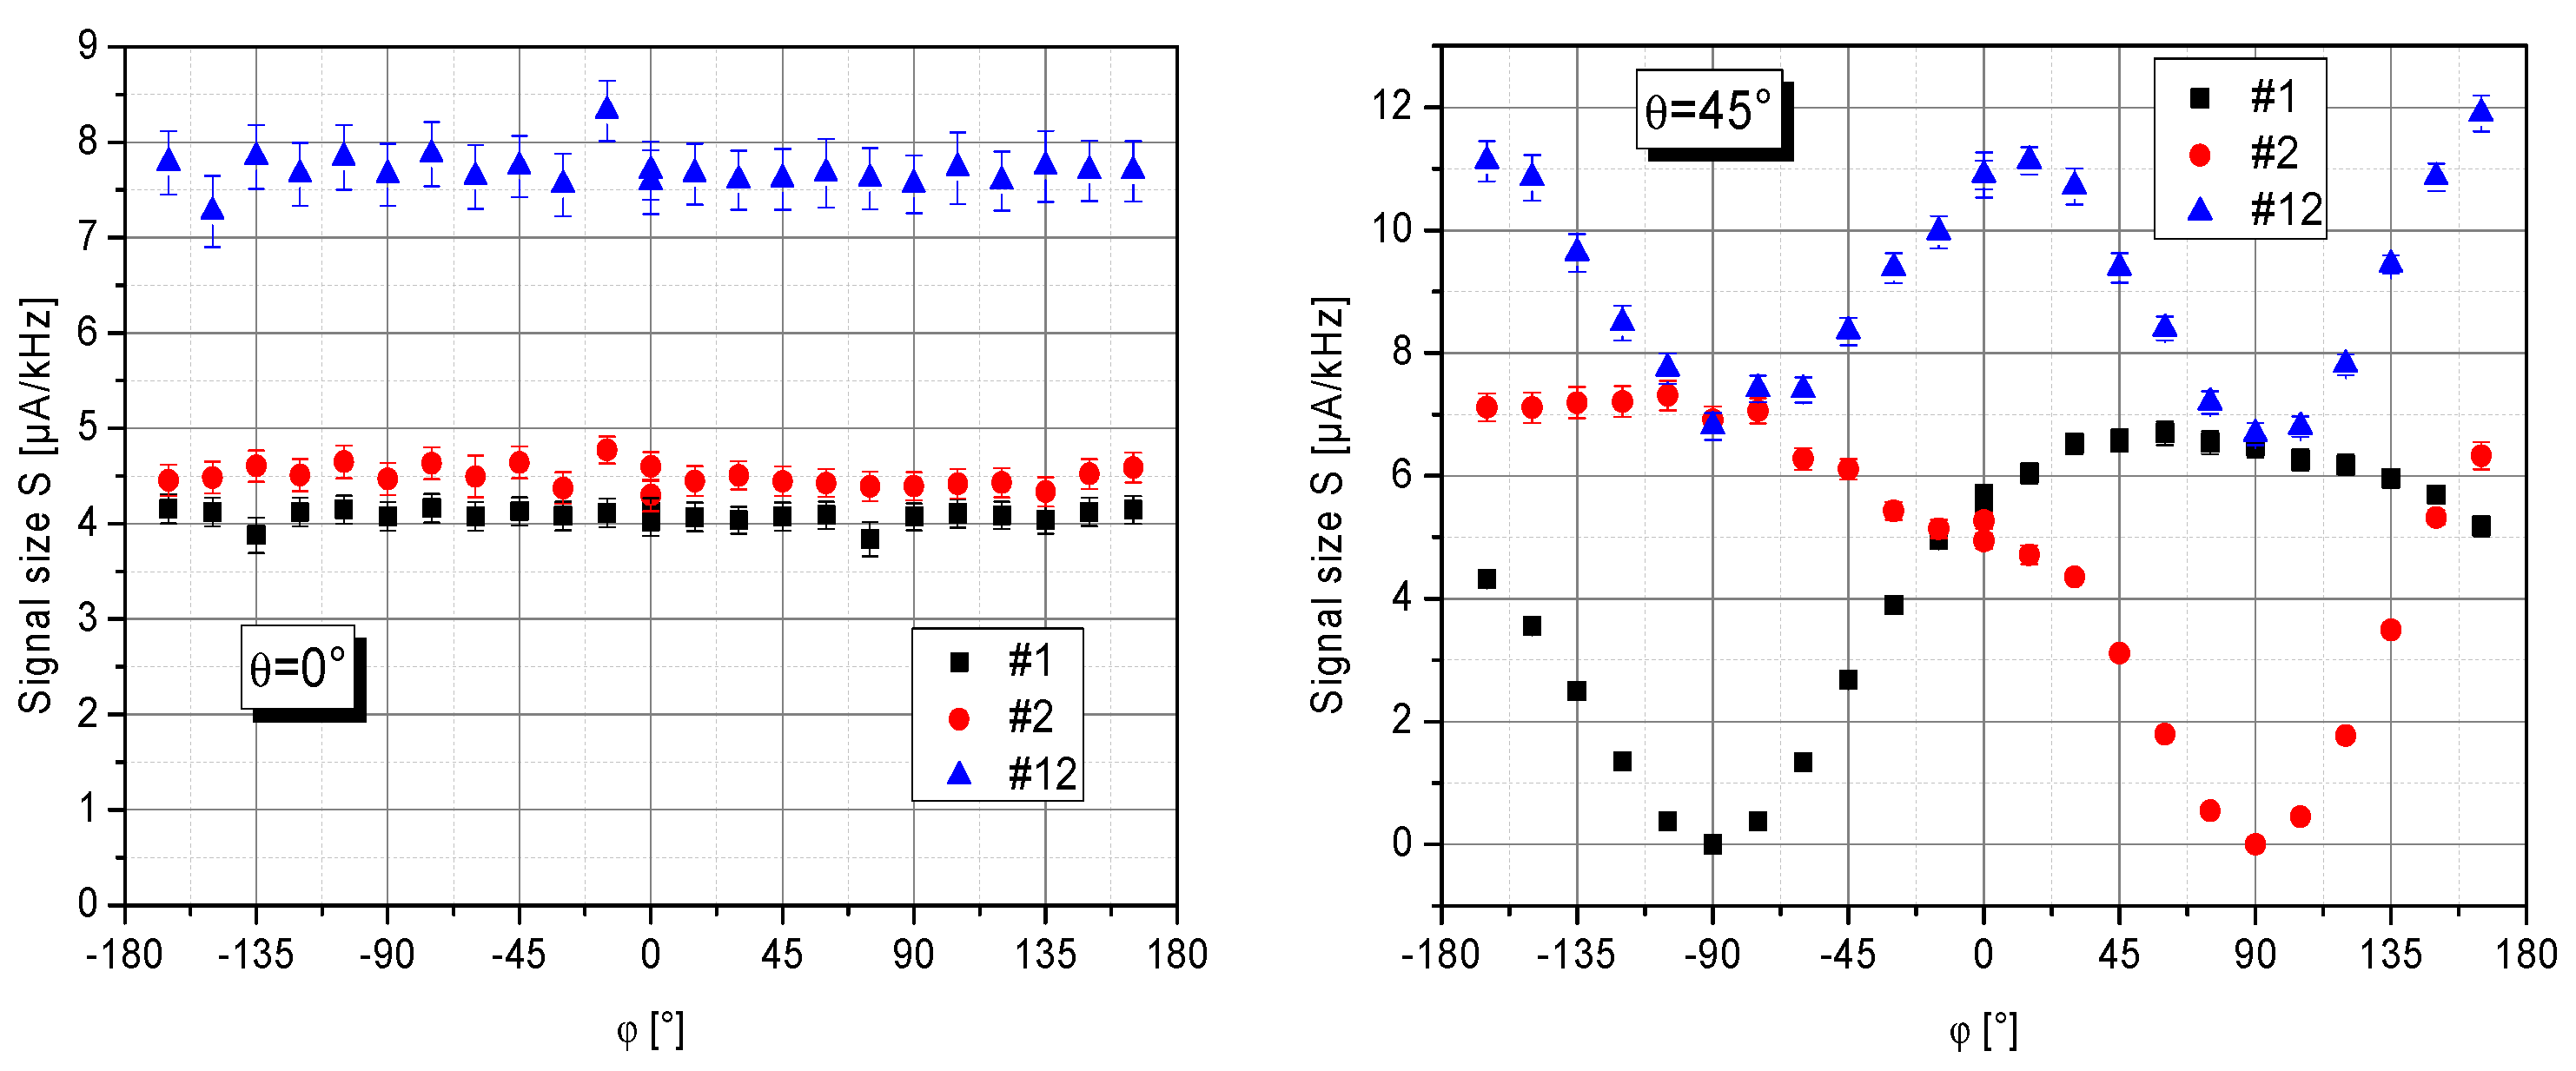
Figure 5 shows data in the lab system recorded for a full rotation of the turntable at θ=0° and θ=45°. As expected from Equation (6), at θ = 0° the signal size
S is largely independent of the azimuth angle ϕ. In contrast, at θ = 45° the channels #1 and #2 cover the full range from 0° to 180° of the incident angle ξ between
k and
B0. Thus
S changes strongly, but in alternating fashion.
Figure 5.
Measured signal size S in dependence on the lab-frame azimuth angle ϕ. Left and right: for a lab-frame polar angle θ of 0° and 45°, respectively.
Figure 5.
Measured signal size S in dependence on the lab-frame azimuth angle ϕ. Left and right: for a lab-frame polar angle θ of 0° and 45°, respectively.
4.1. Signal Size and Magnetic Field Resolution
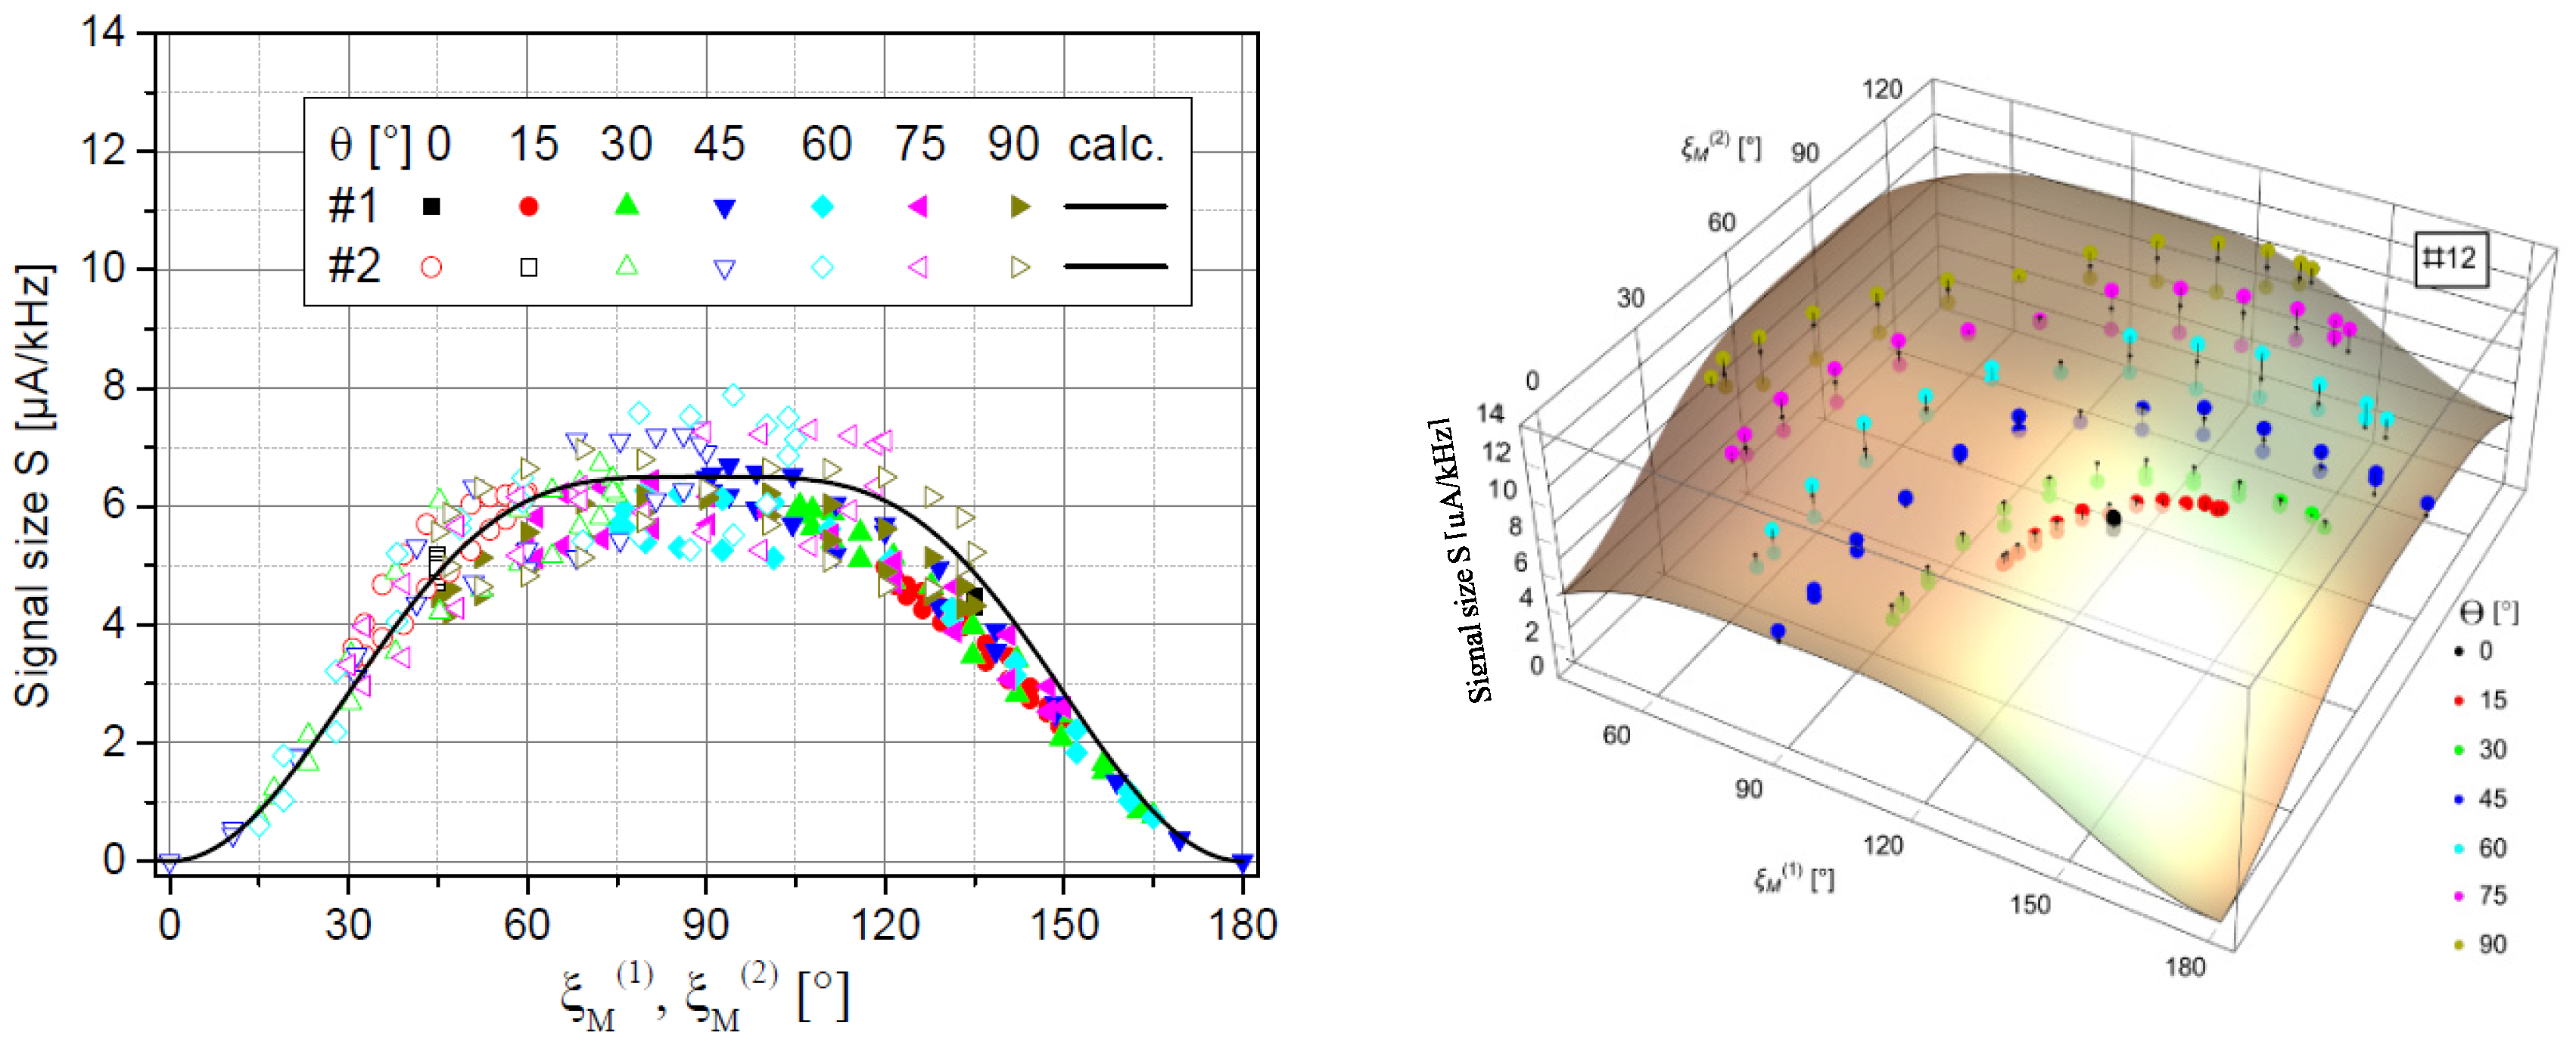
In the magnetometer system, the signal size
S has a dependence on the incident angle ξ
M, given by
which is Equation (5) adapted to the universal coordinate ξ
M. The left side of
Figure 6 shows, that in fact both individual channels follow this expected dependence, whereas in the summing channel #12 the polar dead zones of the individual channels are cancelled as desired (right side of
Figure 6).
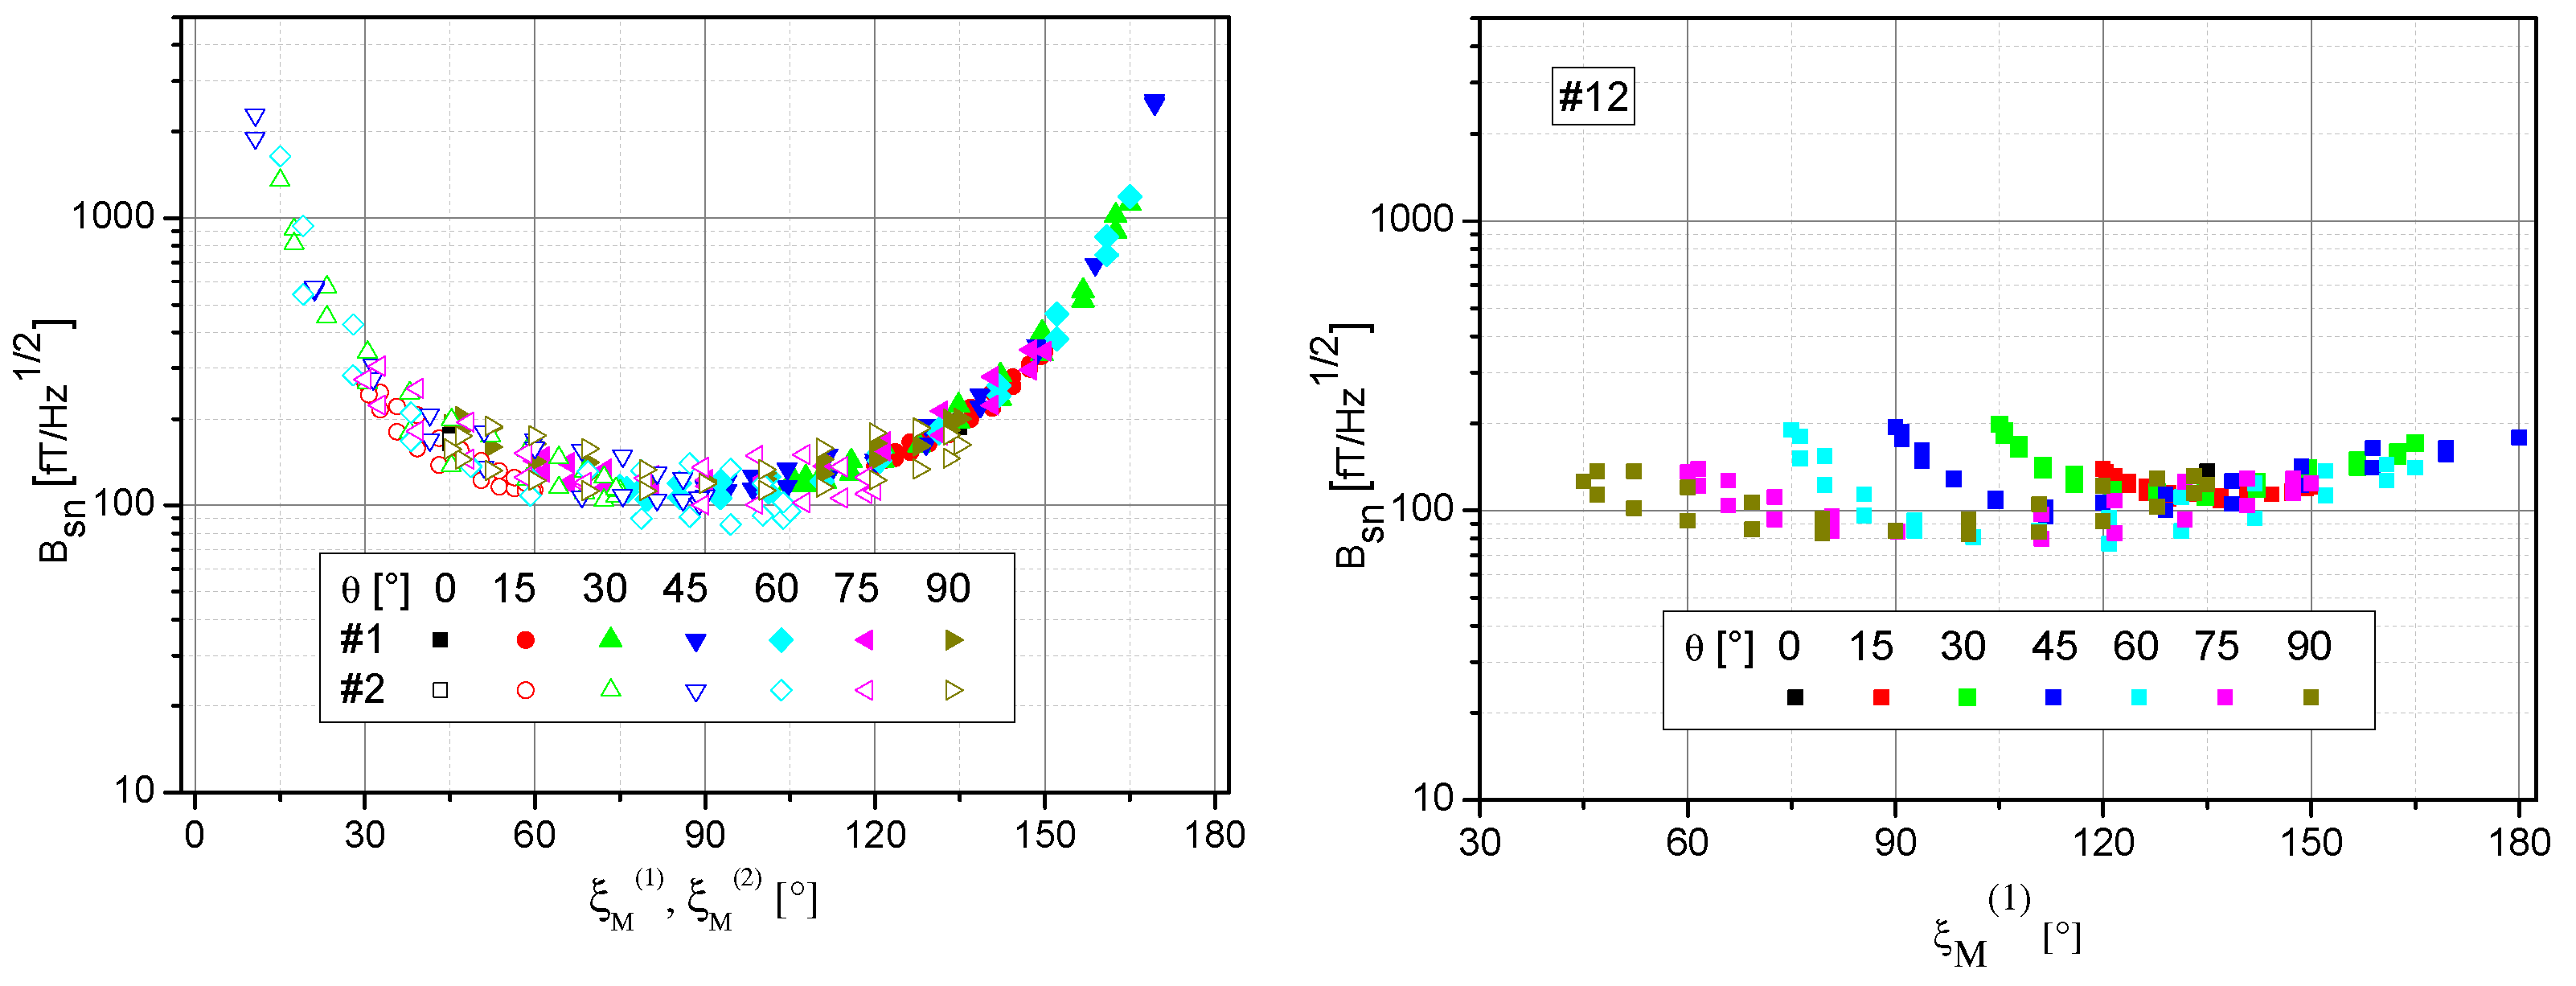
This signal behavior of the single channels #1 and #2 and the sum channel #12 is also reflected in the shot-noise limited magnetic-field resolution
with
being the shot noise of the dc photo current
Idc (what in our case is the mean value of the square-wave modulated pumping light). As
Figure 7 shows, the loss in sensitivity near the dead zones of the single channels is largely cancelled in the summing channel. In worst case, the total sensor sensitivity drops by a factor two. Therefore, the sensor setup with two orthogonally-pumped intensity-modulated OPM cells enables dead-zone free sensor operation.
4.2. Sensor field readings
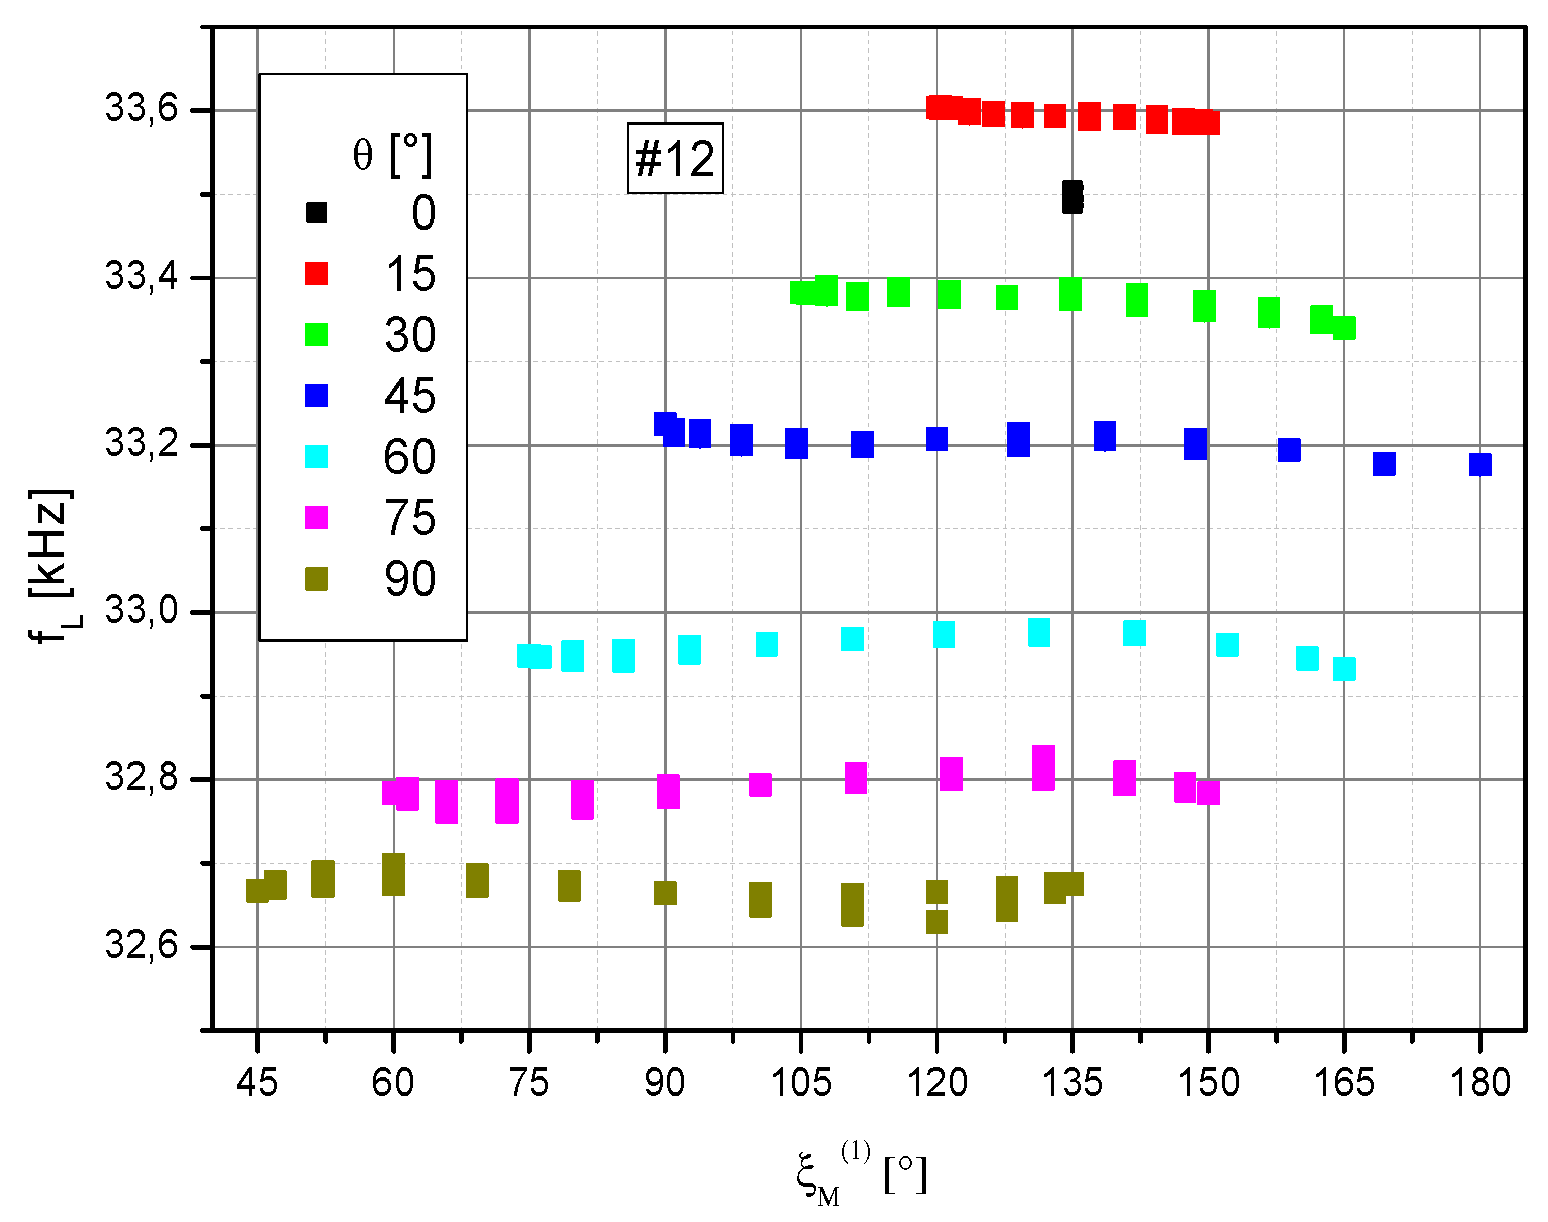
The raw sensor magnetic field readings, given by the measured Larmor frequencies (cf.
Section 3.2) show large offsets between the series with fixed polar angle θ (
Figure 8). These offsets may be either due to residual fields in the shielding, introduced by the change of the
B0 field direction (despite the procedure described in
Section 3.2), or slight differences in the coil calibration constants of the
x and
z magnetic field coil pairs (cf.
Figure 2b). These offsets of the Larmor frequencies between the series have been eliminated afterwards. For this purpose all individual measurement series were shifted in a way, that data around ξ
M(1) = 135°, which are part of all measurement series (cp.
Figure 4), are transferred to the θ = 45° series. This shift was performed with the same value for all data of the three channels #1, #2, and #12 in order not to lose their mutual reference.
These corrected data are shown in
Figure 9. In ideal case, one would expect the same Larmor frequency independent of the measurement situation. However, especially the individual channels 1 and 2 show various systematic deviations. The increasing falsification for incident angles ξ
M < 30° and > 150° is due to the respectively small or zero signal size in these dead zones (cp.
Figure 6).
The inspection of the remaining dependence of the data hints at a systematic shift introduced by vector light shift (LS) effect. The vector light shift can emerge when circularly polarized light is detuned from the involved optical transitions. The effect can be understood as a virtual magnetic field pointing along the photon spin vector of the light which adds vectorially to the external magnetic field
B0. In this way, the LS can lead to shifts depending on sensor orientation. For the two opposite helicities of the circularly polarized light, the magnetic field sensor readings result from
where
LS(ξ) herein follows the dependence
because the light shift is not only proportional to the pumping rate but also to the degree of circular polarization [
25]. The light shift effect vanishes completely at ξ = 90°, where the intensity-modulated OPM also has optimal sensitivity. This is an additional advantage of this operational mode. The addition of the signals of the two orthogonally arranged cells eliminates the pitfall of dead zones and also reduces the systematic shift of Larmor frequency due to LS to some extent, but not completely (
Figure 9 right).
A straightforward and common solution of the LS problem is to use the average of the signals from two cell compartments with identical parameters, interrogated with circularly polarized light of opposite helicity [
3]. With this arrangement also the non-linear Zeeman effect, which becomes remarkable when working in magnetic fields
B0 of geomagnetic strength (viz. around 50 µT in central Europe), can be suppressed. This demands for as good as possible tuned pump power of the two beams with opposite helicity.
5. Conclusions
With an assembly of two vapor cells, pumped by the same intensity-modulated light, but perpendicularly propagating laser beams, a (dead-zone free) omnidirectional OPM can be implemented. This concept especially takes favor of properties of the Bell-Bloom magnetometer: It has a beneficially wide range of sensor orientations offering high sensitivity perpendicular to the pump direction. The signals can be directly added after passing the cells. Thus, only a single-channel signal processing is needed. When light propagation and magnetic field vector are oriented perpendicular, the intensity-modulated OPM shows the best sensitivity while, at the same time, the vector light shift is absent. However, in other directions, the vector light shift as well as the non-linear Zeeman effect cause systematic shifts of the sensor’s magnetic field readings. These detrimental effects could be compensated to a high degree when using two vapor cell compartments in each of the two laser propagation directions, interrogated by two beams with circularly polarized light of opposite helicity. However, a balancing of all the operational parameters to a very high degree is indispensable. The experimental proof of this concept is a future research topic.
Author Contributions
Conceptualization, V.S., T.S., G.O. and R.S.; methodology, V.S., G.O.; software, T.S. and G.O.; validation, T.S., G.O. and R.S.; formal analysis, V.S.; investigation, V.S.; resources, T.W. and F.W.; data curation, T.S. and G.O.; writing—original draft preparation, V.S.; writing—review and editing, T.S., G.O., F.W. and R.S.; visualization, V.S.; supervision, T.S.; project administration, T.S.; funding acquisition, R.S. All authors have read and agreed to the published version of the manuscript.
Funding
This research was partly funded by the German Federal Ministry for Education and Research (BMBF) under grant no. 033R130EN (DESMEX II) and under grant no. 033R385 (DESMEX-Real).
Conflicts of Interest
The authors declare no conflict of interest.
Appendix A
The transformation of the data from the lab system with azimuth angle ϕ and polar angle θ to the magnetometer system ϕM and θM is performed as follows:
The Cartesian coordinates
x,
y,
z in the lab system are connected to the spherical basis by
Due to the ±45° inclined installation of the cells on the rotation axis of the turntable (
Figure 1a) consecutive mathematical rotations of β = 90° about the
x axis and α = -45° about the
y axis are needed. Thus, the coordinates
xM,
yM, and
zM in the magnetometer system calculate from their counterparts in the lab system with the transformation
With the fixed rotation angels given above this results in
Finally, the angles in the magnetometer system are given by
Therein, the function atan2 eliminates the ambiguity of the common atan function.
The incident angle ξ, the angle between pumping light direction
k and magnetic field
B0 can be inferred from the great-circle (or orthodromic) distance, where the arc length of a distance on a great circle is described by the angle between its two end points [
26]. Translated to our configuration, this incident angle is calculated as
Since this expression is ambiguous due to the cos function, we incorporated the additional convention, that ξM is between 0 and 90° when the pumping direction k has a component parallel to B0, and that it is between 90° and 180° for an antiparallel component.
References
- Budker, D.; Romalis, M.V. Optical Magnetometry. Nat. Phys. 2007, 3, 227–234. [Google Scholar] [CrossRef]
- Bloom, A.L. Principles of Operation of the Rubidium Vapor Magnetometer. Appl. Opt. 1962, 1, 61–86. [Google Scholar] [CrossRef]
- Oelsner, G.; Schultze, V.; IJsselsteijn, R.; Wittkämper, F.; Stolz, R. Sources of heading errors in optically pumped magnetometers operated in the Earth’s magnetic field. Phys. Rev. A 2019, 99, 013420. [Google Scholar] [CrossRef]
- Mathur, B.S.; Tang, H.; Happer, W. Light Shifts in the Alkali Atoms. Phys. Rev. 1968, 171, 11–19. [Google Scholar] [CrossRef]
- Prouty, M.D.; Johnson, R.; Hrovic, I.; Vershovsky, A.K. Geophysical application. In Optical Magnetometry; Budker, D., Jackson-Kimball, D.F., Eds.; Cambridge University Press: Cambridge, UK, 2013; pp. 319–336. [Google Scholar]
- Farthing, W.H.; Folz, W.C. Rubidium Vapor Magnetometer for Near Earth Orbiting Spacecraft. Rev. Sci. Instrum. 1967, 38, 1023–1030. [Google Scholar] [CrossRef]
- Yabuzaki, T.; Ogawa, T. Frequency shifts of self-oscillating magnetometer with cesium vapor. J. Appl. Phys. 1974, 45, 1342–1355. [Google Scholar] [CrossRef]
- Bao, G.; Wickenbrock, A.; Rochester, S.; Zhang, W.; Budker, D. Suppression of the Nonlinear Zeeman Effect and Heading Error in Earth-Field-Range Alkali-Vapor Magnetometers. Phys. Rev. Lett. 2018, 120, 33202. [Google Scholar] [CrossRef]
- Ben-Kish, A.; Romalis, M.V. Dead-Zone-Free Atomic Magnetometry with Simultaneous Excitation of Orientation and Alignment Resonances. Phys. Rev. Lett. 2010, 105, 193601. [Google Scholar] [CrossRef]
- Heppner, J.P. The world magnetic survey. Space Sci. Rev. 1963, 2, 315–354. [Google Scholar] [CrossRef]
- Cheron, B.; Gilles, H.; Hamel, J.; Moreau, O.; Noel, E. Improvement of the Spatial Amplitude Isotropy of a 4He Magnetometer Using a Modulated Pumping Beam. J. Phys. III 1997, 7, 1735–1740. [Google Scholar] [CrossRef]
- Guttin, C.; Leger, J.M.; Stoeckel, F. An isotropic earth field scalar magnetometer using optically pumped helium 4. J. Phys. IV 1994, 4, C4–655. [Google Scholar] [CrossRef]
- Wu, T.; Peng, X.; Lin, Z.; Guo, H. A dead-zone free He-4 atomic magnetometer with intensity-modulated linearly polarized light and a liquid crystal polarization rotator. Rev. Sci. Instrum. 2015, 86, 103105. [Google Scholar] [CrossRef] [PubMed]
- Weis, A.; Bison, G.; Grujić, Z.D. Magnetic Resonance Based Atomic Magnetometers. In High Sensitivity Magnetometers. Smart Sensors, Measurement and Instrumentation 19; Grosz, A., Haji-Sheikh, M.J., Mukhopadhyay, S.C., Eds.; Springer-Verlag: Berlin/Heidelberg, Germany, 2017; pp. 361–424. [Google Scholar]
- Scholtes, T.; Schultze, V.; IJsselsteijn, R.; Woetzel, S.; Meyer, H.-G. Light-narrowed optically pumped Mx magnetometer with a miniaturized Cs cell. Phys. Rev. A 2011, 84, 43416. [Google Scholar] [CrossRef]
- Schultze, V.; Schillig, B.; IJsselsteijn, R.; Scholtes, T.; Woetzel, S.; Stolz, R. An Optically Pumped Magnetometer Working in the Light-Shift Dispersed Mz Mode. Sensors 2017, 17, 561. [Google Scholar] [CrossRef] [PubMed]
- Oelsner, G.; IJsselsteijn, R.; Scholtes, T.; Krüger, A.; Schultze, V.; Seyffert, G.; Werner, G.; Jäger, J.; Chwala, A.; Stolz, R. Integrated optically pumped magnetometer for measurements within Earth’s magnetic field. Phys. Rev. Applied 2022, 17, 024034. [Google Scholar] [CrossRef]
- Gilles, H.; Cheron, B.; Hamel, J. Magnetometre a 4He pompe par laser. Isotropie spatiale des signaux de resonance en resonance magnetique et en modulation de lumiere. J. Phys. II 1992, 2, 781–799. [Google Scholar] [CrossRef]
- Bell, W.E.; Bloom, A.L. Optically driven spin precession. Phys. Rev. Lett. 1961, 6, 280–281. [Google Scholar] [CrossRef]
- Schultze, V.; IJsselsteijn, R.; Scholtes, T.; Woetzel, S.; Meyer, H.-G. Characteristics and performance of an intensity modulated optically pumped magnetometer in comparison to the classical Mx magnetometer. Optics Express 2012, 20, 14201. [Google Scholar] [CrossRef] [PubMed]
- Grujic, Z.D.; Weis, A. Atomic magnetic resonance induced by amplitude-, frequency-, or polarization-modulated light. Phys. Rev. A 2013, 88, 012508. [Google Scholar] [CrossRef]
- Oelsner, G.; Schultze, V.; IJsselsteijn, R.; Stolz, R. Performance analysis of an optically pumped magnetometer in Earth’s magnetic field. EPJ Quantum Technol. 2019, 6, 634. [Google Scholar] [CrossRef]
- Woetzel, S.; Schultze, V.; IJsselsteijn, R.; Schulz, T.; Anders, S.; Stolz, R.; Meyer, H.-G. Microfabricated atomic vapor cell arrays for magnetic field measurements. Rev. Sci. Instr. 2011, 82, 033111. [Google Scholar] [CrossRef] [PubMed]
- Schultze, V.; IJsselsteijn, R.; Meyer, H.-G. Noise reduction in optically pumped magnetometer assemblies. Appl. Phys. B 2010, 100, 717–724. [Google Scholar] [CrossRef]
- Savukov, I.M.; Romalis, M.V. Effects of spin-exchange collisions in a high-density alkali-metal vapor in low magnetic fields. Phys. Rev. A 2005, 71, 023405. [Google Scholar] [CrossRef]
- Kells, L.M.; Kern, W.F.; Bland, J.R. Plane and Spherical Trigonometry; McGraw Hill Book Company, Inc., 13 July 1940; pp. 323–326, Retrieved 13 July 2018. [Google Scholar]
|
Disclaimer/Publisher’s Note: The statements, opinions and data contained in all publications are solely those of the individual author(s) and contributor(s) and not of MDPI and/or the editor(s). MDPI and/or the editor(s) disclaim responsibility for any injury to people or property resulting from any ideas, methods, instructions or products referred to in the content. |
© 2023 by the authors. Licensee MDPI, Basel, Switzerland. This article is an open access article distributed under the terms and conditions of the Creative Commons Attribution (CC BY) license (http://creativecommons.org/licenses/by/4.0/).
