
Submitted:
03 July 2023
Posted:
04 July 2023
You are already at the latest version
Abstract
This comprehensive study focused on the standard taxi sign used in Ireland, its impact on drag production, fuel expenses, and CO2 emissions. Experimental analysis revealed that the conventional taxi sign significantly increased drag, especially when mounted on streamlined vehicles such as saloon cars, due to flow separation issues on the rear roof and rear windshield. Longitudinal reorientation of the sign offered a 14-fold reduction in drag increase compared to the traditional placement. It was found that positioning the sign in the middle of the roof offered the greatest fuel efficiency. Furthermore, the study estimated that implementing longitudinal repositioning on all Irish taxi signs could save drivers approximately 832 per year and reduce national CO2 emissions by a substantial 22,464 tonnes annually. Comparative analyses with international taxi signs demonstrated that the Irish sign had significantly larger drag contributions, emphasizing the need for improved aerodynamics. To address the inherent drag issue, the study explored novel appendable devices and proposed alternative taxi sign designs. Among the tested solutions, a magnet-mounted front ramp proved the most effective, reducing total drag by nearly 30%. Additionally, a motorized flip-up taxi sign design demonstrated a remarkable 40% reduction in drag. Finally, a newly proposed taxi sign design, featuring longitudinal positioning and pointed triangular front and rear faces, resulted in a minimal 4.3% increase in vehicle drag compared to the baseline car.
Keywords:
Drag Reduction
; CFD
; Aerodynamics
; Taxi Sign
; Appendable Devices
; Vehicle Add-Ons
1. Introduction
As of May 2023, there were approximately 20,000 taxis operating in Ireland [1]. The standard taxi sign used by all these vehicles is an extremely protrusive, drag-producing shape, that has been in operation for many decades and is mandated by the government to confine to this protrusive size. According to current legislation, the sign should be 1030-1120 mm long and extend 110-120 mm in height, with an added 10-20 mm in height for the mounting magnet used to affix the sign to the taxi’s roof. The sign must be orientated such that its longest dimension is perpendicular to the flow, which causes a huge increase in drag which significantly increases fuel consumption, especially when travelling above 60 km/hr. There is an allowance in the legislation to reorientate the sign parallel with the flow if the journey length for a given passenger exceeds 30 km. In practice, this is rarely done as there is some considerable effort involved in moving the sign between positions. Taxi drivers are generally unaware of the exact financial and environmental benefits that can be realised through the repositioning of the current sign along with the potential for added benefits through the use of novel appendable devices which can be added to the sign to reduce drag and save fuel. This paper endeavours to clearly outline the hugely negative effects the current taxi sign legislation has on both the environment and the taxi driver’s finances, along with quantifying potential drag and fuel consumption savings for drivers if they were to make some novel changes to their current taxi sign.
Irish taxi signs are noticeably different to other signs used throughout the world in countries such as the UK, the US, and Germany. In 2015, the National Transport Authority (NTA) attempted to change this by holding a public consultation with taxi drivers as regards issuing new legislation for a smaller more aerodynamic design [2]. An overwhelming 97.3 % of drivers did not consider the need for a new taxi sign, citing a reluctance to purchase a new taxi sign along with a resistance to reducing the size as it may reduce their visibility. What was not made clear to the drivers was the exact financial savings that the new sign could create. From the government’s perspective, the environmental savings were not as enticing as they would be today, with Ireland now under huge pressure to meet its 2030 climate action targets. With goals to transition our transport network to electric, the potential drag reduction from a new sign would materialise as a considerable range extension for electric vehicles, enabling drivers to travel further between charges. Currently, just 20% of Irish Taxis are hybrid/electric, with the remaining 75 % and 5% being diesel and petrol respectively [3]. Based on recent figures published by the NTA, the average fuel expense per week by drivers was 158.45, working an average of 5 days a week, for 40 hours. It was also found that each driver, on average, would cover 43,866 km a year [3]. This means the taxi industry in Ireland has the potential to gain significant benefits by implementing measures that effectively reduce drag, leading to fuel savings, reductions in CO2 emissions, and increased driving range for electric vehicles.
2. Literature Review
There currently exists no published literature on the issue of Irish taxi sign aerodynamics. There are however some, but not many, articles that address similar topics, such as the aerodynamics of roof racks, roof boxes, and sirens for emergency vehicles. In 2012, Chowdhury et al. [4] examined the effects that several vehicle add-ons had on a vehicle’s energy consumption. Results from a 25% scale wind tunnel test showed a very small taxi sign added 5% to the vehicle’s overall drag. Similarly, an advertising sign was observed to add 24.7% drag when averaged over several yaw angles. The advertising sign was more representative of the Irish sign’s shape. More recently in 2020, [5] investigations into the aerodynamic effects of an emergency response vehicle’s light bar were carried out. The study varied the type of base vehicle along with the relative position of the light bar, front, middle and rear. CFD results outlined that for a sedan vehicle, the front was the position of highest drag, reporting a 37% increase, while the rear was the second highest with 20% [5]. The reason for the front being the highest was due to the light bar having a shape that particularly disrupted flow when placed near the front of the roof. Drag increases for the light bar on an SUV-styled vehicle were seen to be appreciably less [5]. A similar CFD study [6] showed that a 34% drag increase was realisable when adding a generic police siren to a BMW 5-series. The same authors also conducted a study [7] into the effects of light bars being attached to the front and rear of a police van’s roof, reporting a 32% drag increase. In both studies, the authors considerably reduced the drag increases using streamlining techniques for the added structures.
Additionally, studies have been conducted into the drag-increasing effects of roof racks for carrying bicycles [8] in which a 26% drag increase was reported for a roof-mounted rack and only a 5% increase for a bicycle rack positioned at the rear of the vehicle. In 2016 Chen & Meier estimated that in the US, roof racks were responsible for 0.8% of light-duty vehicle fuel consumption in 2015, corresponding to 100 million gallons of gasoline per year [9]. This highlights that drag-increasing add-ons to vehicles have huge fuel consumption implications when considered in the context of an entire transport network, making clear that drag increases for all taxis in Ireland added together amount to significant fuel inefficiencies and CO2 production. Other work has been done into the effects of adding roof boxes to vehicles, in which one study reported a 58.22% drag increase [10]and another a 40% drag increase [11], all being very dependent on the box’s shape and position. Finally, a 2014 SAE article [12] carried out on-road testing on a sedan and SUV to observe the fuel consumption increases for a roof-mounted cargo box. At 70 mph the sedan reported a 25% reduction in fuel efficiency while the SUV only reported a 12% reduction, making clear that the more streamlined a vehicle is, the greater impact the roof add-on will have on its fuel consumption. For reference at 60-70 mph, a 25% change in fuel consumption would manifest as an approximate 50% drag increase [13], bringing this study in line with the other two studies on roof boxes.
3. Computational Setup and Numerical Methodology
3.1. Governing Equations
The CFD results detailed throughout this article were realised using ANSYS Fluent which solves the Reynolds Averaged Navier Stokes (RANS) equations detailed below in Equation 1 and Equation 2 with the help of turbulence models such as the SST model. Widespread CFD simulations are made affordable in the academic and industrial sectors due to the application of the Reynolds Averaged Navier-Stokes equations which offer very reasonable numerical results to the governing equations without the need for more advanced hybrid-LES or LES (Large Eddy Simulations).
To arrive at these two equations, the general Navier Stoke equations (Eq. 3 & 4), which are derived from the principles of mass and momentum conservation, are decomposed into fluctuating and mean components, as per Equation 5. For steady incompressible flow, the transient term goes to zero in Equations 3 & 4.
Fluent also produces force measurements for the simulated geometry once the pressure is calculated at each cell in the vicinity of the geometry. It’s common practice when designing and comparing vehicles to express the forces and moments on a vehicle in terms of dimensionless coefficients. The formulas for the two main force coefficients used throughout this article are detailed in Equations 6 & 7. and are the drag and lift coefficients respectively. Note that each of these aerodynamic forces are proportional to the square of velocity, which is why at very high speeds, the most dominant effects on a vehicle are those caused by the air passing around it. The ’A’ term in the formulas represents the projected frontal area of the vehicle, which should be minimised for low-drag, high-efficiency driving.
3.2. CFD Methodology & Setup
3.2.1. Domain Setup
All ground vehicle geometries were modelled using Solidworks 2021 and were then imported into Ansys SpaceClaim for domain setup and sizing. The rectangular domain consisted of 25 m in front, 75 m behind, 10 m above, and 11.25 m to the side of the vehicle. All vehicle surfaces were modelled as stationary walls while the ground was set to a moving wall, the inlet a velocity inlet, and the outlet a pressure outlet. The wheels of the vehicle were set as moving walls, with the rotating boundary condition applied to model their real-life rotation. The models were split in half to save on size along their symmetry plane. The symmetry plane, along with the two sky surfaces, were given the symmetry boundary condition.
3.2.2. Mesh & Solver Settings
All models were meshed using Ansys Fluent’s in-built meshing tool. The surface mesh consisted of 1 - 5 mm elements on bulk surfaces, with smaller elements used on finer features. The inflation layer consisted of 8 layers with a first cell height of 0.1 mm to ensure a y+ less than 5 over each model’s surface. In general, the y+ was closer to 1 than 5 over the bulk of the model. A poly-hexcore volume mesh was grown throughout the fluid domain with elements closest to the model being sized at 18 mm. Two coarser refinement regions of 30 mm and 42 mm existed outside this finer region. The wake regions had 45 mm elements. The remainder of the domain was restricted to a max element of size 204.8 mm. Once meshed, the models were transferred to the Fluent 21R2 solver. The SST turbulence model was used to model turbulence throughout the domain. The steady-state, pressure-based, coupled, pseudo-transient solver, was used with a density of 1.2215 and a = 1.8013 x Pas. The velocity inlet was set to 27.78 m/s (100 km/hr), while the pressure outlet was set to 0 Pa gauge. The moving ground was set to 27.78 m/s in the flow direction while the wheels rotated around their centres according to . All solver schemes were second order. Simulations were run for 1250 iterations, with the aerodynamic coefficients being averaged over the last 500 iterations. Once setup, case files were exported to UCD SONIC, for simulation on their 48-core HPC clusters. Simulations ran for around 24 hours each, with case and data files then being reimported locally for post-processing. In total, this study consumed 60,000 CPU hours. Meshes generally consisted of between 35- 45 million cells, resulting in high-fidelity, symmetric, RANS car simulations.
3.2.3. Taxi Sign Geometry
Under current Irish legislation, taxi signs must be 1030-1120 mm long and extend 110-120 mm in height. Therefore a standard taxi sign was drawn and fitted to all taxis discussed in the results section. The standard sign tested was 1075 mm in length and 120 mm in height with an additional 10-12 mm for the magnet mount between the sign and the vehicle’s roof. The sign had a trapezoidal profile with a base width of 120 mm and a top width of 50 mm.
3.3. Reynolds Number Sensitivity Study
All CFD studies were carried out at 100 km/hr, however, to ensure a invariance with airspeed, a Reynolds number sensitivity study was conducted at speeds relevant to taxi driving on national roads. As can be seen from the results of Table 1, the variation for the Prius Taxi from 60-120 km/hr was below 1%, meaning the CFD simulations produce the required result, as at speeds above 40 km/hr, should remain constant, due to the largely turbulent, inertial flow dominating with low-speed viscous effects being reduced.
3.4. Mesh Verification Study
To ensure that the CFD results were mesh independent, a mesh sensitivity study was conducted in which three finer meshes were created for the Prius Taxi. Based on the results of Table 2, it can be concluded that the results are sufficiently independent of the mesh as the variation is kept to within 1%. The mesh refinement was increased by reducing the surface mesh element size below 5 mm on bulk surfaces, and by increasing the number of layers used in the inflation layer from 8 up to 16. Additional refinement was also made to the volume mesh in the vicinity of the taxi sign and closest to the overall vehicle.
3.5. Validation Study
The best form of validation available comes from a roof sign fuel economy test funded by the Irish government in 2006 [2]. Two cars were tested in a full-size wind tunnel facility to assess the effects of the Irish taxi roof sign on overall vehicle aerodynamics. The two cars were the popular taxi model Toyota Avensis saloon 2006 specification and the hybrid Toyota Prius 2006 specification. Both were tested at 32km/hr and 97 km/hr wind speeds to assess the effects at town and country road speeds. The Prius without the sign reported a 7.9 kW power estimate at (97 km/hr), while the Prius with the taxi sign placed in the middle of the roof reported an 11.7 kW power estimate. This 48.1 % increase in power consumption highlights the dramatic effect the sign had on the vehicle’s aerodynamics. When the sign was reorientated longitudinally to the flow, the estimated power only increased by 2.5%.
A drawback of the study was its decision to present the test measurements in kilowatts instead of Newtons. This may be because, in the power calculation, the testers included estimates for rolling resistance at 97 km/hr. This would then mean that the force increase for drag would be higher than 48.1 %. If this was the case and we estimate that at 97 km/hr, the ratio for drag to rolling resistance was 4:1, then the actual percentage increase in drag force due to the sign would be a factor of 1.25 higher than the percentage change in power, resulting in a 60.13 % drag increase. A virtual wind tunnel test using Ansys Fluent on a 2010 Toyota Prius found that the drag increase due to the taxi sign was 71.35%, while the drag increase due to a sign placed parallel in the flow was just 5.06 %. This shows that there is reasonable agreement between CFD results and the wind tunnel test conducted in 2006. As the methods used for the Prius CFD study were the same as those for all CFD simulations, it can be concluded that all results have an element of validation with full-scale wind tunnel testing.
4. Results & Discussion
4.1. Van and Prius Taxis
To begin to understand the effects the Irish taxi sign has on vehicle aerodynamics, two contrasting vehicle types were studied, namely the Van Taxi (based on a Peugeot van), and the Toyota Prius Taxi. The Prius was chosen due to its prevalence in Ireland and around the world. The van exhibited a relatively small 17.52% increase in drag when equipped with the taxi sign. The reason for the small increase in drag was due to the initially bluff shape of the van and its lack of streamlining. Of the 41 counts of increase reported for the van, all 41 counts are directly generated by the taxi sign. Hence all other features on the van reported approximately the same drag forces as the standard non-taxi van. Figure 1 shows clearly the large stagnation zone created by the taxi sign.
The same cannot be said for the Prius Taxi in which an astonishing 71.35 % drag increase was observed for the vehicle when fitted with the taxi sign. This highlights that vehicles that are inherently more streamlined will suffer much greater drag increases and fuel efficiency decreases when fitted with taxi signs. The most interesting fact about the 149 count increase is that around 50 % of the additional drag is due to the interference effects between the sign and the rear/rear-roof of the vehicle. The taxi sign’s wide protrusive shape causes a tremendous amount of flow separation which does not reattach to the rear roof of the vehicle. This results in a huge negative pressure region behind the taxi sign and on top of the vehicle’s rear roof, resulting in huge drag increases. Figure 2 & Figure 4 highlight this under-pressured region clearly. The sign is directly responsible for 58 counts (40%) of the drag increase on the vehicle. This is 17 counts higher than that for the van even though the same taxi sign was used. This is due the to sign being placed in a much more direct position subjected to faster-moving flow coming from the windshield of the Prius. To avoid this high level of frontal stagnation on the sign it would be a good idea to design an appendable see-through device capable of gradually ramping up the flow and reducing the frontal stagnation pressure. The appendable device would also aim to reduce the size of the subsequent wake region behind the Irish taxi sign.
The apparent solution based on the results of Table 3 & Table 4 is to reorientate the taxi sign longitudinally, such that the sign’s longest dimension is parallel with the flow. This not only reduces , but also noticeably reduces the vehicle’s frontal area, resulting in huge drag savings. For the van, the net drag increase for a longitudinally fitted sign was just 0.68 %, which is approximately negligible in terms of fuel consumption. For the Prius, the drag increase due to the sign was reduced 14-fold down to just 5.06%. Clearly the more streamlined the vehicle is initially, the more important it is that any taxi sign fitted to it is placed longitudinally on its roof and not perpendicular to the flow. Most taxi signs used in Ireland are magnet mounted, so reorientating the sign is relatively straightforward and could be achieved nationwide overnight following a government mandate enforced through the National Transport Authority.
4.1.1. Nationwide Fuel Savings Calculation for Longitudinally Fitted Taxi Signs
As of May 2023, there were approximately 20,000 registered taxis in Ireland [1]. Survey data gathered in Sept-Oct of 2022 [3] found that drivers travelled an average of 44,000 km a year and spent an average of 160 a week on fuel. The same survey found that the Irish taxi fleet was comprised of approximately 80% internal combustion engine (ICE) (75% diesel, 5% petrol) and 20% alternatively fuelled (10% HEV, 10% BEV) vehicles. The majority of these vehicles are 5-door saloon cars similar to the Toyota Prius, therefore longitudinally reorientating all Irish taxi signs could bring about huge fuel savings on a national level. Taking a current Prius Taxi and reorientating its sign would realise a 38.7% drag reduction, which would then materialise as an approximate 20% fuel saving when travelling at national road speeds or as a 10% fuel saving when operating at the lower city or outer city speeds (60 km/hr). As a conservative estimate, if we approximate the national fuel savings as 10% for reorientating the sign, then each taxi driver in Ireland could expect to save 16 a week on fuel expenses. Taking the average cost of a litre of diesel/petrol as 1.60, then each driver will save 10 litres of fuel each week if they operate an ICE vehicle. As 80% of the 20,000-strong fleet is ICE, this would approximate to an average of 160,000 litres of fuel saved each week. In the survey, drivers worked an average of 40 hours a week, 5 days a week, meaning each day 32,000 litres of fuel in Ireland could be saved, which based on 2.7 kgCO2/L for diesel fuel, would see 87,000 kg less of CO2 each day being pumped into the atmosphere. All the estimates above are based on conservative figures, and drivers travelling at national road speeds can expect to save a lot more than has been outlined. The estimates above also do not account for the other 20% of the fleet that uses hybrid and battery power, which will benefit from significant fuel savings along with appreciable range extensions due to reduced drag forces.

Table 5.
Summary of the calculated savings for longitudinally fitted taxi signs on a yearly basis.
| Financial Savings for Drivers | National Fuel Savings | National CO2 Reductions |
|---|---|---|
| 832/year | 8,320,000 L/year | 22,464 tonnes CO2/year |
4.2. Various Vehicle Taxis
To further quantify the effects the current Irish taxi sign has on the entire taxi network, three additional vehicle types were studied. To best cover the range of vehicle types in use in Ireland, a large crossover, a small hatchback, and a small notchback were drawn and fitted with the taxi sign. The large Crossover Taxi was based on a Tesla Model X, the small hatchback was a Golf MK7, and the small sedan was based on a Skoda Rapid (See Figure 5). As before each vehicle had smooth wheels and a smooth underside. The results for the simulations are outlined in Table 6. The vehicle seen to have the smallest drag increase was the large crossover, and this was to be expected as it was previously shown that the more bluff the body is initially the less affected it is by the taxi sign. Nevertheless, the crossover still reported a 38.88% drag increase, highlighting still the drag-increasing nature of the sign. A 56.21 % drag increase was seen for the hatchback which was notably less than that seen before for the Prius. This is due to the hatchback’s shape having a straight back roof that does not enable the under-pressured wake behind the sign to pull the vehicle back as much as was seen for the Prius. The Notchback Taxi however had the opposite effect, in that its rear roof had a largely exposed rear area, that allowed the under-pressured detached flow to drastically pull the vehicle back and create massive drag forces on both the rear and rear roof. As a result, a shocking 92.25% drag increase was observed. The take home from this is that a notchback vehicle’s fuel efficiency suffers immensely when fitted with a large taxi sign such as the one used in Ireland. This result is also significant to countries in which notchback emergency response vehicles are fitted with protrusive lightbars.
4.3. Sign Positioning Studies
It has already been shown that huge drag savings can be realised by reorientating the taxi sign longitudinally. As current legislation does not assert where a taxi sign should be placed on the vehicle’s roof, this study investigates what are the potential drag changes observed when the sign is moved to the foremost or rearmost positions on the roof of the vehicle. Figure 6 shows the relative positioning of the signs on the vehicles, while Table 7 outlines the results of the study. In all scenarios where the sign was moved either to the front or the rear of the roof, the overall frontal area for the vehicle was reduced. This is advantageous in terms of overall drag reduction however the area reductions were small in comparison to the changes observed for the position changes. The van reported an 8.2 % drag increase when the sign was moved to the foremost point, this was due to the sign being placed in a region of very fast-moving flow just after the end of the windshield, which resulted in a higher stagnation pressure on the sign’s front and hence a higher drag force. The same effect is seen for the Prius when the sign is moved to the front position but some of the added drag on the sign is offset by reduced drag on the rear of the Prius as some flow is able to wrap around the sign and slightly increase the base pressure after the sign due to its forward position.
When the sign is moved to the rear of the vehicle, large amounts of downforce are subsequently produced as the sign begins to act like a rear spoiler. For reference, the downforce on the van increased by 113 % when the sign was positioned at the rear. As a result, the van suffered a 22.12% drag increase due to an increased stagnation pressure along the sign coupled with an added component of lift-induced drag. There was also a negative interference effect between the sign and the rear wake of the vehicle. This effect was much more pronounced on the van in comparison to the Prius or the Golf as the rear-projected area for the van was significantly larger. In general, the taxi sign should not be placed at the rear of the vehicle as it has a drag-increasing effect due to the wake of the sign and the wake of the vehicle interfering to produce additional interference drag. In conclusion, the best position for the Irish taxi sign is in the centre of the vehicle’s roof. Drivers of large taxis such as vans or crossovers should especially avoid moving their sign to the front or rear of their vehicle.
4.4. Sign Connection Study
As there are a variety of taxi sign manufacturers in Ireland, not all signs have the same magnet connection between the sign and the taxi. Some manufacturers provide large magnets that result in a 10-20 mm gap between the sign and roof, while others provide a more flush connection using a slim strip magnet. To investigate if there are any significant aerodynamic benefits between the two connection styles, two simulations were performed on the Prius Taxi in which the standard sign with a 20 mm gap was fitted along with another sign sized exactly the same but with a flush-filled underside. Figure 7 below highlights the two signs tested. As per the results of Table 8 it is clear that there is no drag change between the two connection styles. This is primarily due to the relatively low flow rate in the gap along the length of the sign, which in effect, operates similarly to a fully filled gap. Figure 8 shows how the pressure distribution along the front and rear of both signs is very similar along the symmetry plane. Away from the symmetry plane, towards the ends of the signs, the flow regime begins to become even more similar, hence why both signs report the approximately same drag force.
4.5. International Taxi Signs
Results so far have detailed the inherent drag-producing shape of the standard Irish taxi sign, this section outlines how the Irish sign compares to other standard signs used throughout the world. The first alternative sign tested was a somewhat illegal variant of the standard Irish taxi sign, a small low profile triangular sign of length 940 mm. Some drivers purchase this sign as it fits between the roof racks of some vehicles however under the current legislation (1030-1120 mm) the sign is too small and a driver could technically be fined if caught using it. The results of Table 9 & Table 10 highlight that the smaller triangular Irish sign does reduce drag from 17.52% to 13.02% for the Van Taxi, and from 71.35% to 62.08% for the Prius Taxi. While the drag reduction is appreciable, the overall drag is far too high in comparison to other taxi signs used globally. A very common taxi sign named "US Portugal" which is shown as the third sign from the left in Figure 9, is commonly used throughout the US and other countries such as Portugal and the UK. What is interesting about this sign is that it produces quite a lot of drag on the Prius, which is again due to the negative effects of placing protruding objects perpendicular to the flow on streamlined bodies. Some of the best-performing signs include the UK Taxi sign (which is based on the sign fitted to the UK black cabs) and the German taxi sign.
A sign that many would think should rank very highly in terms of drag production is the US-styled advert sign, due to its tall shape and flat triangular front. As shown in the Tables, the sign only adds 2.61 % of drag to the Van and 16.11% to the Prius. The reason behind these low values even though the sign has a very protrusive nature, is due to its longitudinal orientation and triangular shape. Having a triangular face enables the flow that impacts the front of the sign to easily roll off, and make its way around the sign, which then produces large vortices that travel along the roof of the taxi. These vortices considerably aid flow attachment along the rear of the Prius and help prevent the drastic flow separation that was observed for the Irish taxi sign. Figure 10 uses total pressure plots to show the level of flow attachment on the rear, along with highlighting the vortex cores for the vortices shedding off the sign.
The main conclusion from this study is that the Van Taxi does not exhibit any drastic drag increases when fitted with any of the international taxi signs, whereas the more streamlined Prius Taxi does exhibit some considerable drag increases depending on which sign is fitted. If it were possible to mandate a standard international sign for all countries, the best option would be either the German sign or the small black cab UK sign however, these signs are noticeably small, and if drivers would prefer a larger sign to convey more detail to customers, then an adjusted version of the US advert sign would be applicable, offering high visibility, with acceptable drag increases.
4.6. Novel Appendable Devices for The Irish Taxi Sign
If it were the case that the current Irish taxi could not be replaced or reorientated due to a firm pushback from taxi drivers and consumers in Ireland, then the best option to reduce drag would be to add drag-reducing appendable devices in front of or behind the current taxi sign. Figure 11 outlines six of these devices fitted to the Prius Taxi while Table 11 details the potential drag reductions for the respective devices. The order given in the table is such to match the devices shown in the Figure from left to right. All appendable devices shown would be manufactured from a transparent material to ensure the taxi sign remains fully visible from the front and back. The most successful appendable device was the front ramp, which offered nearly 30% drag reduction from the baseline sign. The ramp works by drastically reducing the stagnation pressure on the front of the sign (Figure 12) while also enabling the flow to easily pass over the sign with minimal separation. Another useful property of the ramp was that it enabled the creation of vortices at its edges which were then carried along the rear roof travelling inward, which significantly increased the flow attachment and base pressure on the taxi in comparison to the baseline Prius Taxi.
The front ramp similarly offers an appreciable 10 % drag reduction for the Van Taxi as shown in Table 12. The device that offered the most drag reduction but was not technically an appendable device was the flip-up taxi sign, which reduced drag from the baseline by nearly 40%. The flip-up sign has a straightforward operation, in which, the taxi driver after securing a fair, remotely lifts up the front and rear taxi sign faces as shown in Figure 11 using a motorised hinge operated from inside the taxi. Once free and available for another fair, the sign’s faces return to normal. Another option would be to design it such that the faces automatically lifted once speeds exceeded 60 km/hr, this way the driver does not need to operate the sign and major fuel savings are realised when travelling at high speeds.
The front ramp with rear hollow does not offer any extra drag reduction and instead slightly reduces the drag reduction of the front ramp. Similarly, the rear ramp on its own increases drag by 1.28%, this means that fitting appendable devices behind the taxi sign is not an effective way to realise drag reduction. This is because in the wake of the sign, the flow is completely separated, and placing geometry in this under-pressured zone just adds drag as the new devices are pulled back by the low pressure, generating drag. As is clear from the results table, adding vortex generators in front of the sign does not produce any practical drag reduction. The vortices produced crash into the sign’s face, along with the vortices produced not being that large, as they are curtailed by the high-pressure zone present on the front of the taxi sign. The final device for discussion is the front corner ramps, which offer some drag reduction but not enough to justify their use. The corner ramps were shaped similarly to the full ramp, however, they did not produce the same useful vortex structures and interacted poorly with the middle stagnation zone on the front of the taxi sign. The corner ramps should be redesigned to see if they could offer more drag reduction in line with that of the full front ramp.
4.7. Proposed Design for The New Irish Taxi Sign
To conclude the results section, a brand new aerodynamic design for a future Irish taxi sign is proposed, outlined in Figure 13. The new sign utilises a lengthwise orientation along with a triangular front face which helps to reduce drag and mitigate against frontal flow stagnation along with rear roof separation. The sign also incorporates two front-face sections available for the display of information to oncoming pedestrians. The sign adds just 4.34% additional drag to the overall vehicle which then materialises as an approximate 2% added fuel consumption for journeys on national roads. This design gives a good benchmark for what an aerodynamic taxi sign should look like, inclusive of several panelled sections for the display of information to the public.
Table 13.
Calculated drag and estimated fuel increase at 100 km/hr for the proposed new taxi sign.
| Simulation Name | % Change | Area () | % Change | Drag Change | Fuel Increase | |
|---|---|---|---|---|---|---|
| Prius | 0.241 | - | 2.237518 | - | - | - |
| Prius - New Taxi Sign | 0.248 | 2.90 % | 2.268942 | 1.40 % | 4.34 % | 2.17 % |
5. Conclusions
To conclude, the standard taxi sign currently in use throughout Ireland is an inherent drag producer and is responsible for large amounts of unnecessary CO2 production and fuel expenses. Results showed that fitting the sign to a Toyota Prius increased total drag by over 71%. Fitting the sign to less streamlined vehicles such as vans and crossovers does not result in as large a drag increase in comparison to streamlined saloon cars. Reorientating the sign longitudinally was shown to be the easiest and quickest solution to the problem, offering a 14-fold reduction to the drag increase associated with fitting the sign to a Prius. It was estimated that reorientating all Irish taxi signs longitudinally could save drivers 832 a year and reduce national CO2 emissions by 22,464 tonnes a year. Notchback saloon cars were found to have the greatest drag increase when fitted with the taxi sign as a result of excessive flow separation on the rear roof and rear windshield. The optimal location for placing the sign was determined to be the middle of the taxi’s roof, as positioning it to the front or rear of the roof increased drag. The rearmost position was seen to be the worst position to fit the sign in terms of fuel consumption, meaning legislation should be brought in to ensure no driver fits their sign there. Visually and aerodynamically the Irish taxi sign differs greatly from taxi signs used throughout the world, hence it was found that the Irish sign had significantly larger drag contributions than all other simulated international signs. Among the signs in use globally, the standard German sign and the UK black cab sign are some of the most aerodynamic.
Simulations were performed on several novel appendable devices that looked to reduce the inherent drag on the Irish taxi sign. The most effective was a magnet-mounted front ramp, that reduced the total drag by nearly 30%. A novel design for a flip-up taxi sign was proposed that used motorised hinges to move the sign’s faces when operating at high speeds, which reduced drag by 40%, nearly totally eliminating the drag increase associated with fitting the taxi sign. To finish, a brand new design for a future Irish taxi sign was proposed that utilised longitudinal positioning along with pointed triangular front and rear faces. The newly proposed taxi sign increased vehicle drag by just 4.3% on the baseline car. The Irish government faces mounting pressure to achieve its 2030 climate action targets, and this paper outlines several ways in which significant CO2 reductions can be realised through a revised design of current taxi signs in Ireland.
Author Contributions
Conceptualization, MGC; methodology, MGC; software, MOR and MGC; validation, MGC; formal analysis, MGC; investigation, MGC; resources, MOR and AI; data curation, MGC; writing—original draft preparation, MGC; writing—review and editing, MGC; visualization, MGC; supervision, MOR and AI; project administration, MOR and AI; funding acquisition, MGC, MOR, and AI. All authors have read and agreed to the published version of the manuscript.
Funding
This research was funded by The Irish Research Council grant number EPSPG/2022/213 and Science Foundation Ireland grant number 22/NCF/EI/11277. The APC was funded by Science Foundation Ireland grant number 22/NCF/EI/11277.
Data Availability Statement
The data presented in this study is available on request from the corresponding author. The data is not publicly available due to the hosting costs for large data sets.
Acknowledgments
The support of UCD SONIC & ICHEC Kay for the use of their HPC resources.
Conflicts of Interest
The authors declare no conflict of interest. The funders had no role in the design of the study; in the collection, analysis, or interpretation of data; or in the writing of the manuscript.
Abbreviations
The following abbreviations are used in this manuscript:
| NTA | National Transport Authority |
| CFD | Computational Fluid Dynamics |
| RANS | Reynolds Averaged Navier Stokes |
| LES | Large Eddy Simulation |
| SST | Shear Stress Transport |
| HPC | High Performance Computing |
| ICE | Internal Combustion Engine |
| HEV | Hybrid Electric Vehicle |
| BEV | Battery Electric Vehicle |
References
- Authority, N.T. Vehicle Licences County* and Category – 31 May 2023, 2023.
- Authority, N.T. Public Consultation on Taxi Roof Signs 2015, 2015.
- Authority, N.T. Taxi Driver Survey Presentation Sept/Oct 2022, 2022.
- Chowdhury, H.; Alam, F.; Khan, I.; Djamovski, V.; Watkins, S. Impact of Vehicle add-ons on Energy Consumption and Greenhouse Gas Emissions. Procedia Engineering 2012, 49, 294–302. [Google Scholar] [CrossRef]
- Iozsa, D.; Ilea, L.; Fratila, G. Influence of warning lights for intervention vehicles on aerodynamic performance. IOP Conf. Ser.: Mater. Sci. Eng. 2020, 997, 012118. [Google Scholar] [CrossRef]
- Taherkhani, A.R.; Gilkeson PhD, C.; Gaskell PhD, P.; Hewson PhD, R.; Toropov PhD, V.; Rezaienia PhD, A.; Thompson, H. Aerodynamic CFD Based Optimization of Police Car Using Bezier Curves. SAE Int. J. Mater. Manf. 2017, 10, 85–93. [Google Scholar] [CrossRef]
- Ar, T.; Gn, d.; Ph, G.; Ca, G.; Rw, H.; A, K.; Hm, T.; Vv, T. Aerodynamic Drag Reduction of Emergency Response Vehicles. Adv Automob Eng 2015, 4. [Google Scholar] [CrossRef]
- Goodrich, S.; Perez-Raya, I. Simulating Aerodynamic Effects of Location and Orientation of Bicycles Mounted on Sedans. Volume 8: Fluids Engineering; Heat Transfer and Thermal Engineering; American Society of Mechanical Engineers: Columbus, Ohio, USA, 2022; p. V008T10A003. [Google Scholar] [CrossRef]
- Chen, Y.; Meier, A. Fuel consumption impacts of auto roof racks. Energy Policy 2016, 92, 325–333. [Google Scholar] [CrossRef]
- Gonzàlez Casal, I. Aerodynamic analysis and improvement of a roof box car. Master thesis (pre-Bologna period) 2013. Accepted: 2015-02-18T19:37:09Z Publisher: Universitat Politècnica de Catalunya.
- Sandberg, M. Aerodynamic study of vehicle mounted cargo boxes: A comparative study between roof boxes and tow bar mounted cargo boxes using CFD 2022.
- Thomas, J.; Huff, S.; West, B. Fuel Economy and Emissions Effects of Low Tire Pressure, Open Windows, Roof Top and Hitch-Mounted Cargo, and Trailer. SAE Int. J. Passeng. Cars - Mech. Syst. 2014, 7, 862–872. [Google Scholar] [CrossRef]
- Chow, K. Improving vehicle rolling resistance and aerodynamics. In Alternative Fuels and Advanced Vehicle Technologies for Improved Environmental Performance; Elsevier, 2022; pp. 459–481. [Google Scholar] [CrossRef]
Figure 1.
Pressure coefficient plotted over the front surfaces of the Van & Van Taxi.
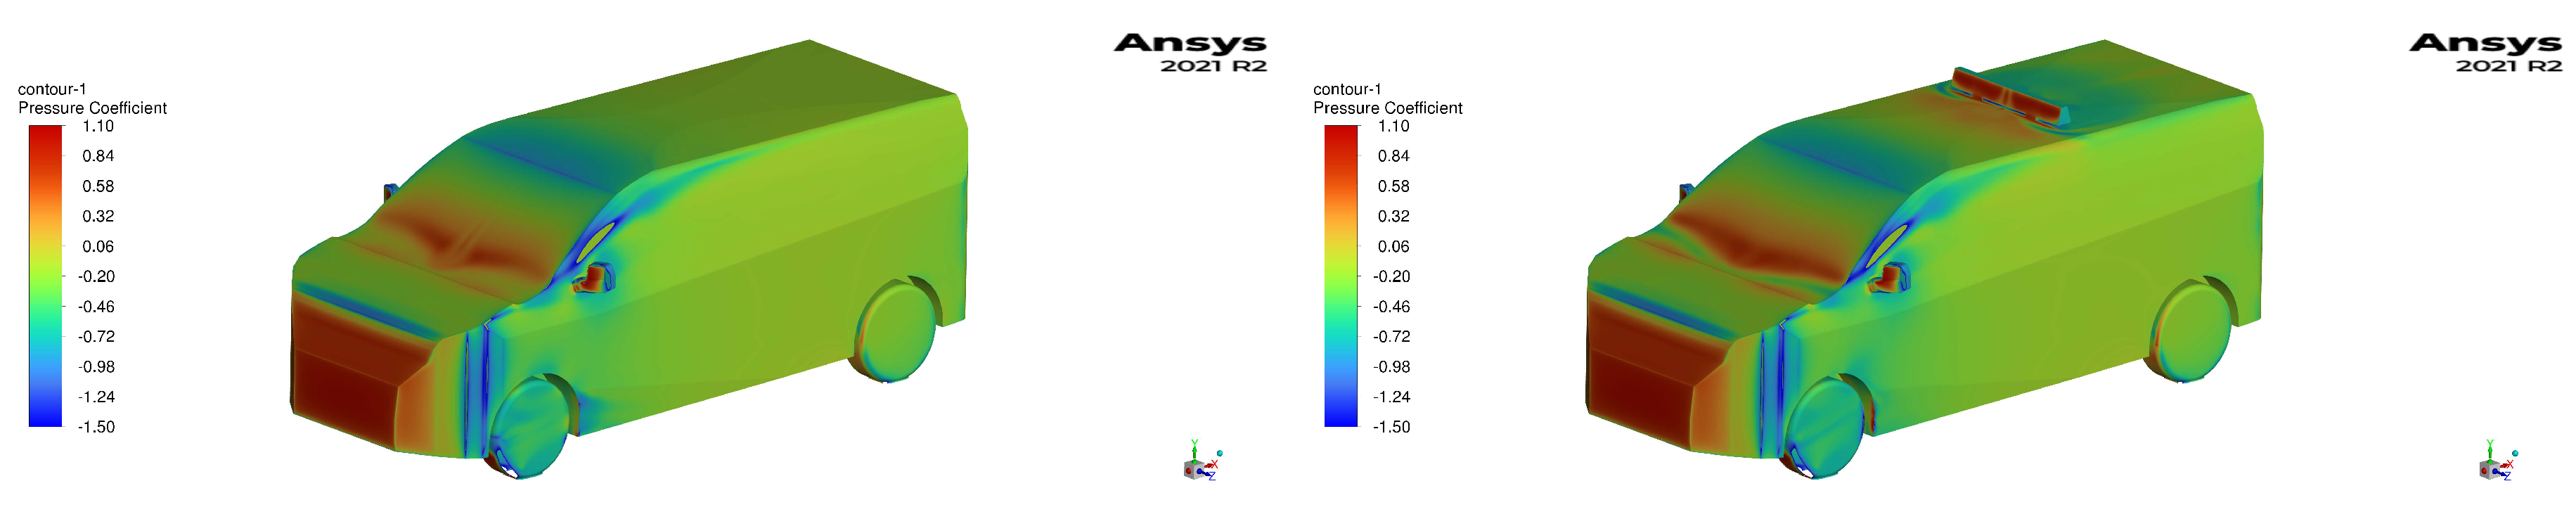
Figure 2.
Pressure coefficient plotted over the rear surfaces of the Prius & Prius Taxi.
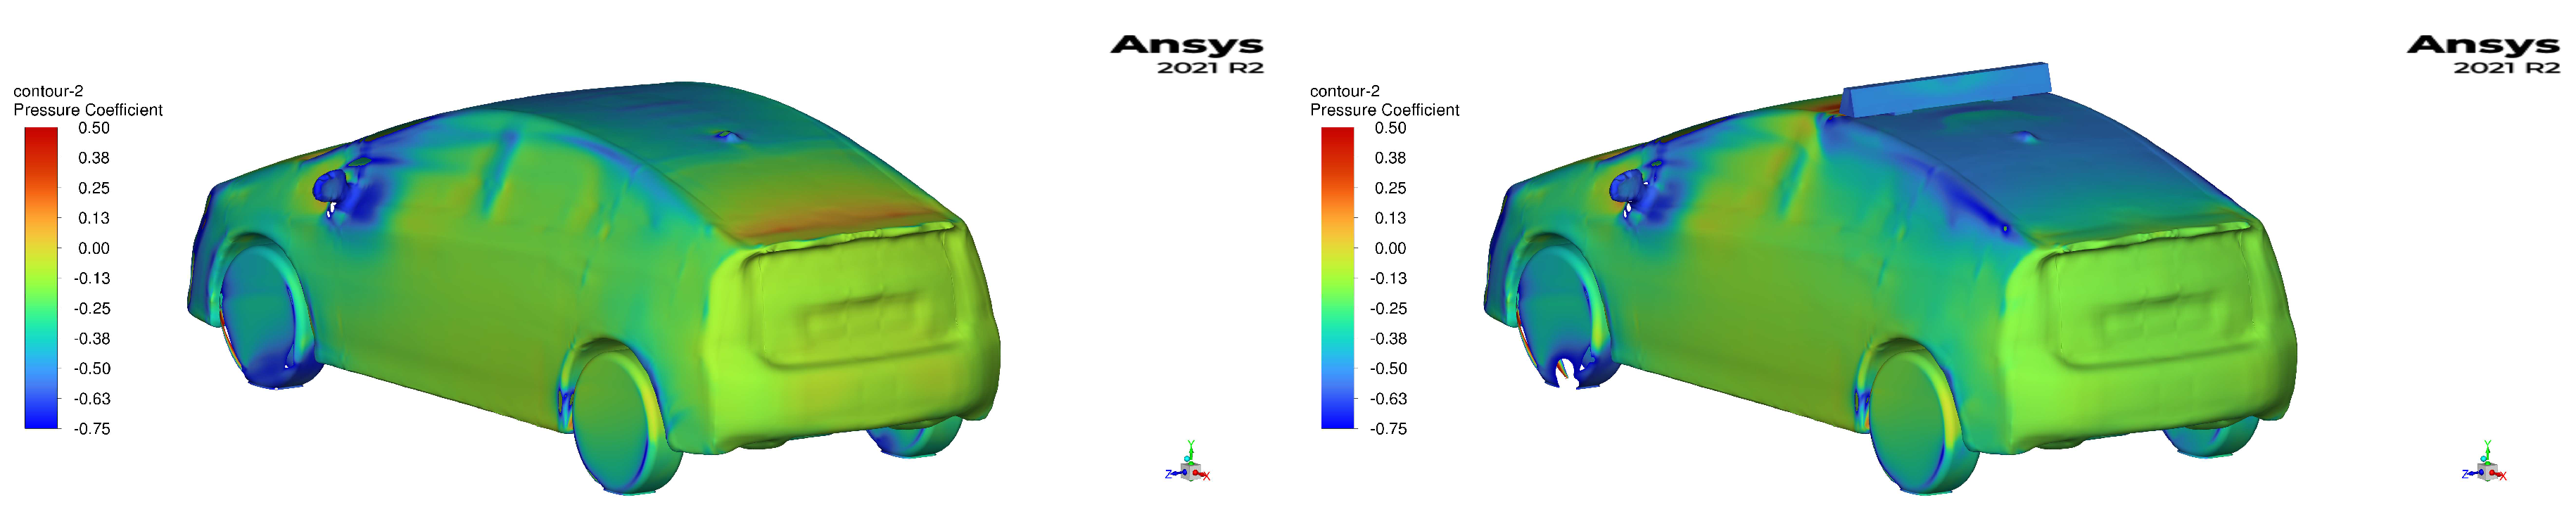
Figure 3.
X velocity plotted along the symmetry plane of the Prius & Prius Taxi.
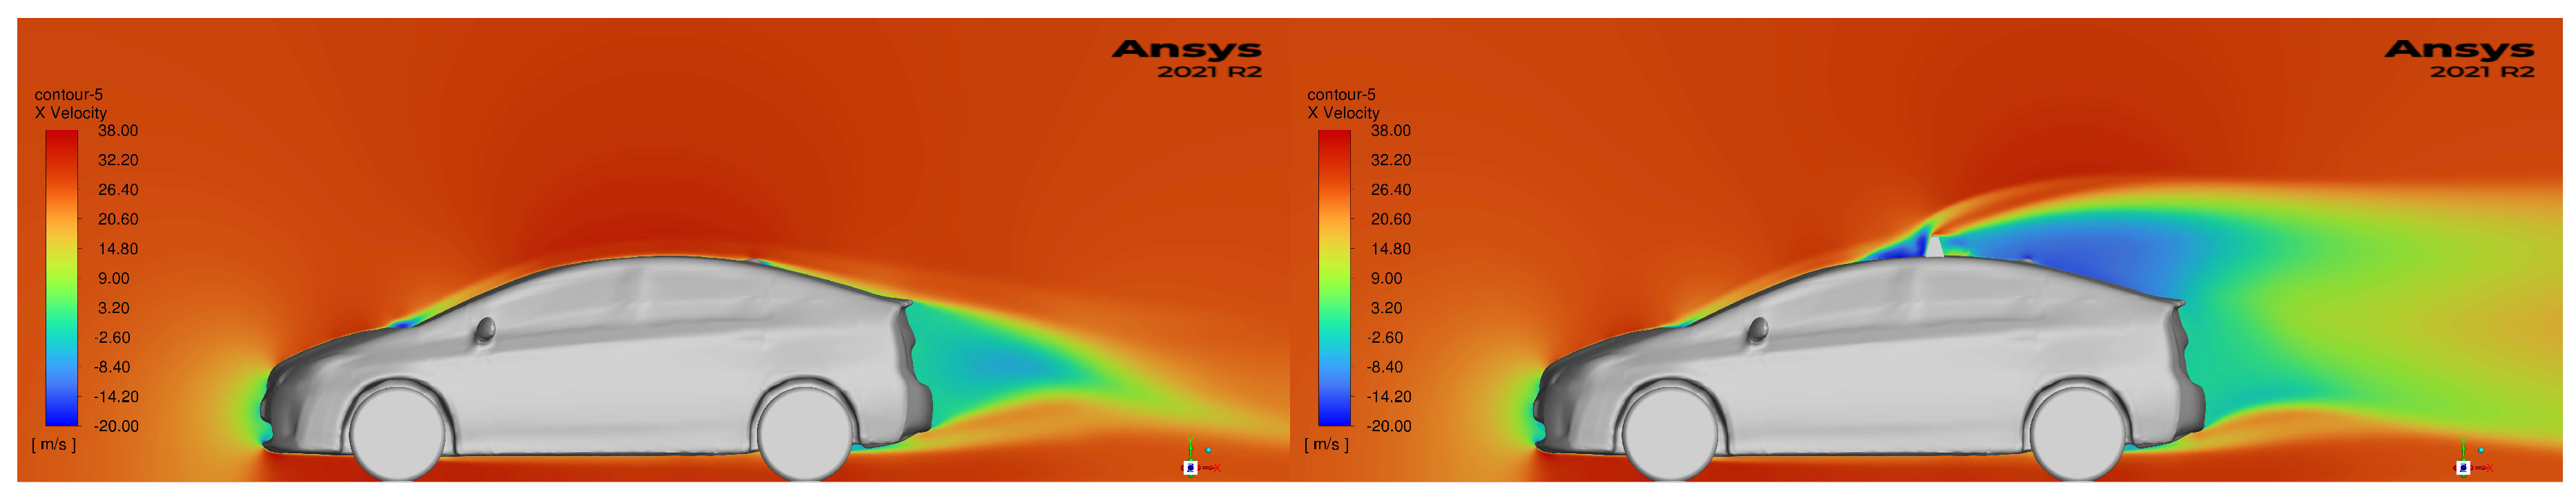
Figure 4.
Total pressure plotted and clipped along x-planes of the Prius & Prius Taxi.
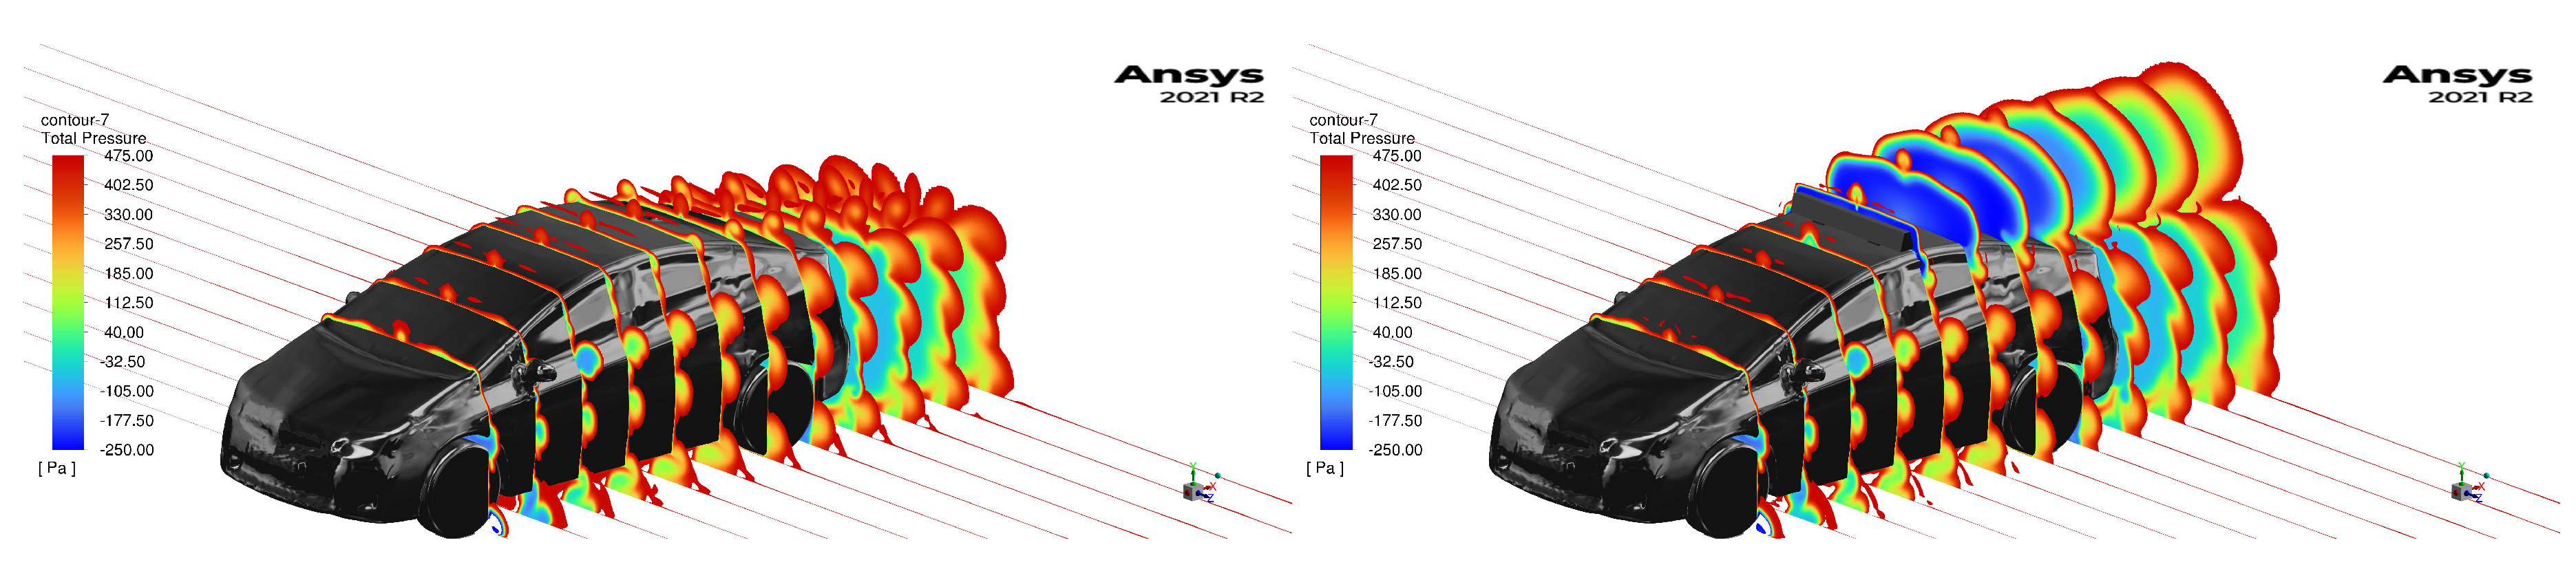
Figure 5.
Rendered image of the three additional taxi types, crossover, hatchback, and notchback.
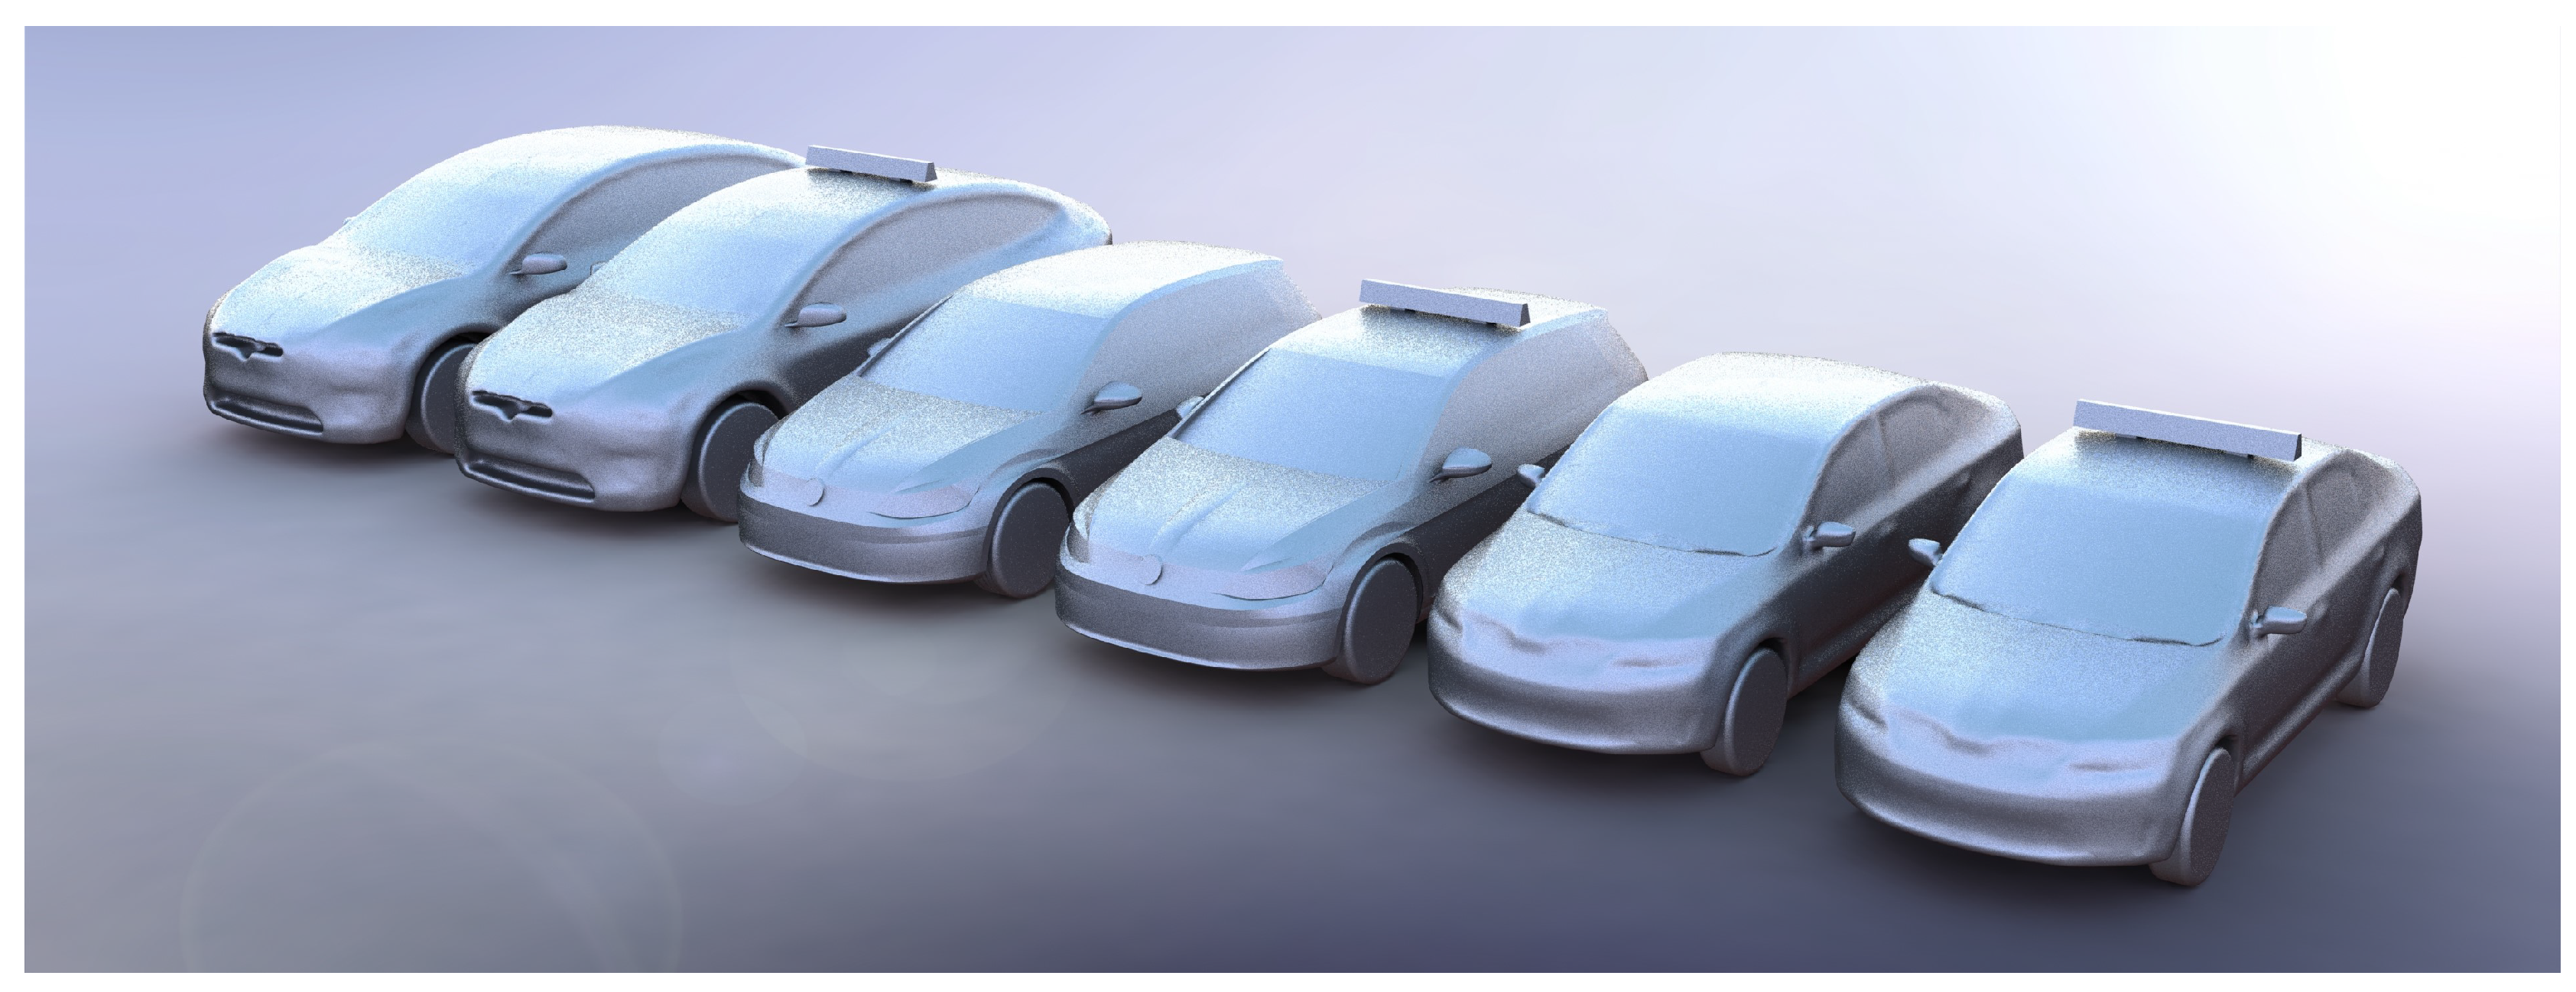
Figure 6.
Rendered image of the different sign positions for the Van, Prius, and Hatchback Taxis.
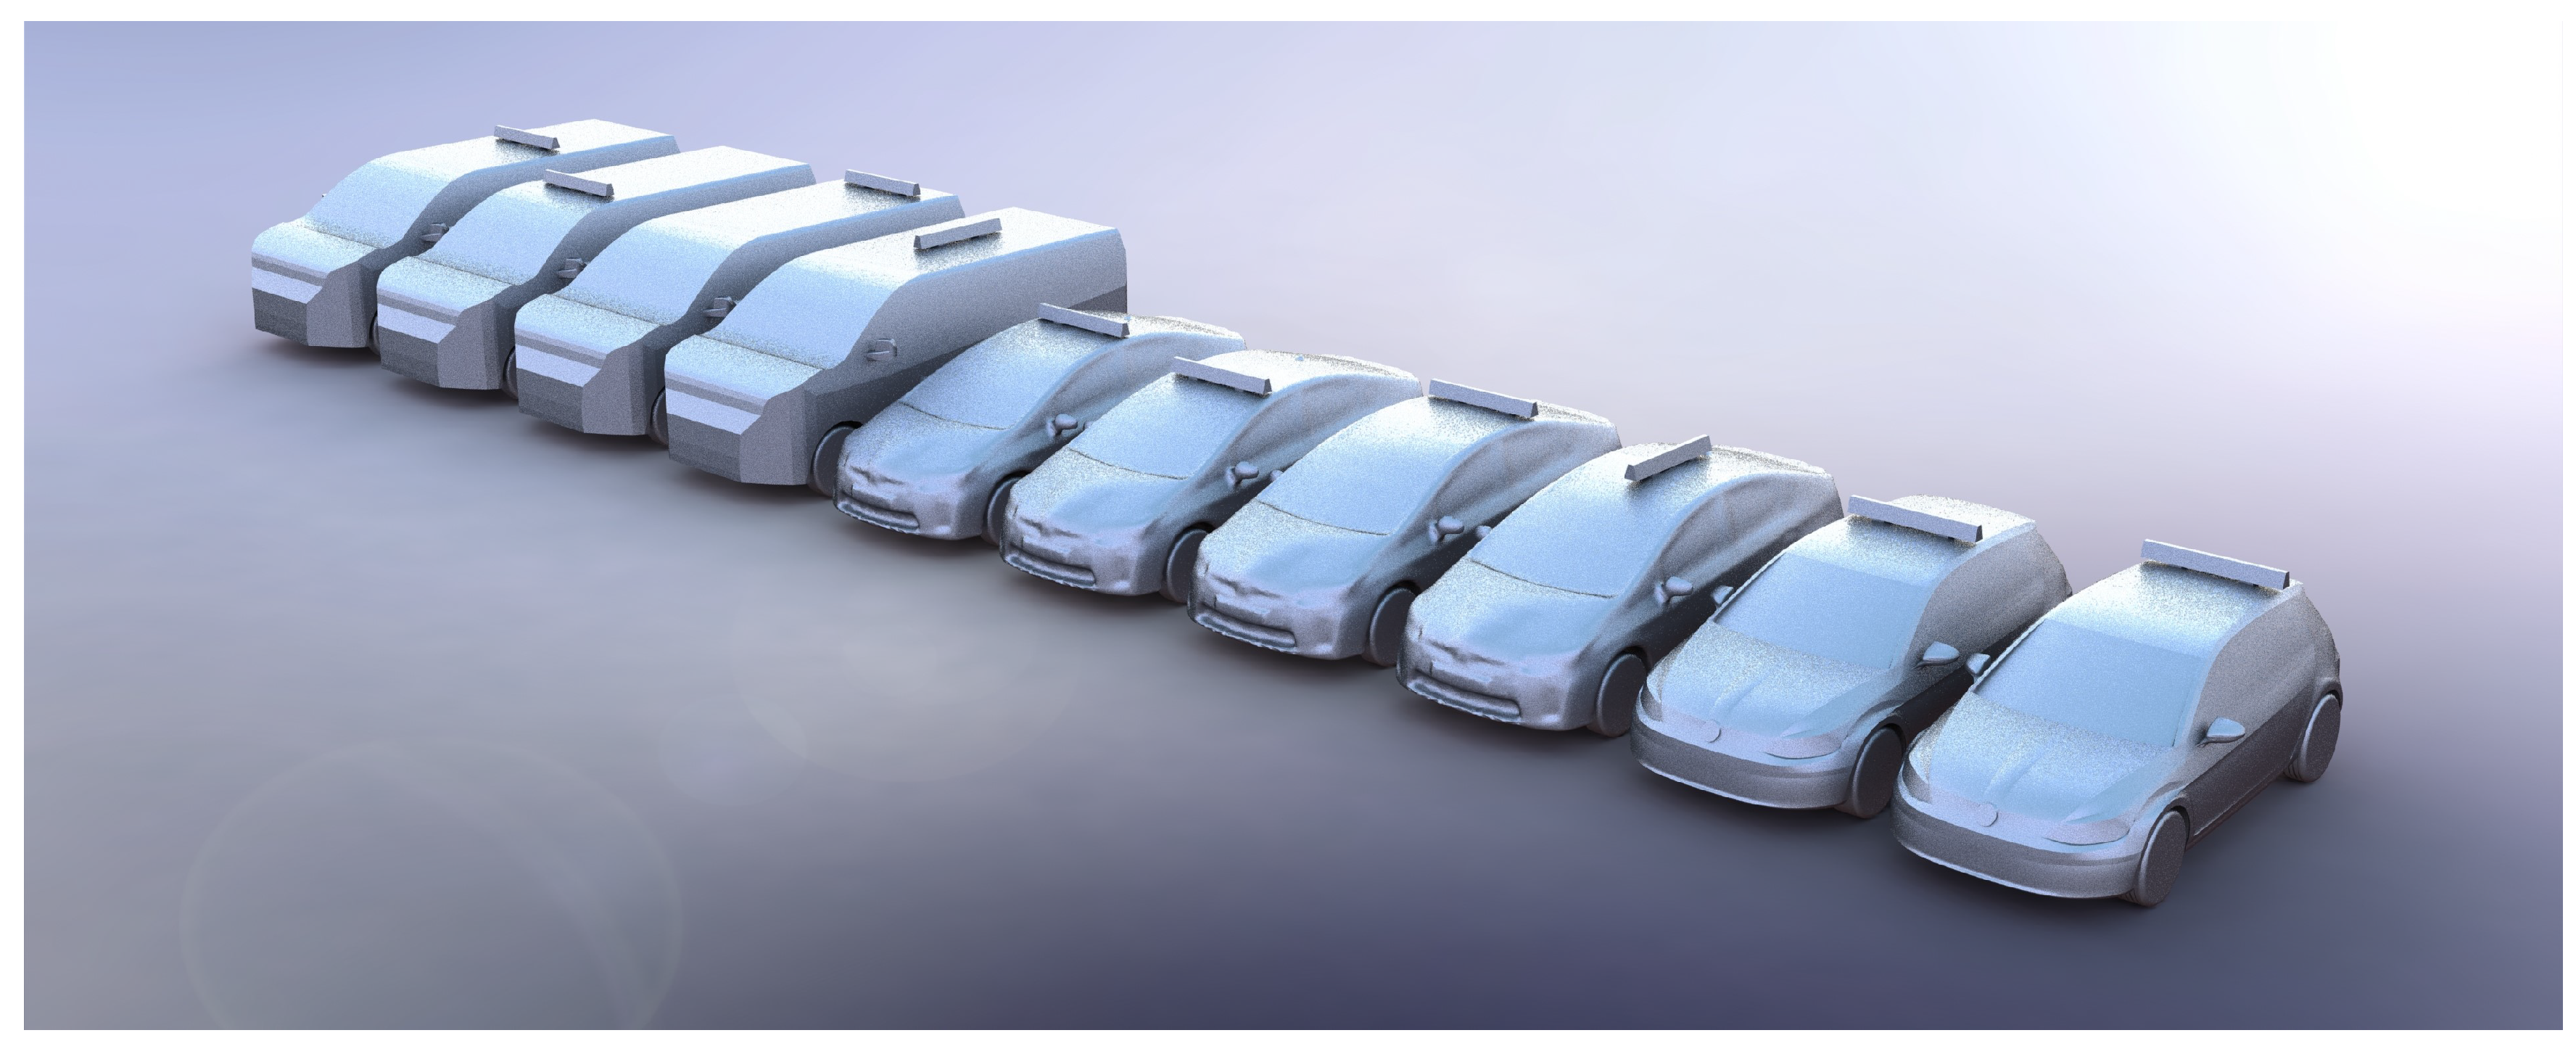
Figure 7.
Rendered image of the different sign connections tested on the Prius Taxi.
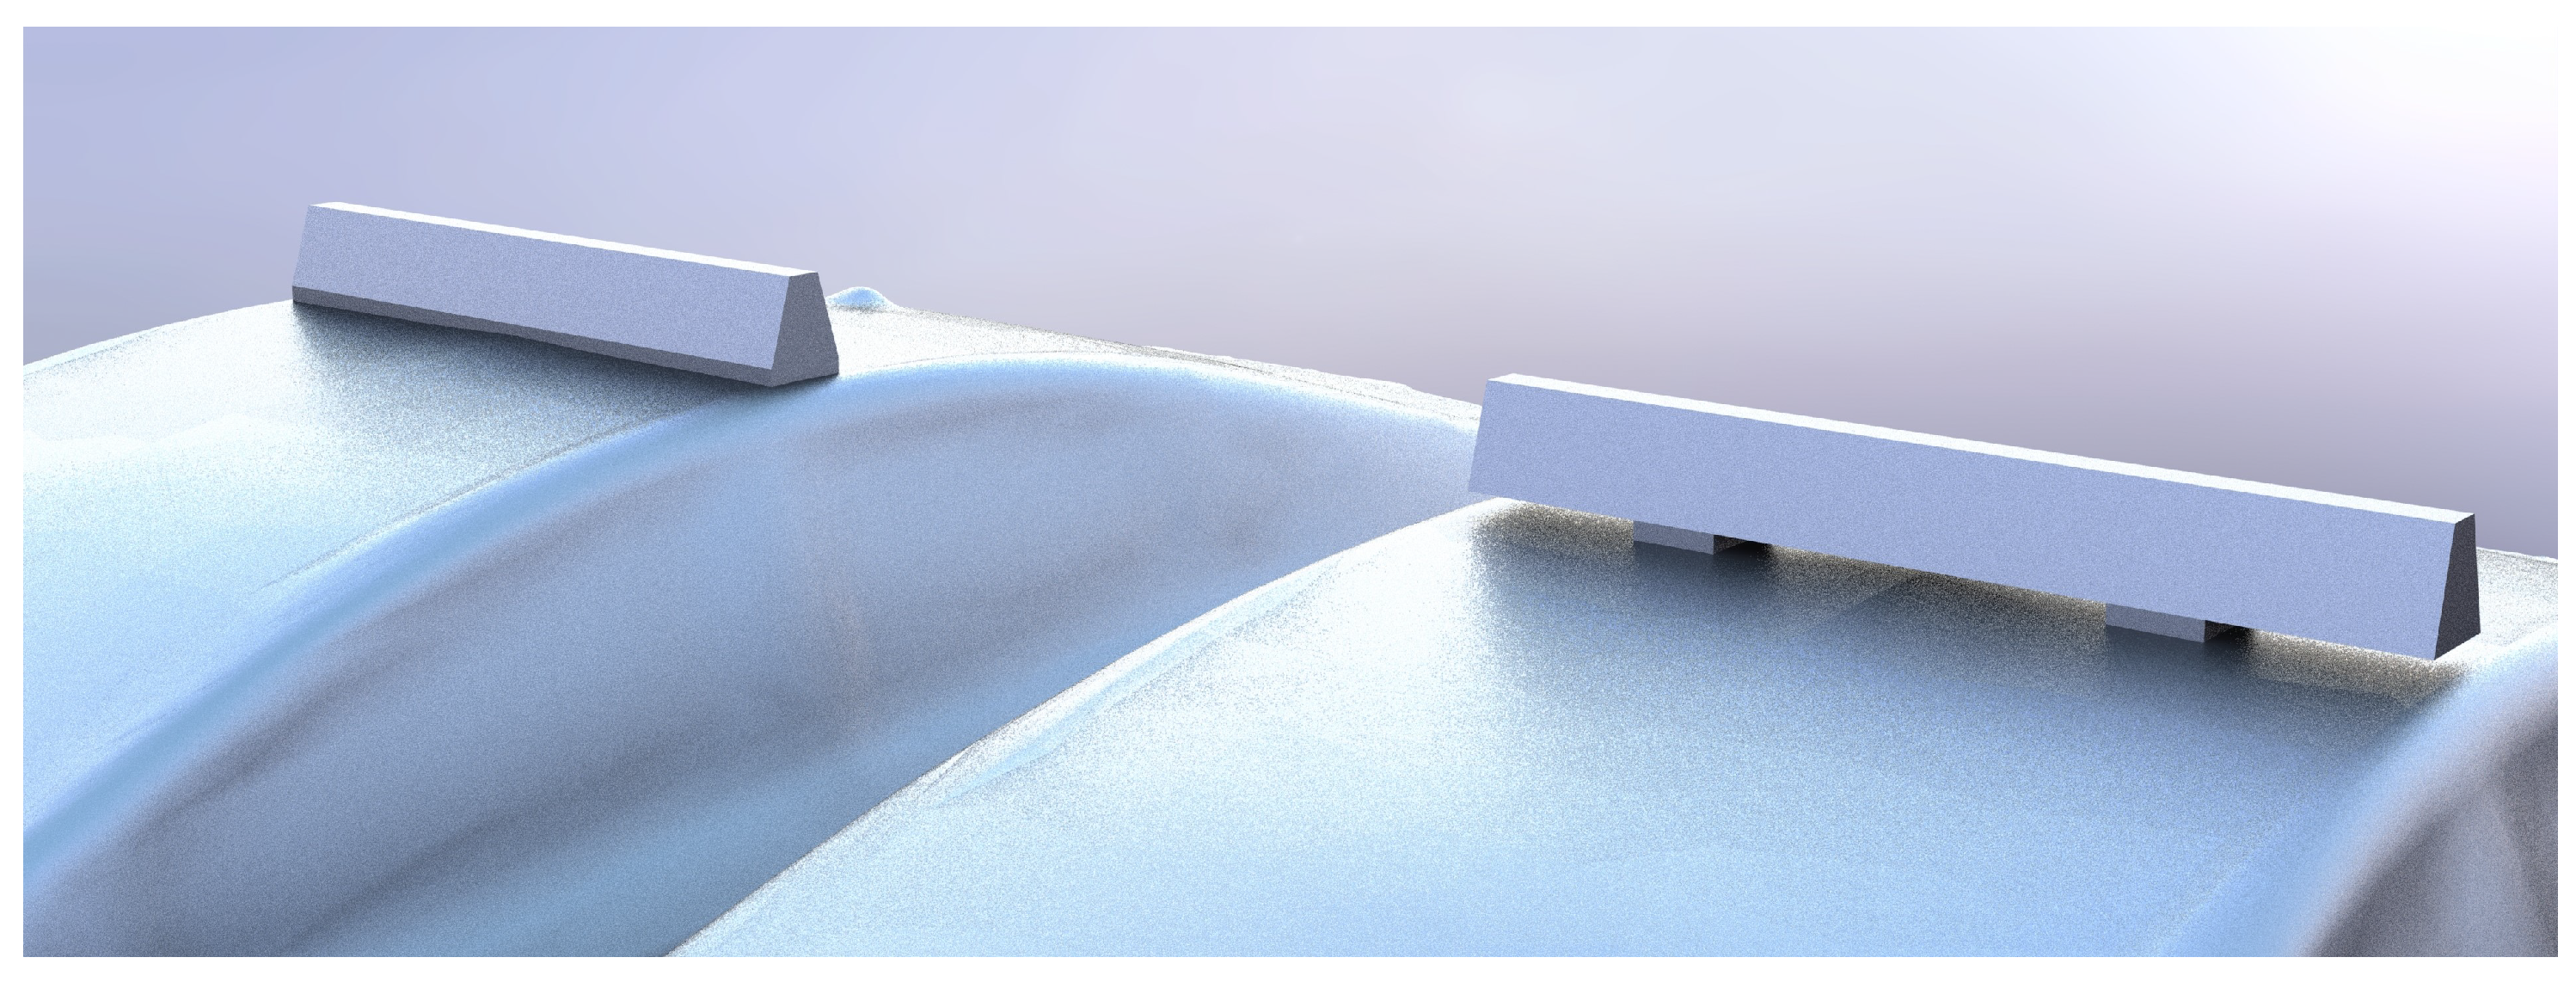
Figure 8.
Pressure coefficient plotted along the symmetry plane of the two sign connections.
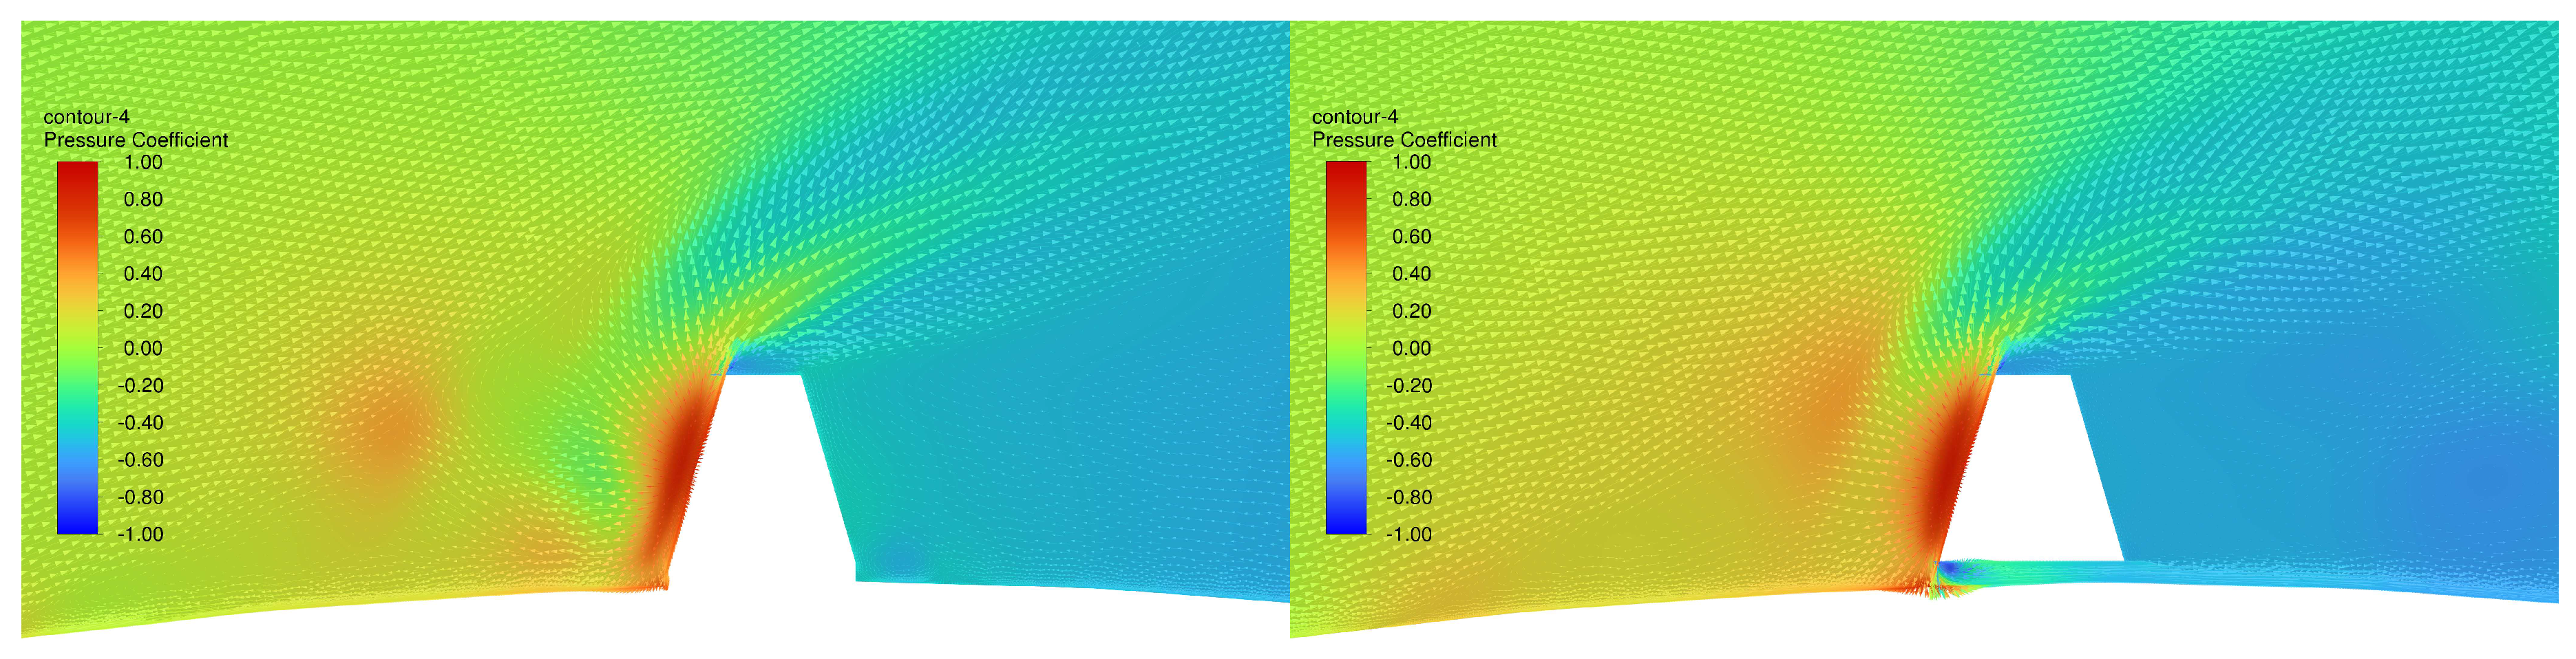
Figure 9.
Rendered image of the different international taxi signs fitted to the Van and Prius taxis (left-right: Standard Irish, Small Irish Triangle, US/Portugal Sign, US Advert Sign, UK Taxi Sign, German Sign).
Figure 9.
Rendered image of the different international taxi signs fitted to the Van and Prius taxis (left-right: Standard Irish, Small Irish Triangle, US/Portugal Sign, US Advert Sign, UK Taxi Sign, German Sign).
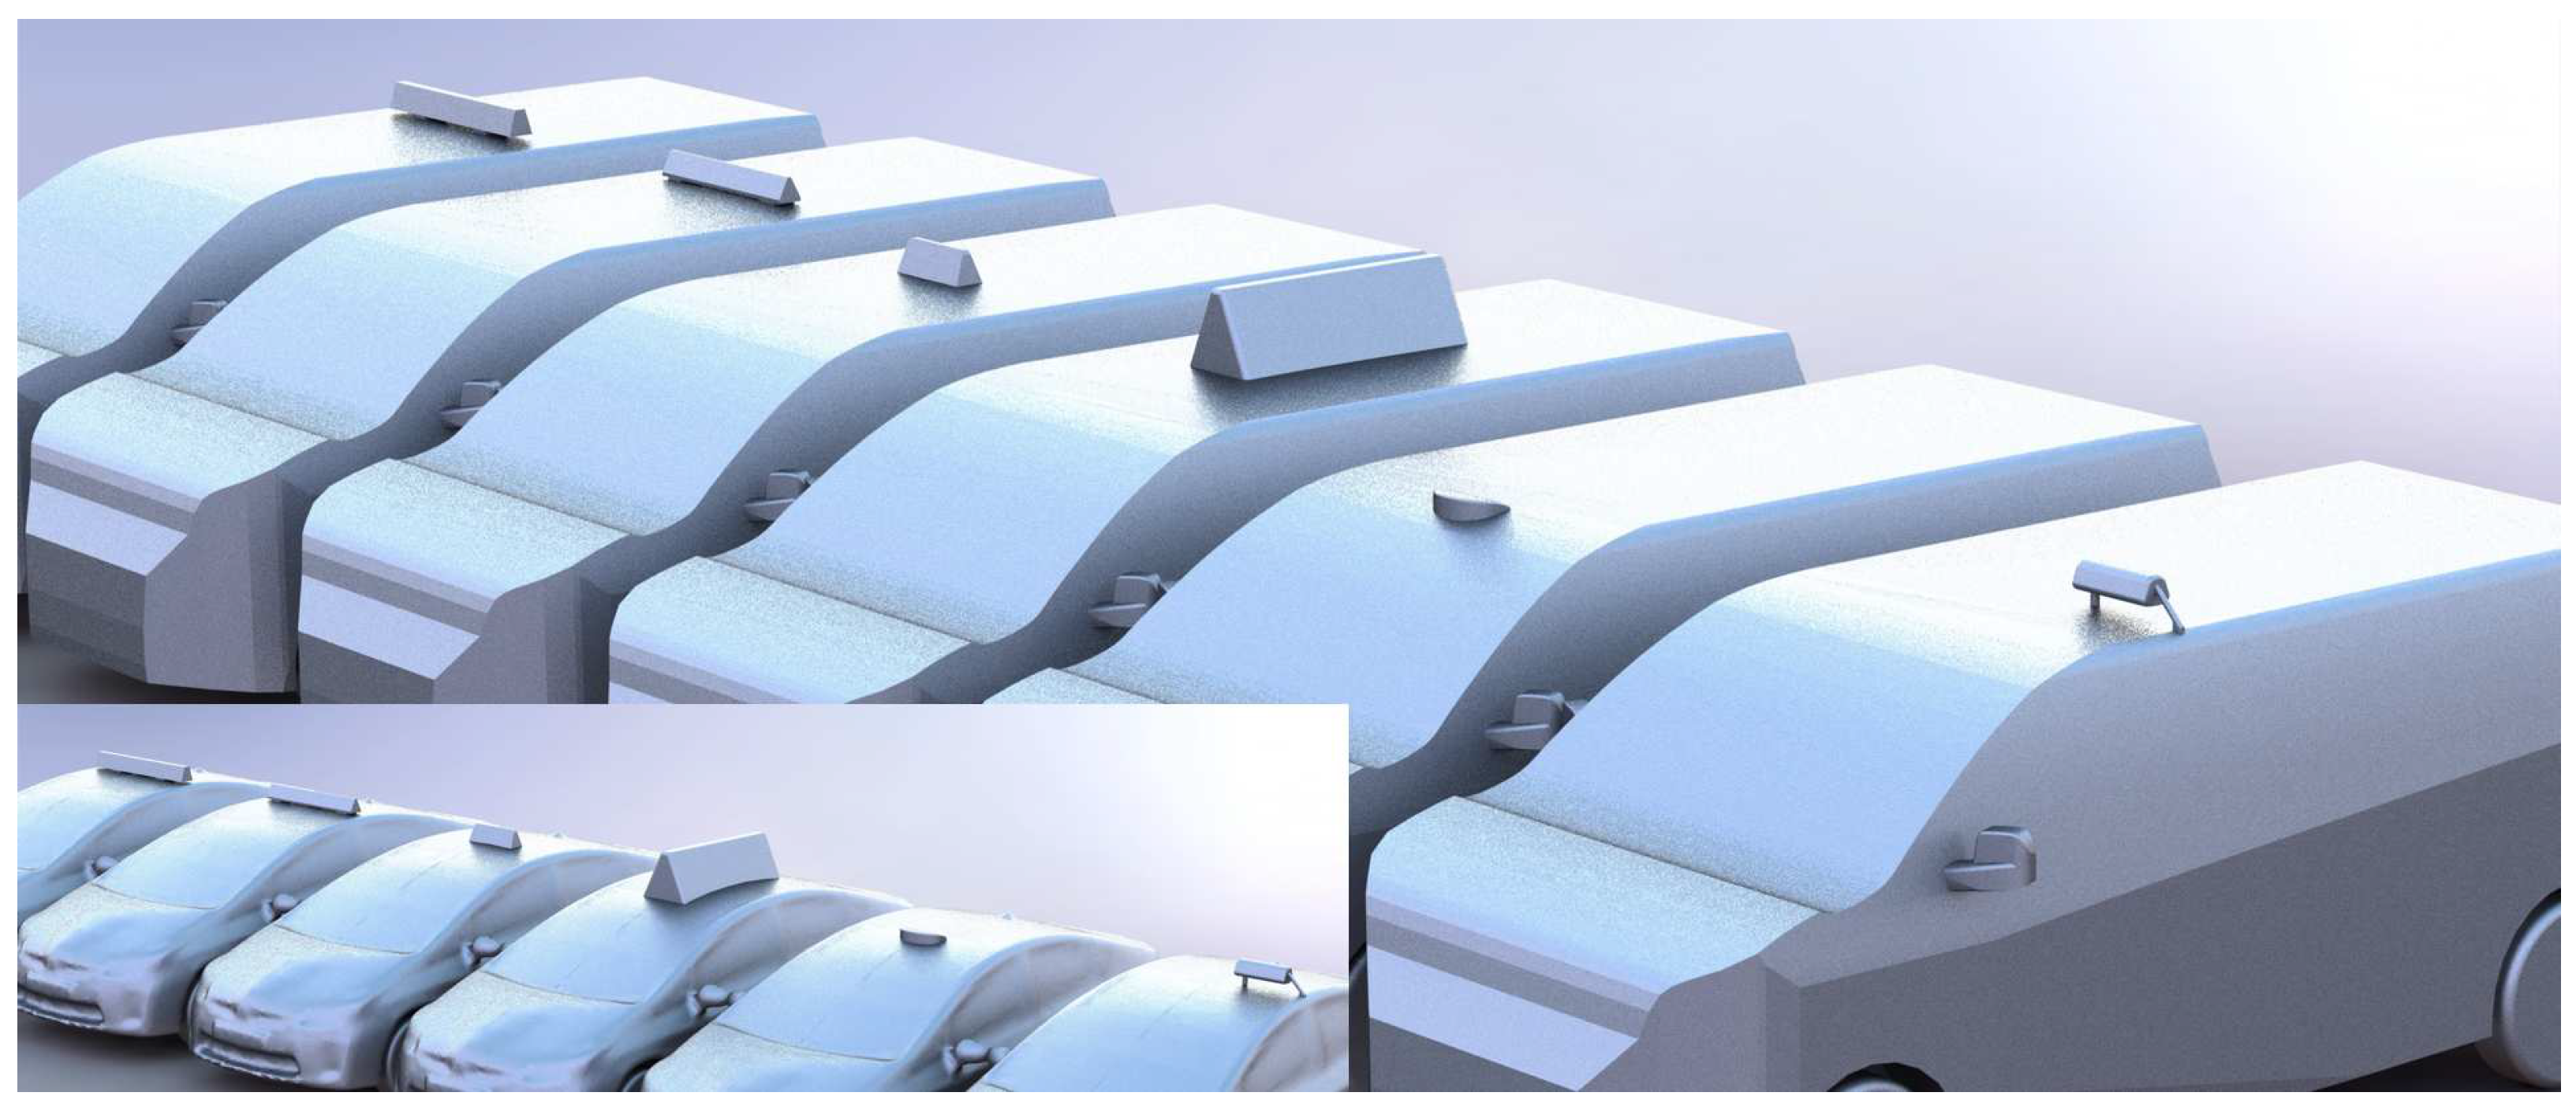
Figure 10.
Isosurface of total pressure = 0 Pa (left) along with clipped surfaces of total pressure along the US Advert Prius Taxi (right).
Figure 10.
Isosurface of total pressure = 0 Pa (left) along with clipped surfaces of total pressure along the US Advert Prius Taxi (right).
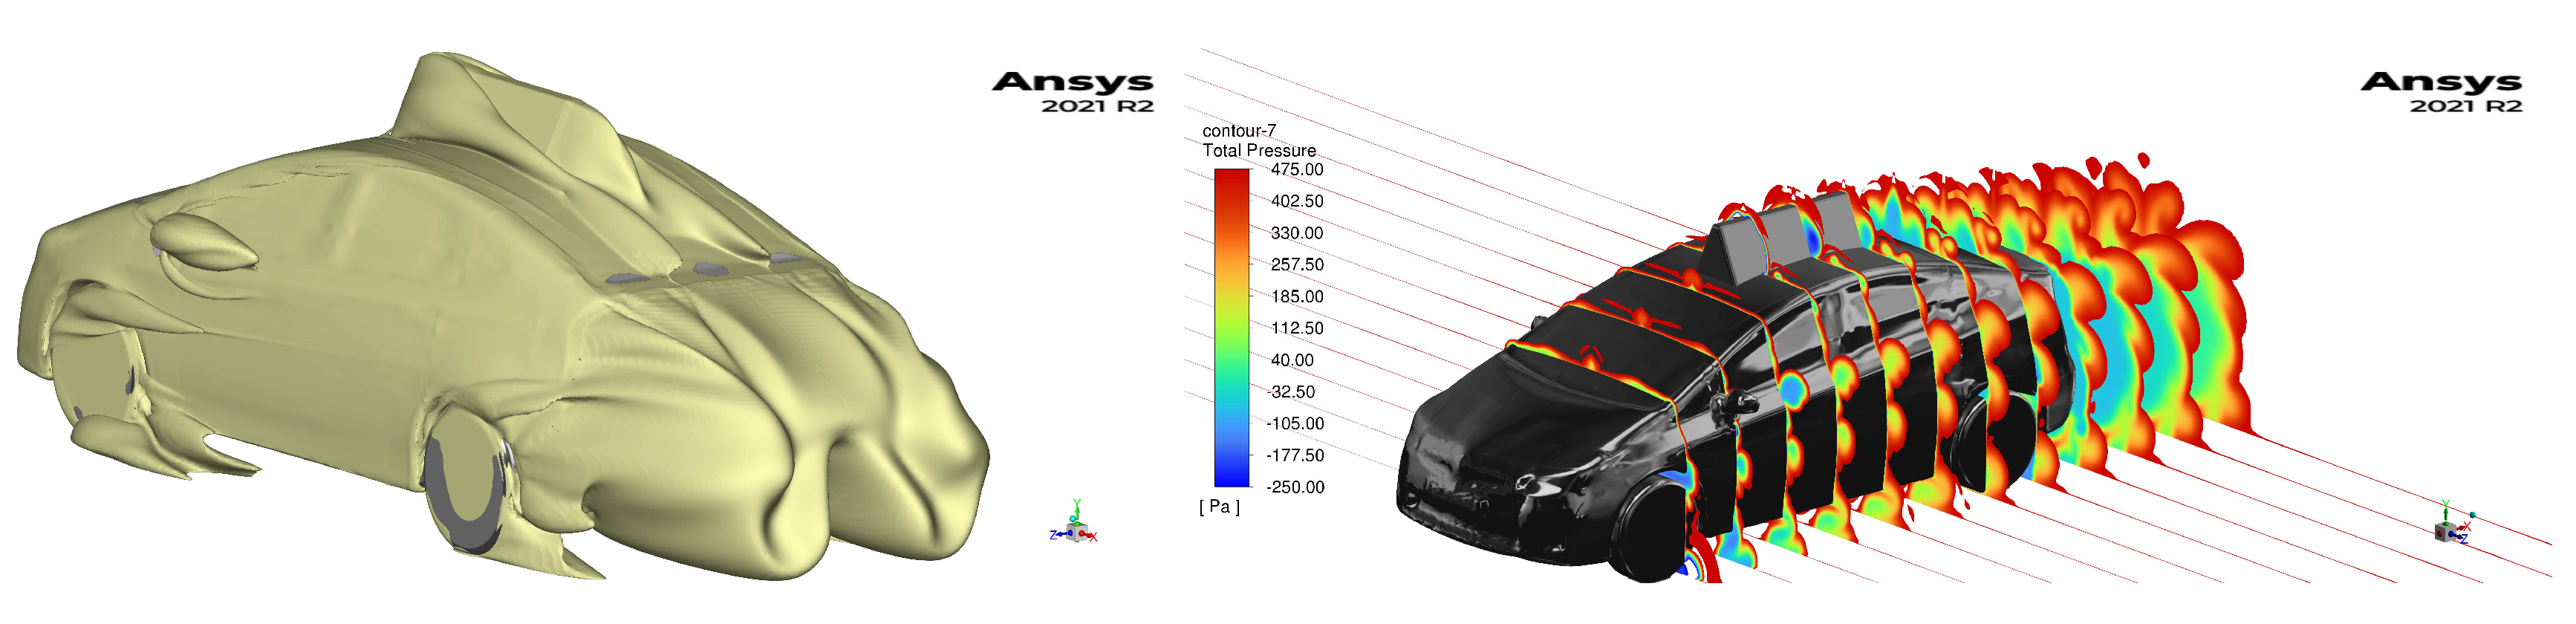
Figure 11.
Images of the novel appendable devices for the Irish taxi sign fitted to the Prius Taxi.
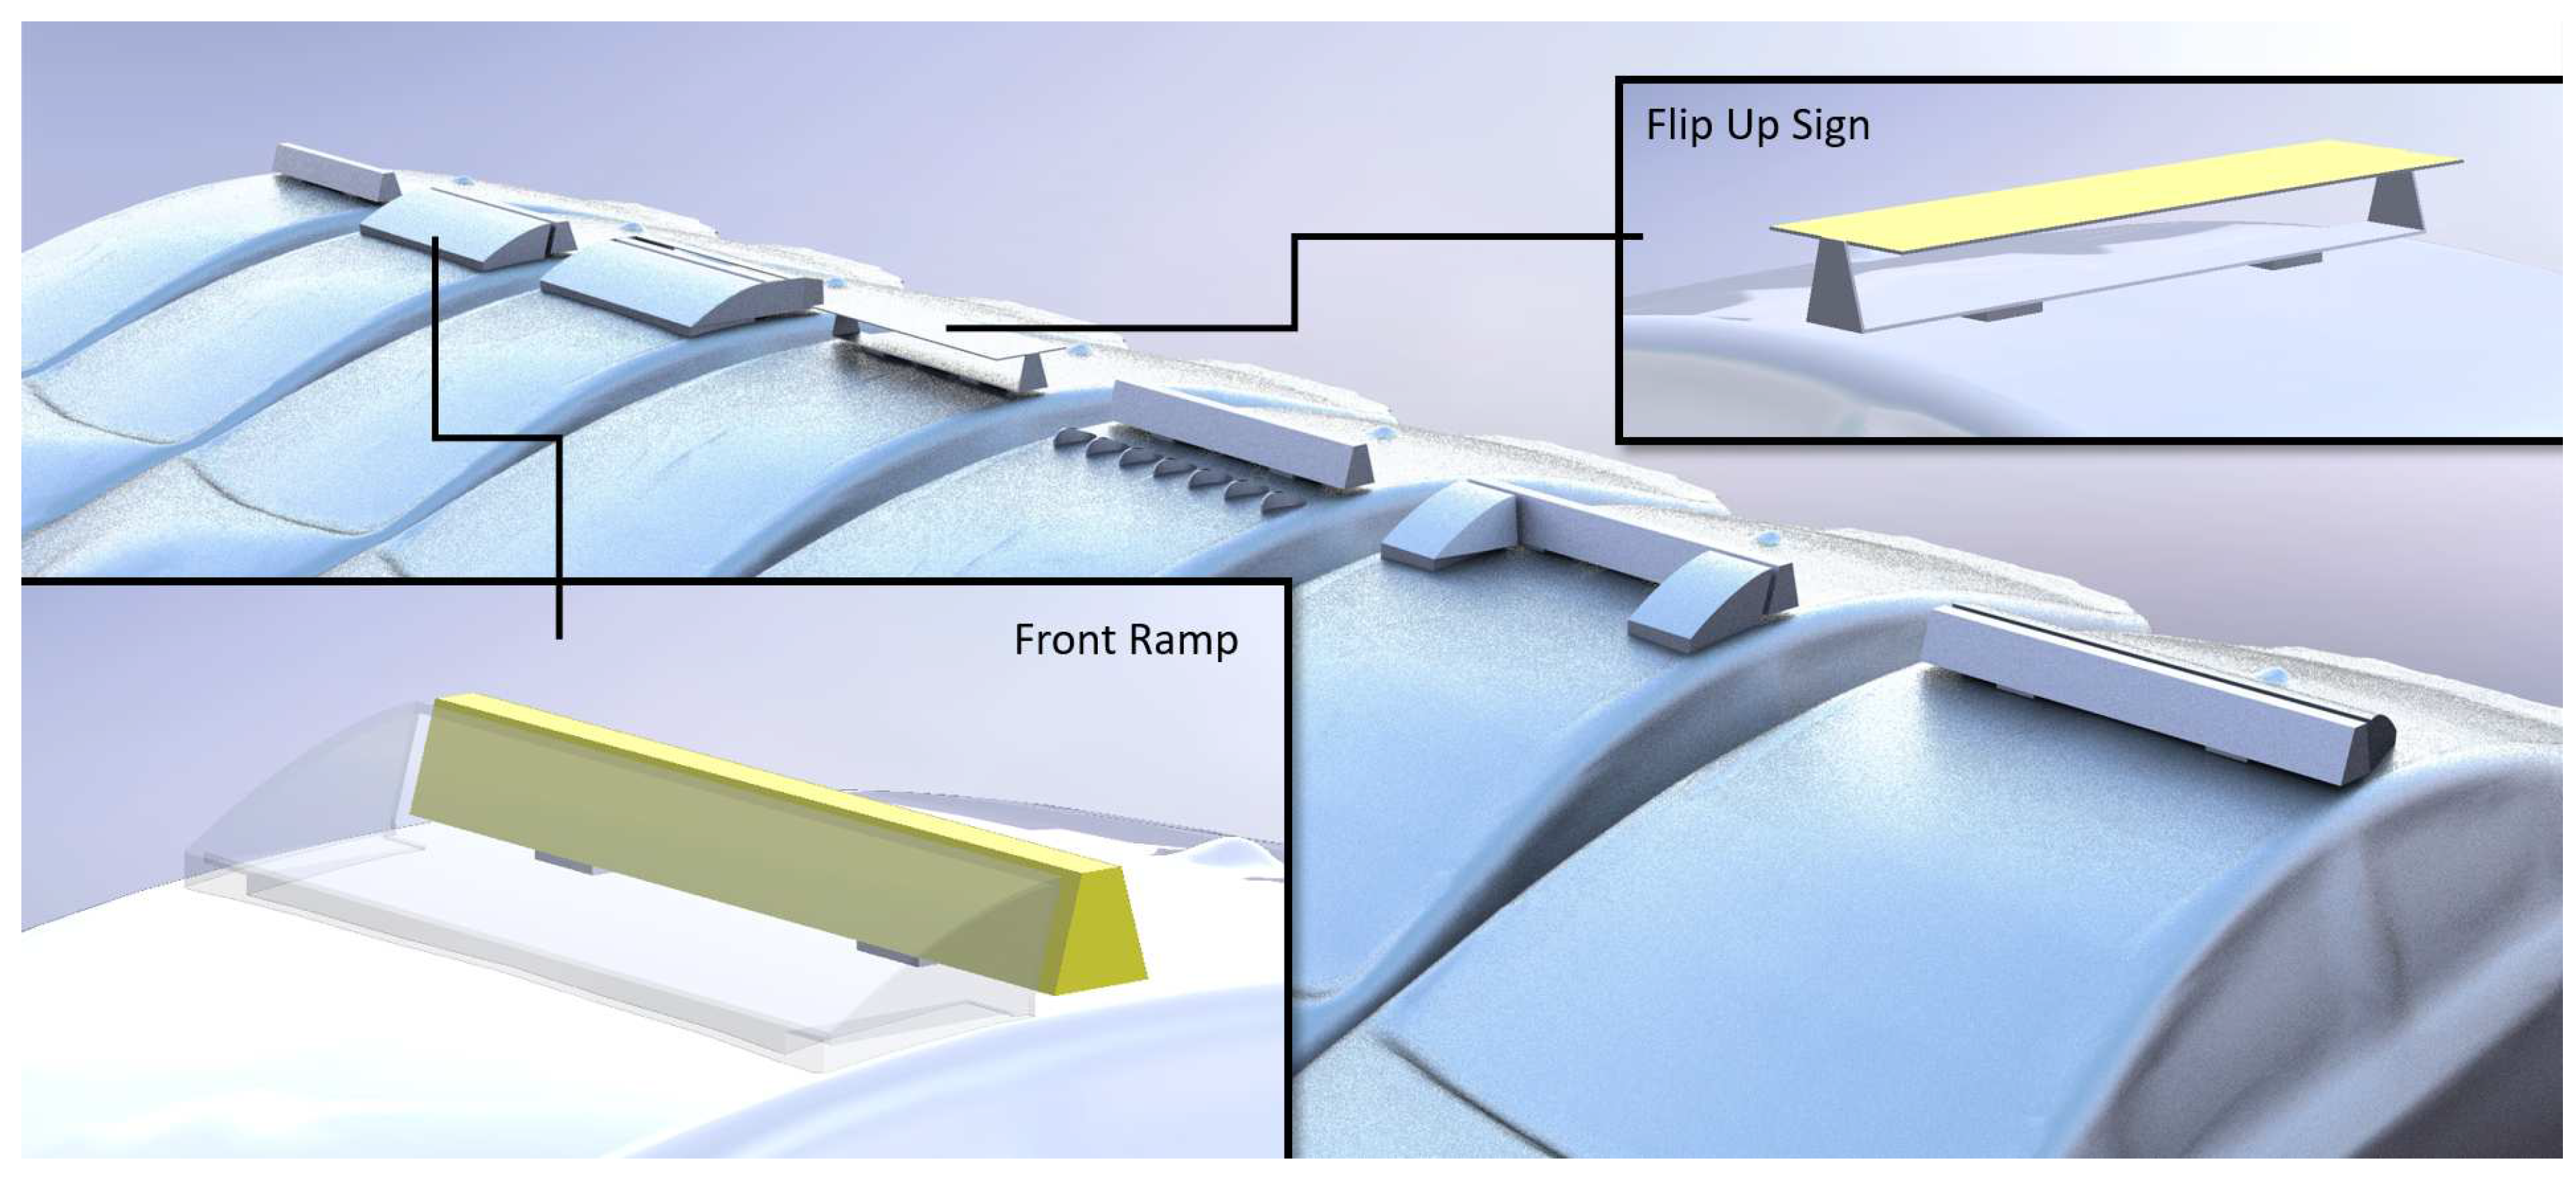
Figure 12.
Pressure coefficient surface plot (left) and total pressure = 0 Pa isosurface (right) along Prius Taxi with Front Ramp.
Figure 12.
Pressure coefficient surface plot (left) and total pressure = 0 Pa isosurface (right) along Prius Taxi with Front Ramp.
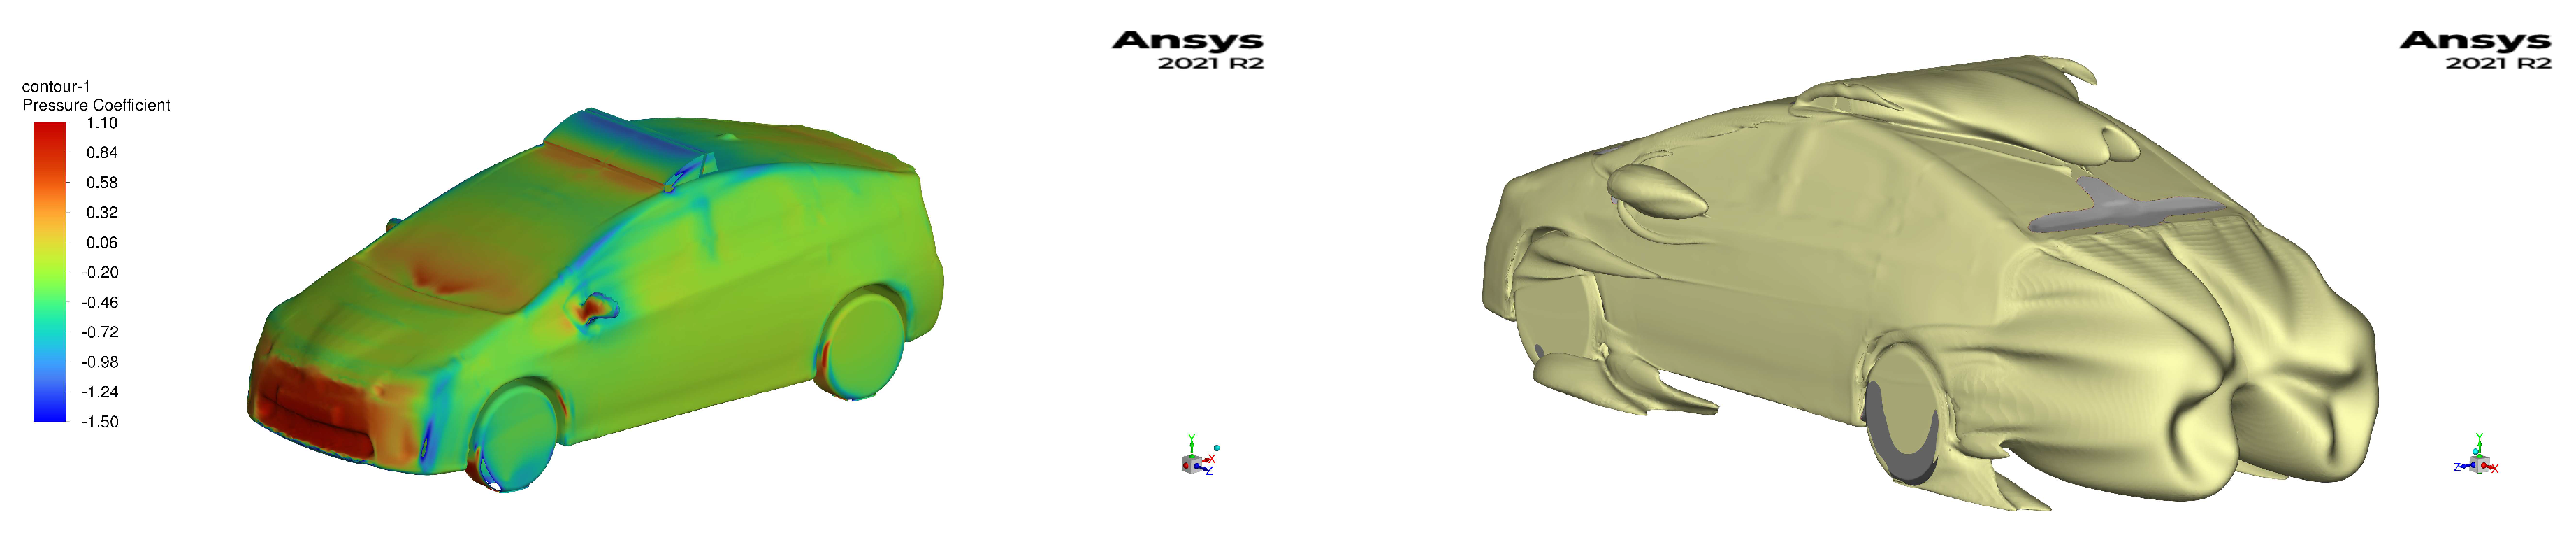
Figure 13.
Rendered images of a proposed aerodynamic design for a future Irish taxi sign.
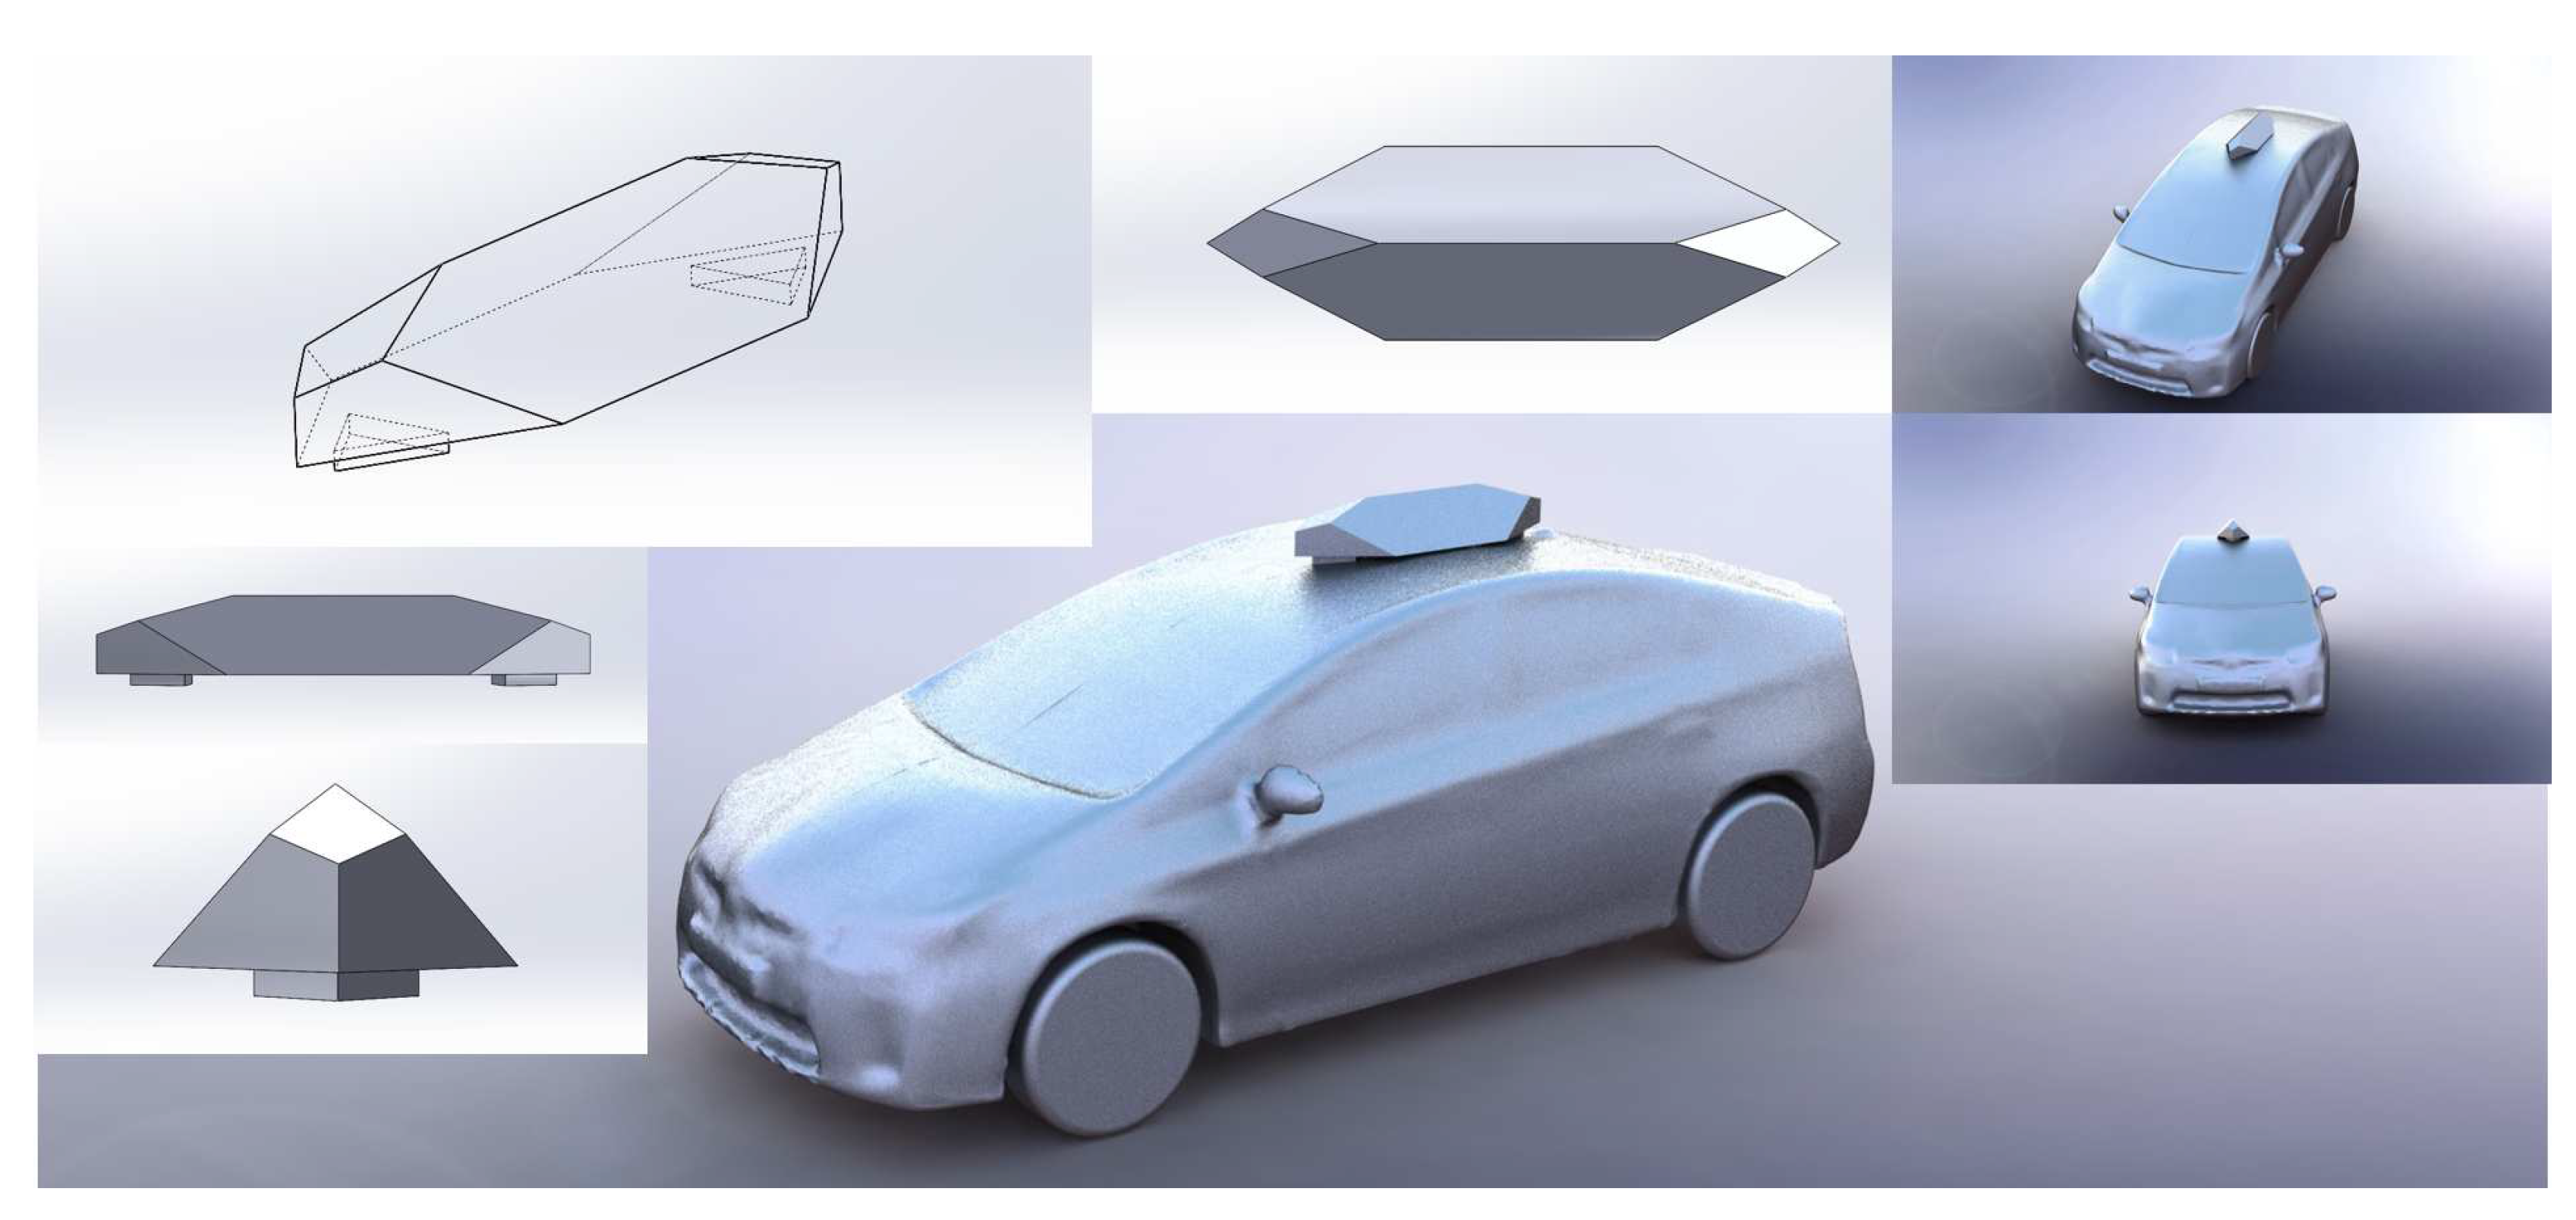
Table 1.
Table showing the variation of against Re for the Prius Taxi.
| Re (10⌃6) | 5.65 | 7.53 | 9.42 | 11.30 |
|---|---|---|---|---|
| Airspeed (km/hr) | 60 | 80 | 100 | 120 |
| Drag Coefficient | 0.388 | 0.387 | 0.390 | 0.390 |
| % Difference | -0.51 % | -0.77 % | - | 0 % |
Table 2.
Table showing the variation of against cell count for the Prius Taxi.
| Mesh Name | Original | Fine | Very Fine | Extreme Fine |
|---|---|---|---|---|
| Cell Count (millions) | 34.2 | 40.5 | 65.3 | 77.1 |
| Drag Coefficient | 0.390 | 0.389 | 0.391 | 0.387 |
| % Difference CD | - | -0.26 % | 0.26 % | -0.77 % |
Table 3.
Calculated drag changes and estimated fuel increases at 100 km/hr for the Van Taxi.
| Simulation Name | % Change | Area () | % Change | Drag Change | Fuel Increase | |
|---|---|---|---|---|---|---|
| Van | 0.321 | - | 3.143806 | - | - | - |
| Van Taxi | 0.362 | 12.77 % | 3.27614 | 4.21 % | 17.52 % | 8.75 % |
| Sign Longitudinal | 0.322 | 0.31 % | 3.155508 | 0.37 % | 0.68 % | 0.35 % |
Table 4.
Calculated drag changes and estimated fuel increases at 100 km/hr for the Prius Taxi.
| Simulation Name | % Change | Area () | % Change | Drag Change | Fuel Increase | |
|---|---|---|---|---|---|---|
| Prius | 0.241 | - | 2.237518 | - | - | - |
| Prius Taxi | 0.390 | 61.83 % | 2.369134 | 5.88 % | 71.35 % | 35.5 % |
| Sign Longitudinal | 0.252 | 4.56 % | 2.248358 | 0.48 % | 5.06 % | 2.5 % |
Table 6.
Calculated drag changes and estimated fuel increases at 100 km/hr for the various taxis.
| Simulation Name | % Change | Area () | % Change | Drag Change | Fuel Increase | |
|---|---|---|---|---|---|---|
| Crossover | 0.303 | - | 2.804206 | - | - | - |
| Crossover Taxi | 0.402 | 32.67 % | 2.935582 | 4.68 % | 38.88 % | 19.5 % |
| HatchBack | 0.281 | - | 2.18708 | - | - | - |
| HatchBack Taxi | 0.414 | 47.33 % | 2.31888 | 6.03 % | 56.21 % | 28 % |
| NotchBack | 0.228 | - | 1.980479 | - | - | - |
| NotchBack Taxi | 0.411 | 80.26 % | 2.112206 | 6.65 % | 92.25 % | 46 % |
Table 7.
Calculated drag changes and estimated fuel increases at 100 km/hr for the position changes.
Table 7.
Calculated drag changes and estimated fuel increases at 100 km/hr for the position changes.
| Simulation Name | % Change | Area () | % Change | Drag Change | Fuel Increase | |
|---|---|---|---|---|---|---|
| Van Taxi | 0.362 | - | 3.27614 | - | - | - |
| Van Taxi - Front | 0.392 | 8.29 % | 3.273638 | -0.08 % | 8.20 % | 4.10 % |
| Van Taxi - Rear | 0.443 | 22.38 % | 3.269372 | -0.21 % | 22.12 % | 11.06 % |
| Prius Taxi | 0.390 | - | 2.369134 | - | - | - |
| Prius Taxi - Front | 0.398 | 2.05 % | 2.345874 | -0.98 % | 1.05 % | 0.53 % |
| Prius Taxi - Rear | 0.415 | 6.41 % | 2.356628 | -0.53 % | 5.85 % | 2.93 % |
| HatchBack Taxi | 0.414 | - | 2.31888 | - | - | - |
| HatchBack Taxi-Rear | 0.435 | 5.07 % | 2.305484 | -0.58 % | 4.47 % | 2.24 % |
Table 8.
Calculated drag changes at 100 km/hr for the sign connection changes.
| Simulation Name | % Change | Area () | % Change | Drag Change | |
|---|---|---|---|---|---|
| Filled Sign Connection | 0.393 | - | 2.386192 | - | - |
| Not-Filled Sign Connection | 0.396 | 0.76 % | 2.370644 | -0.65 % | ≈ 0 % |
Table 9.
Calculated drag changes and estimated fuel increases at 100 km/hr for the international Van taxi signs.
Table 9.
Calculated drag changes and estimated fuel increases at 100 km/hr for the international Van taxi signs.
| Simulation Name | % Change | Area () | % Change | Drag Change | Fuel Increase | |
|---|---|---|---|---|---|---|
| Van | 0.321 | - | 3.143806 | - | - | - |
| Van Taxi | 0.362 | 12.77 % | 3.27614 | 4.21 % | 17.52 % | 8.75 % |
| Small Triangle | 0.351 | 9.35 % | 3.249506 | 3.36 % | 13.02 % | 6.5 % |
| US Portugal Sign | 0.334 | 4.05 % | 3.201646 | 1.84 % | 5.96 % | 3 % |
| US Advert Sign | 0.322 | 0.31 % | 3.215688 | 2.29 % | 2.61 % | 1.25 % |
| UK Taxi Sign | 0.338 | 5.30 % | 3.145938 | 0.07 % | 5.37 % | 2.5 % |
| German Sign | 0.324 | 0.93 % | 3.182899 | 1.24 % | 2.18 % | 1 % |
Table 10.
Calculated drag changes and estimated fuel increases at 100 km/hr for the international Prius taxi signs.
Table 10.
Calculated drag changes and estimated fuel increases at 100 km/hr for the international Prius taxi signs.
| Simulation Name | % Change | Area () | % Change | Drag Change | Fuel Increase | |
|---|---|---|---|---|---|---|
| Prius | 0.241 | - | 2.237518 | - | - | |
| Prius Taxi | 0.390 | 61.83 % | 2.369134 | 5.88 % | 71.35 % | 35.5 % |
| Small Triangle | 0.373 | 54.77 % | 2.343178 | 4.72 % | 62.08 % | 31 % |
| US Portugal Sign | 0.314 | 30.29 % | 2.286076 | 2.17 % | 33.12 % | 16.5 % |
| US Advert Sign | 0.273 | 13.28 % | 2.293374 | 2.50 % | 16.11 % | 8 % |
| UK Taxi Sign | 0.249 | 3.32 % | 2.24612 | 0.38 % | 3.71 % | 1.75 % |
| German Sign | 0.262 | 8.71 % | 2.276093 | 1.72 % | 10.58 % | 5.25 % |
Table 11.
Calculated drag reductions for the novel appendable devices on the Irish taxi sign (Prius).
Table 11.
Calculated drag reductions for the novel appendable devices on the Irish taxi sign (Prius).
| Simulation Name | % Change | Area () | % Change | Drag Change | |
|---|---|---|---|---|---|
| Prius Taxi | 0.390 | - | 2.369134 | - | - |
| Front Ramp | 0.277 | -28.97 % | - | - | -28.97 % |
| Front Ramp + Rear Hollow | 0.280 | -28.21 % | - | - | -28.21 % |
| Flip Up Sign | 0.252 | -35.39 % | 2.251998 | -4.94 % | -38.58 % |
| Vortex Generators in Front | 0.389 | -0.26 % | - | - | -0.26 % |
| Front Corner Ramps | 0.360 | -7.69 % | - | - | -7.69 % |
| Rear Ramp | 0.395 | +1.28 % | - | - | +1.28 % |
Table 12.
Calculated drag reductions for the novel appendable devices on the Irish taxi sign (Van).
| Simulation Name | % Change | Area () | % Change | Drag Change | |
|---|---|---|---|---|---|
| Van Taxi | 0.362 | - | 3.27614 | - | - |
| Front Ramp | 0.326 | -9.94 % | - | - | -9.94 % |
| Front Ramp + Rear Hollow | 0.327 | -9.67 % | - | - | -9.67 % |
Disclaimer/Publisher’s Note: The statements, opinions and data contained in all publications are solely those of the individual author(s) and contributor(s) and not of MDPI and/or the editor(s). MDPI and/or the editor(s) disclaim responsibility for any injury to people or property resulting from any ideas, methods, instructions or products referred to in the content. |
© 2023 by the authors. Licensee MDPI, Basel, Switzerland. This article is an open access article distributed under the terms and conditions of the Creative Commons Attribution (CC BY) license (http://creativecommons.org/licenses/by/4.0/).
Copyright: This open access article is published under a Creative Commons CC BY 4.0 license, which permit the free download, distribution, and reuse, provided that the author and preprint are cited in any reuse.


