
Submitted:
29 June 2023
Posted:
30 June 2023
You are already at the latest version
Abstract
Abstract: The diffusion of competition under the coexistence of multi-generation products has become one of the important challenges faced by enterprises in their daily and sustainable operations. At the same time, the competition between different brands has intensified the difficulty and complexity of decision-making in the process of multi-generation product operation, Therefore, based on the Norton-Bass model diffusion process, this paper introduces two marketing variables, dynamic price and quality level, builds a multi-generation product diffusion model under the dual-brand competition, and analyzes the impact of the company's revenue on the launch time to market, pricing, quality or technical level. By using system dynamics (SD) method, From the perspective of strong brand and weak brand enterprises, the competition diffusion model is built and simulated. The simulation shows that: i) When enterprises have the same brand competitiveness, reducing the pricing level cannot obtain more revenue, but diminish the overall revenue of the industry; Raising the pricing level can get more revenue, but also improve the revenue of competitors. ii) When the competitive strength of enterprises is different, the strong brand tends to maintain a stable pricing on the basis of improving the quality level, or slightly raise the price. Weak brands tend to raise the pricing of new products significantly on the basis of improving the quality level. iii) The launch time to market decision of new product is influenced by the degree of product quality upgrade. Therefore, the frequency of releasing new products should trade-off against the degree of technological upgrading of product quality. This paper provides the theoretical basis and new insights for the new product launch and operation decision of enterprises.
Keywords:
multi-generation products diffusion
; quality improvement
; pricing
; launch time
; Norton-Bass model
; SD model
1. Introduction
With the acceleration of scientific and technological progress, the rapid variation and continuous upgrade of consumer demand, only single-generation products have been unable to meet consumers need, and more and more enterprises take the multi-generation products upgrade way to provide consumers with new products. Relevant study shows that the profits of multi-generation products launched by enterprises is 26% higher than that of multi-series single-generation products, and 40% higher than that of pure single-generation products [1]. Moreover, in a gradually saturated market, multi-generation product will also encourage consumers to make repeated purchases and improve the overall revenue of enterprises. For example, Apple, Xiaomi, Huawei in the mobile phone industry, as well as BYD and Tesla in the electric vehicle industry, these high-tech enterprises provide products and services for consumers through continuous multi-generation product upgrade of products, so as to promote sales and achieve sustainable development. In addition, in the operation process of multi-generation products upgrade, these enterprises also face to the impact of competitors on brand, pricing, quality and launch time to market, which makes the competitive environment of enterprises more complex and severe, and the increasing frequency of new products to market also reduce product innovation and manufacturing sustainability[3].Therefore, in the increasingly competitive business environment, how to systematically analyze the relationship between the brand, pricing, quality or technology upgrade of the product and the launch time to market, as well as how to plan the product comprehensively in the multi-generation products operation process, in order to obtain long-term competitive advantage and growth path, are the strategic decision-making problems that enterprises have to make and need to solve.
We aim to build diffusion model of multi-generation products in the context of dual-brand competition, and use system dynamics method to conduct experimental simulation of the model. In this paper, the marketing factors such as declining dynamic price and quality level are added. The influence of brand value spillover effect on diffusion process and pricing is emphatically discussed, as well as exploring the path of continuous product innovation and improvement.
2. Literature Review
2.1. Multi-generation diffusion
As for the multi-generation update of products, relevant scholars have conducted a large number of relevant studies [3-9]. Among them, the multi-generation upgrade of products can be divided into two ways: one is to completely replace the old products after the new products are launched, that is, to replace the single product; The second is that the new products gradually eliminate the old products until the sales of the old products drop to 0, that is, multi-generation coexistence. Among them, multi-generation coexistence is the most common, and this paper is also mainly to study the market coexistence of multi-generation products. At present, the extension modeling of new products diffusion based on Bass model and the characterization of consumer demand and purchase process is one of the main methods to study multi-generation product renewal. Based on the original classic Bass model[10], Norton and Bass relaxed and extended the assumed conditions, and built a Norton-Bass model of multi-generation products diffusion [4]. Later, many scholars continued to expand the Norton-Bass model. Jiangdeveloped the Generalized multi-generation diffusion model (GNB) based on the Norton-Bass model, analyzed the leapfrogging adoptions purchase and switching adoptions purchase behavior in the diffusion process, and proved the superiority of the model with empirical approach .Islamand IIonenhas studied the effect of sales of old products on the diffusion of new products, as well as on the diffusion of products related to multiple categories .Guoet al. segmented the market from the perspective of strategic consumers. Based on the Norton-Bass model, they analyzed the impact of price discount on consumers' purchase behavior between multi-generations of products and the impact of product performance on time to market. Based on the Norton-Bass model, With the deepening of the research, scholars have added the influence of brand competition factors on the basis of the competition between new and old products of many generations. Lei Ztook an empirical study of multigeneration product diffusion based on competition is carried out to describe the competitive complementary effect and competitive substitution effect in product diffusion. Buddhikaproposed a prediction method based on the Norton-Bass model for continuous multi-generation design to plan the sustainable performance of products .With the deepening of the research, scholars have added the influence of brand competition factors on the basis of the competition between new and old products of many generations[12-17]. Kimproposed a multigenerational diffusion model for homogeneous products and studies the effects of the diffusion of other categories of products on the product markets of concern. Libaibuilt a competitive diffusion model with both internal and cross-brand interactions, and analyzed the process of brand diffusion. Shibuilt a multi-brand and multi-generation diffusion model based on Norton-Bass model, and verified the effectiveness of the model with empirical methods.. Based on Bass model and multi-generation diffusion model, Aggrawaldiscussed how users transfer between different brands and verified the model with actual data. The above research analyzes the diffusion process under the influence of brand by combining brand factors with product diffusion model, and then builds a multi-generation diffusion model under brand competition environment.
2.2. Marketing factor in diffusion process
This paper studies brand’s pricing strategies in a pure duopoly competition environment. Because pricing is an effective tool to either prevent or alleviate the problem when high uncertainty in a new product introduction often leads to extreme cases of demand and supply mismatches[22].LiFexamines offensive pricing strategies in two platform competition ,this study find that WOM marketing can effectively affects the pricing strategies in the platform business.McGrath offers mainly three pricing strategies such as pricing leadership ,penetration pricing ,and experience-curve pricing [24].The experience curve pricing is a defense strategy for discouraging competition ,it is a downward price strategy ,which can drop to a quarter[25]. These works show that we can introduce price marketing into the brand product diffusion process, and discuss it during products update and new products launch. In the process of competition and diffusion of high-tech products, experience- curve pricing is a common price strategy.
In addition, some research processes of multi-generation products upgrade considers price and quality or technical factors. Generally speaking, product quality is the key to consumers choice of product, measure the degree of product upgrade, and also affect product pricing[26], therefore, in the spread of multi-generation product, quality factor must be considered. Some of them jointly optimized price and quality [27-29], and analyzed enterprises' quality and price competition strategies for different consumers by constructing consumer functions. Some scholars have introduced quality level as a key factor into the optimal decision-making problem of product renewal design, and determined the optimal quality upgrade level by constructing a non-competitive model in which new and old products coexist in competition and old products withdraw. With the in-depth research, it is found that quality or technical level has an important impact on the time to market of multi-generation products, and there should be a certain balance between the two [1]. Druehl C Tstudied the relationship with the launch time of update product and profit changes base on the Bass model ,and also explored update the optimal release time of the product .Fengused the game analysis framework to study the entry strategy of new entrants in the software-as-a-service market, and analyzed the impact of product quality on product’s launch time. Lobelproposed that when the company does not announce the future technology, it is optimal to release the new generation of products periodically with fixed technology upgrades, and when the technology is announced, it is optimal to release periodically with the size alternating technology upgrade. In addition, some scholars study the renewal and listing of multi-generation products from the perspective of production and marketing [33-36]. Kalyanaram etal[35]proposed that new products should be listed as soon as possible to improve competitive advantage. Grütznerpointed out that companies need to weigh the timing of product replacement. And Some scholars also pay attention to the consumer behavior in the process of products diffusion[9,37]. Junproposed a multigeneration product model that incorporates the diffusion effect selection effect and captures the substitution process between products. The above works mainly analyze and optimize pricing, launch time to market, quality or technology upgrade strategies from the construction of multi-generation product models and the process of product upgrade, or only discusses the diffusion of one-generation products under the brand competition environment, while there are still many deficiencies in the research on the two dimensions of multi-generation product renewal and brand competition environment. Few scholars pay attention to the relationship between quality level upgrade and launch time to market in the process of multi-generation product renewal under competitive conditions. There's also very little research reflects the important influence of quality or technology upgrade on multi-generation product diffusion, nor did it reflect the dynamic nature of price, nor did the study on the spillover value of brand competition go far enough.
Our main aim is to build a multi-generation diffusion model on the context of two-brand competition, explore the pricing of multi-generation products under different brand values and quality levels, and maximize the profit as the goal of simulation. and finally discuss the launch time to market. This paper puts forward the enterprise product operation path of "pricing -- quality upgrade -- launch" under brand competition, reveals the relationship between pricing, quality level upgrade and launch time to market, expands the multi-generation products diffusion theory, and provides theoretical basis and new insights for enterprises' new product launch and operation decision.
3. The model
3.1. The brand competition diffusion
Brand A and Brand B supply the substitutable products at the same time . We assume that brand A and B diffusion have no influence to each other. That is, in the same market, the diffusion of one brand and the diffusion of another brand are relatively independent, and the diffusion of brands does not promote or hinder each other .With reference to the brand competition model established by Savin and Libai [19], this paper mainly studies the competition at the brand level of products, without considering the cross-brand interaction, and we obtain the competitive diffusion model of double-brand A and B, as shown in equations (1) and (2) :
In the Norton-Bass model, the diffusion model between the two generations of products is as follows:
3.2. Separation of consumer behaviors under multi-generation diffusion
In Norton-Bass model, the diffusion process between the two generations of products is as follows:
Where Mi represents the potential market size, i=1,2, which represents the different generation products. In general, the potential market size of second-generation products is larger than the potential size of the first-generation market. Nji(t) represents the cumulative diffusion quantity of i generation products of brand j at time t, Sji(t) represents the sales quantity of i generation products of brand i at time t, j=A, B; i=1,2. Where, Nji(t) is the number of independent diffusion under Mi, and Sji(t) is the number of sales under the coexistence of multiple generations, that is, the number of sales under the influence of multiple generations of products.
When consumers buy multi-generation products, they will reflect different preferences and behaviors[39,40].Although multiple generation strategy is more profitable than introducing single product strategy, it can also result in inter-generation cannibalization[41]. Where sales of first-generation products are affected by the number of its skipping products, and sales of second-generation products are affected by two quantitative dimensions: skipping products of first-generation products and upgrade products of first-generation products.
Based on the Norton-Bass model and referring to Jiang[5], this paper separates the consumer behavior into two types, captures leapfrogging buyers and switching buyers or adoptions which is also called repeat buyers. The leapfrogging buyers represents the behavior of potential buyers or adopters skipping previous generation and directly buy a newer generation ;switching buyers or adopters represent some existing buyers of the immediate previous generation may also be willing to purchase new generation products. That describes the encroachable behaviors of the next generation of products over the previous generation.
As Jiangdescribes, the leapfrogging buyers or adoptions at time t can be expressed as :
And the switching buyers or adoptions at time t can be expressed as :
We bring competition diffusion of brand into the expression above, then the leapfrogging buyers or adoptions at time t of each brand are given by
We introduce the spillover effect coefficient of brand value and the influence coefficient of quality level and kji. Here, pji stands for innovation coefficient, which is also defined as advertising influence coefficient in some studies, and qji stands for imitation coefficient, which can also be called word-of-mouth influence coefficient. According to literature [5], this paper assumes that advertising coefficient is equal between the two generations of products, and WOM influence coefficient between the two generations of products is greater than that of the first generation . It is embedded in advertising coefficient and WOM impact coefficient respectively. represents the brand value spillover effect coefficient, used to represent the brand's competitive strength, j=A,B, where , we embedded the brand spillover effect coefficient into the innovation coefficient. βi represents the price sensitivity coefficient, j=A,B. which refers to the consumer's sensitivity to the price as a marketing factor, and it affects the diffusion speed of the product, and implies the impact of price on consumer demand to some extent. References [33,45] show that quality affects product sales through word of mouth, and enterprises with higher quality have a positive impact on the spread of word of mouth. kji stands for quality level, j=A,B; Because the quality level of the product is constantly upgraded, therefore, under the same brand, the quality level of the second generation of products must not be less than the quality level of the first generation of products .In reference [34,46], price is added to the brand diffusion model as a marketing variable, expressed as function, and βj represents price sensitivity coefficient. pji(t) represents the dynamic price, which is composed of the initial price pji(0) and the decline factor function R. In the process of multi-generation product upgrade, enterprises are making decisions on this initial price. In a competitive environment, companies of different brands generally release new products at the same time or similar. This is also in line with the phenomenon in the real world that new products from competing companies such as Apple, Samsung, Huawei and Xiaomi are released at the same time.In order to better reflect the characteristics of competition, this paper assumes that the launch time of products of different generations of the two brands will be synchronized, and the two companies will compete against a homogenized market group.
4. The system
Referring to the reasoning and calculation process of sales quantity in literature [5], this paper builds a systematic dynamic model of multi-generation diffusion of dual brands with the goal of maximizing the revenue of two generations of products. The model is established as follows:
In equations(12)–(13),where represents the two generations total revenue of each brand , j=A,B. r is the discount factor, we assume r=0.02, it's about equal to the interest rate of some banks.
In equations(14)-(15), They represent the sales volume of each brand's first-generation products at time t. By combining leapfrogging buyers or adoptions and switching buyers or adoptions into the first generation products diffusion process, we get the second generation-products dynamic sales process, such as equation (16)-(17)
In this system, R represents the rate of price change. This paper use experience curve pricing to describe the brand's pricing strategy, and assumes that the price is monotonically decreasing, but the price cannot fall all the time. Based on the reference that the price of Apple mobile phone products at the end of product sales is about 75%-80% of the initial price, down to about a quarter of the initial price [24], this paper sets the final decline price at 80% of the initial price until the product is completely withdrawn from the market. So we set . Referring to the research of literature [42-44], the price marketing variable is introduced into the Norton-Bass diffusion process. In view of the fact that price decline is a strategy often adopted in commercial activities, this paper adopts the method of price showing a dynamic path of monotone decline over time in literatures [8,42]. Suppose that , represents the initial price of the product to market, j=A,B,a nd R represents the price decline factor.

Table 1.
The interpretation and summary of notation.
| Notation | Interpretation |
|---|---|
| Mi | Total market size of each generation products |
| kji | The quality level of each j brand and i generation products |
| Brand value spillover effect coefficient | |
| Advertising coefficient of each j brand and i Generation products | |
| Word-of-mouth influence coefficient of each j brand and i generation products | |
| Each j brand of i generation product dynamic price (price changes) | |
| Nji(t) | The cumulative diffusion number of each j brand and i Generation products at time t |
| Sji(t) | The cumulative sales volume of each j brand and i Generation products at time t |
| πj | Total revenue of two generations of each brand j products |
| βj | Price sensitivity coefficient of each j brand |
| Second generation products launch time | |
| R | Diminishing price factor |
| r | Product income discount factor |
| T | Simulation termination time |
5. System dynamics simulation and experimentation
Since the parameters and variables involved in the model constructed in this paper are complex, the system dynamics (SD) method is very suitable for complex system modeling and simulation without focusing too much on mathematical forms. This paper mainly discusses the dynamic decision problem ,the system involves many variables and many parameters, and it is difficult to obtain the analytical closed solution. Therefore, we adopts system dynamics method to simulate the model, compare and discuss the problem of multi-generation product diffusion under dual-brand and multi-scenario, and make decision analysis on quality level, pricing and launch time to market.
The flow chart of SD model established is shown in Figure 1, where Ai represents the i generation products of brand A, Bi represents the j generation products of brand B, i=1,2.
According to the values assigned to Bass model parameters by data in literature [5,42], the other specific basic parameter settings of the model in this paper are shown in Table 2.
Assume that the total market size of the second-generation product is about 4 times that of the first-generation product market, the initial price setting is 1, similarly the brand value, quality level coefficient and innovation coefficient are also set to 1, indicating the same competitiveness of the two enterprises. The price decline rate of the two brands is the same, the price sensitivity coefficient is the same, and the imitation coefficient of the same-generation product is the same. It shows that the two companies are in the same market and facing the same consumer group. By changing the parameter assignment, the decision problems of the pricing level, quality level, brand value spillover effect and launch time to market are analyzed. Due to the constraints of production costs and other operating expenses, the price will not drop indefinitely. This paper assumes that when the dynamic price drops to a certain extent, it will not change before the product is withdrawn from the market.
5.1. Optimal pricing decision
5.1.1. In the case of equal brand competitive strength
Taking brand A for example, fixing brand B under the setting of basic parameters. Through simulation and calculation, the optimal pricing level and total income of brand A are as follows:
Before the optimization of brand A pricing, its total revenue is 10814887.927. After the revenue is optimized, the total revenue of brand A has achieved a small increase about 0.74%.
Although the pricing strategy of brand A improves its own revenue, it also promotes the increase of the total revenue of its competitor brand B. The total revenue of B increases to 11196931.813, and the total revenue increases by 3.53%. The simulation results are shown in Figure 2:
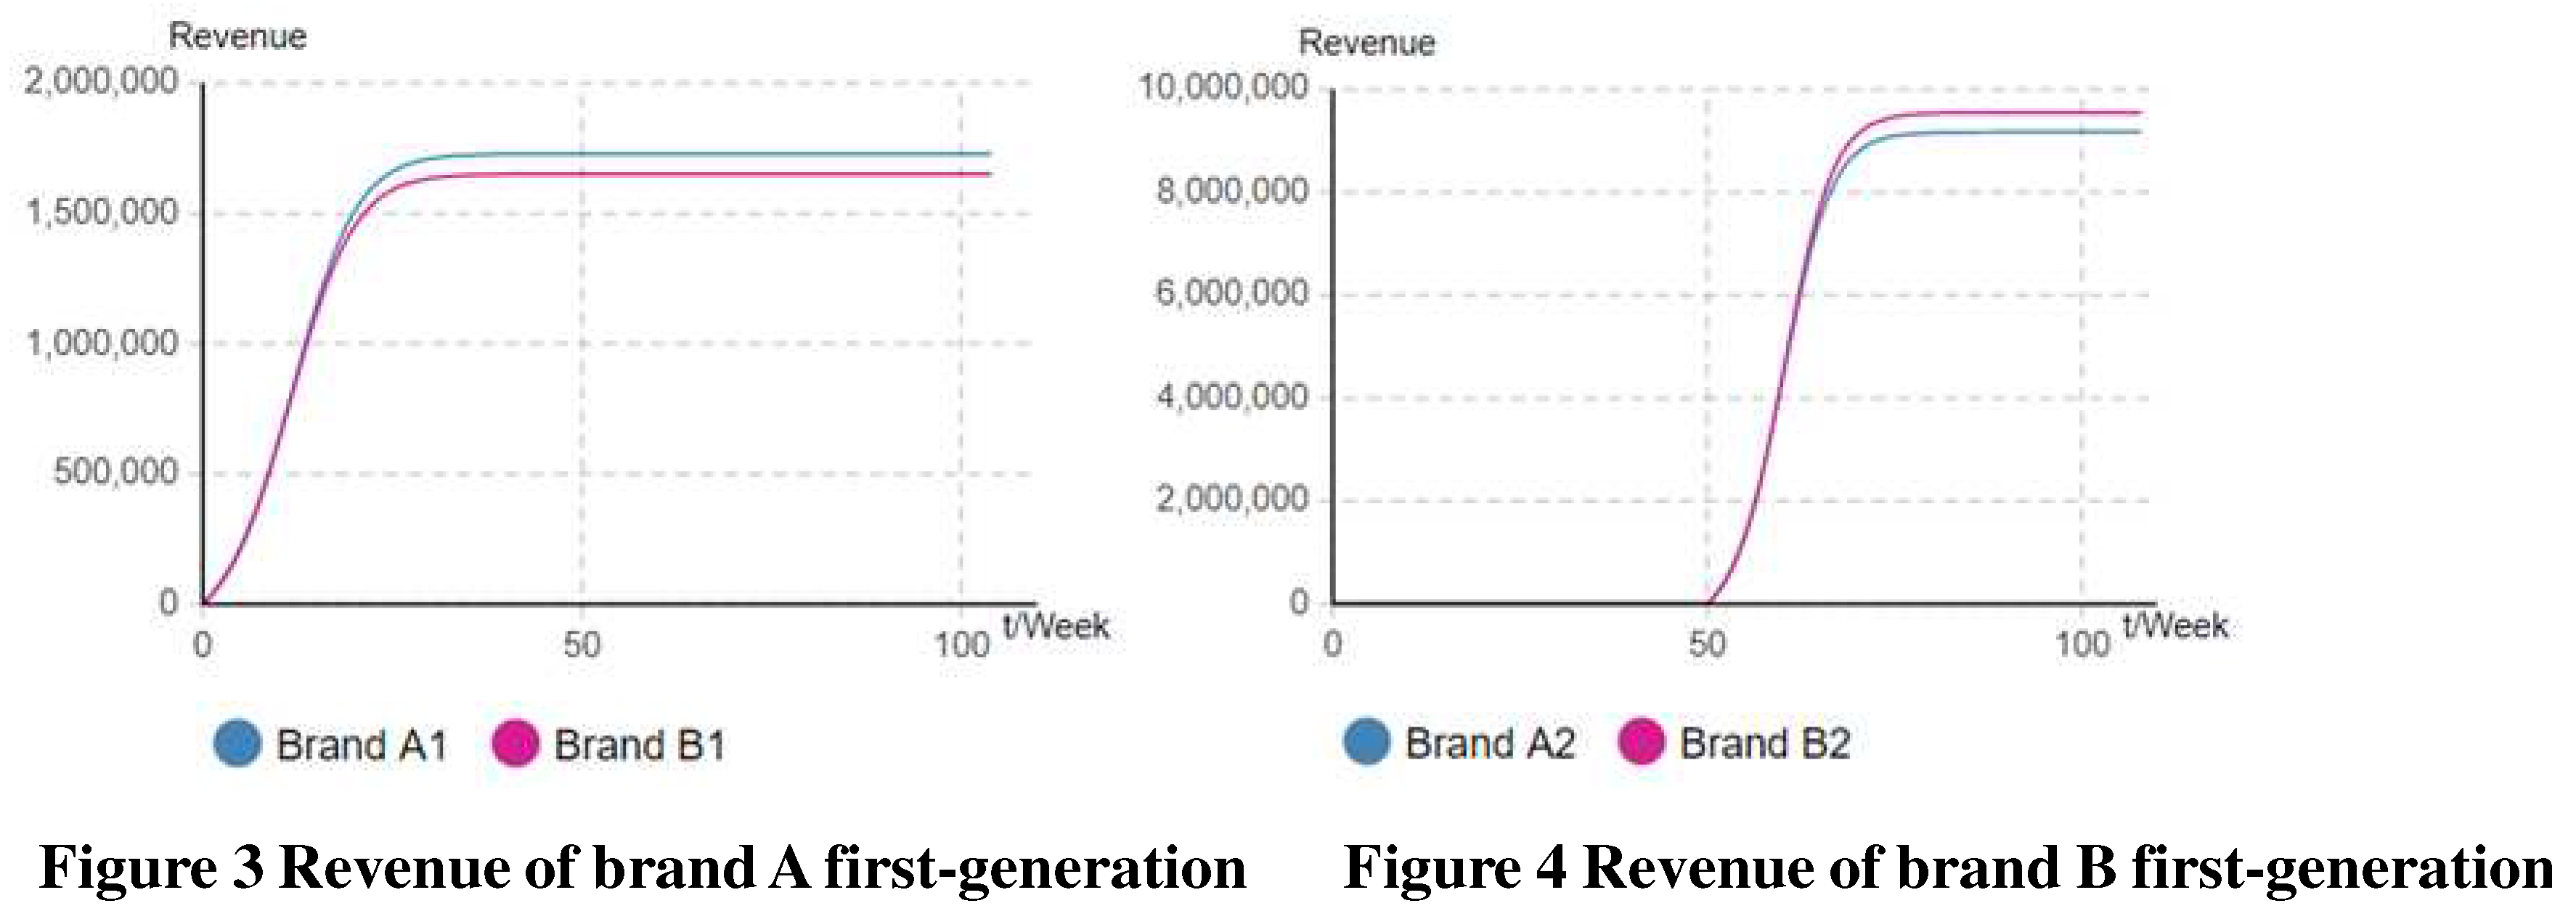
Even if brand A can improve its own earnings, it can not improve its competitive advantage, and even weaken its competitive advantage to some extent. Through the decomposition of the revenue of brand A and brand B, it is found that under the optimal price level, the revenue of brand A is greater than that of brand B in the diffusion stage of the first generation products; in the diffusion stage of the second generation of products, the revenue of brand A is lower than that of brand B because brand A raises the price of new products. As a result, the total revenue of the two generations of brand A is lower than that of brand B. The revenue decomposition results are shown in Figures 3 and 4
As show in Figure 3, under the optimal price, the income of the first-generation products of brand A is greater than that of the first-generation products of brand B. Figure 4 shows that the revenue of the second-generation products of brand A is smaller than that of the second-generation products of brand B, and the revenue of the two generations of products is superimposed, resulting in the total revenue of brand A after price adjustment is smaller than that of brand B. It can be seen that when the competitive strength of the brand is equal, the key to affecting the corporate revenue is the price. In this case, the pricing reduction will make the company gain more revenue than the competitor, and the pricing increase will make the company gain less income than the competitor, and the enterprise is easy to fall into the competition of "price war". The enterprise mainly implements the low-pricing strategy to obtain relatively more income than the competitor, but the total revenue is faced with the risk of decline, which makes the loss of both competitors.
The following is the comparative experiment, which shows that the impact of the pricing level of two generations of brand A on the different brands’ revenue. It is assumed that due to cost constraints, the initial pricing level should not be too low, at least 50% of the competitor's pricing. The simulation calculation results are as follows:
From the above simulation results, it can be concluded that compared with the benchmark initial price of value 1, the optimal initial price reduces the revenue of both brands. Compared with brand A, the revenue of rival brand B decreases by a larger margin. The experiment continues to reduce the price of the two generations of products. Through comparison, it is found that the revenue of the two generations of A and B products continues to decline, and the revenue of brand B is still greater than that of brand A. However, the high pricing may make the company gain revenue, but the competitor gains more revenue. For example, in Figure 5 and Figure 6, when pA1 and pA2 are equal to 1.2 and 1.1 respectively, brand A's revenue of the two generations of products has improved, while the competitor's revenue of brand B has increased by a larger margin, and the increase in price may lead to a significant decline in revenue. For example, when pA1 and pA2 are equal to 1.6, the revenue of the two generations of brand A has declined, but the revenue of brand B has increased significantly. Through the above simulation experiment, the following conclusions can be drawn:
Summary 1: When the strength of each enterprise is equal, lowering the pricing will not necessarily make the enterprise revenue, but will cause the competitor to lose more revenue, which can play the effect of "hurting the enemy 1,000, self-loss 800", resulting in the decline of the overall revenue of the industry.
Summary 2: When the strength of each firm is equal, raising the price may increase or decrease its own revenue, but the competitor can always benefit and get more revenue.
Therefore, in the case of equal competitive strength, the pricing decision of the enterprise is affected by the pricing decision of the competitor, and it should make a reasonable decision to raise or lower the price according to the pricing level of the competitor and its own decision-making purpose.
5.1.2. In the case of unequal brand competitive strength
When the spillover effects of brand value are unequal, assume that A is A strong brand and the brand spillover value effect is 3, and B is a weak brand and the brand spillover value effect is 1, that is, the influence of brand A is 3 times that of brand B. In the experiment, the parameters of brand B are fixed. Through simulation calculation, the optimal pricing and revenue results are as follows:
It can be seen that in the case of unequal brand spillover value, through optimizing the pricing level of brand A and comparing with the benchmark model, it is found that the pricing and total revenue of the two generations of products have been significantly improved, and the revenue has increased by 89.9%, while the revenue of brand B is 8555889.585, and the revenue has decreased by about 20.9% compared with the benchmark model, as shown in Figure 7 below. Due to the more spillover effect of brand value, the total revenue of brand A is much greater than that of brand B.
Before the price optimization, the income of brand A is 17934512.734, and that of brand B is 5471369.187. Compared with the benchmark model, the revenue of brand A increases by 65.8%, and the revenue of brand B decreases by about 49.4%. After the pricing optimization, the revenue of brand A increased by about 14.5% on the original basis, while the revenue of brand B increased by about 56.4% on the original basis. It can be seen that only the pricing of brand A is optimized, and the pricing after optimization is higher than the benchmark pricing, which not only improves its own profit, but also improves the profit of its competitor B, and the competitor has a larger increase.
Summary 3: Under the brand spillover effect, raising prices can increase the total revenue of enterprises on the original basis, and the revenue of competitors will also increase, and the growth range may be larger.
The following is a comparative experiment on the impact of different pricing levels on the revenue of different brands at different stages under the brand spillover effect, and the results are shown in Figure 8 and Figure 9.
From the simulation above, it can also be seen that when brand A lowers the initial price, its own revenue will decline and that of competitor B will also decline, resulting in A decline in the overall industry revenue, but the loss caused by pricing reduction will be more than that of competitor B. For example, when the initial price of brand A's first-generation and second-generation products is 0.7 and 0.5, respectively. Generation product revenue decreased by 22.4% and 41.3%, respectively, and second-generation product revenue decreased by 22.1% and 41.2%. Brand B generation product revenue decreased 21.8% and 33.8%, and the second- generation products revenue decreased 24.7% and 37.8%. The low level of pricing of brand A reduces the overall revenue. Raising the pricing level of brand A can increase or decrease the revenue of this product, but it will always bring more revenue to competitors. For example, when the initial price of brand A and Generation 2 is 2.0, the revenue of each generation will increase, and the revenue of brand B will also increase significantly. When the initial price of brand A and Generation 2 is 2.5, the revenue of brand A will decrease. However, the revenue of brand B increased significantly, which verified Summary 2.
Summary 4: In the case of unequal brand value spillover, the revenue loss caused by price reduction of strong brands is more than that of weak brands. Lowering the pricing level reduces the overall revenue of the industry.
Summary 5: In the case of unequal brand value spillover, the strong brand has a larger space to raise its price, and raising its price may increase or decrease the total revenue, but it is always beneficial to competitors.
From the above summaries, in the face of complex competitive environment, enterprises should avoid making too low competitive pricing strategy, so as not to fall into the "price war" situation, resulting in the overall loss of the industry. This result is similar to reference [23], when new products can be introduced continuously so that competing companies cannot get more revenue by tightening up market prices. Among them, strong brand enterprises should try to avoid setting low prices to reduce the loss caused by brand spillover value, but also avoid raising prices significantly, resulting in greater revenue for competitors. In the face of complex competitive environment, they should carefully adjust pricing. The weak brand enterprises should avoid setting a high level of initial prices, so as not to push up the revenue of the strong brand, thus expanding the disadvantages against to the weak brand.
5.2. Influence of quality level
As this paper studies the pricing of multi-generation products under competitive environment, the quality level of each generation of products is divided into various situations, and the relationship between generations is also diverse. Therefore, this part adopts the scenario analysis method to calculating and analyze the optimal pricing level under different quality and technology levels.
We assume that the quality of the second-generation products of each brand will not be lower than the quality level of the first-generation products, that is, in the case of product quality improvement and upgrade. In the case of equal brand spillover effect, it is assumed that the quality level of each generation is equal, that is, kA1= kB1=1 and kA2=kB2=2.
Through simulation of the model, the optimal price and income are obtained as follows:
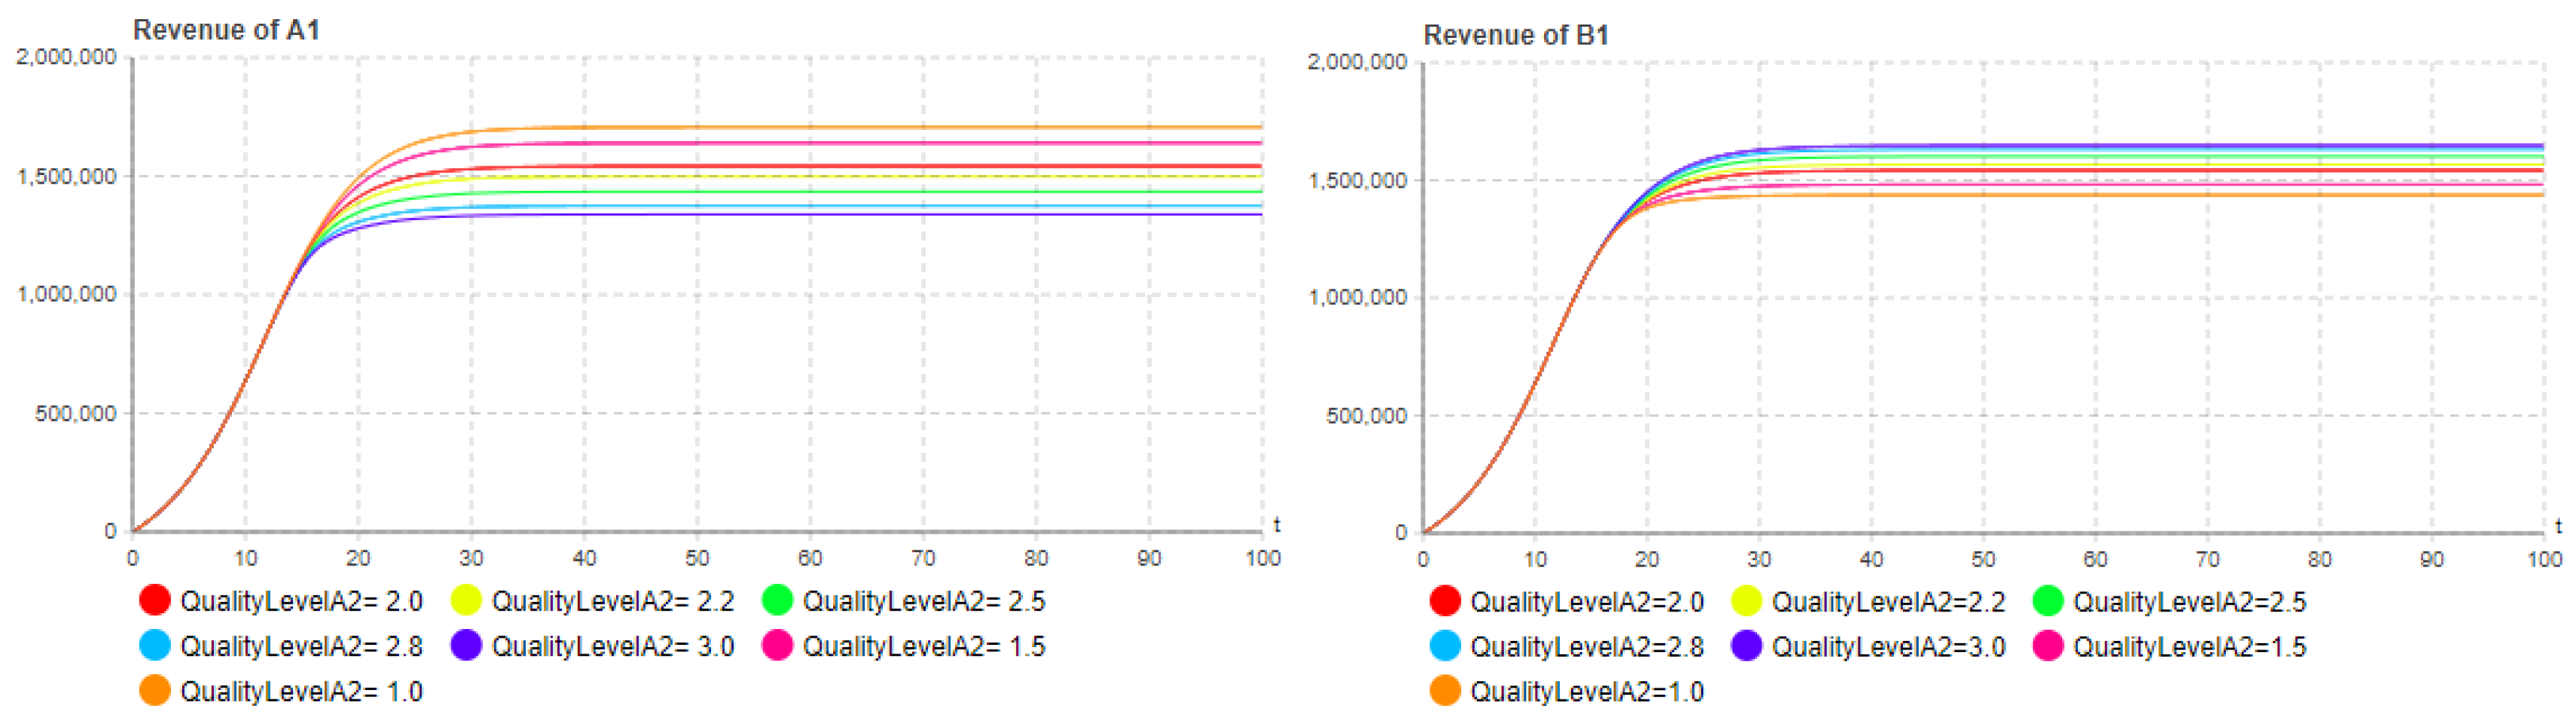
Now the pricing of brand B is fixed, so that the pricing of brand A is under the optimal price. Through the comparison of two groups of experiments, the quality level of each generation of brand A is adjusted, and it is found that the quality level has a significant impact on the revenue of each generation of products. By improving the quality level of each generation, the product revenue of each generation can be increased, and the revenue of competitors' products can be reduced while the product revenue is increased. As shown in Figure 10 and 11:
The influence of the adjustment of the quality or technical level of each generation on the adjacent generations of the product changes in the opposite direction with the launch time of listing. As shown in FIG 12, at t=50, the previous generation product will have an impact on the revenue of the new product, while the influence of the quality or technology level of the new product on the revenue of the previous product can almost be ignored. This is because the launch time of new products is at the end of the decline of previous generation products, the proportion of skipping users is very small, reducing the encroachment on the market share of old products, and with the advance of the launch time, it is found that the impact of new products on the revenue of previous generation products gradually appears, because the advance of the launch time increases the encroachment of new products on the market share of previous generation products, and then reduces the revenue of previous generation products.
Figure 12.
Influence of first-generation product quality of brand A.
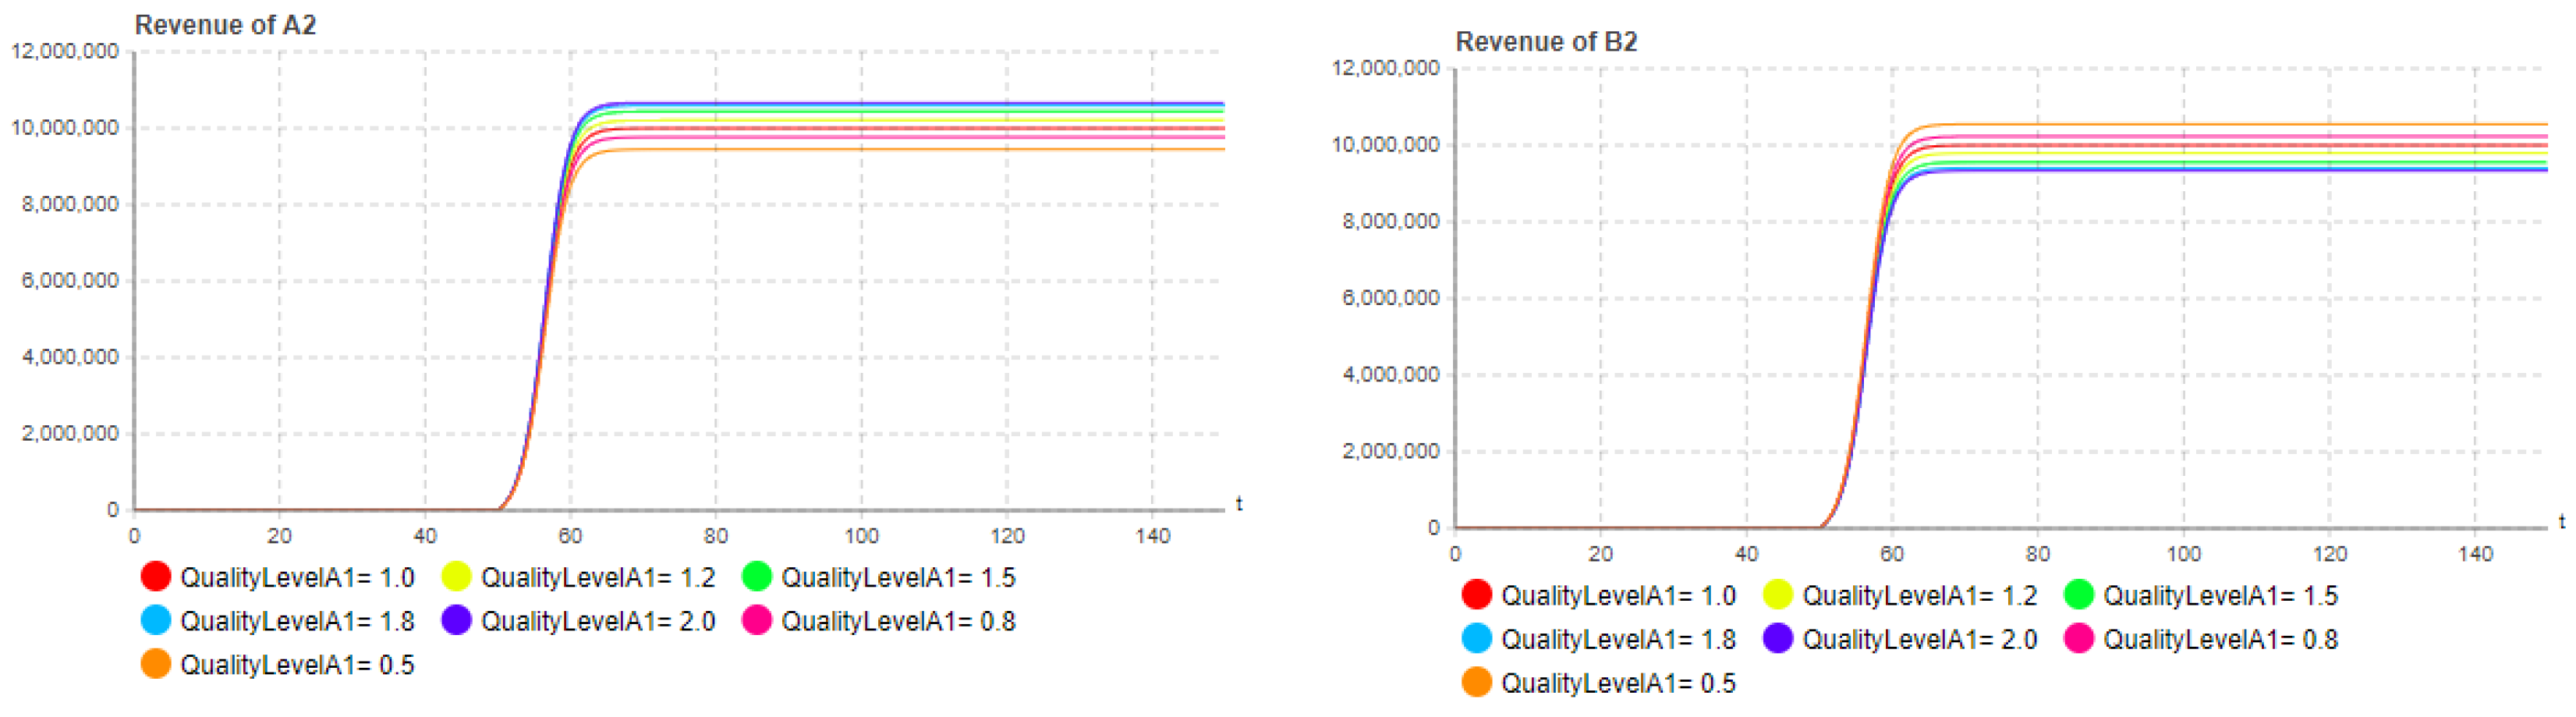
As shown in FIG 13, when the time to market is adjusted to t=10, by adjusting the quality level A1, we find that when the launch time to market is greatly advanced, the higher the quality level of the new product, the more the product revenue level of the previous generation product will decline, while the revenue of the previous generation products of competitors will increase. This is because the improvement of the quality level of new products will slow the diffusion rate of competitors' new products, which will lead to the "cannibalization" of competitors' previous generation products. However, the pricing level at this time cannot maximize the revenue of brand A. The revenue of brand A is 11555236.786. When kA2=2.2, the total revenue increases to 1300,9325.82. By adjusting the quality technical level, the profit can be greatly improved, and the optimal price at this time is calculated as pA1=0.71, pA2=1.072, and the revenue is 13107736.724. After the price level adjustment, the revenue of the competitor B is also increased from 9881453.212 to 10378745.104. At this time, after quality level adjustment, the enterprise can reduce the revenue of its competitors while reducing its own income, and maintaining the original price cannot maximize the income of its own side, but it cannot increase the revenue of competitors. For example, if kA2 is adjusted to 2.2, and then the pricing is adjusted to the optimal level, brand A will increase its revenue by 0.76% on the basis of the original adjustment of quality and technology level, and the competitor's revenue will increase by 5%.
Figure 13.
Influence of second-generation product quality of brand A.
Summary 6: In the listing process of new products, enterprises will weigh the listing time according to the upgrade of quality level, or control the upgrade degree of quality level in order to maintain a certain time listing frequency.
Generally speaking, the earlier you enter the market, the more market you will occupy . but summary 6 of this paper shows that although the earlier you enter the market can occupy more market share, it does not necessarily increase the revenue of the product, or even eat more market share of the previous generation product due to the high quality of the product, resulting in the loss of the total revenue.
Summary 7: Improving the quality level can effectively improve the revenue of each generation of products. Even if the pricing strategy is constant or stable, the revenue of products can be upgraded by improving the quality level, the improvement of quality level can improve product revenue.
Based on the different relationships between brands, when the product quality level of brand A is no less than that of brand B of the same generation, six quality level scenarios are designed to optimize the pricing of brand A respectively. The simulation results are summarized in Table 3:
As can be seen from the results in Table 3, under different quality levels, the spillover effect of brand value can increase the overall revenue of the brand by significantly increasing the pricing of new and previous generation products, and the revenue is relatively stable, reflecting the brand premium of the enterprise's products.
Scenario 2 is more in line with the competition status of enterprises in reality. Brand B is in a weak position in terms of brand value spillover and quality level, and keeps catching up with brand A. Through simulation, it is found that the optimal pricing of the two generations of brand A is basically at the same level, maintaining a certain price stability.
The above results are based on the simulation calculation of the system from the perspective of brand A. The following is the simulation experiment of the system from the perspective of brand B. The pricing level of brand B is also optimized under six scenarios, and the simulation results are obtained as shown in Table 4.
As can be seen from the results in Table 4, an enterprise with a weak brand will lose brand value no matter whether its quality level is upgraded or not, and it will not bring more benefits despite setting a low pricing level. For example, in scenario (8) and (11), although brand B achieves the optimal revenue after raising its pricing, its revenue still decreases when compared with the equivalent brand strength. Weak brand enterprises whose quality level is always lagging behind should maximize their own benefits by raising pricing, even if so, the benefits will be further reduced, and they cannot make up for the loss caused by the spillover effect of brand value.
5.3. Launch time decision
5.3.1. Launch time decision under equal brand value spillover scenario
Under the base model, the impact of changing the launch time to market on leapfrogging adoptions, switching adoptions and revenue is studied. The simulation results are shown in the figure below:
Figure 14 shows that in the condition of equal competitive strength, the launch time to market has an important impact on brand revenue, leapfrogging buyers or adoptions and switching buyers or adoptions. Under the benchmark model, the early launch of new products will erode the market of the previous generation of old products, and weaken the upgrade of the users of the first generation of products to the second generation of products, and the revenue will also decrease. At the same time of competitive strength, in anticipation of rivals will be synchronized with their own new products, the company will not be listed too much earlier, which will not only cause a cannibalizing effect on the previous generation of old products, but also reduce their own earnings, resulting in the industry's overall revenue loss. Enterprises generally choose to withdraw from new products at the end of the sales of the previous generation of products to minimize leapfrogging buyers or adoptions, to increase switching buyers or adoptions and maximize revenue.
5.3.1. Launch time decision under unequal brand value spillover scenario
In the case of spillover effect of brand value, brand strength is no longer equal. By changing the launch time of second-generation products, the impact on leapfrogging buyers, switching buyers and revenue of each brand is obtained. Set the launch time to market distribution within the range of [0,100], and the simulation results are shown in Figure 15:
Figure15 shows the relationship between the launch time to market and the leapfrogging buyers, switching buyers and total revenue of each brand in the case of unequal competitive strength. By solving the time to market of brand A, it is found that the optimal time to market of brand A is t=84.6, while the optimal launch time to market of brand B is t=70.3. Strong brands want new products to go on the market a little later, and weak brands want to go on the market earlier. As can be seen from the figure, the impact of early listing on the revenue of brand A is slightly greater than that of brand B, especially when the listing time is advanced to around 20 to 30, the revenue of brand A changes greatly.
5.3.2. Launch time to market decision under quality upgrade scenario
In the benchmark model, the scenario of the quality upgrade of the second-generation product to the first-generation product is not considered. Under the quality upgrade situation, the impact of time to market on leapfrogging buyers, switching buyers and the revenue of each brand is discussed below. Under the benchmark model, setting kA1= kB1=1,kA2=kB2=2, indicating that the second-generation product is upgraded, so that the quality level of the new product is twice the quality level of the old product. The simulation results are shown in Figure 16:
Under the quality upgrade scenario, the number of leapfrogging adoptions is further increased, the " cannibalization " of the first-generation products is strengthened, the number of users upgrade to the second-generation is weakened, and the early listing has a relatively large impact on brand revenue. For example, when t=10 and t=20, the revenue of each brand is 11494338.921 and 11755864.774 respectively. If the enterprise is listed at t=20, the revenue will increase by 22.8% compared with that at t=10. In the benchmark model, the revenue is, 10642639.005 and 10793582.461, the company listed at t=20, the revenue will be 14.2% higher than that at t=10. Different quality upgrade levels have different impacts on the launch time to market of enterprises. Therefore, the launch time to market of products can be traded off according to the degree of quality upgrade, which is consistent with the research results in literature [36,47-48]. In the case of the simultaneous listing of various brands, if the expected quality upgrade is higher than that of competitors, the launch time can be appropriately delayed. The research conclusions of this paper and those of previous studies clarify the relationship between the degree of quality upgrade and the time to market, and this paper gives an explanation from the perspective of market "cannibalization" and "upgrade".
Summary 8: The early launch time of the product will have a negative impact on the brand revenues, enhance the cannibalization effect of the previous generation product market, and weaken the revenue of product upgrade; In the situation of upgrading the quality level, the above phenomenon will be strengthened.
6. Conclusions
In this paper, the diffusion process of multi-generation products model is built and simulated in the competitive situation, and the influence factors such as brand value spillover effect, dynamic price and quality level are introduced. Through simulation calculation, the influence of pricing, quality level and launch time to market on brand revenue are analyzed, as well as the substitution effect between new and previous generation products on enterprise revenue, and eight relevant important Summaries are drawn.
This paper draws the following management enlightenment: i) In the context of brand competition, the way to obtain high revenues is not to obtain more through lower pricing competition or higher pricing after quality upgrade. In the process of multi-generation products, the key to price level decision is brand competitiveness whether it is stronger. ii) Strong brands can set a higher level of pricing, and then try to maintain a stable price strategy or slightly increase the price in the process of quality upgrade of multi-generation products in order to obtain higher brand value benefits, and with the learning effect, the development costs will continue to decline[2], so more profits will be obtained. However, weak brands set a lower pricing level in the early stage, and appropriately raise the pricing level with continuous quality upgrade and brand competitiveness improvement. After obtaining a relative brand premium, they should try to maintain price stability and improve the brand strength ability through continuous quality upgrade. iii) The launch time to market decision of new products is influenced by the level of quality upgrade of new products, and the frequency of releasing new products should be traded off against the degree of product quality upgrade. From the perspective of the diffusion of brand competition. This paper provides theoretical support and decision-making basis for enterprises to continuously promote product quality or technical level upgrade, and also offers sustainable improvement under the stable price strategy.
This paper mainly studies the diffusion of multi-generation products in the context of brand competition. Instead of considering the user's certain loyalty to the brand and the conversion cost between brands, it only considers the competition between products of the same generation between brands. In the future, we can consider the conversion between different brands, that is, the multi-generation product competition between different brands. In fact, the mutual transfer or betrayal of users to the brand is a very common phenomenon, and it is necessary to carry out a more detailed division of user behavior. By modeling individual behavior[49], combined with the multi-generation diffusion model constructed in this paper, to simulate and calculate which will be a good research direction in the future. The model constructed in this paper only covers the leapfrogging effect of new products on the market share of previous generation products, and does not separate the substitution effect of previous generation products on the market share of new product, Future research will reflect this kind of consumer behavior.
Acknowledgments
The research was supported and funded by the National Natural Science Foundation of China, China (No. 72172025, 71772033, 72101051); Humanities and Social Sciences Foundation of the Ministry of Education of China (No. 21YJAZH130);.
References
- Leslie Olin Morgan, Ruskin M. Morgan, William L. Moore.Quality and Time-to-Market Trade-offs when There Are Multiple Product Generations. [J]. Manufacturing & Service Operations Management, 2001, 3, 89–104. [Google Scholar]
- Liao S, Seifert R W. On the optimal frequency of multiple generation product introductions[J]. European Journal of Operational Research, 2015, 245, 805–814. [Google Scholar] [CrossRef]
- 3. Hapuwatte B M , Badurdeen F , Bagh A ,et al.Optimizing sustainability performance through component commonality for multi-generational products[J]. Resources, Conservation and Recycling 2022, 180, 105999. [CrossRef]
- John, A. Norton, Frank M. Bass.A Diffusion Theory Model of Adoption and Substitution for Successive Generations of High-Technology Products. [J]. Management Science, 1987, 33, 1069–1086. [Google Scholar]
- Zhengrui Jiang, Dipak C. Jain.A Generalized Norton–Bass Model for Multigeneration Diffusion. [J]. Management Science, 2012, 58, 1887–1897. [Google Scholar] [CrossRef]
- Islam T, Fiebig D G. Modelling the development of supply-restricted telecommunications markets[J]. Journal of Forecasting, 2001, 20, 249–264. [Google Scholar] [CrossRef]
- Ilonen J, Kamarainen J K, Puumalainen K, et al. Toward automatic forecasts for diffusion of innovations[J]. Technological Forecasting and Social Change, 2006, 73, 182–198. [Google Scholar] [CrossRef]
- Guo Z, Chen J. Multigeneration Product Diffusion in the Presence of Strategic Consumers[J]. Information Systems Research, 2018, 29, 206–224. [Google Scholar] [CrossRef]
- Jun D B, Park Y S. A Choice-Based Diffusion Model for Multiple Generations of Products[J]. Technological Forecasting & Social Change, 1999, 61, 45–58. [Google Scholar]
- Frank, M. Bass, (1969) A New Product Growth for Model Consumer Durables. Management Science 15, 215-227.
- 11. Lei Z, Yi-jun L, Wen-guo A. Research on Diffusion Mode of Chinese Mobile Communication Products[C]//2007 International Conference on Management Science and Engineering. IEEE, 2007: 2034-2039. 2.
- Laciana C E, Gual G, Kalmus D, et al. Diffusion of two brands in competition: Cross-brand effect[J]. Physica A: Statistical Mechanics and its Applications, 2014, 413, 104–115.
- Nikolopoulos K, Buxton S, Khammash M,et al. Forecasting branded and generic pharmaceuticals[J].International Journal of Forecasting, 2016, 32, 344–357.
- Krishnan TV,PB" Seethu,Seetharaman,et al. The multiple roles of interpersonal communication in new product growth[J].International Journal of Research in Marketing, 2012, 29, 292–305.
- Guseo R, Mortarino C. Within-brand and cross-brand word-of-mouth for sequential multi-innovation diffusions[J]. Ima Journal of Management Mathematics, 2014, 25, 287–311. [Google Scholar]
- Krishnan T V, Kumar F M B. Impact of a Late Entrant on the Diffusion of a New Product/Service[J]. Journal of Marketing Research, 2000, 37, 269–278. [Google Scholar] [CrossRef]
- Mahajan V, Sharma S, Buzzell R D. Assessing the impact of competitive entry on market expansion and incumbent sales[J]. Journal of marketing, 1993, 57, 39–52. [Google Scholar] [CrossRef]
- Kim N, Chang D R, Shocker A D. Modeling intercategory and generational dynamics for a growing information technology industry[J]. Management Science, 2000, 46, 496–51. [Google Scholar] [CrossRef]
- Libai B, Muller E, Peres R. The Role of Within-Brand and Cross-Brand Communications in Competitive Growth[J]. Journal of Marketing, 2009, 73, 19–34. [Google Scholar] [CrossRef]
- Xiaohui Shi, Pattarin Chumnumpan.Modelling market dynamics of multi-brand and multi-generational products,European Journal of Operational Research,Volume 279, Issue 1,2019,Pages 199-210.
- Aggrawal D, Anand A, Bansal G, et al. Modelling product lines diffusion: a framework incorporating competitive brands for sustainable innovations[J]. Operations Management Research, 2022:1-13.
- Li H,Graves S C. Pricing Decisions During Inter-Generational Product Transition[J].Production & Operations Management, 2012, 21, 14–28.
- Li F, Du T C, Wei Y. Offensive pricing strategies for online platforms[J]. International Journal of Production Economics, 2019, 216, 287–304. [Google Scholar] [CrossRef]
- Mcgrath M E.Product strategy for high-technology companies[J].McGraw-Hill, 1995.
- Henderson,B,D,1973.The experience curve-reviewed II:history.Available at: https://www.bcg.com/search?q=+The+experience+curve+%E2%80%93+reviewed+II%3A+history+.
- Bock S , Puetz M .Implementing Value Engineering based on a multidimensional quality-oriented control calculus within a Target Costing and Target Pricing approach[J].International Journal of Production Economics, 2017, 183(PT.A):146-158.
- Li H, Webster S, Yu G. Product Design Under Multinomial Logit Choices: Optimization of Quality and Prices in an Evolving Product Line[J]. Manufacturing & Service Operations Management, 2020, 22, 1011–1025. [Google Scholar]
- Bala R, Carr S. Pricing Software Upgrades: The Role of Product Improvement and User Costs[J]. Production and Operations Management, 2009, 18, 560–580. [Google Scholar] [CrossRef]
- Kim H J, Jee S J, Sohn S Y. Cost–benefit model for multi-generational high-technology products to compare sequential innovation strategy with quality strategy[J]. PloS one, 2021, 16, e0249124. [Google Scholar]
- Druehl C T, Schmidt G M, Souza G C. The optimal pace of product updates[J]. European Journal of Operational Research, 2009, 192, 621–633. [Google Scholar] [CrossRef]
- Feng H, Jiang Z, Liu D. Quality, pricing, and release time: Optimal market entry strategy for new software-as-a-service vendors[J]. MIS Quarterly, 2017, 42, 333–353. [Google Scholar]
- Lobel I, Patel J, Vulcano G, et al. Optimizing Product Launches in the Presence of Strategic Consumers[J]. Management Science, 2016, 62, 1778–1799. [Google Scholar] [CrossRef]
- 33. Negahban A , Smith J S . Optimal production-sales policies and entry time for successive generations of new products[J]. International Journal of Production Economics 2018, 199, 220–232. [CrossRef]
- Wenjing Shen, Izak Duenyas, Roman Kapuscinski. Optimal Pricing, Production, and Inventory for New Product Diffusion Under Supply Constraints[J]. Manufacturing & Service Operations Management, 2014, 16, 28–45. [Google Scholar]
- Kalyanaram G, Robinson W T, Urban G L. Order of Market Entry: Established Empirical Generalizations, Emerging Empirical Generalizations, and Future Research[J]. Marketing Science, 1995, 14, 212–212. [Google Scholar] [CrossRef]
- Grützner T, Schnider C, Zollinger D, et al. Reducing time to market by innovative development and production strategies[J]. Chemical Engineering & Technology, 2016, 39, 1835–1844. [Google Scholar]
- McKie E C, Ferguson M E, Galbreth M R, et al. How do consumers choose between multiple product generations and conditions? An empirical study of iPad sales on eBay[J]. Production and Operations Management 2018, 27, 1574–1594. [Google Scholar] [CrossRef]
- Savin S, Terwiesch C. Optimal product launch times in a duopoly: Balancing life-cycle revenues with product cost[J]. Operations Research, 2005, 53, 26–47.
- Ke T T, Shen Z J M, Li S. How inventory cost influences introduction timing of product line extensions[J]. Production and Operations Management, 2013, 22, 1214–1231.
- McKie E C, Ferguson M E, Galbreth M R, et al. How do consumers choose between multiple product generations and conditions? An empirical study of iPad sales on eBay[J]. Production and Operations Management, 2018, 27, 1574–1594. [Google Scholar] [CrossRef]
- Kilicay-Ergin N ,Chun-yuLin, Okudan G E ,et al. Analysis of dynamic pricing scenarios for multiple-generation product line [J]. Journal of Systems Science and Systems Engineering 2015, 1861-9576.
- Frank, M. Bass, Dipak C. Jain.Optimal Pricing Strategy for New Products. Management Science[J]. 1999, 45, 1650–1663. [Google Scholar]
- Cosguner K, Seetharaman S. Dynamic Pricing for New Products Using a Utility-Based Generalization of the Bass Diffusion Model l[J]. Management Science, 2022, 68, 1904–1922. [Google Scholar] [CrossRef]
- Speece, M. W, MacLachlan, et al. Forecasting fluid milk package type with a multigeneration new product diffusion model[J]. Engineering Management, IEEE Transactions on, 1992, 39, 169–175. [Google Scholar] [CrossRef]
- Fouad, El, Ouardighi, et al. Advertising and Quality-Dependent Word-of-Mouth in a Contagion Sales Model[J]. Journal of Optimization Theory and Applications, 2016, 170, 323–342. [Google Scholar] [CrossRef]
- Danaher P J, Hardie B G S, Putsis W P. Marketing-Mix Variables and the Diffusion of Successive Generations of a Technological Innovation[J]. Journal of Marketing Research, 2001, 38, 501–514. [Google Scholar] [CrossRef]
- Pedram M, Balachander S. Increasing Quality Sequence: When Is It an Optimal Product Introduction Strategy? [J]. Management Science, 2015, 61, 2487–2494.
- 48. Peng S , Li B , Hou P . Optimal Upgrading Strategy for the Quality, Release Time, and Pricing for Software Vendor[J]. IEEE Transactions on Engineering Management, 2021, PP(99):1-1.
- Zhang J, Dong L, Ji T. The Diffusion of Competitive Platform-Based Products with Network Effects[J]. Sustainability, 2023, 15, 8845. [Google Scholar] [CrossRef]
Figure 1.
Multi-generation diffusion model of brand competition.
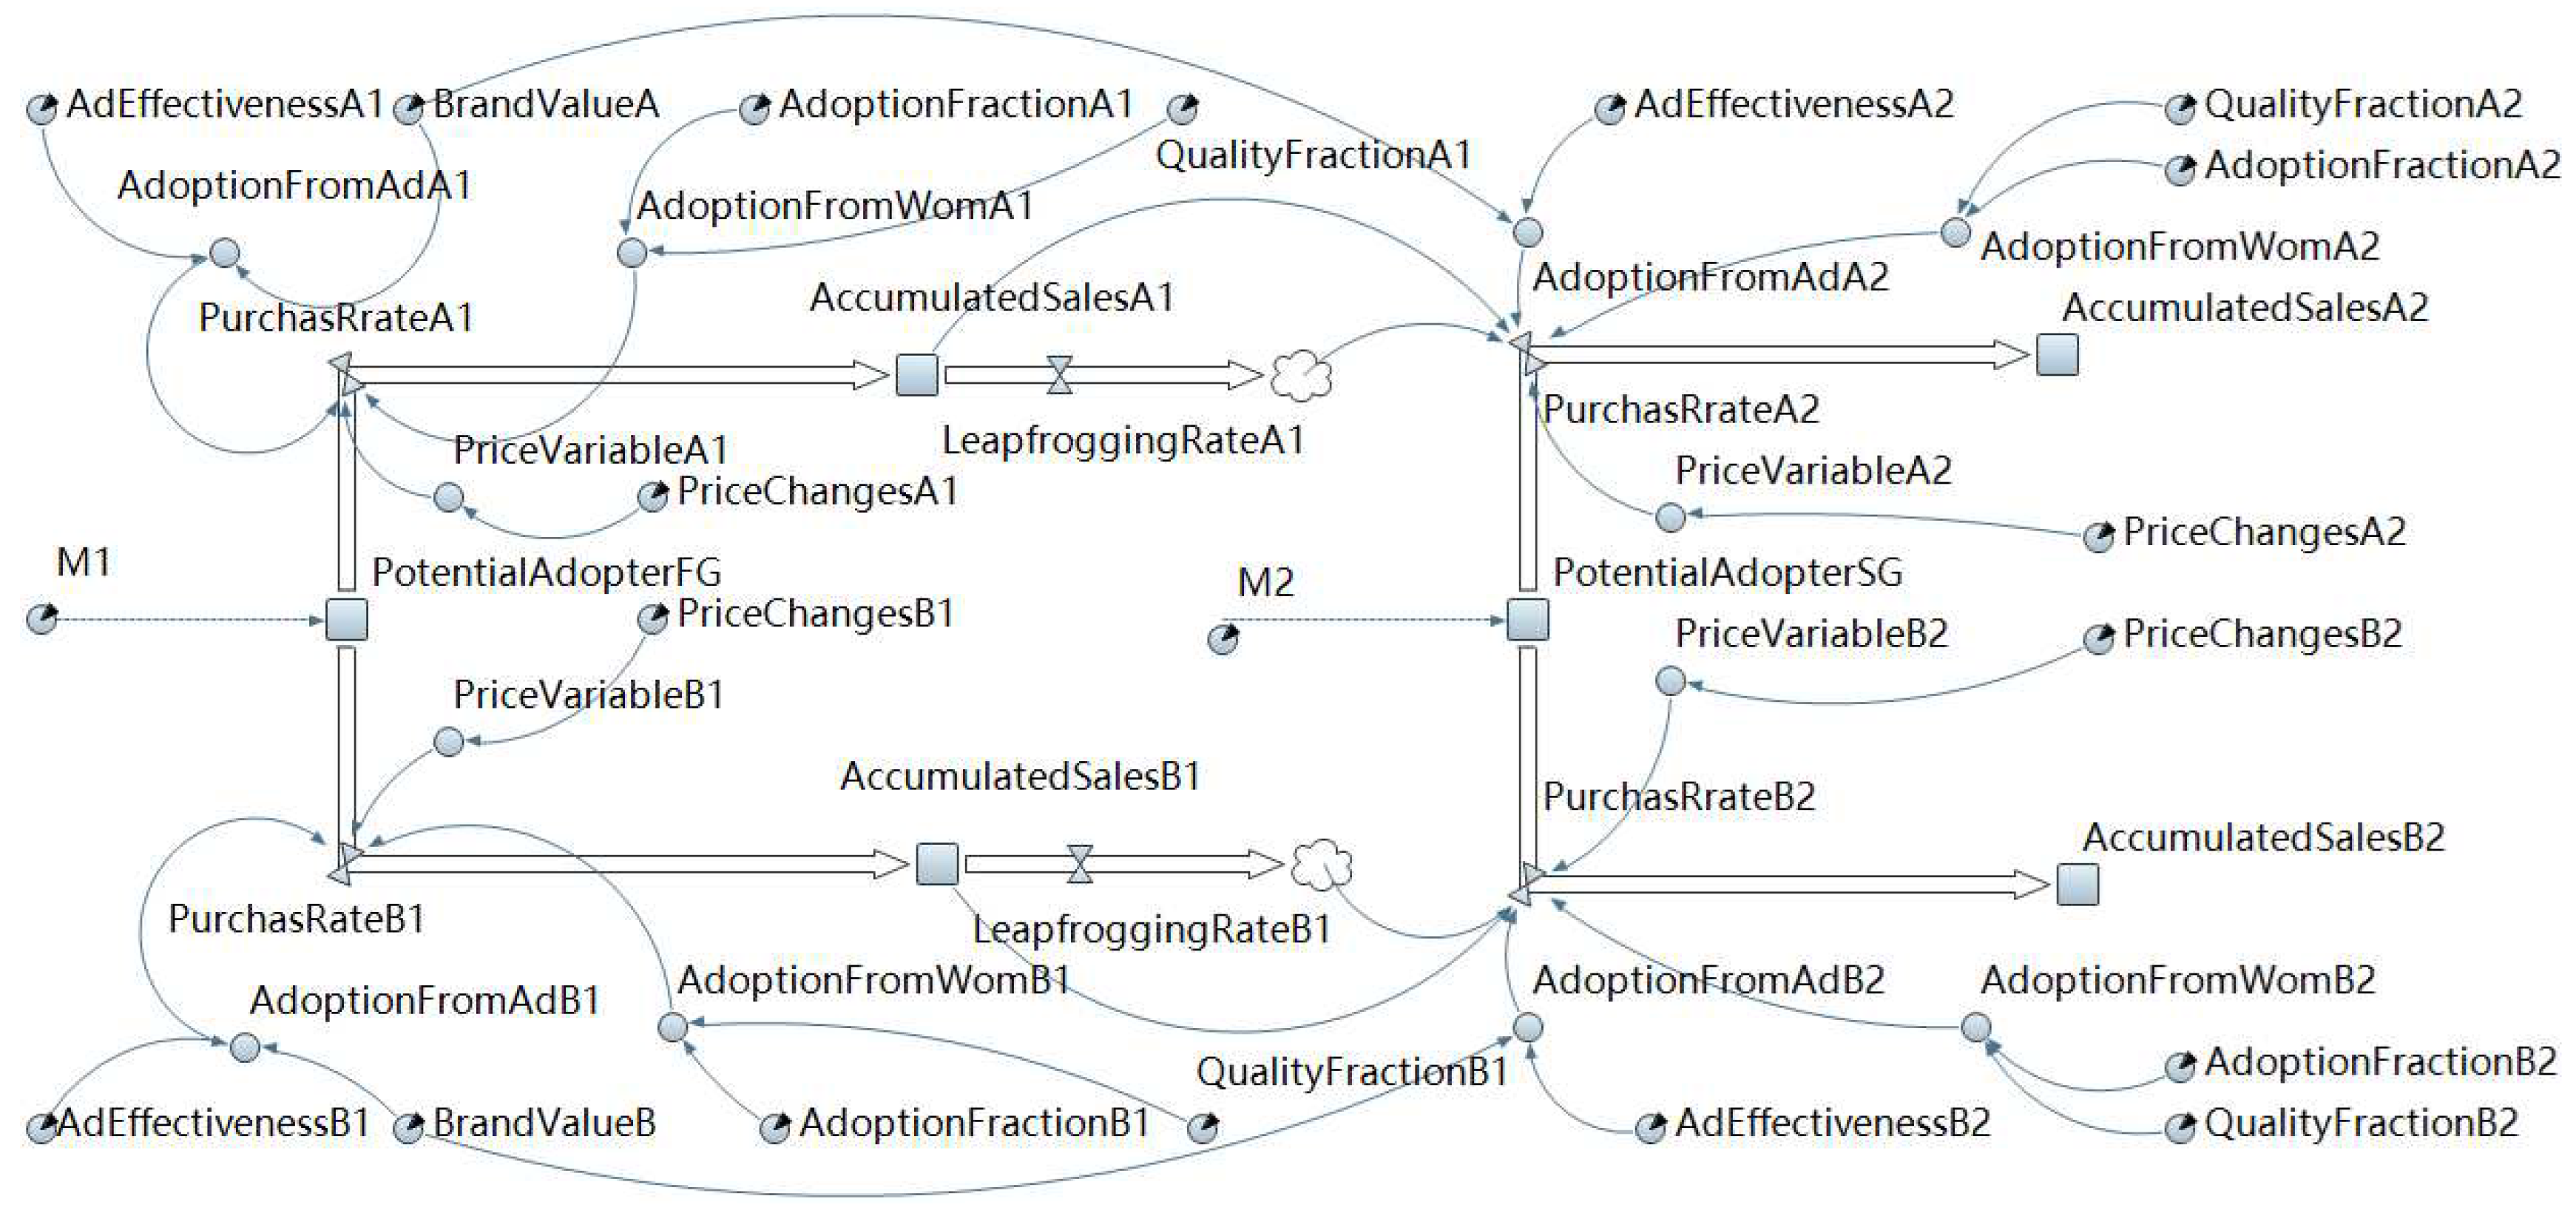
Figure 2.
The curve in the total revenue of two brand.
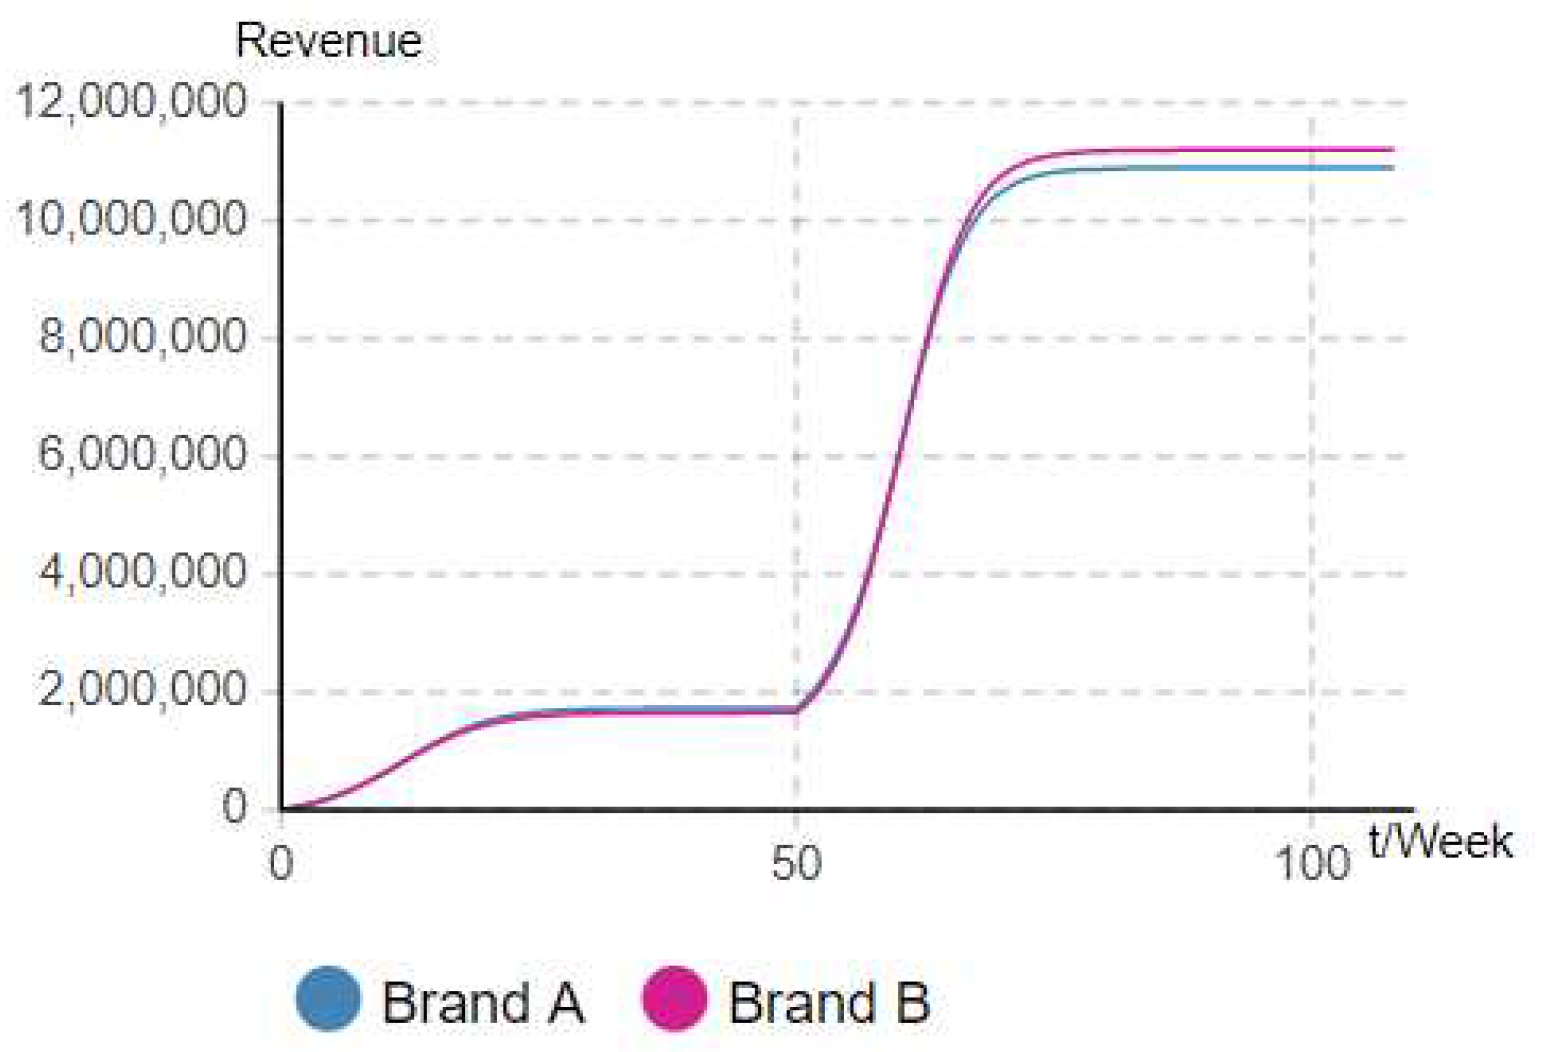
Figure 5.
Influence of first-generation product Initial price of brand A.
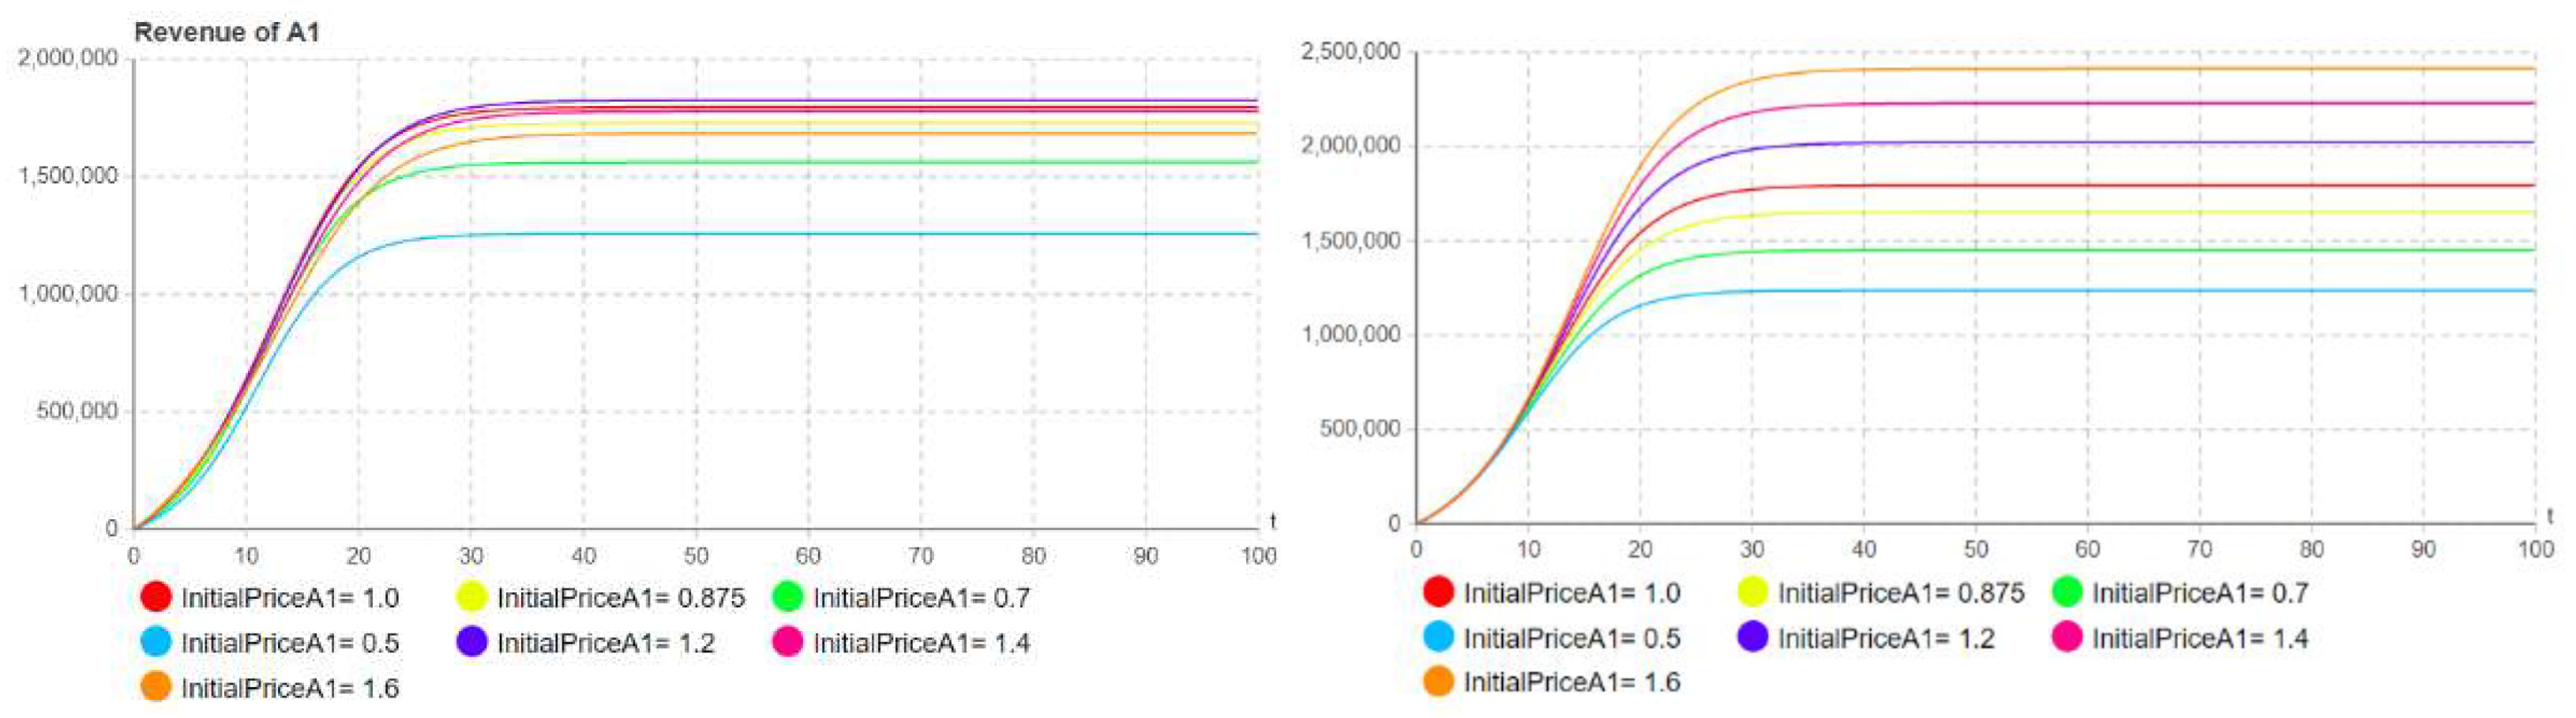
Figure 6.
Influence of second-generation product Initial price of brand A.
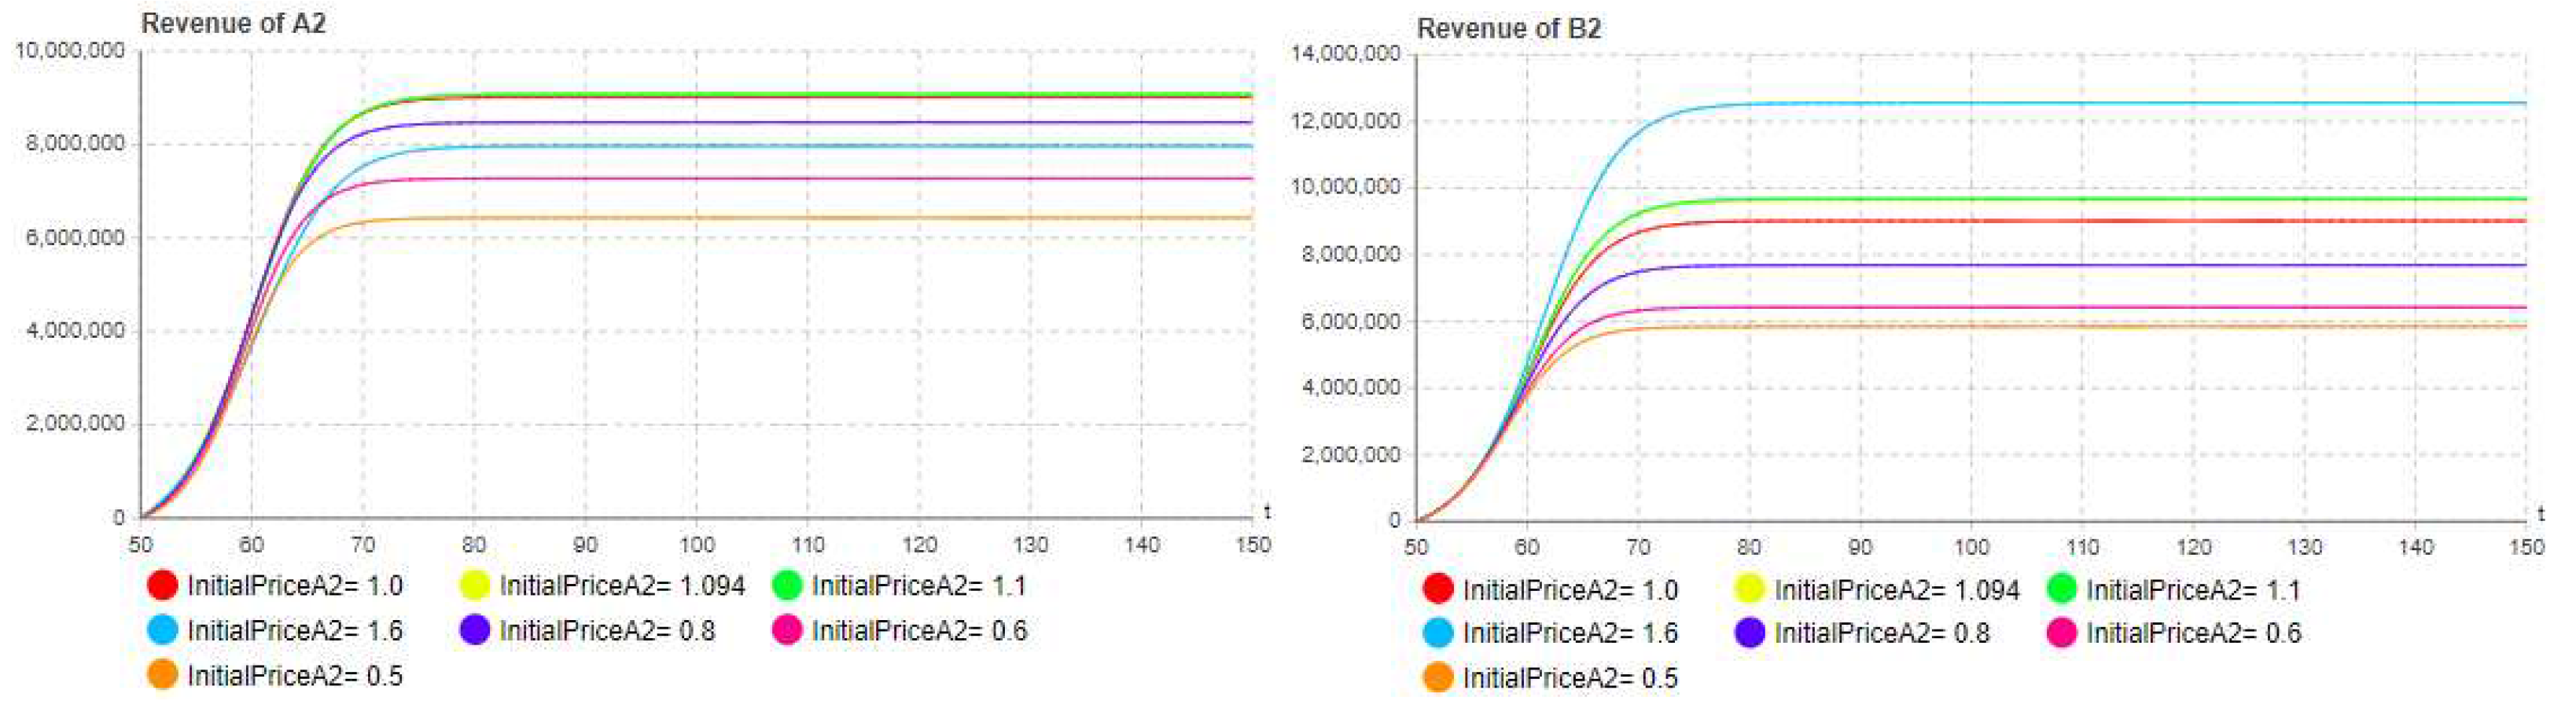
Figure 7.
The curve in the total revenue of two brand.
Figure 8.
Influence of first-generation product Initial price of brand A.
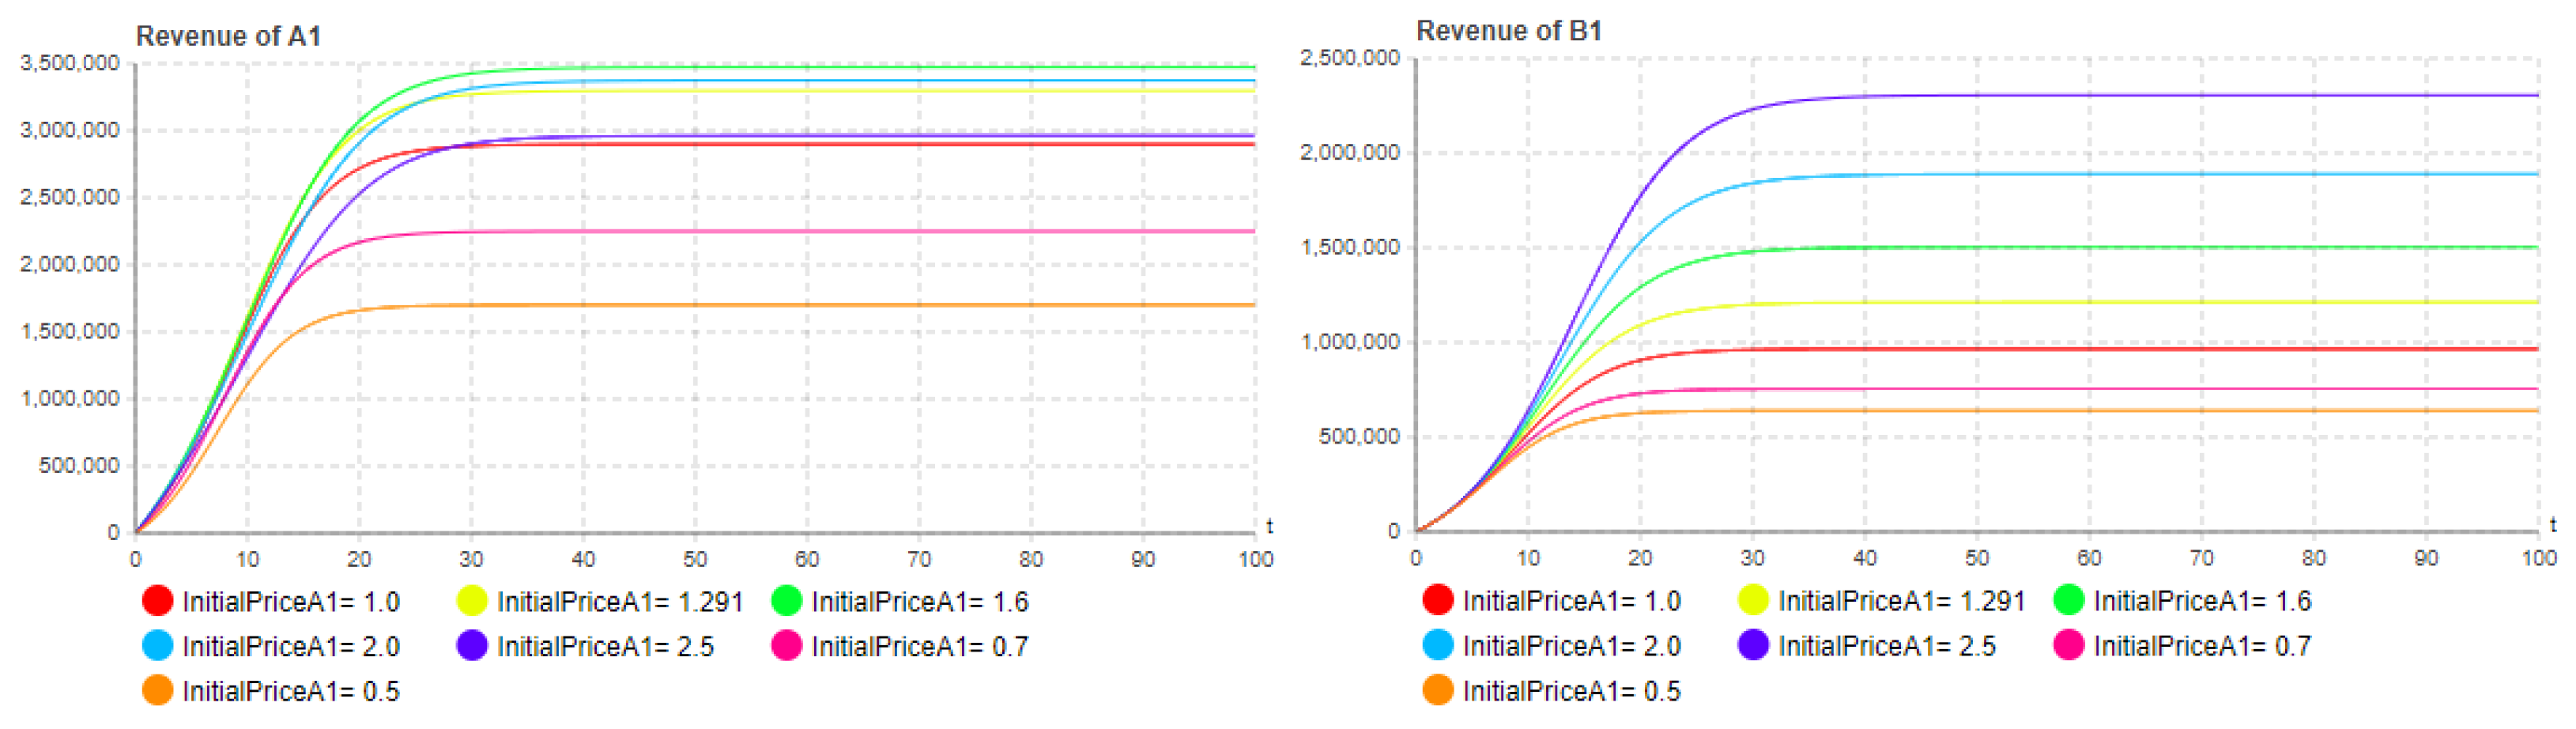
Figure 9.
Influence of second-generation product Initial price of brand A.
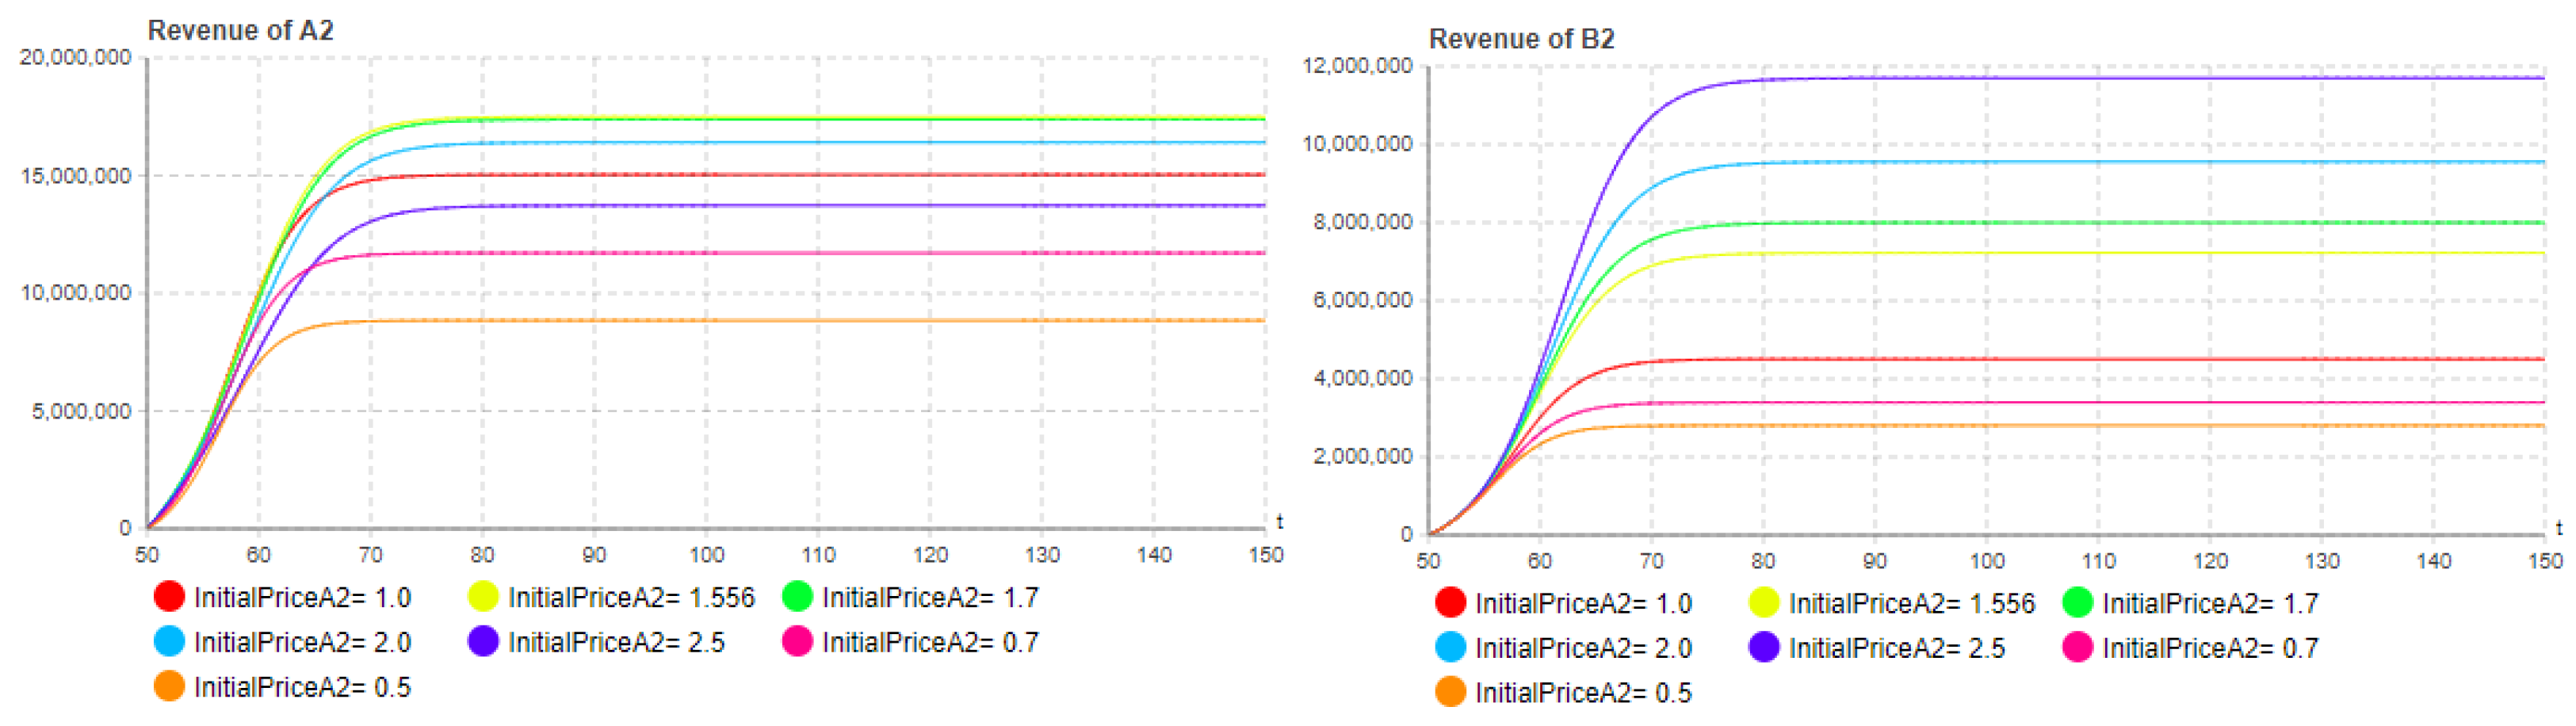
Figure 10.
Influence of first-generation product quality of brand A.
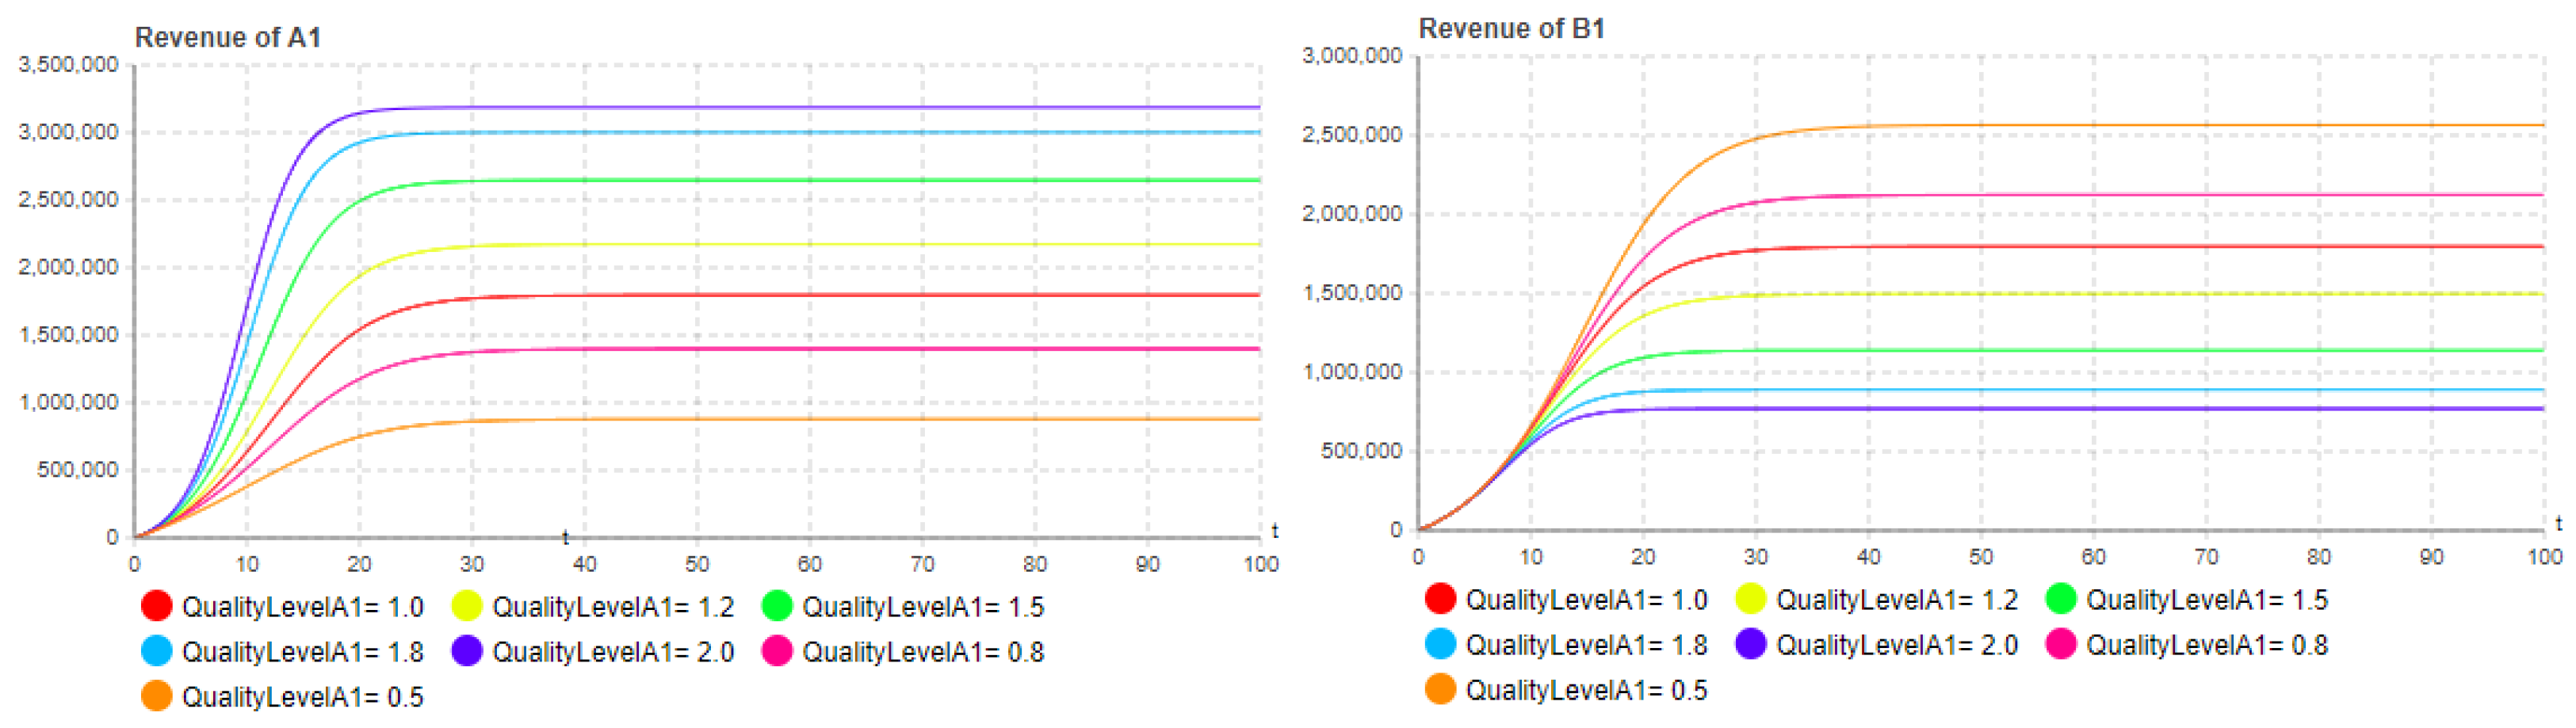
Figure 11.
Influence of second-generation product quality of brand A.
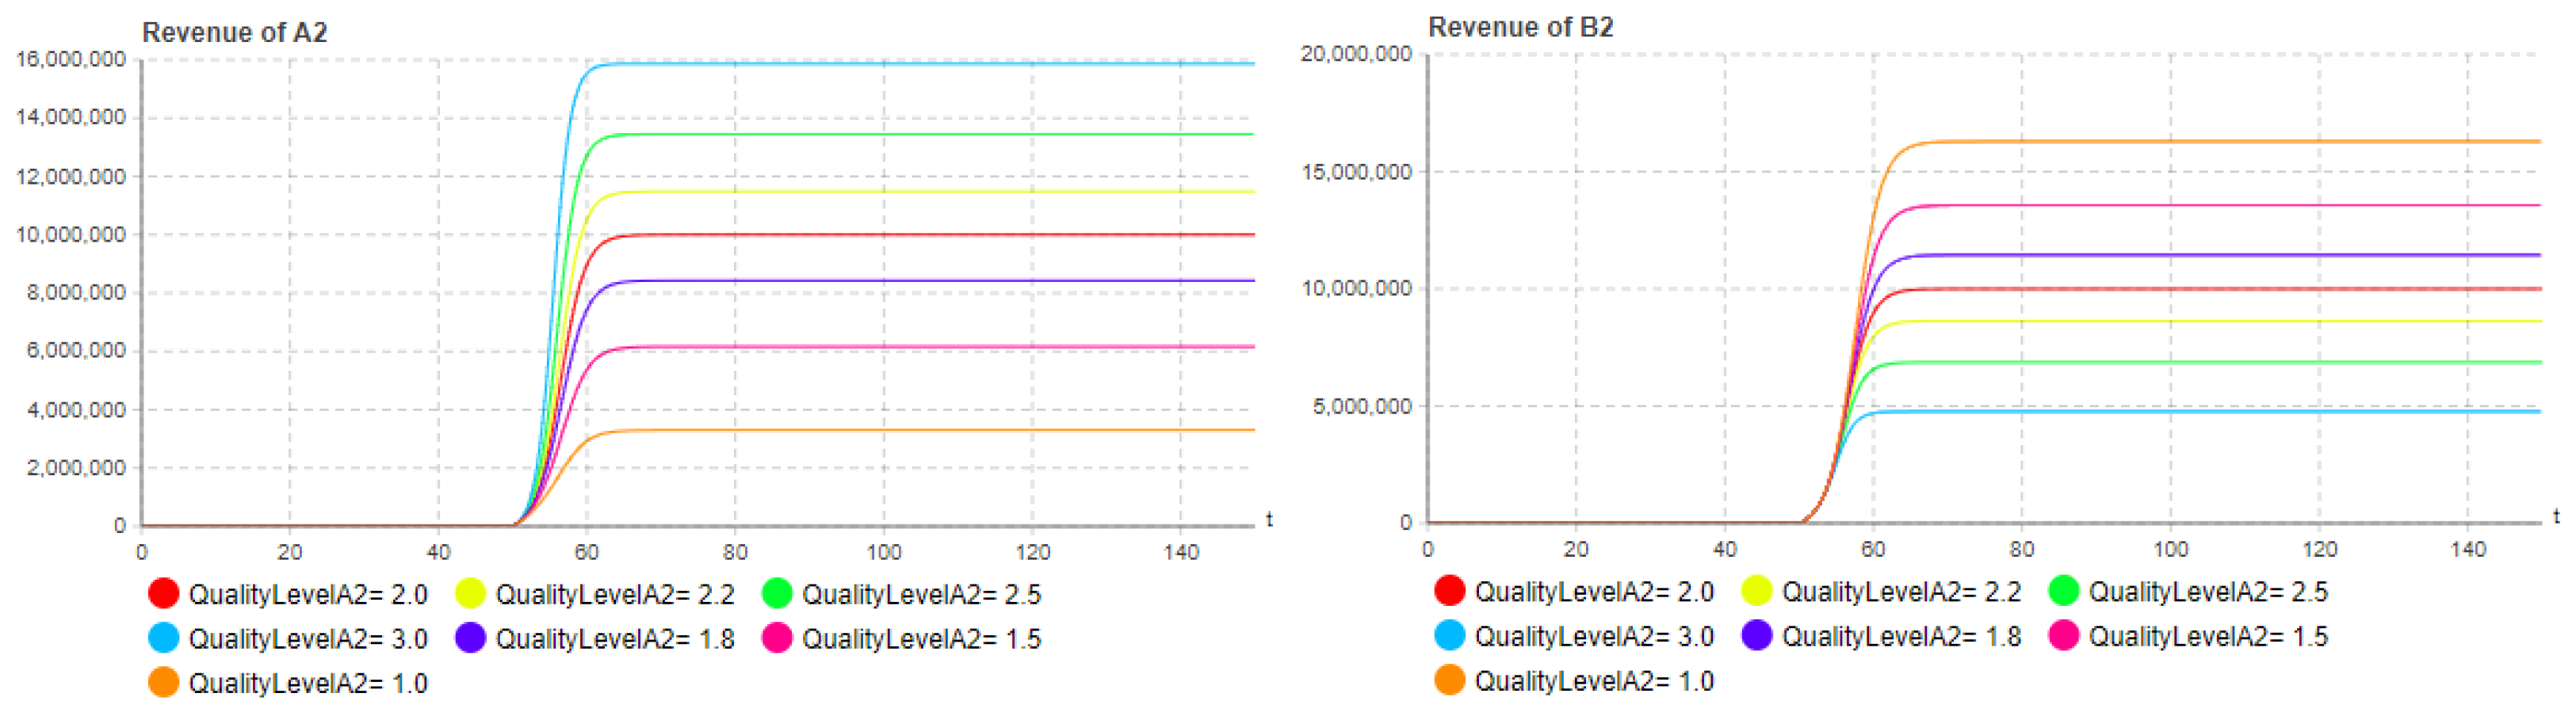
Figure 14.
The relationship between launch time to total revenue of each brand.
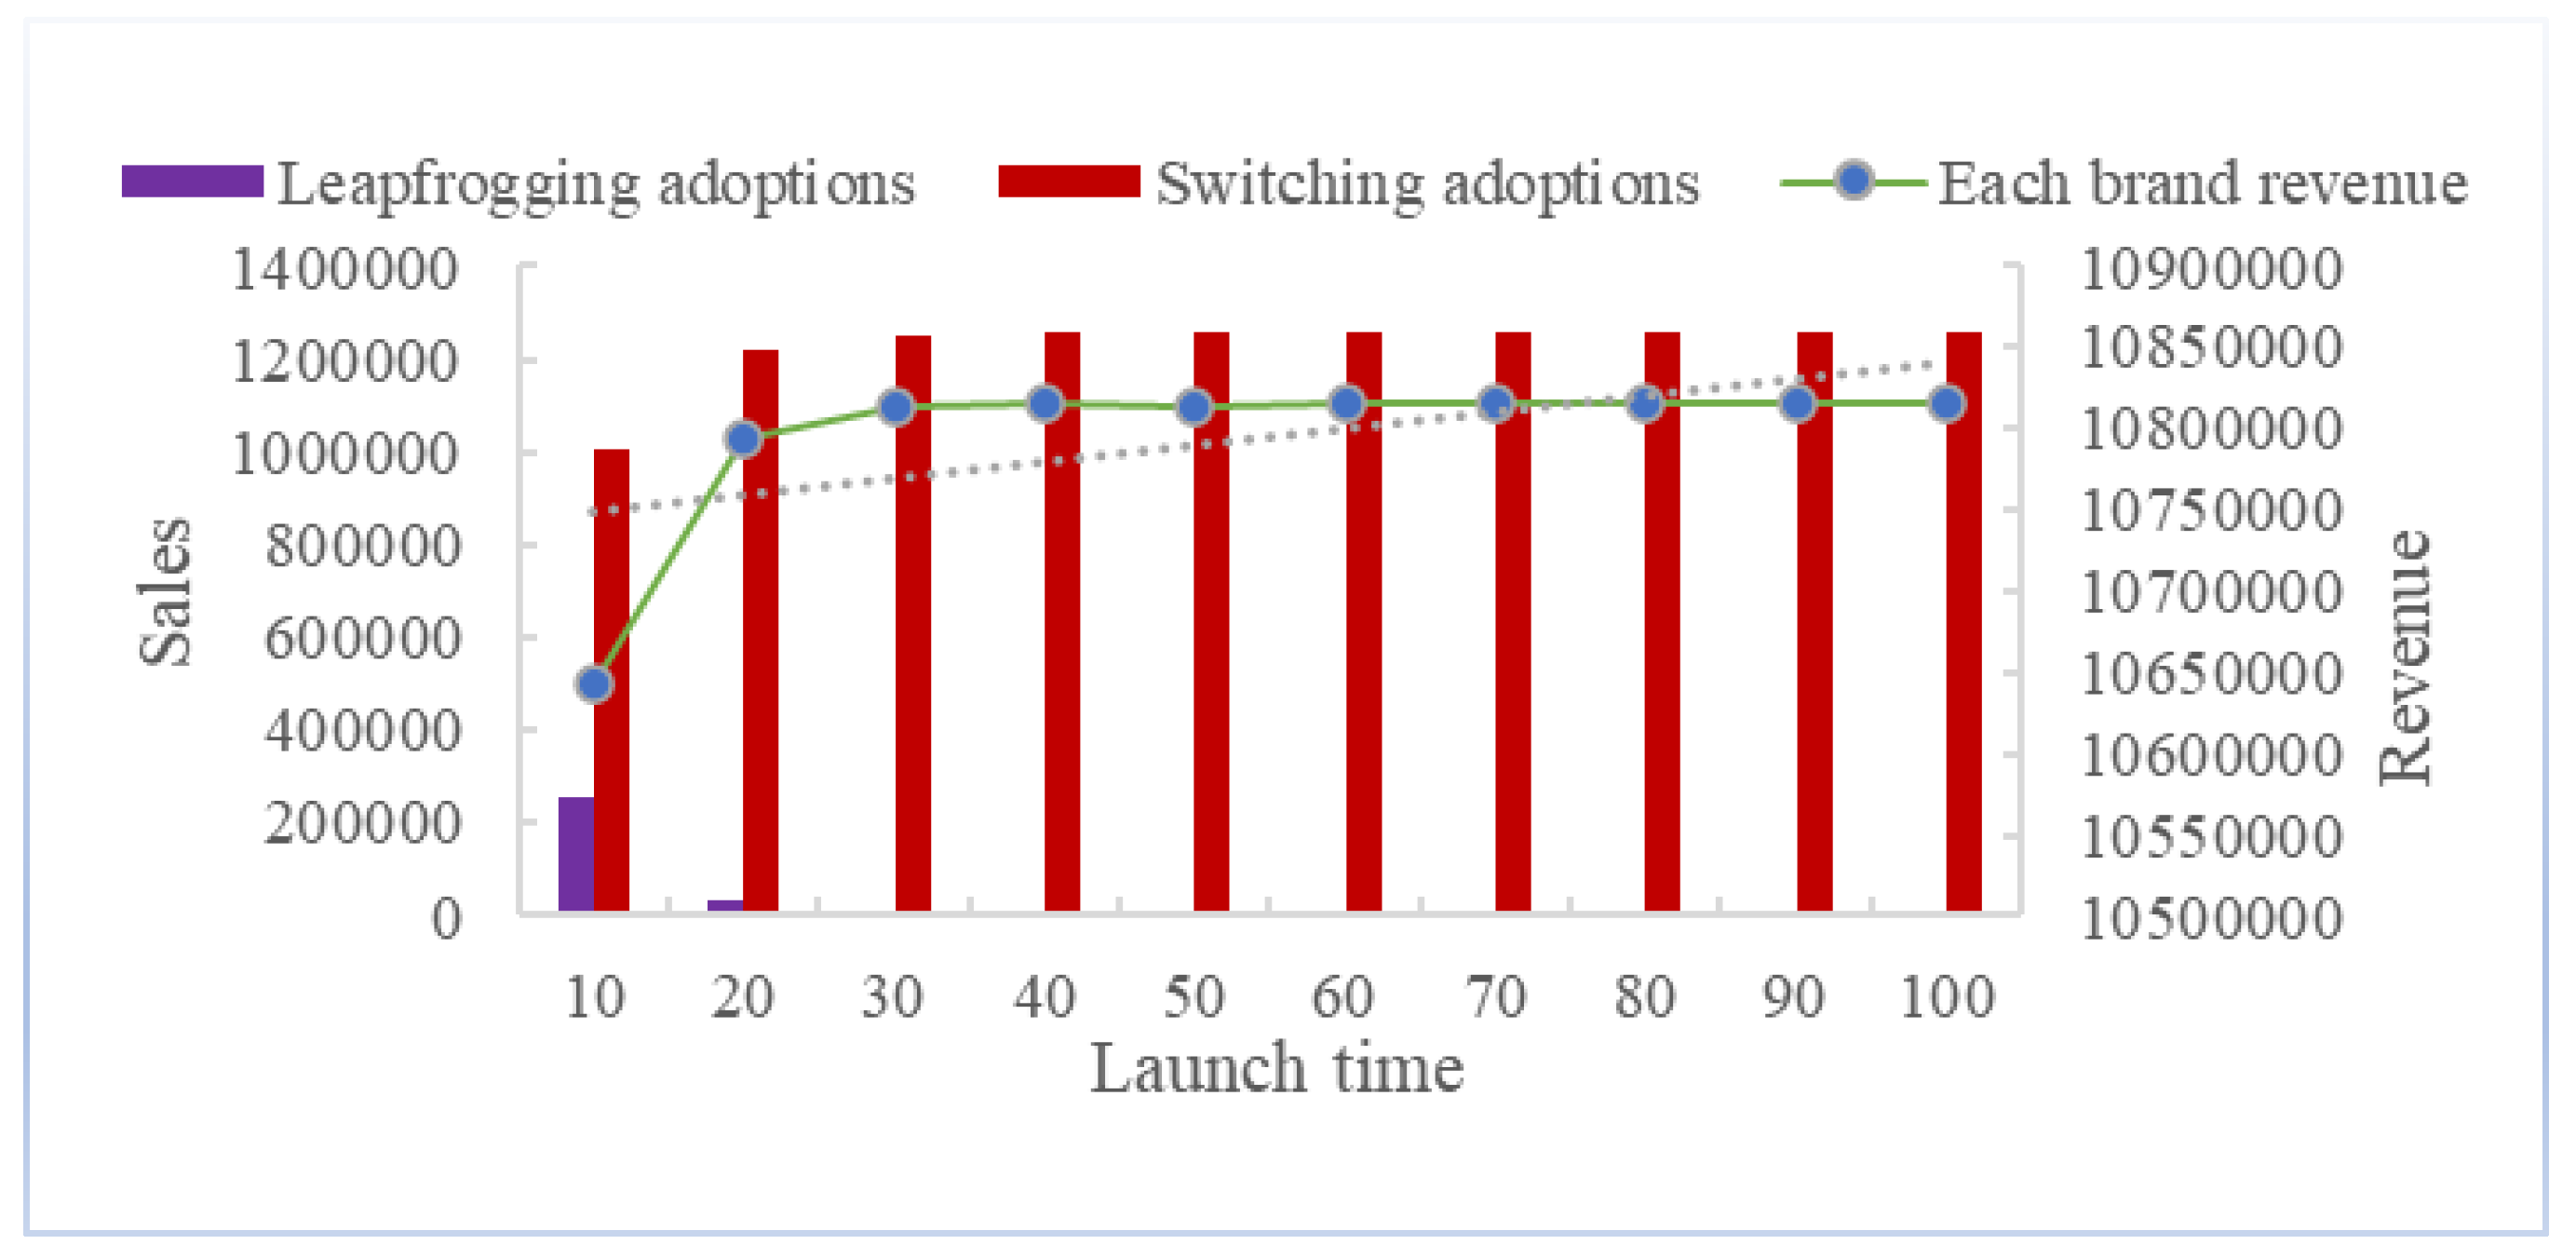
Figure 15.
The relationship between launch time to total revenue of each brand.
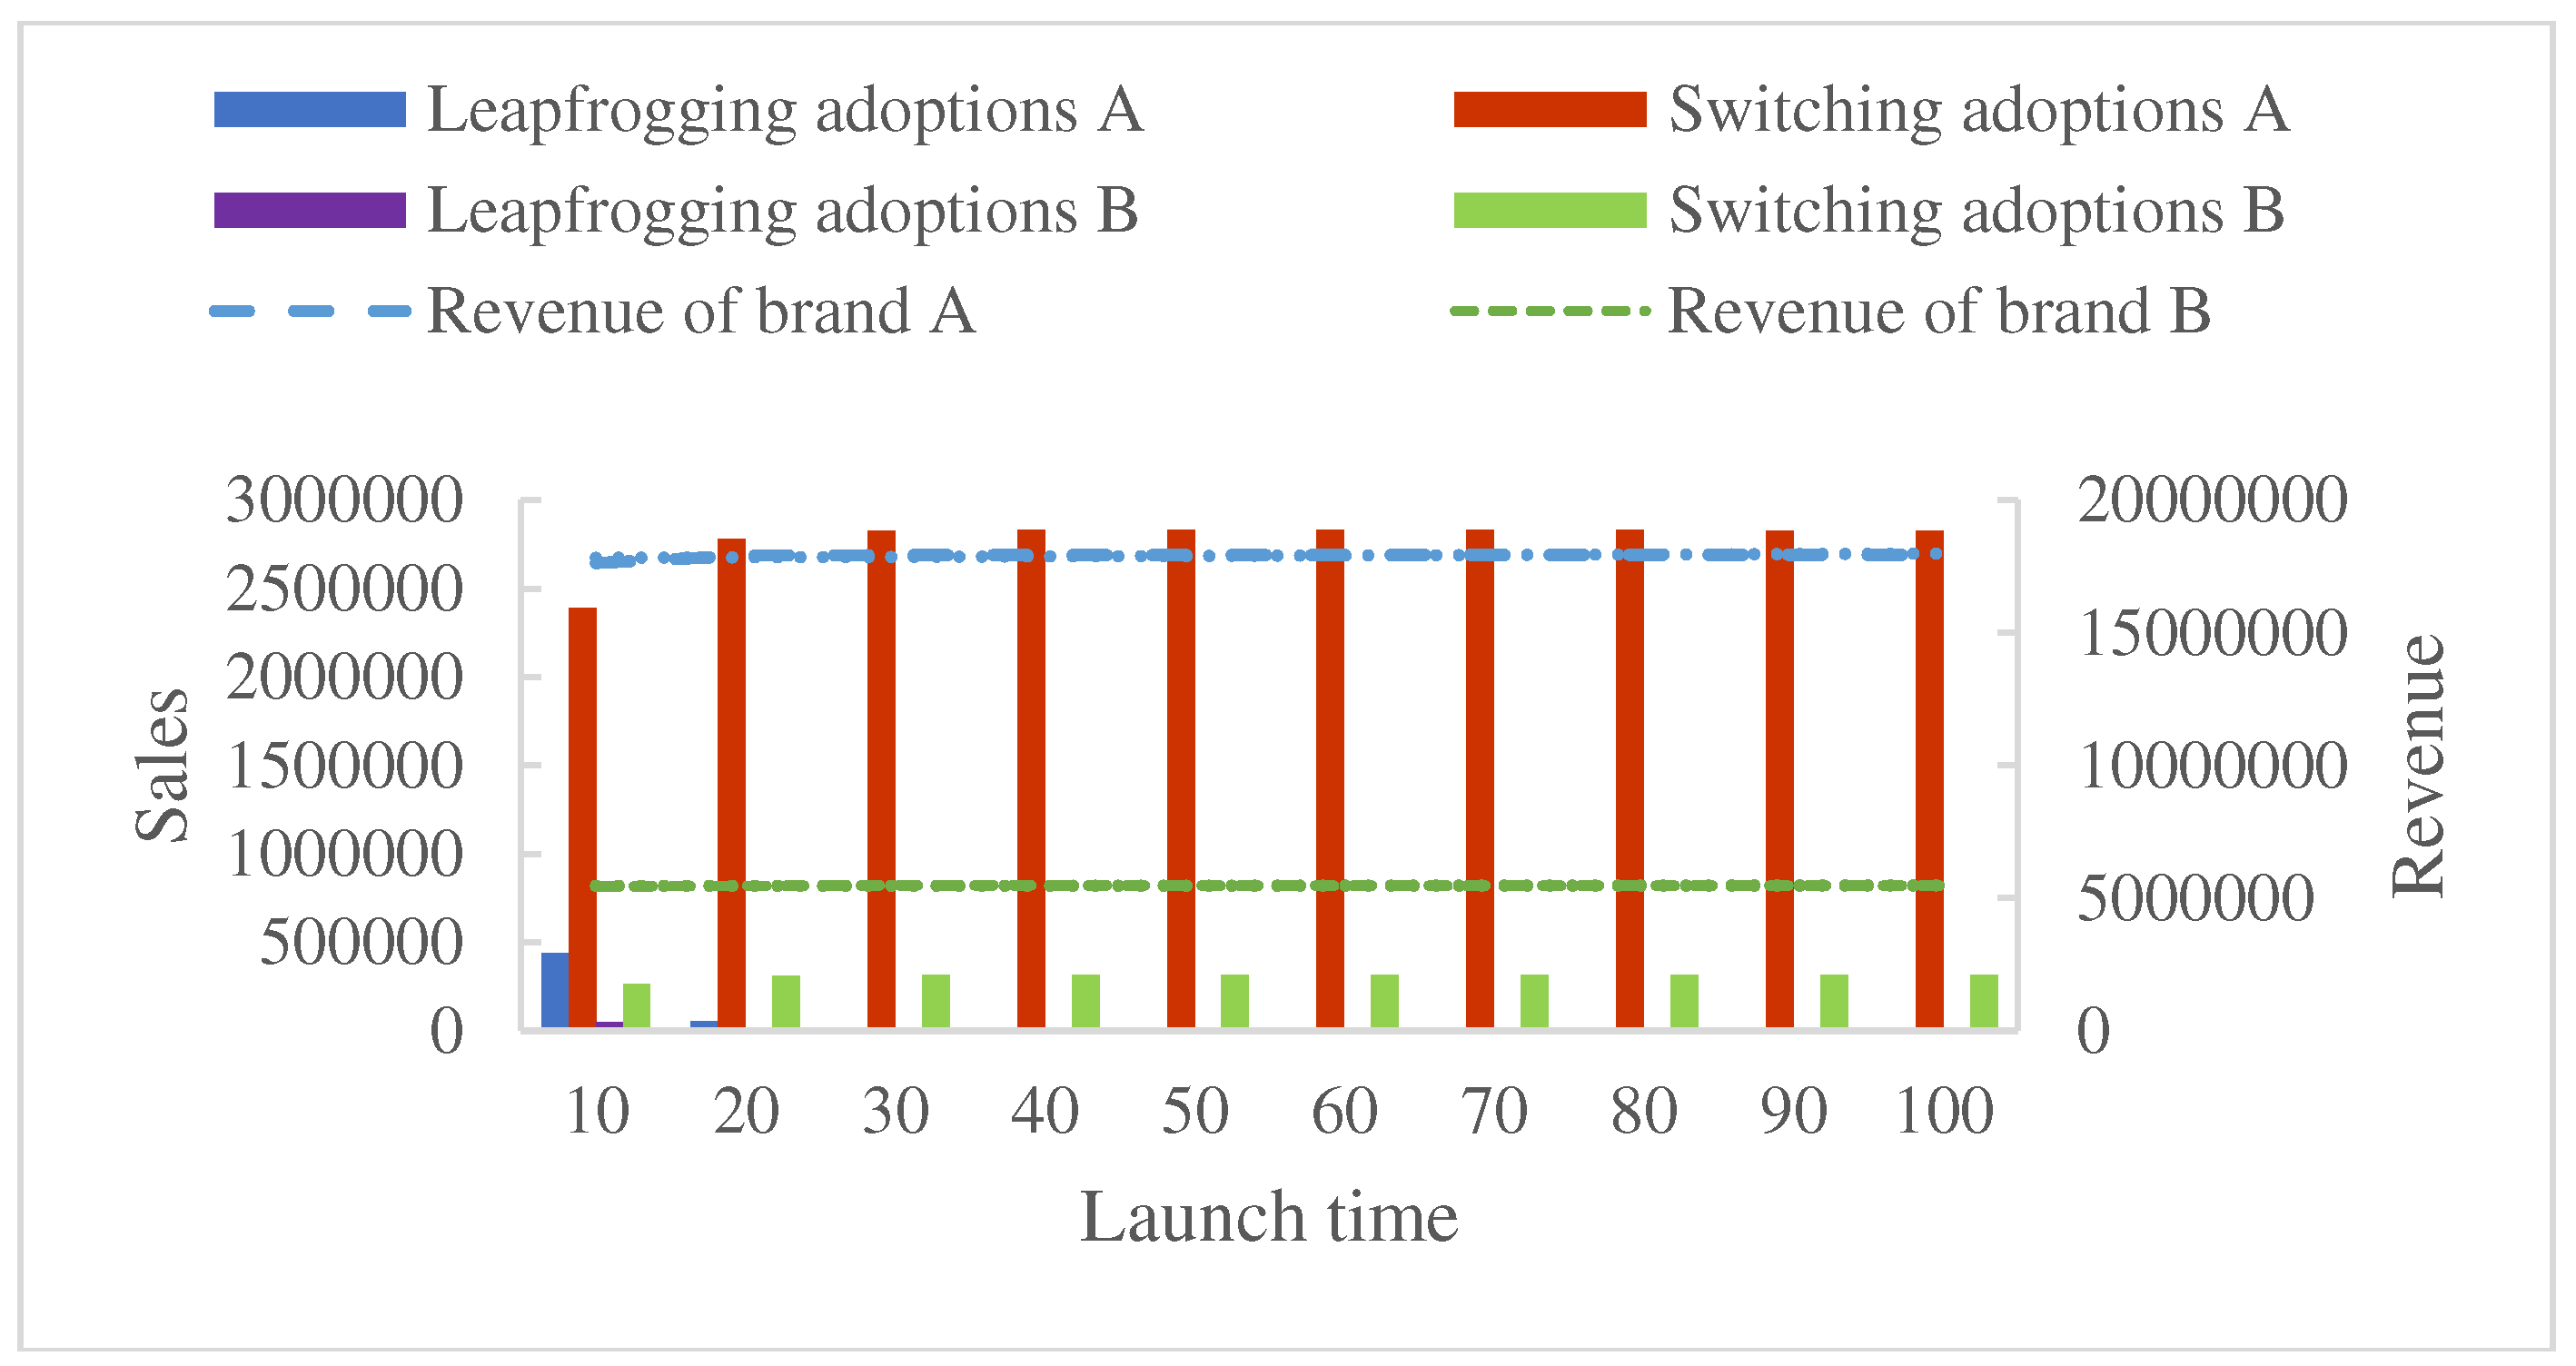
Figure 16.
The relationship between launch time to total revenue of each brand.
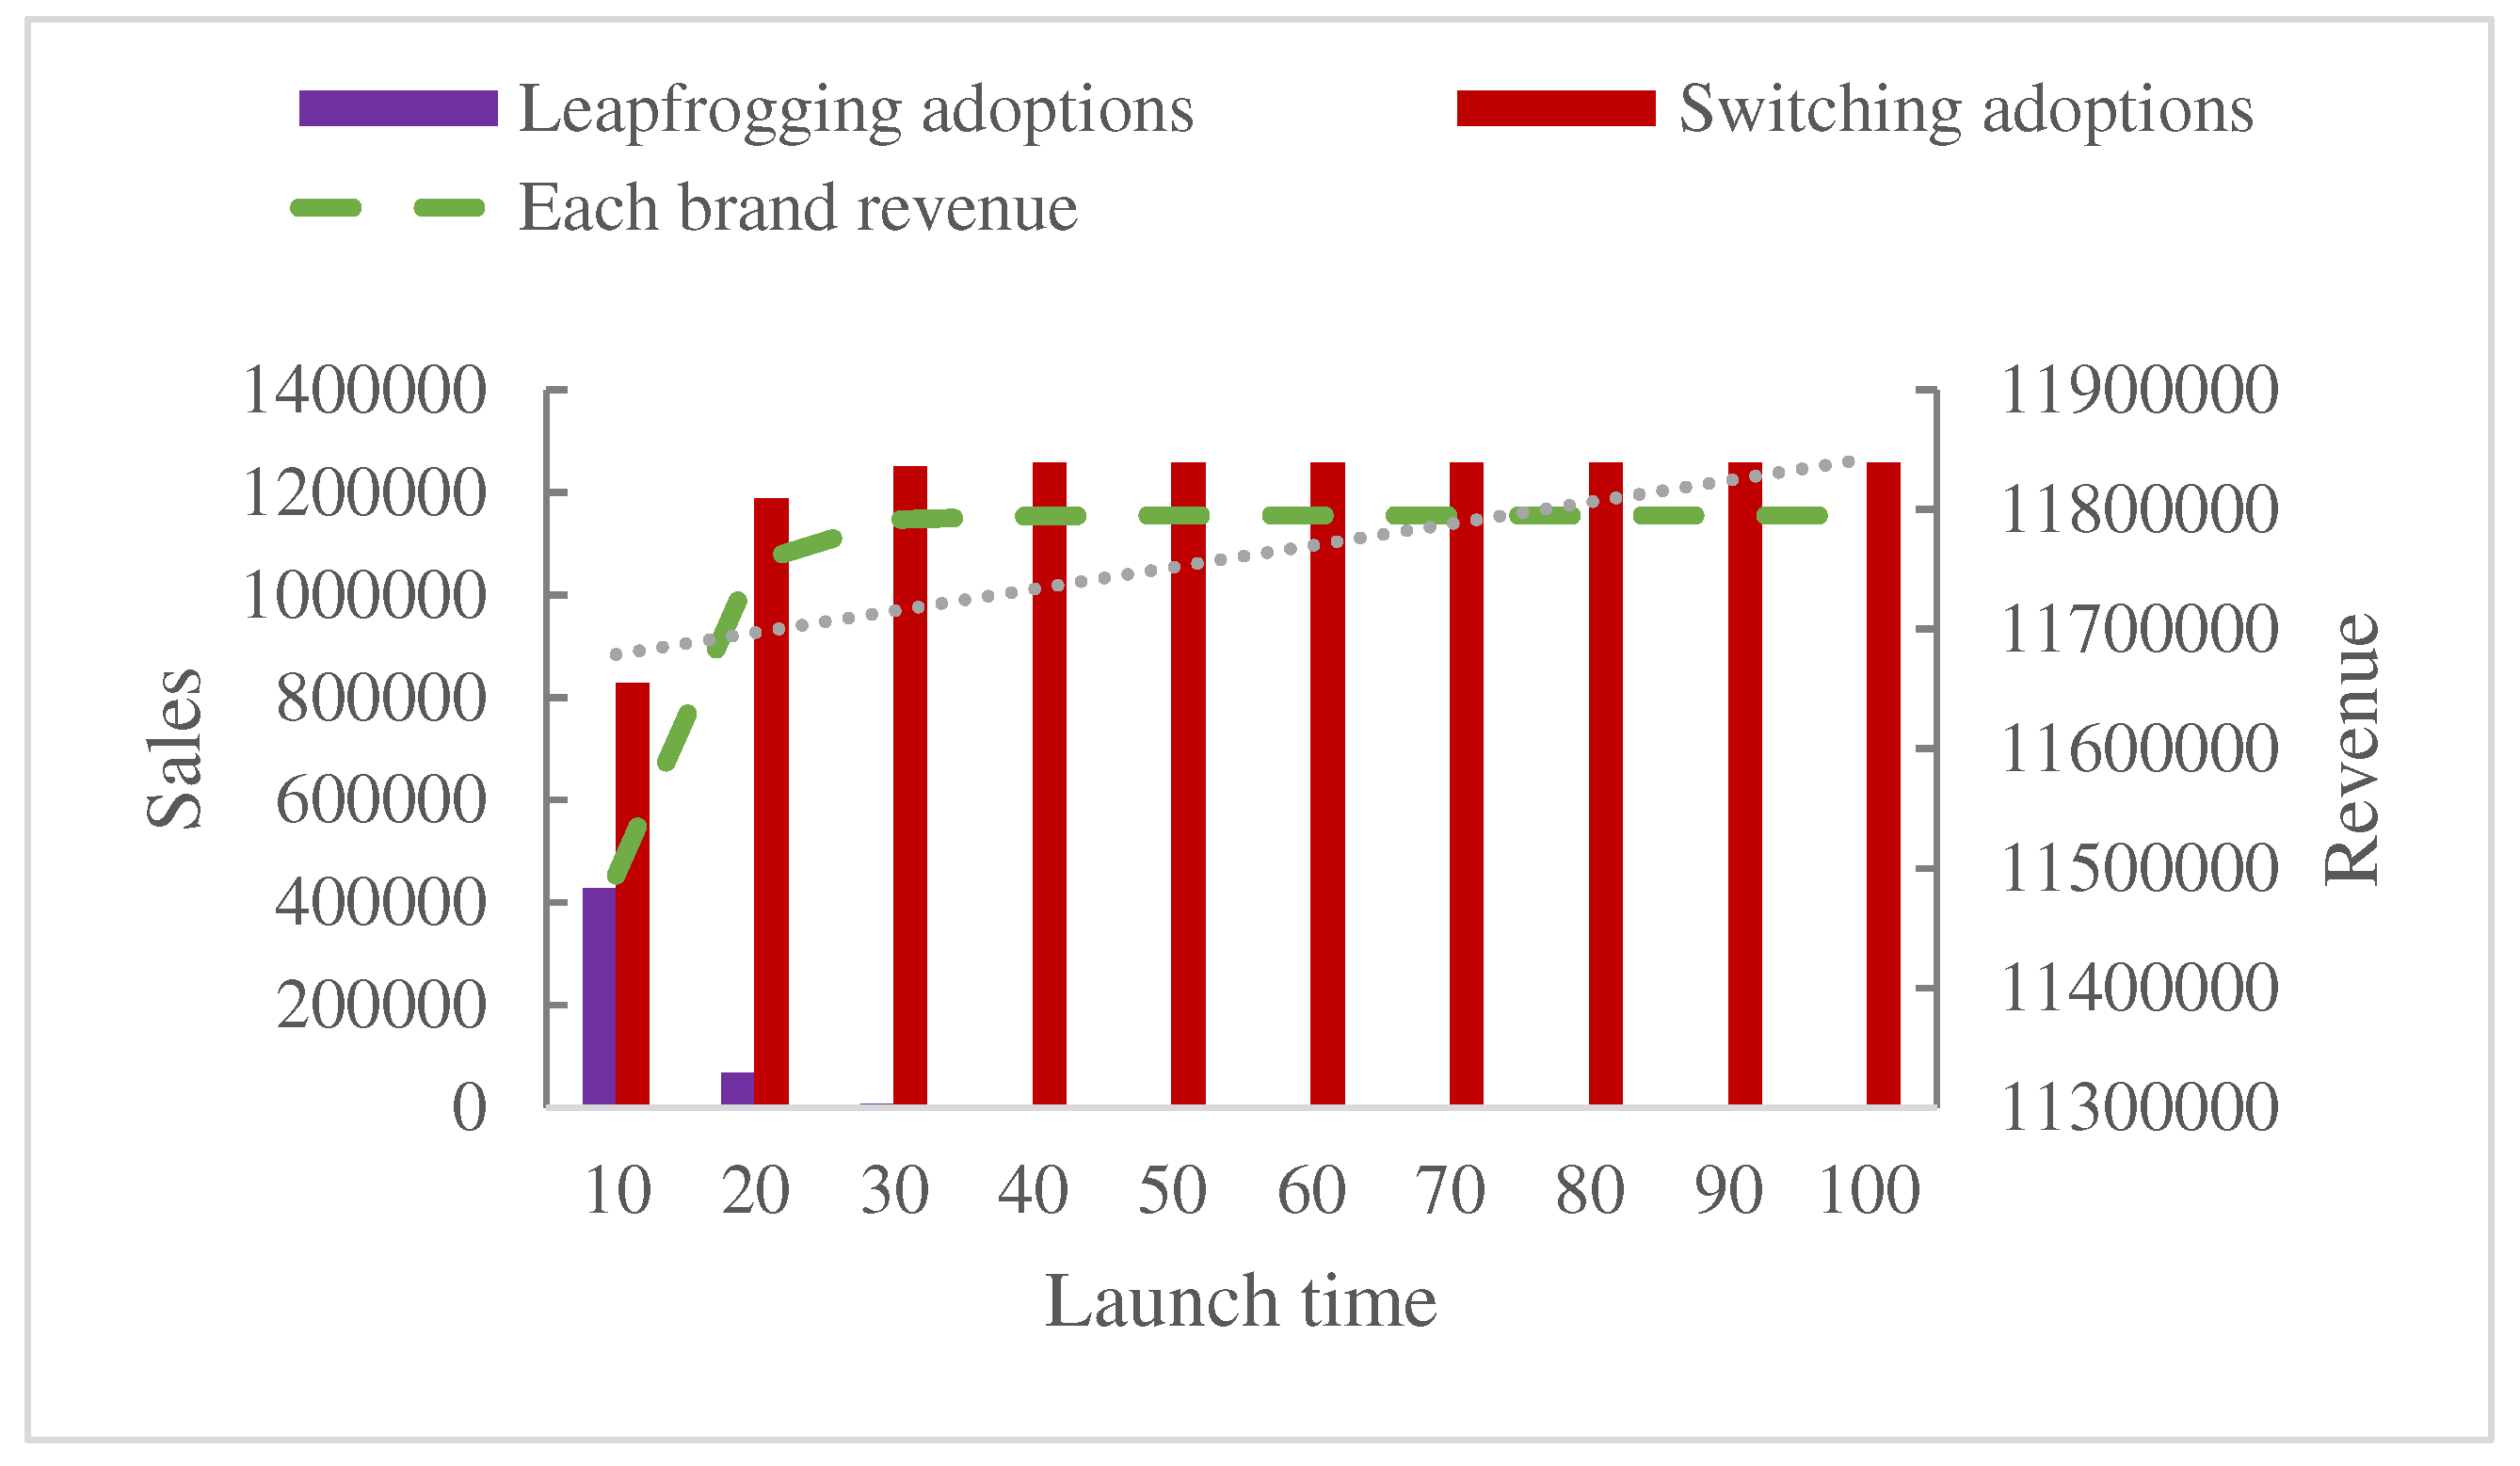
Table 2.
Basic parameter Settings during model simulation.
| Parameter | Value | Parameter | Value |
|---|---|---|---|
| M1 | kAi | 1 | |
| M2 | kA2 | 1 | |
| αA | 1 | kB1 | 1 |
| αB | 1 | kB2 | 1 |
| qA1 | 0.337 | pA1(0) | 1 |
| qA2 | 0.477 | pA2(0) | 1 |
| qB1 | 0.337 | pB1(0) | 1 |
| qB2 | 0.477 | pB2(0) | 1 |
| PA1 | 0.00943 | R | -0.05 |
| PA2 | 0.00943 | 50 | |
| pB1 | 0.00943 | βA | 0.5 |
| pB2 | 0.00943 | βB | 0.5 |
| r | 0.02 | T | 150 weeks |
Table 3.
Optimal initial price of brand B under scenarios of different quality levels.
| scenario | Brand value αA=1,αB=1 |
Brand value αA=3,αB=1 |
|---|---|---|
|
kA1=1, kB1=1 kA2=2, kB2=2 |
pA1(0)=0.849,pA2(τ2)=0.994 πA=11827922.349 |
pA1(0)=1.278,pA2(τ2)=1.398 πA=21015325.598 (1) |
|
kA1=2, kB1=1 kA2=3, kB2=2 |
pA1(0)=1.345,pA2(τ2)=1.336 πA=21963950.961 |
pA1(0)=1.762,pA2(τ2)=1.742 πA=31744272.157 (2) |
|
kA1=1, kB1=1 kA2=3, kB2=2 |
pA1(0)=0.676,pA2(τ2)=1.34 πA=19334506.412 |
pA1(0)=1.173,pA2(τ2)=1.743 πA=29099025.877 (3) |
|
kA1=2, kB1=1 kA2=3, kB2=3 |
pA1(0)=1.438,pA2(τ2)=0.954 πA=14736147.193 |
pA1(0)=1.857,pA2(τ2)=1.321 πA=23729928.91 (4) |
|
kA1=2, kB1=1 kA2=2, kB2=1 |
pA1(0)=1.427,pA2(τ2)=1.675 πA=24773330.916 |
pA1(0)=1.741,pA2(τ2)=2.075 πA=35111523.865 (5) |
|
kA1=1, kB1=1 kA2=1, kB2=1 |
pA1(0)=0.875,pA2(τ2)=1.094 πA=10894474.196 |
pA1(0)=1.291,pA2(τ2)=1.556 πA=20536744.303 (6) |
Table 4.
Optimal initial price of brand B under scenarios of different quality levels.
| scenario | Brand value αA=1,αB=1 |
Brand value αA=3,αB=1 |
|---|---|---|
|
kA1=1, kB1=1 kA2=2, kB2=2 |
pB1(0)=0.849,pB2(τ2)=0.994 πB=11827922.349 |
pB1(0)=0.819,pB2(τ2)=0.833 πB=5964821.122 (7) |
|
kA1=2, kB1=1 kA2=3, kB2=2 |
pB1(0)=0.715,pB2(τ2)=0.761 πB=5460440.417 |
pB1(0)=0.999,pB2(τ2)=0.78 πB=2805444.926 (8) |
|
kA1=1, kB1=1 kA2=3, kB2=2 |
pB1(0)=0.99,pB2(τ2)=0.762 πB=6789403.062 |
pB1(0)=0.949,pB2(τ2)=0.78 πB=3402421.956 (9) |
|
kA1=2, kB1=1 kA2=3, kB2=3 |
pB1(0)=0.454,pB2(τ2)=0.952 πB=10685858.775 |
pB1(0)=0.813,pB2(τ2)=0.778 πB=5567137.124 (10) |
|
kA1=2, kB1=1 kA2=2, kB2=1 |
pB1(0)=0.817,pB2(τ2)=0.908 πB=3873196.966 |
pB1(0)=1.043,pB2(τ2)=1.052 πB=2205744.207 (11) |
|
kA1=1, kB1=1 kA2=1, kB2=1 |
pB1(0)=0.875,pB2(τ2)=1.094 πB=10894474.196 |
pB1(0)=0.847,pB2(τ2)=0.975 πB=5486472.016 (12) |
Disclaimer/Publisher’s Note: The statements, opinions and data contained in all publications are solely those of the individual author(s) and contributor(s) and not of MDPI and/or the editor(s). MDPI and/or the editor(s) disclaim responsibility for any injury to people or property resulting from any ideas, methods, instructions or products referred to in the content. |
© 2023 by the authors. Licensee MDPI, Basel, Switzerland. This article is an open access article distributed under the terms and conditions of the Creative Commons Attribution (CC BY) license (http://creativecommons.org/licenses/by/4.0/).
Copyright: This open access article is published under a Creative Commons CC BY 4.0 license, which permit the free download, distribution, and reuse, provided that the author and preprint are cited in any reuse.


