Submitted:
28 June 2023
Posted:
29 June 2023
You are already at the latest version
Abstract
We investigated new anodic coloring materials that are used as ion storage layers in complementary energy storage electrochromic devices (ESECDs) to enhance their electrochromic storage performance. In this study, we fabricated counter electrodes (ion storage layers) using IrO2 doping NiO (Ir: NiO) film through cathodic arc plasma (CAP) with varying surface charge capacities. We investigated the influence of MoO3-doped WO3 (Mo: WO3) film by various Ar/O2 gas flow ratios (1/4, 1/5, and 1/6). The ESECDs used in the demonstration were 10×10 cm2 in size. They achieved optical transmittance modulation of Ir: NiO- ESECDs (glass/ITO/ Mo: WO3/gel-polymer electrolytes/ Ir: NiO /ITO/glass), ΔT=53.3% (from Tbleaching (66.6%) to Tcoloration (13.1%)). The ESECDs had a quick coloration time of 3.58 seconds, a rapid bleaching time of 1.24 seconds, and high cycling durability. It remained at 45% transmittance modulation even after 3000 cycles. New anodic materials can provide an alternative to traditional active materials for bi-functional electrochromic batteries.
Keywords:
Iridium oxide
; Energy-storage electrochromic device
; Cathodic arc plasma (CAP)
1. Introduction
With the accelerating depletion of fossil fuels and increasing environmental degradation, energy conservation and emission reduction have become an inevitable global trend [1,2]. Currently, over 30% of the world's energy consumption is dedicated to providing heating, cooling, ventilation, and artificial lighting for buildings. [3]. One of the primary factors that affect building energy consumption is the windows, as a significant percentage of light and heat is transmitted and lost through them [4]. Electrochromic (EC) materials can reversibly adjust their optical characteristics, including reflectance, transmittance, and absorption, to regulate indoor sunlight and solar heat. EC materials can effectively reduce the heating and cooling loads inside a building [5]. Smart windows made of electrochromic materials can utilize in architectural buildings’ rooms (Sage Glass, View, Inc.), auto-dimming rearview mirrors, and aircraft (Gentex Corp.) [6].
Energy storage electrochromic devices (ESECDs) consist of anodic and cathodic coloring materials arranged in a five-layer structure. This structure includes a pair of transparent conducting layers, an ionic conduction layer (electrolyte) in contact with an electrochromic (EC) layer, and a complementary ion storage layer. [7,8,9]. Smart windows are made of electrochromic materials that can block solar and indoor sunlight heat, resulting in a reduction in air-conditioning energy consumption [6,7]. The active electrochromic materials used in the device have undergone extensive study. Several transition metal oxides, such as WO3, V2O5, NiO, and TiO2, have been utilized as supercapacitors or electrochromic electrodes. Electrochromic devices (ECDs) can function at low voltages and change color or bleach through the injection or extraction of positive ions (such as lithium or protons) and electrons into and out of electrochromic materials [10,11,12].
Implementing the combination of bi-functional electrochromic and energy storage through reversible redox reactions using an active electrode material is a logical focus for many investigations [13,14,15,16]. It would be exciting to utilize not only smart windows but also charge capacity, which possess excellent electrochromic and energy-storage capabilities while also displaying significant color variations [13]. Our objective is to develop energy-saving strategies to overcome challenges in response to the worldwide energy crisis. Since Energy-storage electrochromic devices (ESECD) are considered promising research possibilities due to their low power consumption, reversible color changing, low power driving, extensive optical modulation, and good memory [14,15,16,17].
Due to their potential use in heat-insulating glass for airplanes and smart windows for buildings, these devices are attracting a lot of attention [18,19]. WO3 is a widely recognized cathode material, while NiO is a frequently used anode material. The primary drawbacks of the NiO-ECD are its low contrast in optical transmittance and limited lifespan [20,21]. IrO2 film has been proposed as an anodic electrode in ECDs, as it facilitates reversible oxidation and reduction reactions, enabling Li ions to enter and exit the interface between the electrodes and electrolyte [20]. In general, ECD electrode films for ECDs consist of an anode and a cathode that can be manufactured using various methods, such as sputtering [24,25,26], chemical deposition [27,28], sol-gel [29,30], dip-coating [31,32], pulsed-laser deposition [33], and electrodeposition [34]. In our previous work, we fabricated anodic coloring materials (IrO2 and NiO) and cathodic coloring materials (WO3) using CAP. The CAP technique is not widely applied due to its poorer macro-particle production. The inferior performance is caused by the consequence of plasma-liquid pooling on cathode spots and its attachment to the electrode film. The harmful macro-particles are the main factor why the CAP technique is not suitable for industrial applications. Therefore, we amended a way that made use of Theorton deposition [10,11,12,22,23] to reduce marco-particle size and adjust the process parameters for high work pressure to turn up self-organized structure, and high horizontal magnetic to improve the quality.
In this study, we examined the influence of Mo: WO3/ITO film on the electrochemical and optical characteristics, including surface diffusion coefficients, and optical density, under various Ar/O2 gas flow ratios (1/4, 1/5, and 1/6). The configuration of Ir: NiO- ESECDs (glass/ITO/Mo: WO3/gel-polymer electrolytes/Ir: NiO/ITO/glass) is illustrated in Figure 1. In addition, the ESECD measures the time it takes for coloring and bleaching to occur, as well as cycling durability.
2. Materials and Methods
2.1. Synthesis of Mo: WO3 (Electrochromic layer) working and the transparent electrode
Electrochromic Mo: WO3(MoO3-doped WO3 films) electrode was fabricated by CAP technique using a Molybdenum (Mo)- Tungsten (W) Alloy-metal target (99.99% purity), the Mo/W weight ratio of the target is around 25%, the deposition temperature was fixed at 50 °C. In the CAP technique, Mo/W -metal disk was used with 3 in. The target size is a diameter of 3 mm and a thickness of 3 mm. The base chamber pressure was set to less than 6×10⁻⁶ Torr using a turbo pump. We deposited Mo: WO3 films (samples 1-3) in a series of reaction Ar/O2 gas flow ratios (1/4, 1/5, and 1/6) as electrochromic electrodes deposited on indium tin oxide (ITO) glass. During the process, each ITO-coated glass sample was deionized for 2 min to get rid of surface bounded particles. Indium tin oxide (ITO, Solaronix SA, Rsh=5.8 Ω/□)-coated glass was cut into wafers (10×10 cm2) for use as a transparent conducting substrate in ESECDs. The deposition parameters are implemented in Table 1.
2.2. Deposition of IrO2 and NiO Counter Electrode
The Ir:NiO layer was fabricated using the CAP technique, which utilized metallic Iridium (Ir)-Nickel (Ni) Alloy-metal targets (99.99% purity) with an Ir/Ni weight ratio of approximately 20%. The counter electrode was deposited on a 10x10 cm2 indium tin oxide (ITO) glass substrate using a fixed Ar/O2 gas flow ratio of 1/3. The deposition parameters implemented are detailed in Table 2.
2.3. Gel Polymer Electrolyte Preparation
The electrolyte system consisted of a 10 wt% solution of 89-98 k PVA (99% hydrolyzed) in a solvent mixture of 80:20 DMSO: H2O. The PVA was dissolved by stirring at 90°C for 2 hours and subjected to two freeze-thaw cycles under a vacuum to produce PVA gels. Following the freeze-thaw process, the PVA gels were immersed in three separate fresh DI water baths for 1 hour and subsequently soaked in DI water for an additional 24 hours to remove excess DMSO and form PVA hydrogels. These hydrogels were then immersed in baths containing BiCu ClO4 with a 0.1 wt% PVA additive electrolyte for 24 hours, allowing the water in the hydrogel to be replaced with sufficient liquid electrolyte, resulting in the formation of PVA gel polymer electrolyte (GPE) [35].
2.4. Experimental Details
Scanning electrochemical characteristics were analyzed using cycle voltammetry (CV) and chronoamperometry (CA) techniques with a PGSTAT30 model Autolab (Utrecht, The Netherlands) in a three-electrode system. The working electrode consisted of Ir:NiO /ITO/glass, the counter electrode was a platinum mesh, and the reference electrode was Ag/AgCl. The optical transmittance of the film was measured using an ultraviolet-visible (UV-Vis) spectrophotometer (model DH-2000-BAL, Ocean Optics, Dunedin, FL, USA) in the wavelength range of 300 nm to 900 nm, while in coloration and bleached states.
3. Results
3.1. Mo: WO3 /ITO Films: Electrochromic and Capacitive Performance
We investigated the electrochemical and energy storage properties of Mo: WO3/ITO/glass by constructing three-electrode cells. These cells consisted of a working electrode (Mo: WO3 film on ITO/glass), a counter-electrode (Pt mesh), and a reference electrode (Ag/AgCl) in a 0.5 M LiClO4/Perchlorate (LiClO4/PC) solution. Figure 2(a) displays the cycle voltammetry (CV) curves of Mo: WO3 films produced with different Ar/O2 gas flow ratios (1/4, 1/5, and 1/6) on ITO glass. The samples are denoted as Sample 1 (blue line), Sample 2 (red line), and Sample 3 (green line). The reaction that pertains to the colored and bleached states is described by Equation (1).
(W1-yMoy)O3(bleaching)+ x(Li+ + e−) ÛLix(W1-yMoy)O3 (coloration)
To achieve optimal performance of Mo-doped WO3 films deposited on ITO glass, cyclic voltammetry (CV) curves were conducted by scanning the potential from -1.5 V (coloring) to 1 V (bleaching) at a fixed rate of 0.1 V/s for the first cycle. Sample 2 exhibits a larger envelope area and much higher peak current compared to Samples 1 and 3, indicating greater participation of Li+ charge in the electrochemical redox reaction [36].
Figure 2
(b) illustrates the optical transmittance of Mo: WO3 films at a wavelength of 633 nm, under the same voltage range of -1.5 V to 1 V, with different Ar/O2 gas flow ratios, indicating the coloring/bleaching effect. It can be observed from
Figure 2
(b) that Sample 2 displays an extremely high transmittance modulation of 76% (89% in the bleached state and 13% in the colored state) at 633 nm, which is significantly greater than that of Sample 1 (27% modulation, with 39% in the bleached state and 12% in the colored state) and Sample 3 (58% modulation, with 71% in the bleached state and 13% in the colored state).
Figure 2(c) shows that the surface charge capacity of Mo: WO3 layers was determined by integrating the CA curves and ranged from -1.5 to 1 V versus AgCl/Ag for intercalation surface charges (Qin) and extraction surface charges (Qout). It is clearly observed in Figure 2 (c) that Mo: WO3 films with different Ar/O2 gas flow ratios of 1/4, 1/5, and 1/6 exhibit slight intercalation surface charges (Qin) for 19.65, 24.84, 22.19 mC/cm2 and extraction surface charges (Qout) for 15.63, 20.85, 17.8 mC/cm2, respectively. The speed at which the electrochromic system switches from one state to another is a crucial factor in its practical application. This is investigated through chronoamperometry, and the corresponding in situ transmittance at 633 nm is depicted in Figure 2(d).
Figure 2(d) illustrates the in-situ optical transmittance of Mo: WO3 films at a wavelength of 633 nm, under the same voltage range of -1.5 V to 1 V, with different Ar/O2 gas flow ratios (1/4, 1/5, and 1/6), demonstrating the coloring and bleaching effects. The coloration and bleaching times are defined as the duration required for a 90% alteration in the full transmittance modulation. The coloration switching times (tc) and bleaching switching times (tb) were very important factors for the Sample 2 system calculated with a tc of 9 s and tb of 9.8 s, respectively. In general, electrochromic materials with active properties exhibit a relatively slow response time due to their low electron transport conductivity. Electrochemical impedance spectroscopy (EIS) tools are used to conduct measurements on three-electrode for this cell. It consists of a working electrode (a Mo: WO3 film on ITO/glass), a counter-electrode (Pt mesh), and a reference electrode (Ag/AgCl) in a 0.5 M LiClO4/Perchlorate (LiClO4/PC). Figure 3(a) presents the corresponding Nyquist plots and analyzes the comparison of the charge transport kinetics of Mo-doped WO3/ITO/glass films under various Ar/O2 gas flow ratios (Sample 1-Sample 3). Each contains two distinct parts: a semicircle at high and medium frequencies and a straight line at low frequencies. The semicircle at high frequencies represents the resistance to Li+ ion migration across the electrode-electrolyte interface (Rf), while the semicircle at medium frequencies reflects the charge transfer reaction (Rct) [6]; the oblique line represents Li+ ion diffusion to the electrodes, which is associated with the Warburg impedance [5]. As shown in Figure 2(b), the point where the Re[Z](ohm) axis intersects at high frequency indicates the solution resistance (Rs) [3]. The values of Rs for Sample 1 (0.02 Ω) are similar to those of Sample 2 (0.03 Ω) and Sample 3 (0.01 Ω). Samples 1, 2, and 3 exhibited charge transfer resistances (Rct) of 35 Ω, 16.9 Ω, and 17.1 Ω, respectively. The Rct value for Sample 2 is the lowest compared to Mo: WO3/ ITO /glass, which may be due to Sample 2 having a larger enclosed area of the CV curves. This leads to faster charge transfer at the electrode-electrolyte interface [35], which can significantly contribute to larger diffusion coefficients of electrons and Li+ ions around the surface of Mo: WO3/ ITO /glass, thus enhancing the electrochemical response [29,42].
In addition, Equation (3) can be used to calculate the diffusion coefficient DLi of Li+ ions during the injection and extraction of ions into and out of Mo: WO3/ ITO /glass.
DLi =R2T2/(2A2n4F4C02σ2)
where R is the gas constant, T is the absolute temperature of the experiment, A is the surface area of the electrodes, n is the number of electrons per molecule during oxidation, F is the Faraday constant, and C0 is the concentration of Li+ ion in Mo: WO3 electrodes. The Warburg factor is calculated using the slope of Equation (3).
Z’= Rs+ Rct+σω-1/2
Here ω stands for the angular frequency. As shown in Figure 3 (b), σ values for cathodic coloring electrodes are calculated based on the linear correlation between Z' and ω-1/2, Samples 1, 2, and 3 exhibited σ of 48.5, 17.1, and 36.7, respectively. The corresponding DLi values are calculated using equation (3) (see Figure 3(c)). Sample 2 shows a significantly higher value (3.93×10⁻¹¹ cm2 s-1) than Sample 1 (4.28×10⁻¹²) and Sample 3 (6.81×10⁻¹²). This can be attributed to the presence of nanostructures, which provide more channels for the movement of lithium ions and electrons [32]. Sample 2 shows a significantly higher value of optical density (∆OD) defined as ln(Tbleaching/Tcoloration) at a wavelength of 633 nm (0.77) than Sample 1 (0.5) and Sample 3 (0.65). Sample 2 can rapidly supply electrons to the surface of Mo: WO3 layers, resulting in enhanced ambipolar (ionic and electronic) diffusion into and out of the EC electrodes [42].
Therefore, we can conclude that enhanced Li+ ion diffusion and reduced charge transfer resistance lead to improved electrode kinetics for Mo: WO3/ITO/glass-based coloration /bleaching, resulting in significantly improved performance [30]. R is defined as Qout/Qin representing ion reversibility, and Samples 1, 2, and 3 exhibited R of 79.54%, 83.93%, and 80.1%, respectively(see Figure 3(d)).
Figure 4 (a1)-(c1) shows top-view SEM and (a2)-(c2) cross-sectional morphologies of Mo: WO3 films images of Samples 1, 2, and 3, indicating a consistent thickness of 200 nm. The particle size is inversely proportional to the flow of increasing O2 gas. To reduce the spot residence time, high-speed steering of the arc spot was employed across the surface of the cathodic target. By altering the O2 gas, the surface of Mo: WO3 films may be polished to the point where the particles are reduced to macro-particles (MPs). The SEM image of Sample 2 shows the formation of nano-grains with a close-packed structure, resulting in nanoporous structures.
3.2. Characteristic of Ir: NiO/ITO films
The chemical composition of Ir: NiO/ ITO film was studied using the EDS spectrum shown in Figure 4 (a). The elemental composition of the Ir: NiO film, including the atomic percentage (at%) and weight percentage (wt%), is displayed in the inset. The table shows the presence of iridium (Ir), nickel (Ni), and oxygen (O).
The elements Ir and Ni are present in Ir: NiO. Sn and In are present in the ITO substrate, while O is present in both Ir: NiO and the ITO substrate. The absence of peaks other than those of the ITO substrate attributable to Ir, Ni, and O, confirms the deposition of an Ir: NiO film without any elemental impurities. The surface composition of the Ir: NiO/ ITO films prepared by the CAP technique was analyzed by X-ray photoemission spectrum (XPS). Electrochemical testing of the IrO2 doped Lix (NiO) was performed in a 0.5 M liquid-electrolyte solution of LiClO4/ PC using a three-electrode cell. The cell consisted of a working electrode (Ir: NiO film on ITO /glass), a counter-electrode (Pt mesh), and a reference electrode (Ag/AgCl). In Figure 5 (c) show the peaks Ir 4f7/2 and 4f5/2 that are located at binding energies of61.7eV and 64.7 eV corresponding to Ir4 f5/2 and Ir 4 f7/2 of Ir3+ in the LixIrO2. Te coloration process indicates the movement of Li+ ions and electrons into the Ir: NiO/ ITO flms, such that the Ir3+ extracted an e− to become Ir4+, resulting in a corresponding shif in the peak to a lower energy level. We evaluated ions transformed from the Ir3+ to the Ir4+state. In Figure 5(c), we calculated that approximately 35% (100nm) of the ions transformed from the Ir3+ to the Ir4+ state. Thus, we can deduce that only Ir3+ ions were present in the Ir: NiO/ ITO films in the bleached state (see Figure 5(b)). The 100 nm-thick Ir: NiO/ ITO films contained only Ir3+ions.
3.3. Bi-Functional ESECDs: Electrochromic and Energy-Storge Performance
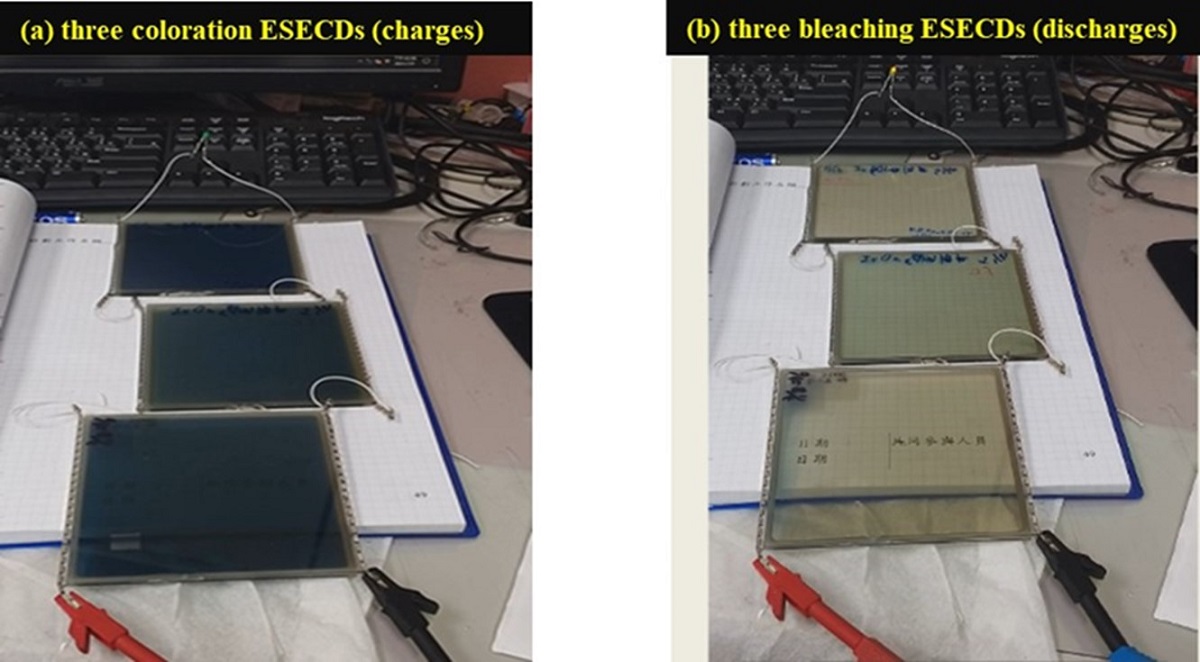
To demonstrate the potential of a working layer that utilizes Mo: WO3 films (O2/Ar ratio of 5 at the thickness of 200 nm)and a counter layer consisting of Ir: NiO films (O2/Ar ratio of 3 at the thickness of 100 nm), a bi-functional electrochromic supercapacitor device was constructed. Figure 6 displays a digital photograph of ESECDs (glass/ITO/Mo: WO3/gel polymer electrolyte/Ir: NiO films/ITO/glass) in both the coloration and bleaching states. The active area of the ESECDs is 10 × 10 cm2. The optical images of ESECDs show a deep blue coloration state under a negative potential of -2.2 V. Once a reverse potential of +2 V was applied, the ESECDs showed a bleaching state. Furthermore, Figure 6 demonstrates that a series connection of three colored states (charges) based on Ir: NiO-ESECDs can illuminate a 2.15 V yellow LED, indicating the practical applicability of these devices as energy storage systems for EC smart windows. The Ir: NiO-ESECDs demonstrate integrated energy storage, and the color variations resulting from this energy can be used to indicate the charge-discharge state of the device.
In general, ESECDs with high durability and stability are required to prevent the accumulation of trapped ions (Qtrap). The accumulated Qtrap can be calculated as follows [37,38].
Here, Qin represents the amount of inserted ions, and R represents ion reversibility, which is expressed as the ratio of ions extracted to ions inserted. The value of Qtrap depends on Qin and R. In addition, the charge density of inserted ion and extracted ion can be calculated by the integration of CV curves [39], which the following Equation (6)
Figure 7(a) shows the plot of current density versus voltage during the first cycle of the applied sweep voltage, ranging from -2.5 V to 2.5 V, at three scanning rates of 0.05, 0.10, and 0.15 V/s, respectively. From the CV curve, it can be observed that the area under the curve for all three types of ESECDs increases as the scan rate increases. The charge densities of the inserted ions, calculated by equation (6) are shown in Figure 7(b). From Equations (5) and (6), the charge density varies directly with the area under the CV curve, but inversely with the scan rate. ESECDs exhibit the least Qtrap at 0.15 V/s scanning rates, which is smaller than that of 0.1 V/s and 0.05 V/s. Figure 7(c) shows the relationship between the charge of trapped ions and scan rates, demonstrating that slower scan rates lead to the formation of more trapped ions in ESECDs.
Figure 8(a) presents the durability of ESECDs up to the 1000 times CV cycles at a sweep voltage of - 2.5V to 2.5V and a scanning rate of 0.15V. Figure 8(b), the reversibility (R for ESECDs) of Ir: NiO -based ESECDs is about from 0.96 to 0.95. It seems that the high R-value reduces the amount of trapped ions and the probability of ion blockage, which affects the driving force and the time of the ion insertion process. Figure 8(c) presents the electrochromic performance of Ir: NiO- ESECDs (glass/ITO/Mo: WO3/gel-polymer electrolytes/ Ir: NiO /ITO/glass) with an active area of 10 × 10 cm2. Figure 8(c) presents the in-situ transmittance of ESECDs, as analyzed during a continuous potential cycle from −2.2 V (coloration potential, Vc) to 2 V (bleaching potential, Vb). Figure 8(c) shows that the coloration state (charge process) and bleaching state (discharge process) of ESECDs were measured by CA curves and in-situ optical response of transmittance at fixed 633 nm. The coloration and bleaching of switching times or speed was a prominent characteristic of the ESECD system, which was defined as the time required for a 90% change in the full transmittance modulation.
As shown in Figure 8(c), it achieves a maximum optical modulation reached 53% (from Tbleaching (66.6%) to Tcoloration (13.1%))and the switching times at a wavelength of 633 nm were obtained coloration (9.1 sec) and bleaching (3.6 sec) in intervals of 10 s. Note that the optical transmittance modulation measured with the CA curves had the same trend as the optical transmittance modulation measured with the CV curves. The durable stability of Ir: NiO- ESECDs is an important factor to determine whether the mass-produce can work function in real life. Figure 8(d) presents the long-time 3000 number cycles. After 3000 cycles of bleaching/coloration operation, which retained 96% (4% decayed) of its initial state. The high contrast optical performance and good durability of ESECDs could be attributed to the inserted MoO3-doped WO3 (Mo: WO3) and IrO2-doped NiO films for the electrochromic electrode. New anodic discoloration materials may provide new insight to develop energy-storage prominent candidates for use in smart windows.
4. Conclusions
We investigated the influence of MoO3-doped WO3 (Mo: WO3) film by various Ar/O2 gas flow ratios (1/4, 1/5, and 1/6). According to the results, in Sample 2, the σ value was calculated based on the linear correlation between Z' and ω-1/2, which σ exhibited 17.1, and the corresponding DLi was significantly higher values (3.93×10⁻¹¹ cm2 s-1). This can be attributed to the presence of nanostructures, which provide more channels for the movement of Li ions and electrons. In this study, we fabricated counter electrodes (ion storage layers) using IrO2 doping NiO (Ir: NiO) films and cathodic arc plasma (CAP). New anodic materials can provide alternatives to traditional active materials for bi-functional electrochromic batteries.
The ESECDs used in the demonstration were 10×10 cm2 in size and achieved optical transmittance modulation of Ir: NiO- ESECDs (glass/ITO/ Mo: WO3/gel-polymer electrolytes/ Ir: NiO /ITO/glass), ΔT=53.3% (from Tbleaching (66.6%) to Tcoloration (13.1%)). Furthermore, Figure 6 demonstrates that a series connection of three colored states (charges) based on Ir: NiO-ESECDs can illuminate a 2.15 V yellow LED, indicating the practical applicability of these devices as energy storage systems for EC smart windows. We present the durability of ESECDs up to the 3000 times CV cycles and the reversibility (R for ESECDs) of Ir: NiO -based ESECDs is about from 0.96 to 0.95. After 3000 cycles of bleaching/coloration operation, which retained 96% (4% decayed) of its initial state. The high contrast optical performance and good durability of ESECDs could be attributed to the inserted MoO3-doped WO3 (Mo: WO3) and IrO2-doped NiO films for the electrochromic electrode.
References
- Wang, J.; Zhang, L.; Yu, L.; Jiao, Z.; Xie, H.; Lou, X.W.; Sun, X.W. A bi-functional device for self-powered electrochromic window and self-rechargeable transparent battery applications. Nat. Commun. 2014, 5, 4921. [Google Scholar] [CrossRef] [PubMed]
- Cai, G.; Wang, X.; Cui, M.; Darmawan, P.; Wang, J.; Eh, A.L.-S.; Lee, P.S. Electrochromo-supercapacitor based on direct growth of NiO nanoparticles. Nano Energy 2015, 12, 258–267. [Google Scholar] [CrossRef]
- Ghosh, A.; Norton, B. Advances in switchable and highly insulating autonomous (self-powered) glazing systems for adaptive low energy buildings. Renew. Energy 2018, 126, 1003–1031. [Google Scholar] [CrossRef]
- Kou, Z.; Wang, J.; Tong, X.; Lei, P.; Gao, Y.; Zhang, S.; Cui, X.; Wu, S.; Cai, G. Multi-functional electrochromic energy storage smart window powered by CZTSSe solar cell for intelligent managing solar radiation of building. Solar Energy Materials & Solar Cells 2023, 254, 112273. [Google Scholar]
- Baetens, R.; Jelle, B.P. Gustavsen, Properties, requirements and possibilities of smart windows for dynamic daylight and solar energy control in buildings: A state-of-the-art review. Sol. Energ. Mat. Sol. C. 2010, 94, 87–105. [Google Scholar] [CrossRef]
- Eh, A.L.-S.; Tan AW, M.; Cheng, X.; Magdassi, S.; Lee, P.S. Recent Advances in Flexible Electrochromic Devices: Prerequisites, Challenges, and Prospects. Energy Technol. 2017, 6, 33. [Google Scholar] [CrossRef]
- Zhao, S.-Q.; Liu, Y.-H.; Ming, Z.; Chen, C.; Xu, W.-W.; Chen, L.; Huang, W. Highly Flexible Electrochromic Devices Enabled by Electroplated Nickel Grid Electrodes and Multifunctional Hydrogels. Opt. Express 2019, 27, 29547. [Google Scholar] [CrossRef]
- Liu, Q.; Xu, Z.; Qiu, W.; Hou, C.; Wang, Y.; Yao, P.; Yu, R.; Guo, W.; Liu, X.Y. Ultraflexible, Stretchable and Fast-Switching Electrochromic Devices with Enhanced Cycling Stability. RSC Adv. 2018, 8, 18690. [Google Scholar] [CrossRef]
- Rozman, M.; Zener, B.; Matoh, L.; Godec, R.F.; Mourtzikou, A.; Stathatos, E.; Bren, U.; Lukšic, M. Flexible Electrochromic Tape Using Steel Foil with WO3 Thin Film. Electrochim. Acta 2020, 330, 135329. [Google Scholar] [CrossRef]
- Ko, T.F.; Chen, P.W.; Li, K.M.; Young, H.T.; Chang, C.T.; Shu, S.C. High Performance Complementary Electrochromic Device Based on Iridium Oxide as a Counter Electrode. Materials 2021, 14, 1591. [Google Scholar] [CrossRef]
- Chen, P.W.; Chang, C.T.; Ali, M.; Wu, J.-Y.; Li, Y.-C.; Chen, M.-H.; Jan, D.-J.; Yuan, C.-T. Tantalum oxide film deposited by vacuum cathodic arc plasma with improved electrochromic performance. Sol. Energy Mater. Sol. Cells 2018, 182, 188–195. [Google Scholar] [CrossRef]
- Chen, P.W.; Chang, C.T.; Ko, T.F.; Hsu, S.C.; Li, K.F.; Wu, J.Y. Fast response of complementary electrochromic device based on WO3/NiO electrodes. Sci. Rep. 2020, 10, 8430. [Google Scholar] [CrossRef] [PubMed]
- Wei, C.C.; Wu, T.H.; Huang, J.W.; Young BLi Jian, W.B.; Lin, Y.L.; Chen, J.T.; Hsu, C.S.; Ma, Y.R.; Tsukagoshi, K. Nanoparticulate films of WO3 and MoO3 composites for enhancing UV light electrochromic transmittance variation and energy storage applications Electrochim. Acta 2023, 442, 141897. [Google Scholar]
- Granqvist, C.G. Electrochromics for smart windows: Oxide-based thin films and devices. Thin Solid Films 2014, 564, 1–38. [Google Scholar] [CrossRef]
- Chang, J.Y.; Chen, Y.C.; Wang, C.M.; Wang, W.N.; Wen, C.Y.; Lin, J.M. Electrochromic properties of Lithium-doped tungsten oxide prepared by electron beam evaporation. Coatings 2019, 9, 191. [Google Scholar] [CrossRef]
- Kim, K.H.; Koo, B.R.; Ahn, H.J. Title of the chapter Sheet resistance dependence of fluorine-doped tin oxide films for high-performance electrochromic devices. Ceram. Int. 2018, 44, 9408–9413. [Google Scholar] [CrossRef]
- Jiang, B.; Lou, B.; Li, J.; Peng, P.; Chen, J.W.; Chu, L.H.; Li, Y.F.; Li, M.C. Electrochemical effect of graphite fluoride modification on Li-rich cathode material in lithium ion battery. Ceram. Int. 2019, 45, 160–167. [Google Scholar] [CrossRef]
- Runnerstrom, E.L.; Llorde´s, A.; Lounisac, S.D.; Milliron, D.J. Nanostructured electrochromic smart windows:traditional materials and NIR-selective plasmonic nanocrystals. Chem. Commun. 2014, 50, 10555–10572. [Google Scholar] [CrossRef]
- Li, H.; McRaea, L.; Firby, C.J.; Hussein, M.A.; Elezzabi, A.Y. Nanohybridization of molybdenum oxide with tungsten molybdenum oxide nanowires for solution-processed fully reversible switching of energy storing smart windows. Nano. Energy. 2020, 47, 130–139. [Google Scholar] [CrossRef]
- Lang, F.; Liu, J.; Wang, H.; Yan, H. NiO nanocrystalline/reduced graphene oxide composite film with enhanced electrochromic properties. Nano. 2017, 12, 1750058. [Google Scholar] [CrossRef]
- Cai, G.; Darmawan, P.; Cui, M.; Chen, J.; Wang, X.; Eh, A.L.S.; Magdassi, S.; Lee, P.S. , Inkjet-printed all solid-state electrochromic devices based on NiO/WO3. Nanoscale. 2016, 8, 348–357. [Google Scholar] [CrossRef] [PubMed]
- Ko, T.F.; Chen, P.W.; Li, K.M.; Young, H.T. ; Applied IrO2 Buffer Layer as a Great Promoter on Ti-Doping V2O5 Electrode to Enhance Electrochromic Device Properties. Materials 2022, 15, 1579. [Google Scholar] [CrossRef] [PubMed]
- Li, K.D.; Chen, P.W.; Chang, K.S. Low-Temperature Deposition of Transparent Conducting Films Applied to Flexible Electrochromic Devices. Materials 2021, 14, 4959. [Google Scholar]
- Madhavi, V.; Kumar, P.J.; Kondaiah, P.; Hussain, O.M.; Uthanna, S. Efect of molybdenum doping on the electrochromic properties of tungsten oxide thin fms by RF magnetron sputtering. Ionics. 2014. 20, 1737–1745.
- Pooyodying. Pattarapon.; Son, Y.H.; Sung, Y.M.; Ok, J.W. The effect of sputtering Ar gas pressure on optical and electrical properties of flexible ECD device with WO3 electrode deposited by RF magnetron sputtering on ITO/PET substrate. Opt. Mater. 2022, 123, 111829. [Google Scholar] [CrossRef]
- Panagopoulou, M.; Vernardou, D.; Koudoumas, E.; Tsoukalas, D.; Raptis, Y.S. Oxygen and temperature effects on the electrochemical and electrochromic properties of rf-sputtered V2O5 thin films. Electrochim. Acta. 2017, 232, 54–63. [Google Scholar] [CrossRef]
- Liu, Y.; Jia, C.; Wan, Z.; Weng, X.; Xie, J.; Deng, L. Electrochemical and electrochromic properties of novel nanoporous NiO/ V2O5 hybrid film. Sol. Energy Mater Sol. Cells. 2015, 132, 467–475. [Google Scholar] [CrossRef]
- Najdosk, M.; Koleva, V.; Samet, A. ; Effect of deposition conditions on the electrochromic properties of nanostructured thin films of ammonium intercalated vanadium pentoxide xerogel. J. Phys. Chem. C. 2014, 118, 9636–9646. [Google Scholar] [CrossRef]
- Yu, D.M.; Zhang, S.T.; Liu, D.W.; Zhou, X.Y.; Xie, S.H.; Zhang, Q.F.; Liu, Y.Y.; Cao, G.Z. Effect of manganese doping on Li-ion intercalation properties of V2O5 films. J. Mater. Chem. 2010, 20, 10841–10846. [Google Scholar] [CrossRef]
- Loi, M.R.; Moura, E.A.; Westphal, T.M.; Balboni, R.D.C.; Gündelc, A.; Flores, W.H.; Pereira., M.B.; Santos, M.J.L.; Santos., J.F.L.; Pawlicka, A.; Avellaneda, C.O. Impact of Zr precursor on the electrochemical properties of V2O5 sol-gel films. J. Electroanal. Chem. 2019, 839, 67–74. [Google Scholar] [CrossRef]
- Moura, E.A.; Cholan, C.M.; Balboni, R.D.C.; Westphal, T.M.; Lemos, R.M.J.; Azevedo, C.F.; Gündel, A.; Flores, W.H.; Gomez, J.A.; Ely, F.; Pawlicka, A.; Avellaneda, C.O. Electrochemical properties of thin films of V2O5 doped with TiO2. J. Phys. Chem. Solids. 2018, 119, 1–8. [Google Scholar] [CrossRef]
- Vasanth, R.D.; Ponpandian, N.; Mangalaraj, D.; Viswanathan, C. Effect of annealing and electrochemical properties of sol–gel dip coated nanocrystalline V2O5 thin films. Mater. Sci. Semicond. Process. 2013, 16, 256–262. [Google Scholar] [CrossRef]
- Sinha, S.K. Effect of temperature on structural, optical and electrical properties of pulsed-laser deposited W-doped V2O5 thin films. Superlattices Microstruct. 2019, 25, 88–94. [Google Scholar] [CrossRef]
- Qiu, D.; Wu, J.; Liang, L.; Zhang, H.; Cao, H.; Yong, W.; Tian, T.; Gao, J.; Zhuge, F. Structural and electrochromic properties of undoped and Mo-doped V2O5 thin films by two-electrode electrodeposition. J. Nanosci. Nanotechnol. 2018, 18, 7502–7507. [Google Scholar] [CrossRef]
- Cai, Y.; Hernandez, T.S.; et al. Gel polymer electrolyte for reversible metal electrodeposition dynamic windows enables dual-working electrodes for faster switching and reflectivity control. Front. Nanotechnol. 2022, 4, 1083247. [Google Scholar] [CrossRef]
- Liu, Q.; Chen, Q.; Zhang, Q.; Dong, G.; Zhong, X.; Xiao, Yu.; Delplancke-Ogletree, M.P.; Reniers, F.; Diao, X. Dynamic behaviors of inorganic all-solid-state electrochromic device: Role of potential. Electrochim. Acta. 2018, 269, 617–623. [Google Scholar] [CrossRef]
- Zhou, K.L.; Wang, H.; Zhang, Y.Z.; Liu, J.B.; Yan, H. Electroanalysis 2017, 29, 1573. [CrossRef]
- Zhou, K.; Wang, H.; Liu, J.; Yan, H. Int. J. Electrochem. Sci. 2018, 13, 7335–7346. [CrossRef]
- Zhou, K.L.; Wang, H.; Zhang, Y.Z.; Liu, J.B.; Yan, H. J. Electrochem.Soc. 2016, 163, 1033. [CrossRef]
Figure 1.
Schematic representation for CAP technique synthesis of Mo: WO3/ITO under various Ar/O2 gas flow ratios (1/4, 1/5, and 1/6), and Ir: NiO Ar/O2 gas flow ratios (1/3) films.
Figure 1.
Schematic representation for CAP technique synthesis of Mo: WO3/ITO under various Ar/O2 gas flow ratios (1/4, 1/5, and 1/6), and Ir: NiO Ar/O2 gas flow ratios (1/3) films.
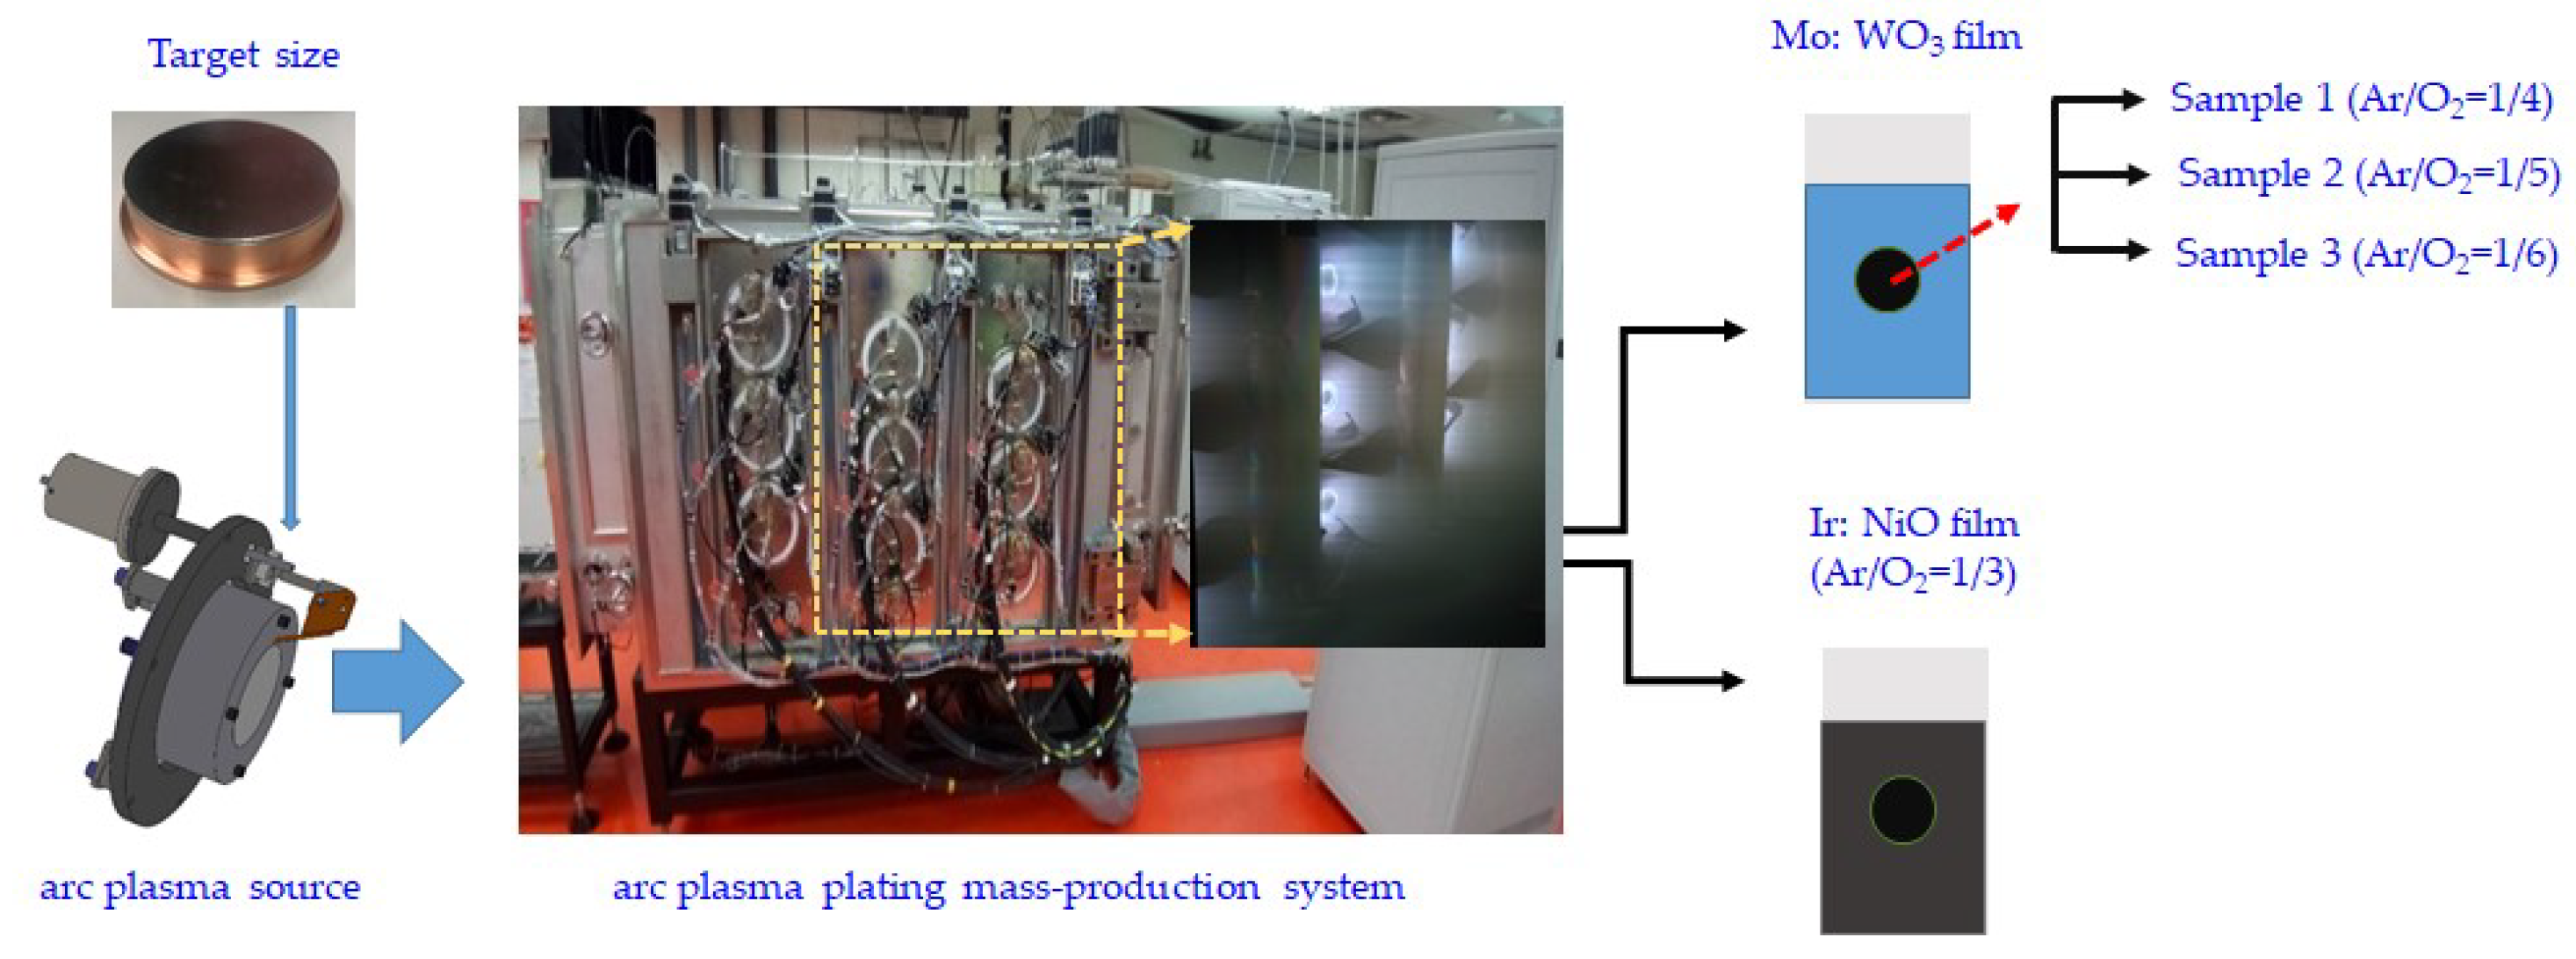
Figure 2.
(a) Cycle voltammetry (CV) curves of Mo: WO3 films produced with different Ar/O2 gas flow ratios (1/4, 1/5, and 1/6) on ITO glass as working electrode in a 0.5 M LiClO4/Perchlorate (LiClO4/PC), a counter-electrode (Pt mesh), and a reference electrode (Ag/AgCl). (b) Optical transmittance of Mo: WO3 films with different Ar/O2 gas flow ratios for the coloring/bleaching states (c) Surface charge capacity of Mo: WO3 layers were determined by intercalation surface charges (Qin) and extraction surface charges (Qout) (d) the in-situ optical transmittance of Mo: WO3 films at a wavelength of 633 nm.
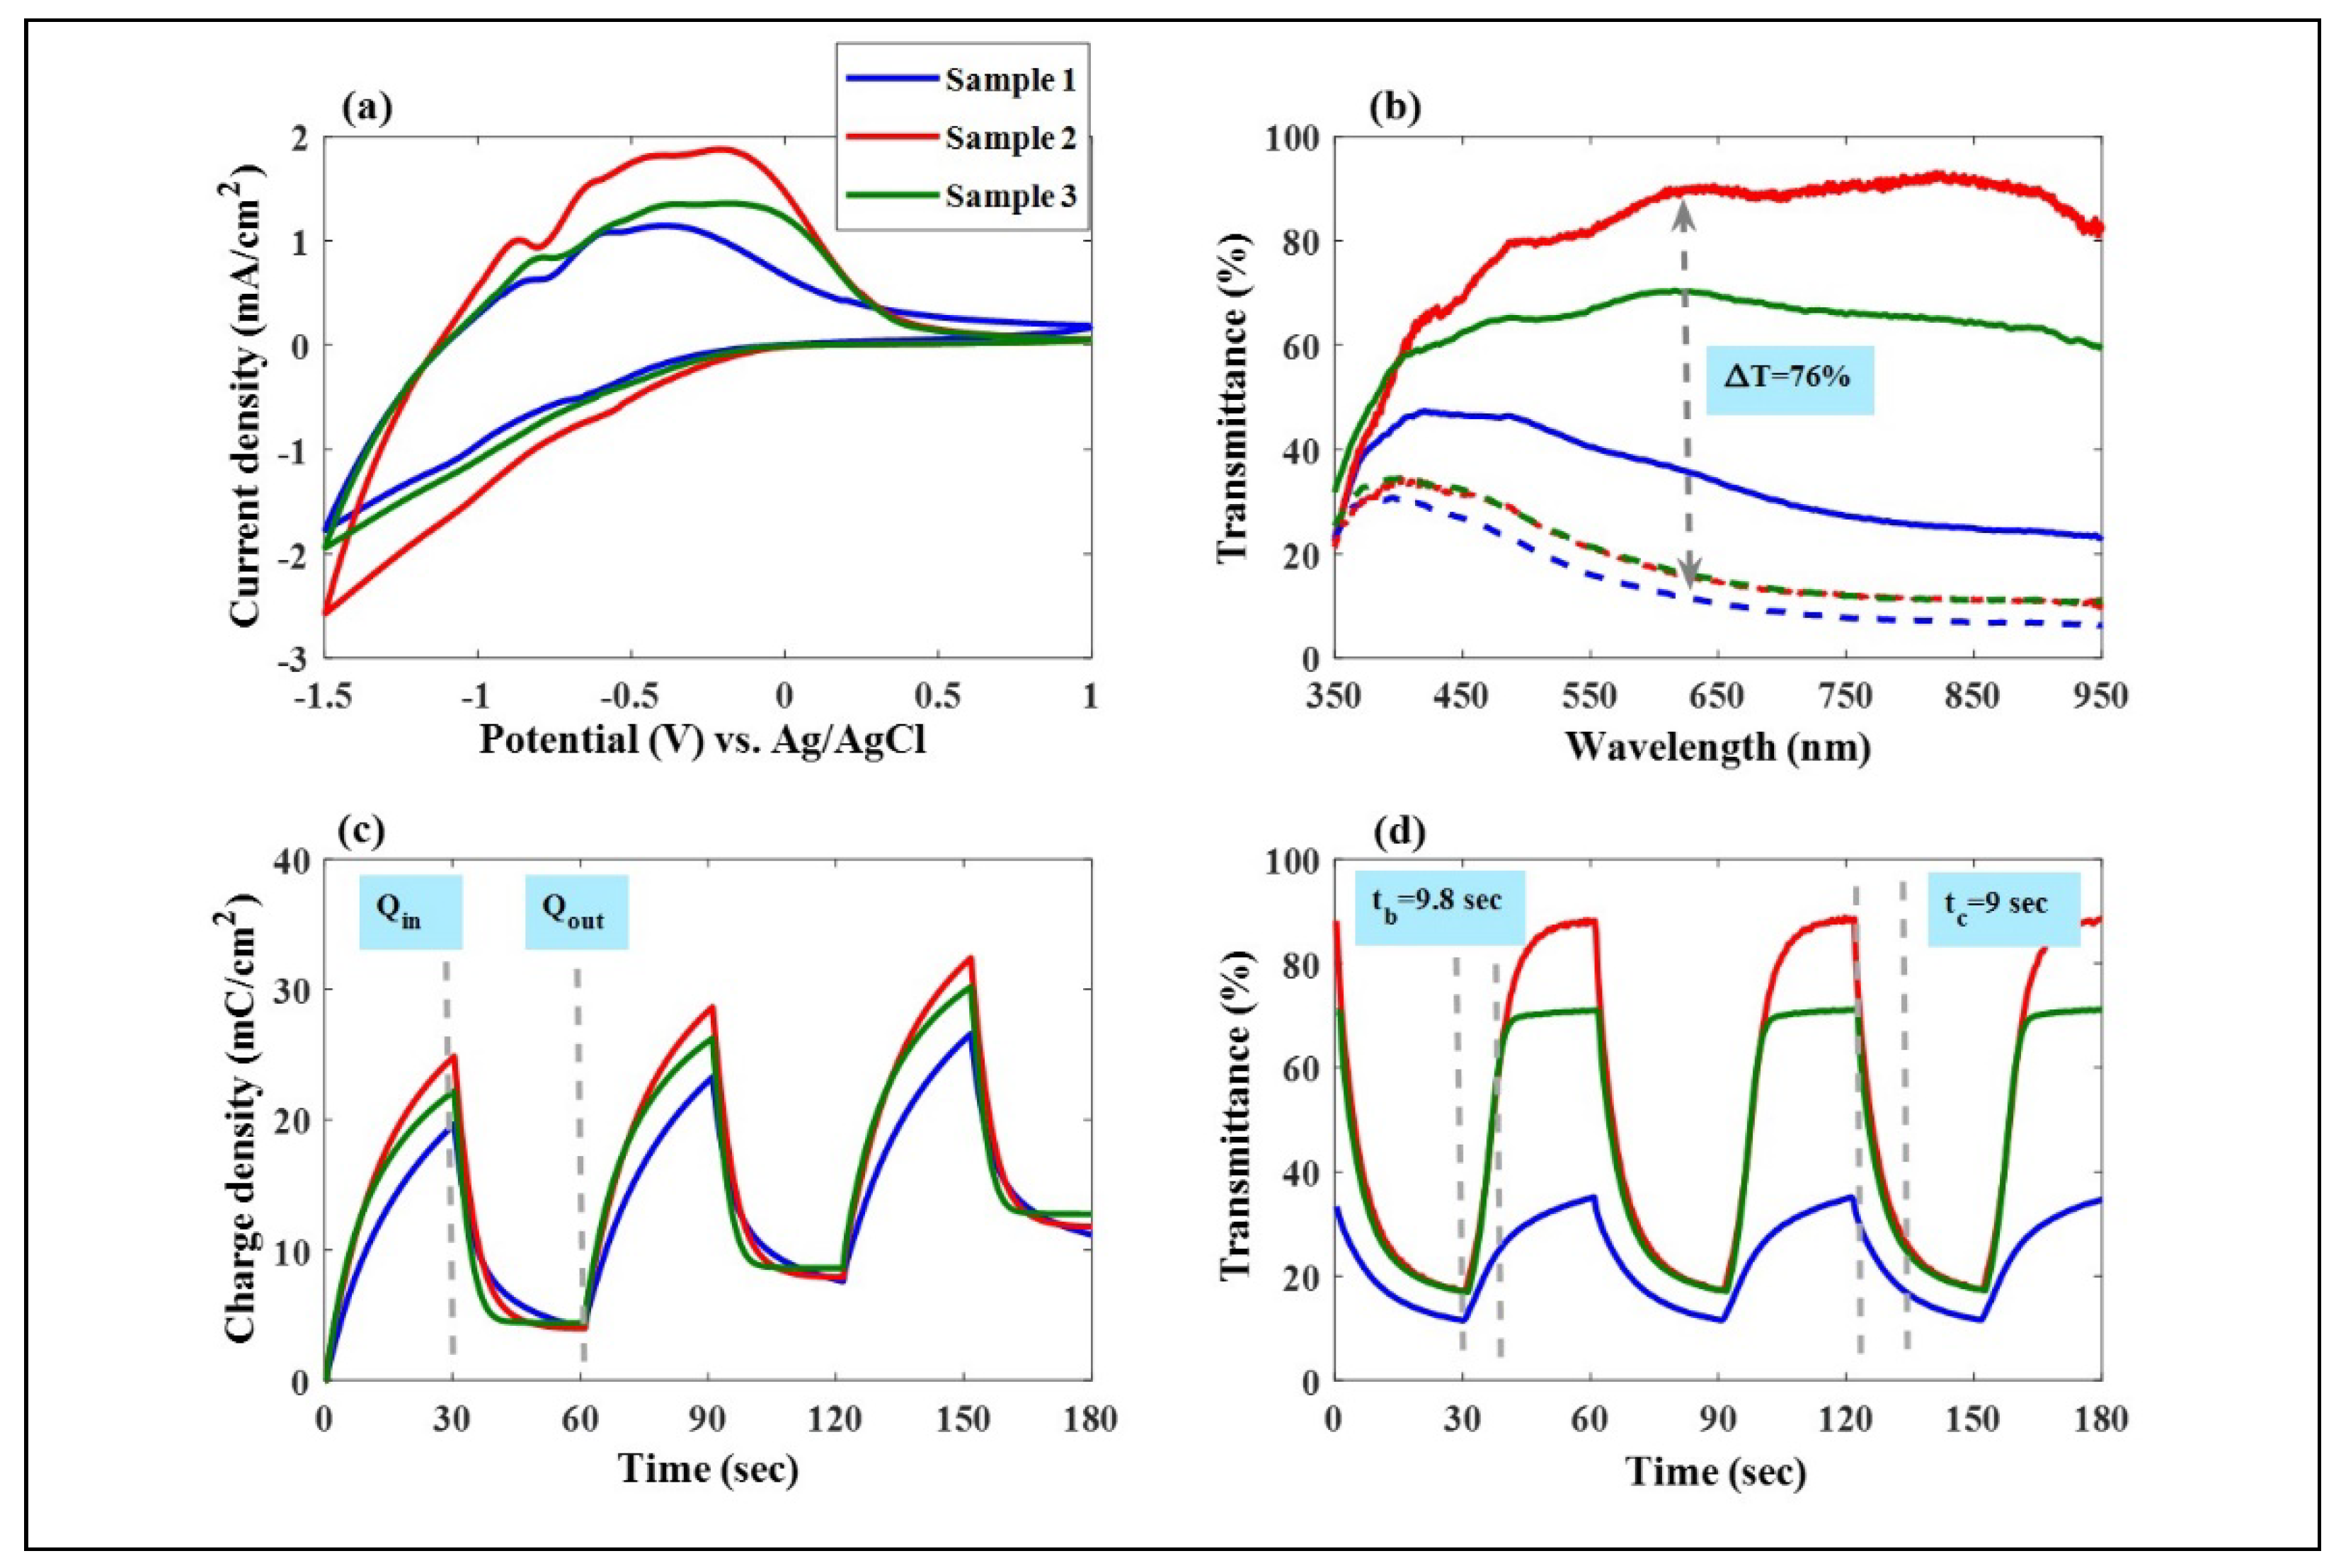
Figure 3.
(a) Nyquist plots of various Ar/O2 gas flow ratios (Sample 1-Sample 3) from 100kHz to 0.1Hz; (b) the relationship between Z' and ω-1/2 for Samples 1, 2, and 3 at low-frequency region; (c) The corresponding DLi values and optical density (∆OD) at a wavelength of 633 nm for Samples 1, 2, and 3 (d) R represents ion reversibility for Samples 1, 2, and 3.
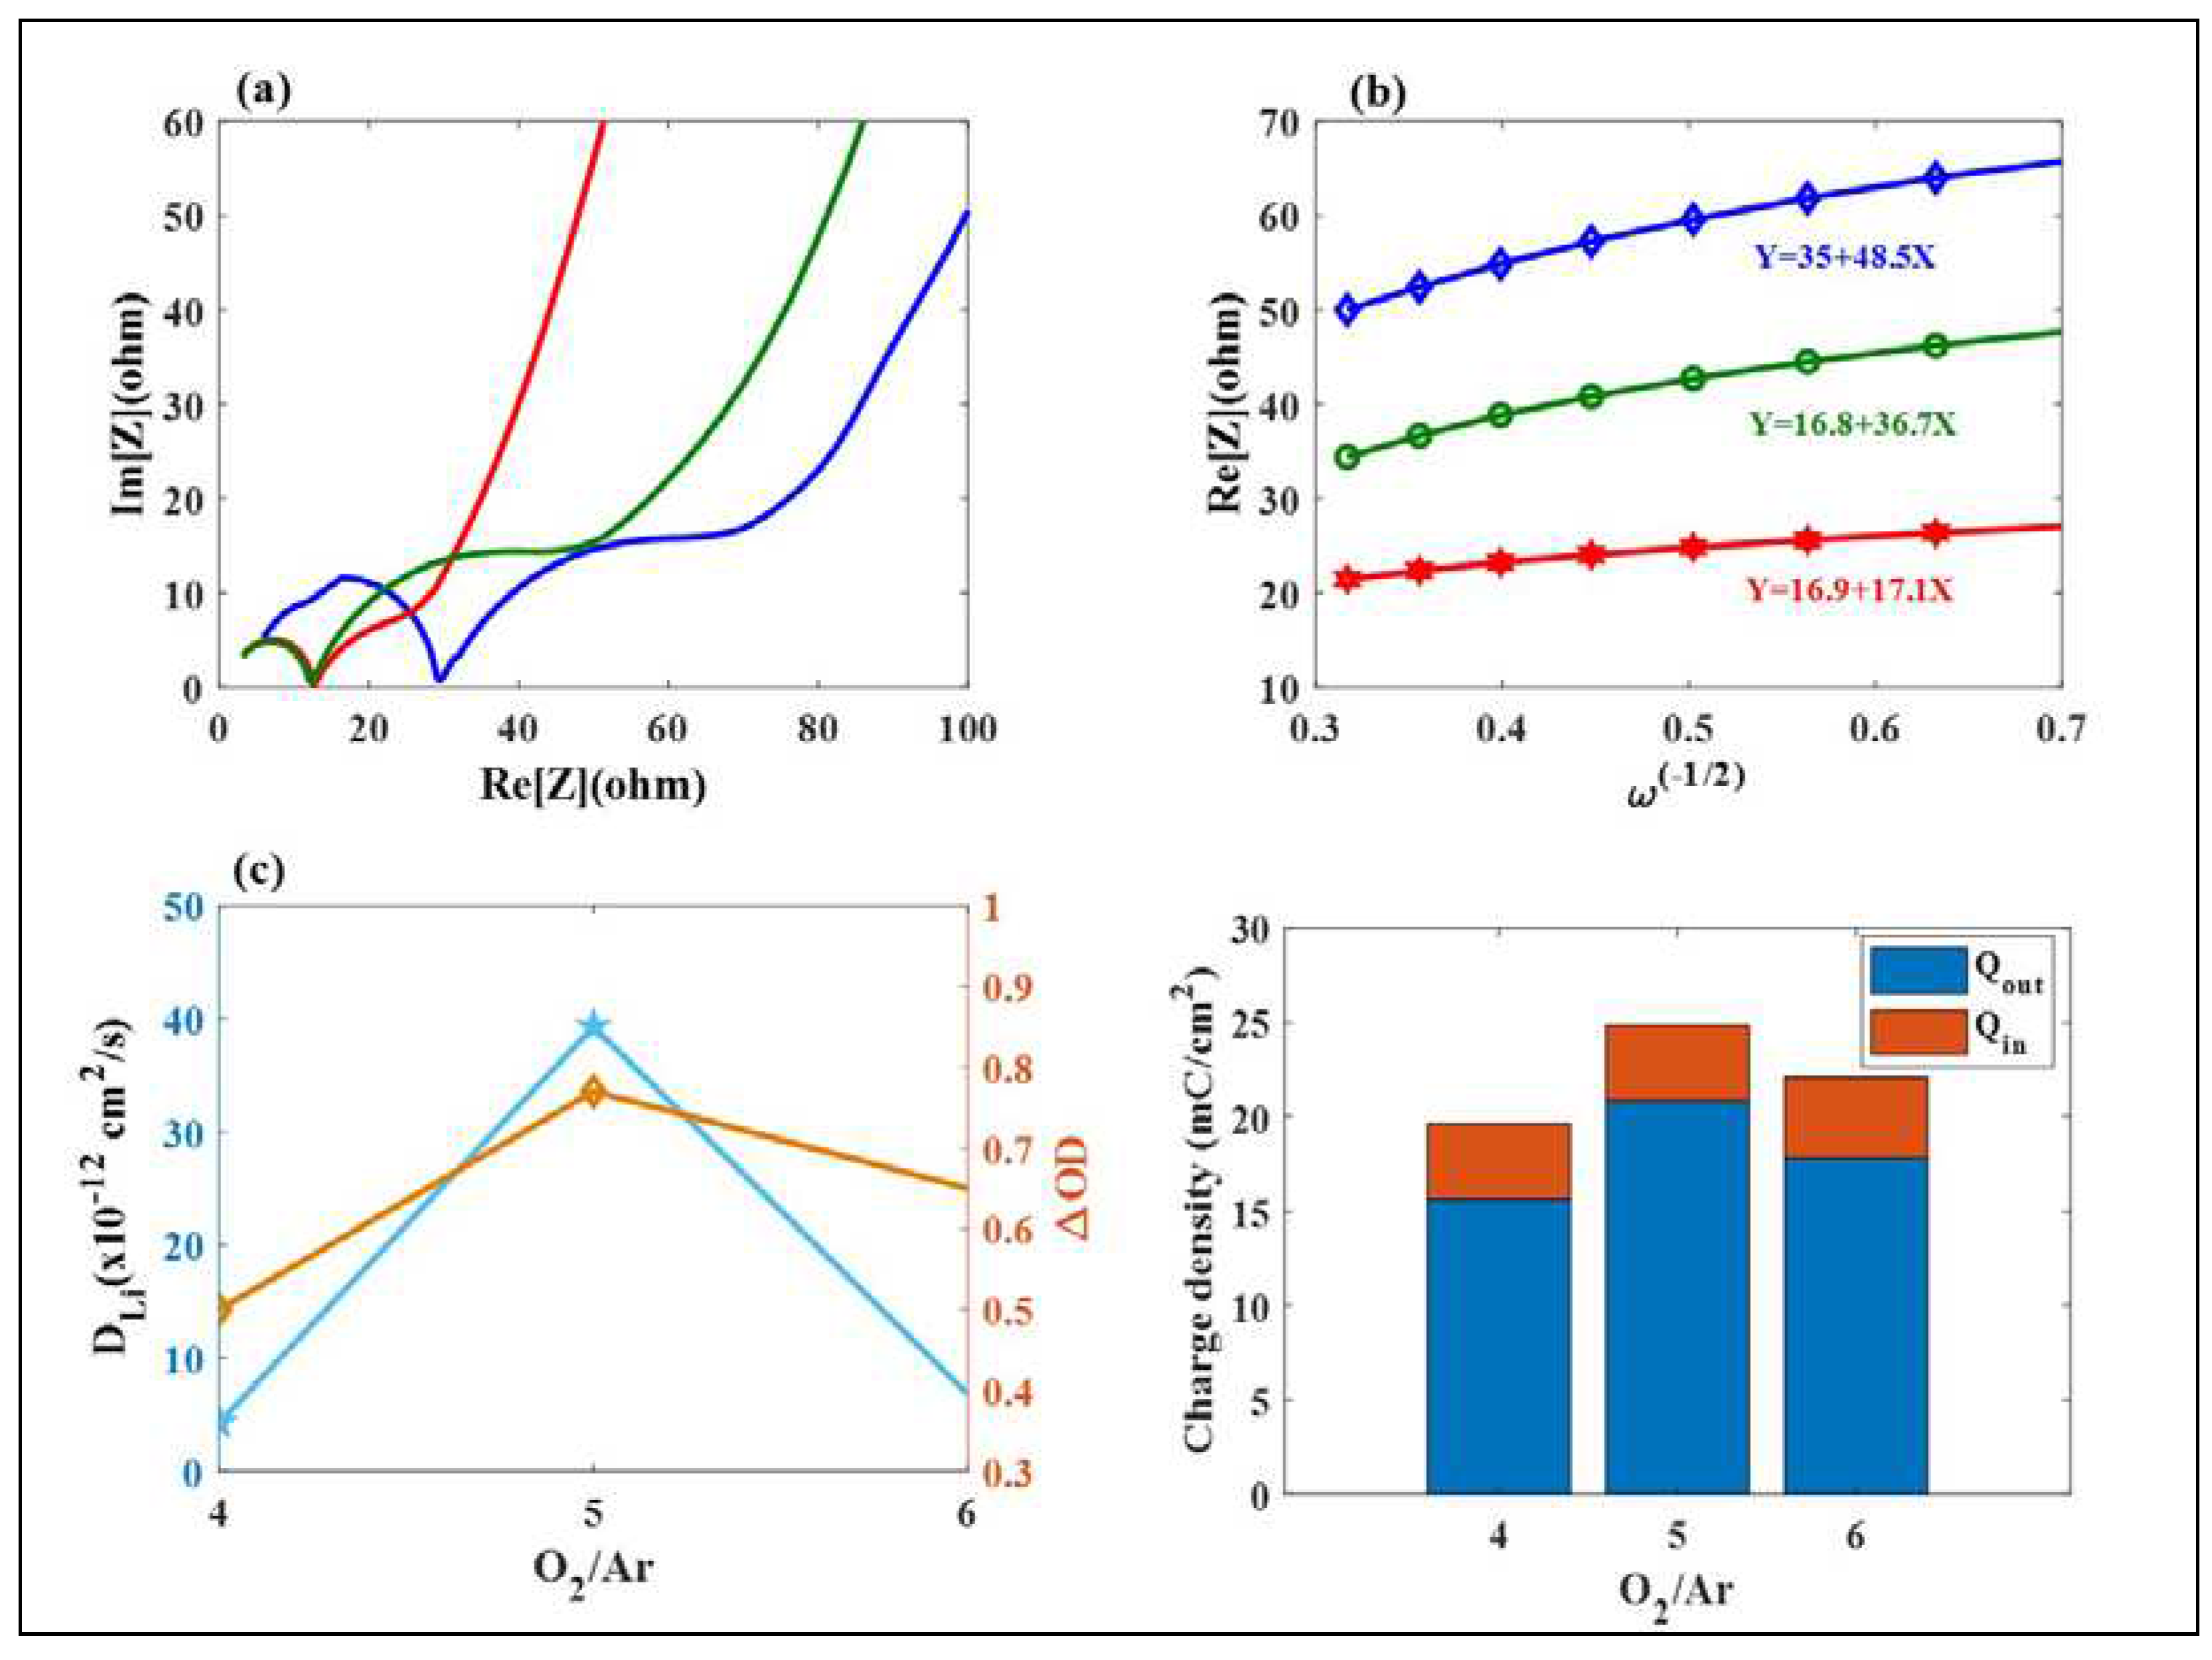
Figure 4.
(a1)-(c1) top-view SEM of Mo: WO3 films images for (Sample 1-Sample 3); (a2)-(c2) cross-sectional morphologies of Mo: WO3 films images for (Sample 1-Sample 3).
Figure 4.
(a1)-(c1) top-view SEM of Mo: WO3 films images for (Sample 1-Sample 3); (a2)-(c2) cross-sectional morphologies of Mo: WO3 films images for (Sample 1-Sample 3).
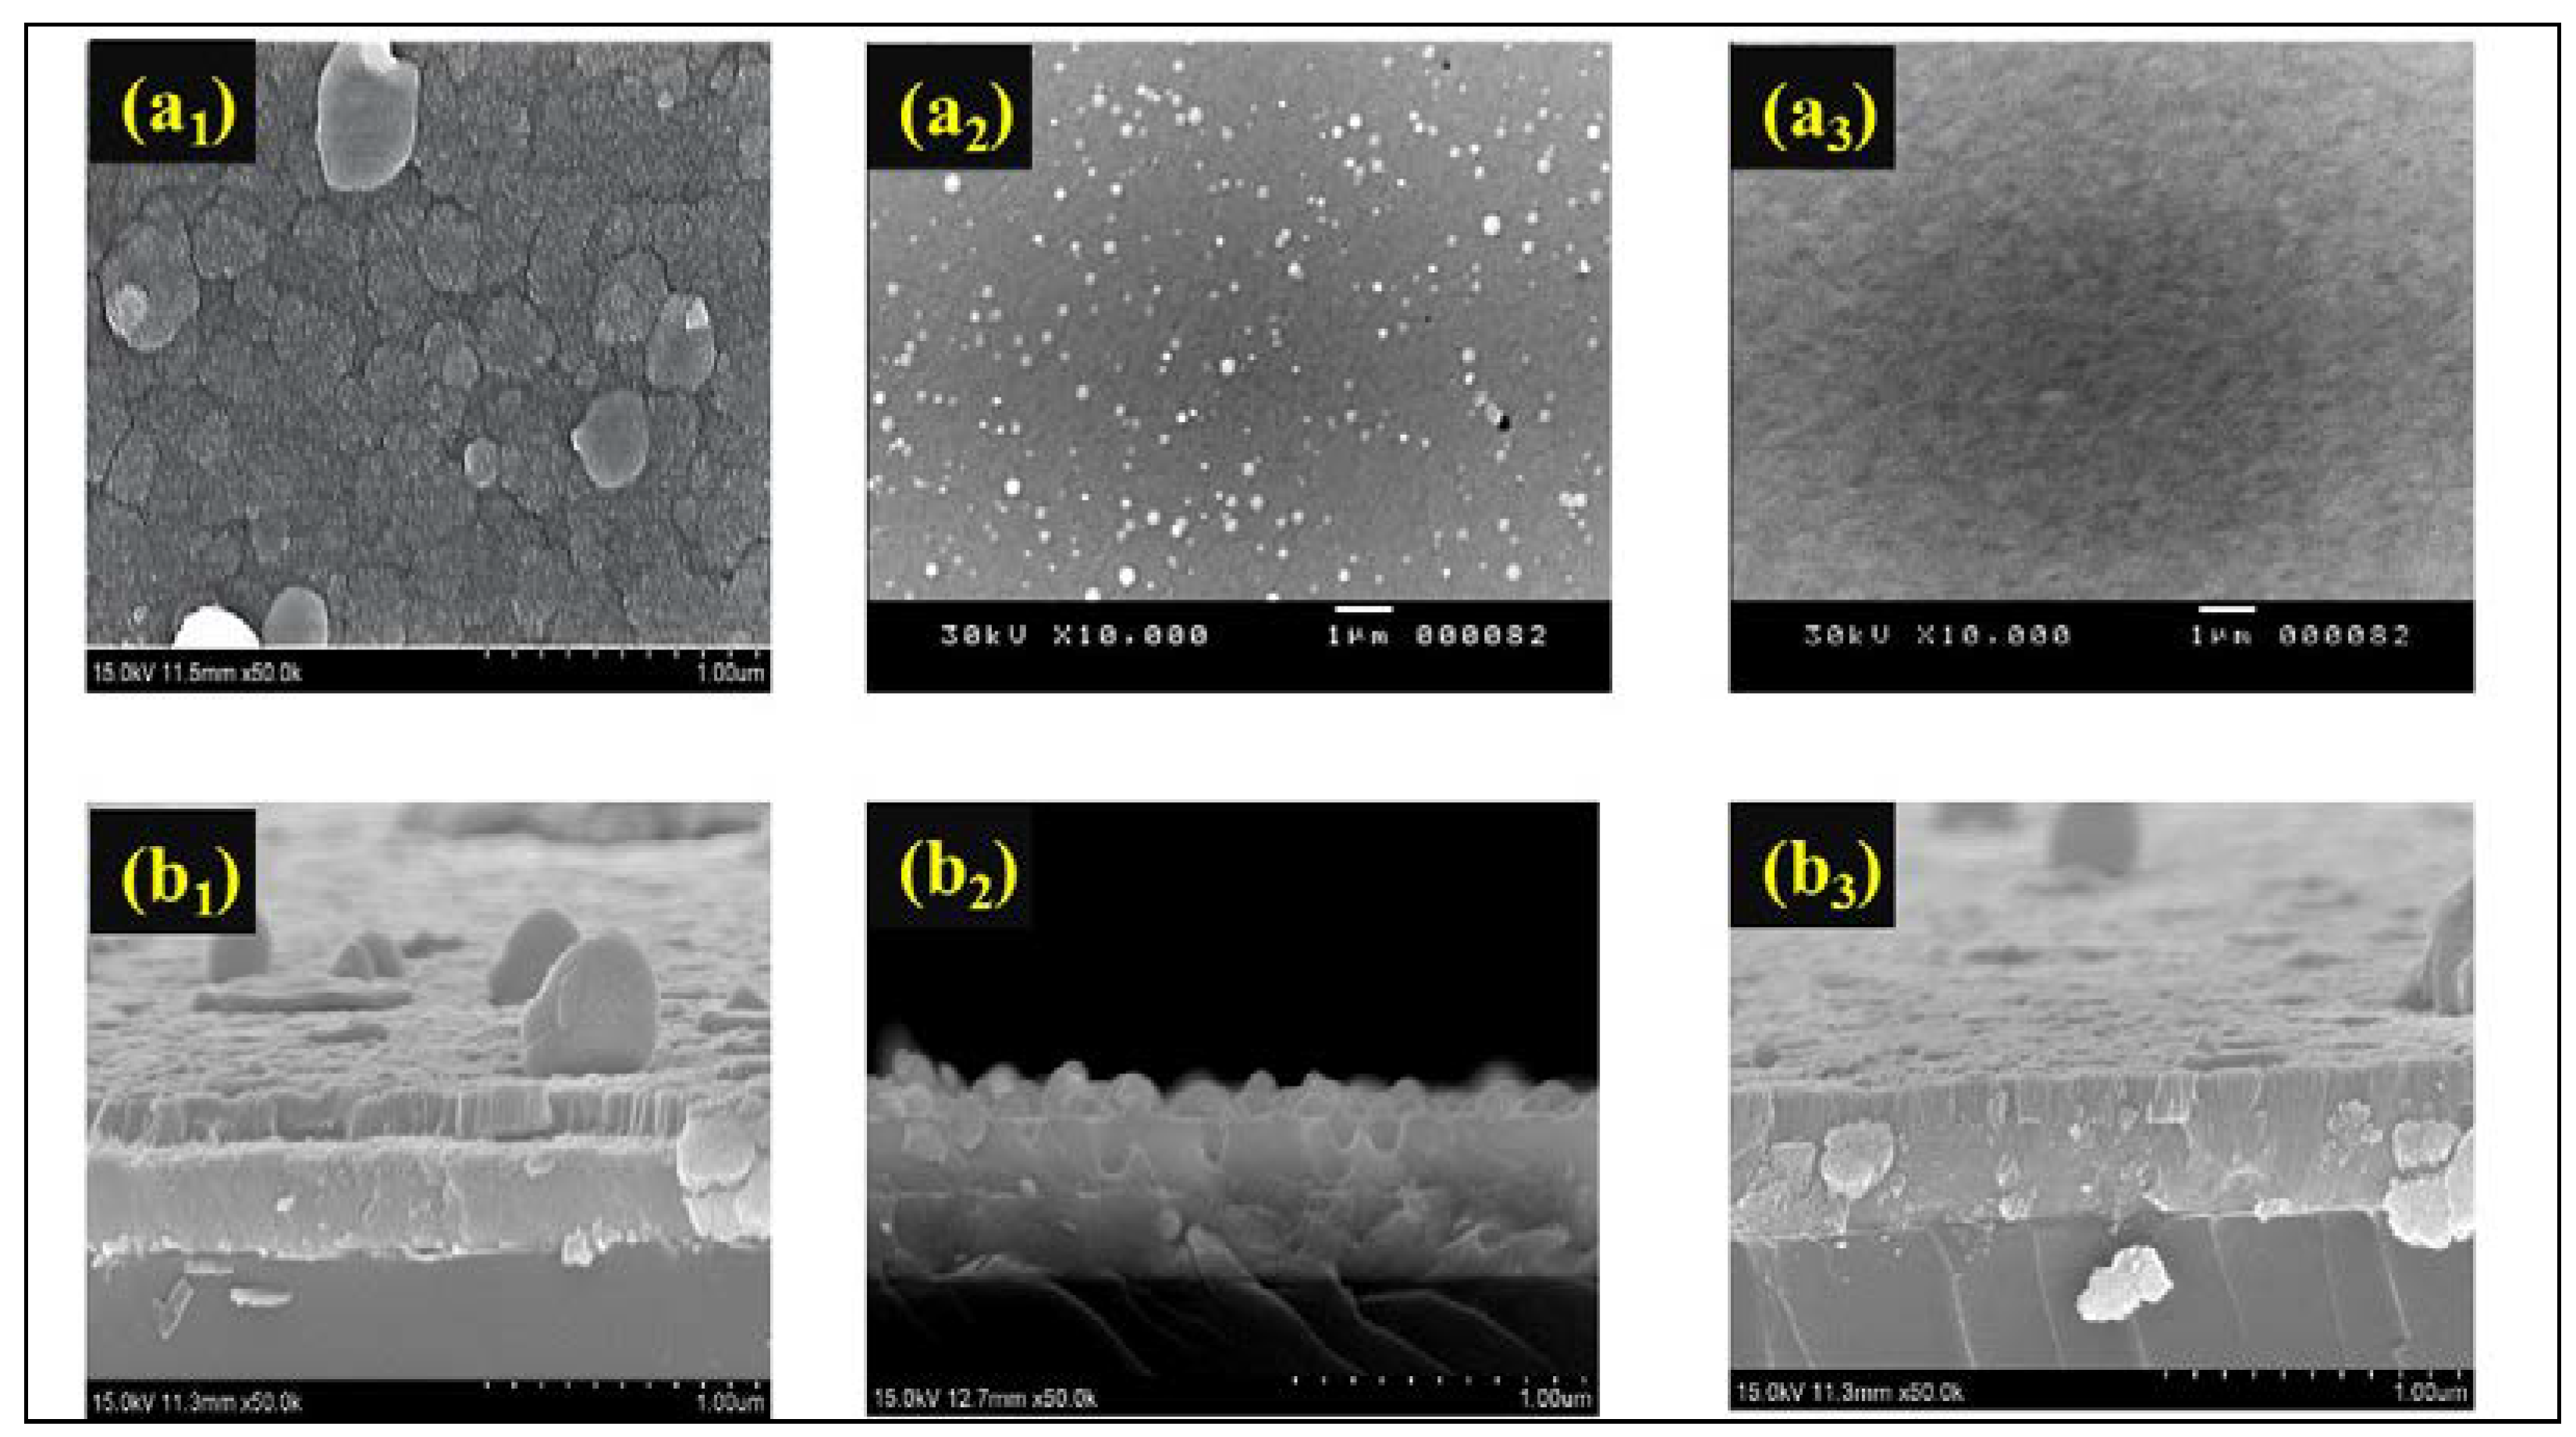
Figure 5.
(a) EDS spectrum of Ir: NiO/ ITO film onto ITO coated glass; (b) Highresolution XPS Ir4f spectra of bleaching Ir: NiO/ ITO flm at 100-nm-thick.(c) High-resolution XPS Ir4f spectra of coloration Ir: NiO/ ITO flm at 100-nm-thick.
Figure 5.
(a) EDS spectrum of Ir: NiO/ ITO film onto ITO coated glass; (b) Highresolution XPS Ir4f spectra of bleaching Ir: NiO/ ITO flm at 100-nm-thick.(c) High-resolution XPS Ir4f spectra of coloration Ir: NiO/ ITO flm at 100-nm-thick.
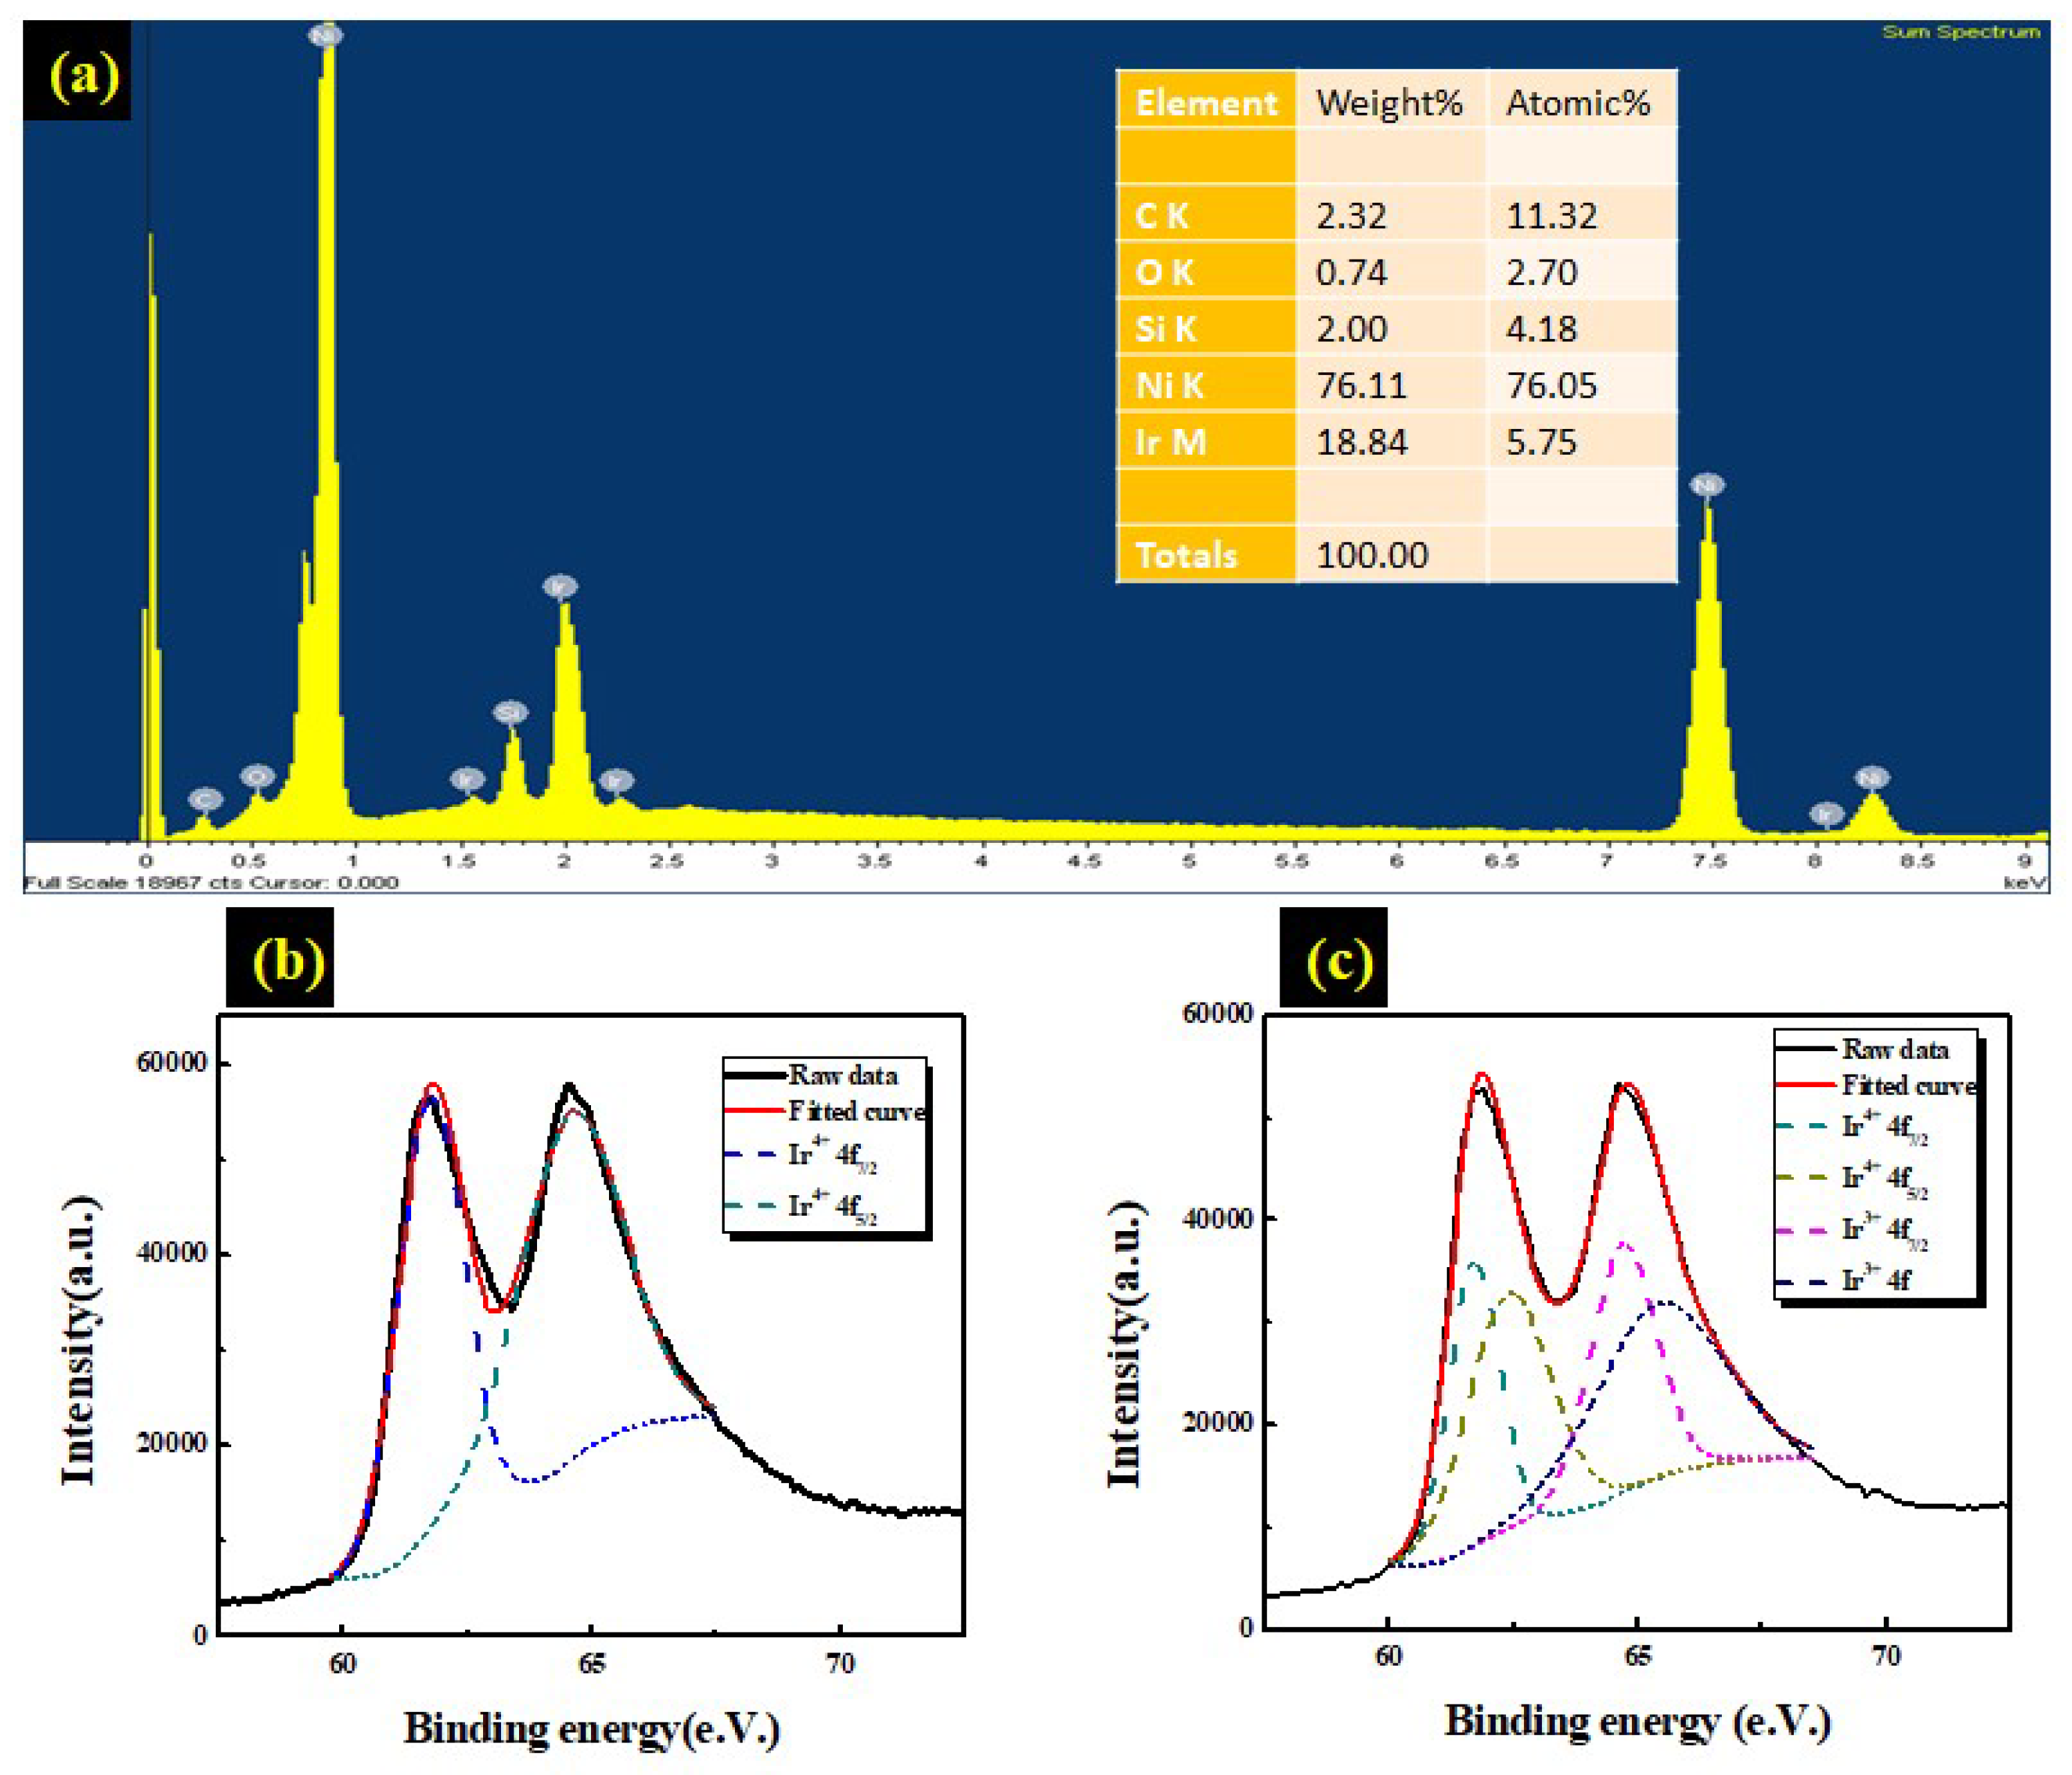
Figure 6.
(a) Digital image of connection of three ESECDs at coloration state; (b) Three ESECDs at bleaching state (discharge) can light yellow LED, which contributes bi-functional electrochromic supercapacitor.
Figure 6.
(a) Digital image of connection of three ESECDs at coloration state; (b) Three ESECDs at bleaching state (discharge) can light yellow LED, which contributes bi-functional electrochromic supercapacitor.
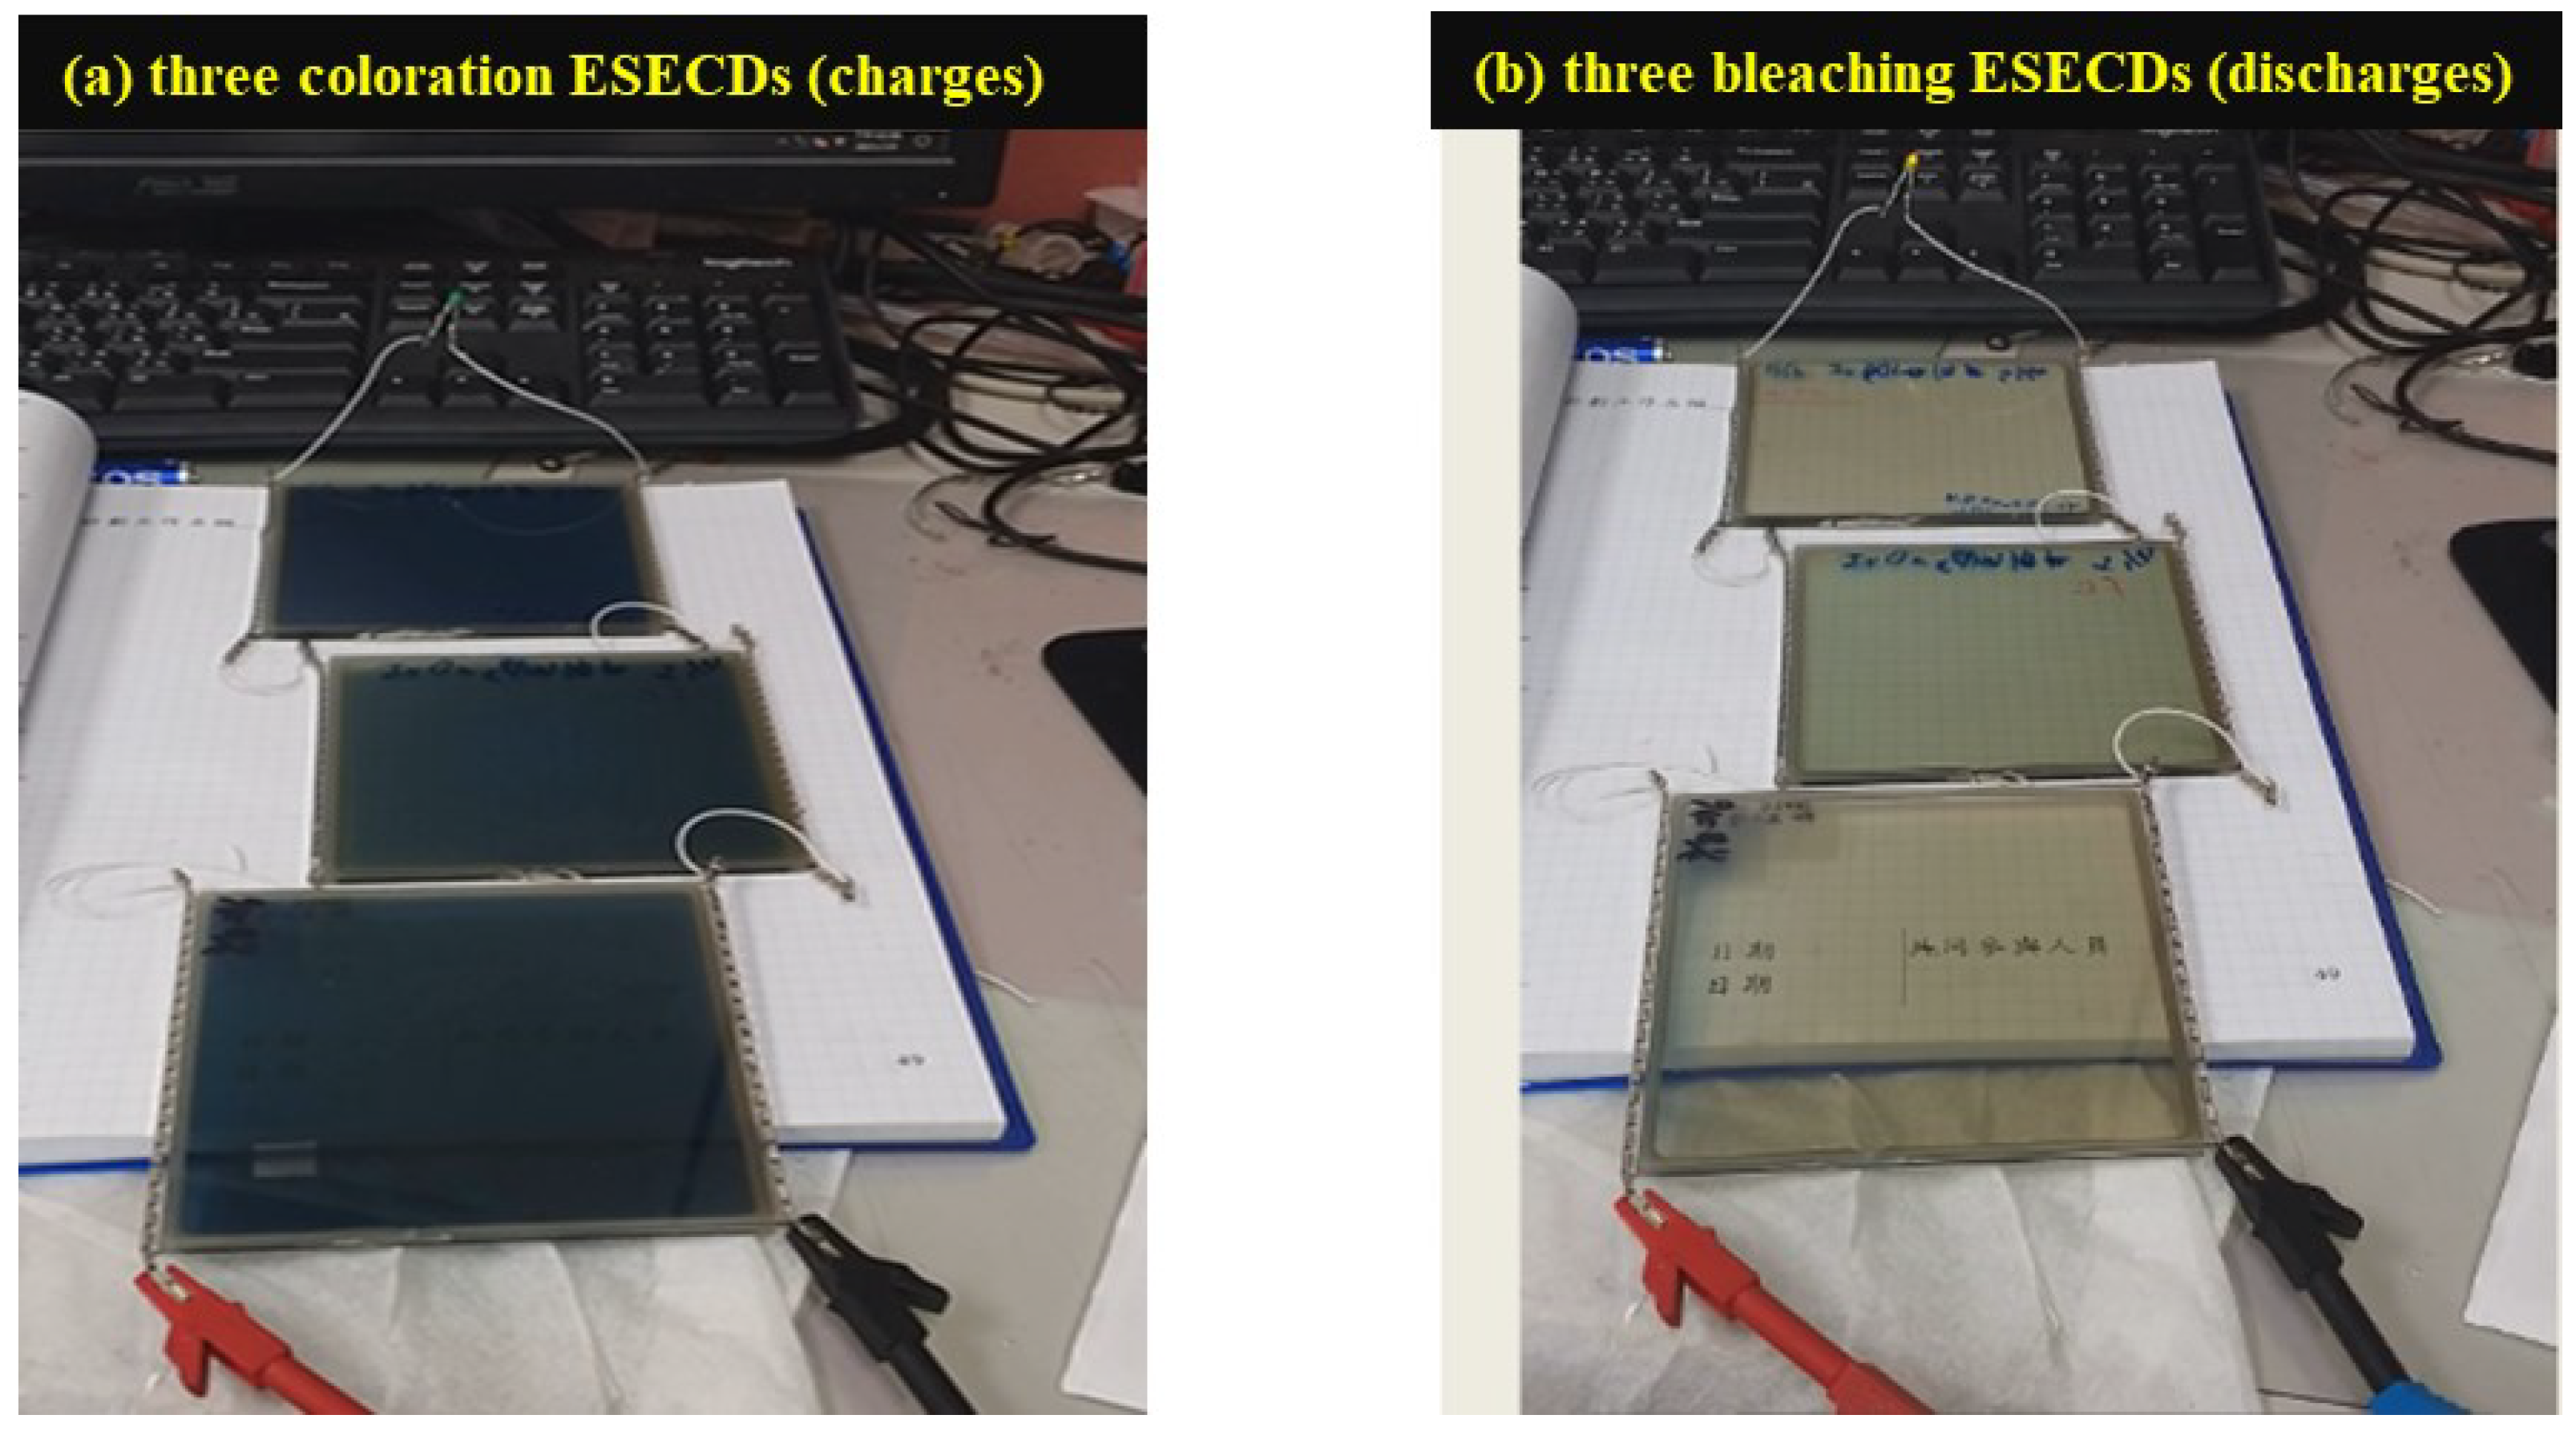
Figure 7.
Electrochemical properties and electrochromic performances of ESECDs under different scan rates by CV test. (a) CV curves. (b) The charge density of the inserted ions and extracted ions. (c) The relationship between trapped ions and scan rates.
Figure 7.
Electrochemical properties and electrochromic performances of ESECDs under different scan rates by CV test. (a) CV curves. (b) The charge density of the inserted ions and extracted ions. (c) The relationship between trapped ions and scan rates.
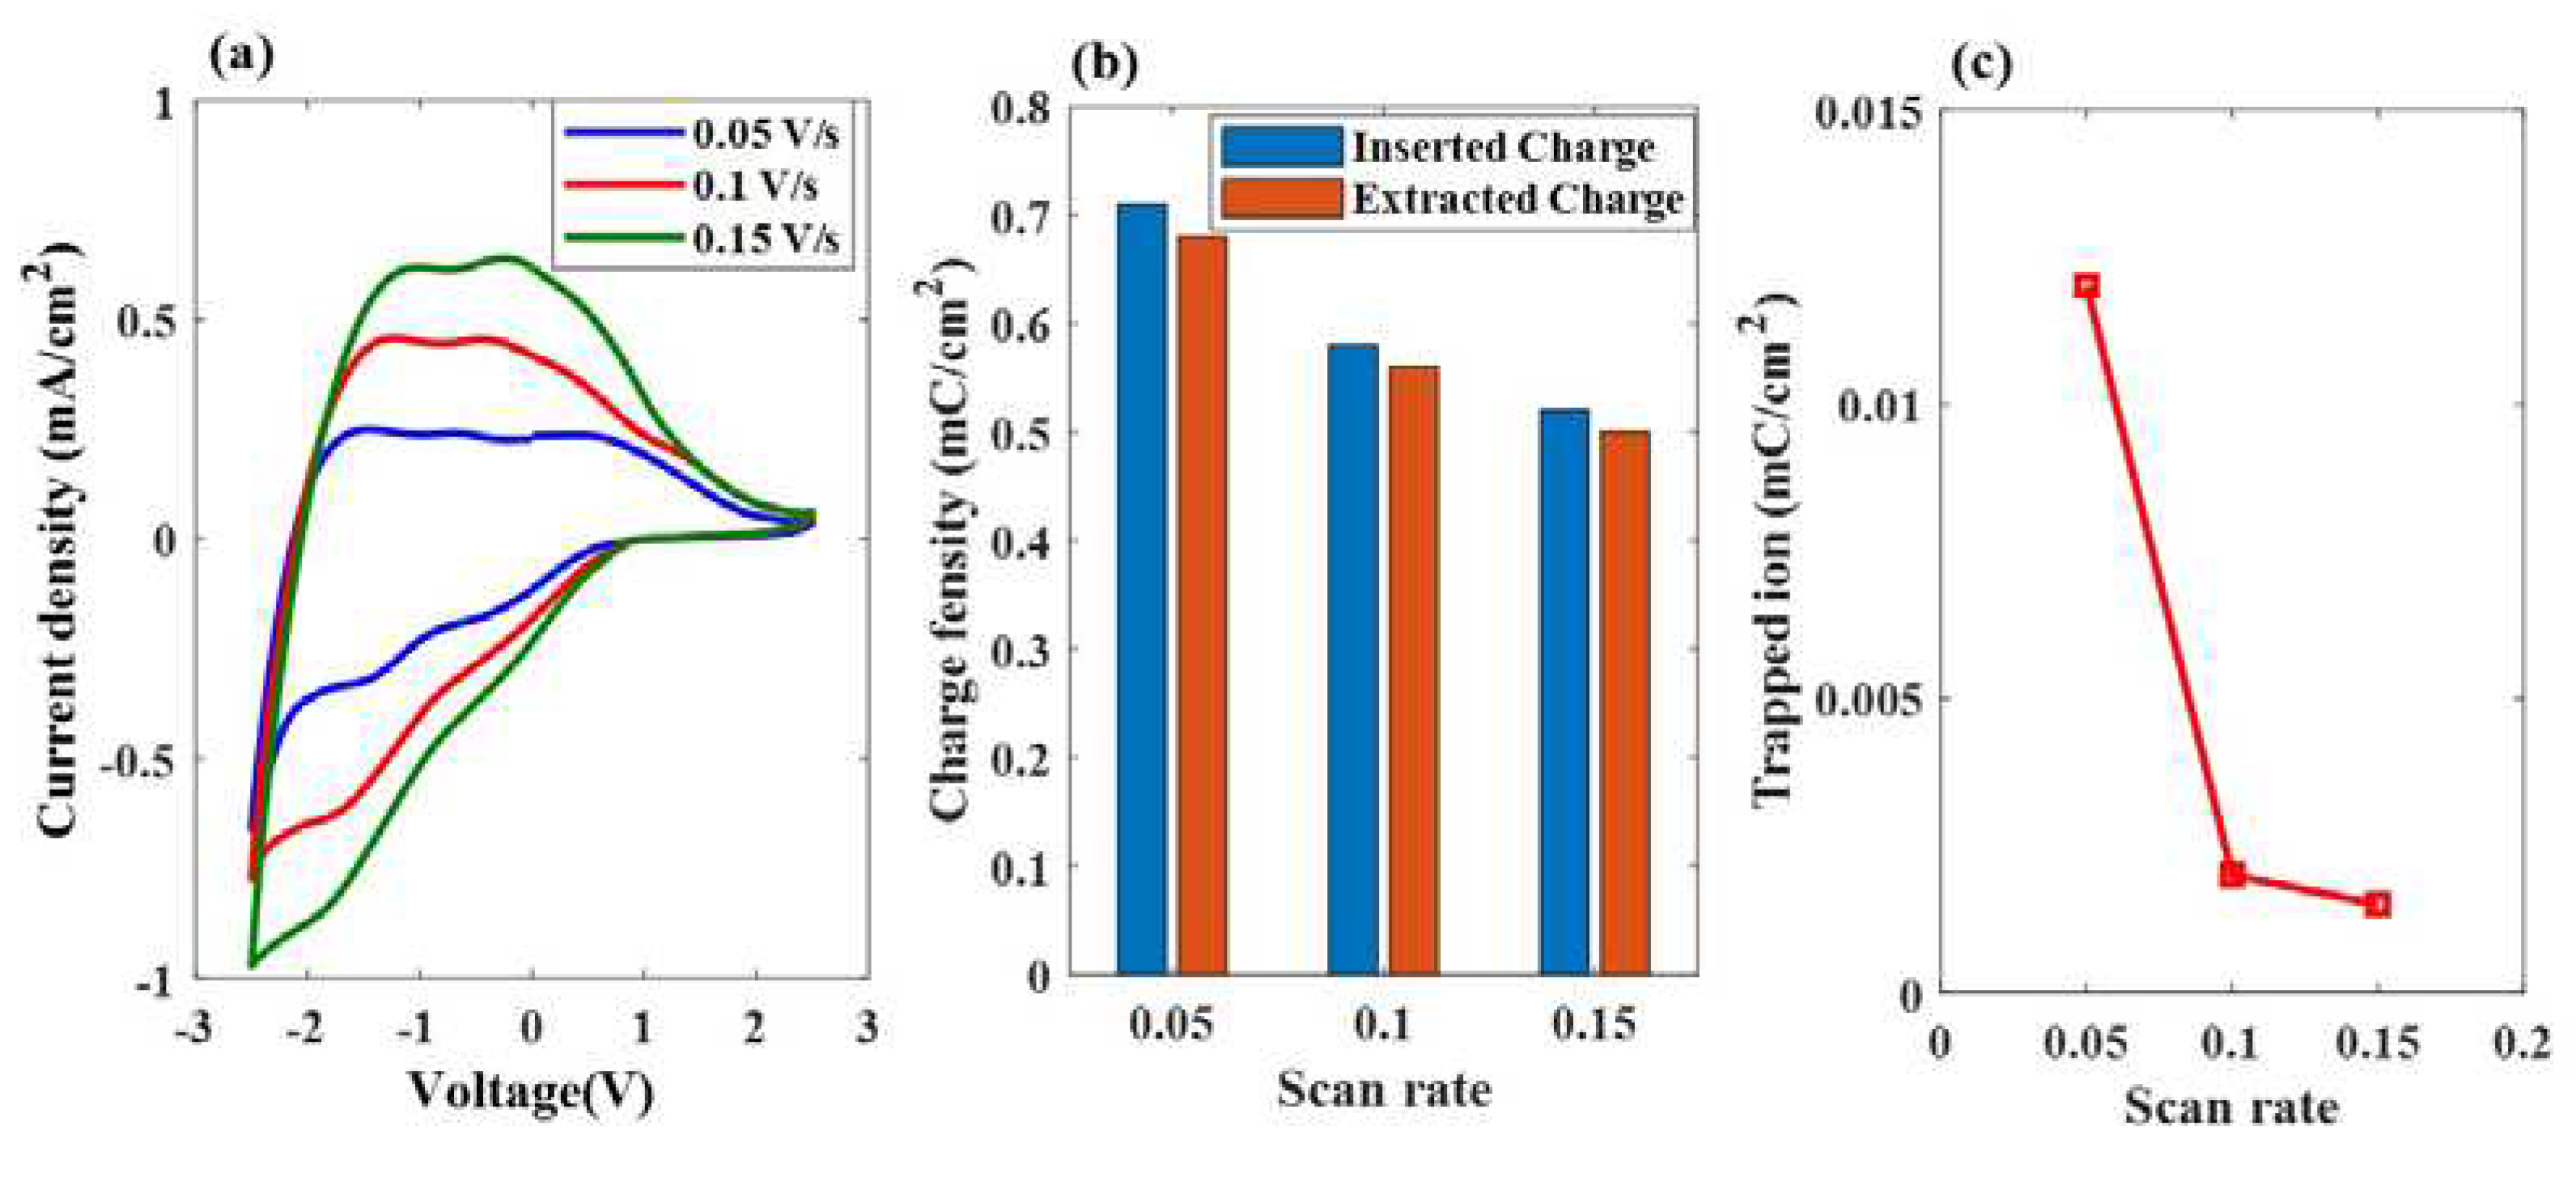
Figure 8.
(a) Evolution of the charge density of inserted ions in the ESECDs under different scanning rates with 0.15 V/s; and (b) the evolution of the reversibility between inserted ions and extracted ions; (c) chronoamperometry (CA) response time with in-situ transmittance measurement of Ir: NiO- ESECDs in coloration and bleaching states for 10 s (d) the durability of Ir: NiO- ESECDs (glass/ITO/ Mo: WO3/gel-polymer electrolytes/ Ir: NiO /ITO/glass) up to 3000 times.
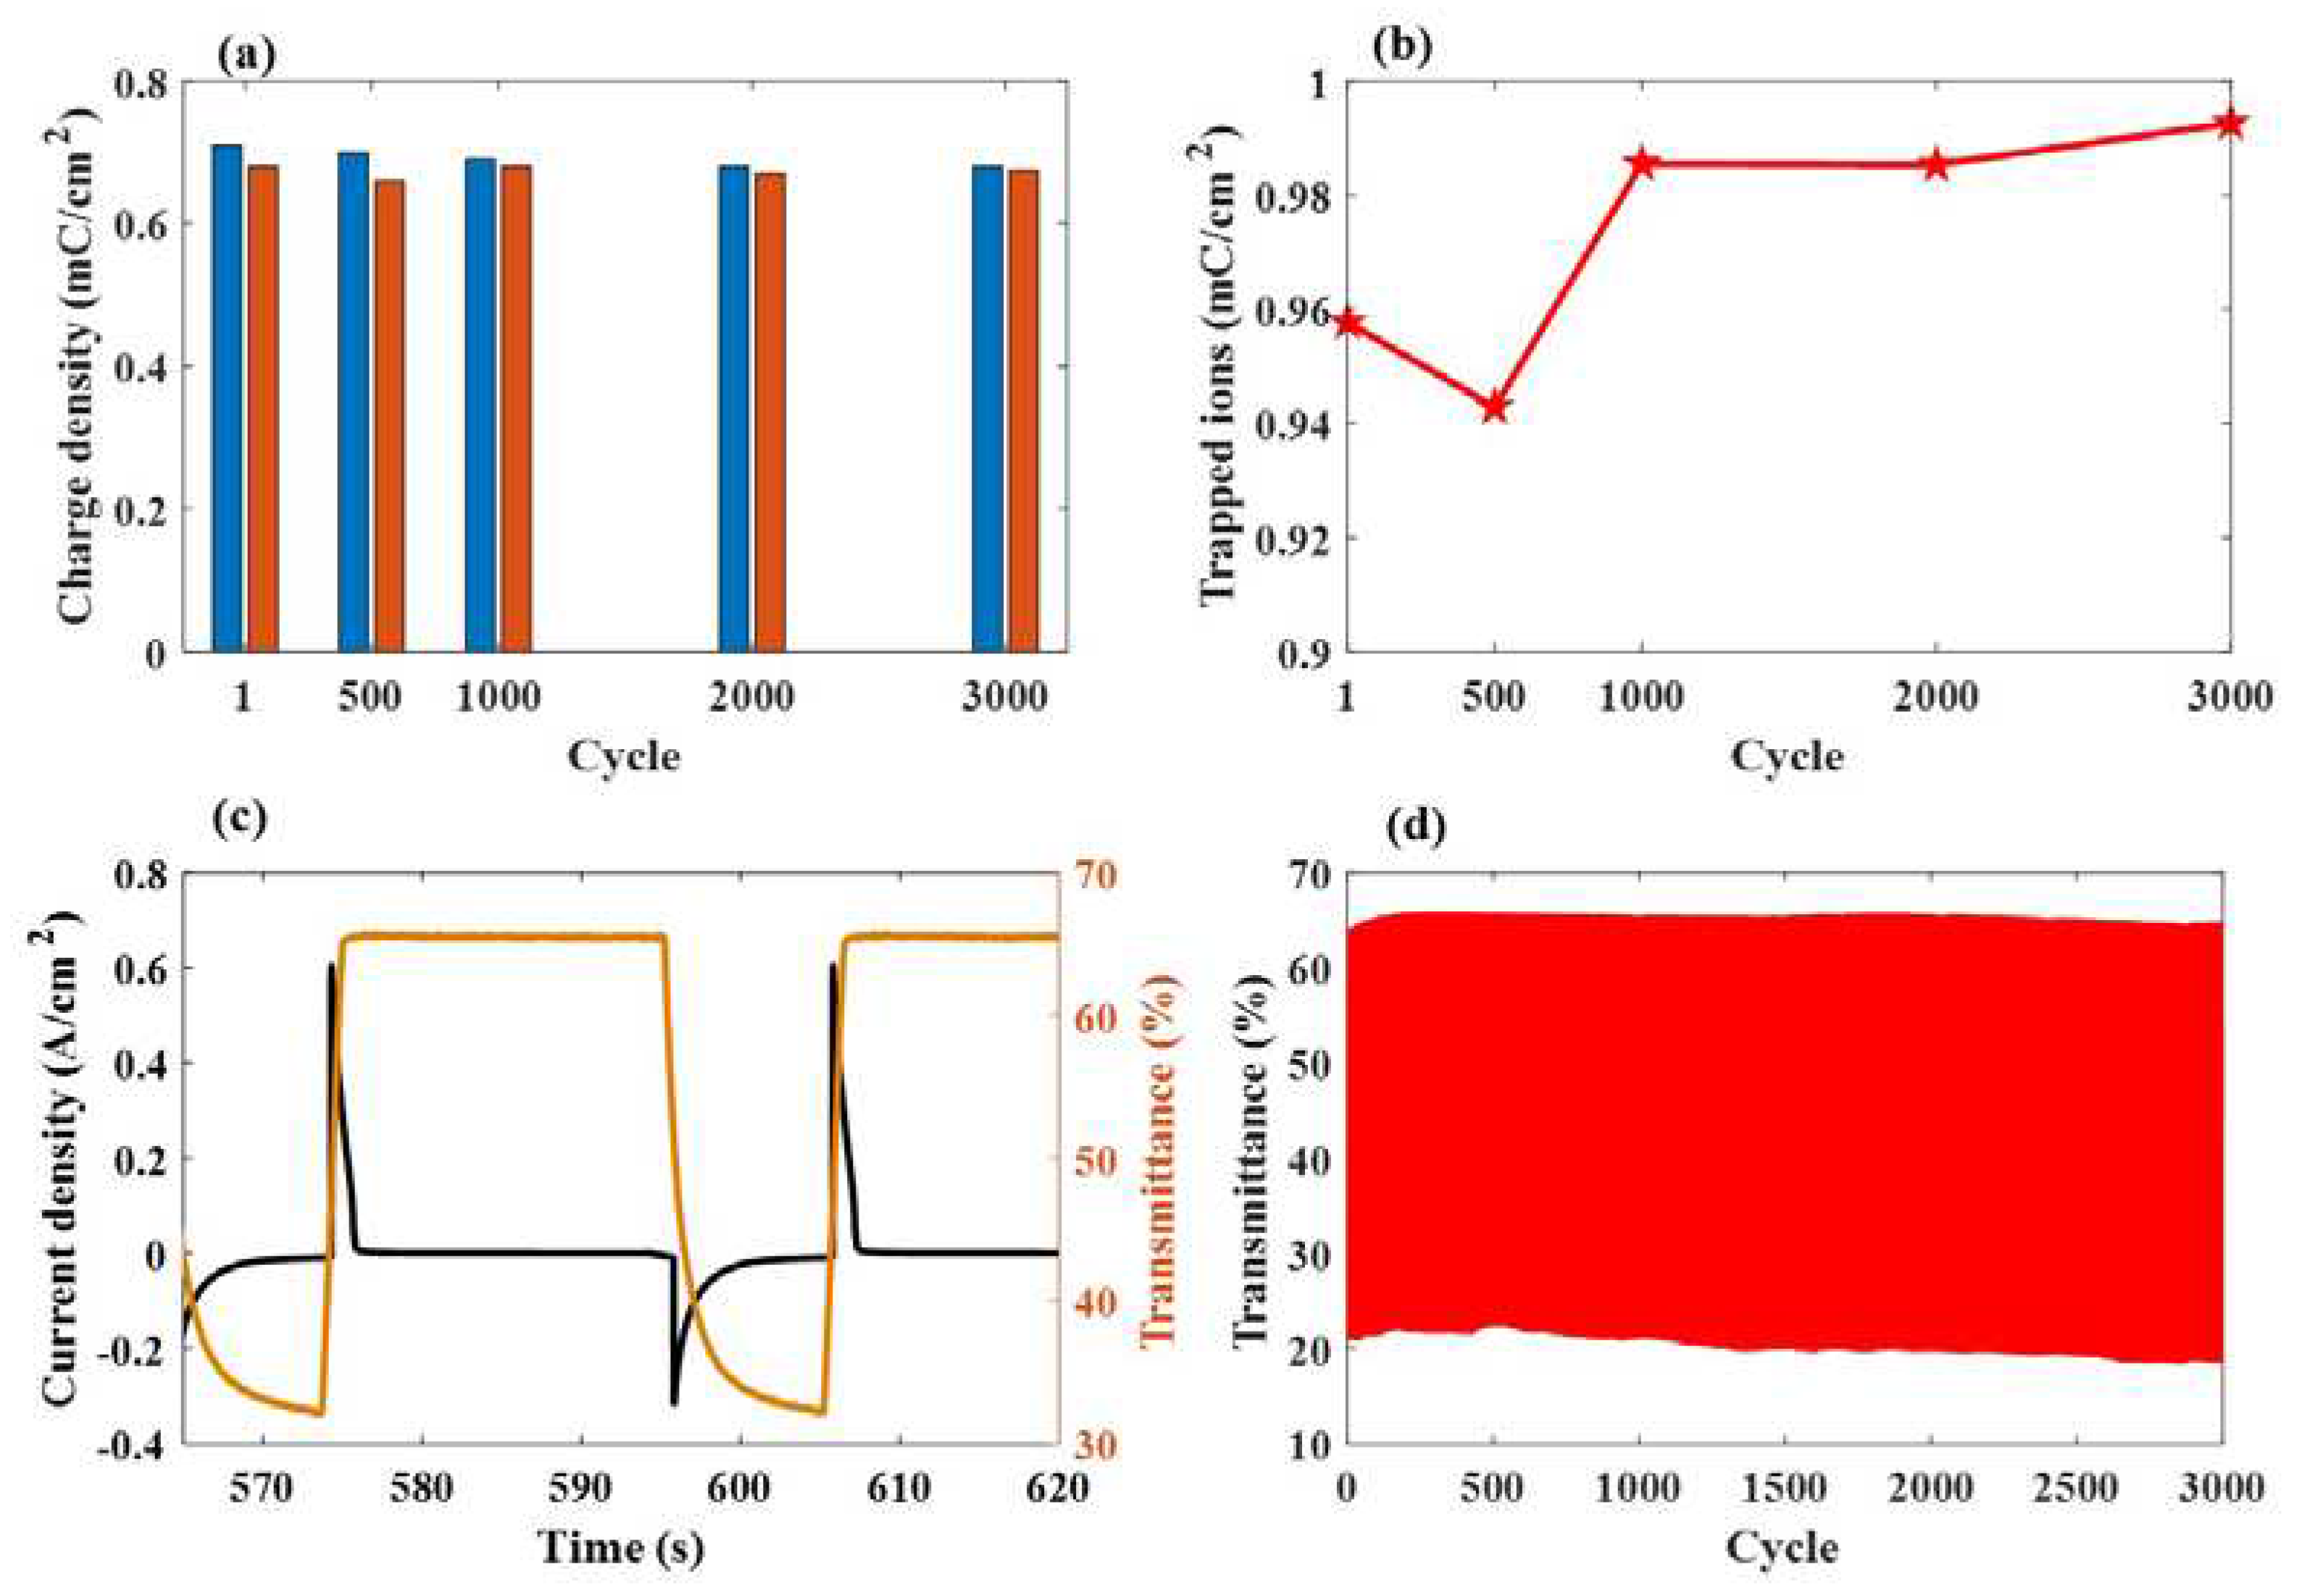

Table 1.
The deposition parameters for both the electrochromic layer and the transparent conducting layer was determined
Table 1.
The deposition parameters for both the electrochromic layer and the transparent conducting layer was determined
| No. | Film | Ar/O2 (Ar =150 sccm) |
W.P. (Torr) |
DC Power (W) |
Deposition Temp. (°C) |
Deposition Time (s) |
Thickness (nm) |
|---|---|---|---|---|---|---|---|
| Sample 1 | Mo: WO3 | 1/4 | 1 × 10⁻² | 1400 | 50 | 1450 | 200 |
| Sample 2 | Mo: WO3 | 1/5 | 1 × 10⁻² | 1400 | 50 | 1500 | 200 |
| Sample 3 | Mo: WO3 | 1/6 | 1 × 10⁻² | 1400 | 50 | 1550 | 200 |
| ITO | Ar=150 | 3.5 × 10⁻³ | 650 | 200 | 3600 | 300 |
Table 2.
Deposition parameters of WO3 electrode film and ITO glass.
| Target | Film | Ar/O2 (Ar =150 sccm) |
W.P. (Torr) |
DC power (W) |
Deposition Time (sec) |
Deposition Rate (nm/sec) |
Deposition Temp °C |
Thickness (nm) |
|---|---|---|---|---|---|---|---|---|
| Ir/Ni Metal | Ir: NiO | 1/3 | 8 × 10⁻³ | 1500 | 100 | 1 | 50 | 100 |
Disclaimer/Publisher’s Note: The statements, opinions and data contained in all publications are solely those of the individual author(s) and contributor(s) and not of MDPI and/or the editor(s). MDPI and/or the editor(s) disclaim responsibility for any injury to people or property resulting from any ideas, methods, instructions or products referred to in the content. |
© 2023 by the authors. Licensee MDPI, Basel, Switzerland. This article is an open access article distributed under the terms and conditions of the Creative Commons Attribution (CC BY) license (http://creativecommons.org/licenses/by/4.0/).
Copyright: This open access article is published under a Creative Commons CC BY 4.0 license, which permit the free download, distribution, and reuse, provided that the author and preprint are cited in any reuse.


