1. Introduction
In most sports where athletes compete or are timed alongside others, athletes are required to exert their utmost effort to overcome the drag caused by the surrounding fluid (e.g., water or air). The magnitude of this drag frequently plays a critical role in competition results. Hence, utilizing the presence of other athletes to reduce drag has become a popular competitive strategy in racing events. For example, when athletes form a drafting formation, the wake created by the leading athletes not only significantly reduces the fluid velocity, but also generates a negative pressure coefficient that creates a suction effect. These factors contribute to the improved performance of the athletes following behind.
Drafting formation strategies are widely employed in various summer sports, such as cycling [
1,
2,
3,
4,
5], swimming [
6,
7], and winter sports, such as short track speed skating [
8,
9], speed skating [
10,
11] and cross-country skiing [
12,
13]. Rundell conducted a study on drafting in short track speed skating and reported positive effects on metabolic activity, heart rate, and lactate response [
8]. Terra evaluated the aerodynamic benefits of drafting in speed skating by varying the lateral and longitudinal spacing between the lead and trailing athletes and found that up to 40% drag reduction could be achieved [
10]. van den Brandt studied the effects of drafting in speed skating training and showed that at the same external intensity, the drafting benefit resulted in lower physical and perceived intensity compared to speed skating alone and would lead to mental relaxation in athletes [
11]. Ainegren observed clear positive effects of drafting behind a skier during double poling. This resulted in reductions in propulsive force, drag area, oxygen cost, metabolic rate, and heart rate [
12].
Similarly, drafting is a key strategy employed in most track and field events. Besides wind-tunnel experiment, which often involves the use of scaled models with similar Reynolds numbers, computational fluid dynamics (CFD) has emerged as a prevalent method for precisely evaluating drag distribution among athletes. Beaumont used CFD simulation to study the effect of drafting in two formations [
14,
15]. The results showed that second in line of five runners achieved the optimal drag reduction of 63.3%, whereas the third runner in line of three runners had a drag reduction of only 33%. A reduction of 63.3% in drag was associated with a 4.4% increase in running economy and a 2.9% increase in running speed. Similarly, a 33% drag reduction led to a 6% decrease in oxygen consumption, a 1% reduction in heart rate, and a 33% decrease in energy consumption. Polidori calculated the drag and energy expenditure corresponding to three quadruple formations and found that maintaining a spacing of 1.3 m from the middle runner in the front resulted in a 57.3% reduction in drag and a 2.84% decrease in metabolic power [
16]. However, the above studies were conducted to evaluate the impact of drag reduction on runners' economy and physiological parameters. They specifically concentrated on drag reduction using CFD simulation, without incorporating an analysis of the flow field and the mechanism behind drag reduction. Schickhofer employed CFD simulation to investigate the effects of various drafting formations (one double, two triple, and one quadruple) during a marathon race [
17]. They discovered that the most significant drag reduction of 75.6% and a performance improvement of 154s were achieved when a runner positioned himself between two runners, one in front and one behind. Furthermore, a basic analysis of the drag reduction mechanism suggested that the reduction in drag is a result of no sharp deceleration of air and resulting formation of areas of high stagnation pressure on the core runner’s surface. However, the study lacked an explanation of the pressure reduction mechanism and did not quantify the pressure changes. Additionally, no conclusions have been reached regarding the impact of other athletes on pressure and the mechanism by which it influences the drag reduction effect when exploring additional formations. Moreover, there is currently limited research on drafting formations in race walking and the existing research on drafting formations in track and field events primarily focuses on simple formation mentioned above, neglecting more complex formations.
Furthermore, the majority of drag calculations for athletes in drafting formations are based on CFD simulation and lack verification through wind-tunnel experiment. Due to the complex structure of the human body, the geometry and motion of the athletes need to be simplified during CFD numerical simulation compared to wind-tunnel experiment Consequently, there is often a significant disparity in drag obtained by these two methods. Blocken was the first in performing numerical simulations of tandem interactions considering various cyclist postures [
18]. The result showed that the greatest reduction in drag was observed for trailing riders when two riders maintained an upright position at the closest distance, resulting in a drag reduction of 27% compared to riding alone. This drag reduction trend was consistent with the results of wind-tunnel experiment by Zdravkovich [
19] and Kawamura [
20], where the drag reduction benefit decreased linearly as the traction distance increased for all riders’ postures. However, the drag variation was large, especially when the spacing was 1m, and the difference in drag between CFD simulation and wind-tunnel experiment reached 21%. The drag results from different wind-tunnel experiments on complex human structures sometimes differ as well. Barry performed a full-scale wind-tunnel experiment under controlled conditions and observed a significant 40% reduction in drag at a distance of 0.7 m, showing a large difference of about two times of the results of Zdravkovich’s wind-tunnel experiment [
19,
21]. Whether this difference is attributable to differences in posture or experimental artifacts (e.g., high blockage rates) remains unclear.
Therefore, it is crucial to verify the results of the wind-tunnel experiment through CFD numerical simulations. The accuracy of the findings can be ensured by validating the agreement between the aerodynamic drag obtained from both methods. Furthermore, if any discrepancies exist between the drag of two methods, further investigation should be conducted to explore alternative explanations for the inconsistencies.
This study aims to achieve the following objectives: firstly, to investigate the drag reduction of drafting formations involving two, three, and four race walkers using both wind-tunnel experiment and CFD simulation. The comparison of drag coefficient obtained from both methods will be analyzed to identify the contributing factors leading to the differences between them. Additionally, the drag reduction rates of the two methods will be assessed to verify their consistency. Secondly, the CFD analysis will provide a detailed study of the flow field of different formations by the differences between their streamlines and pressure to elucidate the mechanism behind the optimal drafting formation with various numbers of race walkers. Lastly, using the 20-km race walking event as an example, the benefits of drafting formations with different numbers of race walkers will be evaluated based on sports economy, speed, and overall performance.
2. Methods for drag reduction of drafting formations in race walking
2.1. Wind-tunnel experiment
The wind-tunnel experiments to test race walking drafting formations were conducted at the National Ice and Snow Sports Training and Research Base in Beijing, China. The wind tunnel employed in this study was an open circuit, low-velocity wind tunnel with a resident room. Situated inside the resident room, the test section had dimensions of 8 m in length and a rectangular cross-section measuring 2.5 meters by 3.0 meters. The test wind speed ranged from 0 to 42 m/s and could be smoothly adjusted in a continuous manner.
The turbulence level of the airflow was maintained below 0.75%, and the deflection angle of the airflow was kept below 0.75°. Specifically, the wind-tunnel experiment focused on race walkers from the Chinese national team participating in various drafting formations involving two, three, and four race walkers. These formations were simulated in order to measure the aerodynamic drag under different drafting formations. In each formation, a core race walker was positioned statically on a boxed six-component balance in a standard stance posture during walking, while auxiliary race walkers were added according to the desired formation.
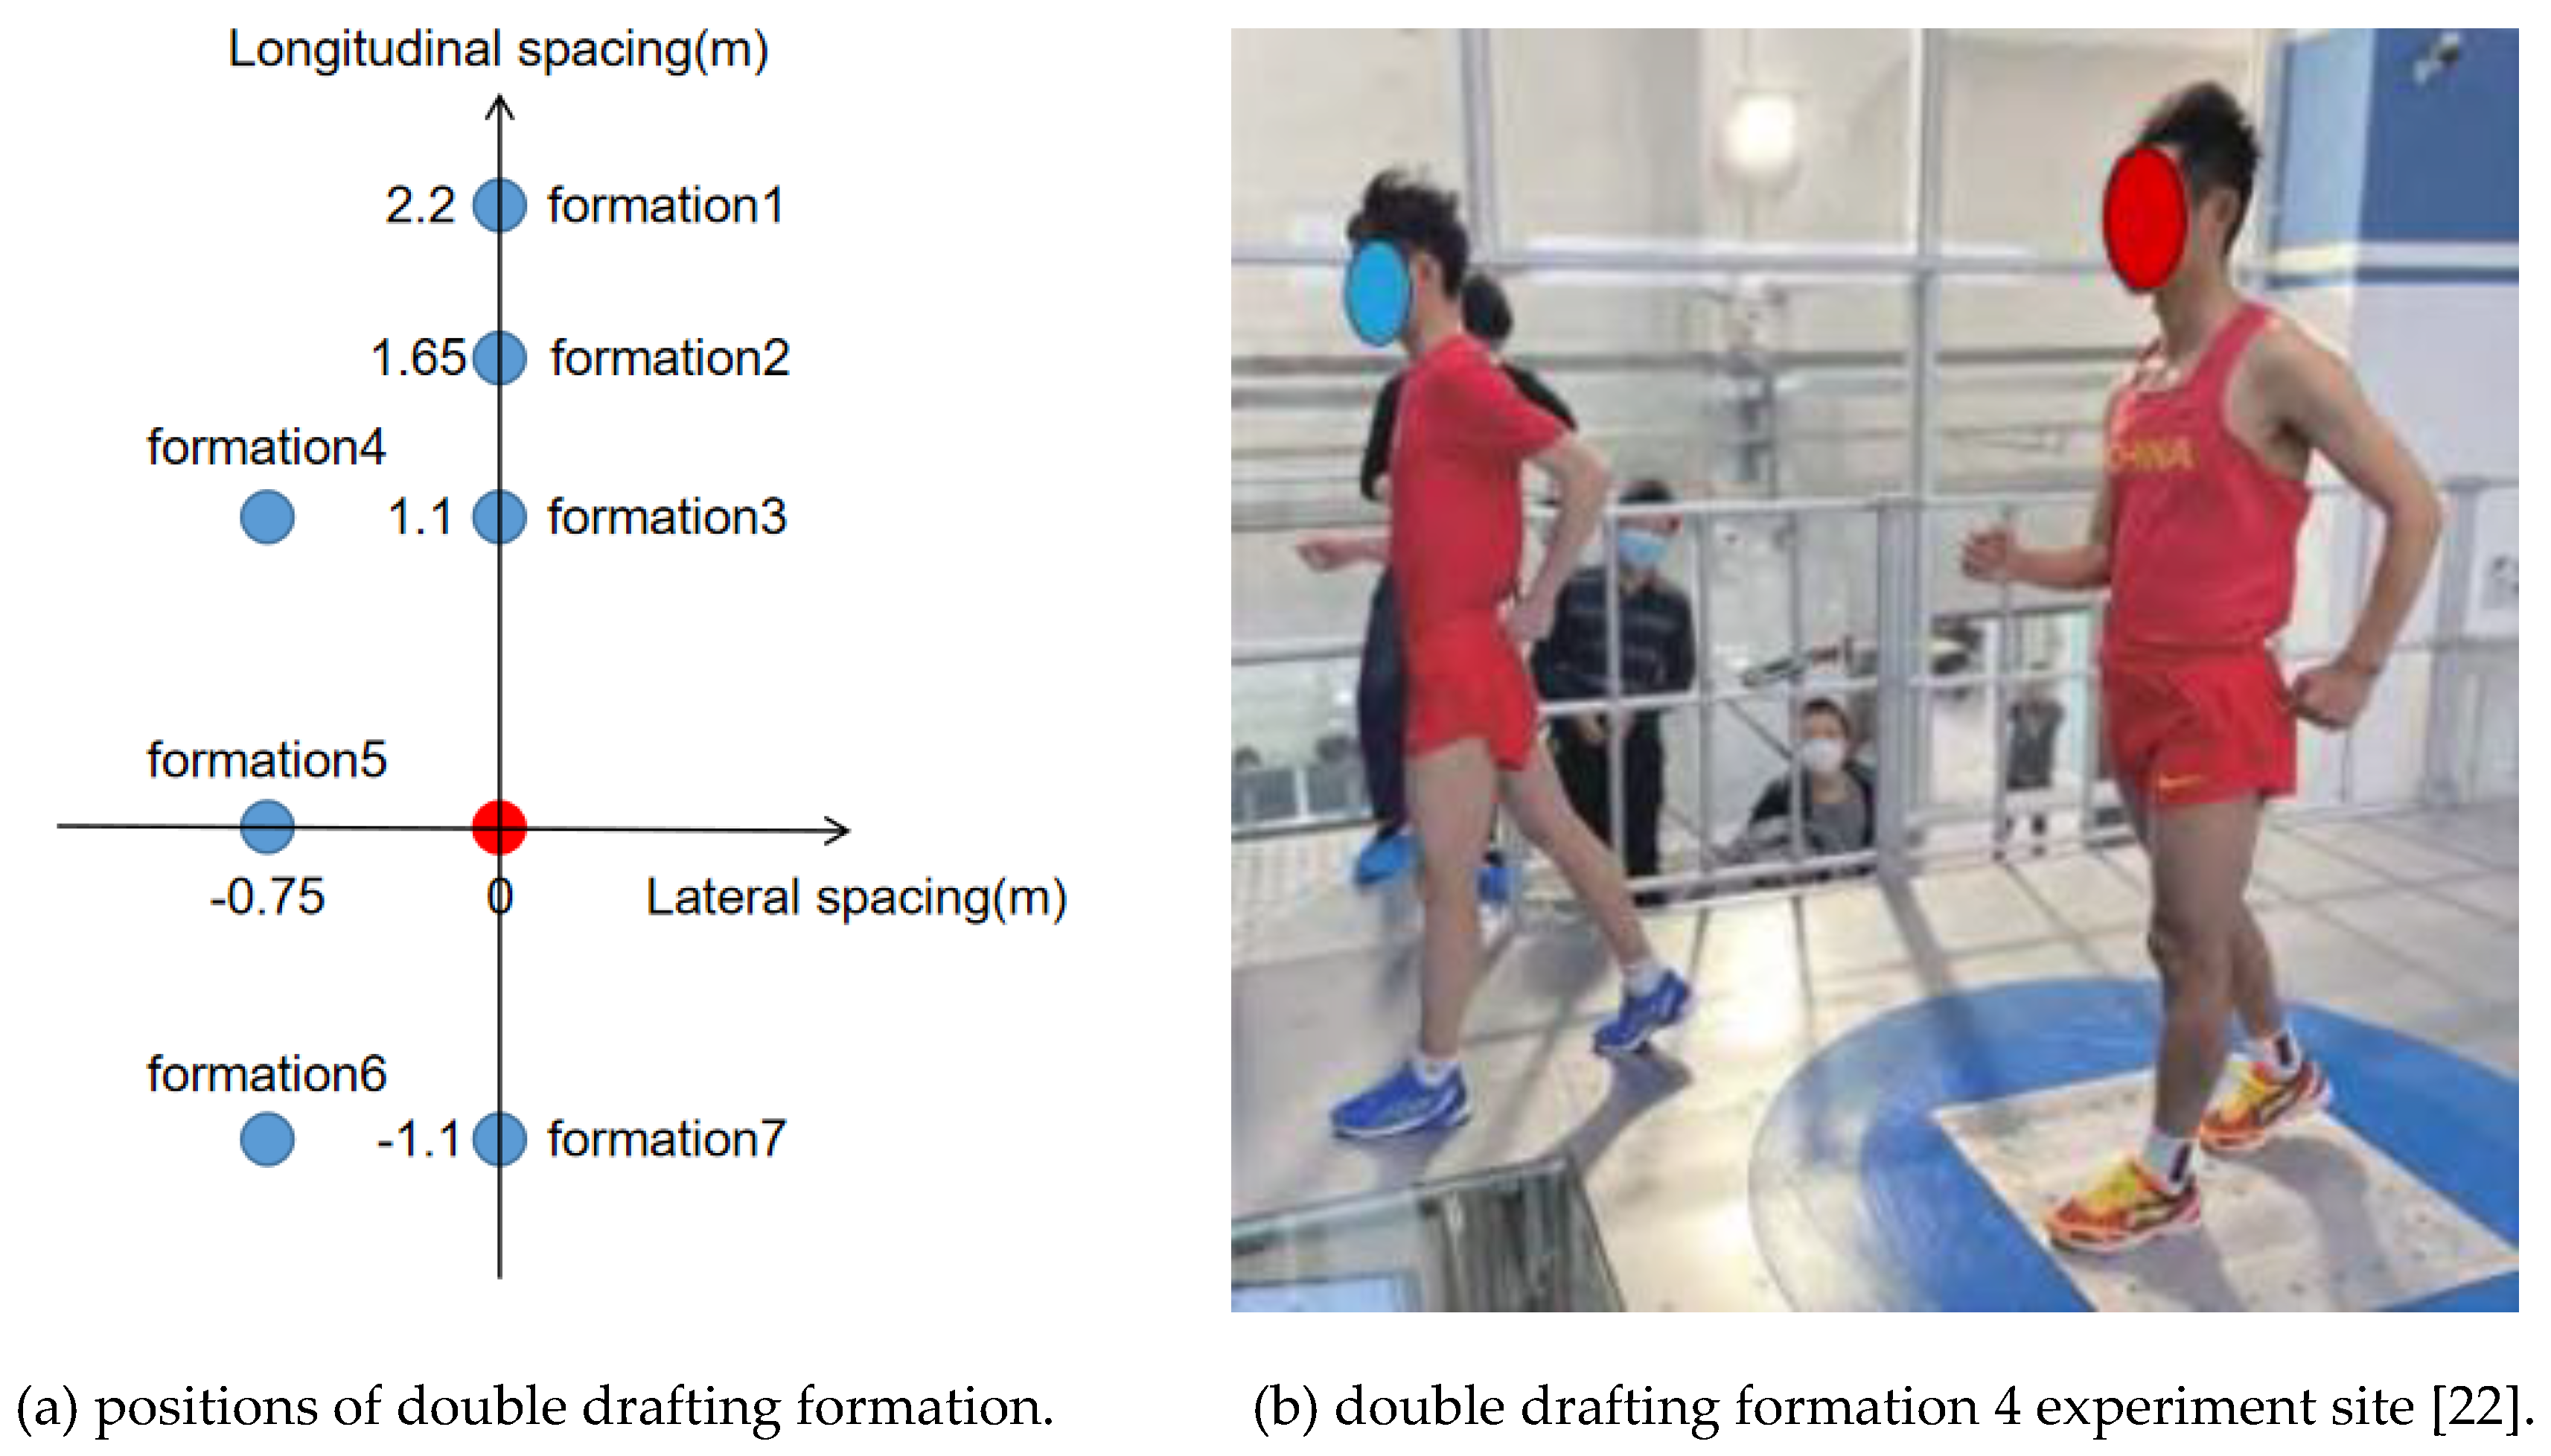
Figure 1 depicts the positions of seven double drafting formations and a race walking scene. Specifically,
Figure 1b represents the wind-tunnel experiment conducted by Hu [
22], corresponding to double formation 4 in
Figure 1a. The core race walker is represented by a red point in
Figure 1a, while the auxiliary race walkers are indicated by blue points. The longitudinal and lateral spacing between the race walkers in the drafting formations are determined based on the criterion of not interfering with the race walkers' stride, with a minimum longitudinal spacing of 1.1 meters and a minimum lateral spacing of 0.75 meters. For more detailed information on the wind-tunnel experiment, please refer to the literature by Hu [
22].
2.2. Numerical simulation method based on computational fluid dynamics
This study employs static models of race walkers in typical drafting formations. A 3D scanner is used to acquire a model of the core race walker in a standard race walking pose. The 3D scanned human body model exhibits high precision and captures intricate details such as clothing folds, ears, and nose. Nevertheless, these gaps pose challenges for subsequent mesh generation. During the pre-processing stage, Space Claim software offers the Shrinkwrap feature, which generates a patch-based enclosure, wraps the model, closes gaps, and smoothens sharp areas, thereby improving the mesh quality. It is crucial for researchers to meticulously determine the ideal size of the gaps around the ears and nose. The study investigates the impact of gap sizes (3mm, 5mm, and 10mm) on drag and observes that the drag error remained below 0.5%. Consequently, a gap size of 10mm is selected in this paper to improve grid quality and decrease the number of grids.
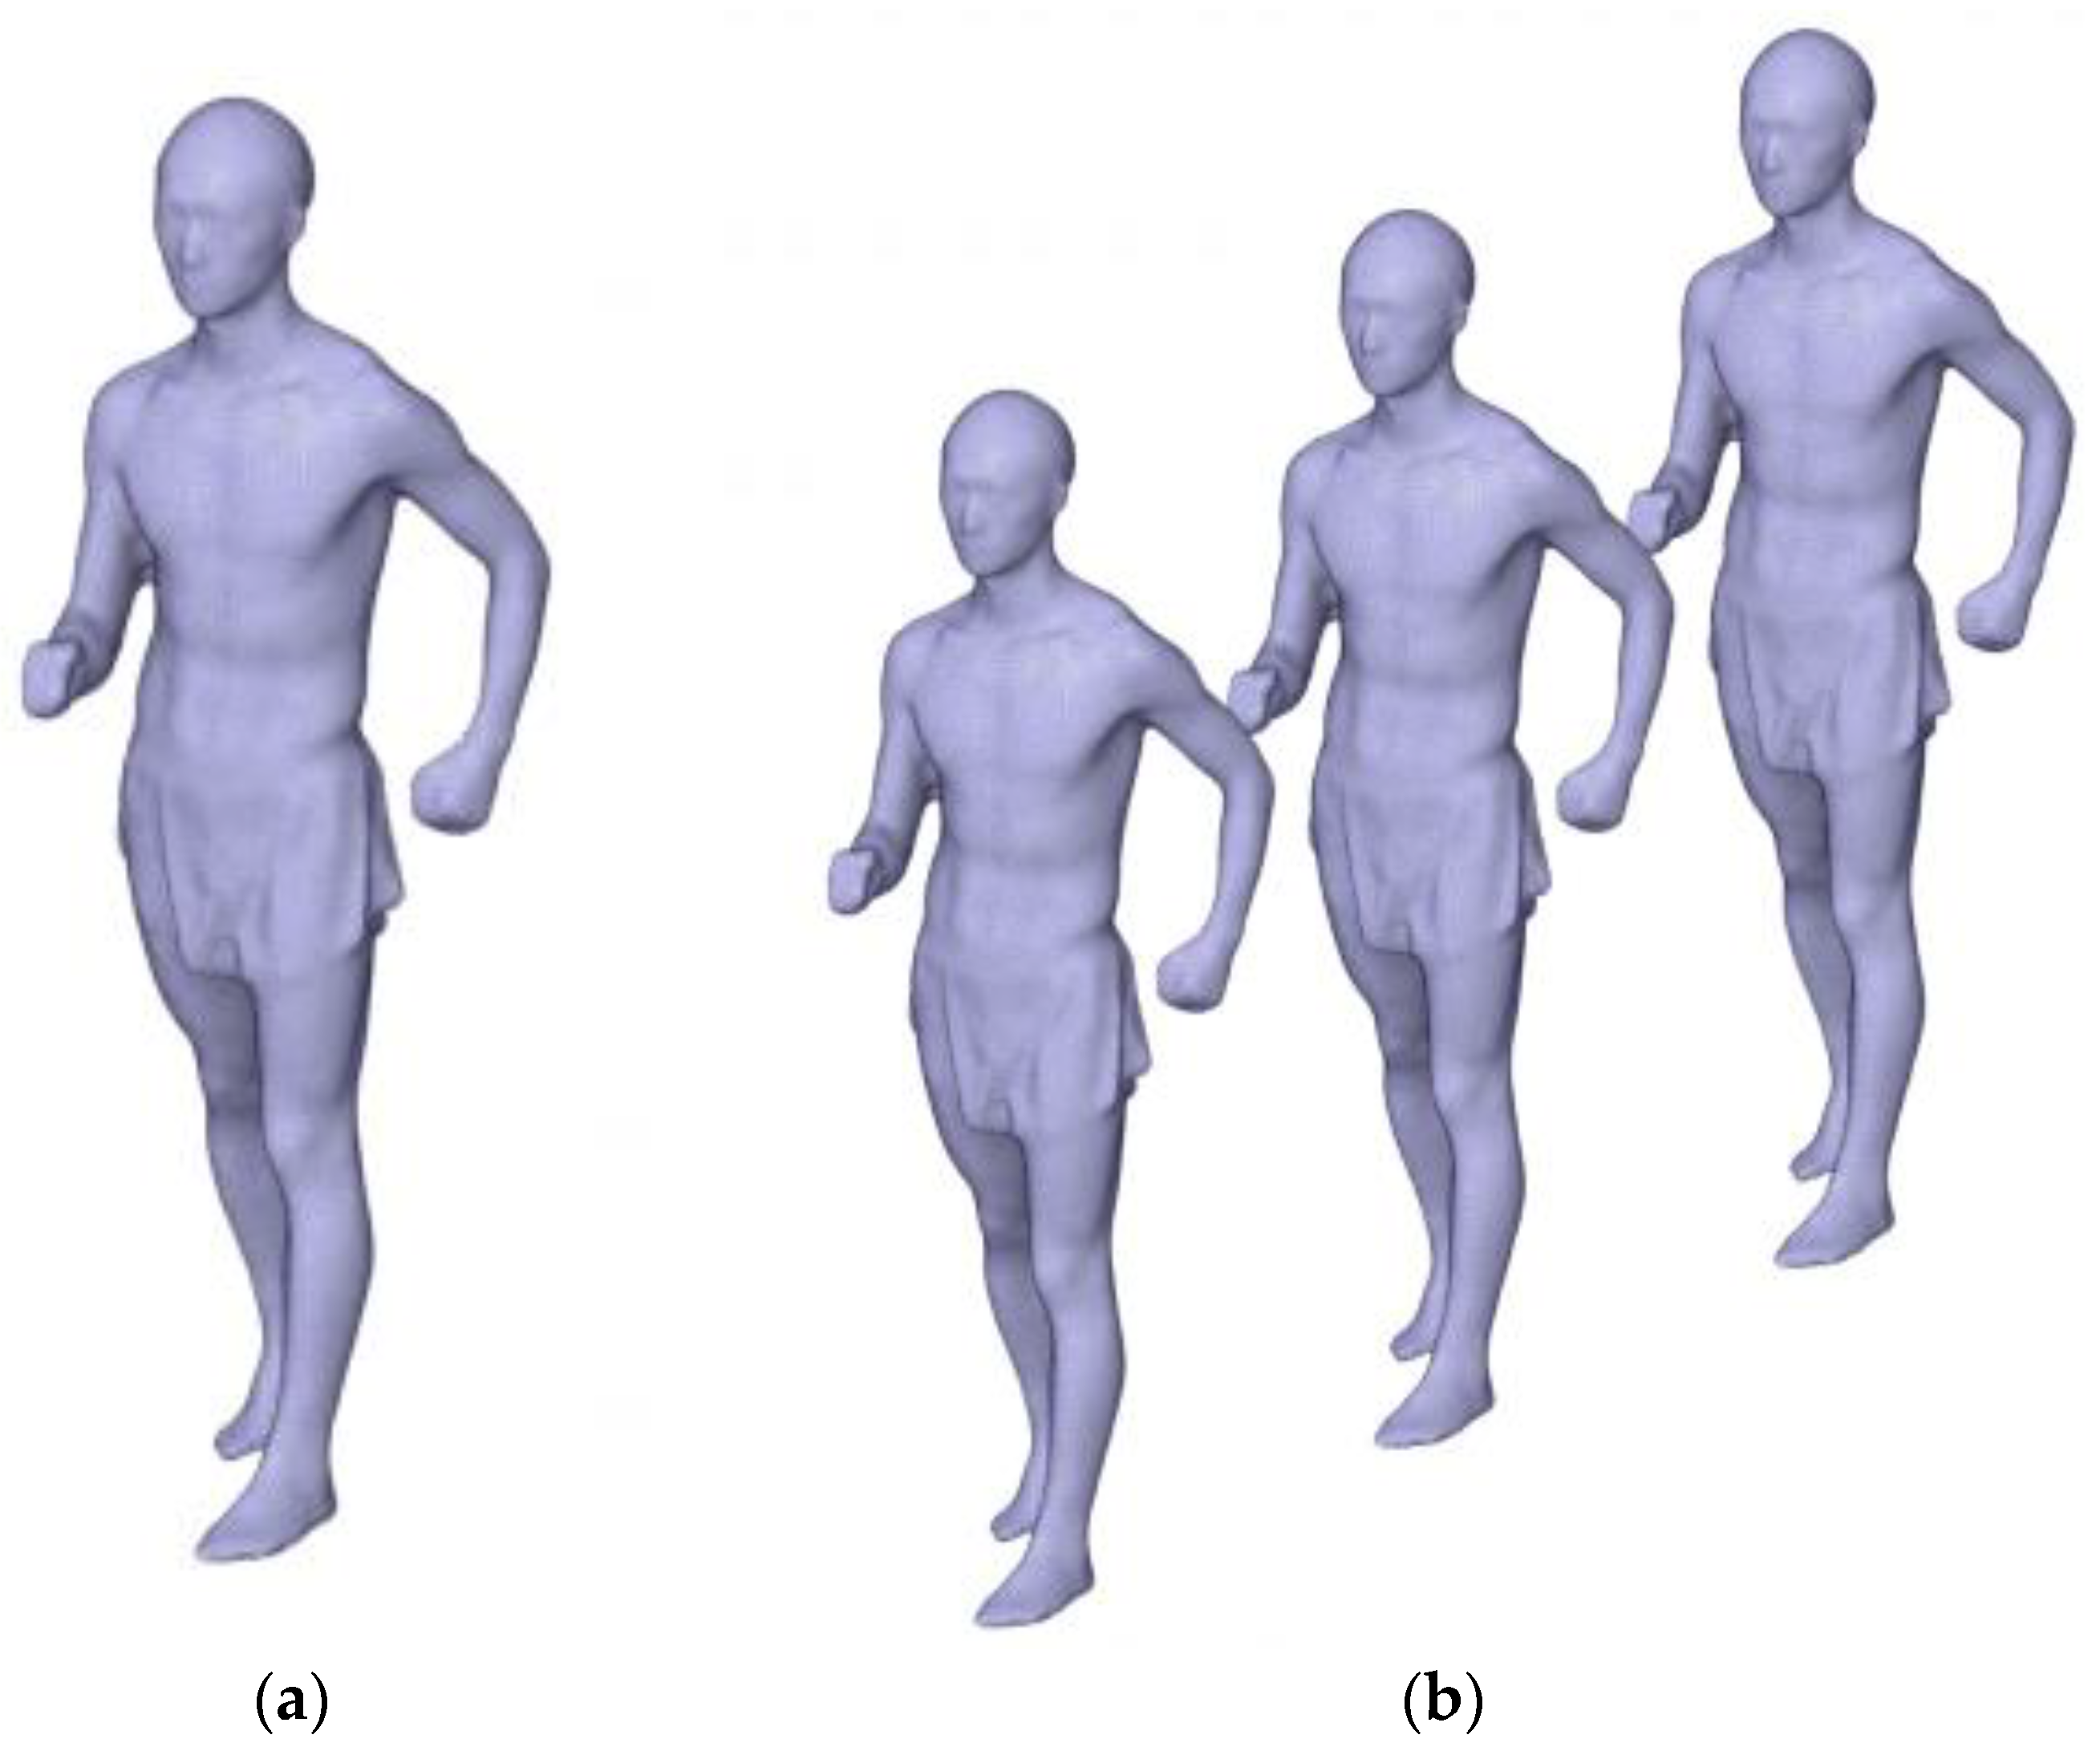
Figure 2 presents the model of the core race walker and an example of drafting formations in CFD simulation. The model of core race walker has a height of 1.76 m, an orthographic windward area of 0.46 m
2, a mass of 61.2 kg and a volume of 0.656 m
3.
2.2.1. Governing equation
Computational fluid dynamics (CFD) is utilized with the finite-volume method to compute the flow field variables and resultant aerodynamic forces acting on the race walkers. The Navier-Stokes equations, governing the momentum conservation, are discretized using the Reynolds-averaged (RANS) approach. The simulations are performed with the commercial CFD code Ansys Fluent 2023 R1 [
23]. Under the assumption of unsteady state, the governing equation for the mainstream region can be expressed as follow [
24]:
(2)Momentum equation:
where
is the air density,
is the velocity of the air in each direction,
is the hydrostatic pressure,
is the stress tensor in each direction,
is the external forces in each direction.
(3)Energy equation:
where
is the effective conduction coefficient,
is the enthalpy,
is the diffusive flow,
is the heat source term.
Turbulence model plays a crucial role in aerodynamic drag calculations, particularly in capturing momentum transfer near surfaces and within boundary layers. This in turn influences the occurrence of flow separation, which is pivotal for precise drag predictions. The
SST turbulence model has undergone extensive validation in the field of external aerodynamics, exhibiting superior performance in flow situations involving adverse pressure gradients and free shear layers when compared to other models such as the Spalart-Allmaras and
models [
25]). In this study, a recently developed generalized
turbulence model is utilized, delivering comparable accuracy to the
SST model while demanding fewer mesh requirements. Moreover, the discretization in this study employs a second-order scheme for the spatial derivatives. Pressure, velocity, and enthalpy are calculated using a coupled approach. Convergence is achieved in this study when the total residual value in all the above-mentioned equations falls below 10
-6.
2.2.2. Computational domains and meshes
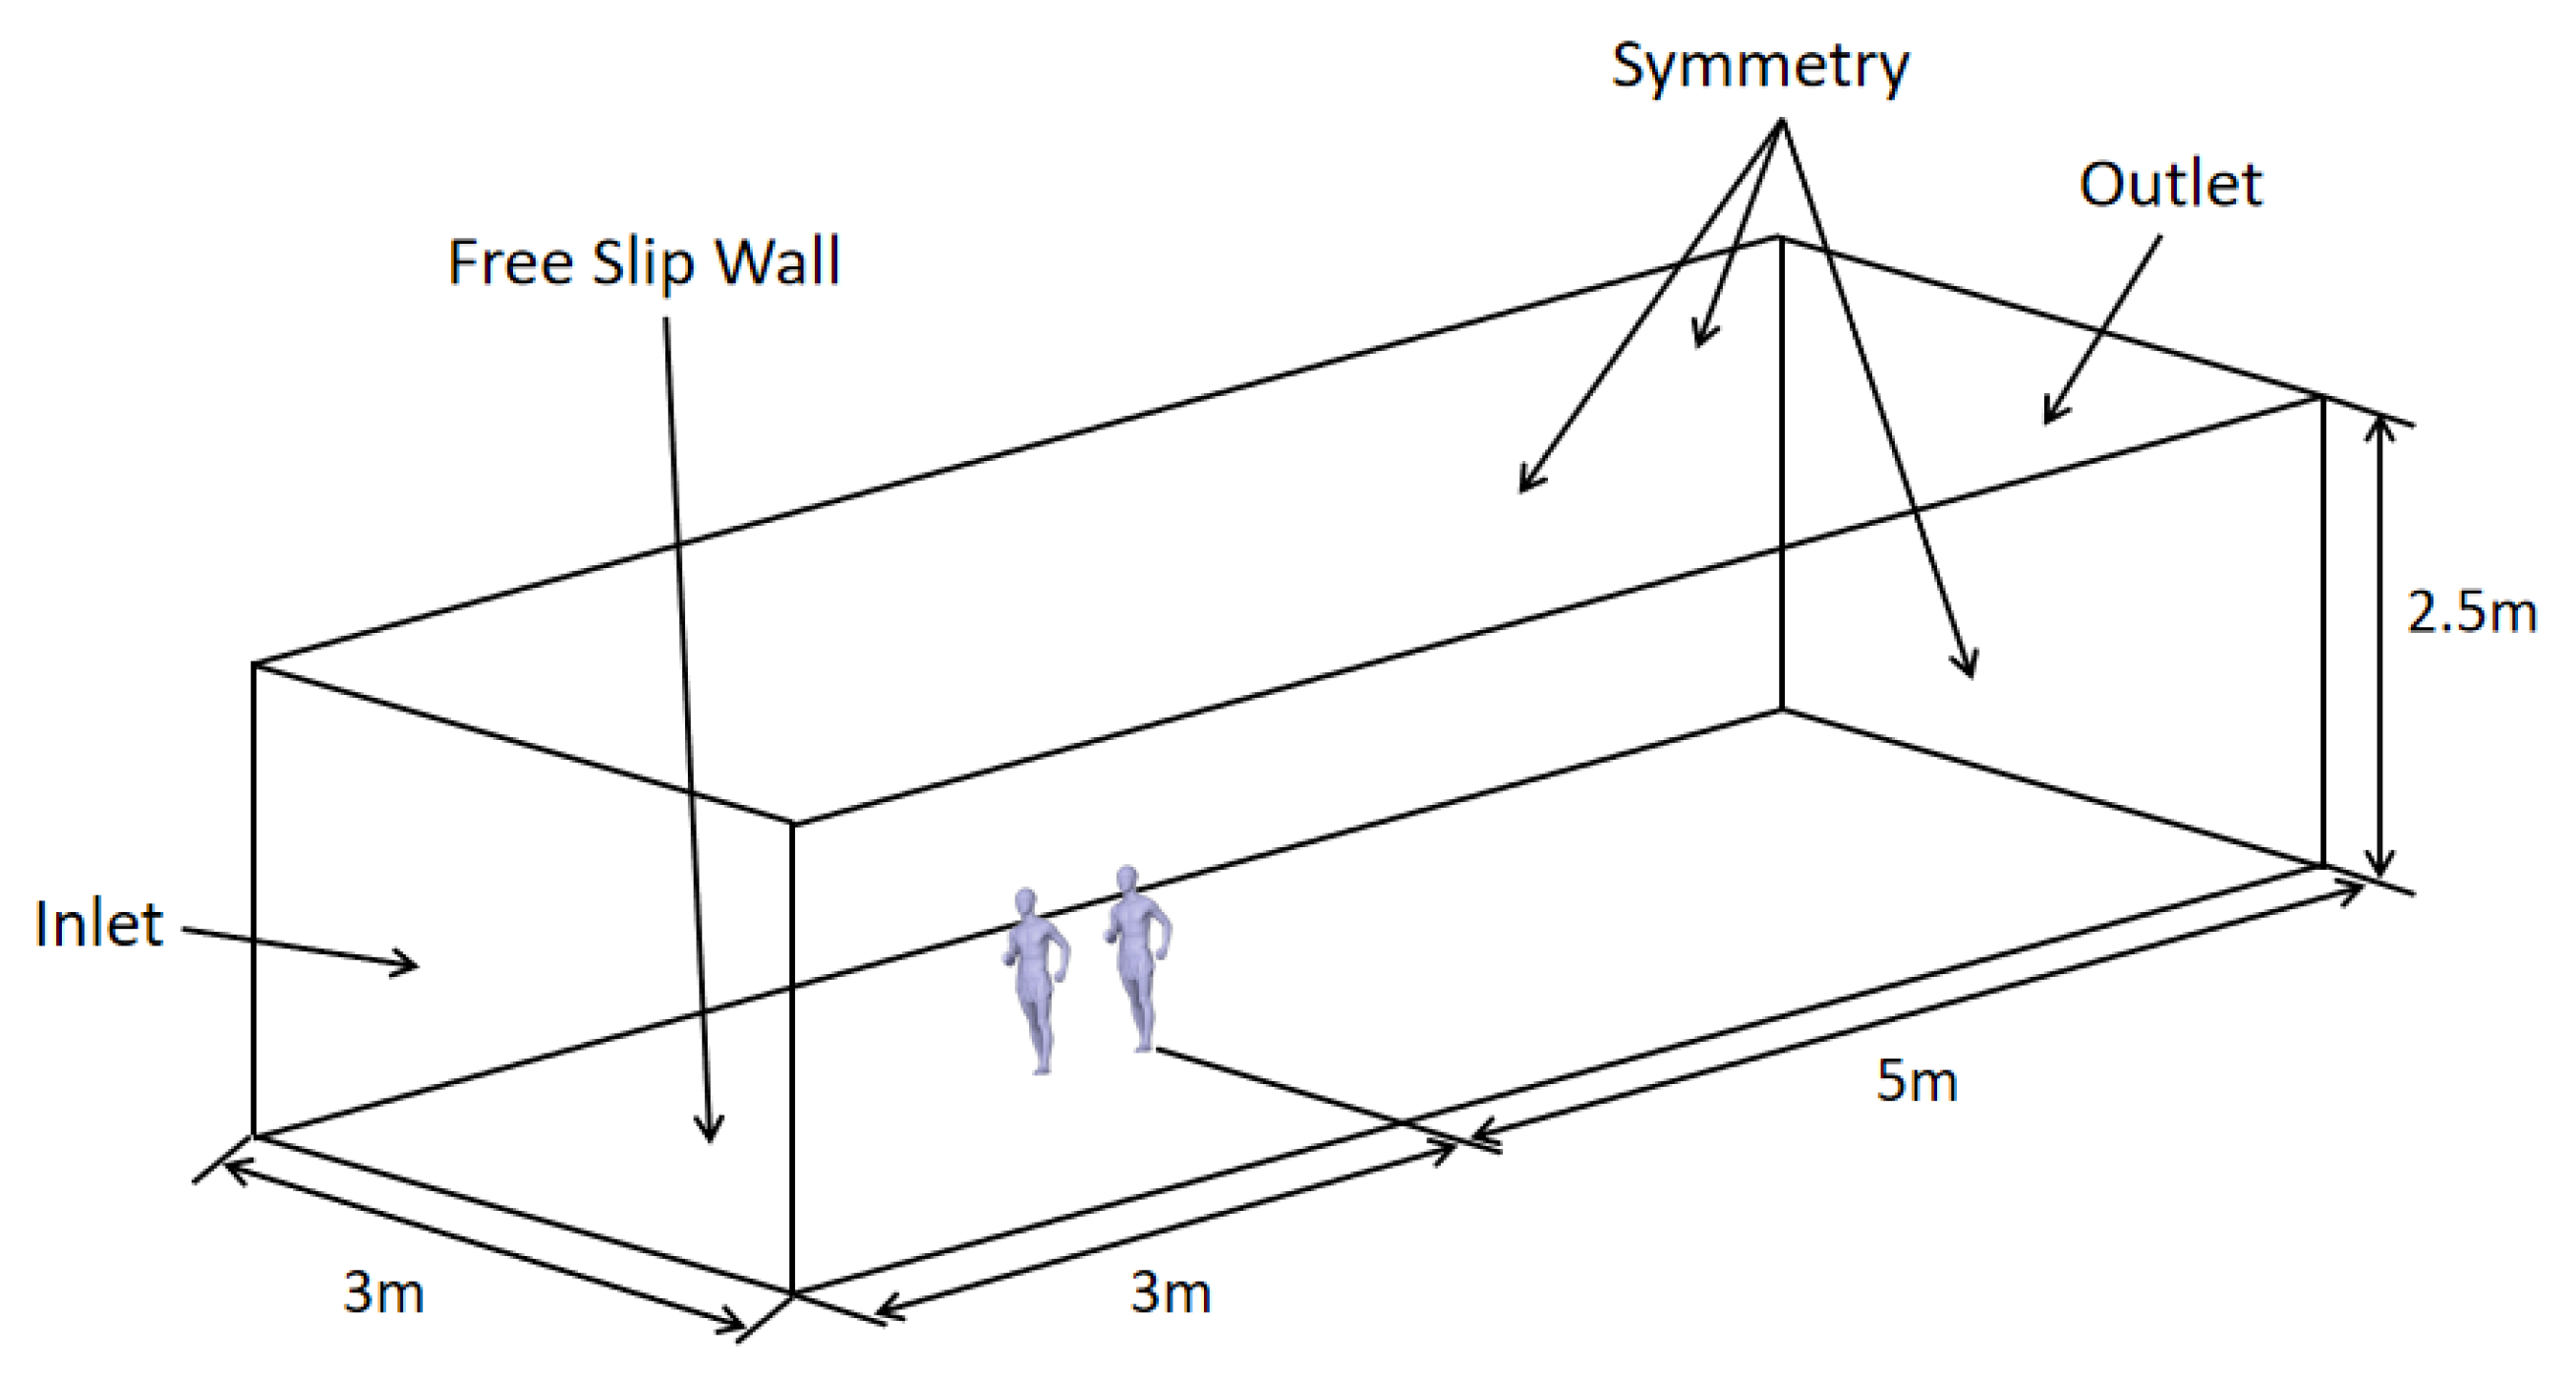
To validate the accuracy of the CFD results, the computational domain is simulated using the identical geometry employed in the wind-tunnel experiment, as shown in
Figure 3. Inoue conducted wind-tunnel experiment that demonstrated an approximately 10% increase in drag values during running alone when employing a moving-belt system compared to a stationary setup [
26]. This experimental setup inhibited the formation of unrealistic ground boundary layers, which is also the case in our study. Here, we utilize stationary models of race walkers coupled with a moving ground boundary, which has proven adequate for predicting the overall aerodynamic drag. Symmetric boundary conditions are applied to the upper and lateral surfaces of the computational domain.
The inlet velocity shown in
Figure 3 is set to the typical race walking velocity of 6 m/s, which is the combination of the race walking velocity of 4 m/s in the absence of ambient wind and the headwind velocity of 2 m/s. The turbulence intensity is set to 0.5%, consistent with the value used in the wind-tunnel experiment. At the outlet, a pressure boundary condition is applied with an ambient static pressure of 1 atm. The ambient temperature is set to 303 K, while the body surface temperature was set to 310 K.
The 3D mesh is generated using ANSYS Workbench Meshing, employing a stable growth factor of 1.2 and an expansion layer thickness of 10 layers. The average mesh size near the surface is 5×10⁻⁴ m, while the average cell size at the outer boundary is 0.2 m. To ensure accurate results, all solid boundaries are directly inserted, resulting in a y+ value of approximately 1 at the surface of the human model. Furthermore, during grid refinement for different numbers of race walkers, the grid count increases by a factor of five, while the drag coefficient remains constant, thereby confirming the grid independence. The mesh size varies from 8.35 million cells for a single race walker to 22.39 million cells for four race walkers.
2.3. CFD numerical simulation results and verification
2.3.1 Results of race walking alone
To validate the accuracy of the CFD simulation drag coefficient calculations in race walking alone, a comprehensive comparison is conducted. This comparison involves examining drag coefficient obtained from CFD simulation, wind-tunnel experiment, and relevant literature. The results of this comparison are presented in
Table 1.
The CFD numerical simulation results exhibit similarities with Schickhofer in terms of drag coefficient, achieving 0.68 at a comparable speed of 5.83m/s, with a relative error of 3% [
17]. Similarly, Polidori reported a drag coefficient of approximately 0.81 at a similar speed of 5.75m/s, albeit with a relatively larger relative error of 15% [
16]. Moreover, the CFD results present in this study fall within the range of wind-tunnel experiment results reported by Walpert and Kyle [
27]. However, the drag coefficient obtained from CFD simulation and wind-tunnel experiment were 0.7 and 0.83, resulting in a relative difference of 18% [
22]. Therefore, additional systematic analysis is required to investigate the disparities between CFD simulation and wind-tunnel experiment.
Several factors that contribute to discrepancies in drag coefficient between CFD simulation and wind-tunnel experiment are identified: (1) Posture discrepancies: Prolonged standing during wind-tunnel experiment can cause posture alterations and subsequent shaking; (2) Model discrepancy: Certain intricate structural details may be lost during the 3D scanning process for CFD analysis, resulting in delayed air separation and diminished drag. Loose clothing, for instance, causes earlier air separation and increases drag, resulting in an approximate increase of 4.2% [
28]. Similarly, hair length contributes to a drag increase ranging from 4-6% [29[. (3) Systems errors in both wind-tunnel experiment and CFD simulation: Including higher blockage rate for race walkers, control and measurement errors in parameters such as wind velocity and direction, as well as discretization, mesh-related, and numerical errors in CFD simulation.
2.3.1 Race walking in drafting formations
The drag reduction rate is defined as the rate of the difference in drag between the core race walker in drafting formations and race walking alone.
where
is the aerodynamic drag when race walking alone,
is the current aerodynamic drag.
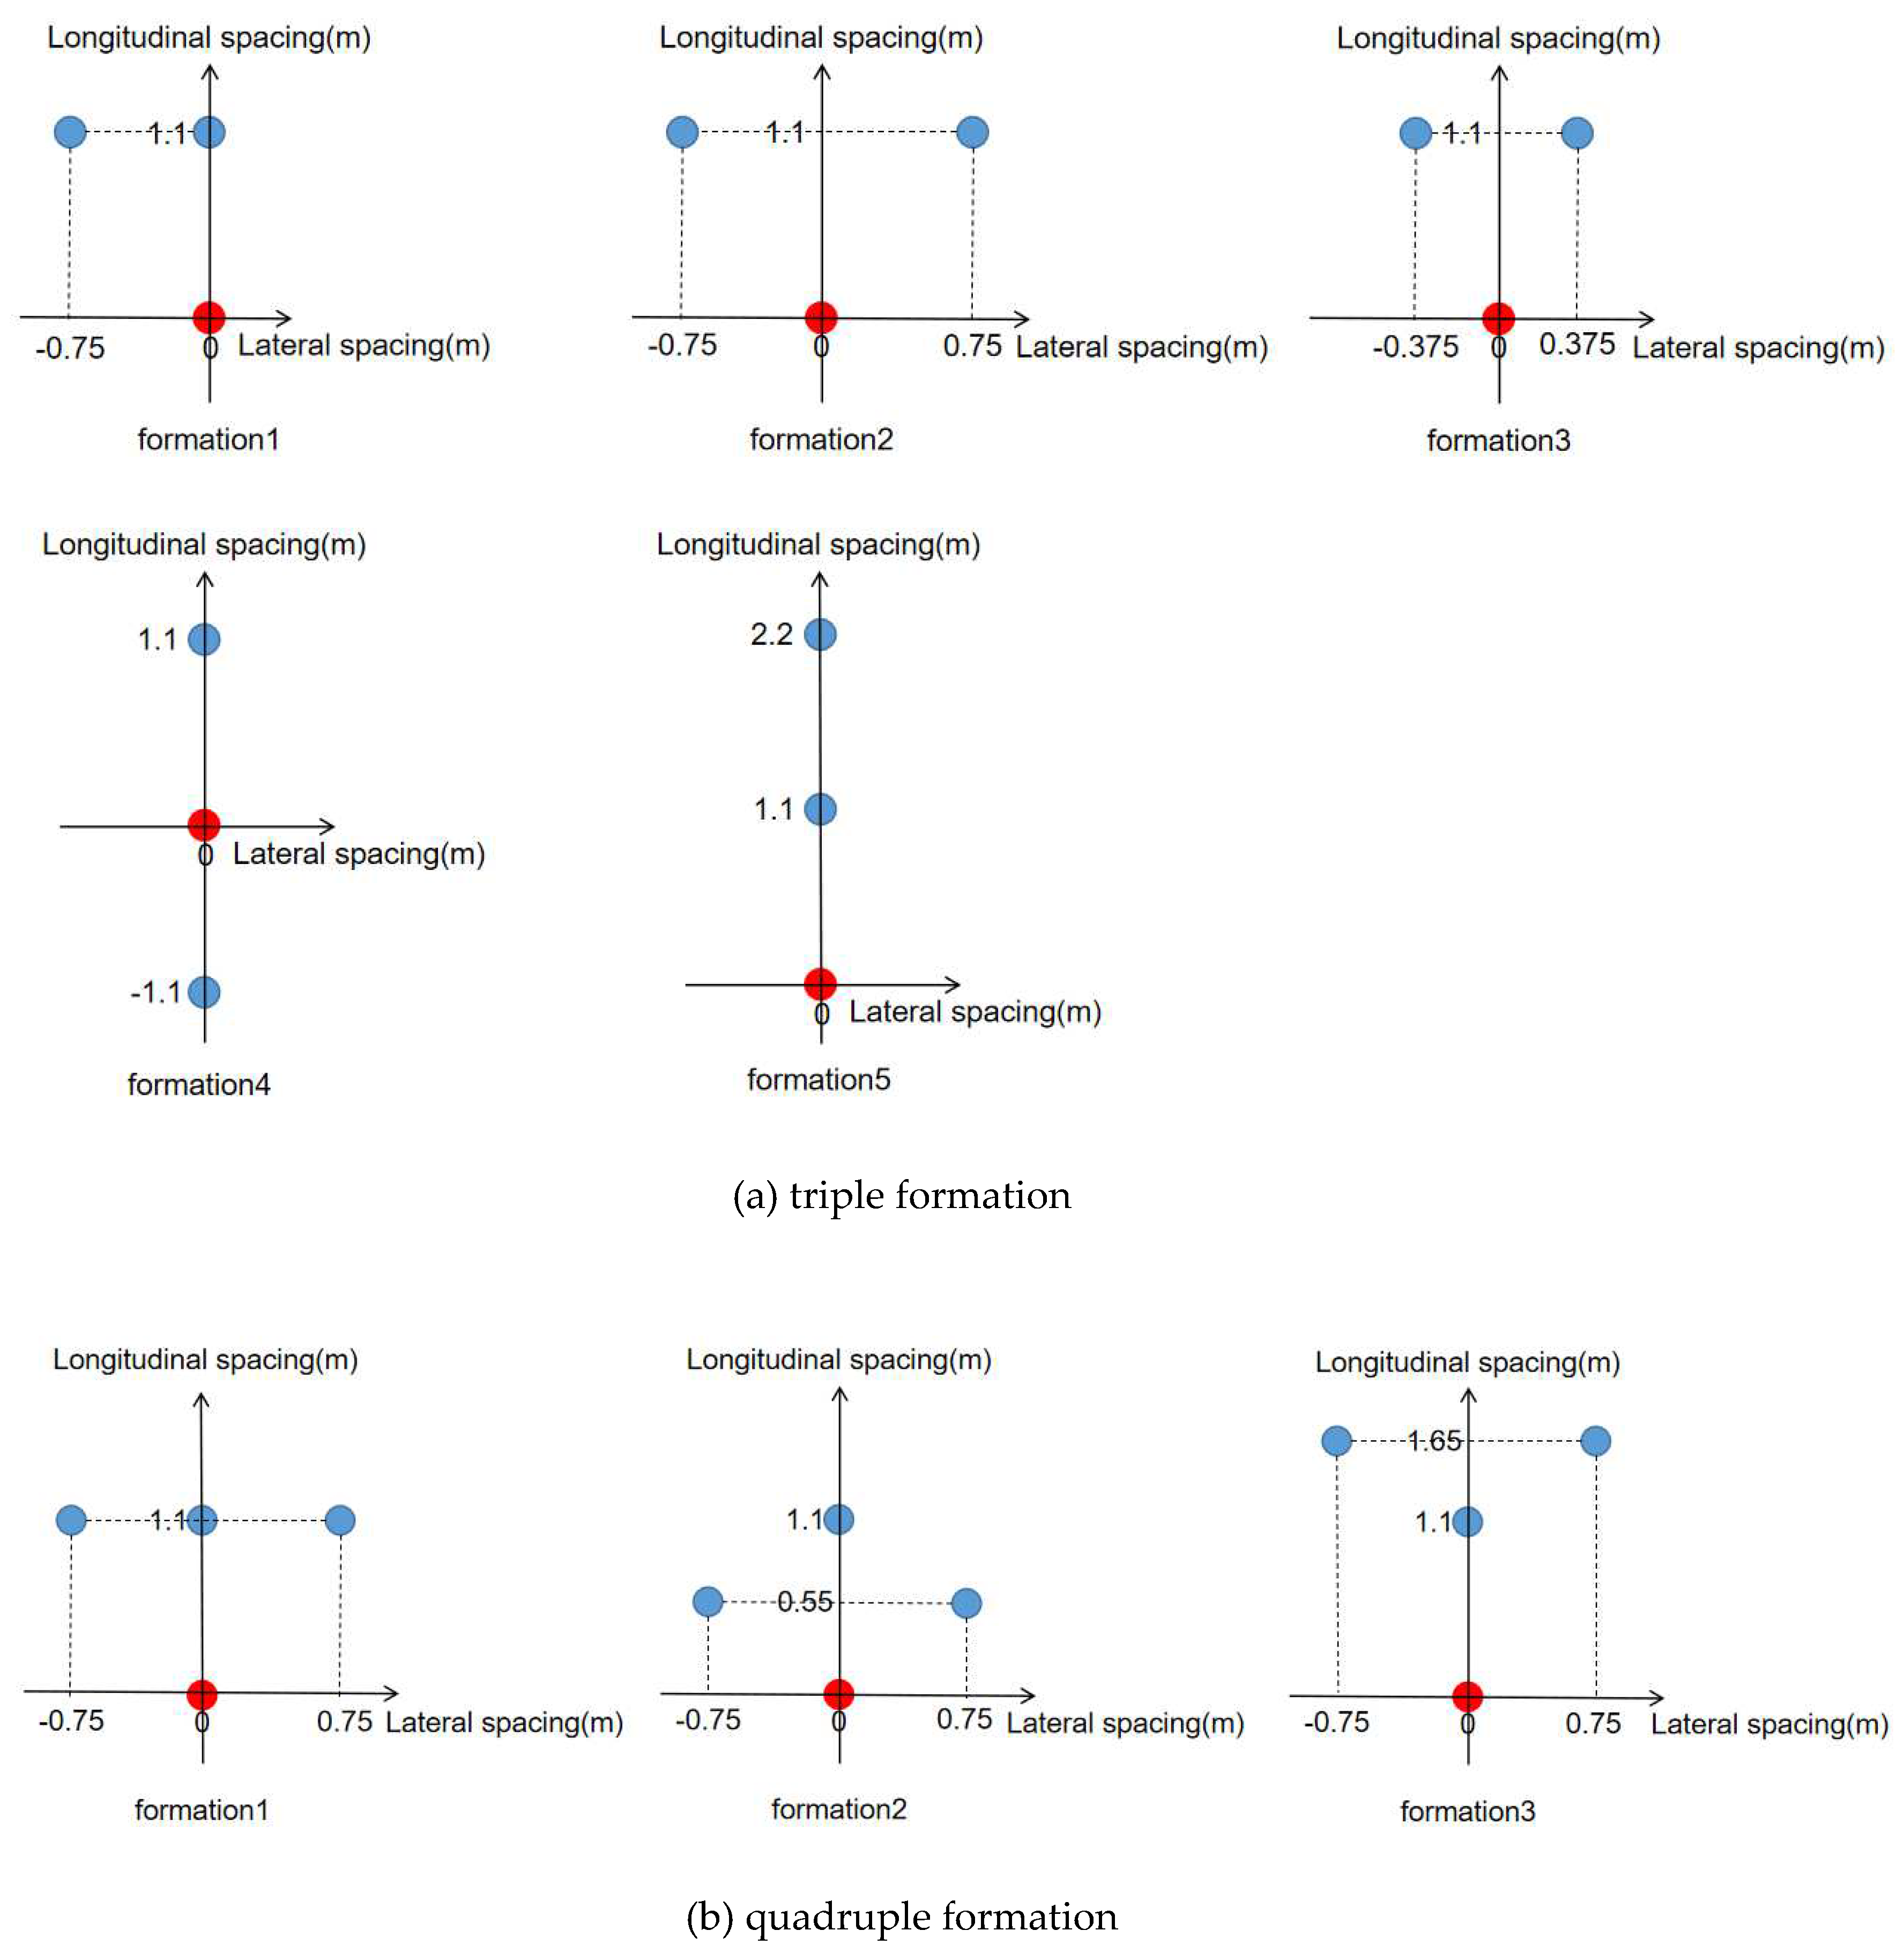
Figure 4 depicts the positions for five triple drafting formations and three quadruple drafting formations.
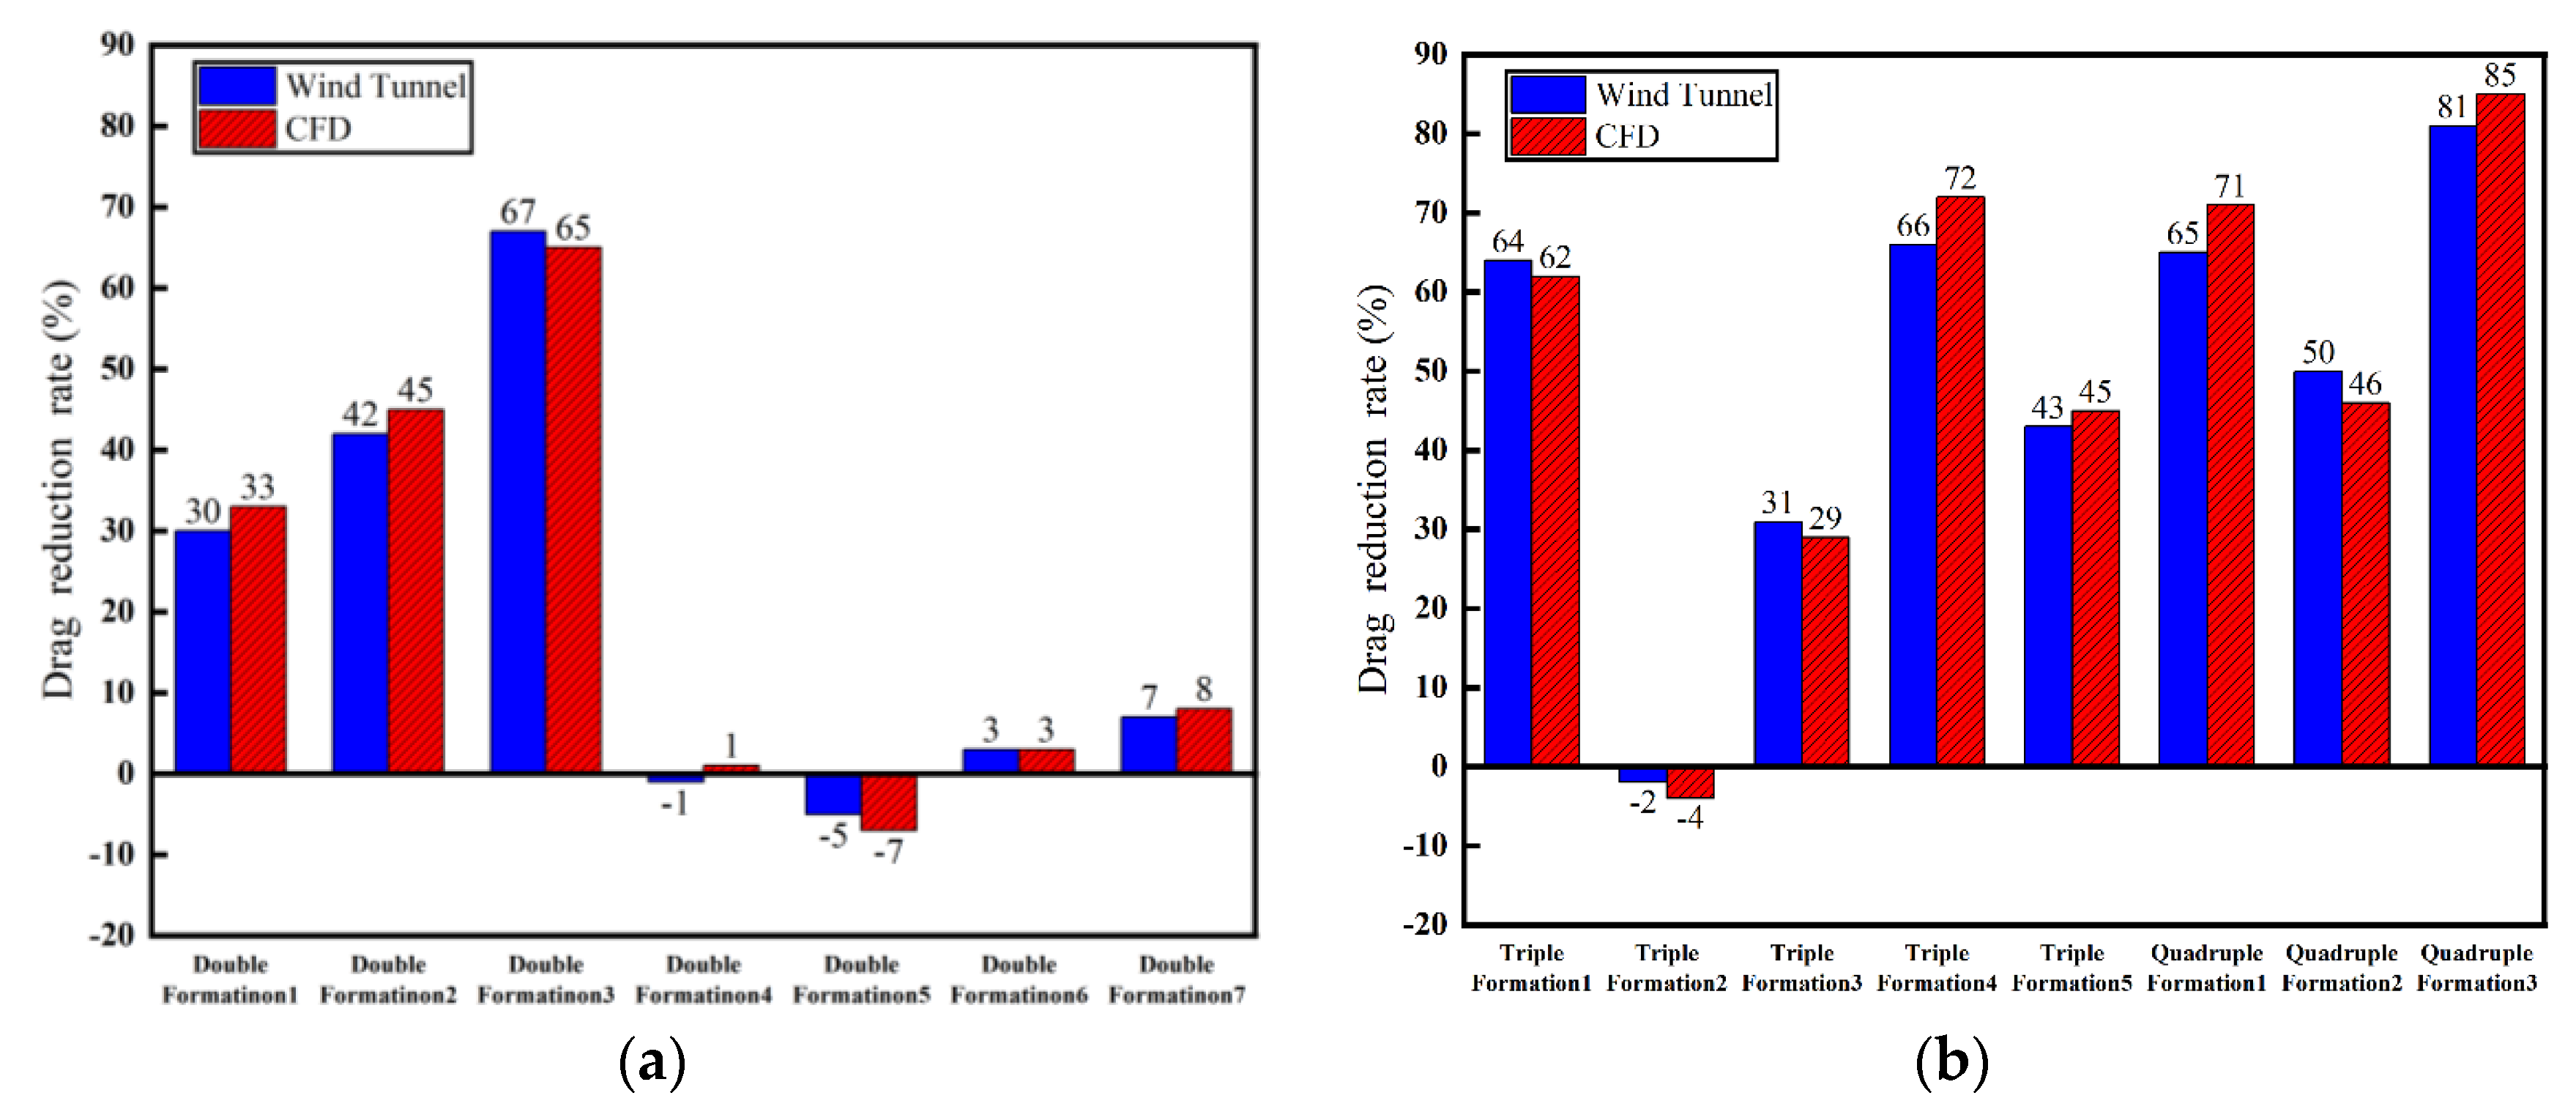
Figure 5 depicts the drag reduction rate of the core race walker for 15 drafting formations obtained from both wind-tunnel experiment and CFD simulation. The maximum absolute error in drag reduction rate for all drafting formations is 6%, with a corresponding maximum relative error of 9.2%, which falls below 10%. Importantly, the optimal drafting formations of different numbers of race walkers are consistent in CFD simulation and wind-tunnel experiment. Specifically, double formation 3, triple formation 4, and quadruple formation 3 exhibit the highest drag reduction rates among their respective numbers of race walkers. The drag reduction rates of these formations in wind-tunnel experiment are 67%, 66%, and 81%, respectively. In CFD numerical simulation, the corresponding drag reduction rates are 65%, 72%, and 85%.
According to
Figure 5, both wind-tunnel experiment and CFD simulation demonstrate that double drafting formation 1, 2, and 3 can significantly reduce the aerodynamic drag experienced by the core race walker who is following behind another one. Among the three formations, double drafting formation 3, where the two walkers are closest to each other, exhibits the highest effectiveness achieving a drag reduction rate of 65% in CFD simulation and 67% in wind-tunnel experiment. Conversely, the other double drafting formations have minimal effect on drag reduction. Therefore, it is recommended that the core race walker should maintain a position as close as possible directly behind the front race walker to achieve the greatest reduction in drag when utilizing double drafting formation in race walking.
Regarding triple drafting formations, the most notable reduction in drag is observed in triple drafting formation 4, where an additional race walker is added behind the core race walker of the optimal double drafting formation. This drafting formation resulted in a drag reduction rate of 72% in CFD simulation and 66% reduction in wind-tunnel experiment. The second highest reduction is achieved by triple drafting formation 5, where an additional race walker is added in front of the front race walker of the optimal double drafting formation. This drafting formation results in a drag reduction rate of 62% in CFD simulation and 64% reduction in wind-tunnel experiment. The other triple formations have minimal or negative effects on drag reduction. Thus, in triple drafting formation, it is advisable for the core race walker to position himself between two race walkers in front and behind him.
Among the quadruple drafting formations, the aerodynamic drag experienced by the core race walker is reduced, although to different extents. The quadruple drafting formation 3, which adds one race walker to the front left and right of the optimal double drafting formation, forming a V-shape in front of the core race walker, demonstrates the most significant reduction in drag. This formation achieves the highest drag reduction rate, with a reduction of up to 85% in CFD simulation and 81% in wind-tunnel experiment. If the two side race walkers in front move back to a side-by-side position (quadruple drafting formation 1), the drag reduction rate decreases to 71% in CFD simulation and 65% in wind-tunnel experiment. If they move further back to an inverted V position (quadruple drafting formation 2), the drag reduction rate further deteriorates to 44% in CFD simulation and wind-tunnel experiment. Thus, in quadruple drafting formation, it is ideal for the three auxiliary race walkers in front of the core race walker to form a V shape.
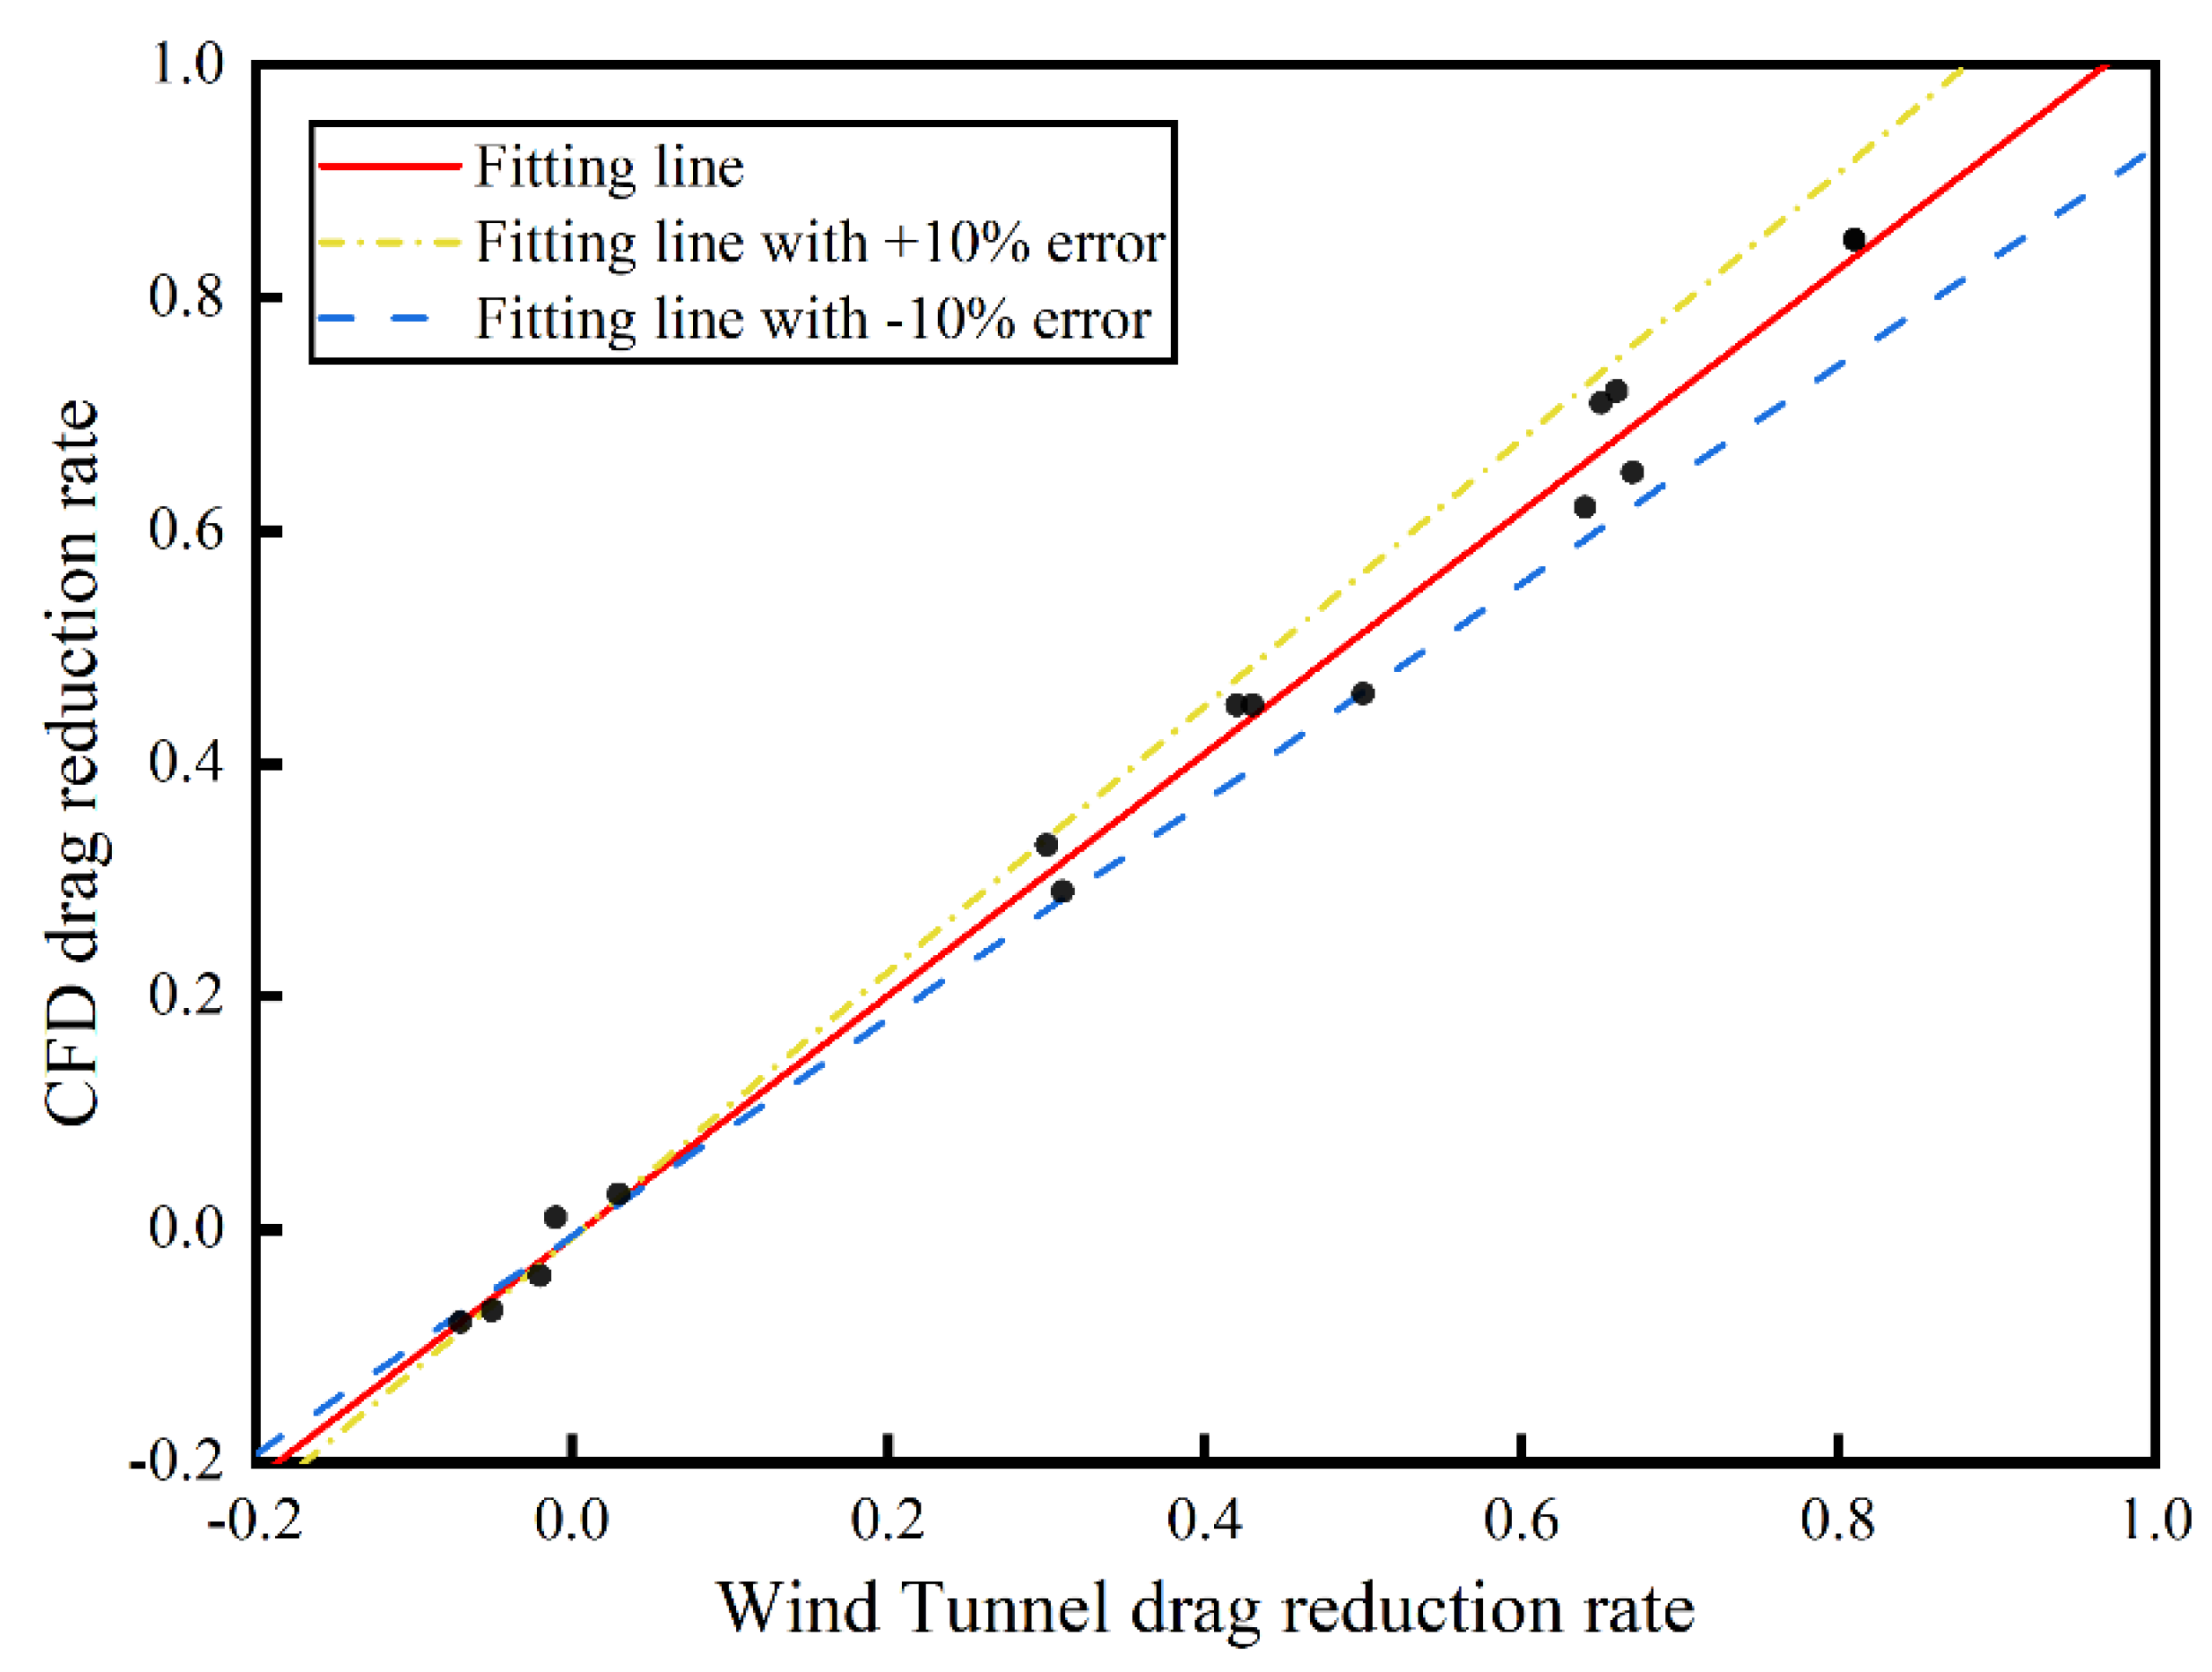
Figure 6 displays the fitting results of the drag reduction rate obtained from the wind-tunnel experiment and CFD simulation, demonstrating a strong agreement between the two methods with a fitting error below 10%. This further illustrates the consistency of the drag reduction rate between the two methods and validates the accuracy of the CFD numerical simulation results.
As the core race walker engages in drafting formations with different numbers of race walkers, the encountered aerodynamic drag demonstrates corresponding variations. Nonetheless, the mannequins used in the CFD numerical simulations are 3D scanned models of the core walker, employed to simulate the other race walkers in the drafting formation, while in the wind-tunnel experiment, the other race walkers display diverse body shapes, resulting in significant differences compared to CFD simulation. This paper introduces the drag reduction rate () as an evaluation index. It is observed that the discrepancy between the drag reduction rate obtained from wind-tunnel experiment and CFD simulation is less than 10%, thereby establishing their consistency. This observation emphasizes that as the spacing between race walkers increases, the influence of body shape variations on drag reduction decreases, with the spacing between race walkers emerging as the primary factor in drag reduction.
3. Drag reduction mechanism in race walking drafting formations
In race walking, aerodynamic drag is characterized by an augmented pressure difference between the front and rear of the race walker, caused by the impact of airflow ahead of the race walker. The pressure coefficient is defined as:
where the static pressure at infinity
Pa, the incoming velocity
=6 m/s,
is the static pressure at the specific point,
is the air density.
The drag experienced by the core race walker is primarily determined by the pressure difference between the front and back.
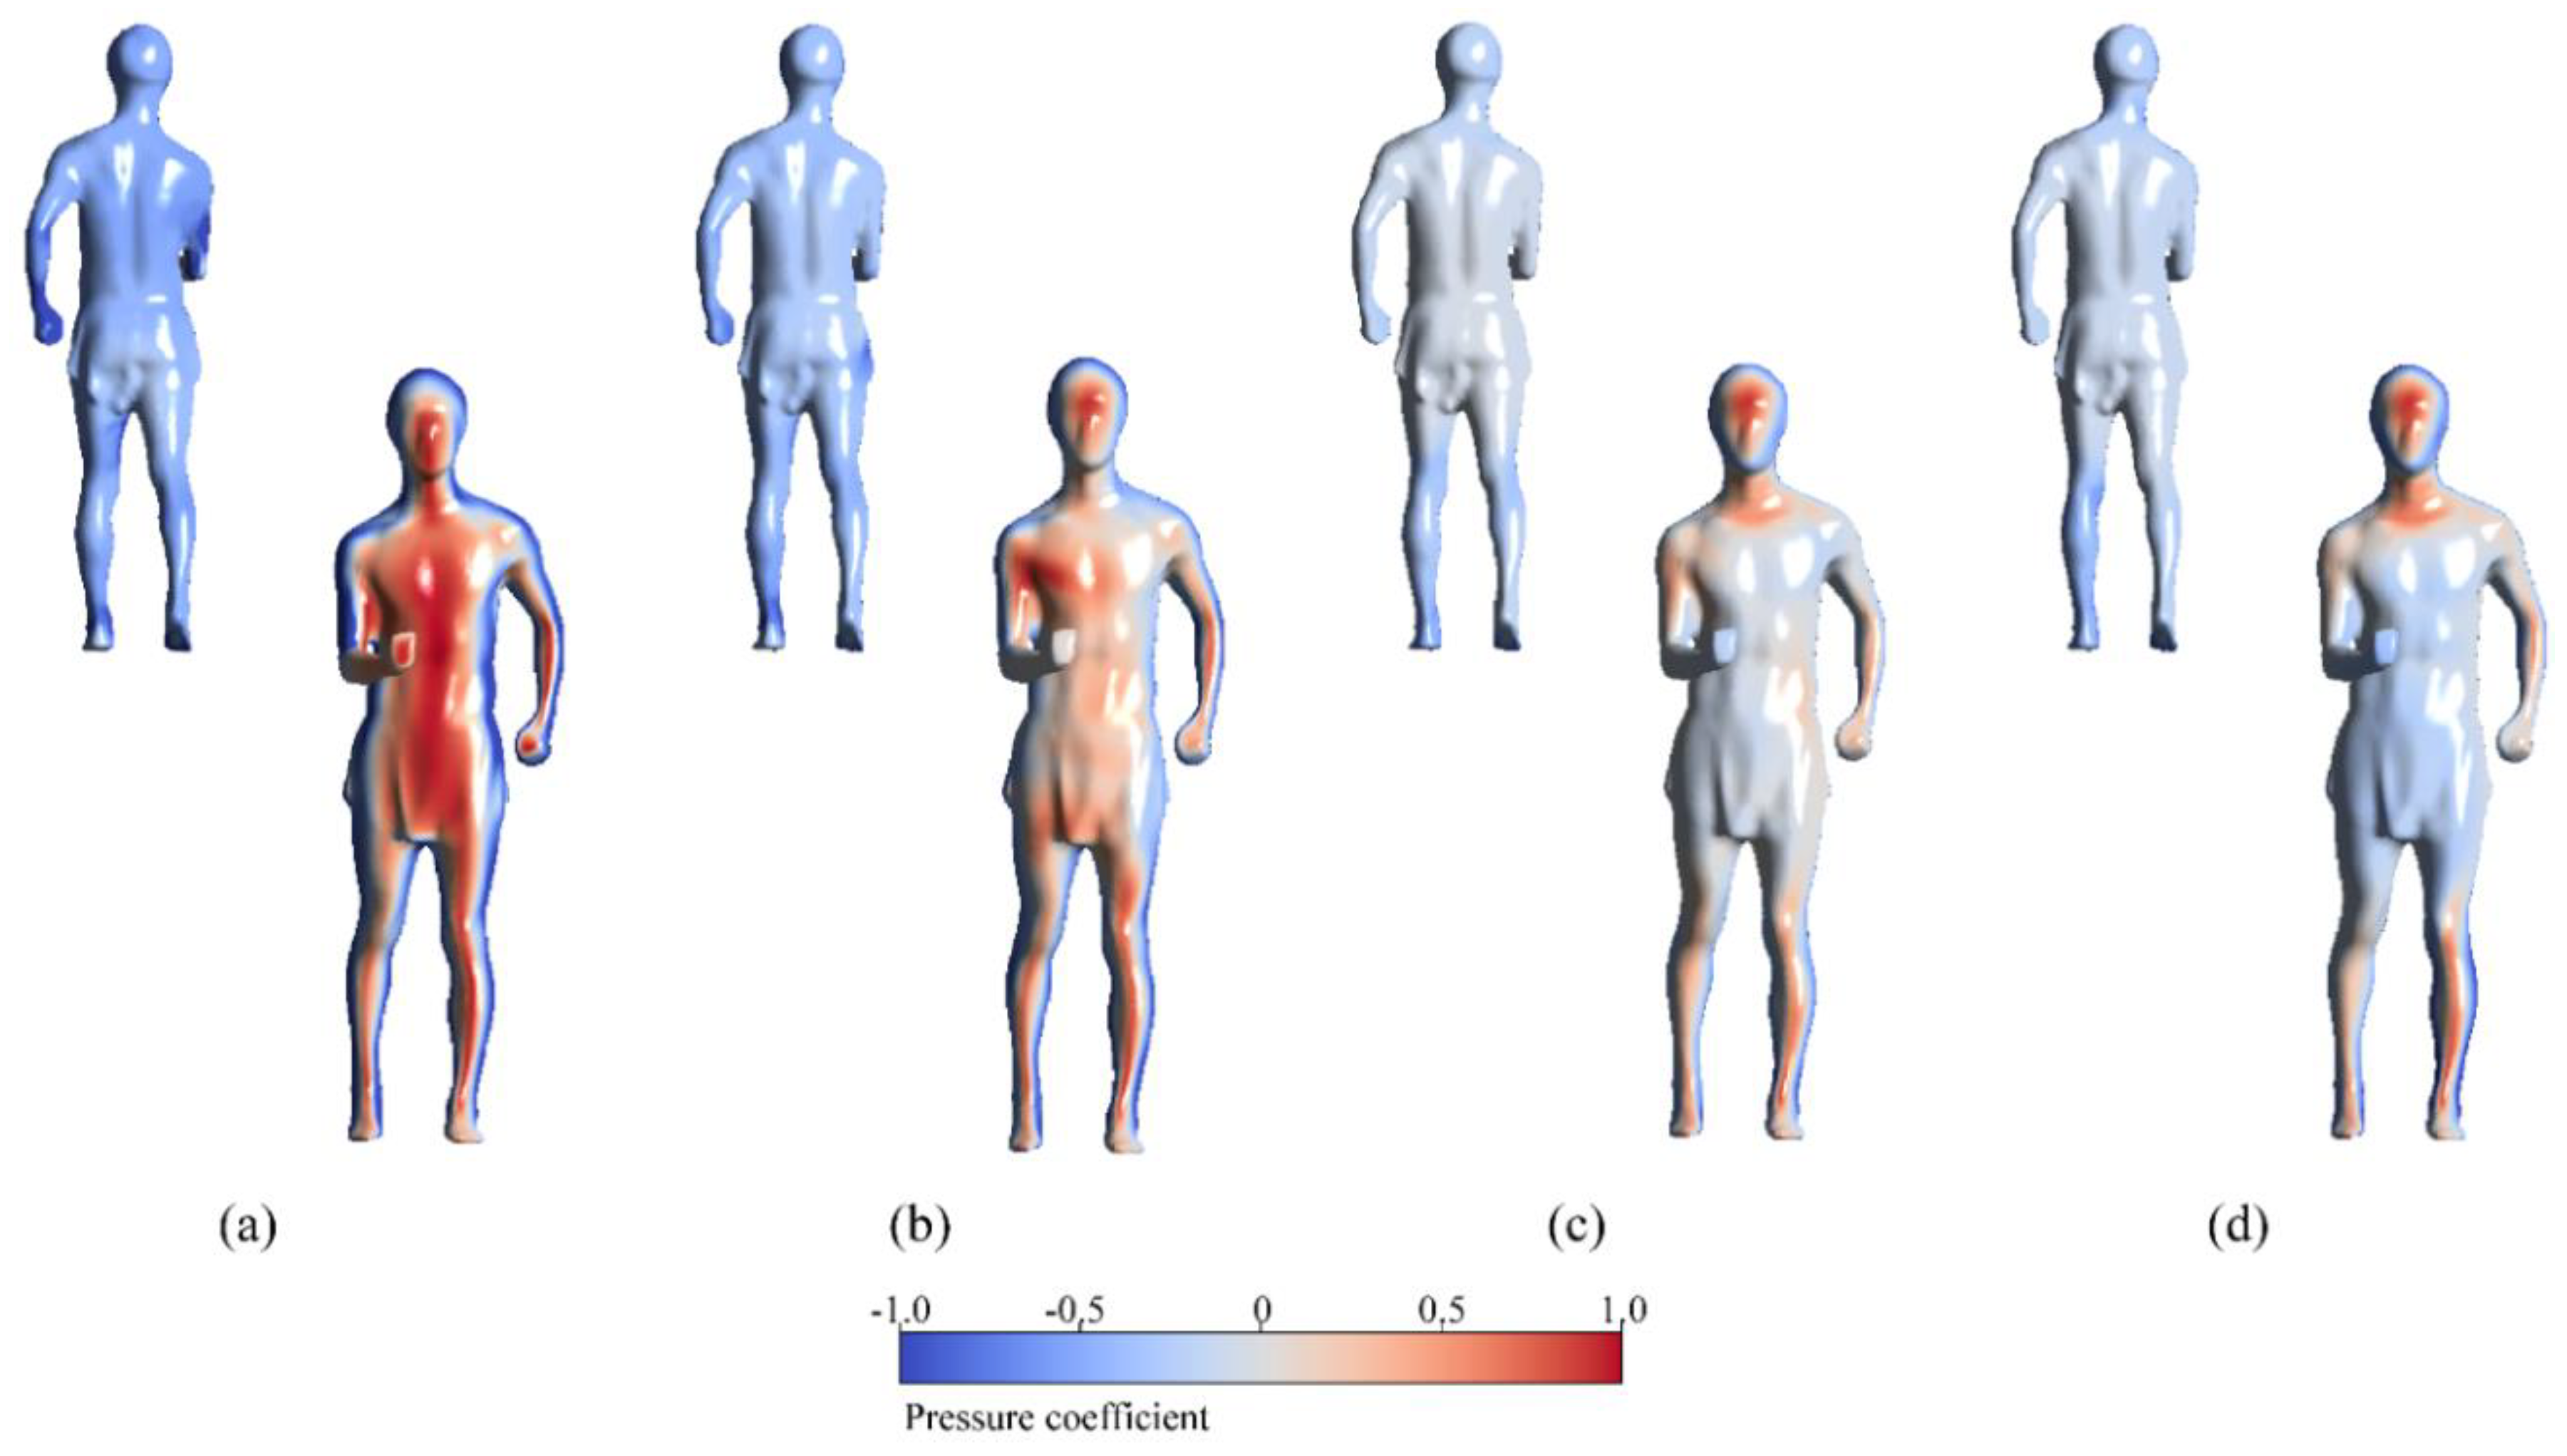
Figure 7 and
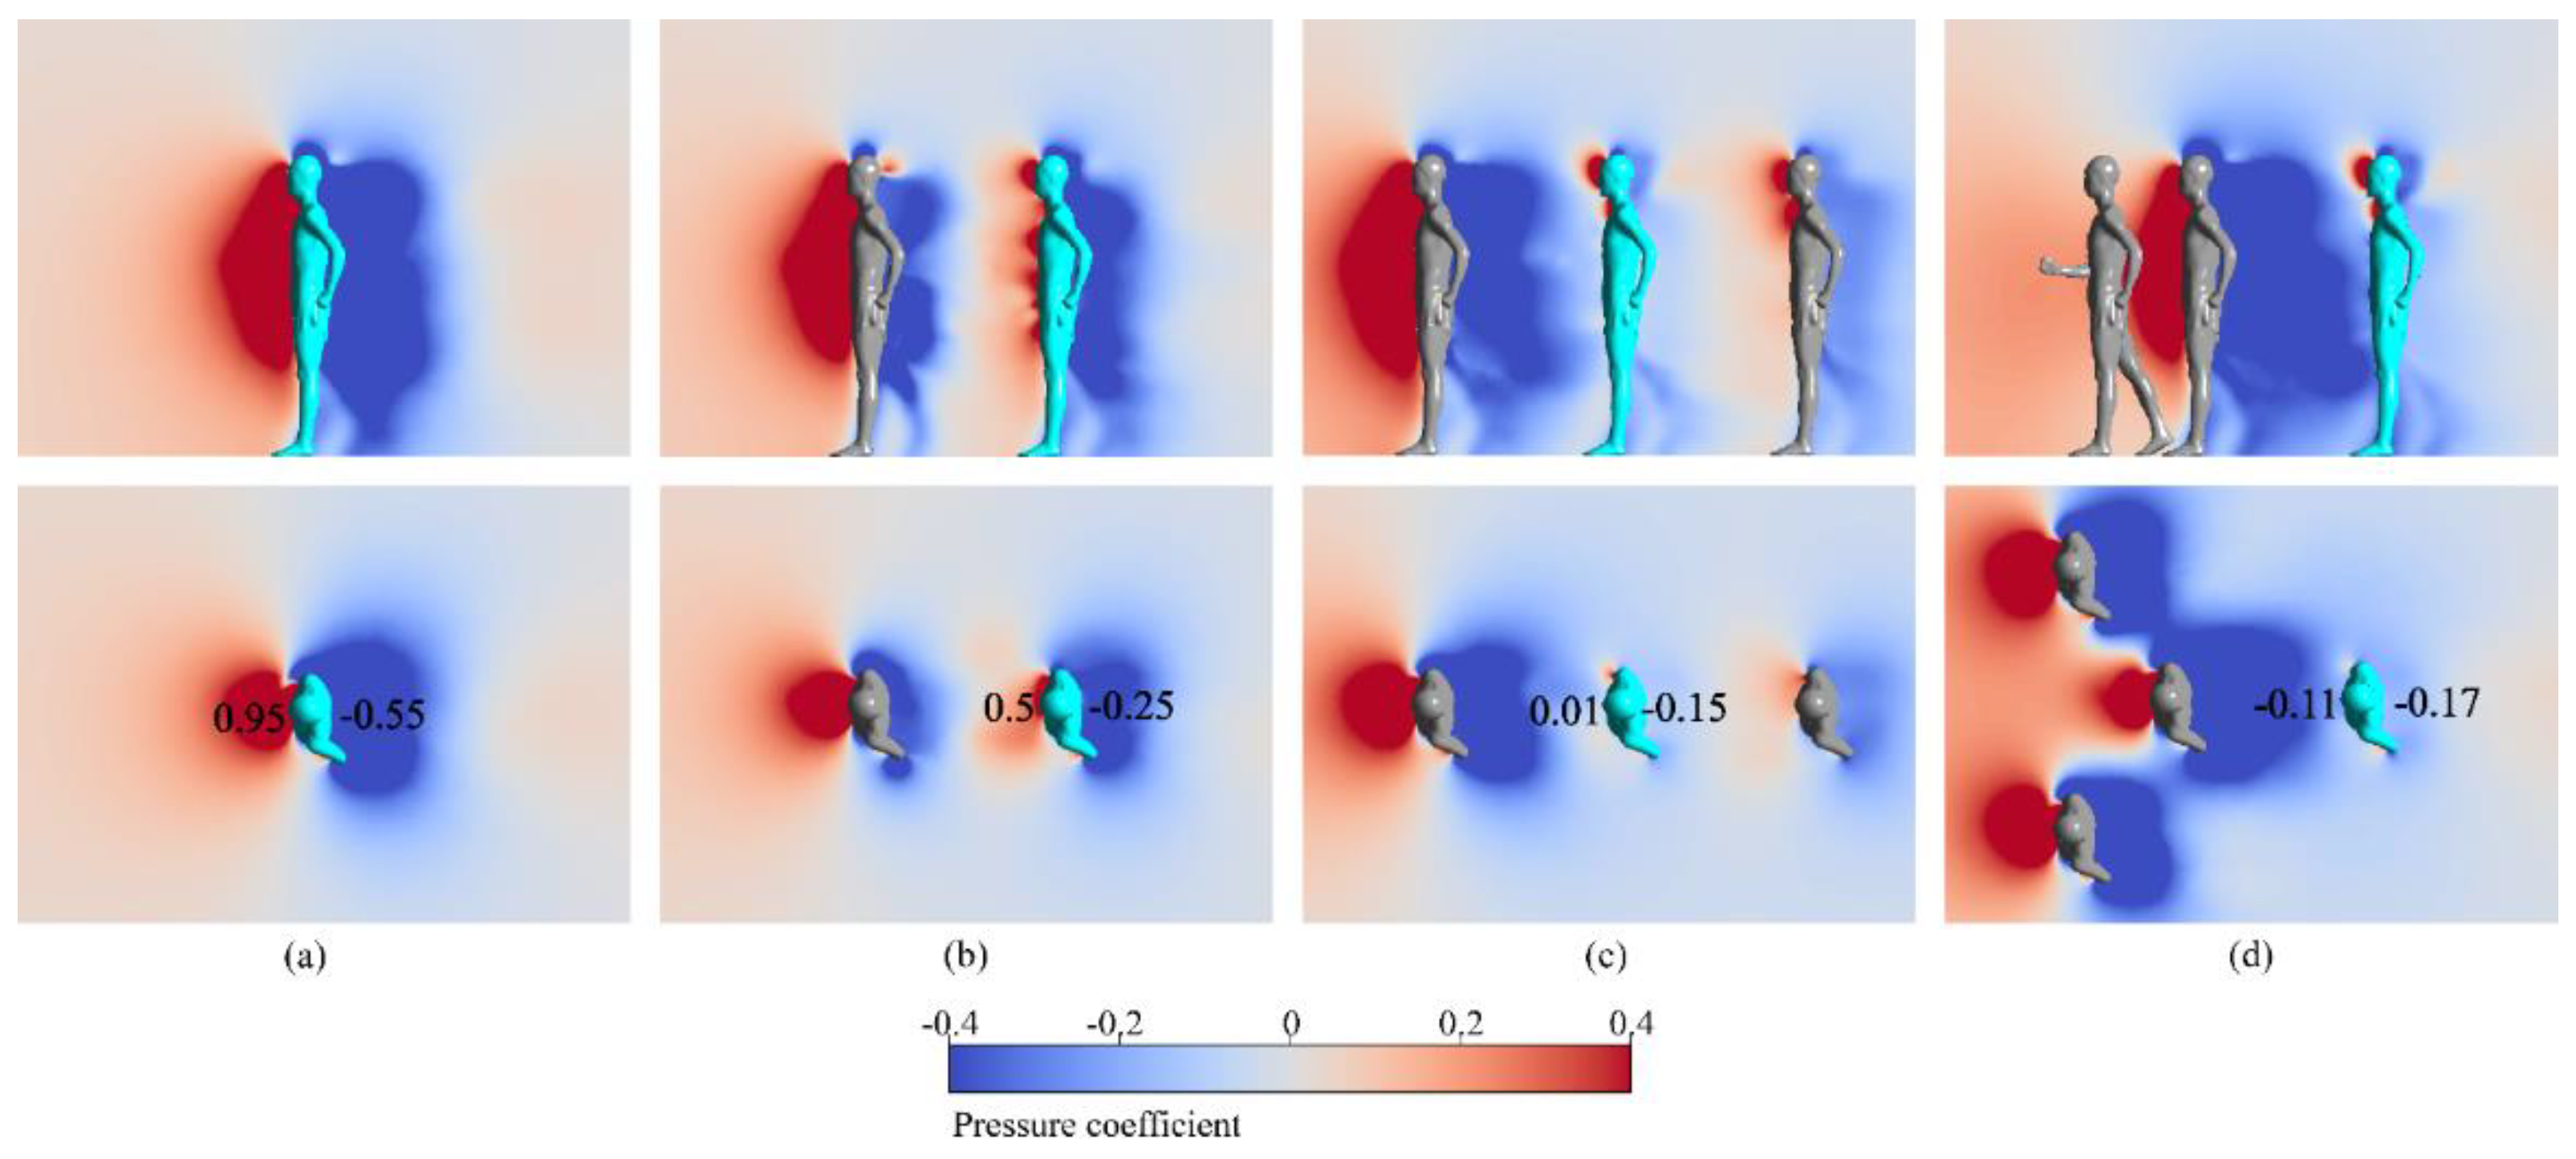
Figure 8 displays the surface pressure of the core race walker and ambient pressure experienced around the core race walkers in different optimal drafting formations.
Figure 7 clearly shows that as the number of race walkers in optimal formations increases (from left to right), the pressure coefficient in front of the core race walker decreases gradually, while the pressure coefficient at the back increases gradually. This results in a smaller pressure difference between the front and rear, thereby achieving better drag reduction effect. The drag reduction effects, as indicated by CFD simulation, are 0%, 65%, 72%, and 85% from left to right.
Figure 8 also provides an intuitive view that as the number of race walker in optimal formations increases, the positive pressure area in front of the core athlete and the negative pressure area at the rear gradually decrease. Taking the chest pressure of the core race walker as an example, when race walking alone, the chest pressure is 0.95, the back chest pressure is -0.55, resulting in a front-to-back pressure difference of 1.4. However, with an increase in the number of optimal formations, the front-to-back pressure difference gradually decreases to 0.75 in double drafting formation, 0.16 in triple drafting formation, and 0.06 in quadruple drafting formation, respectively.
In the optimal double drafting formation, a race walker is added and positioned directly in front of the core race walker at the shortest distance, resulting in a drag reduction rate of 65%. Compared to race walking alone, race walking in different formations exhibits a more significant decrease in the front-to-back pressure difference, as illustrated in
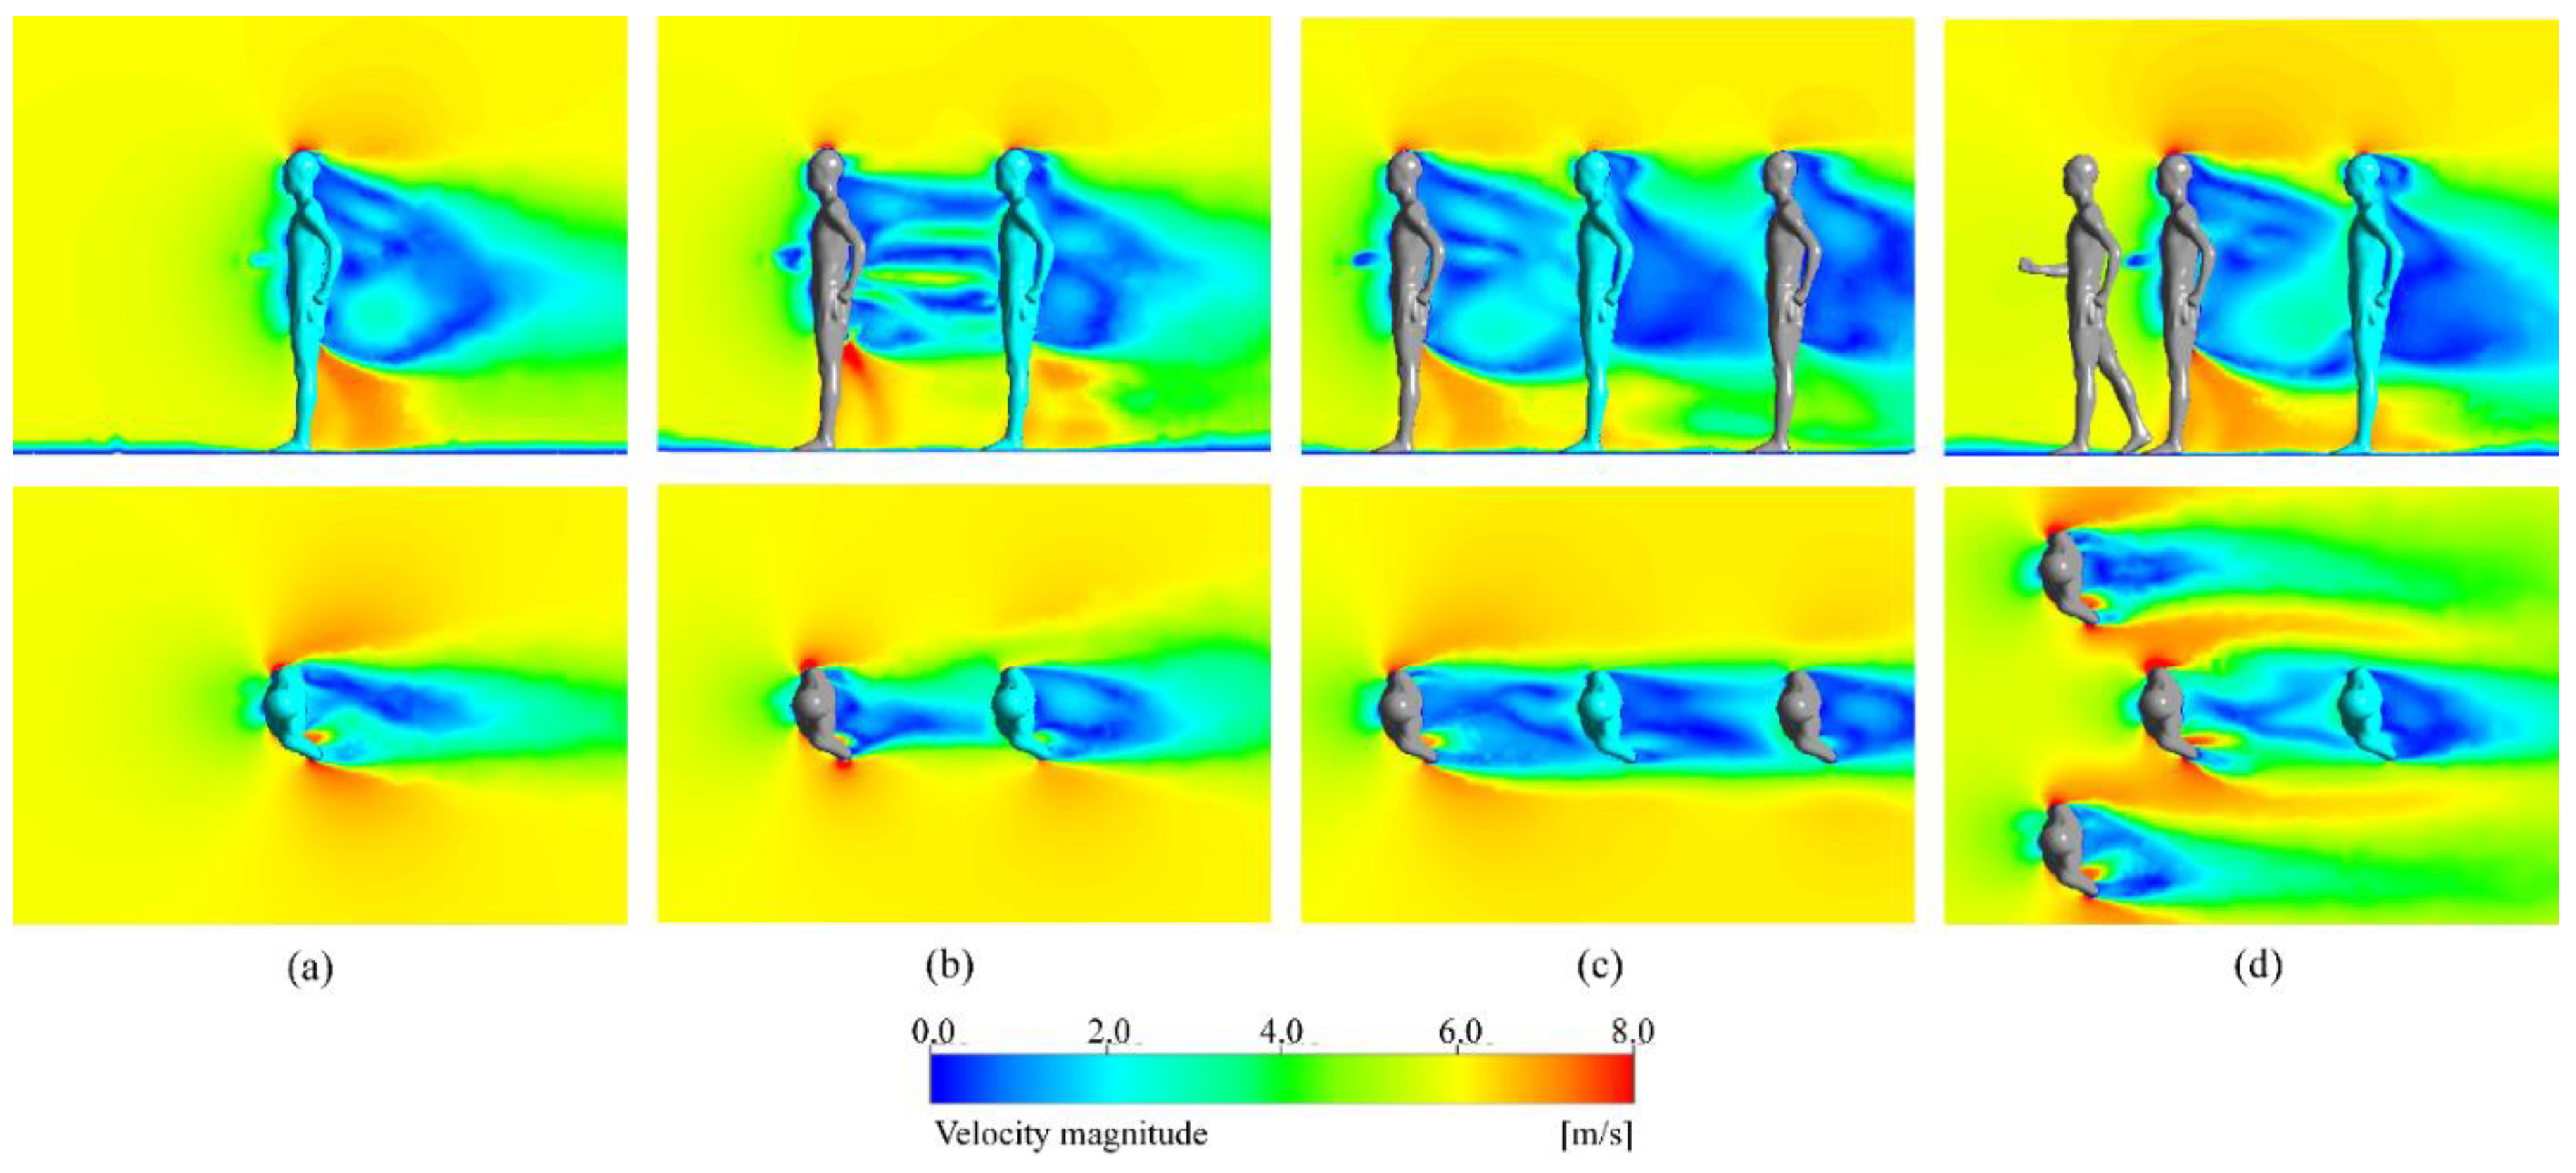
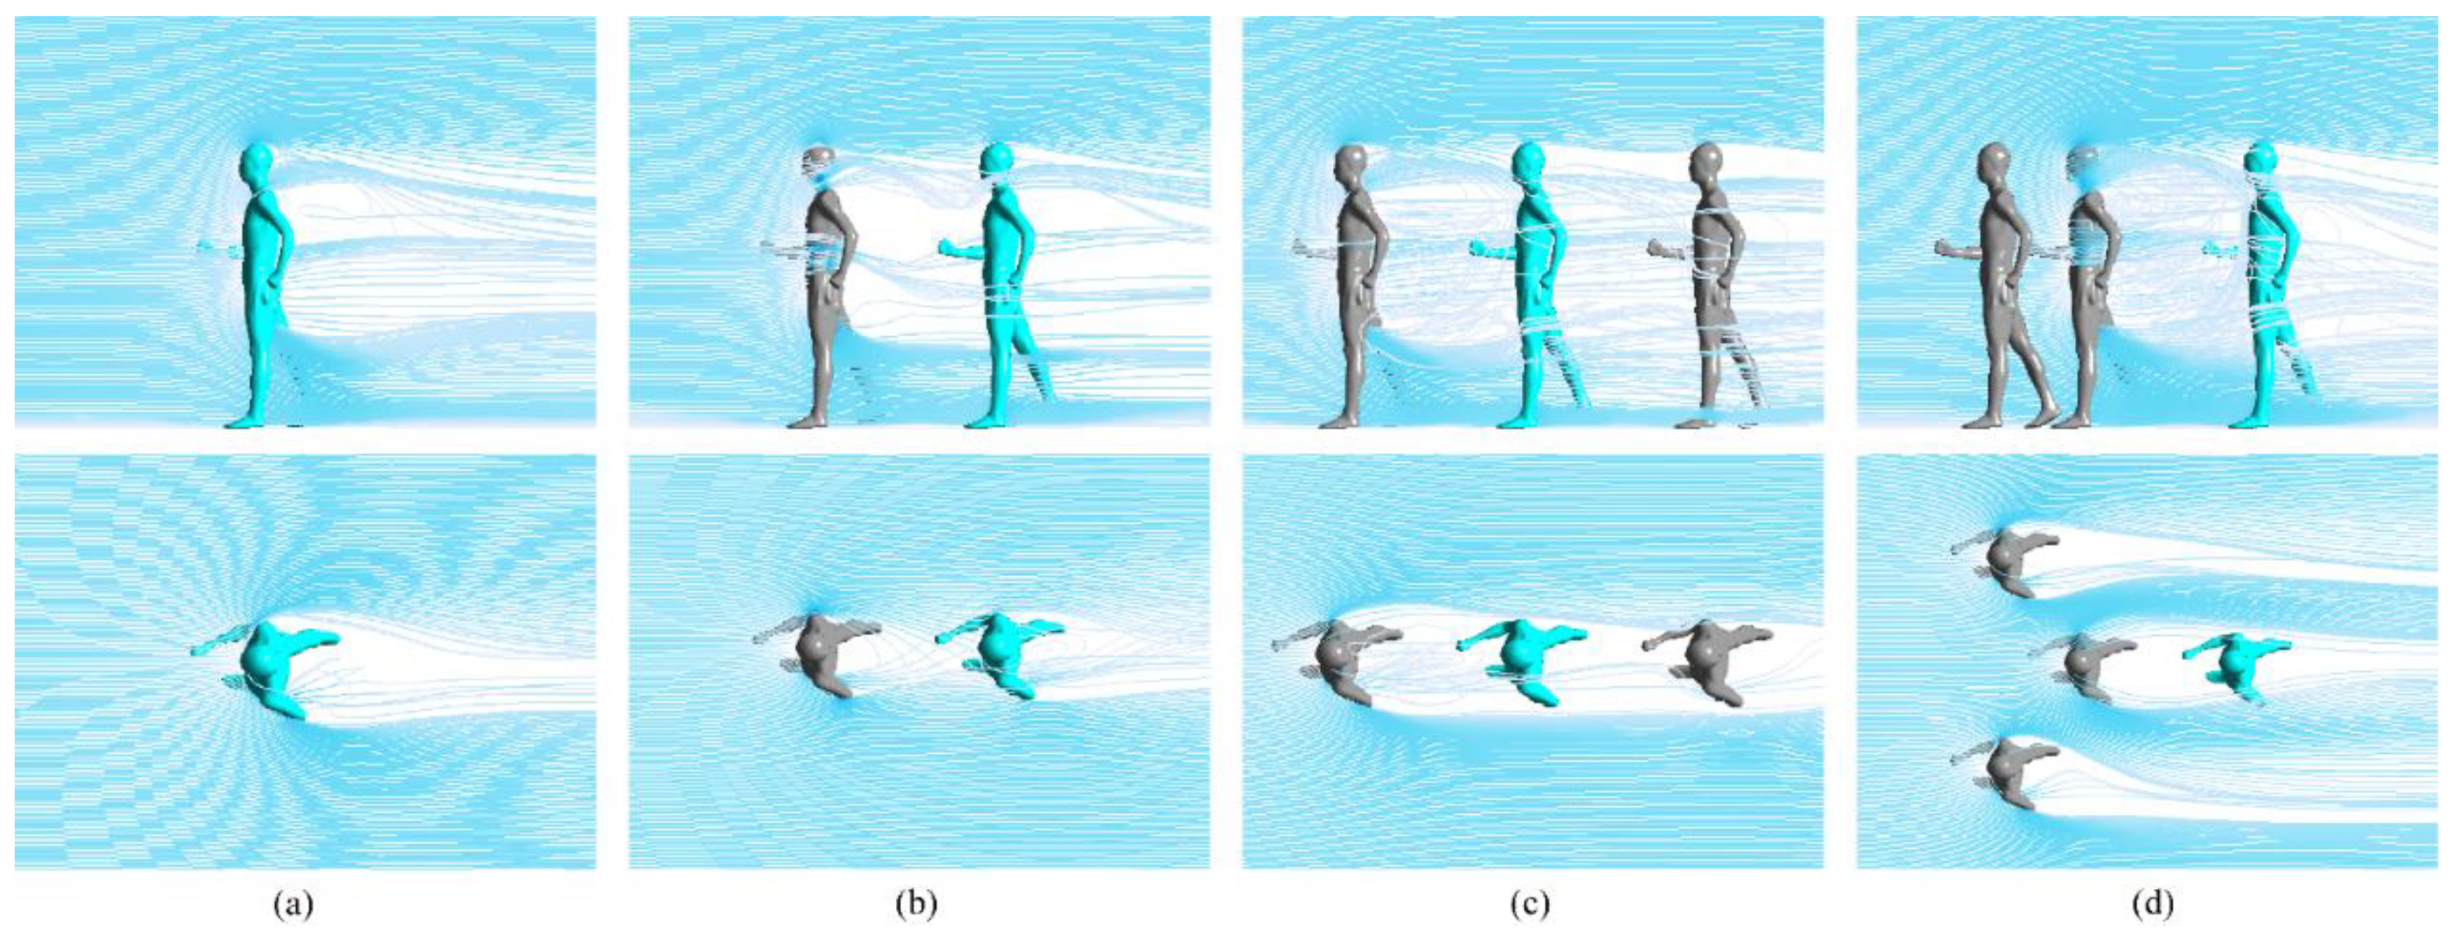
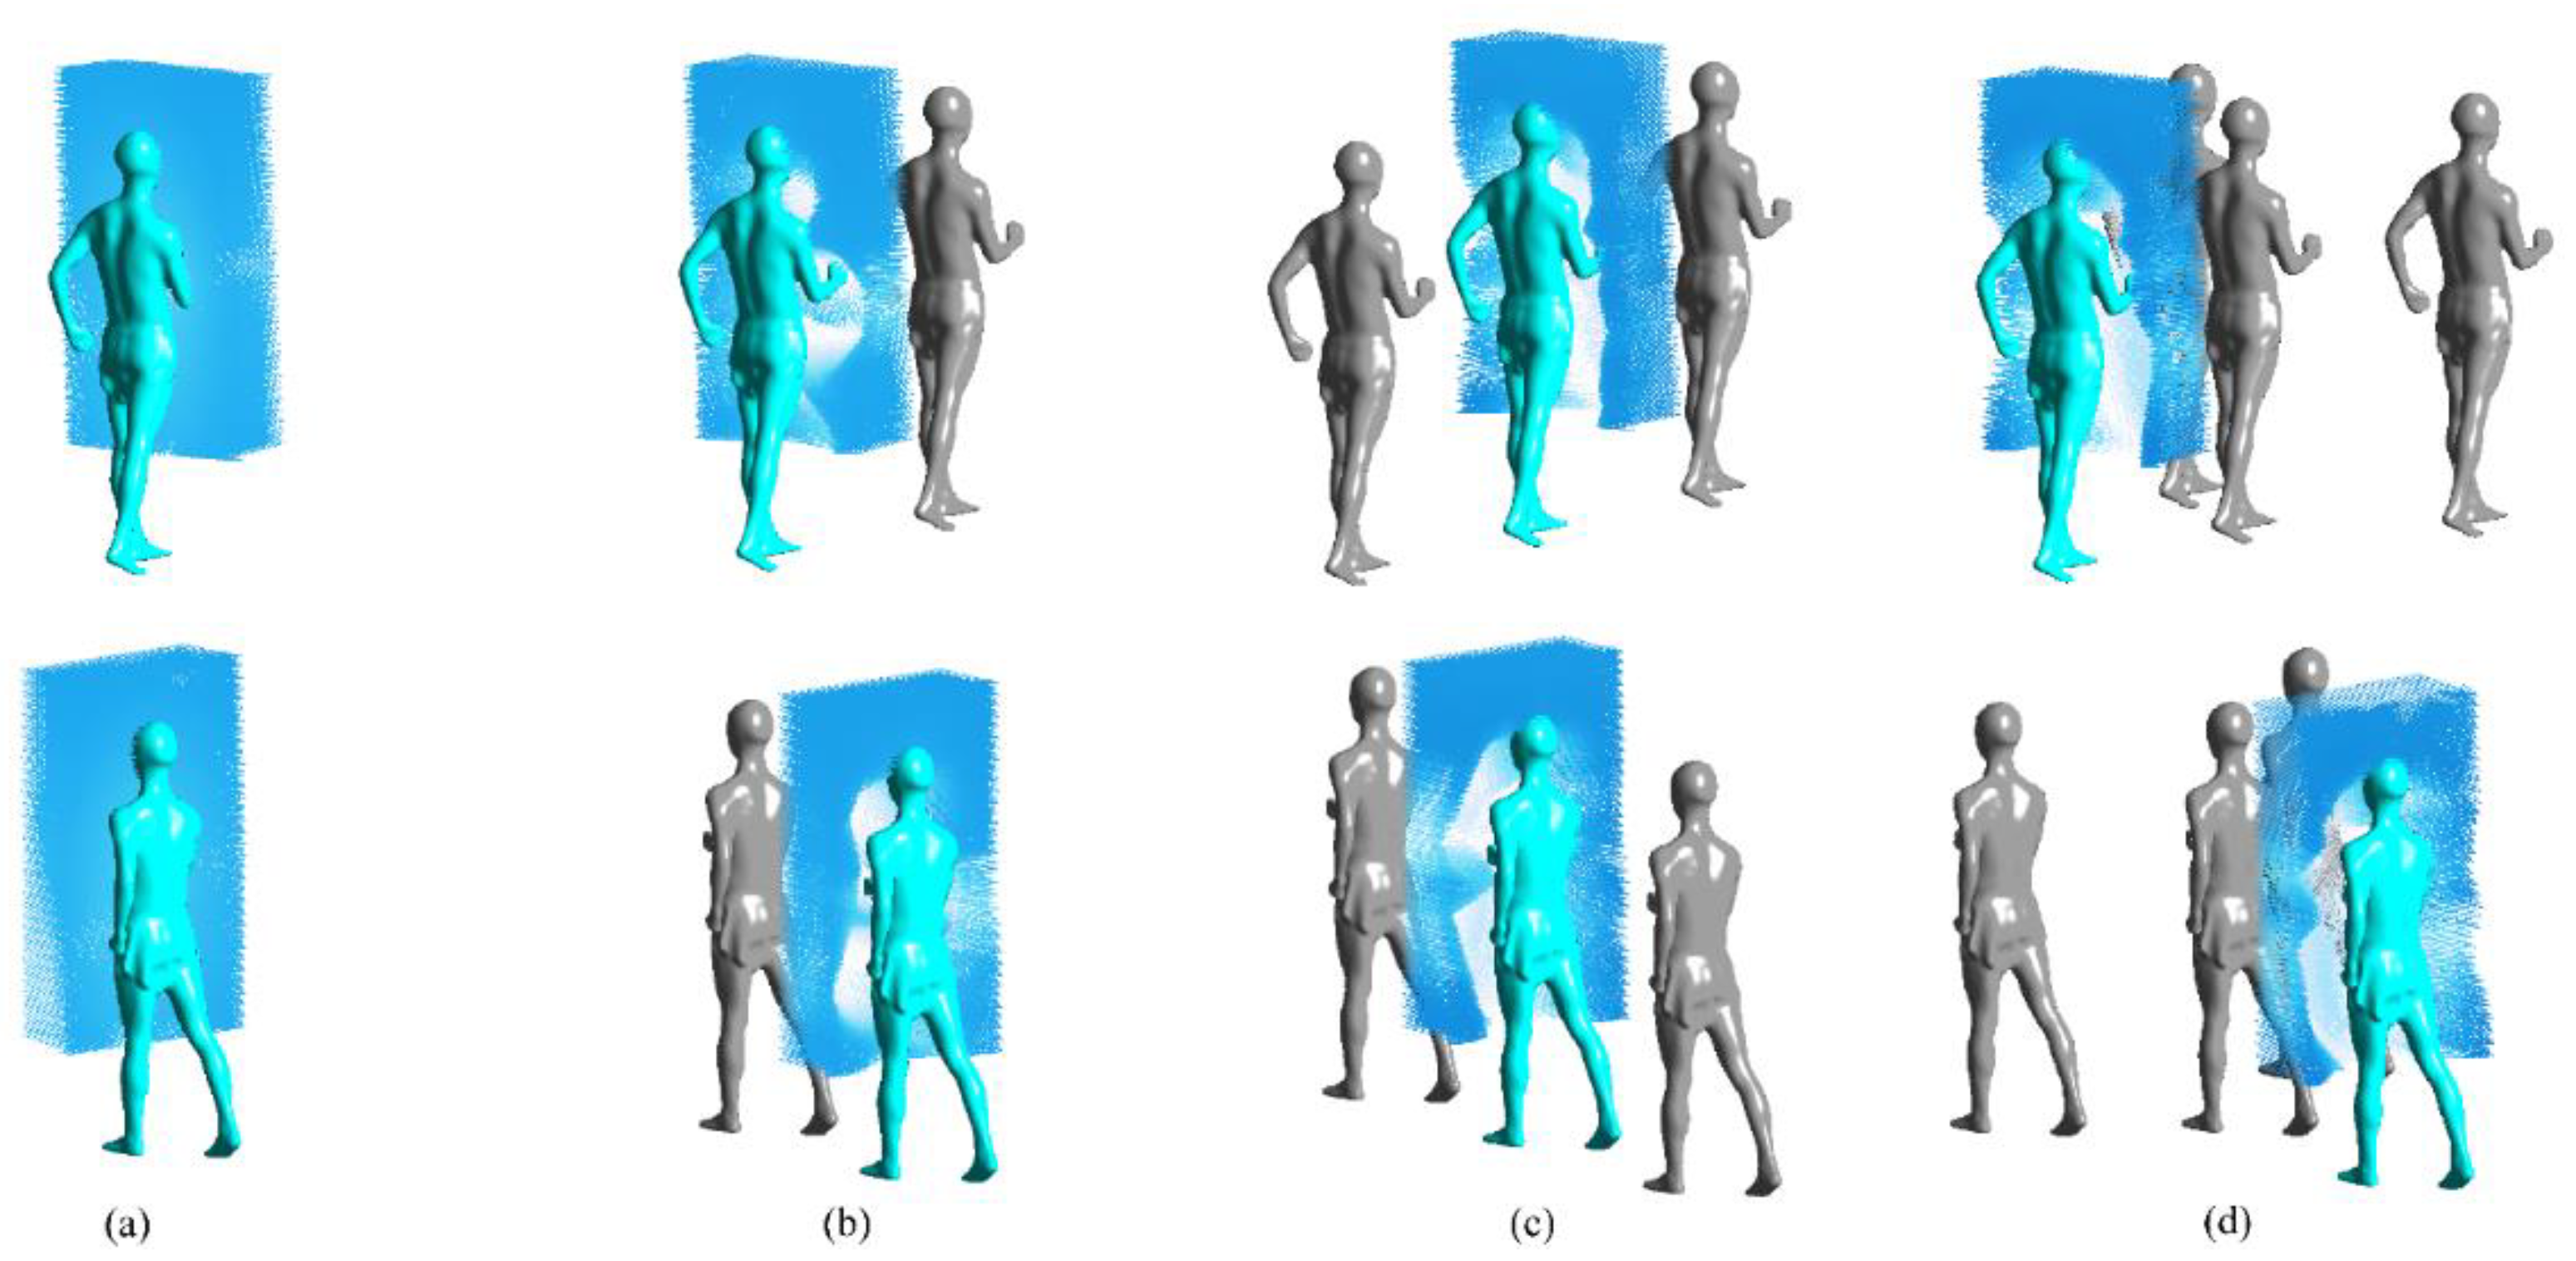
Figure 8b. Taking the chest pressure coefficient as an example, the coefficient decreases by 0.45 in the front and increases by 0.3 in the rear, in comparison to race walking alone. As a result, the pressure difference is reduced by 0.7. In order to gain a deeper understanding of the changes in pressure difference between the front and rear, an analysis is conducted on the velocity, streamline and velocity vector around the core race walker, as depicted in
Figure 9b,
Figure 10b and
Figure 11b. These figures illustrate the streamlines in the double optimal double drafting formation, showing the airflow's shielding effect by the front race walker.
Figure 9b clearly indicates a notable decrease in the velocity in front of the core race walker compared to
Figure 9(a), resulting in reduced kinetic energy of the incoming flow. As a consequence, the core race walker experiences less impact and lower pressure at the front. From
Figure 10b and
Figure 11b, it can be found that only a small portion of the incoming airflow passes directly through the gap, impacting the core race walker, while the majority of the airflow is diverted towards the sides due to the obstruction created by the front race walker. The diverted airflow gradually converges towards the center as a result of the pressure difference between the diverted airflow and the inner airflow, impacting the core race walker. The degree of convergence of the diverted airflow primarily depends on the velocity of the air on both sides, where higher velocity leads to lower pressure and slower convergence. As a result, the core race walker experiences reduced impact from the airflow, leading to lower pressure on the front surface of the core walker. Furthermore,
Figure 12b illustrates that the reduction in the number and velocity of incoming airflow directly leads to a decrease in the air velocity behind the core race walker. This reduction mitigates the formation of rear turbulence and vortex, thereby increasing the pressure of the rear pressure regions.
The analysis of the flow field in the optimal double drafting formation indicates that, to achieve enhanced drag reduction, it is crucial to minimize the number and velocity of incoming airflow that impact on the core race walker. On one hand, it is essential to minimize the airflow that directly impact the core race walker through the gaps between the front race walkers. On the other hand, delaying the convergence of the airflow on both sides is necessary to mitigate the impact.
The optimal triple drafting formation builds upon the optimal double drafting formation by adding another race walker behind the core race walker. This addition further enhances the drag reduction effect, reaching a level of 72%.
Figure 7c also reveals a further reduction in front pressure and an increase in back pressure of the core race walker compared to
Figure 7b, resulting in a decreased of the front and rear pressure difference. Figure 8a–c illustrate that the front chest pressure coefficient of the core race walker is 0.01, while the rear chest pressure coefficient is -0.17. This yields a pressure difference of 0.18, which is 1.32 lower than that race walking alone and 0.59 lower than race walking in double drafting formation.
Figure 9c shows a further decrease in the velocity in front of the core race walker.
Figure 10c and
Figure 11c provide illustrations of backflow occurring when the airflow impacts the rear race walker, resulting in a delay in the inward convergence of the airflow. These factors further reduce the impact of airflow on the core race walker. Simultaneously, the continued reduction in the number and velocity of airflow impacting the core race walker leads to a decrease in the rear air speed, as depicted in
Figure 12c. This further diminishes the formation of rear turbulence and vortex, increases the pressure coefficient at the rear, and reduces the pressure difference between the front and rear.
The optimal quadruple drafting formation is derived from the optimal double drafting formation by adding a race walker to both the left front and right front of the front race walker, forming a V shape. This addition significantly enhances the drag reduction effect, resulting in a drag reduction rate of 85%. Comparing
Figure 7d,c, it can be observed that the optimal quadruple drafting formation exhibits a further reduction in the pressure in front of the core race walker compared to the optimal triple drafting formation, while the rear pressure remains relatively unchanged.
Figure 8d shows the lowest pressure difference between the front and rear chest among all drafting formations, with a value of -0.06.
Figure 9d reveals that the presence of race walkers on both sides in front of the V-shaped formation results in increased air velocity on both sides of the front race walker. Consequently, the pressure difference between the airflow on both sides and the inner side decreases as shown in
Figure 10d. This delay in the inward convergence of the airflow further mitigates the impact of the core race walkers on the airflow, compared to
Figure 10c. However, since the optimal triple and quadruple formations both achieve good drag reduction, the differences between
Figure 11c,d and
Figure 12c,d are small and cannot be visually seen from the images. To provide a more detailed explanation regarding the impact of airflow on drag reduction, the velocity in
Figure 11 and
Figure 12 is further quantified. The average speed of the velocity vector in
Figure 11c is 3.29, whereas the average speed in
Figure 11d is 2.97, confirming a lower airflow impact in optimal quadruple drafting formation. The average velocity in both
Figure 12c,d is 4.08, indicating a small difference in reducing the formation of rear turbulence and vortices. Therefore, the difference in the rear pressure coefficient between the optimal triple and quadruple drafting formations is small. The pressure difference between the front and rear chest is -0.06, which is the lowest among all drafting formations.
The analysis of race walking alone and three optimal drafting formations reveals that drag reduction is achieved through the shielding effect of the front race walker on the oncoming flow. This effect minimizes the impact of fluid on the core race walker, leading to a reduced pressure difference between the front and rear.
4. Metabolic power savings and performance predictions
To calculate the power consumed by core race walker against the aerodynamic drag, the basic kinematic equations and an empirical mathematical model of mechanical power output are utilized. Cavagna conducted experiment with race walkers on a force platform to establish an empirical model of mechanical power output [
30]. This model considers the power generated by moving the center of mass, limb movement, and the work done to overcome aerodynamic drag, enabling the expression of mechanical power output.
where
is the speed,
is the mechanical power output,
is the work done to overcome aerodynamic drag,
is the mass of the core race walker.
The formula for overcoming the work done by aerodynamic drag is
where
is aerodynamic drag.
The metabolic power
can be expressed as:
where
is the metabolic efficiency and
when the speed is
[
31].
The sport economy
can be expressed as [
31].
In accordance with the drag coefficient calculations presented in
Section 2.3, the work done by aerodynamic drag
, the mechanical power
, the mechanical power
, and sport economy
of core race walker in different drafting formations are computed utilizing equations (7)-(10), as depicted in Table 3.
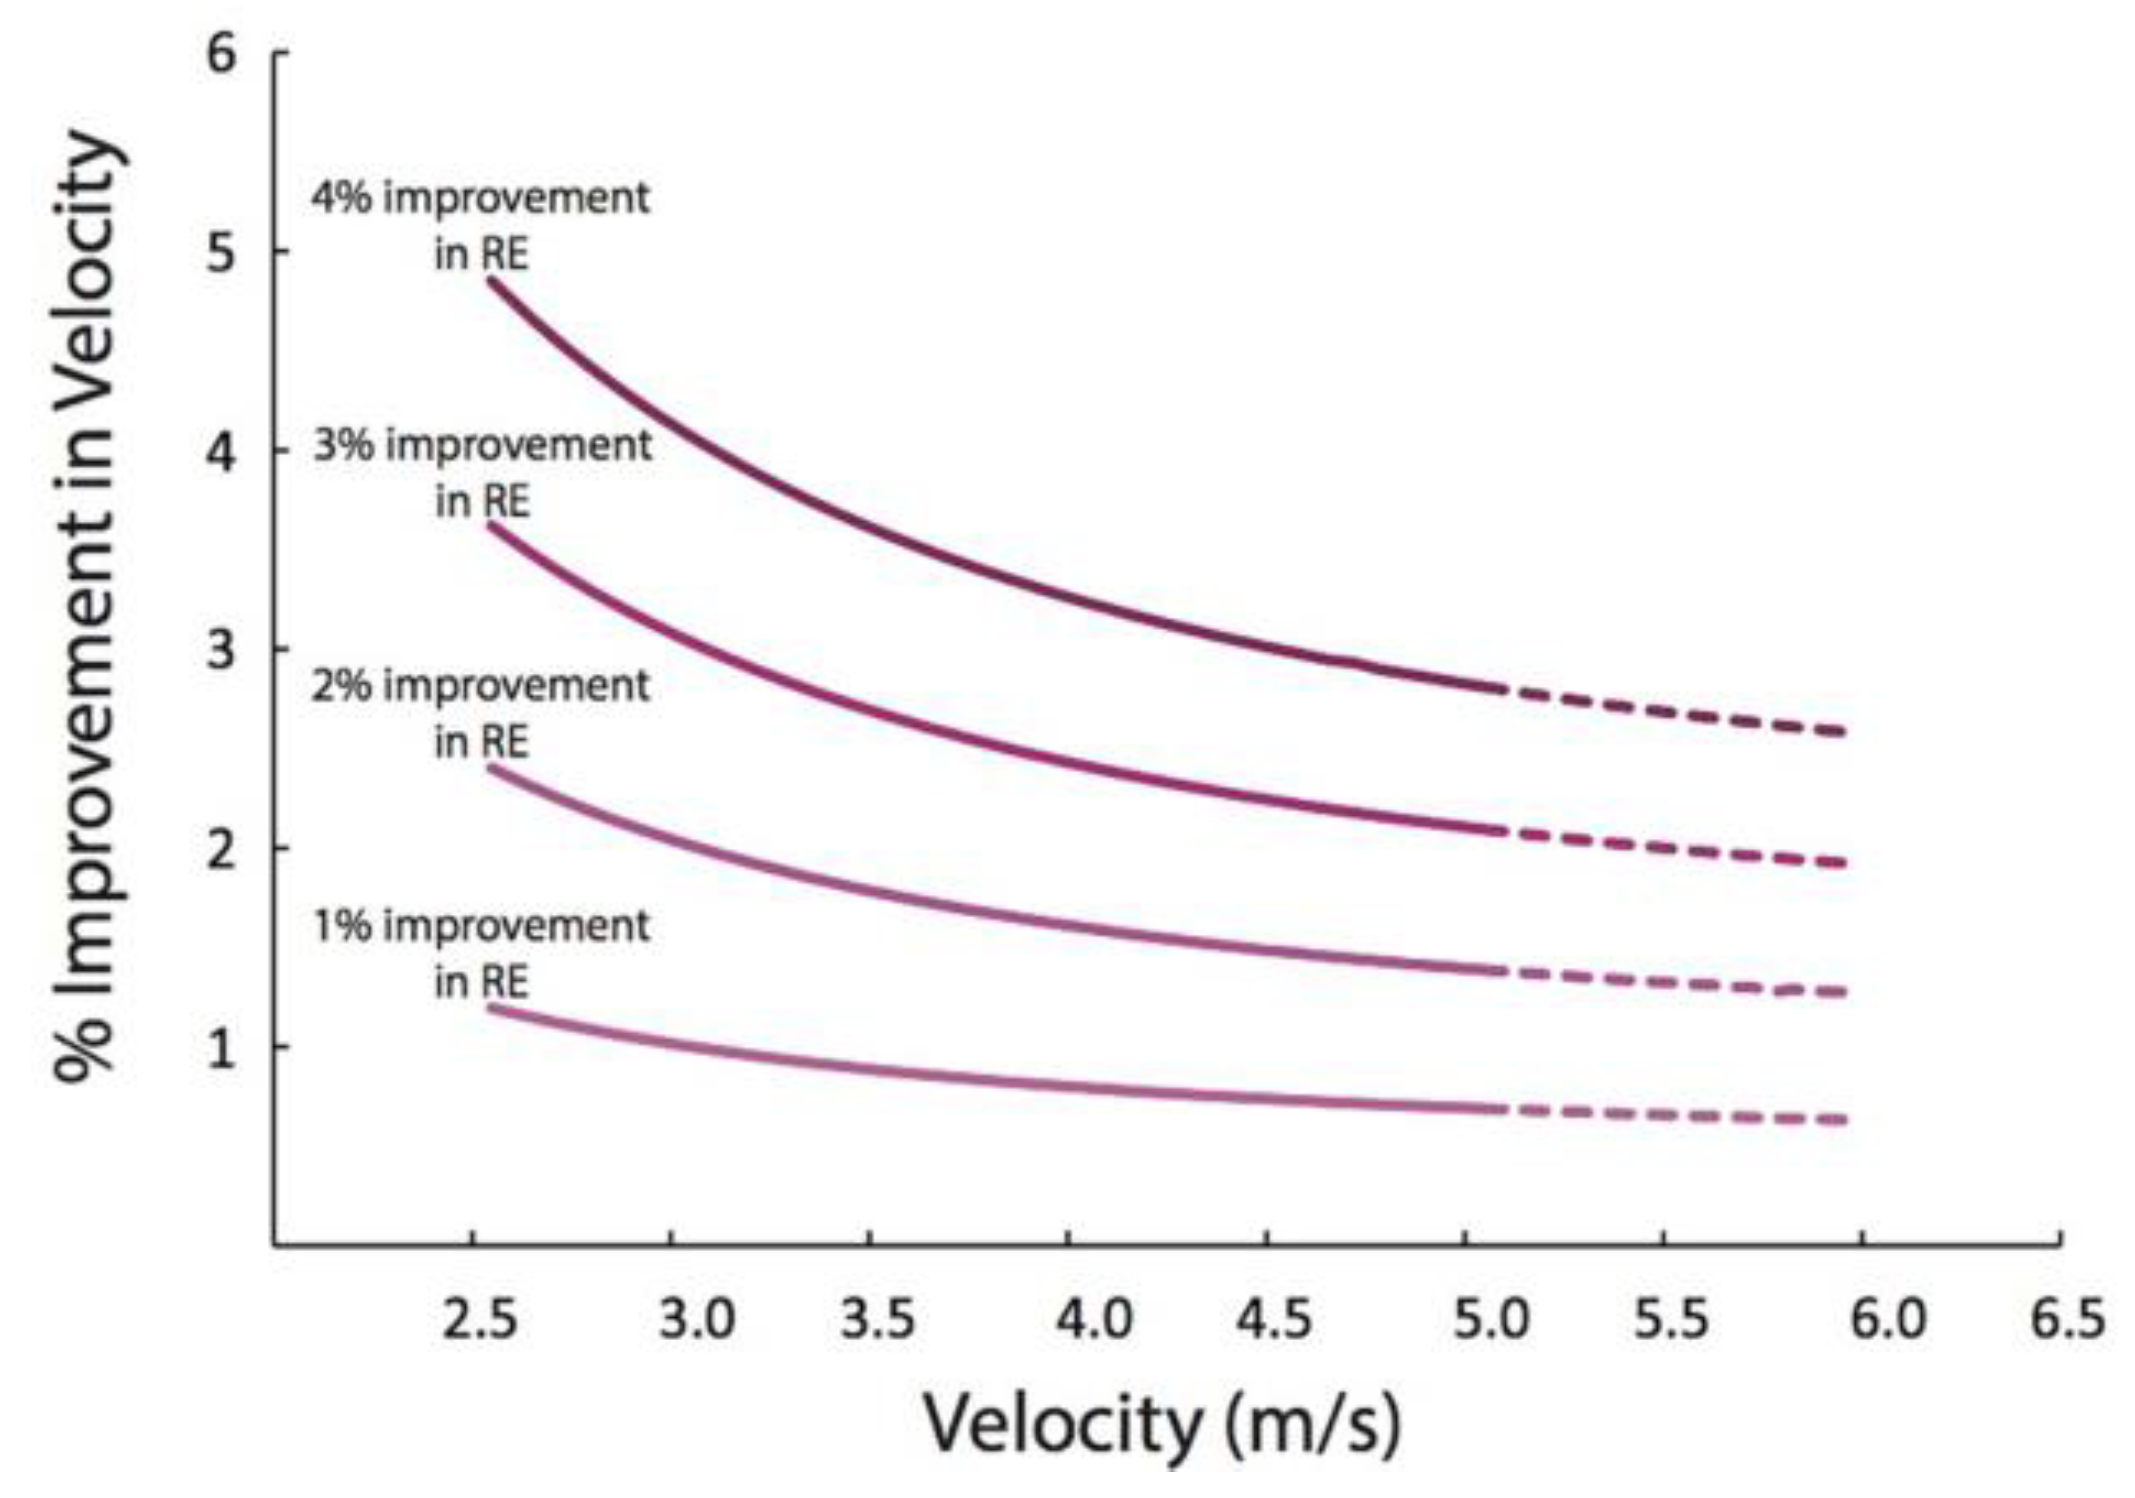
Kipp observed that in high-level racing events, speed increases with
, as shown in
Figure 13 [
31]. When
increased by 3% relative to the 2:04:00 time of the Berlin Marathon in 2015, the speed increased by 1.97%, resulting in a time of 2:01:36. This time is remarkably close to the recent world record set by Kipchoge, thus confirming the accuracy of Kipp's model.
Figure 13 indicates that at a speed of 4m/s, an increase in
by 1% corresponds to a 0.82% increase in speed. According to Table 3, the optimal double, triple, and quadruple drafting formations result in
increases of 4.4%, 4.9%, and 5.7%, respectively, compared to race walking alone. Table 4 presents the speed and performance of the core race walker in the optimal formations with different numbers of race walkers in the 20km race walking competition after improving the sports economy. Based on the
in Table 3, the core race walker's speed is increased by 3.61%, 4.03%, and 4.67% in the optimal double, triple, and quadruple drafting formations, and the performance is improved by 173.8s (3.48%), 193.5s (3.87%), and 223.3s (4.47%).
Table 2.
Aerodynamic power , mechanical power , metabolic power and sports economy of core race walker in optimal drafting formations.
Table 2.
Aerodynamic power , mechanical power , metabolic power and sports economy of core race walker in optimal drafting formations.
| Drafting formations |
|
|
|
|
|
|
|
|
| Race walking alone |
7.5 |
45 |
|
675.3 |
|
1007.9 |
16.47 |
|
| Double formation |
2.6 |
15.6 |
65% |
645.9 |
4.4% |
964.0 |
15.75 |
4.4% |
| Triple formation |
2.1 |
12.6 |
72% |
642.9 |
5.1% |
959.6 |
15.67 |
4.9% |
| Quadruple formation |
1.1 |
6.6 |
85% |
636.9 |
5.7% |
950.6 |
15.53 |
5.7% |
Table 3.
The speed and performance of core race walker in optimal drafting formations in the 20km race walking competition after improving sport economy.
Table 3.
The speed and performance of core race walker in optimal drafting formations in the 20km race walking competition after improving sport economy.
| Optimal drafting formations |
Speed after improving sport economy (m/s) |
Percentage increase in speed |
Competition time (s) |
Time difference (s) |
Percentage improvement in performance |
| Race walking alone |
4 |
|
5000 |
|
|
| Double formation |
4.144 |
3.61% |
4826.2 |
173.8 |
3.48% |
| Triple formation |
4.161 |
4.03% |
4806.5 |
193.5 |
3.87% |
| Quadruple formation |
4.187 |
4.67% |
4776.7 |
223.3 |
4.47% |
5. Conclusions
This study utilizes wind-tunnel experiment and CFD numerical simulation to investigate the drag reduction impact of different drafting formations. The main conclusions can be drawn as follows:
1) Combining the wind-tunnel and CFD results, it is found that the difference in drag between the two methods was 18% for race walking alone. A comprehensive analysis of the error reveals that the discrepancy in body shape plays a crucial role in causing the drag difference. The disparity in drag calls for the identification of a novel evaluation index to evaluate the consistency between the results obtained from CFD simulation and wind-tunnel experiments. Therefore, the drag reduction rate is further evaluated, revealing a difference of less than 10% between the two methods, which confirms the reliability of the CFD simulation results. Interestingly, it is the spacing between the race walkers, rather than the variation in body shape, is the most influential factor affecting drag reduction.
2) The drag reduction of 15 different drafting formations is evaluated using both CFD simulation and wind-tunnel experiment. Our findings indicate that the optimal drafting formations are consistent with different numbers of race walkers in both CFD and wind-tunnel experiment. The core race walker experiences drag reductions of 67%, 66%, and 81% in double, triple, and quadruple formations in wind-tunnel experiment, and 65%, 72%, and 85% in CFD simulation. The utilization of CFD analysis to investigate drafting formations in race walking reveals that drag reduction is achieved through the shielding effect of the race walkers on the oncoming flow. This effect minimizes the impact of fluid on the core race walker, resulting in a reduced pressure difference between the front and rear.
3) The effect of drag reduction on performance is analyzed by an empirical model for mechanical power output. Using a 20-km race walk as a case study, the benefits of different drafting formations with race walkers are evaluated in terms of sport economy, speed, and performance. The results indicates that, compared to race walking alone, the core race walker in the optimal double, triple, and quadruple drafting formations experienced improves sport economy of 4.4%, 4.9%, and 5.7%, increases speed by 3.61%, 4.03%, and 4.67%, and enhances performance by 173.8s (3.48%), 193.5s (3.87%), and 223.3s (4.47%).
Furthermore, race walkers share similar body shape and speed (4-6 m/s) with marathoners and middle-distance runners, resulting in a Reynolds number range of 6-8105. Within this specific Reynolds number range, the aerodynamic drag law behaves similarly. Hence, the aerodynamic drag analysis of race walking drafting formations can be applicable to drafting formations in marathon and middle-distance running as well.
However, in this study the examination of the drag reduction in 15 typical drafting formations may not comprehensively consider the influence of race walkers' spacing and body shape on drag reduction. To overcome this limitation, future research could employ CFD simulation to investigate drafting formations with different spacing and analyze how race walkers with diverse body shapes impact drag reduction. This approach would lead to a more precise understanding of the drag reduction mechanism in drafting formations and facilitate the determination of an optimal positioning strategy.
Author Contributions
Data curation, Yiming ZHANG; Formal analysis; Yiming ZHANG and Peng KE; Funding acquisition, Peng KE and Ping HONG; Methodology, Yiming ZHANG and Peng KE; Project administration, Peng KE and Ping HONG; Resources, Yiming ZHANG; Software, Yiming ZHANG and Peng KE; Supervision, Peng KE and Ping HONG; Visualization, Yiming ZHANG; Writing - original draft, Yiming ZHANG; Writing - review & editing, Yiming ZHANG, Peng KE and Ping HONG.
Funding
This research was funded by Funding for open projects of the Key Laboratory of Icing and Anti-icing, grant number IADL201904.
Institutional Review Board Statement
Not applicable.
Informed Consent Statement
Informed consent was obtained from all subjects involved in the study.
Acknowledgments
The authors would also like to express their gratitude to Professor Bo Li from Beijing Jiaotong University in China and Mr. Qi Hu from the Winter Sports Management Center of the State General Administration of Sports in China for their work and contributions in the field of wind-tunnel experiment.
Conflicts of Interest
The authors declare no conflict of interest.
References
- Beaumont, F.; Bogard, F.; Murer, S.; Polidori, G. Fighting crosswinds in cycling: A matter of aerodynamics. J. Sci. Med. Sport. 2023, 26(1), 46–51. [Google Scholar] [CrossRef]
- Blocken, B.; Toparlar, Y.; van Druenen, T.; Andrianne, T. Aerodynamic drag in cycling team time trials. J. Wind Eng. Ind. Aerodyn. 2018, 182, 128–145. [Google Scholar] [CrossRef]
- Blocken, B.; Malizia, F.; Druenen, T.V.; Gillmeier, S. Aerodynamic benefits for a cyclist by drafting behind a motorcycle. J. Sci. Med. Sport. 2020, 23(19), 1–11. [Google Scholar] [CrossRef]
- Fitton, B.; Caddy, O.; Symons, D. The impact of relative athlete characteristics on the drag reductions caused by drafting when cycling in a velodrome. Proc. Inst. Mech. Eng., Part P: J. Sports Eng. Technol. 2018, 232 (1), 39–49. [Google Scholar] [CrossRef]
- Spoelstra, A.; Sciacchitano, A.; Scarano, F.; Mahalingesh, N. On-site drag analysis of drafting cyclists. J. Wind Eng. Ind. Aerodyn. 2021, 219, 104797. [Google Scholar] [CrossRef]
- Janssen, M.; Wilson, B.D.; Toussaint, H.M. Effects of Drafting on Hydrodynamic and Metabolic Responses in Front Crawl Swimming. Med. Sci. Sports Exerc. 2009, 41(4), 837–843. [Google Scholar] [CrossRef] [PubMed]
- Silva, A.J.; Rouboa, A.; Moreira, A.; Reis, V.M.; Alves, F.; Vilas-Boas, J.P.; Marinho, D.A. Analysis of drafting effects in swimming using computational fluid dynamics. J. Sports Sci. Med. 2008, 7(1), 60–66. [Google Scholar] [PubMed]
- Rundell, K.W. Effects of drafting during short-track speed skating. Med. Sci. Sports Exerc. 1996, 28(6), 765–771. [Google Scholar] [CrossRef]
- Hext, A.; Hettinga, F.J.; McInernery, C. Tactical positioning in short-track speed skating: The utility of race-specific athlete-opponent interactions. Eur. J. Sport Sci. 2022, 22(1), 77–84. [Google Scholar] [CrossRef]
- Terra, W. , Spoelstra, A.; Sciacchitano, A. Aerodynamic benefits of drafting in speed skating: Estimates from in-field skater’s wakes and wind tunnel measurements. J. Wind Eng. Ind. Aerodyn. 2023, 233, 105329. [Google Scholar]
- van den Brandt, F.A.P.; Stoter, I.K.; Otter, R.T.A.; Elferink-Gemser, M.T. Why Train Together When Racing Is Performed Alone? Drafting in Long-Track Speed Skating. Int. J. Sports Physiol. Perform. 2021, 16, 1874–1879. [Google Scholar] [CrossRef]
- Ainegren, M.; Linnamo, V.; Lindinger, S. Effects of Aerodynamic Drag and Drafting on Propulsive Force and Oxygen Consumption in Double Poling Cross-Country Skiing. Med. Sci. Sports Exerc. 2022, 54, 1058–1065. [Google Scholar] [CrossRef] [PubMed]
- Brownlie, L. Aerodynamic drag reduction in winter sports: The quest for "free speed". Proc. Inst. Mech. Eng. P-J. Sports Eng. Technol. 2021, 235 (4), 365–404. [Google Scholar] [CrossRef]
- Beaumont, F.; Legrand, F.; Bogard, F.; Murer, S.; Vernede, V.; Polidori, G. Aerodynamic interaction between in-line runners: new insights on the drafting strategy in running. Sports Biomech. 2021, 1–16. [Google Scholar] [CrossRef] [PubMed]
- Beaumont, F.; Bogard, F.; Murer, S.; Polidori, G.; Madaci, F. , Taiar, R. How does aerodynamics influence physiological responses in middle-distance running drafting? Mathe. Modell. Eng. Probl. 2019, 6, 129–135. [Google Scholar] [CrossRef]
- Polidori, G.; Legrand, F.; Bogard, F.; Madaci, F.; Beaumont, F. Numerical investigation of the impact of Kenenisa Bekele’s cooperative drafting strategy on its running power during the 2019 Berlin marathon. J. Biomech. 2020, 107, 109854. [Google Scholar] [CrossRef]
- Schickhofer, L.; Hanson, H. Aerodynamic effects and performance improvements of running in drafting formations. J. Biomech. 2021, 122, 110457. [Google Scholar] [CrossRef] [PubMed]
- Blocken, B.; Defraeye, T.; Koninckx, E.; Carmeliet, J.; Hespel, P. CFD simulations of the aerodynamic drag of two drafting cyclists. Comput. Fluids 2018, 71, 435–445. [Google Scholar] [CrossRef]
- Zdravkovich, M.M. Effect of cyclist’s posture and vicinity of another cyclist on aerodynamic drag. Eng Sport. 1996, 1, 21–28. [Google Scholar]
- Kawamura, T.M. Wind Drag of Bicycles; Report No.1; Tokyo University, 1953. [Google Scholar]
- Barry, N.; Burton, D.; Sheridan, J.; Thompson, M.; Brown, N.A.T. Aerodynamic drag interactions between cyclists in a team pursuit. Sports Eng. 2015, 18(2), 93–103. [Google Scholar] [CrossRef]
- Hu, Q.; Li, B.; Ke, P.; Shen, M.; Hong, P. Aerodynamic Drag Reduction Effect of Drafting Formation in Race Walking Based on Wind Tunnel Tests. J. Shanghai Univ. Sport. 2022, 46(3), 62–71. [Google Scholar]
- Fluent, A. ANSYS Fluent Theory Guide, Release 2023 R1; ANSYS Inc.: Canonsburg, PA, USA, 2023. [Google Scholar]
- Anderson, J.D. Computational fluid dynamics, 2rd ed.; McGraw-Hill: NY, USA, 1995; pp. 15–51. [Google Scholar]
- Defraeye, T.; Blocken, B.; Koninckx, E.; Hespel, P.; Carmeliet, J. Computational fluid dynamics analysis of cyclist aerodynamics: Performance of different turbulence-modelling and boundary-layer modelling approaches. J. Biomech. 2010, 43(12), 2281–2287. [Google Scholar] [CrossRef] [PubMed]
- Inoue, T.; Okayama, T.; Teraoka, T.; Maeno, S.; Hirata, K. Wind-tunnel experiment on aerodynamic characteristics of a runner using a moving-belt system. Cogent Eng. 2016, 3(1), 1231389. [Google Scholar] [CrossRef]
- Walpert, R.A.; Kyle, C.R. Aerodynamics of the human body in sports. J. Biomech. 1989, 22(10), 1096. [Google Scholar] [CrossRef]
- Kyle, C.R.; Caiozzo, V.J. The effect of athletic clothing aerodynamics upon running speed. J. Med. Sci. Sports Exerc. 1986, 18(5), 509–515. [Google Scholar] [CrossRef]
- Nørstrud, H. The diverse manifestations of physical performance. In Sport Aerodynamics, 1st ed.; CISM: Udine, Italy, 2008; pp. 50–55. [Google Scholar]
- Cavagna, G.A.; Kaneko, M. Mechanical work and efficiency in level walking and running. J. Physiol. 1977, 268(2), 467–481. [Google Scholar] [CrossRef] [PubMed]
- Kipp, S.; Kram, R.; Hoogkamer, W. Extrapolating metabolic savings in running: Implications for performance predictions. Front. Physiol. 2019, 10, 79. [Google Scholar] [CrossRef]
Figure 1.
Positions of seven different double drafting formations and a race walking scene. (Red point indicates core race walker, blue points indicate auxiliary race walkers).
Figure 1.
Positions of seven different double drafting formations and a race walking scene. (Red point indicates core race walker, blue points indicate auxiliary race walkers).
Figure 2.
The model of (a) core race walker and (b) an example of drafting formation (the core race walker in the middle).
Figure 2.
The model of (a) core race walker and (b) an example of drafting formation (the core race walker in the middle).
Figure 3.
Computational domain and boundary conditions.
Figure 3.
Computational domain and boundary conditions.
Figure 4.
Race walking positions of triple and quadruple drafting formations. (Red points indicate core race walker, blue points indicate auxiliary race walkers).
Figure 4.
Race walking positions of triple and quadruple drafting formations. (Red points indicate core race walker, blue points indicate auxiliary race walkers).
Figure 5.
Comparison of drag reduction rate of the core race walker in 15 drafting formations between wind-tunnel experiment and CFD simulation, (a) race walking in double drafting formation, (b) race walking in triple and quadruple drafting formation.
Figure 5.
Comparison of drag reduction rate of the core race walker in 15 drafting formations between wind-tunnel experiment and CFD simulation, (a) race walking in double drafting formation, (b) race walking in triple and quadruple drafting formation.
Figure 6.
Wind-tunnel experiment and CFD simulation fitting result of drag reduction rate of core race walker while race walking in 15 drafting formations (Error line 10%).
Figure 6.
Wind-tunnel experiment and CFD simulation fitting result of drag reduction rate of core race walker while race walking in 15 drafting formations (Error line 10%).
Figure 7.
Pressure coefficient of race walking in optimal drafting formations, (a) race walking alone, (b) race walking in optimal double formation, (c) race walking in optimal triple formation, and (d) race walking in optimal quadruple formation.
Figure 7.
Pressure coefficient of race walking in optimal drafting formations, (a) race walking alone, (b) race walking in optimal double formation, (c) race walking in optimal triple formation, and (d) race walking in optimal quadruple formation.
Figure 8.
Pressure coefficient of race walking in optimal drafting formations, (a) race walking alone, (b) race walking in optimal double formation, (c) race walking in optimal triple formation, and (d) race walking in optimal quadruple formation.
Figure 8.
Pressure coefficient of race walking in optimal drafting formations, (a) race walking alone, (b) race walking in optimal double formation, (c) race walking in optimal triple formation, and (d) race walking in optimal quadruple formation.
Figure 9.
Speed contour of race walking in optimal drafting formations, (a) race walking alone, (b) race walking in optimal double formation, (c) race walking in optimal triple formation, and (d) race walking in optimal quadruple formation.
Figure 9.
Speed contour of race walking in optimal drafting formations, (a) race walking alone, (b) race walking in optimal double formation, (c) race walking in optimal triple formation, and (d) race walking in optimal quadruple formation.
Figure 10.
Streamline of race walking in optimal drafting formations, (a) race walking alone, (b) race walking in optimal double formation, (c) race walking in optimal triple formation, and (d) race walking in optimal quadruple formation.
Figure 10.
Streamline of race walking in optimal drafting formations, (a) race walking alone, (b) race walking in optimal double formation, (c) race walking in optimal triple formation, and (d) race walking in optimal quadruple formation.
Figure 11.
Velocity vector diagram of 0.2m in front of the core race walker, (a) race walking alone, (b) race walking in optimal double formation, (c) race walking in optimal triple formation, and (d) race walking in optimal quadruple formation.
Figure 11.
Velocity vector diagram of 0.2m in front of the core race walker, (a) race walking alone, (b) race walking in optimal double formation, (c) race walking in optimal triple formation, and (d) race walking in optimal quadruple formation.
Figure 12.
Speed contour of 0.1m behind the core race walker of race walking in optimal drafting formations, (a) race walking alone, (b) race walking in optimal double formation, (c) race walking in optimal triple formation, and (d) race walking in optimal quadruple formation.
Figure 12.
Speed contour of 0.1m behind the core race walker of race walking in optimal drafting formations, (a) race walking alone, (b) race walking in optimal double formation, (c) race walking in optimal triple formation, and (d) race walking in optimal quadruple formation.
Figure 13.
Percentage increase in operating speed after the improvement of operating economy [
31].
Figure 13.
Percentage increase in operating speed after the improvement of operating economy [
31].
Table 1.
Comparison of drag coefficient in various track and field events.
Table 1.
Comparison of drag coefficient in various track and field events.
| Author |
Activities |
Method |
Speed(m/s) |
drag coefficient |
Relative error |
| This study |
Race walking |
CFD |
6 |
0.70 |
Calculation basis |
| Hu et al. [22] |
Race walking |
Wind-tunnel |
6 |
0.83 |
18% |
| Schickhofer et al. [17] |
Running |
CFD |
5.83 |
0.68 |
-3% |
| Polidori et al. [16] |
Running |
CFD |
5.75 |
0.81 |
15% |
| Walpert and Kyle [27] |
Running |
Wind-tunnel |
4.5-13 |
0.64-0.79 |
-8%-13% |
|
Disclaimer/Publisher’s Note: The statements, opinions and data contained in all publications are solely those of the individual author(s) and contributor(s) and not of MDPI and/or the editor(s). MDPI and/or the editor(s) disclaim responsibility for any injury to people or property resulting from any ideas, methods, instructions or products referred to in the content. |
© 2023 by the authors. Licensee MDPI, Basel, Switzerland. This article is an open access article distributed under the terms and conditions of the Creative Commons Attribution (CC BY) license (http://creativecommons.org/licenses/by/4.0/).
