
Submitted:
25 June 2023
Posted:
26 June 2023
You are already at the latest version
Abstract
Identification of the honey bee (Apis mellifera) subspecies is an important aspect of bee breeding and biodiversity conservation. The identification can be based on molecular or morphological markers. For some markers, including the cytochrome c oxidase subunit, there is a well-established methodology allowing consistent subspecies identification in different laboratories. In the case of morphological markers, identification is hindered by a lack of reference data and a standardized methodology to reuse it. We show here that reference data for the identification of honey bees based on geometric morphometrics can be saved in an XML file. The information in this file can be easily extracted by other users for the identification of unknown samples. We illustrate this procedure using ten samples from north India. The samples were identified as A. mellifera; next, they were identified as lineage C; and finally, most of the samples had high similarity to honey bees from Croatia and Slovenia. We explained what data is required for such identification and how it can be reused. The method described here can be applied not only to honey bee wings but also to all data based on landmark coordinates.
Keywords:
Honey bee
; identification
; wings
; geometric morphometrics
; XML
1. Introduction
Identifying honey bee (Apis mellifera) subspecies is crucial for the conservation of their diversity and breeding. It can be achieved using various methods based on molecular markers, including mitochondrial cytochrome c oxidase (COI) subunits [1,2], microsatellites [3,4] and single nuclear polymorphism (SNP) [5,6] for review, see Meixner et al. [7]. Identification of subspecies based on COI is well documented, a detailed protocol is available for the users, and a small sample size can provide efficient results [8]. This method can be used for the identification of lineages, but in the case of detection of hybrids, it is not effective. Molecular identification based on microsatellites can be used for the identification of subspecies; however, in this case, the availability of reference material can be a limiting factor. The SNP reference sequences are available for many subspecies. However, this method is more expensive, time-consuming, requires sophisticated equipment, and involves more cumbersome storage of samples [7]. Due to the drawbacks of molecular markers, beekeepers and honey bee breeders often prefer identification based on morphological markers [9].
Insect wings are often used for the morphometric identification because they are flat and easy to measure. In earlier studies, the identification of honey bees was based on the cubital index, which is a single number representing the proportion of two distances along the wing veins [10], making it easy to report and compare. For example, in A. m. carnica, the cubital index is higher than in A. m. mellifera [11]. On the other hand, identification based on a single variable can be inaccurate [12]; therefore, nowadays, identification of honey bees is usually based on a larger number of variables. The first multivariate identification of honey bees, based on 13 angles and two distances, was introduced by DuPraw [13,14]. A similar methodology was used later in standard morphometry [10]. Currently, the identification is often based on the coordinates of landmarks within a methodological approach called “geometric morphometrics” [15]. It proved to be an effective, fast, and easily accessible method to differentiate honey bee species and subspecies [16,17,18,19]. Using multiple variables improved the accuracy of the identification; however, it is more difficult to report the results and reuse them. For all identified subspecies and all variables, it is important to provide averages along with measures of variation. Moreover, classification functions or other identification data should also be provided to aid in identifying unknown samples. Unfortunately, such data were provided only in some of the earlier studies [13,14], but they were incomplete in the contribution by Ruttner [20], which covered the global diversity of honey bees. Later, the classification data were provided only in some studies [16,17,19,21,22]. In most of those studies, the measurements were analyzed using linear discriminant analysis (LDA); however, various other statistical methods are available, including the naive Bayes classifier and an artificial neural network [23].
In India, the western honey bee, A. mellifera, is a non-native species. It was introduced to this country in the 1960s in Himachal Pradesh, which is a neighboring state of Jammu and Kashmir [24,25,26,27]. Since then, it has been used in commercial apiculture. Both Italy and the USA are considered to be the places of origin of bees imported to India [28]. In Jammu and Kashmir, the western honey bee was introduced in 1984–85 [29]. Currently, it is an important region for beekeeping in India [30].
In this study, we demonstrate how previously published data about wing measurements can be used to identify the origin of an unknown sample. For identification, we have used a sample of western honey bees from northern India. First, the sample was classified as Apis mellifera using data provided by Bustamante et al. [16]. Next, it was classified as evolutionary lineage C using data provided by Nawrocka et al. [21]. Finally, the sample was classified as originating from Croatia and Slovenia using data provided by Oleksa et al. [31]. We explain what data are required for such identification and how they can be analyzed.
2. Materials and Methods
2.1. Sampling
Honey bee samples were collected from the union territory of Jammu and Kashmir in northern India (Table 1, Figure 1). There were 175 workers, representing 10 locations. Both the left and right wings were measured. In total, 350 wings were measured.
The worker bees were preserved in ethanol. The forewings were carefully detached at their base, mounted between two clean microscope slides, and their images acquired using a USB camera equipped with a 25-mm lens (FL-CC2514-2M, Ricoh). The images had a resolution of 94488 pixels per meter. Nineteen landmark coordinates were digitized on each wing using the IdentiFly software [21]. The position of the landmarks is the same as in Nawrocka et al. [21] and Oleksa et al. [32]. The dataset used in this study, including forewing images, landmark coordinates, geographic coordinates of sampling locations, and other data, is available on the Zenodo website [33].
All analyses were conducted in R (v. 4.0.3) [34] using RStudio (v. 2022.12.0). The whole statistical analysis is available as an R script (Supplementary document S1). Classification into species, lineages, and regions was based on LDA which is also referred to as canonical variate analysis (CVA). The process of classifying an unknown sample involves two major steps: (1) preparation of classification data and (2) application of this data to an unknown wing.
2.2. Classification Data
In this study, the classification was based on the LDA of landmark coordinates, and the classification data consisted of: reference configuration (mean of all landmark configurations), mean configurations for all classes (groups), variance-covariance matrices for all classes, and classification coefficients.
In the case of classification to species from the genus Apis, we have used data provided by Bustamente et al. [16]. The classification data were obtained from supplementary files: ESM1, ESM2, and ESM3 [16]. The data were converted to XML format and saved as the file “apis-species.dw.xml” (Supplementary document S2).
In the case of classification to evolutionary lineages and geographic regions, the classification data were calculated from raw landmark coordinates provided by Nawrocka et al. [21] and Oleksa et al. [32], respectively. They consist of x and y coordinates of 19 landmarks, which gives 38 columns (or variables). Each row was labeled with a class identifier.
The preparation of identification data was implemented in the “GM.data2XML” function, which takes two arguments: the coordinates of landmarks and class labels. In the first step, the landmark configurations were aligned using generalized Procrustes analysis in the geomorph package [35]. The aligned coordinates were averaged in order to obtain the reference configuration and mean configuration for each class. At this stage, the LDA could be applied; however, the aligned coordinates contain redundant information because, after Procrustes alignment, the degrees of freedom are reduced by four. The covariance matrices obtained from aligned coordinates are singular, which complicates the process of matrix inversion. In order to remove this problem, we used principal component analysis (PCA) and removed the last four principal components from the analysis. The obtained principal components were not correlated with each other, which improved the predictive power of LDA, calculated using package MASS [36]. Because we used both PCA and LDA, the classification coefficients were calculated by matrix multiplication of the principal coefficients by the discriminant coefficients. Finally, the linear discriminant scores obtained from LDA were used to obtain variance-covariance matrices for all classes. The identification data calculated in this way was encoded in two XML files: “apis-mellifera-lineage.dw.xml” (Supplementary document S3) and “apis-mellifera-lineage-c-regions.dw.xml” (Supplementary document S4), which correspond to identification of four honey bee lineages and five geographic regions, respectively.
2.3. Classification of Unknown Data
The classification data and the unknown data should have the same number of landmarks that are homologues to each other. In the case of the data provided by Bustamente et al. [16] order of the landmarks was different than in our data; therefore, they were reordered.
The unknown data can consist of a single wing, but the results are more precise when it is an average of a larger number of wings. If both the left and right wings were measured, they could be averaged to represent one individual. Often, classification is based on 10–20 workers averaged within one colony or one location. Before averaging, the landmark configurations have to be aligned with each other.
The classification can be easily achieved using the function “XML2id”, which takes three arguments: the name of the XML file with classification data, the coordinates of the landmarks, and an optional “average” argument indicating if the input data should be averaged before analysis. Inside the function, the input data was aligned with the reference configuration using ordinary Procrustes analysis in the shapes package [37]. The aligned input data was multiplied by classification coefficients in order to obtain linear discriminant scores, which were compared with the means and variance-covariance matrices of all classes. The comparison was based on the squared Mahalanobis distance (MD) between the unknown sample and each of the classes. We assume that the input data belongs to the class with the smallest Mahalanobis distance. Apart from the MD, there were also calculated probabilities that the input data belonged to each of the classes.
3. Results
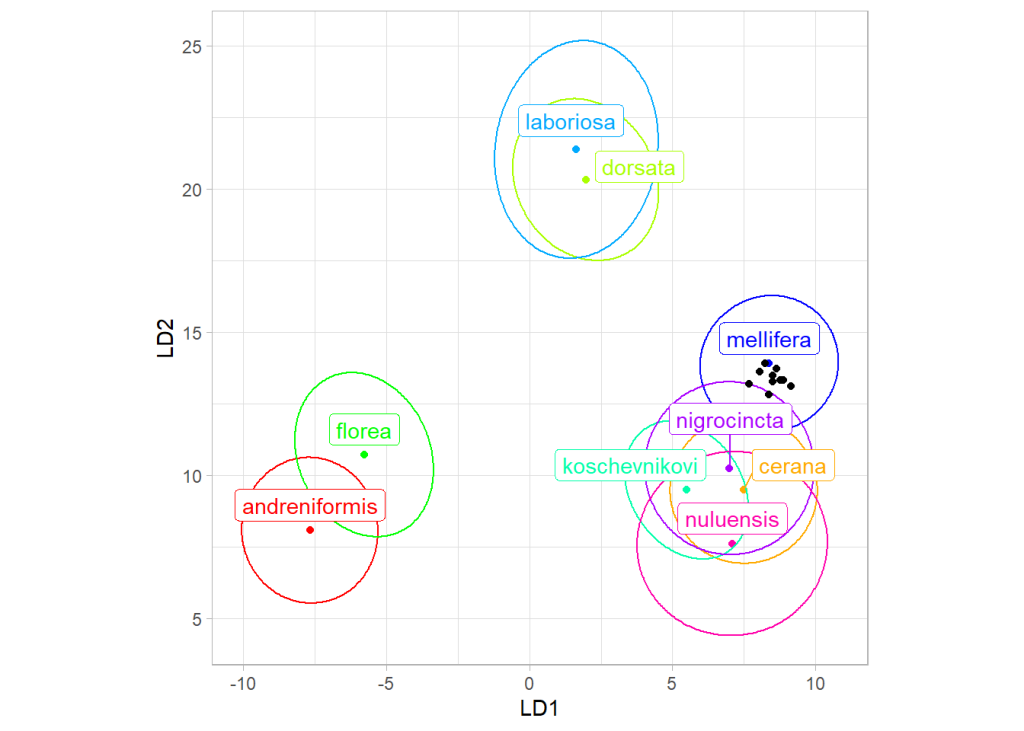
Principal component analysis revealed that both workers and samples from India formed a single cluster of points (Supplementary document S1). Using data provided by Bustamente et al. [16], all workers and samples were classified as Apis mellifera (Figure 2). The classification probabilities were high (Supplementary document S1), which confirms that the collected material represented A. mellifera and not A. cerana, which is present in the study area.
Using data provided by Nawrocka et al. [21], the average of all samples from India was classified as the evolutionary lineage C with a probability of 4.83 × 10⁻³ (Table 2). When the same classification was based on samples, nine of them were classified as lineage C, and one was classified as lineage A (Figure 3). In the case of some samples, the classification probabilities were relatively low (Table 3).
Using data provided by Oleksa et al. [32] and Nawrocka et al. [21], the average of all samples from India was classified as Croatia and Slovenia with a probability of 6.93 × 10⁻² (Table 4). When the same classification was based on samples, seven of them were classified as Croatia and Slovenia; two sample was classified as Romania and Moldova, and one sample was classified as Greece (Table 5, Figure 4).
4. Discussion
The results presented here indicate that the western honey bees (A. mellifera) from India belong to lineage C (Figure 3), which naturally occurs in south-eastern Europe. Among countries in this region, the highest similarity was found for bees from Croatia and Slovenia (Figure 4). It was earlier reported that A. mellifera was introduced to India from Italy and the USA [27]. Unexpectedly, the analyzed samples here differed markedly from A. m. ligustica from Italy. In comparison to other countries, the similarity to Italy was the lowest (Table 4, Figure 4). The reference sample of A. m. ligustica is relatively small, and it unexpectedly differed from all other regions from lineage C. In order to conclude that the honey bees from India do not originate from Italy, there is a need for larger and more representative reference samples from this country.
It cannot be excluded that the analyzed sample had ancestors from the USA, where numerous honey bees subspecies were introduced at various times [38]. A. m. ligustica, and A. m. carnica (both from lineage C) were introduced to the USA in the 1870s and 1880s from north Italy and Croatia, respectively [38]. Current honey bee population in the USA primarily exhibits the genetic characteristics of those two subspecies [38]. Therefore, there is a possibility that the investigated honey bees originated in America; however, we do not have reference samples to verify this. It is also possible that the bees introduced to India originated from more than one geographic region. Because they could hybridize with each other, it is difficult to reconstruct their origin using morphological data. Analysis based on molecular markers could be more conclusive.
4.1. Probability of Classification
It is often assumed that the classification model includes all possible groups. Such an approach was used, among others, by Bustamante et al. [39]. In that approach, the success of classification is presented as a percent, calculated by adding the probabilities of classification for all groups and finding what percent of this probability corresponds to the group with the highest probability. In this approach, the classification probability is often large and close to 100%. This is the case even if the similarity between the unknown sample and the focal group is relatively low. This problem was recognized to some degree in the web application for the identification of Apis species [16], in which results can be accompanied by a warning that “shape is abnormal”. This can happen when the measured wing was obtained from a different genus, for example, Bombus.
The use of percentages or proportions in identification results was called the restricted approach to classification [40]. It was argued that it is better to use an unrestricted method in which there is a provided probability of classification for all identified groups. [40]. In most realistic scenarios, the reference data used for classification represents only part of the variation. For example, in the case of honey bee subspecies classification, often some geographic regions can be unrepresented, but bees from this region can be used as an unknown sample. We should attempt to detect such situations. The unrestricted method of classification of honey bee subspecies was used in Nawrocka et al. [21] and in this study.
The interpretation of the results should not be limited to obtaining the most probable group. It should be verified what the probabilities of classification are for all groups. In particular, the two largest probabilities should be compared. In the case of classification into lineages, the largest probability value (4.83 × 10⁻³) was relatively low; however, the next largest value (2.05 × 10⁻⁸) was much smaller. The largest probability was relatively low because the reference sample of lineage C consists of only 37 colonies [21] and does not adequately cover the natural variation. In this situation, many samples within the range of lineage C will be relatively dissimilar to the reference sample. In the case of classification into species, the sample size of A. mellifera was 615 colonies [16] and in the case of classification into regions in lineage C, the sample size of regions Croatia and Slovenia was 181 colonies [32]. Those reference samples are more representative, and the largest classification probabilities corresponding to them are larger.
Sample 3 was classified as lineage A; however, it was classified as originating from Greece. This can be considered inconsistent because Greece is within the range of lineage C. The classification into regions can be interpreted as more reliable because it is based on a large reference sample. It can be suspected that this inconsistency is related to an inadequate sample size in lineage classification.
4.2. Providing Identification Data
In this study, we show how to produce classification data and provide it to others in a format that is easy to reuse. The classification data were saved in an XML files, which are readable by various software. XML is widely used in various operating systems and is supported by many libraries. Among others, it can be read by R and IdentiFly software [21]. We provide an R script with functions that can be used to create new classification data, read it, and reuse it for the identification of unknown samples. Although R software is freely available, some users find it difficult to use because it is based on scripts in text format. Those who prefer a graphical user interface can open the XML file in the IdentiFly software and use it there for identification. In the latter case, the user needs to determine landmarks on wing images that are saved in one directory. Next, the classification file with the extension “.dw.xml” should be chosen using the option “Set classification” in the menu “Classification”, and finally, the option “Classify directory” should be used from the same menu. The results of the classification will be provided in the new window. More advanced users can open XML files in a text editor or spreadsheet for inspection and modification.
4.2. Providing Raw Data
It is possible to identify an unknown sample using summary statistics, including reference configuration, class means, variance-covariance matrices, and classification coefficients; however, it is even better to provide all raw data. This allows to use different statistical identification models, which can be more adequate [23]. Moreover, different studies used different configurations of landmarks [for example in 16,21]. When wing images are provided, they can be reanalyzed, and additional landmarks can be determined. We demonstrate here how useful the raw data are. The reuse of datasets from earlier studies allowed us to compare our sample with a much larger reference. We provide both wing images and landmark coordinates, which were newly obtained in this study [33].
5. Conclusions
When classifying unknown samples, it is better to use an unrestricted rather than a restricted approach to calculate the probability of classification. In order to obtain those probabilities based on LDA of landmark coordinates, the following data is required: reference configuration, mean configurations for all classes, classification coefficients, and variance-covariance matrices for all classes. We provide an R script that can be used to produce the classification data, save it in an XML file, and reuse it in another analysis. The method described here can be applied not only to honey bee wings but also to all data based on landmark coordinates.
Supplementary Materials
The following supporting information can be downloaded at the website of this paper posted on Preprints.org. Document S1: R Markdown document with details of statistical analysis; Document S2: XML file with classification data allowing identification of nine species from genus Apis; Document S3: XML file with classification data allowing identification of four honey bee lineages; Document S4: XML file with classification data allowing identification of honey bees from five geographic regions in south-eastern Europe.
Author Contributions
“Conceptualization, A.T.; data acquisition, S.A.G. and H.K.; statistical analysis, A.T.; writing—original draft preparation, H.K.; writing—review and editing, H.K., S.A.G. and A.T.; funding acquisition, A.T. All authors have read and agreed to the published version of the manuscript.
Funding
This research was funded by National Science Centre, Poland, grant number 2021/41/B/NZ9/03153.
Data Availability Statement
The dataset from India, including the wing images, landmark coordinates, and geographic coordinates of sampling locations, is openly available in Zenodo at [https://doi.org/10.5281/zenodo.8071014].
Acknowledgments
The authors gratefully acknowledge the Principal investigator IDP NAHEP- SKUAST-Kashmir for his valuable guidance, support, encouragement and sanctioning of overseas training. We are also grateful to the beekeepers for providing honey bee samples for the study.
Conflicts of Interest
The authors declare no conflict of interest.
References
- Cornuet, J.M.; Garnery, L.; Solignac, M. Putative Origin and Function of the Intergenic Region between COI and COII of Apis Mellifera L. Mitochondrial DNA. Genetics 1991, 128, 393–403. [Google Scholar] [CrossRef]
- Magnus, R.M.; Tripodi, A.D.; Szalanski, A.L. Mitochondrial DNA Diversity of Honey Bees, Apis Mellifera L. (Hymenoptera: Apidae) from Queen Breeders in the United States. J. Apic. Sci. 2011, 55, 37–46. [Google Scholar]
- De la Rúa, P.; Galián, J.; Serrano, J.; Moritz, R.F.A. Genetic Structure of Balearic Honeybee Populations Based on Microsatellite Polymorphism. Genet. Sel. Evol. GSE 2003, 35, 339–350. [Google Scholar] [CrossRef] [PubMed]
- Rahimi, A.; Kahrizi, D.; Mirmoayedi, A.; Zarei, L.; Jamali, S. Genetic Characterizations of the Iranian Honey Bee (Apis Mellifera Meda Skorikov 1929) Populations Using the Microsatellite DNA Markers. Biochem. Genet. 2023. [Google Scholar] [CrossRef] [PubMed]
- Chapman, N.C.; Harpur, B.A.; Lim, J.; Rinderer, T.E.; Allsopp, M.H.; Zayed, A.; Oldroyd, B.P. A SNP Test to Identify Africanized Honeybees via Proportion of ‘African’ Ancestry. Mol. Ecol. Resour. 2015, 15, 1346–1355. [Google Scholar] [CrossRef]
- Parejo, M.; Henriques, D.; Pinto, M.A.; Soland-Reckeweg, G.; Neuditschko, M. Empirical Comparison of Microsatellite and SNP Markers to Estimate Introgression in Apis Mellifera Mellifera. J. Apic. Res. 2018, 57, 504–506. [Google Scholar] [CrossRef]
- Meixner, M.D.; Pinto, M.A.; Bouga, M.; Kryger, P.; Ivanova, E.; Fuchs, S. Standard Methods for Characterising Subspecies and Ecotypes of Apis Mellifera. J. Apic. Res. 2013, 52, 1–28. [Google Scholar] [CrossRef]
- Evans, J.D.; Schwarz, R.S.; Chen, Y.P.; Budge, G.; Cornman, R.S.; Rua, P.D. la; Miranda, J.R. de; Foret, S.; Foster, L.; Gauthier, L.; et al. Standard Methods for Molecular Research in Apis Mellifera. J. Apic. Res. 2013, 52, 1–54. [Google Scholar] [CrossRef]
- Ruttner, F. Breeding Techniques and Selection for Breeding of the Honeybee.; British Isles Bee Breeders’ Association, 1988.
- Ruttner, F.; Tassencourt, L.; Louveaux, J. Biometrical-Statistical Analysis of the Geographic Variability of Apis Mellifera L. Apidologie 1978, 9, 363–381. [Google Scholar] [CrossRef]
- Maul, V.; Hähnle, A. Morphometric Studies with Pure Bred Stock of Apis Mellifera Carnica Pollmann from Hessen. Apidologie 1994, 25, 119–132. [Google Scholar] [CrossRef]
- Ruttner, F. Biometrical Control of Breeding. J. Apic. Res. 1991, 30, 113–115. [Google Scholar]
- DuPraw, E.J. The Recognition and Handling of Honeybee Specimens in Non-Linnean Taxonomy. J. Apic. Res. 1965, 4, 71–84. [Google Scholar] [CrossRef]
- DuPraw, E.J. Non-Linnean Taxonomy and the Systematics of Honeybees. Syst. Zool. 1965, 14, 1–24. [Google Scholar]
- Bookstein, F.L. Morphometric Tools for Landmark Data: Geometry and Biology; Cambridge University Press, 1991; ISBN 978-0-521-58598-9.
- Bustamante, T.; Fuchs, S.; Grünewald, B.; Ellis, J.D. A Geometric Morphometric Method and Web Application for Identifying Honey Bee Species (Apis Spp.) Using Only Forewings. Apidologie 2021, 52, 697–706. [Google Scholar] [CrossRef]
- Francoy, T.M.; Wittmann, D.; Drauschke, M.; Müller, S.; Steinhage, V.; Bezerra-Laure, M.A.; De Jong, D.; Gonçalves, L.S. Identification of Africanized Honey Bees through Wing Morphometrics: Two Fast and Efficient Procedures. Apidologie 2008, 39, 488–494. [Google Scholar] [CrossRef]
- Rodrigues, P.J.; Gomes, W.; Pinto, M.A. DeepWings©: Automatic Wing Geometric Morphometrics Classification of Honey Bee (Apis Mellifera) Subspecies Using Deep Learning for Detecting Landmarks. Big Data Cogn. Comput. 2022, 6, 70. [Google Scholar] [CrossRef]
- Tofilski, A. Using Geometric Morphometrics and Standard Morphometry to Discriminate Three Honeybee Subspecies. Apidologie 2008, 39, 558–563. [Google Scholar] [CrossRef]
- Ruttner, F. Biogeography and Taxonomy of Honeybees; Springer: Berlin, 1988. [Google Scholar]
- Nawrocka, A.; Kandemir, İ.; Fuchs, S.; Tofilski, A. Computer Software for Identification of Honey Bee Subspecies and Evolutionary Lineages. Apidologie 2018, 49, 172–184. [Google Scholar] [CrossRef]
- Rinderer, T.E.; Buco, S.M.; Rubink, W.L.; Daly, H.V.; Stelzer, J.A.; Riggio, R.M.; Baptista, F.C. Morphometric Identification of Africanized and European Honey Bees Using Large Reference Populations. Apidologie 1993, 24, 569–585. [Google Scholar] [CrossRef]
- Silva, F.L. da; Grassi Sella, M.L.; Francoy, T.M.; Costa, A.H.R. Evaluating Classification and Feature Selection Techniques for Honeybee Subspecies Identification Using Wing Images. Comput. Electron. Agric. 2015, 114, 68–77. [Google Scholar] [CrossRef]
- Atwal, A.S.; Goyal, N.P. Introduction of Apis Mellifera in Punjab Plains. Indian Bee J 1973, 35, 1–9. [Google Scholar]
- Goyal, N.P. Introduction of Apis Mellifera in India: Background and Present Status. Indian Bee J. 1990, 52, 57–59. [Google Scholar]
- Rao, G.M.; Rao, K.S.; Chaudhary, O.P. Introduction of Apis Mellifera in India. Khadi Gramodyog 1993, 34, 815–819. [Google Scholar]
- Rahman, A. Apiculture in India; Directorate of Knowledge Management in Agriculture, Indian Council of Agricultural Research, 2017.
- Ibrahim, M.M.; Chandel, Y.; Anil, A. Morphometrics of Apis Mellifera after Five Decades of Its Introduction in North-Western Himalayan Region of India. Pak. J. Zool. 2017, 49, 1397–1403. [Google Scholar] [CrossRef]
- Abrol, D.P. Introduction of Apis Mellifera in Jammu and Kashmir: Present Status and Future Prospects. Bee World 2004, 85, 37–40. [Google Scholar] [CrossRef]
- Goyal, N.P. Apis Cerana Indica and Apis Mellifera as Complementary to Each Other for the Development Of Apiculture. Bee World 1974, 55, 98–101. [Google Scholar] [CrossRef]
- Oleksa, A.; Căuia, E.; Siceanu, A.; Puškadija, Z.; Kovačić, M.; Pinto, M.A.; Rodrigues, P.J.; Hatjina, F.; Charistos, L.; Bouga, M.; et al. Collection of Wing Images for Conservation of Honey Bees (Apis Mellifera) Biodiversity in Europe. Zenodo 2022. [Google Scholar] [CrossRef]
- Oleksa, A.; Căuia, E.; Siceanu, A.; Puškadija, Z.; Kovačić, M.; Pinto, M.A.; Rodrigues, P.J.; Hatjina, F.; Charistos, L.; Bouga, M.; et al. Honey Bee (Apis Mellifera) Wing Images: A Tool for Identification and Conservation. GigaScience 2023, 12, giad019. [Google Scholar] [CrossRef] [PubMed]
- Kaur, H.; Ganie, S.A.; Tofilski, A. Fore Wings of Honey Bee (Apis Mellifera) from Jammu and Kashmir, India. Zenodo 2023. [Google Scholar] [CrossRef]
- R Core Team R: A Language and Environment for Statistical Computing; R Foundation for Statistical Computing: Vienna, Austria, 2018.
- Baken, E.K.; Collyer, M.L.; Kaliontzopoulou, A.; Adams, D.C. Geomorph v4.0 and GmShiny: Enhanced Analytics and a New Graphical Interface for a Comprehensive Morphometric Experience. Methods Ecol. Evol. 2021, 12, 2355–2363. [Google Scholar] [CrossRef]
- Venables, W.N.; Ripley, B.D. Modern Applied Statistics with S; Fourth.; Springer: New York, 2002. [Google Scholar]
- Dryden, I.L. Shapes Package; R Foundation for Statistical Computing: Vienna, Austria, 2021. [Google Scholar]
- Carpenter, M.H.; Harpur, B.A. Genetic Past, Present, and Future of the Honey Bee (Apis Mellifera) in the United States of America. Apidologie 2021, 52, 63–79. [Google Scholar] [CrossRef]
- Bustamante, T.; Fuchs, S.; Grünewald, B.; Ellis, J.D. A Geometric Morphometric Method and Web Application for Identifying Honey Bee Species (Apis Spp.) Using Only Forewings. Apidologie 2021, 52, 697–706. [Google Scholar] [CrossRef]
- Albrecht, G.H. Assessing the Affinities of Fossils Using Canonical Variates and Generalized Distances. Hum. Evol. 1992, 7, 49–69. [Google Scholar] [CrossRef]
Figure 1.
Map of India with the study area enlarged in an inset. Sampling sites are indicated with black circles.
Figure 1.
Map of India with the study area enlarged in an inset. Sampling sites are indicated with black circles.
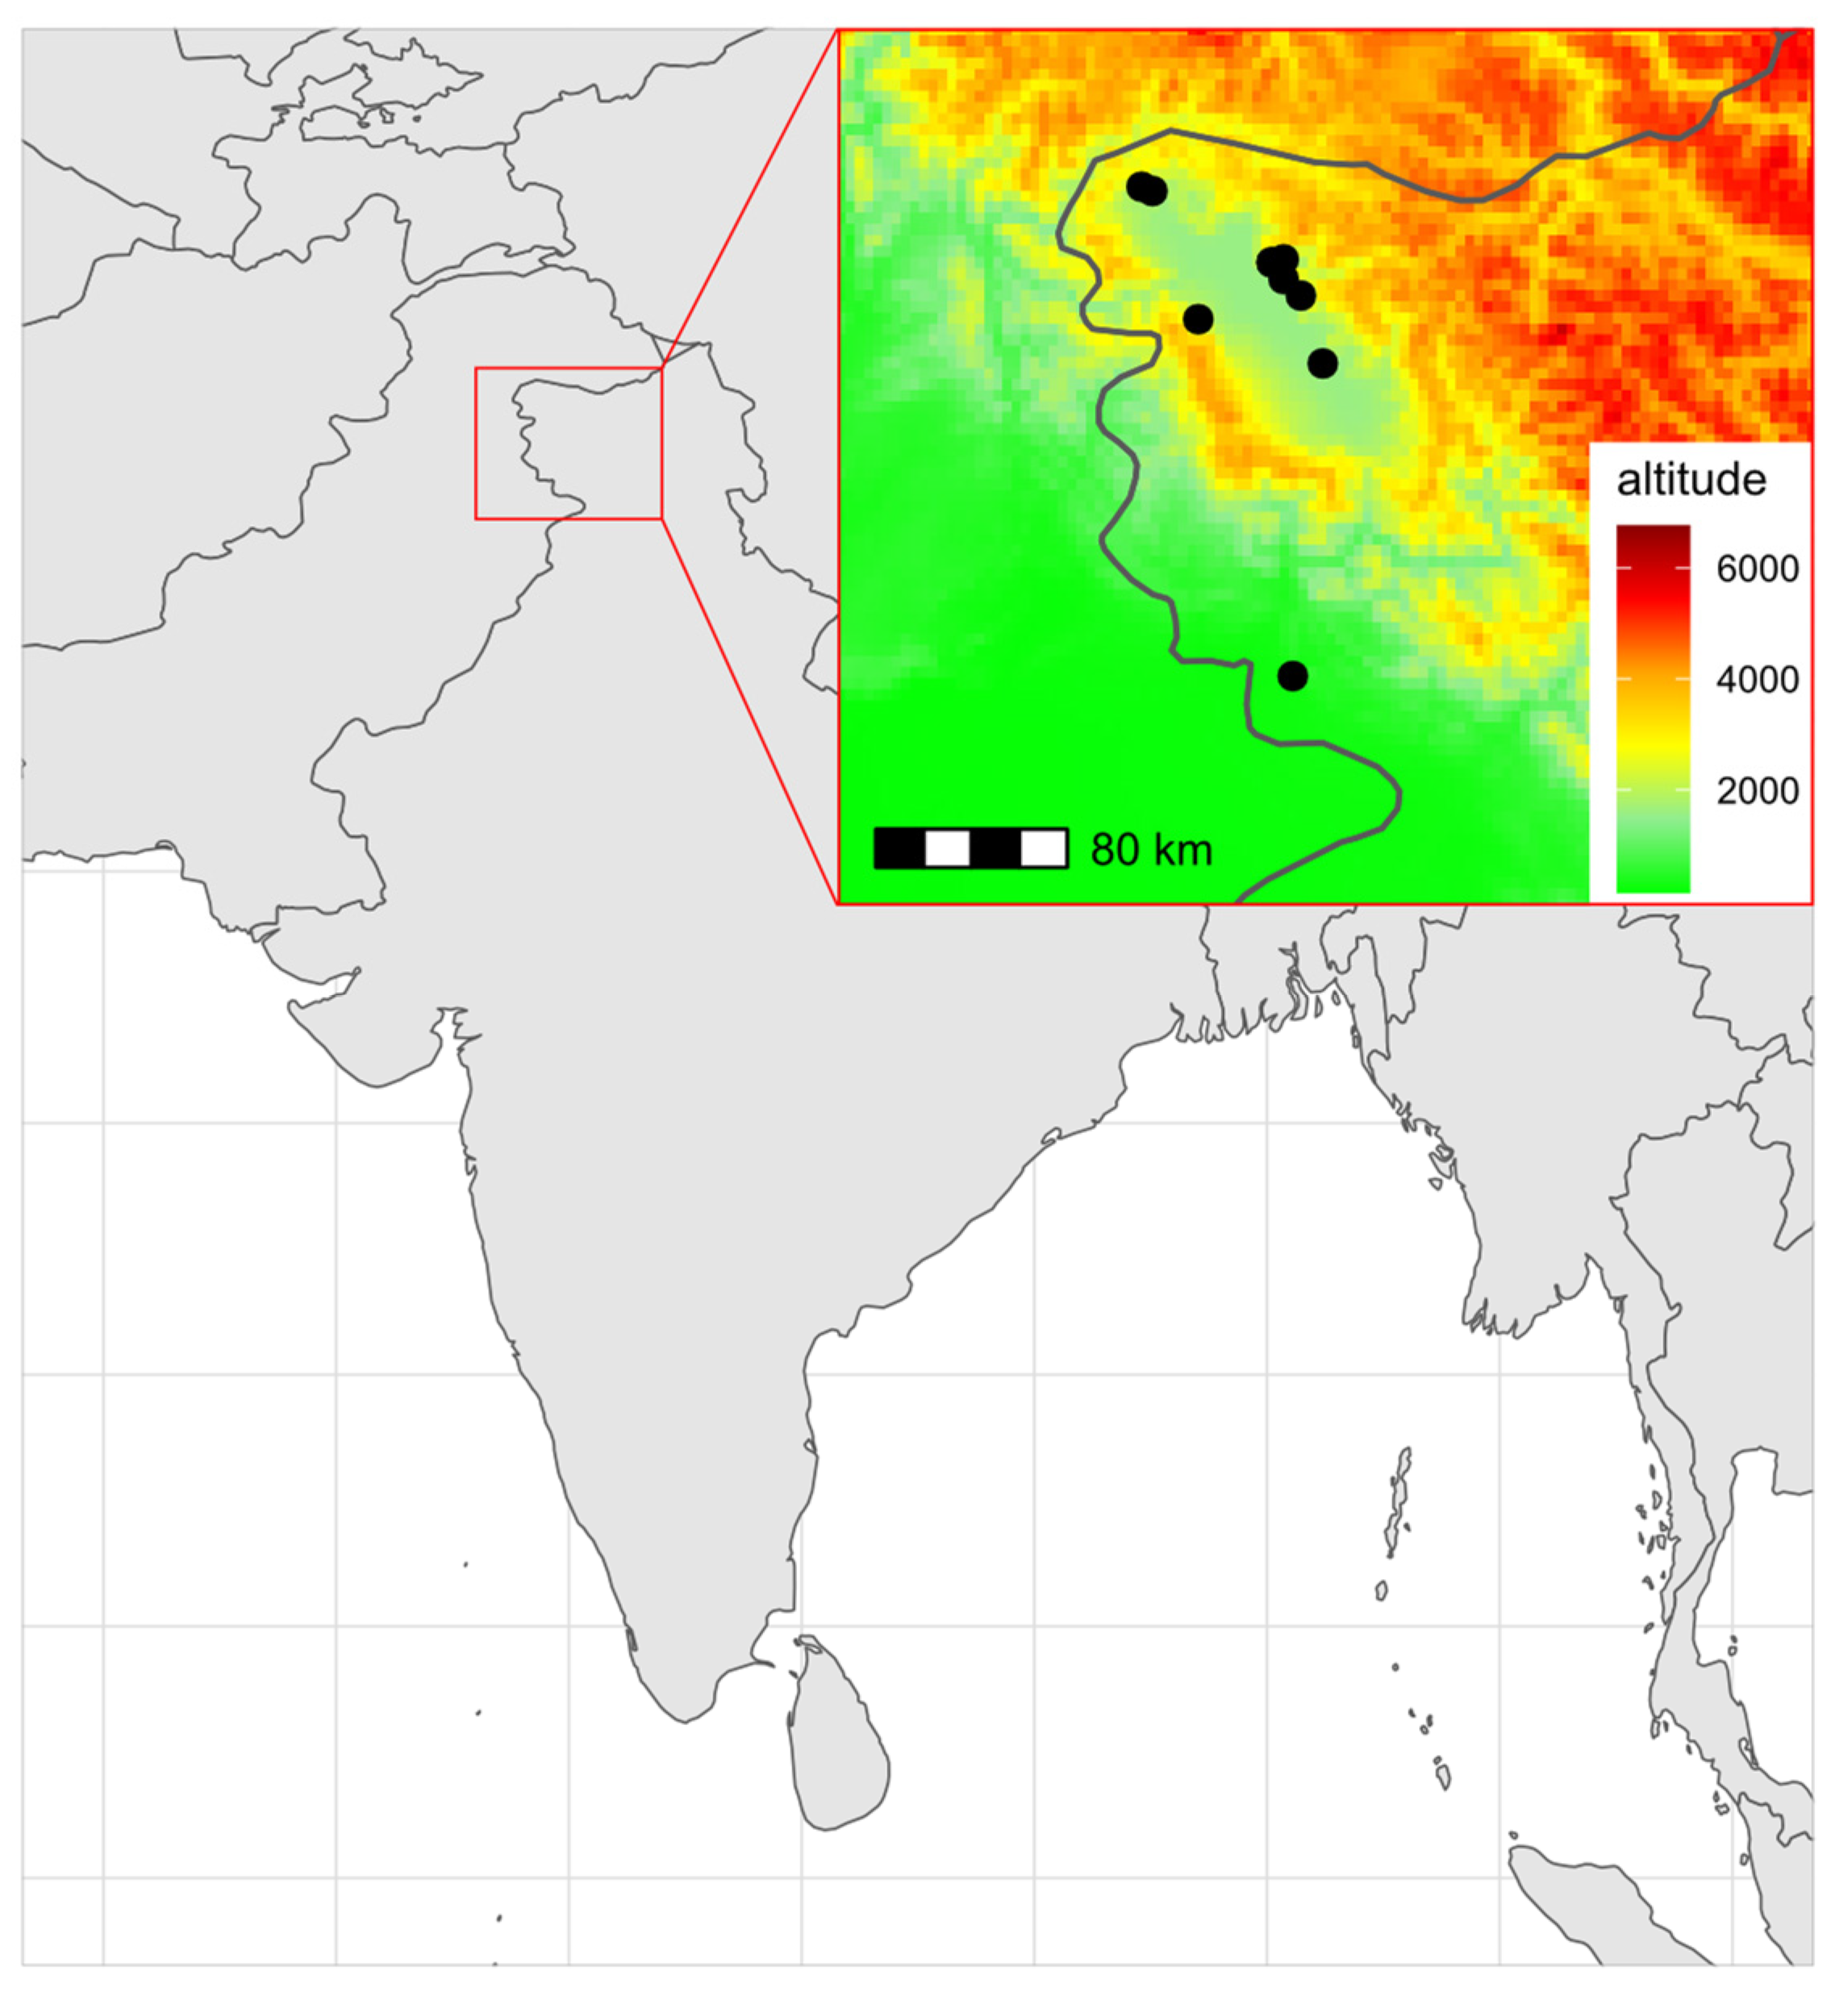
Figure 2.
Classification of honey bee samples from India as species from genus Apis based on the first two linear discriminants (LD). Each black dot indicates one sample. Ellipses indicate 95% confidence regions.
Figure 2.
Classification of honey bee samples from India as species from genus Apis based on the first two linear discriminants (LD). Each black dot indicates one sample. Ellipses indicate 95% confidence regions.
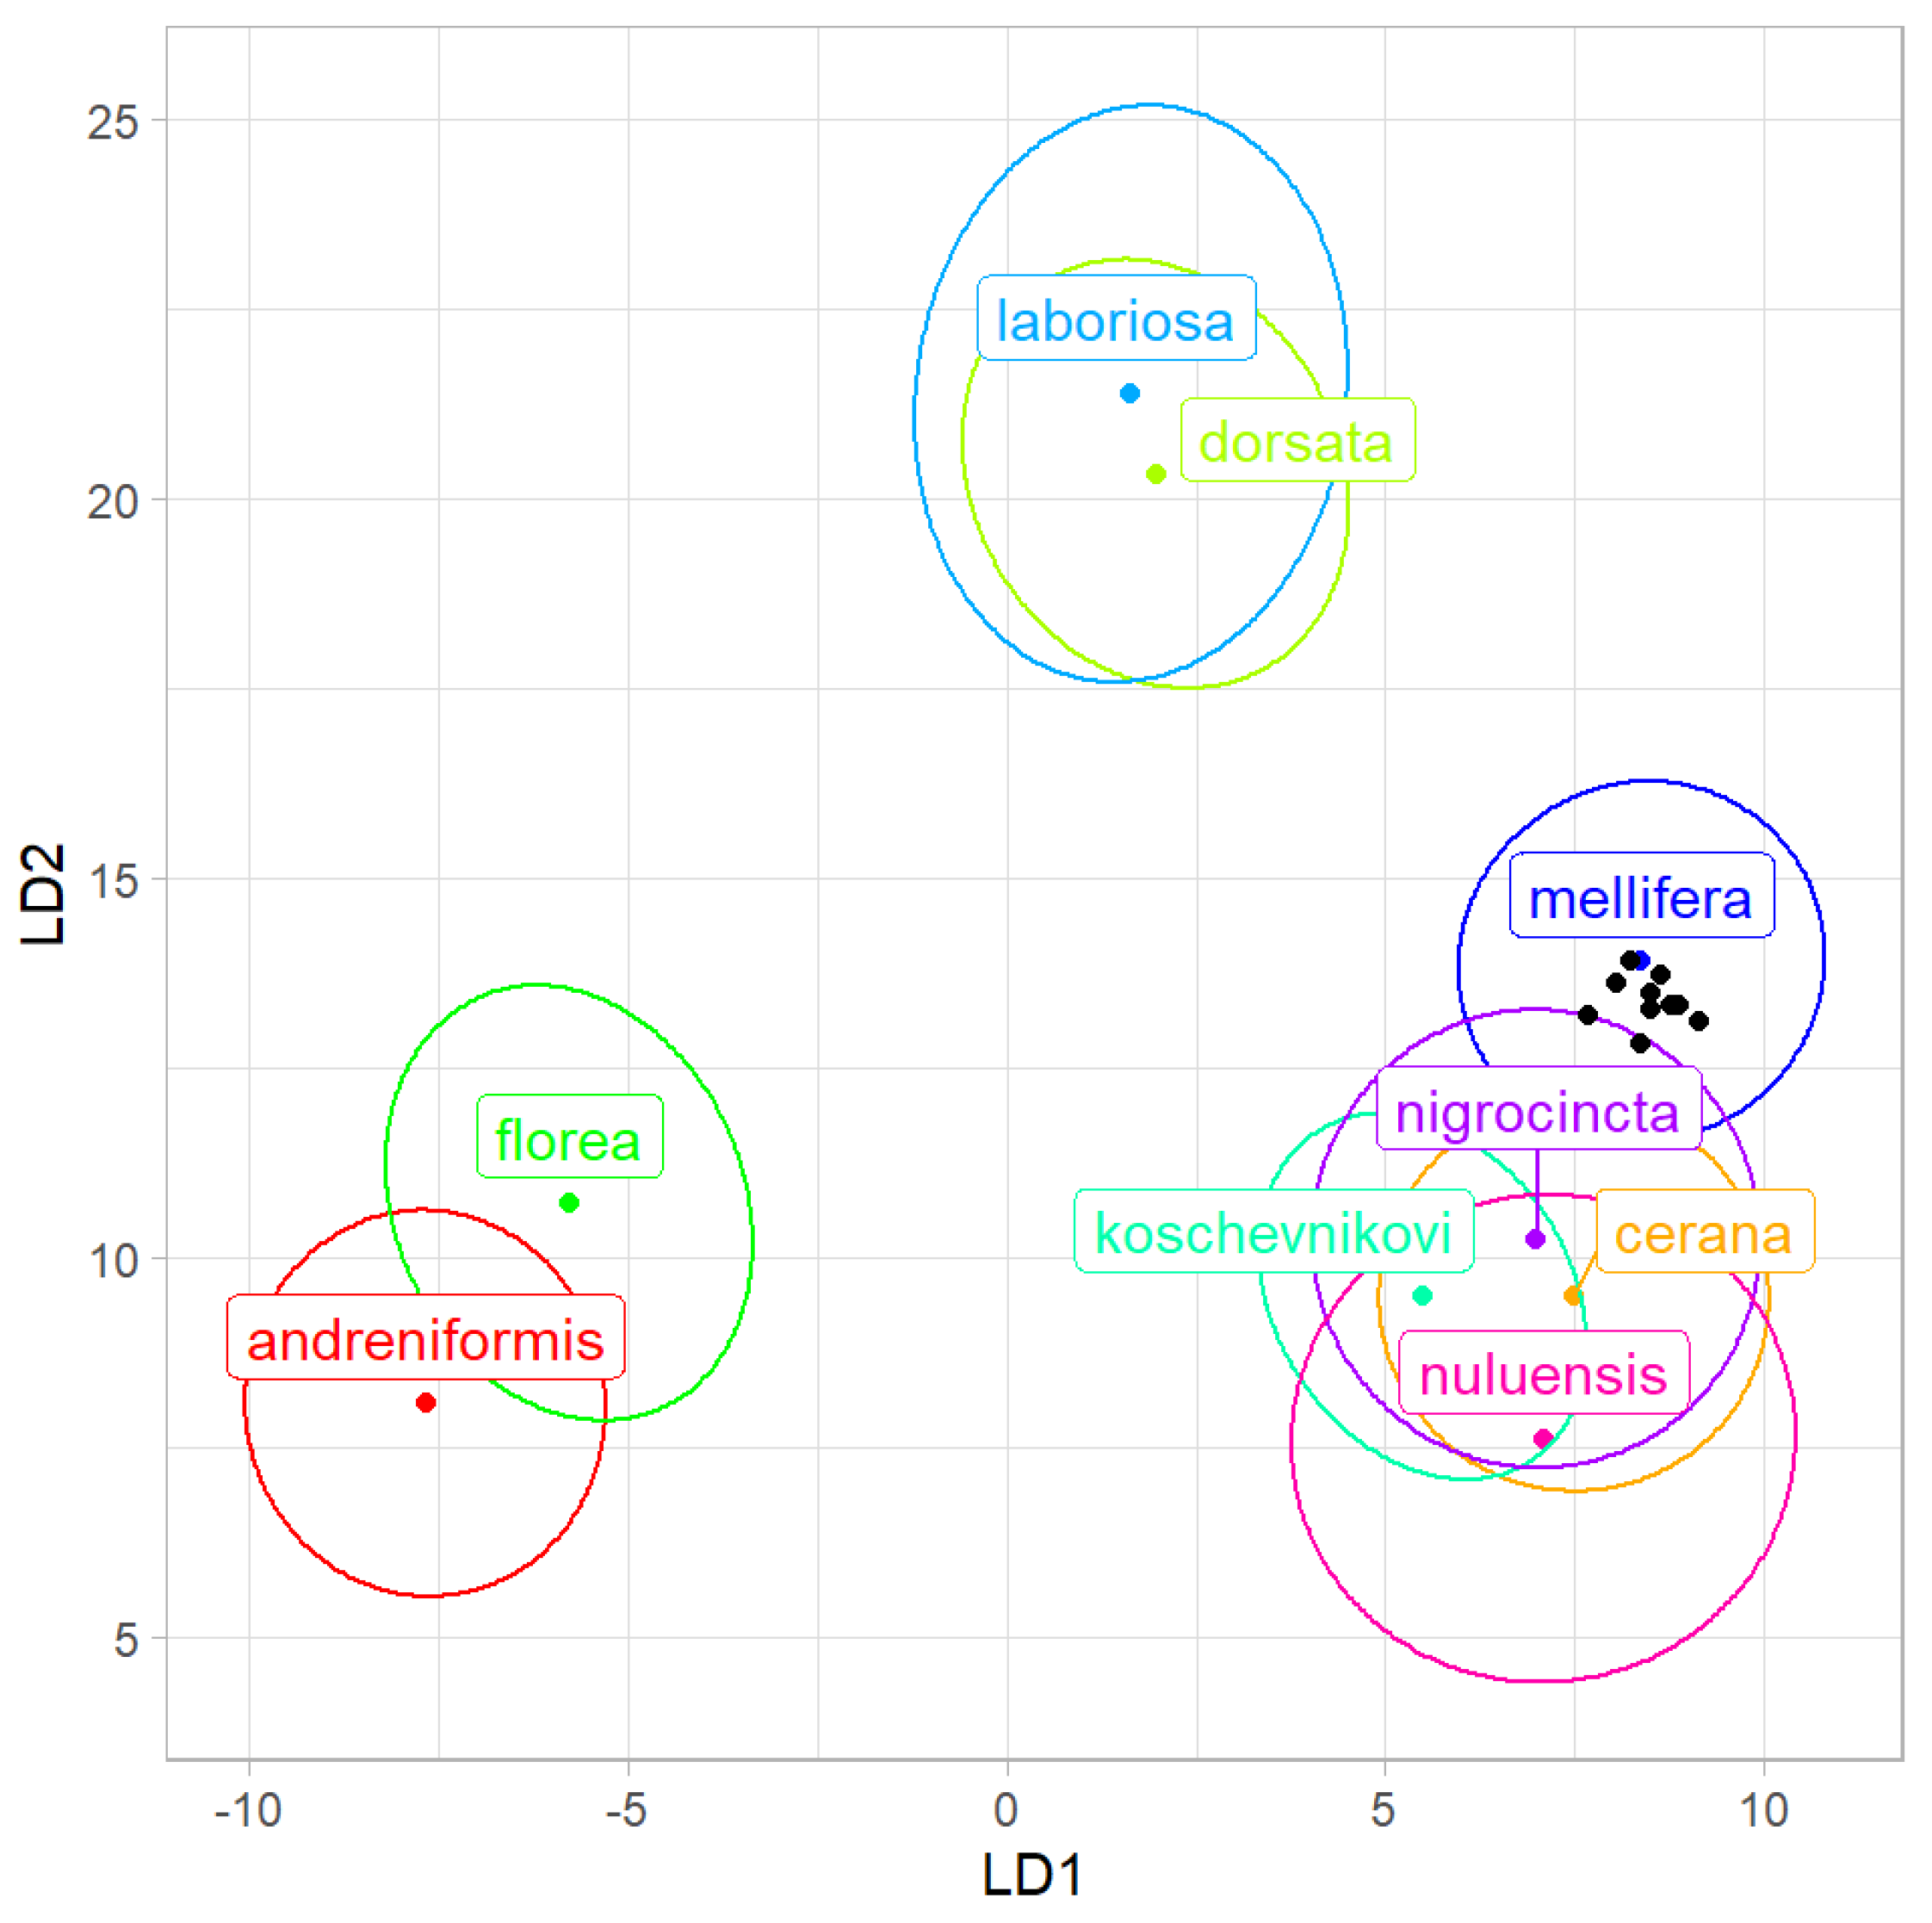
Figure 3.
Classification of honey bee samples from India as honey bee lineages based on the first two linear discriminants (LD). Each black dot indicates one sample. Ellipses indicate 95% confidence regions.
Figure 3.
Classification of honey bee samples from India as honey bee lineages based on the first two linear discriminants (LD). Each black dot indicates one sample. Ellipses indicate 95% confidence regions.
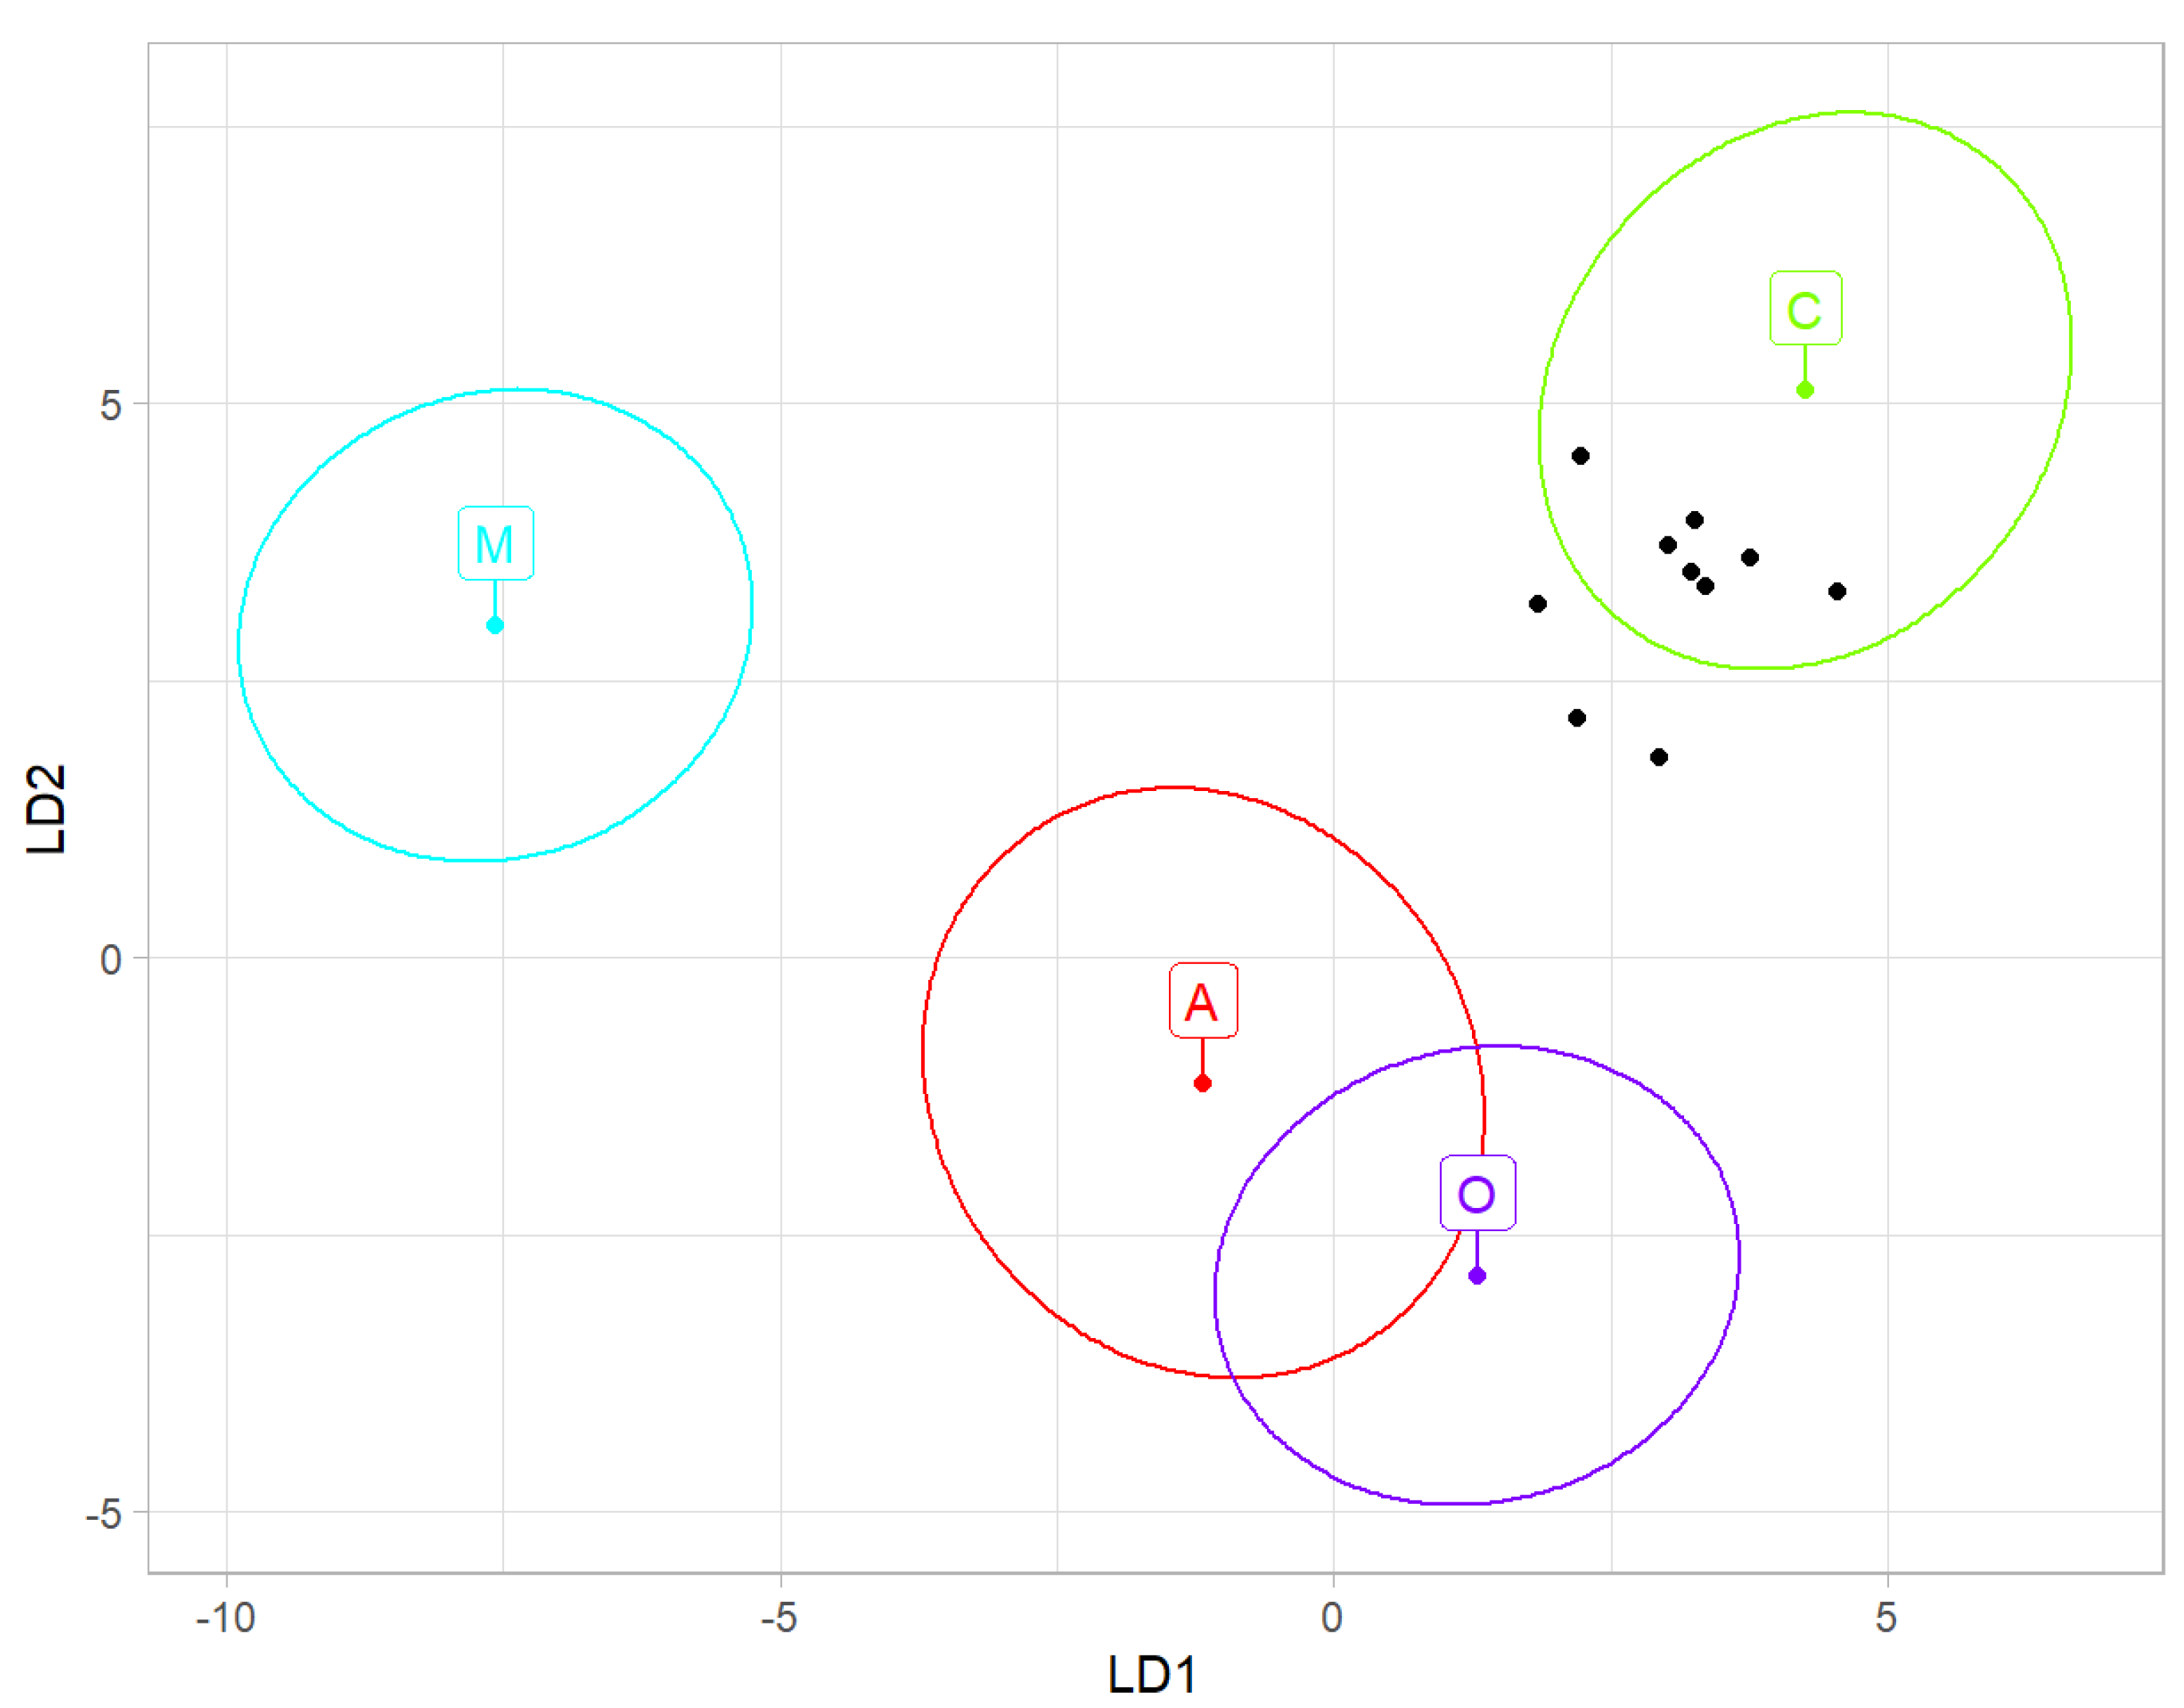
Figure 4.
Classification of honey bee samples from India as regions in lineage C based on the first two linear discriminants (LD). Each black dot indicates one sample. Ellipses indicate 95% confidence regions.
Figure 4.
Classification of honey bee samples from India as regions in lineage C based on the first two linear discriminants (LD). Each black dot indicates one sample. Ellipses indicate 95% confidence regions.
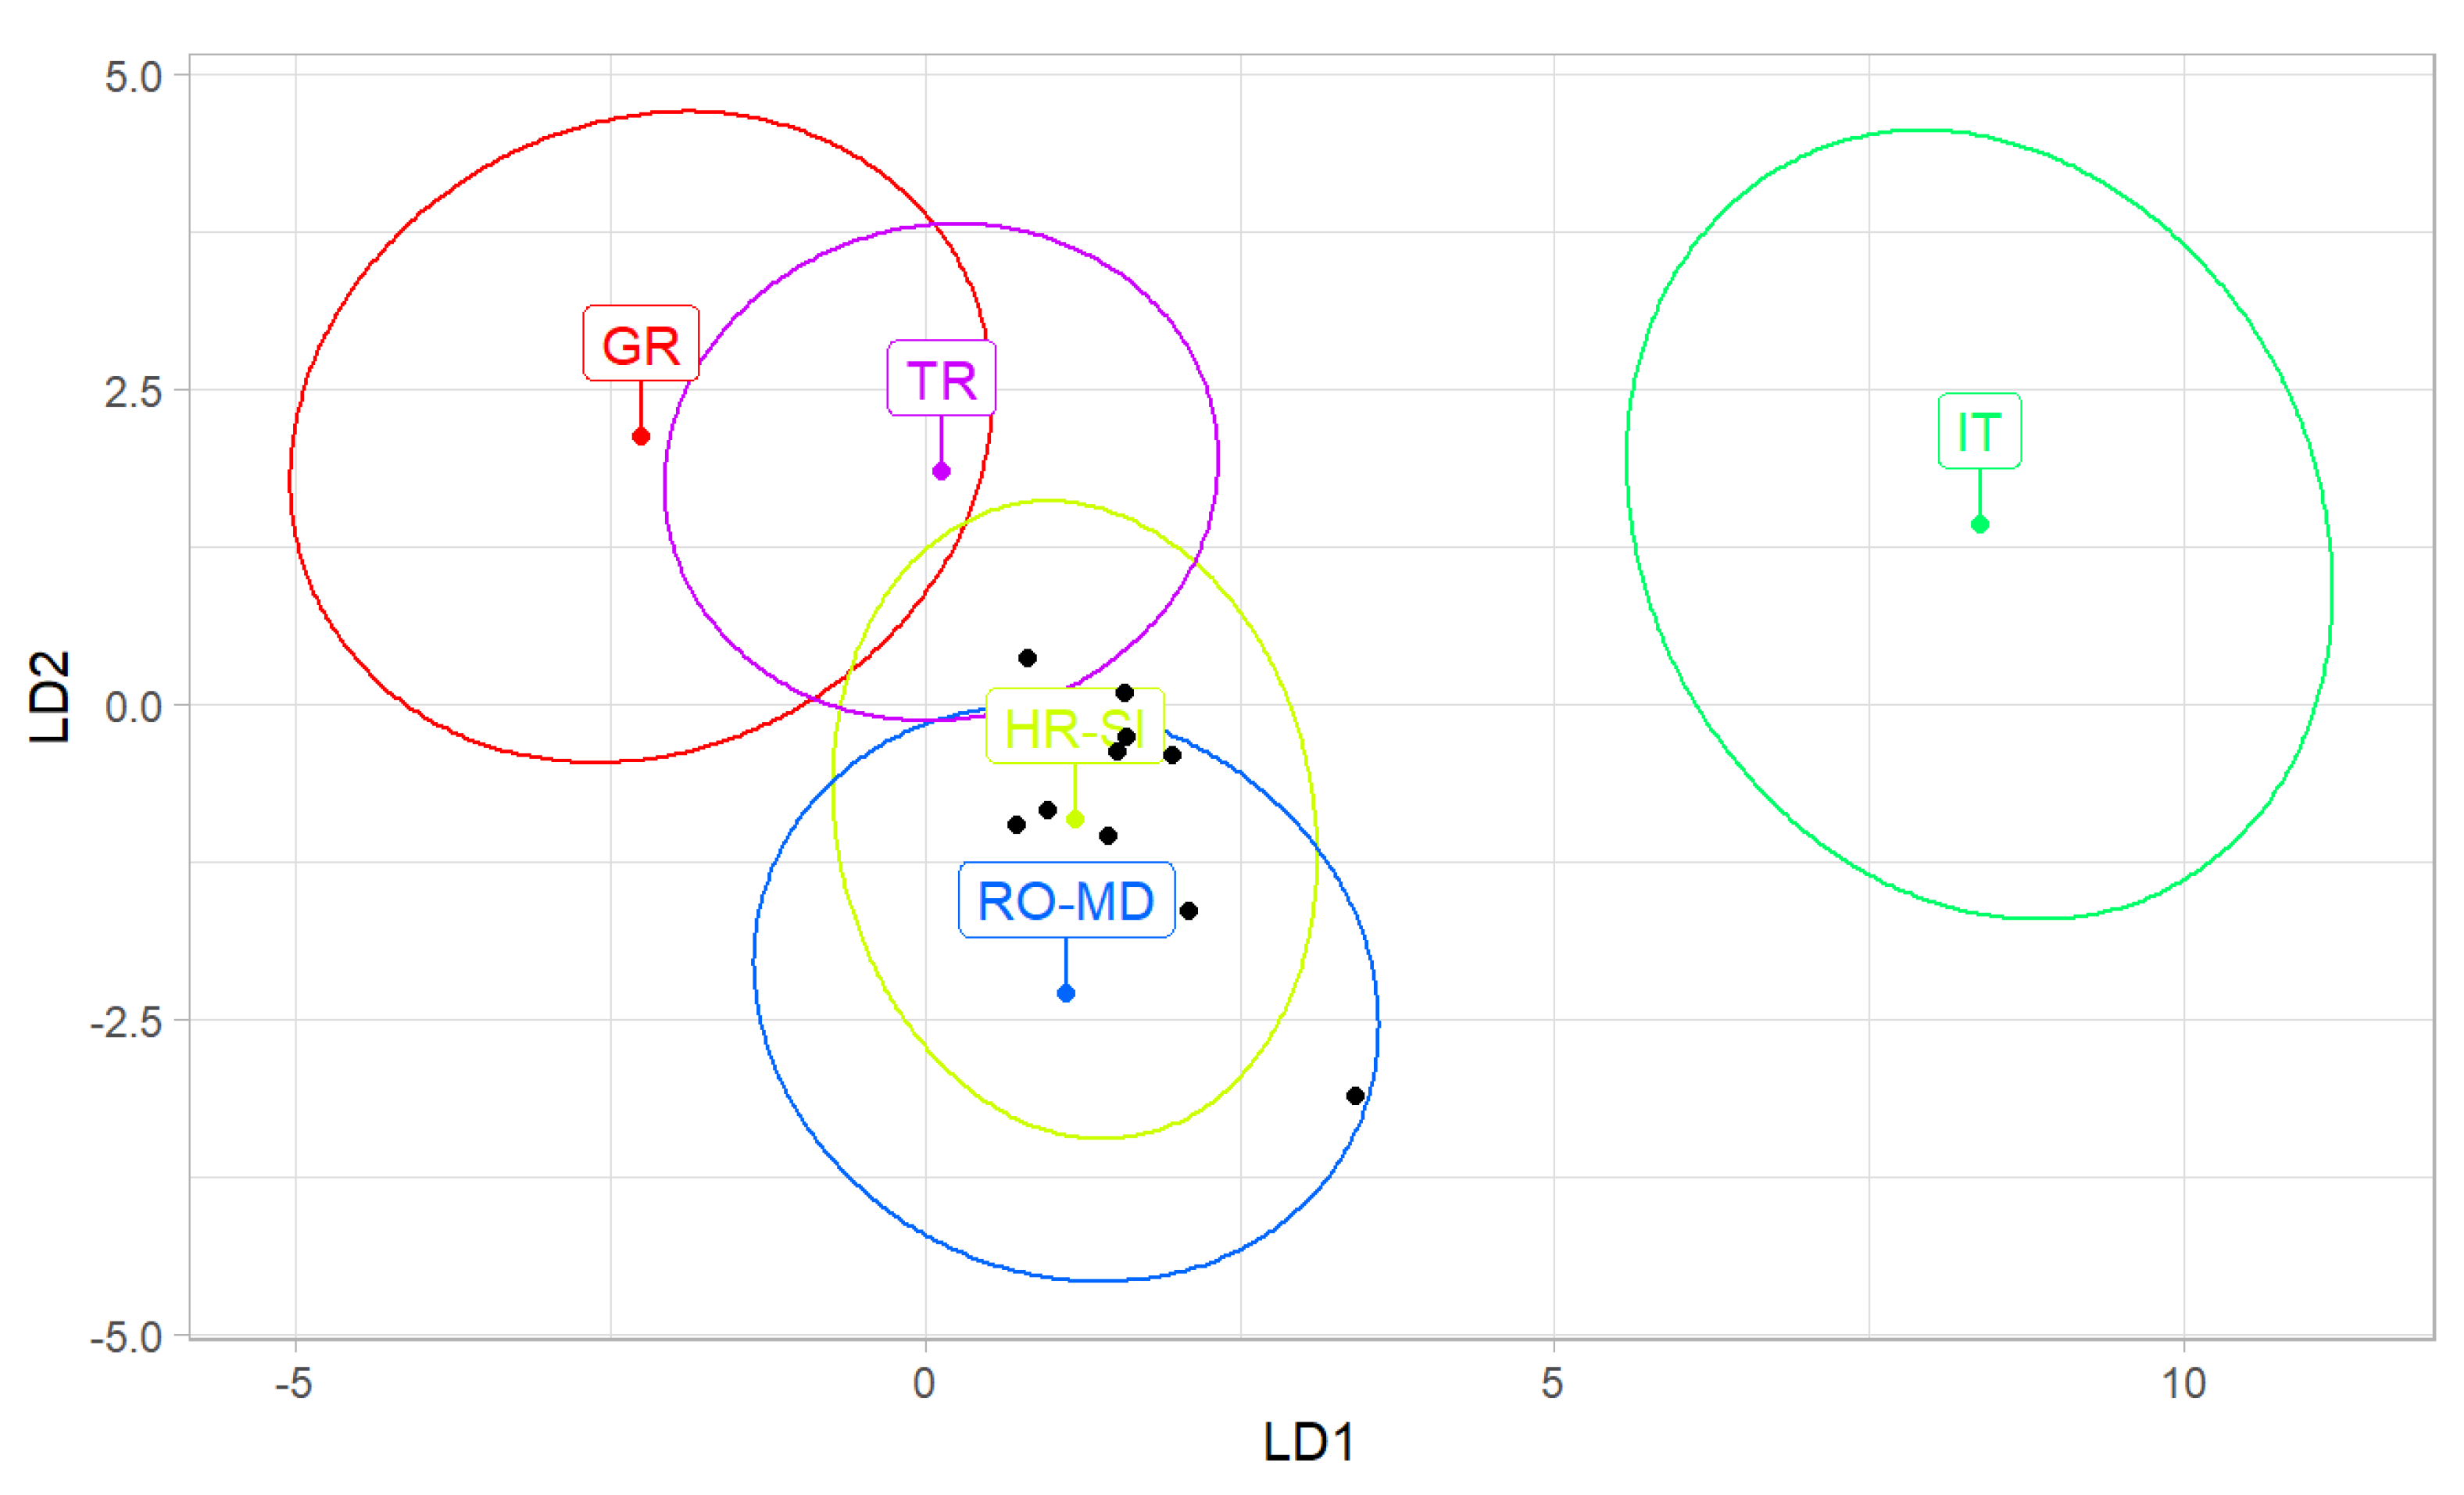

Table 1.
Locations in northern India from which samples were obtained.
| Sample | Location | Latitude | Longitude | Altitude (m) |
|---|---|---|---|---|
| 1 | Waliwar | 34.2713 | 74.7533 | 1743 |
| 2 | Rangil | 34.2093 | 74.8064 | 1664 |
| 3 | Cxanthan | 34.2717 | 74.7539 | 1737 |
| 4 | Manigam | 34.2825 | 74.8069 | 1674 |
| 5 | Wayan | 34.5381 | 74.2189 | 1631 |
| 6 | Zurhama | 34.5542 | 74.1701 | 1840 |
| 7 | Malangpora | 33.8934 | 74.9822 | 1626 |
| 8 | Mahyan | 34.0588 | 74.4244 | 2159 |
| 9 | Shalimar | 34.1472 | 74.8838 | 1585 |
| 10 | Jammu | 32.7245 | 74.8479 | 271 |
Table 2.
Dissimilarity of the honey bees from India to evolutionary lineage. MD: Squared Mahalanobis distance.
Table 2.
Dissimilarity of the honey bees from India to evolutionary lineage. MD: Squared Mahalanobis distance.
| Evolutionary Lineage | MD | Probability |
|---|---|---|
| A | 38.65 | 2.057 × 10⁻⁸ |
| C | 12.91 | 4.837 × 10⁻³ |
| M | 128.67 | 1.046 × 10⁻²⁷ |
| O | 69.96 | 4.355 × 10⁻¹⁵ |
Table 3.
Classification of honey bee samples from India as evolutionary lineages.
| Sample | Evolutionary Lineage | Probability |
|---|---|---|
| 1 | C | 3.820 × 10⁻³ |
| 2 | C | 1.499 × 10⁻² |
| 3 | A | 4.833 × 10⁻⁵ |
| 4 | C | 4.213 × 10⁻¹ |
| 5 | C | 3.241 × 10⁻³ |
| 6 | C | 1.032 × 10⁻¹ |
| 7 | C | 4.264 × 10⁻⁴ |
| 8 | C | 2.637 × 10⁻² |
| 9 | C | 1.351 × 10⁻⁵ |
| 10 | C | 2.443 × 10⁻⁵ |
Table 4.
Dissimilarity of honey bee samples from India to regions in lineage C. MD: Squared Mahalanobis distance.
Table 4.
Dissimilarity of honey bee samples from India to regions in lineage C. MD: Squared Mahalanobis distance.
| Region | MD | Probability |
|---|---|---|
| Greece | 22.743 | 1.425 × 10⁻⁴ |
| Croatia- Slovenia | 8.691 | 6.930 × 10⁻² |
| Italy | 54.513 | 4.109 × 10⁻¹¹ |
| Romania- Moldova | 12.432 | 1.441 × 10⁻² |
| Turkey | 69.199 | 3.350 × 10⁻¹⁴ |
Table 5.
Classification of honey bee samples from India as regions in lineage C. MD: Squared Mahalanobis distance.
Table 5.
Classification of honey bee samples from India as regions in lineage C. MD: Squared Mahalanobis distance.
| Sample | Region | Probability |
|---|---|---|
| 1 | RO-MD | 0.038065 |
| 2 | HR-SI | 0.124295 |
| 3 | GR | 0.020656 |
| 4 | HR-SI | 0.499434 |
| 5 | HR-SI | 0.086676 |
| 6 | HR-SI | 0.006802 |
| 7 | HR-SI | 0.039837 |
| 8 | HR-SI | 0.019549 |
| 9 | HR-SI | 0.026855 |
| 10 | RO-MD | 0.020600 |
Disclaimer/Publisher’s Note: The statements, opinions and data contained in all publications are solely those of the individual author(s) and contributor(s) and not of MDPI and/or the editor(s). MDPI and/or the editor(s) disclaim responsibility for any injury to people or property resulting from any ideas, methods, instructions or products referred to in the content. |
© 2023 by the authors. Licensee MDPI, Basel, Switzerland. This article is an open access article distributed under the terms and conditions of the Creative Commons Attribution (CC BY) license (http://creativecommons.org/licenses/by/4.0/).
Copyright: This open access article is published under a Creative Commons CC BY 4.0 license, which permit the free download, distribution, and reuse, provided that the author and preprint are cited in any reuse.


