Submitted:
21 June 2023
Posted:
22 June 2023
You are already at the latest version
Abstract
This paper presents a scenario evolution model for maritime accidents using Bayesian networks (BN) to predict the most likely causes of specific types of maritime incidents. The BN nodes encompass accident type, life loss contingency, accident severity, the quarter and time period of the accident, and the type and gross tonnage of the ships involved. We analyzed 5,660 global maritime accidents from 2005 to 2020. Using Netica software, we constructed a Tree Augmented Network (TAN) model, accounting for interdependencies among risk influencing factors. We validated the results through sensitivity analysis and historical accident records. Forward causal inference and reverse diagnostic inference were then performed on each node variable to investigate the accident development trend and evolution process under predetermined conditions. The findings indicate that the model can effectively predict the likelihood of various accident scenarios under specific conditions, as well as the extrapolation of accident consequences. Forward causal reasoning reveals that general cargo ships with a gross tonnage of 1-18,500 t are most likely to experience collision, grounding, and stranding accidents in the first quarter. Reverse diagnostic reasoning indicates that during early morning hours, container ships, general cargo ships, and chemical ships with a tonnage of 1-18,500 t are less likely to involve life loss in the event of collision accidents.
Keywords:
maritime traffic safety
; maritime accident
; Bayesian network (BN)
; accident scenario analysis
; Netica
1. Introduction
The intricately variable and multifaceted climatic conditions, endemic to the expansive marine environment, have perpetually underscored maritime transport as a vocation of considerable risk. Incidents disrupting maritime transit, encompassing a spectrum of occurrences from vessel collisions to groundings, and from onboard fires to devastating explosions, bear the hallmark of low frequency yet are marked by their profoundly destructive aftermath [1]. Upon the unfortunate manifestation of a maritime accident, a tsunami of undesirable outcomes typically ensues, notably substantial financial loss, a tragic toll of human casualties, or even the insidious onset of extensive environmental pollution [2]. As an imperative and fundamental step towards mitigating the inherent perils of maritime navigation, a comprehensive exploration into the multifactorial etiology of these traffic mishaps proves indispensable [3,4,5]. Moreover, it becomes increasingly pivotal to meticulously undertake a dynamic risk evaluation, focusing on the myriad facets of maritime operations [6,7,8]. Complementing this, the development and implementation of robust predictive models, which can potentially forecast the calamitous conjunction of human fatality and its probability in the event of an accident, can contribute significantly towards minimizing future maritime disasters [9,10,11,12].
Over the years, an impressive corpus of scholarly efforts has been devoted to enhancing our understanding of maritime traffic safety, including explorations into accident causation analysis [3,4,5,13], accident consequence assessment [14,15,16], and accident loss computation [17,18]. These endeavors have given rise to an array of innovative evaluation methodologies. In one notable study, Hu et al. [3] skillfully harnessed the capabilities of the Human Failure Analysis and Classification System (HFACS) in tandem with Structural Equation Modeling (SEM) to disentangle the intricate web of causal factors underpinning Marine Traffic Accidents (MTAs). Chou et al. [4], in a synergistic integration of technologies, amalgamated the Automatic Identification System, Geographic Information System, and an electronic chart (e-chart) to scrutinize the interplay between environmental factors, geographical locations, and common causes of marine mishaps. By overlaying vessel traffic flows, accident sites, and environmental data on a shared e-chart, their research unfurled valuable insights for port authorities in streamlining ship traffic flow and curtailing the prevalence of marine accidents in the vicinity of ports. Meanwhile, Xue et al. [5] proffered a comprehensive analytical framework for investigating the peculiarities and causative factors of ship accidents, utilizing a decade's worth of historical data harvested from the capriciously fluctuating backwater expanse of the Three Gorges Reservoir region. Their extensive work yielded a thorough summary and visualization of vessel accident categories and severity, involved vessel types, spatial-temporal distribution characteristics, vessel accident losses, along with the underlying causes and lessons gleaned from pertinent accidents, achieved through a rigorous statistical and comparative analysis of historical data. Elsewhere, Fu et al. [13] engineered a bivariate probit model to delve into an array of 311 Arctic ship accidents spanning from 1998 to 2017. Their study brought to the fore influential factors such as gross tonnage, ship type, ship age, accident type, accident year, accident location, wind, and sea ice as primary contributors to accident severity. Simultaneously, their research unveiled an intriguing negative correlation between serious accidents and those resulting in pollution. As research on maritime traffic accidents has illuminated a gamut of potential causative factors, an increased granularity of available accident data has spurred a growing number of scholars to concentrate on the ramifications of these mishaps, specifically the evaluation of accident consequences and loss computation. Such undertakings have risen to prominence, particularly in the eyes of managers concerned with incidents that yield significant economic damage and human casualties. For instance, Chen et al. [15] presented an evidence-based Fuzzy Bayesian Network methodology to erect probabilistic models of marine accidents, thereby enabling the appraisal of accidents likely to spawn severe consequences. In a similar vein, Ventikos and Giannopoulos [16] introduced a criterion for assessing risk and repercussions within the maritime transport sector from the societal perspective, thereby formulating a novel framework for marine risk assessment that facilitates the comparison of disparate accident scales and characteristics, while accurately mirroring the risk threshold society is prepared to tolerate. Chen et al [17] pioneered an enhanced entropy weight-TOPSIS model to furnish a holistic analysis and appraisal of marine total loss incidents, encompassing a global scope from 1998 to 2018. These studies, though highly impactful, predominantly undertake analyses either from the standpoint of accident causation or evaluation of accident consequences. Rarely do these scholarly pursuits straddle both domains in a bidirectional inquiry.
In the realm of accident scenario analysis, methodological constructs like event tree analysis and accident tree analysis find frequent utilization in the assembly of traffic accident scenario evolution models [19,20,21,22,23]. However, the breadth of most accident-cause analyses often overshadows their specificity, impeding their ability to yield targeted recommendations for forestalling analogous events [24]. To bridge this gap, scholars may employ a Bayesian network-based maritime accident scenario modeling approach. Bayesian networks stand as a form of probabilistic graphical model, deftly equipped to encapsulate and deliberate over uncertain knowledge and nebulous relationships among variables. This versatile modeling approach, designed to embrace the labyrinthine and dynamic character of maritime activities, excels at discerning the contributory factors precipitating maritime accidents [3,5]. Employing a synergistic blend of historical data and expert acumen, this model can approximate both the likelihood of an accident's occurrence and the potential fallout arising from a range of accident scenarios [14,16]. Bayesian networks (BN) find broad application in confronting uncertain multi-factor causality inference, accident causation analysis, and scenario prediction, making them invaluable tools in road and waterway transportation sectors [25,26,27,28,29,30,31,32]. Various scholars have employed these tools in diverse studies: Zou and Yue [33] melded probabilistic risk analysis with BN theory to explore the origins of road traffic accidents; Yuan et al. [34] constructed a scenario-derived prediction model for the repercussions of fire accidents in oil and gas storage and transportation emergency processes, leveraging a defuzzification method and a dynamic BN model. Other researchers, such as Zhao et al. [35], used the ISM-BN model to assess the impact of varying factors on maritime safety, successfully pinpointing the critical risk components for different accident types. Afenyo et al. [36] utilized a BN model to sketch an Arctic shipping accident scenario and illuminate the crucial causative elements of a potential accident scenario. Similarly, Jiang et al. [37] proposed a Bayesian network-based risk analysis strategy for evaluating maritime accidents along the 21st century Maritime Silk Road (MSR), identifying the principal influencing factors to bolster accident prevention measures and ensure maritime transportation's safety and sustainability. In a more focused study, Si et al. [38] employed a BN structure learning algorithm that paired kernel density estimation with a model weighted average strategy to dissect the causative elements of container ship collisions, basing their analysis on a limited set of container ship collision sample data. Other studies like Fan et al. [39] and Hänninen et al. [40] proposed similar Bayesian network-based risk analysis approaches for understanding the contributing factors to maritime transport accidents, with the latter focusing more on maritime safety management and its relationship with maritime traffic safety. Despite these successes, these aforementioned studies suffer from a triad of limitations: 1) a paucity of sample data from maritime accidents, 2) a labor-intensive and time-consuming data collection process, and 3) the inherent difficulty in obtaining accident loss records. Summarily, while waterway transportation research has honed its focus on accident causality reasoning and accident causation analysis, there remains a conspicuous void in the research landscape pertaining to accident scenario modeling.
In light of this, the paper aims to build a BN model for the evolution of maritime accident scenarios using global maritime accident data. The data derive from the Global Integrated Shipping Information System (GISIS) established by the International Maritime Organization (IMO) and have been widely used by scholars in maritime accident studies [41,42,43,44,45,46,47]. A Bayesian network-based maritime traffic accident scenario modeling approach is proposed to analyze the causes of maritime traffic accidents, perform dynamic risk assessment of shipping activities, and predict the probability of occurrence and consequences of accidents. By identifying the influencing factors and simulating various accident scenarios, the proposed approach can help maritime stakeholders to implement appropriate preventive measures and improve the safety of maritime transportation. The proposed model can predict the most likely causal factors leading to specific accident consequences, thereby providing technical support for the practical direction of shipping safety management strategies.
The rest of this article is structured as follows. Section 2 briefly introduces the structure and construction method of Bayesian network, and further introduces the method tree augmented network (TAN) driven by Bayesian data. Section 3 builds the TAN model based on the data of 5660 maritime accidents, and carries out sensitivity analysis and simulation verification on the built model. Section 4 uses the two-way reasoning ability of TAN model to predict the accident chain and analyze the accident causes. Finally, the fifth part summarizes the full text.
2. BN Structure Learning—TAN
BN is a Directed Acyclic Graph (DAG) composed of nodes and directed edges, which is widely employed to illustrate the interdependence and strength of associations between variables. The network represents the interrelationships between variables through vectorial arcs, with the intensity of each association specified by a table of conditional probabilities.
There are two primary approaches to generating BN structures: 1) the expert knowledge method, and 2) the data-driven method. In the expert knowledge method, the BN structure is built by subjectively evaluating the causal relationships between variables. Conversely, the data-driven method is employed to uncover the interdependence between variables, based on the learning algorithm of the BN model and data correlations. In this study, since sufficient sample data were collected, the data-driven method was used to construct the BN structure.
Data-driven Bayesian approaches can be classified into three main categories: 1) the Naive Bayesian Network (NBN); 2) the Augmented Naive Bayesian Network (ABN); and 3) the Tree Augmented Network (TAN). Among these, TAN learning effectively combines the simplicity and robustness of NBN computation with the ability to characterize interaction dependencies among variables, thus providing insights into the key factors leading to the outcomes of specific accidents [48]. Therefore, this paper employs the data-driven TAN approach to construct the BN structure.
BN encodes the joint probability distribution over a set of random variables . Let , where denotes the number of influencing factors, represent the influencing factors, and is a class variable (accident type). It is established that the set of parent nodes of in is empty, meaning . Moreover, has at most one other node besides that can have an associated edge pointing to it. The joint probability density distribution adheres to the following equation:
In the process of learning the TAN structure, Chow and Liu [49] proposed an approach to optimize and construct the BN structure using the conditional mutual information of each attribute pair. The function is defined as:
where denotes the conditional mutual information; and is the i-th state of the influencing factor ; and is the i-th state of the influencing factor .
3. Global Maritime Accident TAN Model
This section can be divided using subheadings to provide clear organization. It should offer a concise and accurate description of the experimental results, their interpretation, and the conclusions that can be drawn from the experiments.
3.1. Data Collection
This paper utilizes the Marine Casualties and Incidents (MCI) database in GISIS, which is managed by IMO [50]. GISIS is a comprehensive, global maritime information system. In accordance with IMO regulations, every country with sovereignty over its territorial sea is required to report maritime accidents occurring within its waters to the IMO. The MCI database contains two types of information related to global maritime accidents: first, factual data gathered from various sources; and second, detailed data obtained from casualty investigation reports submitted to the IMO.
The MCI database houses global maritime accident data dating back to 1973. Between 1973 and 2000, the annual number of recorded maritime accidents was quite limited. From 2001 onwards, the number of accidents documented in the MCI database has been more consistent. However, the accident timestamps during 2001-2004 are only accurate to the day, which is not sufficient for studying the specific time periods in which the accidents occurred. Consequently, we excluded the low-quality data from the early years and utilized a total of 5,660 maritime accident records from 2005 to 2020 to construct the BN model.
3.2. Node Variable Definitions
Based on the literature's studies on maritime accident factor analysis [1,43,51,52], there are 16 primary factors contributing to maritime accidents, including ship type, hull type, ship age, ship length, ship gross tonnage, ship operation, voyage segment, ship speed, ship condition, ship equipment or device condition, ship design, interaction information, weather condition, ocean condition, time period, and channel traffic condition. Combining these factors with the information available in the MCI database, we selected seven node variables for the BN model: accident quarter, accident period, accident type, ship type involved, total tonnage of the ship involved, life loss contingency, and accident severity.
Since BN nodes require discrete variables, it is necessary to discretize continuous variables in the accident statistics. We divided accident occurrence quarters into first quarter (January, February, March), second quarter (April, May, June), third quarter (July, August, September), and fourth quarter (October, November, December). Accident periods were categorized as dawn (0:00-5:59), early morning (6:00-8:59), morning (9:00-11:59), noon (12:00-13:59), afternoon (14:00-16:59), early evening (17:00-19:59), and evening (20:00-23:59). To discretize the gross tonnage of the ships involved, we used the collected data and the Centroid Clustering (CC) algorithm for classification. The CC algorithm employs the minimization error sum of squares as the objective function and terminates when the number of iterations reaches a preset maximum of 5,000 iterations. The optimal classification results yielded four groups based on the gross tonnage of the ships involved: (1-18,500 t), (18,501-57,500 t), (57,501-120,000 t), and (120,001-403,342 t). Among them, 403,342 t represents the maximum total tonnage of the ships involved in the collected data.
Furthermore, this paper classifies non-routine accidents, such as missing ships, life-saving equipment accidents, and numerous accident types with irregular or rare records, accounting for no more than 5%, as "other" [53]. Multipurpose ships, tugboats, supply and offshore vessels, unspecified ship types, and other ship types, representing no more than 10%, are categorized as "Other" [53]. Table 1 presents the names, classifications, frequency of occurrence, and percentages of each discrete variable category.
3.3. TAN Modeling
Based on the data processing results, we examined the relationship between six influencing factors and accident consequences. We used Netica software with a "learning network" function to develop a TAN model based on Equation (2), ensuring that all connections between nodes are meaningful. The initial structure of the TAN, depicted in Figure 1, is grounded in data-driven TAN training results that demonstrate realistic correlations between variables.
Utilizing the TAN model, Netica software employs basis functions to create a structure learning module and a parameter learning module that automatically learn the Conditional Probability Table (CPT) parameters from the sample dataset. By constructing the TAN and obtaining the CPT, we can calculate the posterior probability of each variable. The statistical results of the probabilistic variables facilitate the analysis of maritime safety considerations and aid in accident prevention. Figure 2 presents the TAN results for the random variables of interest.
3.4. Sensitivity Analysis and Model Validation
3.4.1. Sensitivity Analysis
In the Netica software, we selected the accident type as the target node and conducted a sensitivity analysis on this node to identify the factors with the greatest influence on the target node within the TAN model.
The mutual information value represents the sensitivity level between two random variables; a higher value indicates greater sensitivity of the influencing factor to the target node and, conversely, lower sensitivity. We used the sensitivity analysis function in Netica software to calculate the mutual information value, percentage, and variance for each influencing factor and accident type, as displayed in Table 2. According to Table 2, the accident consequence and accident severity are the factors most sensitive to accident type performance, with mutual information values of 0.14246 and 0.14033, respectively, which are notably higher than those of the other four factors. The results reveal that accident consequence and accident severity are the two most intuitive factors for determining the type of accident, followed by ship type, gross tonnage of the ship, time period, and quarter.
3.4.2. Model Validation
To validate the TAN model's effectiveness, we randomly selected three offshore accident cases from 2021, each with varying accident consequences and severities, labeled as events 1, 2, and 3. We input the case data into the model for scenario analysis, and Table 3 presents the relevant data information for these accident cases.
Based on the data from three randomly selected events, we set the probability of known nodes such as quarter, time period, vessel type, accident consequence, accident severity, and gross tonnage of the vessel to 100%. We then observed the types and probabilities of the predicted accidents. As illustrated in Table 3, the probability of other accident types occurring in event 1 was 75.1%; the probability of reefing and grounding in event 2 was 38.0%; and the probability of collision in event 3 was 44.4%. When compared to the original data's accident types, the predicted accident types for the three events matched, indicating that the model's predictions are accurate to some extent. Since the occurrence probability of other accident types in the original data is significantly higher than that of collision, reefing, and grounding, the data-driven TAN model's simulation results demonstrate better performance in predicting the occurrence probability of other accident types (e.g., Figure 3a) and average results in predicting collision and reefing and grounding accidents (e.g., Figure 3b and Figure 3c).
4. Model Reasoning
The TAN model has the ability to reason bidirectionally and helps explain the most likely scenarios associated with a specific accident type. The data-driven TAN-based model examines the correlations between various influencing factors of maritime accidents and accident types, as well as accident consequences. This analysis enables the prediction of the likelihood of various accident scenarios and the extrapolation of accident consequences under specific conditions.
4.1. Accident Chain Forecast
After using the Netica software to manipulate the TAN model, we obtained the relationships between the influencing factors and the accident type, life loss contingency, and probability of each node. By adjusting the placement bar of a single node or multiple nodes, we observed the target node's probability trend, forming a judgment of the potential trend and consequences of the accident.
We first simulated the parameters of the conditions for maritime accidents by changing a single node and observing the target node's changes. When changing the ship type, more significant changes occur in the probability of each accident type. For example, when the ship type is set to a chemical ship, the probability of fire and explosion accident type increases significantly. When the ship type is a bulk carrier, the probability of collision accident type increases notably. The study shows that different ship types can lead to significant differences in the occurrence of accident types. Additionally, the ship's gross tonnage and the accident's quarter and time also impact the accident type.
Since the accident type is influenced by the joint decision of several nodes, the influence of a single node on the accident type is more one-sided. Therefore, we set the accident quarter to the first quarter (with the variable node's confidence bar set to 100%), the ship type to general cargo ship, and the gross tonnage to 1-18,500 t, as shown in Figure 4. At this time, the change in accident type and accident severity node probability from early morning to evening is shown in Figure 5. As seen in Figure 5, among the types of maritime accidents throughout the day, the probability of fire and explosion on ships is low, except for the afternoon time period, which is 18.2%; the probabilities of ship capsizing, machinery damage, and poor communication are also low, at below 10%. Among other accidents, the probabilities of ship collision and reefing and grounding accidents are significantly higher, around 20%. Additionally, it is observed that the occurrence probability of reefing and grounding accidents is significantly higher during dawn and evening than in other periods.
In summary, the highest probabilities of collision and grounding occur at dawn, with the accident severity being particularly serious. Collision is most likely to occur at noon, with high accident severity. Particularly severe collision and grounding accidents are more likely to occur in the evening. It is worth mentioning that although the probabilities of collision and grounding and stranding of ships are higher in this scenario, the probability of life loss is relatively low, and the accident consequences are less affected by the time of the accidents.
4.2. Accident Cause Analysist
The bidirectional reasoning of the TAN model refers to causal reasoning and diagnostic reasoning. Causal reasoning can be applied to accident chain prediction, while diagnostic reasoning can be applied to accident cause analysis. Diagnostic reasoning aims to determine the type, consequence, and severity of an accident to more intuitively understand the causes and mechanisms of offshore accident formation.
As shown in Figure 6, when the accident type is determined to be a collision accident, the accident severity is a general accident, and it does not involve life loss. The study shows that the probability of nodes for container ships, general cargo ships, and chemical ships among the ship types is significantly higher than for other ship types, and the probability of collision accidents for these three ship types is higher than for other ship types. Additionally, observation of accident time and ship tonnage shows that ships with a tonnage of 1-18,500 t are more prone to collisions during the dawn hours. Furthermore, the consequences of accidents involving container ships, general cargo ships, and chemical ships of such tonnage indicate a lower probability of causing life loss. This could be because it is easier for personnel to escape from small ships in distress, or because the rescue of small ships in distress is relatively easy and more successful.
5. Conclusions
Ship safety has always been a major concern in the maritime transportation industry. In this paper, a TAN model for maritime traffic accident risk assessment is constructed to analyze the relationship between the consequences of maritime accidents and various influencing factors, and to use model simulation to analyze how different risk factors affect different types of maritime accidents.
The TAN model was constructed based on data from a total of 5,660 maritime accidents from 2005 to 2020. In addition to other accident types, the accident type with the highest probability of occurrence among maritime traffic accidents is collision, followed by grounding and stranding, and then fire and explosion.
The sensitivity analysis and simulation validation of the constructed model showed that accident consequences and accident severity are the two most intuitive factors in determining the type of accident occurrence, followed by ship type, gross tonnage of the ship, time period, and season. The constructed model can effectively predict the likelihood of various accident scenarios and accident consequence projections under specific conditions.
According to the causal reasoning analysis of the TAN model, under the condition of "first quarter, general cargo ship, and ship's gross tonnage of 1-18,500 t," the probability of ship collision and grounding and stranding accidents is higher, while the probability of life loss is relatively low, and the consequences of the accident are less affected by the time of the accident. According to the analysis of model diagnostic reasoning, in the general collision accident chain without loss of life, container ships, general cargo ships, and chemical ships are the main types of ships involved in such accidents. Ships with a tonnage of 1-18,500 t are more likely to have such accidents in the dawn hours, but the probability of causing loss of life is lower.
Author Contributions
Conceptualization, methodology, software, writing—original draft, S.L. (Shiguan Liao); supervision, J.W. (Jinxian Weng); writing—review and editing, Z.Z. (Zhaomin Zhang); data curation, F.L. (Fang Li) and Z.L. (Zhuang Li); visualization, Z.L. All authors have read and agreed to the published version of the manuscript.
Funding
This research was supported by the National Natural Science Foundation of China under Grants 52072237, the Guangdong Basic and Applied Basic Research Foundation of China under Grants 2022A1515110776 and the Project of Educational Commission of Guangdong Province of China under Grants 2021WTSCX222.
Institutional Review Board Statement
Not applicable.
Informed Consent Statement
Not applicable.
Data Availability Statement
Not applicable.
Conflicts of Interest
The authors declare no conflict of interest.
References
- Fan, S.; Blanco-Davis, E.; Yang, Z.; Zhang, J.; Yan, X. Incorporation of human factors into maritime accident analysis using a data-driven Bayesian network. Reliab. Eng. Syst. Saf. 2020, 203, 107070. [Google Scholar] [CrossRef]
- Zhang, G.; Thai, V.V. Expert elicitation and Bayesian Network modeling for shipping accidents: A literature review. Saf. Sci. 2016, 87, 53–62. [Google Scholar] [CrossRef]
- Hu, S.; Li, Z.; Xi, Y.; Gu, X.; Zhang, X. Path analysis of causal factors influencing marine traffic accident via structural equation numerical modeling. J. Mar. Sci. Eng. 2019, 7, 96. [Google Scholar] [CrossRef]
- Chou, C.-C.; Wang, C.-N.; Hsu, H.-P.; Ding, J.-F.; Tseng, W.-J.; Yeh, C.-Y. Integrating AIS, GIS and E-Chart to Analyze the Shipping Traffic and Marine Accidents at the Kaohsiung Port. J. Mar. Sci. Eng. 2022, 10, 1543. [Google Scholar] [CrossRef]
- Xue, J.; Papadimitriou, E.; Reniers, G.; Wu, C.; Jiang, D.; van Gelder, P. A comprehensive statistical investigation framework for characteristics and causes analysis of ship accidents: A case study in the fluctuating backwater area of Three Gorges Reservoir region. Ocean Eng. 2021, 229, 108981. [Google Scholar] [CrossRef]
- Göksu, S.; Arslan, Ö. Quantitative analysis of dynamic risk factors for shipping operations. J. ETA Marit. Sci. 2020, 8, 86–97. [Google Scholar] [CrossRef]
- Li, Z.; Yao, C.; Zhu, X.; Gao, G.; Hu, S. A decision support model for ship navigation in Arctic waters based on dynamic risk assessment. Ocean Eng. 2021, 244, 110427. [Google Scholar] [CrossRef]
- Guo, Y.; Jin, Y.; Hu, S.; Yang, Z.; Xi, Y.; Han, B. Risk evolution analysis of ship pilotage operation by an integrated model of FRAM and DBN. Reliab. Eng. Syst. Saf. 2023, 229. [Google Scholar] [CrossRef]
- Zhang, L.; Wang, H.; Meng, Q.; Xie, H. Ship accident consequences and contributing factors analyses using ship accident investigation reports. Proc. Inst. Mech. Eng. Part O: J. Risk Reliab. 2019, 233, 35–47. [Google Scholar] [CrossRef]
- Otay, E.N.; Özkan, S. Stochastic Prediction of Maritime Accidents in the strait of Istanbul. In Proceedings of the 3rd International Conference on Oil Spills in the Mediterranean and Black Sea regions; 2003; pp. 92–104. [Google Scholar]
- Koromila, I.; Nivolianitou, Z.; Giannakopoulos, T. Bayesian network to predict environmental risk of a possible ship accident. In Proceedings of the 7th International Conference on PErvasive Technologies Related to Assistive Environments; 2014; pp. 1–5. [Google Scholar] [CrossRef]
- Zhang, C.; Zou, X.; Lin, C. Fusing XGBoost and SHAP models for maritime accident prediction and causality interpretability analysis. J. Mar. Sci. Eng. 2022, 10, 1154. [Google Scholar] [CrossRef]
- Fu, S.; Liu, Y.; Xi, Y.; Zhang, M.; Hu, S. Analysis of influencing factors on severity of ship accidents in ice-covered Arctic waters. China Safety Science Journal 2019, 29, 84. (in Chinese). [Google Scholar] [CrossRef]
- Baksh, A.-A.; Abbassi, R.; Garaniya, V.; Khan, F. Marine transportation risk assessment using Bayesian Network: Application to Arctic waters. Ocean Eng. 2018, 159, 422–436. [Google Scholar] [CrossRef]
- Chen, P.; Zhang, Z.; Huang, Y.; Dai, L.; Hu, H. Risk assessment of marine accidents with Fuzzy Bayesian Networks and causal analysis. Ocean Coast. Manag. 2022, 228. [Google Scholar] [CrossRef]
- Ventikos, N.P.; Giannopoulos, I.F. Assessing the Consequences from Marine Accidents: Introduction to a Risk Acceptance Criterion for Greece. Hum. Ecol. Risk Assessment: Int. J. 2013, 19, 699–722. [Google Scholar] [CrossRef]
- Chen, J.; Bian, W.; Wan, Z.; Yang, Z.; Zheng, H.; Wang, P. Identifying factors influencing total-loss marine accidents in the world: Analysis and evaluation based on ship types and sea regions. Ocean Eng. 2019, 191, 106495. [Google Scholar] [CrossRef]
- Chen, J.; Zhang, F.; Yang, C.; Zhang, C.; Luo, L. Factor and trend analysis of total-loss marine casualty using a fuzzy matter element method. Int. J. Disaster Risk Reduct. 2017, 24, 383–390. [Google Scholar] [CrossRef]
- Nivolianitou, Z.; Leopoulos, V.; Konstantinidou, M. Comparison of techniques for accident scenario analysis in hazardous systems. J. Loss Prev. Process. Ind. 2004, 17, 467–475. [Google Scholar] [CrossRef]
- Wang, W.; Jiang, X.; Xia, S.; Cao, Q. Incident tree model and incident tree analysis method for quantified risk assessment: An in-depth accident study in traffic operation. Saf. Sci. 2010, 48, 1248–1262. [Google Scholar] [CrossRef]
- Liu, P.; Yang, L.; Gao, Z.; Li, S.; Gao, Y. Fault tree analysis combined with quantitative analysis for high-speed railway accidents. Saf. Sci. 2015, 79, 344–357. [Google Scholar] [CrossRef]
- Ung, S.-T. Evaluation of human error contribution to oil tanker collision using fault tree analysis and modified fuzzy Bayesian Network based CREAM. Ocean Eng. 2019, 179, 159–172. [Google Scholar] [CrossRef]
- Ahn, Y.-J.; Yu, Y.-U.; Kim, J.-K. Accident cause factor of fires and explosions in tankers using fault tree analysis. J. Mar. Sci. Eng. 2021, 9, 844. [Google Scholar] [CrossRef]
- Kim, K.-I.; Jeong, J.S.; Lee, B.-G. Study on the analysis of near-miss ship collisions using logistic regression. J. Adv. Comput. Intell. Intell. Informatics 2017, 21, 467–473. [Google Scholar] [CrossRef]
- Yu, H.; Khan, F.; Veitch, B. A flexible hierarchical Bayesian modeling technique for risk analysis of major accidents. Risk Anal. 2017, 37, 1668–1682. [Google Scholar] [CrossRef]
- Hänninen, M. Bayesian networks for maritime traffic accident prevention: Benefits and challenges. Accid. Anal. Prev. 2014, 73, 305–312. [Google Scholar] [CrossRef] [PubMed]
- Abistado, K.G.; Arellano, C.N.; Maravillas, E.A. Weather forecasting using artificial neural network and Bayesian network. Journal of Advanced Computational Intelligence and Intelligent Informatics 2014, 18, 812–817. [Google Scholar] [CrossRef]
- Wang, J.; Zhang, M.; Huang, X.; Chen, J. Scenario analysis of road transportation accidents of inflammable and explosive hazardous chemicals. China Safety Science Journal 2019, 29, 171. (in Chinese). [Google Scholar] [CrossRef]
- Qiao, W.; Liu, Y.; Ma, X.; Liu, Y. Human factors analysis for maritime accidents based on a dynamic fuzzy Bayesian network. Risk analysis 2020, 40, 957–980. [Google Scholar] [CrossRef] [PubMed]
- Zhang, G.; Thai, V.V.; Yuen, K.F.; Loh, H.S.; Zhou, Q. Addressing the epistemic uncertainty in maritime accidents modelling using Bayesian network with interval probabilities. Saf. Sci. 2018, 102, 211–225. [Google Scholar] [CrossRef]
- Li, K.X.; Yin, J.; Bang, H.S.; Yang, Z.; Wang, J. Bayesian network with quantitative input for maritime risk analysis. Transp. A: Transp. Sci. 2012, 10, 89–118. [Google Scholar] [CrossRef]
- Wang, L.; Yang, Z. Bayesian network modelling and analysis of accident severity in waterborne transportation: A case study in China. Reliab. Eng. Syst. Saf. 2018, 180, 277–289. [Google Scholar] [CrossRef]
- Zou, X.; Yue, W.L. A bayesian network approach to causation analysis of road accidents using netica. J. Adv. Transp. 2017, 2017, 1–18. [Google Scholar] [CrossRef]
- Yuan, C.; Hu, Y.; Zhang, Y.; Zuo, T.; Wang, J.; Fan, S. Evaluation on consequences prediction of fire accident in emergency processes for oil-gas storage and transportation by scenario deduction. J. Loss Prev. Process. Ind. 2021, 72, 104570. [Google Scholar] [CrossRef]
- Zhao, J.; Xie, L.; Yang, Y.; Hu, X.; Ou, C.; Zeng, R. An ISM-BN based research on navigation risk factors of inland waterway vessels. China Safety Science Journal 2022, 32, 37. (in Chinese). [Google Scholar] [CrossRef]
- Afenyo, M.; Khan, F.; Veitch, B.; Yang, M. Arctic shipping accident scenario analysis using Bayesian Network approach. Ocean Eng. 2017, 133, 224–230. [Google Scholar] [CrossRef]
- Jiang, M.; Lu, J.; Yang, Z.; Li, J. Risk analysis of maritime accidents along the main route of the Maritime Silk Road: a Bayesian network approach. Marit. Policy Manag. 2020, 47, 815–832. [Google Scholar] [CrossRef]
- Si, D.; Zhang, J.; Lang, K. Causation analysis of container ship collision accidents based on improved BN. China Safety Science Journal 2019, 29, 31. (in Chinese). [Google Scholar] [CrossRef]
- Fan, S.; Yang, Z.; Blanco-Davis, E.; Zhang, J.; Yan, X. Analysis of maritime transport accidents using Bayesian networks. Proc. Inst. Mech. Eng. Part O: J. Risk Reliab. 2020, 234, 439–454. [Google Scholar] [CrossRef]
- Hänninen, M.; Banda, O.A.V.; Kujala, P. Bayesian network model of maritime safety management. Expert Syst. Appl. 2014, 41, 7837–7846. [Google Scholar] [CrossRef]
- Zhao, X.; Yuan, H.; Yu, Q. Autonomous vessels in the Yangtze river: A study on the maritime accidents using data-driven bayesian networks. Sustainability 2021, 13, 9985. [Google Scholar] [CrossRef]
- Acharya, T.D.; Yoo, K.W.; Lee, D.H. GIS-based spatio-temporal analysis of marine accidents database in the coastal zone of Korea. J. Coast. Res. 2017, 79, 114–118. [Google Scholar] [CrossRef]
- Uğurlu, Ö.; Köse, E.; Yıldırım, U.; Yüksekyıldız, E. Marine accident analysis for collision and grounding in oil tanker using FTA method. Marit. Policy Manag. 2015, 42, 163–185. [Google Scholar] [CrossRef]
- Antão, P.; Teixeira, A.; Soares, C.G. Statistical characterization of risk influencing factors in ship collision accidents. In Developments in Maritime Technology and Engineering; CRC Press, 2021; pp. 221–229. [Google Scholar] [CrossRef]
- Magda, B. Fires as a cause of ship accidents-a statistical approach. Safety & Fire Technology 2015, 37, 171–180. [Google Scholar]
- Li, H.; Ren, X.; Yang, Z. Data-driven Bayesian network for risk analysis of global maritime accidents. Reliab. Eng. Syst. Saf. 2023, 230. [Google Scholar] [CrossRef]
- Huang, D.-Z.; Hu, H.; Li, Y.-Z. Spatial analysis of maritime accidents using the geographic information system. Transp. Res. Rec. J. Transp. Res. Board 2013, 2326, 39–44. [Google Scholar] [CrossRef]
- Friedman, N. Geiger, D., Goldszmidt, M. Bayesian network classifiers. Machine learning 1997, 29, 131–163. [Google Scholar] [CrossRef]
- Chow, C.; Liu, C. Approximating discrete probability distributions with dependence trees. IEEE Trans. Inf. Theory 1968, 14, 462–467. [Google Scholar] [CrossRef]
- International Maritime Organization-Global Integrated Shipping Information System. Marine Casualties and Incidents. Available online: https://gisis.imo.org/Public/MCI/Default.aspx. (accessed on 21 June 2022).
- Zhu, L.; Lu, L.; Zhang, W.; Zhao, Y.; Song, M. Analysis of accident severity for curved roadways based on bayesian networks. Sustainability 2019, 11, 2223. [Google Scholar] [CrossRef]
- Liu, L.; Ye, X.; Wang, T.; Yan, X.; Chen, J.; Ran, B. Key factors analysis of severity of automobile to two-wheeler traffic accidents based on bayesian network. Int. J. Environ. Res. Public Heal. 2022, 19, 6013. [Google Scholar] [CrossRef]
- Zhang, Y.; Sun, X.; Chen, J.; Cheng, C. Spatial patterns and characteristics of global maritime accidents. Reliab. Eng. Syst. Saf. 2020, 206, 107310. [Google Scholar] [CrossRef]
Figure 1.
Initial structure of TAN model.
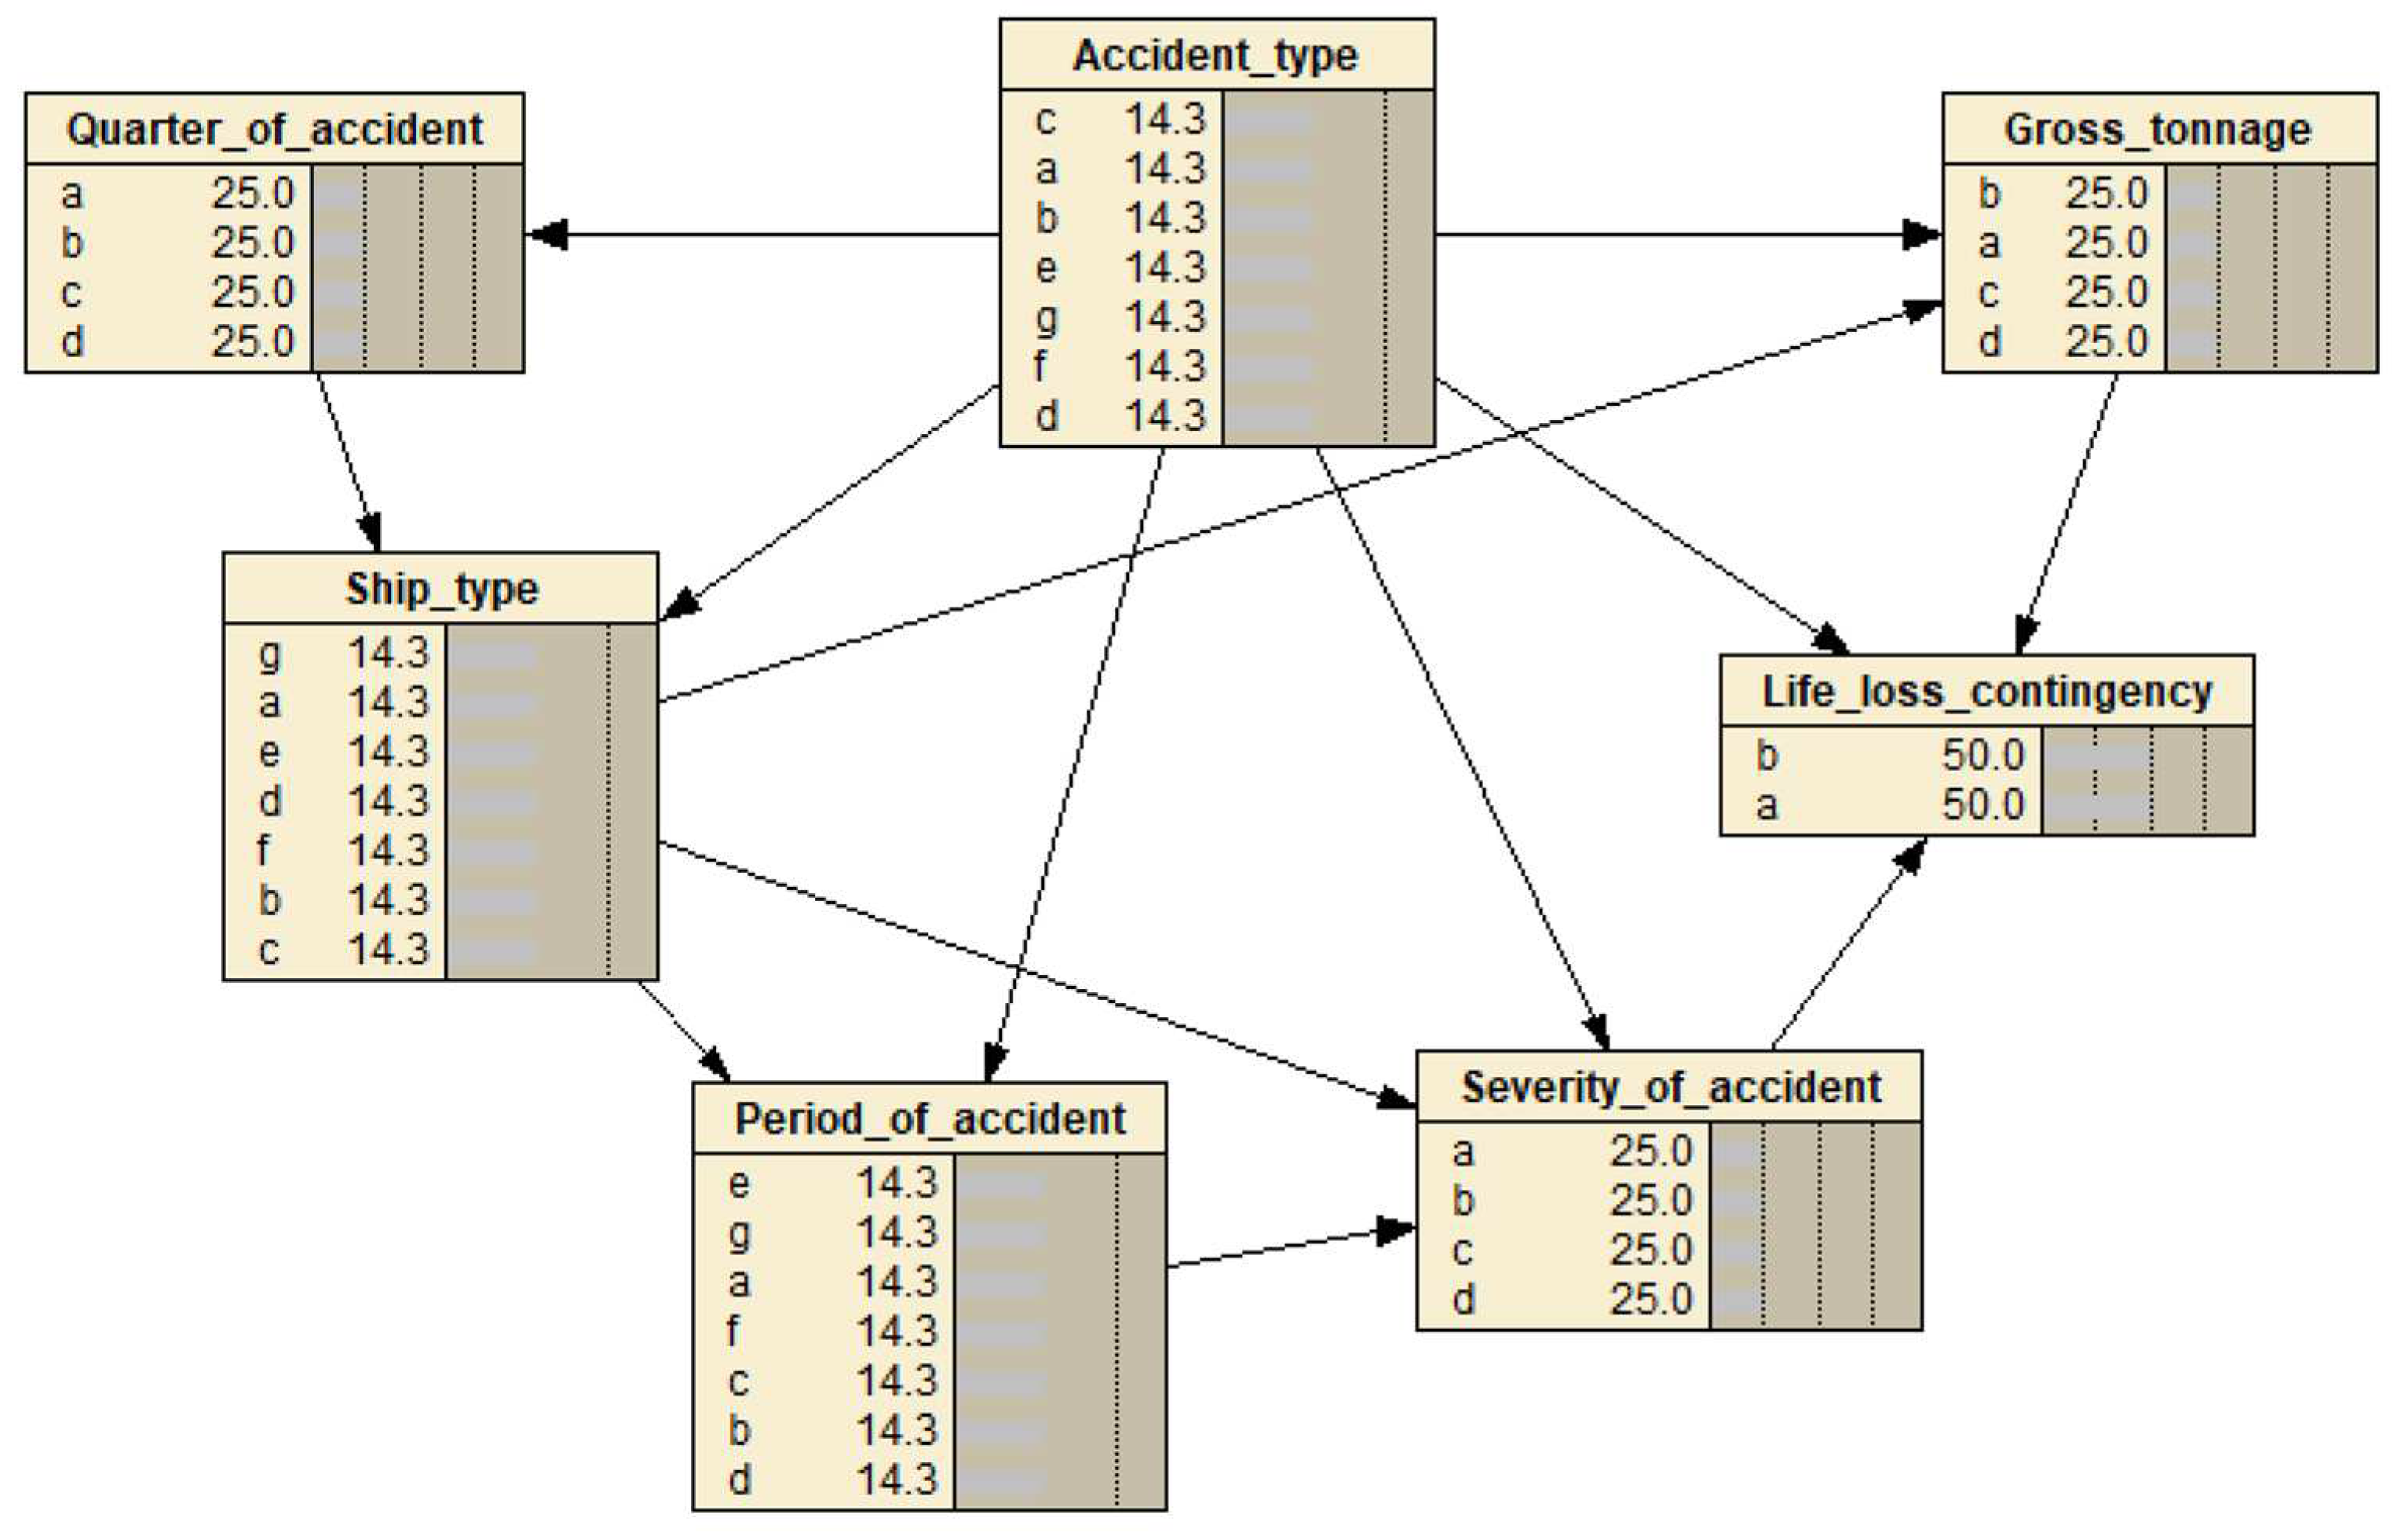
Figure 2.
TAN of vessel navigation risk.

Figure 3.
Event model validation.

Figure 4.
Analysis of the accident chain with characteristics "Q1, general cargo ships, gross ship tonnage set to 1-18500".
Figure 4.
Analysis of the accident chain with characteristics "Q1, general cargo ships, gross ship tonnage set to 1-18500".
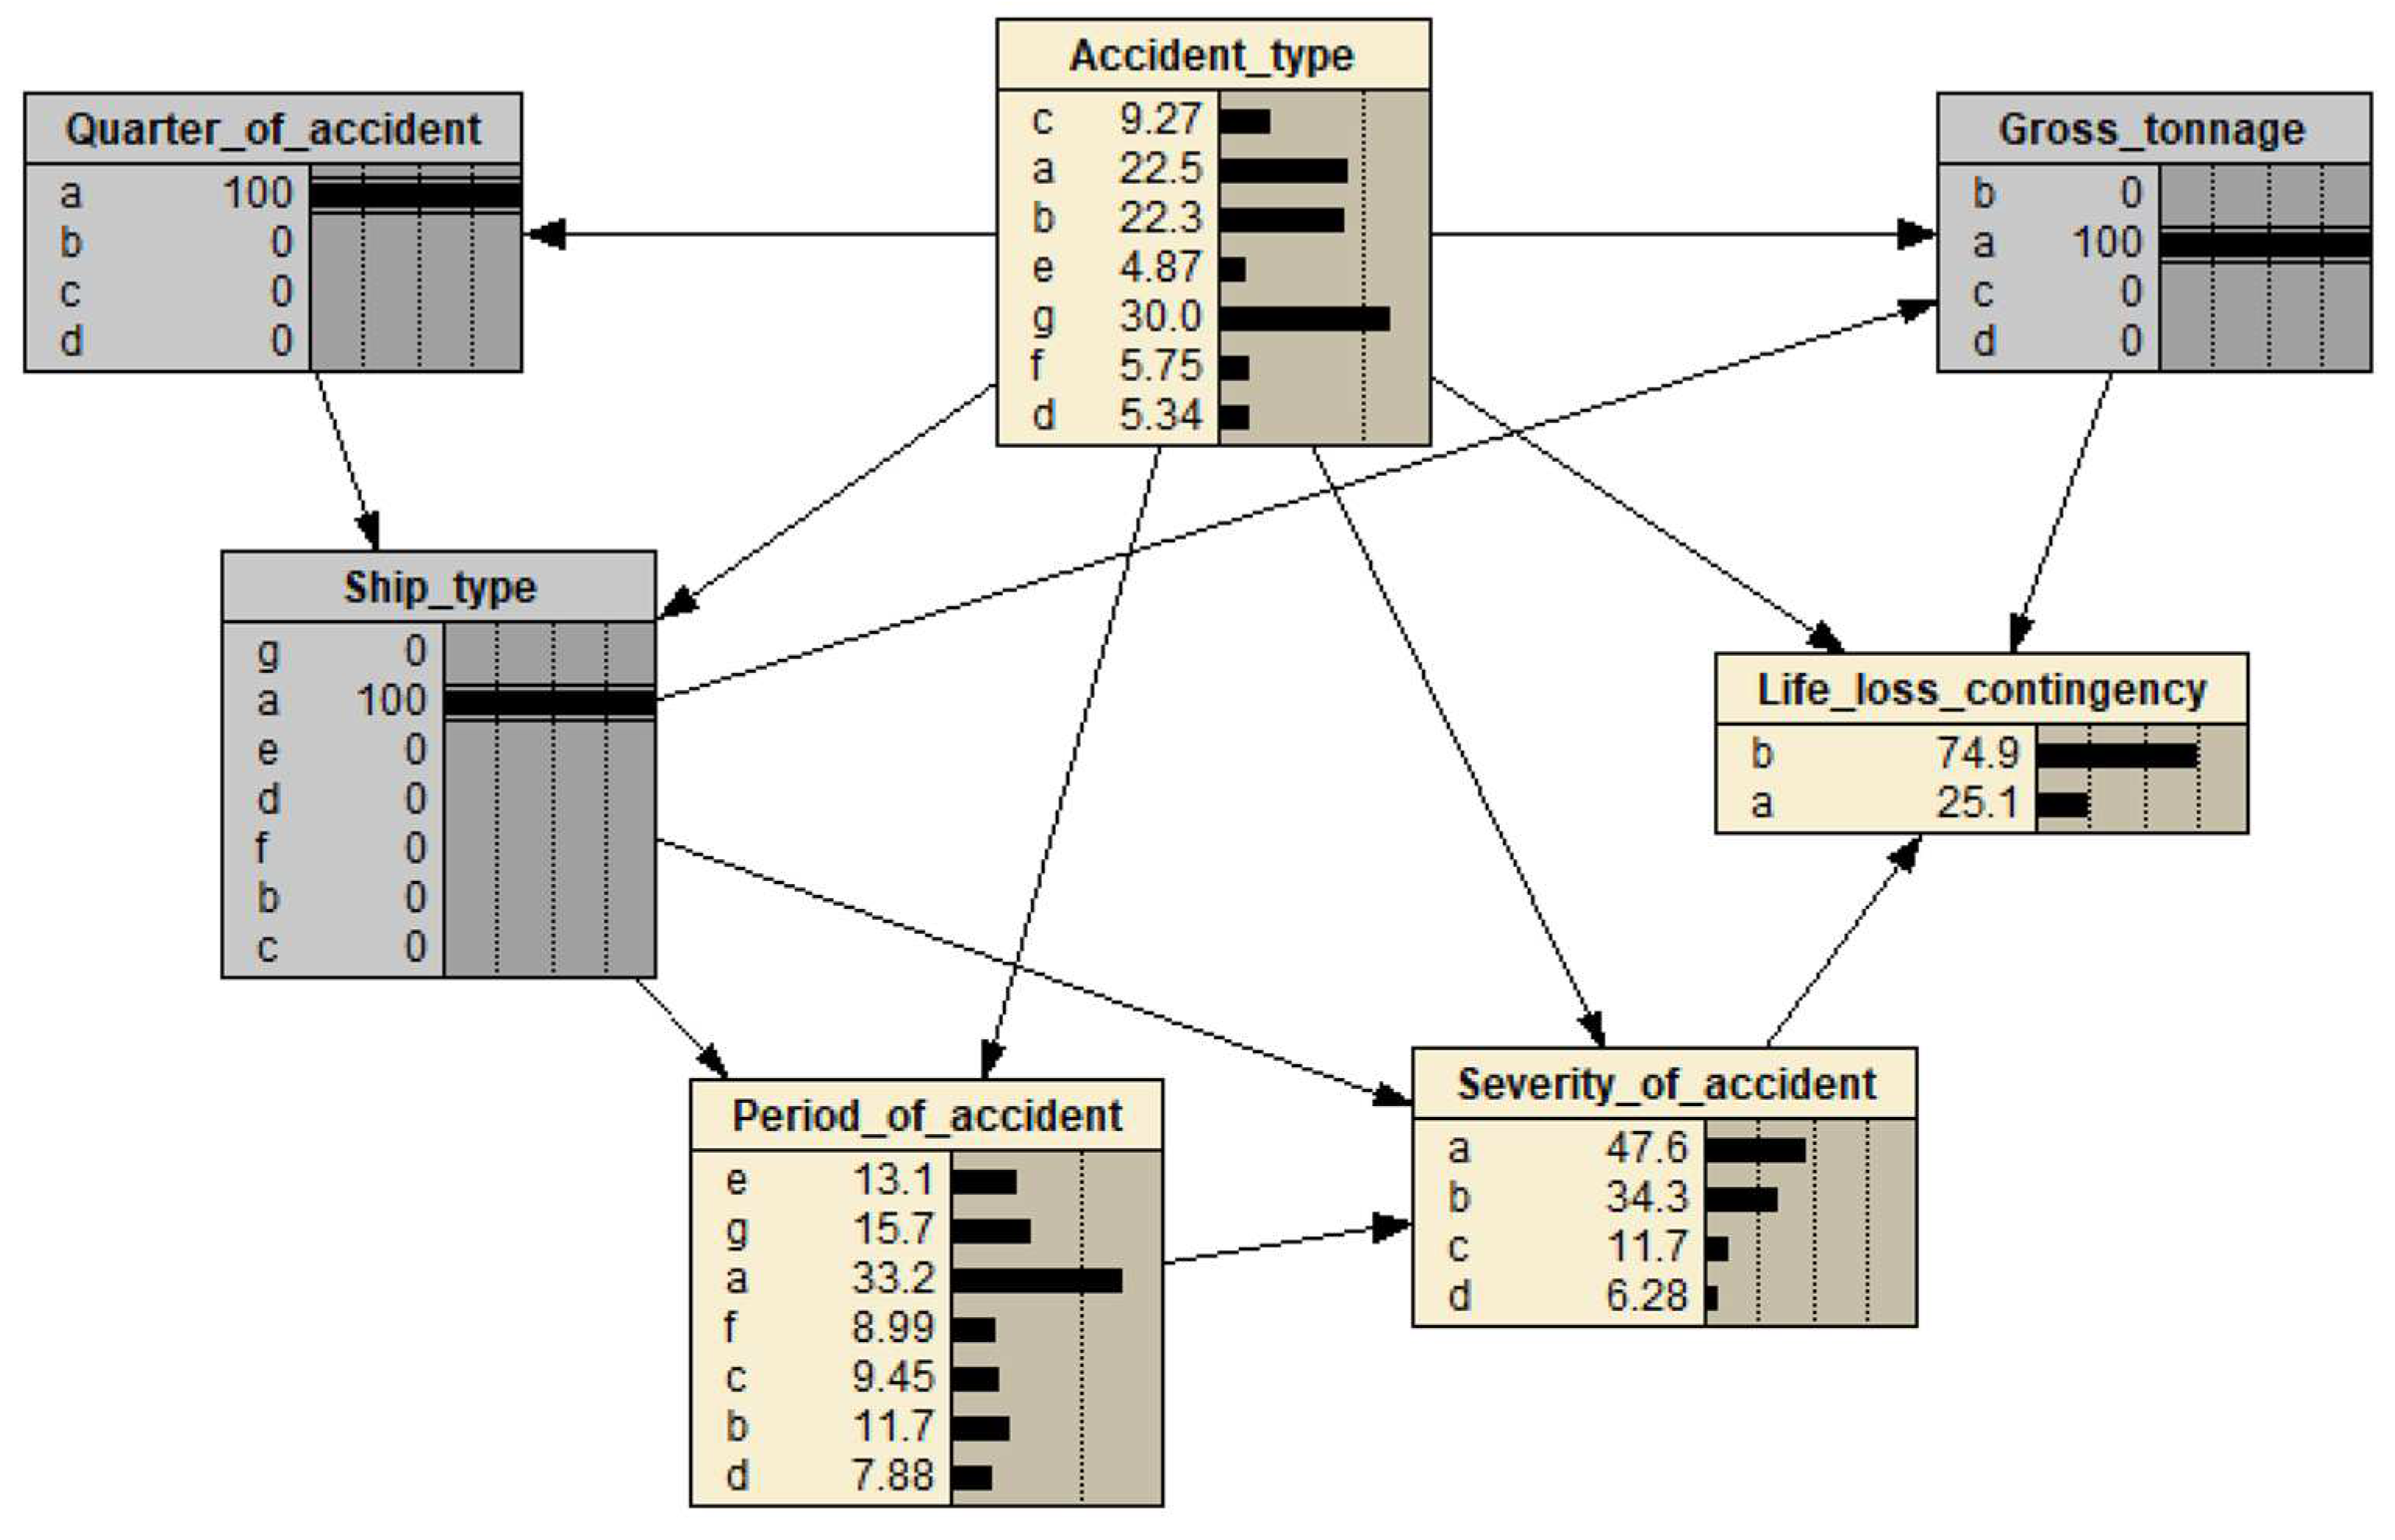
Figure 5.
The posterior probability of "accident types and accident severity" in specific accident scenarios.
Figure 5.
The posterior probability of "accident types and accident severity" in specific accident scenarios.
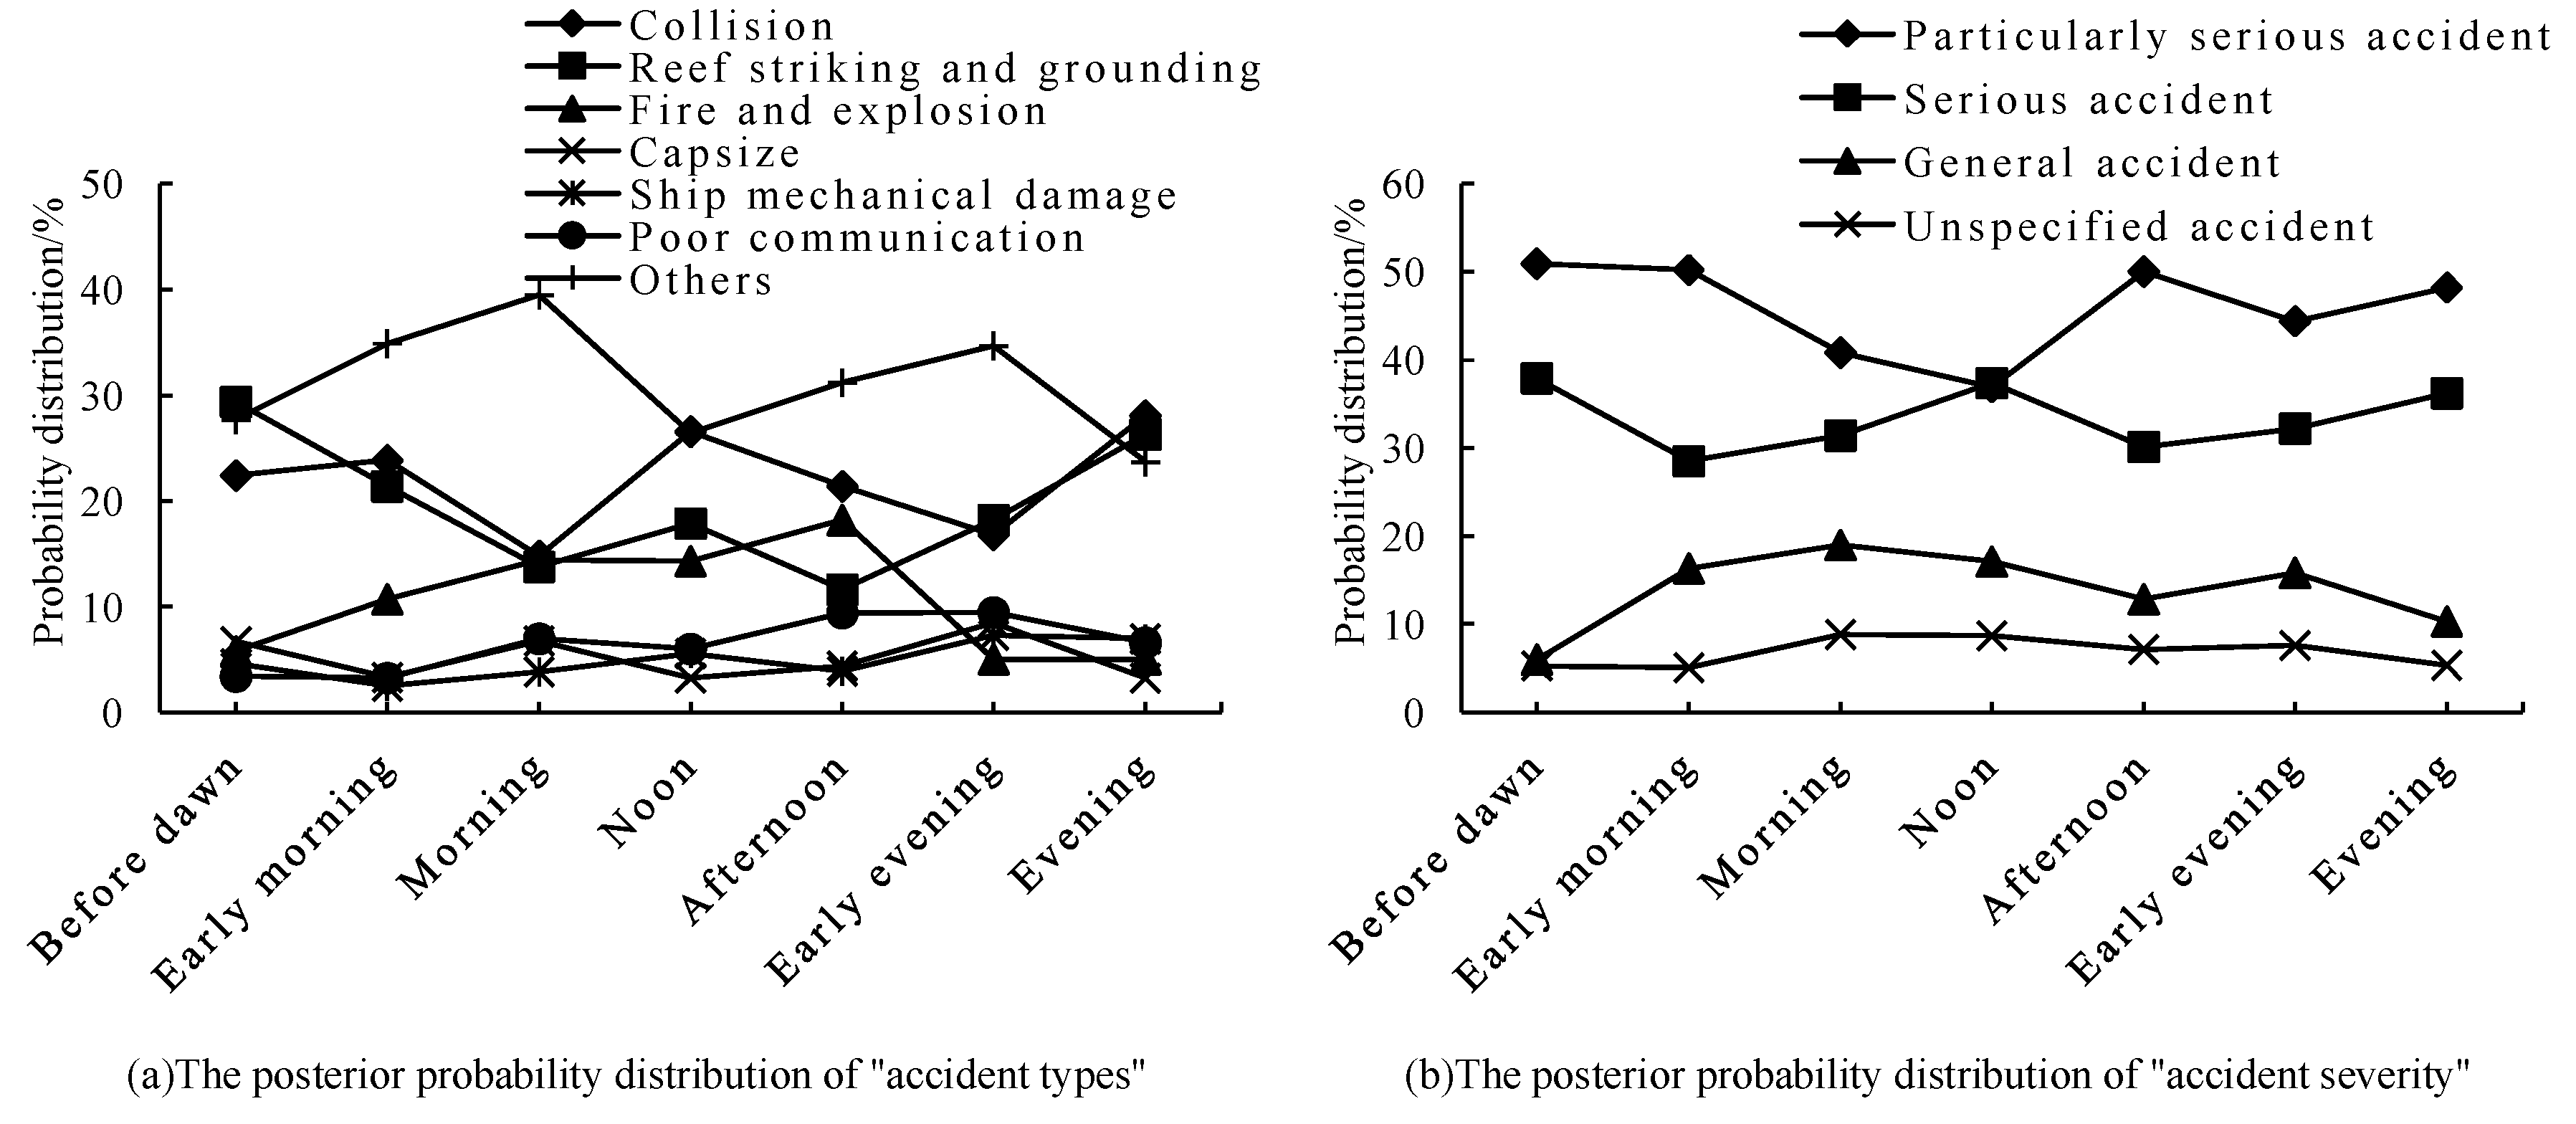
Figure 6.
Analysis of accident scenarios with characteristics "collision, general accident, no loss of life involved".
Figure 6.
Analysis of accident scenarios with characteristics "collision, general accident, no loss of life involved".


Table 1.
Variables for building BN.
| Variable Name | Classification | Frequency | Percentage/% | Variable Name | Classification | Frequency | Percentage/% |
|---|---|---|---|---|---|---|---|
| Accident quarter | a (the first quarter) | 1539 | 27.19 | Ship type | a (general cargo ship) | 989 | 17.47 |
| b (the second quarter) | 1353 | 23.90 | b (bulk carrier) | 255 | 4.50 | ||
| c (the third quarter) | 1406 | 24.84 | c (container ship) | 370 | 6.54 | ||
| d (the fourth quarter) | 1362 | 24.06 | d (chemical tanker/oil tanker) | 537 | 9.49 | ||
| Accident time | a (dawn 0-5 a.m.) | 1954 | 34.52 | e (passenger ship) | 453 | 8.00 | |
| b (early morning 5-8 a.m.) | 562 | 9.93 | f (fishing vessel) | 634 | 11.20 | ||
| c (morning 8-11p.m.) | 693 | 12.24 | g (other) | 2422 | 42.79 | ||
| d (noon 11-13 p.m.) | 427 | 7.54 | Vessel gross tonnage | a (gross tonnage [1,18500]) | 4011 | 70.87 | |
| e (afternoon 13-16 p.m.) | 647 | 11.43 | b (gross tonnage [18501,57500]) | 1219 | 21.54 | ||
| f (early evening 16-19 p.m.) | 540 | 9.01 | c (gross tonnage [57501,120000]) | 340 | 6.00 | ||
| g (evening 19-24 p.m.) | 837 | 14.79 | d (gross tonnage [120001,403342]) | 90 | 1.59 | ||
| Accident type | a (collision) | 1016 | 17.95 | Life loss contingency | a (life loss) | 1651 | 29.17 |
| b (reefed and stranded) | 823 | 14.54 | b (no life loss) | 4009 | 70.83 | ||
| c (fire and explosion) | 754 | 13.32 | Accident severity | a (particularly serious accidents) | 2837 | 50.12 | |
| d (capsize) | 365 | 6.45 | b (serious accidents) | 2034 | 35.94 | ||
| e (ship's machinery damage) | 287 | 5.07 | c (general accident) | 622 | 10.99 | ||
| f (poor communication) | 281 | 4.96 | d (unspecified accident) | 167 | 2.95 | ||
| g (other) | 2134 | 37.70 | |||||
Table 2.
Mutual information shared with "accident type".
| Nodes | Mutual Information Value | Percentage /% | Variance |
|---|---|---|---|
| Life loss contingency | 0.14246 | 5.800 | 0.0176774 |
| Accident severity | 0.14033 | 5.710 | 0.0088289 |
| Ship type | 0.04235 | 1.720 | 0.0013155 |
| Vessel gross tonnage | 0.02096 | 0.853 | 0.0004918 |
| Time period | 0.02006 | 0.817 | 0.0012170 |
| Quarter | 0.00421 | 0.171 | 0.0000869 |
Table 3.
State values of real event factor variables.
| Variables | Event Number | ||
|---|---|---|---|
| 1 | 2 | 3 | |
| Quarterly | c | a | b |
| Time period | e | b | g |
| Ship type | g | a | g |
| Life loss contingency | a | b | b |
| Accident severity | a | b | c |
| Vessel gross tonnage | b | a | b |
| Accident type | g | b | a |
| Accident probability | 75.1% | 38.0% | 44.4% |
Disclaimer/Publisher’s Note: The statements, opinions and data contained in all publications are solely those of the individual author(s) and contributor(s) and not of MDPI and/or the editor(s). MDPI and/or the editor(s) disclaim responsibility for any injury to people or property resulting from any ideas, methods, instructions or products referred to in the content. |
© 2023 by the authors. Licensee MDPI, Basel, Switzerland. This article is an open access article distributed under the terms and conditions of the Creative Commons Attribution (CC BY) license (http://creativecommons.org/licenses/by/4.0/).
Copyright: This open access article is published under a Creative Commons CC BY 4.0 license, which permit the free download, distribution, and reuse, provided that the author and preprint are cited in any reuse.


