Submitted:
16 June 2023
Posted:
19 June 2023
You are already at the latest version
Abstract
Equine Asthma Syndrome (EAS) is a common respiratory problem that affects horses of any age. In the severe EAS form (historically referred to as recurrent airway obstruction or RAO) the diagnosis, based mainly on history and clinical signs, it is definitively confirmed by the cytological examination of the bronchoalveolar lavage (BAL), also very useful in monitoring lower airway inflammation in response to environmental management and medication. Cytocentrifugated preparation is usually the staging method for the BAL cytological interpretation. To evaluate whether the BAL cytology in horses with severe EAS under different environmental conditions and before and after treatment can undergo significant changes, and at the same time to investigate whether in the cytological evaluation of the BAL there are interpretative differences between two methods of smear preparation of the collected fluid, a study was carried out on a series of BAL samples (n=48) collected in 8 withdrawals from 6 EAS-affected horses subjected to process exacerbation through environmental stimuli and then to pharmacological treatment. Each BAL fluid collected was equally divided into duplicate portions: one set up by cytocentrifugation and one by sediment from simple centrifugation. The cytological examination revealed any significant difference between the EAS-affected horses in all experimental phases (asymptomatic, early exacerbation phase, late exacerbation phase, and remission phase). Diagnostic interpretive comparison between the two BAL preparations then showed no significant differences in results, suggesting how they can be used indifferently in the evaluation of BAL under conditions of airway inflammation in the horse. Thus, the concentrated smear preparation appears to be an equally diagnostically useful method in conditions where there is no possibility of using an appropriate cytocentrifuge.
Keywords:
BAL
; Equine Asthma Syndrome
; cytocentrifugation
; smear
; cytology
; horse
1. Introduction
Bronchoalveolar lavage (BAL) is currently the most widely used method to assess the presence and type of cells in the lower respiratory tract and constitutes a valuable tool both when used for research purposes and for clinical investigations [1]. It was first used in the dog and later adapted to the horse around the 1970s [2].
The widespread use owes credit to its wide versatility in diagnostic lung pathology, often providing a valuable aid in the formulation of the diagnosis [3]. BAL can be used, in fact, both for a cytologic assessment of the cell population present in the respiratory tree, as well as to perform a culture examination to confirm the septic nature of the lung disease and to identify the pathogen [4], and additionally for analysis of proinflammatory cytokines by biomolecular investigations [5,6,7,8,9].
Among non-infectious inflammatory small airway respiratory disease, recently defined under the term “Equine Asthma” Syndrome (EAS) and common cause of poor performance in the horse, have been described two primary manifestations: a mild/moderate form, referred also as to inflammatory airway disease or IAD, and the severe from, previously referred to as recurrent airway obstruction (RAO), or heaves [10,11].
In the severe form of EAS, the analysis of bronchoalveolar lavage fluid represents a fundamental element that, associated with history, clinical examination, and collateral diagnostic investigations with additional tests, such as an airway endoscopy or lung function evaluation, can confirm and further characterize the diagnostic suspect [10,11,12,13,14]. BAL fluid cytology is also used to monitor lower airway inflammation in response to environmental management and medication in horses with severe EAS [15]. Currently, little is known about the degree and type of BAL fluid inflammation, during the different phases of the disease (asymptomatic, exacerbation and remission phase).
The definitive diagnosis of severe EAS is usually based with the presence of lower airway inflammation, characterized by total nucleated cell count with moderate to severe increased numbers of neutrophils (> 20-25%) [16,17,18] as well as decreased lymphocytes and macrophages [10,12,19]. However, proportion of macrophages and lymphocytes are proven not to be clinically relevant for the diagnosis of EAS [20].
Currently, the ‘gold-standard’ technique for processing BAL and making it suitable for reading and differential cell counting under the light microscope, which is necessary for diagnostic purposes, involves the use of a cytocentrifuge, a specific centrifuge for cytological fluid that is still a major obstacle important for smaller facilities, which therefore necessarily have to rely on well-equipped laboratories and send there the samples properly stored [1,21].
About equine BAL sampling and preparation, literature data shows that there are only very few studies carried out to date for the purpose of attempting to find an effective alternative to the use of cytocentrifuge [1,21]. In those studies, the authors [1,21] however, concluded how there are qualitative and quantitative differences between cytocentrifugated and sedimented smear preparations, but not such as to invalidate their diagnosis, especially in what concerns inflammatory lung neutrophilic disease [21].
The aim of this study is to contribute to the knowledge regarding the potential concordance of diagnostic results in manual differential cell counts between preparations set up by cytocentrifugation and preparations set up by smear from simple sediment centrifugation in horse BAL. To do this, serial BAL pooled sampling was performed in six horses with EAS during different phases of an experimental challenge of exacerbation and remission of the severe inflammatory lower airway disease. From each of them, cytological smears were set up in duplicate using the two techniques (cytocentrifugated and sedimented smear) and submitted for observation and cytological counts, obtaining a good concordance between the two methods and thus allowing us to state that in horse BAL fluid the sedimented smear may represent a valid and economical alternative to the use of cytocentrifuge, at least for neutrophilic inflammatory airway diseases of the horse.
At the same time, this study also made it possible to investigate the cytological morphology of BAL at the different phases (asymptomatic, exacerbation and remission) of severe EAS, allowing us to conclude that in the same horse there were no significant differences throughout the challenge and in being able to define the effectiveness of therapy.
2. Materials and Methods
2.1. Horses
Eleven animals were used in the study: six horses with asymptomatic EAs (five Italian Saddle horses and one Appaloosa, four mares and two geldings, 15.7 ± 1.9-year-old, with body weight ranging from 400 to 520 kg).
Horses lived outdoors and had a history of signs of recurrent acute onset of asthma when housed in a stable with wood chips for bedding and hay for feed. None of the horses received any medications for at least three months prior to evaluation. Throughout the experimental time, a daily clinical examination was performed.
2.2. Experimental Design
EAS-affected horses were in the asymptomatic phase for at least 6 months, during which they had lived in paddocks and in absence of any pharmacological treatment.
Upon admission, they were hospitalized for 6 days in the stable box, keeping the doors open with dedusted chip litter to maintain levels of environmental dust at minimum levels. During this period, they were executed three broncho-alveolar lavages (BAL), one on the first day of hospitalization, one on the next day and one two days later (T0, T1 and T2) (Figure 1).
Seven days after admission, patients were placed in a stimulating environment (challenge) that stimulated immediate changes in lung function by inducing an inflammatory stimulus in susceptible horses. Specifically, the challenging environment involved closing the barn doors, placing a fixed straw bedding that has not been changed, and having stable staff turn the bedding once a day to increase environmental dust. In this environment they were left for six days. During the challenge, four BAL extractions were performed on all subjects one day apart, the first one the day after the start of the challenge (T3, T4, T5 and T6) (Figure 1).
At the end of this period, the desensitization phase began, lasting 4 days, during which the doors of the shelter, the straw bedding was replaced with wood shavings and the subjects were treated pharmacologically with dexamethasone (0.1 mg /kg) [22]. At the end of the four days, the last sample of BAL was taken (T7) (Figure 1).
2.3. Broncho-Alveolar Lavage and Preparation of the Cytocentrifugation and Smears
The patients were sedated to perform bronchoalveolar lavage (acepromazine maleate 2mg/q; detomidine HCl 1mg/q) and the procedure was carried out by administering 350 mL of heated physiological solution through a Kruuse bronchoalveolar lavage catheter (Kruuse, World veterinary supplier, Denmark. Size: 2.5 mm inner diameter, 10 mm outer diameter, length 240cm).
Pooled BAL fluid recovered from each subject (ca 70mL from each horse) was evaluated macroscopically to ascertain the presence of foam (indication of the presence of surfactant) and to evaluate turbidity, color and presence of macroscopically visible agglomerates of material. The sample was then immediately refrigerated at a temperature of +4C° then centrifuged within 3 hours of collection.
For the preparation of the Cytospin (Shandon Cytospin 3, Shandon Scientific Ltd., Runcorn, Cheshire, Uk) samples in duplicate, 15-20 mL of BAL were cytocentrifugate for 10 minutes at 1000 laps.
For sedimented smear preparations in duplicate, about 15-20 mL of BAL were centrifugate for 10 minutes at 1000 rpm. At the end of the cycle, the supernatant and the remaining portion of material was mixed gently, and one drop was smeared with a blood smear technique in a slide and left to air dry.
2.4. Cytology Stain and Evaluation Criteria
Slides from both processing methods, after drying in air, were stained with May-Grünwald Giemsa stain (MGG) (cat n. 04-090805, Bio-Optica, Milan, Italy).
For the evaluations of the cytological preparations, a special table was designed and used, composed of a grid on which the data coming from cytological observations and cell counts present in the two preparations (cytocentrifugation and smear) of the same sample (Table 1).
In all observation was performed initially at small magnification (10X), to evaluate the homogeneity and the presence and amount of mucus. The presence of mucus was recorded and quantified assigning each preparation, a score from 0 to 3, where 0 indicates the absence of mucus, 1 indicates mucus present in up to 30% of the material of which it is composed smear, 2 indicates mucus occupies 30 to 60% and 3 indicates mucus occupies more of 60% of the smear. Instead, a higher magnification (40X) was used to recognize the morphology and the peculiar characteristics of the different cell types [23]. Cells evaluated were cells of the inflammatory component (neutrophils, mast cells, lymphocytes, macrophages and eosinophils). Moreover, we recorded also the presence and morphological appearance of the epithelial cells, but, since they were presence in small number and in a very limited quantity of samples, they have been excluded from the total count.
From each slide, 5 fields were then selected and evaluated.
2.5. Statistical Analysis
Statistical analysis was performed with a commercially available program (GraphPad Prism 5, GraphPad Software, San Diego, CA, USA). Assessment of data for normality was calculated by applying the D’Agostino-Pearson test. Data were expressed as median (minimum-maximum). A Mann–Whitney test (two tail p-value) was applied to perform a comparison between the two cytological methods. The significance was set for p<0.05.
3. Results
3.1. Caseload
The case series consisted of 6 subjects from mixed breeds and sexes (4 females and 2 castrated males) with an average age of 15.7+1.9 years. Thirty-seven pairs of specimens, out of a total of 96 preparations, derived in duplicate from 2 pairs of samples (one cytocentrifugated and one smear) were collected eight times for each of the 6 horses.
Two types of assessments were made on all observed preparations:
1) morphological (cell morphology, homogeneity of cells, and presence of other cells);
2) cell counts.
A total of 12 preparations (12.5%) were considered unsuitable for reading, because they were poorly cellular or because of morphological features (staining, excess overlap) that made identification doubtful of the cells.
3.2. Cell Morphology, Homogeneity of the Samples and Presence of Mucus, Epithelial and Inflammatory Cells
Cell morphology was appreciably better in the cytocentrifugated preparations, where the different cell types were more rapidly and easily recognized. Indeed, in such preparations, the cells appeared sharper and more defined, the colors sharper, and there was less overlap between one cell and another. Sedimented smear preparations, on the contrary, were characterized by cells that were slightly smaller in size small, darker in color, and with less sharp contours.
Cytocentrifugated preparations were highly cellular and presented as a uniform dot. The smear cells, on the other hand, were often distributed in an unevenly, alternating portions characterized by significant presence of cells, to portions of the slide that were almost empty.
The amount of mucus was normally more abundant in the concentrated smear than in the cytocentrifugated smears, with a few single exceptions. In the cytocentrifuged preparations, the mucus usually appeared as aggregates of light pink material against the background of the cellular mat. The smear, on the other hand, was characterized by conspicuous filaments of a deep pink color that trapped a significant number of cells.
Epithelial cells were observed in 3 specimens (3%) and in minimal amounts (1 or 2 cells at most per slide). Morphologically they appeared as cells with a high nucleus-to-cytoplasm ratio and rounded nucleus. They showed no atypia.
3.3. Cell Count and Mucus Estimation
Differential cell count results are detailed in tables (Tables S1–S8). For each cell category, cell counts were performed under a microscope light microscope of the cells present in 5 fields at 40X magnification. Each count was averaged, expressed as a percentage of the total cells counted.
For each preparation, an estimate was also made of the amount of mucus present. Of the total number of specimens in which it was possible to estimate the presence of mucus (45/48, 94 % for cytocentrifugate; 39/48, 81 % for sedimented smear) it was resulted that in the cytocentrifugates 4/45 (9 %) had mucus amount of 0, 14/45 (31%) an amount of 1, 21/45 (47%) an amount of two and 6/45 (13%) an amount of 3. In the concentrated smears, on the other hand, 5/39 (13%) presented an amount of mucus equal to 0, 1/39 (2%) an amount equal to 1, 7/39 an amount of 2 and 26/39 (67%) an amount of 3.
The results of the assessments were used to perform statistical analysis of the data divided into concordance between the two methods (1), evaluation of the cytology according to the clinical stage of the disease (2), repeatability of the count cell counts (3).
3.3.1. Concordance between the Two Methods
Concordance for the variable "Neutrophils": the Concordance correlation Coefficient (ρc) calculated for the neutrophil parameter is 0.76. The level of accuracy based on Pearson's Coefficient and the accuracy considering the bias factor are 0.81 and 0.94, respectively (Figure 5).
Concordance for the variable "Lymphocytes": the Concordance correlation Coefficient (ρc) calculated for the parameter lymphocytes is 0.65. The level of precision based on Pearson's Coefficient and accuracy considering the factor of bias are 0.70 and 0.92, respectively (Figure 6).
Concordance for the variable "Macrophages": the Concordance correlation Coefficient (ρc) is 0.59. The level of accuracy based on Pearson's Coefficient and the accuracy considering the Bias factor are 0.67 and 0.89, respectively (Figure 7).
Concordance between for the variables "Mast cells" and "Eosinophils": for the variables "Mast cells" and "Eosinophils" could not be evaluated due to the paucity of data. Concordance for the variable "Mucus": the parameter K used to evaluate the concordance of mucus between the two techniques was found to be 0.2.
3.3.2. Evaluation of Cytology According to the Clinical Stage of the Disease
The data showed no statistically significant results between cytology and clinical stage in the different phases of EAS (neutrophils P= 0.23; lymphocytes P= 0.22; macrophages P= 0.82 and mast cells P=0.43).
3.3.3. Repeatability of Cell Count
The evaluation of cell count repeatability was carried out on two randomly selected pairs of samples. For each cell category, the Coefficient of Variability (CV) in percent was calculated. The percentage CV value was found to be well below the threshold value considered acceptable for repeatability of laboratory tests (<25%) In all cases, in fact, the CV value was between 0 and 1, indicating a very high repeatability of the count (Table 2).
4. Discussion
In bronchoalveolar lavage fluid samples, the standardization of sampling procedure and cytological interpretation is of crucial importance and is required to compare the results between laboratories. Different studies described different techniques for BAL collection in EAS, regarding lavage volume, site of sampling, procedure for conservation and preparation of samples, of note, also the clinical importance of the presence of inflammatory and epithelial cells [18,20,21,24,25,26,27].
A volume of 250-500 mL of fluid instilled as one to the three bolus is the amount recommended by the international workshop on Equine chronic airway disease [28], and general guidelines recommended pooling all syringes for analysis [19].
Regional variation in BAL cytology, in particular the comparison between left and right lungs, have been investigated in different studies which have found controverse results. McGorum et al. (1993) [25], Meyer et al. (1998) [29] and Deniau (2010) [30] found no difference in BAL fluid from different regions of the right and left lung in both healthy and affected horses. Sweeney et al. (1992) [24] compared BAL cytology from both lungs in 23 healthy horses and found mast cells to be significantly higher in the left lung, whereas they were significantly higher in the right lung in the study by Jean et al. (2011) [18] who looked at five healthy and five recurrent airway obstruction-affected horses. Furthermore, Depecker et al. (2014) [31] demonstrate that BAL performed on one lung may not be representative of the other lung in the same horse. Recently, the use of one single cytology on a pooled BAL fluid sample from both individual lungs showed that this procedure constitutes a valid method in the diagnosis of the inflammatory forms of the lower airway[32].
Cytocentrifugation is the most common method of processing BAL for cytology; the result is a uniform monolayer of cells in one area focal length of a common microscope slide [32,33]. However, in veterinary literature there are not standardized protocols to define speed and time of centrifugation. In veterinary practice, because cytocentrifuge is quite expensive and requires specific equipment, the samples collected from the washing, properly stored, must be sent to a private laboratory for processing and preparation. In equine practice, BAL preparation method using used an easily available and inexpensive equipment (e.g., smears from sediment by centrifugation), which may result in an acceptable cytology quality, could offer a practical and equal alternative to cytocentrifugation, and make BAL cytology more accessible to the veterinary medical professionals.
In our study, between the two different types of samples (cytocentrifugate vs. sediment smears) analyzed by light microscopy, a clear difference in the homogeneity of the cell monolayer is observed. In the cytocentrifugates, in fact, the cells appear more evenly distributed, while in concentrated smears, on the contrary, there are greater differences in the distribution of the cells with more concentrated areas alternating with more rarefied areas. This characteristic could be due in part to the action of creeping during slide preparation and partly to the greater presence of mucus, which tends to trap a certain proportion of cells.
Cell concentration is another element in which there are appreciable differences between the two methods: cytocentrifuge preparations appear in many cases significantly more cellular at the same observation magnification than the corresponding smears, a fact probably related to the method and the greater concentration capacity of the cytocentrifuge.
As for cell morphology, the cells of the preparations by cytocentrifuge appear much more delineated and recognizable than those of the smears, and slightly larger in size, allowing the observer a more precise and quicker recognition of the cell category to which they belong, and thus saving some time. The cells within the smears, on the other hand, appear significantly smaller, darker (they retain more dye making the staining more intense) with less sharp borders, making their interpretation less immediate.
In the cytocentrifugated preparation, there is also less cellular overlap, a fact probably due in part to the intrinsic nature of the method and in part to the frequently lower presence of mucus noted than in the corresponding smears. The presence of less mucus is speculated to be due to a greater loss of the same within the machine during the process of centrifugation, also confirmed by the very low K value (0.21) for this variable.
The Coefficient of Variability (CV) for the repeatability of cell counts appears to be substantially superimposable both in the context of the individual method and in the comparison between the two methods themselves, and was therefore found to be nearly excellent, with values approaching 0%. Thus, although the morphological findings suggest a different degree of ease and immediacy to reading, this result would seem not to confirm the different weight on interpretation.
The evaluation of concordance between the two methods was carried out with a statistical processing involving the calculation of a correlation coefficient (Concordance Correlation Coefficient - ρc) usually used to assess the degree of concordance between laboratory methods on the same analyte, and is an analysis of extreme precision, whose threshold values are very high and set for generic analytical methods. In our case history, in which differential cell counts are compared in the same preparation and numerically expressed as a percentage of the total, values approaching 0.90 are still to be considered as very high. From the results that have emerged, we can therefore state that for granulocytes neutrophils the concordance tends to be high (0.8) and certainly higher than for the other components under evaluation. Precision and accuracy (0.8 and 0.9, respectively) turn out to be equally high. Lymphocytes (ρc=0.7; precision 0.7; accuracy 0.9) and macrophages (ρc= 0.6; precision 0.7; accuracy 0.9), have less concordant values. These data are almost superimposable from what has been reported so far in the veterinary literature [1,34].
Regarding the other cell categories, the presence of granulocytes eosinophils and mast cells was found to be lower than reported in other studies and in the literature [14,34]. Mast cells and eosinophils, although present in low numbers in all samples evaluated, regardless of the type of staging, were easily identified by their characteristic granules. This did not allow the data to be used for statistical processing for comparison, but the quantification of their presence allowed us to observe a slight decrease in numbers in sedimented smears that could be attributed in part to a greater ease of damage of these cells in the smears, in contrast more conserved in the cytocentrifugated preparations.
Their lower numbers in the smears also could also be partly justified by the fact that, if for greater reliability of the results it is suggested to count a number of cells equal to at least 300 cells in each field [14], this number was never reached in our study, where priority was given to accuracy in counting and recognizing morphology using high microscope magnification (40X). The results of the CV calculated count repeatability test allow us to validate the data of this study and to be able to state how there is then no substantial difference between cytocentrifugated and sedimented smears that would compromise the results.
Epithelial cells in this study were excluded from differential cell counts. A recent paper on the possible effects of inclusion or exclusion of epithelial cells in cytologic analyses (in BALs and tracheal washes) of horse respiratory diseases indicates that the presence of epithelial cells may affect count results and suggests how important it may be to include the explicitly state in equine respiratory studies[35]. To date, no consensus has been established on epithelial cell inclusion during cytology reporting of BAL sampling.
As for one of the purposes of this work, which was to try to understand whether the most accessible and inexpensive alternative to cytocentrifugation (the smear from sediment) allowed for overlapping results, the data obtained confirm how there is no substantial difference in the differential count and in the percentage, values obtained from it. Moreover, in both methods, the cytological evaluation allowed to find a percentage value of neutrophils greater than 5%, a threshold value that, together with the history, examination clinical and possibly endoscopic, helps to classify a subject as having neutrophilic lung disease [14]. These positive results are also supported by an excellent CV value for repeatability.
Mild to moderate forms of EAS may have increased mast cells and eosinophils, with a slight increase in neutrophils, while the severe form of EAS has been characterized by marked neutrophilic inflammation of the lower airway, in which neutrophils exceed 20% in BAL fluid cytology [10,32]. However, if on the one hand the BAL fluid cytology is able to disclose neutrophilic inflammation during the exacerbation of the disease [18], on the other hand, the inflammatory pattern should completely normalize during periods of remission, induced by antigen avoidance strategies [36,37].However, if on the one hand the BAL fluid cytology is able to disclose neutrophilic inflammation during the exacerbation of the disease [18], on the other hand, the inflammatory pattern should completely normalize during periods of remission, induced by antigen avoidance strategies [36,37].
Currently, little is known about the degree and type of BAL fluid inflammation during the different phases of the disease (asymptomatic, exacerbation and remission phase). The studies carried out on BAL and on endobronchial biopsy specimens have focused on biomolecular type investigations gene expression [38,39,40,41,42,43,44,45,46,47,48]. In a recent study performed by the same work team on the horses within the same experimental study [49] histological investigations from endoscopic biopsies taken serially from the bronchial tree at different stages of EAS also fails to first differentiate between the exacerbation and the remission phase, in which the histological conditions instead should return to normal, in the same way as BAL sampling.
When comparing cell counts on cytocentrifugated preparations between different times of sampling (corresponding to different phases of severe EAS) in our horses, the results obtained did not appeared statistically significant for any of the variables evaluated. The significance of the mean percentage values of cell counts referable to the variable neutrophils, however, are always in all cases above the 5% threshold that allows for the diagnosis of airway neutrophilic inflammatory disease anyway such as EAS. Thus, the cytologic evaluation, if on one hand a useful tool to identify preclinical and asymptomatic, appears on the other hand not sufficiently able to assess the progress of the disease and the effectiveness of the medical treatment (the sampling performed after 4 days of corticosteroids caused no significant alteration on the results of the differential cell count). The cytological results therefore do not correspond with the clinical stage of the disease in the EAS-horses of this study.
5. Conclusions
In conclusion, we believe we can state that for more in-depth studies where greater precision is required in identifying the exact number of cells contained in the preparation, the cytocentrifuge remains the reference standard technique. The BAL cytocentrifugated, in fact, appears morphologically of better preparation, of easier and quicker to read, although less representative of the amount of mucus.
In the face of high equipment costs, however, the smears on balance do not show significant differences in the total differential cell count and especially in the amount of individual cellular components, and they prove to be nevertheless as a viable, practical and inexpensive alternative to cytocentrifugated preparation, at least for the diagnosis of neutrophilic inflammatory diseases in ongoing.
Furthermore, the results of cytological observations of serial BALs in the experimental challenge at different stages of clinical expression of the disease revealed how there are no significant differences in terms of % of the different cellular components, and that clinical improvement related to corticosteroid treatment does not produce normalization of the cytological picture of BALs in a short time.
Further studies on a larger number of samples and on different types of lung diseases are needed to confirm and extend these findings to the diagnosis of all horse lung diseases, as well as further biomolecular investigations are needed to understand whether proinflammatory cytokines are able to provide additional information about the diagnosis and therapeutic approach of severe EAS.
Supplementary Materials
The following supporting information can be downloaded at: Preprints.org, Table S1-S8: Raw data of cytocentrifugated and sedimented smear cell count results at T0-T7.
Author Contributions
Conception and design of the work: M.M., M.P., A.P., N.R., and A.S.; acquisition, analysis, and interpretation of data: M.M., F.G., M.P., R.R., and C.M.; drafted the work: M.M. and F.G.; substantively revised the manuscript: M.M., F.G., M.P., A.P., N.R., and R.R. All authors have read and agreed to the published version of the manuscript.
Funding
This research has no external funding.
Institutional Review Board Statement
The study was approved by the Ethics and Scientific Committee of the Alma Mater Studiorum University of Bologna in the plenary session on 3 March 2009 (protocol n° 04/55/09) and submitted to the Italian Ministry of Health. All experimental procedures were carried out in accordance with European legislation regarding the protection of animals used for experimental and other scientific purposes (Council Directive 86/609/EEC).
Informed Consent Statement
Informed consent was obtained from all subjects involved in the study.
Data Availability Statement
All data generated or analyzed during this study are included in this published article. The raw datasets used and analyzed during the current study are available from the corresponding author on reasonable request.
Conflicts of Interest
The authors declare no conflict of interest.
References
- Lapointe, J.M.; Vrins, A.; Lavoie, J.P. Effects of Centrifugation and Specimen Preparation Technique on Bronchoalveolar Lavage Analysis in Horses. Equine Vet J 1994, 26, 227–229. [Google Scholar] [CrossRef]
- Hoffman, A.M. Bronchoalveolar Lavage: Sampling Technique and Guidelines for Cytologic Preparation and Interpretation. Vet Clin North Am Equine Pract 2008, 24, 423–435, vii–viii . [Google Scholar] [CrossRef]
- Mair, T.S.; Stokes, C.R.; Bourne, F.J. Cellular Content of Secretions Obtained by Lavage from Different Levels of the Equine Respiratory Tract. Equine Vet J 1987, 19, 458–462. [Google Scholar] [CrossRef]
- Cowell R.L., T.R.D. Diagnostic Cytology and Hematology of the Horse; Ed. Mosby Inc.: St. Louis, Missouri, USA, 2007. [Google Scholar]
- Bedenice, D.; Mazan, M.R.; Hoffman, A.M. Association between Cough and Cytology of Bronchoalveolar Lavage Fluid and Pulmonary Function in Horses Diagnosed with Inflammatory Airway Disease. J Vet Intern Med 2008, 22, 1022–1028. [Google Scholar] [CrossRef]
- Beekman, L.; Tohver, T.; Léguillette, R. Comparison of Cytokine MRNA Expression in the Bronchoalveolar Lavage Fluid of Horses with Inflammatory Airway Disease and Bronchoalveolar Lavage Mastocytosis or Neutrophilia Using REST Software Analysis. J Vet Intern Med 2012, 26, 153–161. [Google Scholar] [CrossRef]
- Hughes, K.J.; Nicolson, L.; Da Costa, N.; Franklin, S.H.; Allen, K.J.; Dunham, S.P. Evaluation of Cytokine MRNA Expression in Bronchoalveolar Lavage Cells from Horses with Inflammatory Airway Disease. Vet Immunol Immunopathol 2011, 140, 82–89. [Google Scholar] [CrossRef]
- Lavoie-Lamoureux, A.; Moran, K.; Beauchamp, G.; Mauel, S.; Steinbach, F.; Lefebvre-Lavoie, J.; Martin, J.G.; Lavoie, J.-P. IL-4 Activates Equine Neutrophils and Induces a Mixed Inflammatory Cytokine Expression Profile with Enhanced Neutrophil Chemotactic Mediator Release Ex Vivo. Am J Physiol Lung Cell Mol Physiol 2010, 299, L472–82. [Google Scholar] [CrossRef]
- Sarli, G.; Peli, A.; Marrocco, R.; Zanotti, L.; Ducci, A.; Isani, G.; Alessandra, S.; Sassi, F.; Benazzi, C.; Cinotti, S.; et al. A Comparison of IL-1 Beta and IL-8 MRNA and Their Respective Proteins in Equine Bronchoalveolar Lavage Fluid during Recurrent Airway Obstruction. Online Journal of Veterinary Research 2011, 15, 215–228. [Google Scholar]
- Bullone, M.; Lavoie, J.P. Science-in-Brief: Equine Asthma Diagnosis: Beyond Bronchoalveolar Lavage Cytology. Equine Vet J 2017, 49, 263–265. [Google Scholar] [CrossRef]
- Bond, S.; Léguillette, R.; Richard, E.A.; Couetil, L.; Lavoie, J.P.; Martin, J.G.; Pirie, R.S. Equine Asthma: Integrative Biologic Relevance of a Recently Proposed Nomenclature. J Vet Intern Med 2018, 32, 2088–2098. [Google Scholar] [CrossRef]
- Couetil, L.L.; Thompson, C.A. Airway Diagnostics: Bronchoalveolar Lavage, Tracheal Wash, and Pleural Fluid. Veterinary Clinics of North America - Equine Practice 2020, 36, 87–103. [Google Scholar] [CrossRef]
- Niedzwiedz, A.; Mordak, R.; Jaworski, Z.; Nicpon, J. Utility of the Histological Examination of the Bronchial Mucosa in the Diagnosis of Severe Equine Asthma Syndrome in Horses. J Equine Vet Sci 2018, 67, 44–49. [Google Scholar] [CrossRef]
- McGorum B.C., D.P.M., R.N.E., S.J. Equine Respiratory Medicine and Surgery. Ed. Saunders; Elsevier, Ed.; Ed. Saunders.; Philadelphia, Pennsylvania, USA, 2007.
- Davis, K.U.; Sheats, M.K. Bronchoalveolar Lavage Cytology Characteristics and Seasonal Changes in a Herd of Pastured Teaching Horses. Front Vet Sci 2019, 6. [Google Scholar] [CrossRef]
- Fogarty, U.; Buckley, T. Bronchoalveolar Lavage Findings in Horses with Exercise Intolerance. Equine Vet J 1991, 23, 434–437. [Google Scholar] [CrossRef]
- Holcombe, S.J.; Jackson, C.; Gerber, V.; Jefcoat, A.; Berney, C.; Eberhardt, S.; Robinson, N.E. Stabling Is Associated with Airway Inflammation in Young Arabian Horses. Equine Vet J 2010, 33, 244–249. [Google Scholar] [CrossRef]
- Jean, D.; Vrins, A.; Beauchamp, G.; Lavoie, J.-P. Evaluation of Variations in Bronchoalveolar Lavage Fluid in Horses with Recurrent Airway Obstruction. Am J Vet Res 2011, 72, 838–842. [Google Scholar] [CrossRef] [PubMed]
- Hoffman, A.M. Bronchoalveolar Lavage: Sampling Technique and Guidelines for Cytologic Preparation and Interpretation. Veterinary Clinics of North America: Equine Practice 2008, 24, 423–435. [Google Scholar] [CrossRef]
- Fernandez, N.J.; Hecker, K.G.; Gilroy, C. V; Warren, A.L.; Léguillette, R. Reliability of 400-Cell and 5-Field Leukocyte Differential Counts for Equine Bronchoalveolar Lavage Fluid. Vet Clin Pathol 2013, 42, 92–98. [Google Scholar] [CrossRef]
- Pickles, K.; Pirie, R.S.; Rhind, S.; Dixon, P.M.; McGorum, B.C. Cytological Analysis of Equine Bronchoalveolar Lavage Fluid. Part 3: The Effect of Time, Temperature and Fixatives. Equine Vet J 2002, 34, 297–301. [Google Scholar] [CrossRef] [PubMed]
- Rush, B.R.; Raub, E.S.; Rhoads, W.S.; Flaminio, M.J.; Matson, C.J.; Hakala, J.E.; Gillespie, J.R. Pulmonary Function in Horses with Recurrent Airway Obstruction after Aerosol and Parenteral Administration of Beclomethasone Dipropionate and Dexamethasone, Respectively. Am J Vet Res 1998, 59, 1039–1043. [Google Scholar] [PubMed]
- McGorum, B.C.; Dixon, P.M. Evaluation of Local Endobronchial Antigen Challenges in the Investigation of Equine Chronic Obstructive Pulmonary Disease. Equine Vet J 1993, 25, 269–272. [Google Scholar] [CrossRef] [PubMed]
- Sweeney, C.R.; Rossier, Y.; Ziemer, E.L.; Lindborg, S. Effects of Lung Site and Fluid Volume on Results of Bronchoalveolar Lavage Fluid Analysis in Horses. Am J Vet Res 1992, 53, 1376–1379. [Google Scholar] [PubMed]
- McGorum, B.C.; Dixon, P.M.; Halliwell, R.E.; Irving, P. Comparison of Cellular and Molecular Components of Bronchoalveolar Lavage Fluid Harvested from Different Segments of the Equine Lung. Res Vet Sci 1993, 55, 57–59. [Google Scholar] [CrossRef] [PubMed]
- Pickles, K.; Pirie, R.S.; Rhind, S.; Dixon, P.M.; McGorum, B.C. Cytological Analysis of Equine Bronchoalveolar Lavage Fluid. Part 1: Comparison of Sequential and Pooled Aliquots. Equine Vet J 2002, 34, 288–291. [Google Scholar] [CrossRef] [PubMed]
- Allen, K.J.; Tennant, K. V; Franklin, S.H. Effect of Inclusion or Exclusion of Epithelial Cells in Equine Respiratory Cytology Analysis. Vet J 2019, 254, 105405. [Google Scholar] [CrossRef]
- Robinson, N.E. International Workshop on Equine Chronic Airway Disease. Michigan State University 16-18 June 2000. Equine Vet J 2001, 33, 5–19. [Google Scholar] [CrossRef]
- Meyer, T.S.; Fedde, M.R.; Gaughan, E.M.; Langsetmo, I.; Erickson, H.H. Quantification of Exercise-Induced Pulmonary Haemorrhage with Bronchoalveolar Lavage. Equine Vet J 1998, 30, 284–288. [Google Scholar] [CrossRef]
- Deniau, V., J.L., F.G., C.-M.A. Comparison of Cytological Profiles of Bronchoalveolar Lavage Fluid Obtained from Left and Right Lungs According to Conditions of Conservation and Preparation. In:Proceedings of the Conference on Equine Sports Medicine and Science; 2010.
- Depecker, M.; Richard, E.A.; Pitel, P.-H.; Fortier, G.; Leleu, C.; Couroucé-Malblanc, A. Bronchoalveolar Lavage Fluid in Standardbred Racehorses: Influence of Unilateral/Bilateral Profiles and Cut-off Values on Lower Airway Disease Diagnosis. Vet J 2014, 199, 150–156. [Google Scholar] [CrossRef]
- Hermange, T.; Le Corre, S.; Bizon, C.; Richard, E.A.; Couroucé, A. Bronchoalveolar Lavage Fluid from Both Lungs in Horses: Diagnostic Reliability of Cytology from Pooled Samples. Veterinary Journal 2019, 244, 28–33. [Google Scholar] [CrossRef]
- Pickles, K.; Pirie, R.S.; Rhind, S.; Dixon, P.M.; McGorum, B.C. Cytological Analysis of Equine Bronchoalveolar Lavage Fluid. Part 2: Comparison of Smear and Cytocentrifuged Preparations. Equine Vet J 2010, 34, 292–296. [Google Scholar] [CrossRef]
- Pickles, K.; Pirie, R.S.; Rhind, S.; Dixon, P.M.; McGorum, B.C. Cytological Analysis of Equine Bronchoalveolar Lavage Fluid. Part 3: The Effect of Time, Temperature and Fixatives. Equine Vet J 2002, 34, 297–301. [Google Scholar] [CrossRef] [PubMed]
- Allen, K.J.; Tennant, K.V.; Franklin, S.H. Effect of Inclusion or Exclusion of Epithelial Cells in Equine Respiratory Cytology Analysis. The Veterinary Journal 2019, 254, 105405. [Google Scholar] [CrossRef] [PubMed]
- Bullone, M.; Hélie, P.; Joubert, P.; Lavoie, J. -P. Development of a Semiquantitative Histological Score for the Diagnosis of Heaves Using Endobronchial Biopsy Specimens in Horses. J Vet Intern Med 2016, 30, 1739–1746. [Google Scholar] [CrossRef]
- Leclere, M.; Lavoie-lamoureux, A.; Lavoie, J.-P. Heaves, an Asthma-like Disease of Horses. Respirology 2011, 16, 1027–1046. [Google Scholar] [CrossRef] [PubMed]
- Tessier, L.; Côté, O.; Clark, M.E.; Viel, L.; Diaz-Méndez, A.; Anders, S.; Bienzle, D. Impaired Response of the Bronchial Epithelium to Inflammation Characterizes Severe Equine Asthma. BMC Genomics 2017, 18, 708. [Google Scholar] [CrossRef]
- Giguère, S.; Prescott, J.F. Quantitation of Equine Cytokine MRNA Expression by Reverse Transcription-Competitive Polymerase Chain Reaction. Vet Immunol Immunopathol 1999, 67, 1–15. [Google Scholar] [CrossRef]
- Swiderski, C.E.; Klei, T.R.; Horohov, D.W. Quantitative Measurement of Equine Cytokine MRNA Expression by Polymerase Chain Reaction Using Target-Specific Standard Curves. J Immunol Methods 1999, 222, 155–169. [Google Scholar] [CrossRef]
- Joubert, P.; Silversides, D.W.; Lavoie, J.-P. Equine Neutrophils Express MRNA for Tumour Necrosis Factor-α, Interleukin (IL)-1β, IL-6, IL-8, Macrophage-Inflammatory-Protein-2 but Not for IL-4, IL-5 and Interferon-γ. Equine Vet J 2010, 33, 730–733. [Google Scholar] [CrossRef]
- Beadle, R.E.; Horohov, D.W.; Gaunt, S.D. Interleukin-4 and Interferon-Gamma Gene Expression in Summer Pasture-Associated Obstructive Pulmonary Disease Affected Horses. Equine Vet J 2010, 34, 389–394. [Google Scholar] [CrossRef]
- Horohov, D.W.; Beadle, R.E.; Mouch, S.; Pourciau, S.S. Temporal Regulation of Cytokine MRNA Expression in Equine Recurrent Airway Obstruction. Vet Immunol Immunopathol 2005, 108, 237–245. [Google Scholar] [CrossRef]
- Laan, T.T.J.M.; Bull, S.; Pirie, R.S.; Fink-Gremmels, J. Evaluation of Cytokine Production by Equine Alveolar Macrophages Exposed to Lipopolysaccharide, Aspergillus Fumigatus, and a Suspension of Hay Dust. Am J Vet Res 2005, 66, 1584–1589. [Google Scholar] [CrossRef] [PubMed]
- Ainsworth, D.M.; Wagner, B.; Franchini, M.; Grünig, G.; Erb, H.N.; Tan, J.-Y. Time-Dependent Alterations in Gene Expression of Interleukin-8 in the Bronchial Epithelium of Horses with Recurrent Airway Obstruction. Am J Vet Res 2006, 67, 669–677. [Google Scholar] [CrossRef] [PubMed]
- Riihimäki, M.; Raine, A.; Art, T.; Lekeux, P.; Couëtil, L.; Pringle, J. Partial Divergence of Cytokine MRNA Expression in Bronchial Tissues Compared to Bronchoalveolar Lavage Cells in Horses with Recurrent Airway Obstruction. Vet Immunol Immunopathol 2008, 122, 256–264. [Google Scholar] [CrossRef] [PubMed]
- Klukowska-Rötzler, J.; Swinburne, J.E.; Drögemüller, C.; Dolf, G.; Janda, J.; Leeb, T.; Gerber, V. The Interleukin 4 Receptor Gene and Its Role in Recurrent Airway Obstruction in Swiss Warmblood Horses. Anim Genet 2012, 43, 450–453. [Google Scholar] [CrossRef]
- Padoan, E.; Ferraresso, S.; Pegolo, S.; Castagnaro, M.; Barnini, C.; Bargelloni, L. Real Time RT-PCR Analysis of Inflammatory Mediator Expression in Recurrent Airway Obstruction-Affected Horses. Vet Immunol Immunopathol 2013, 156, 190–199. [Google Scholar] [CrossRef] [PubMed]
- Morini, M.; Peli, A.; Rinnovati, R.; Magazzù, G.; Romagnoli, N.; Spadari, A.; Pietra, M. Immunohistochemical Expression of Neurokinin-A and Interleukin-8 in the Bronchial Epithelium of Horses with Severe Equine Asthma Syndrome during Asymptomatic, Exacerbation, and Remission Phase. Animals 2021, 11, 1376. [Google Scholar] [CrossRef] [PubMed]
Figure 1.
Timeline flow chart of trial.
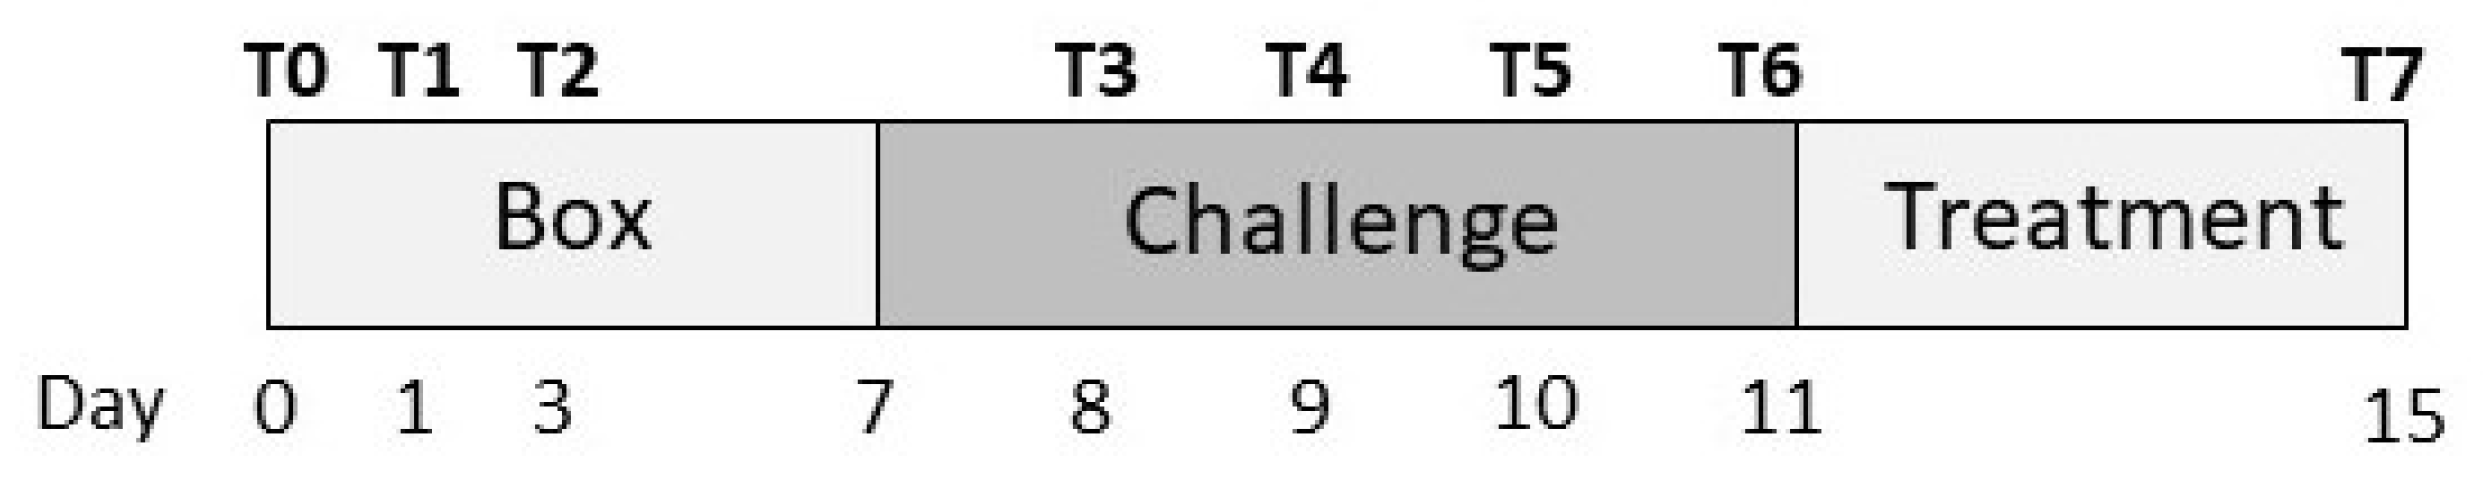
Figure 2.
Macroscopic and microscopic appearance of the cytocentrifugated (a and b) and smear (c and d) preparations of the same horse (T6 treatment). Macroscopically, the cellularity of the cytocentrifugate appears concentrated in a small circular area (a), and microscopically, the cells appear homogeneously distributed (b). The cellularity of the simple sedimented smear instead has seeped through the glass (c). Microscopically, cell aggregates of different densities can be observed. The cells appear unevenly distributed with the presence of mucus (in bright pink) which retains a large amount of cells (d). MGG stain, 4x magnification b and d.
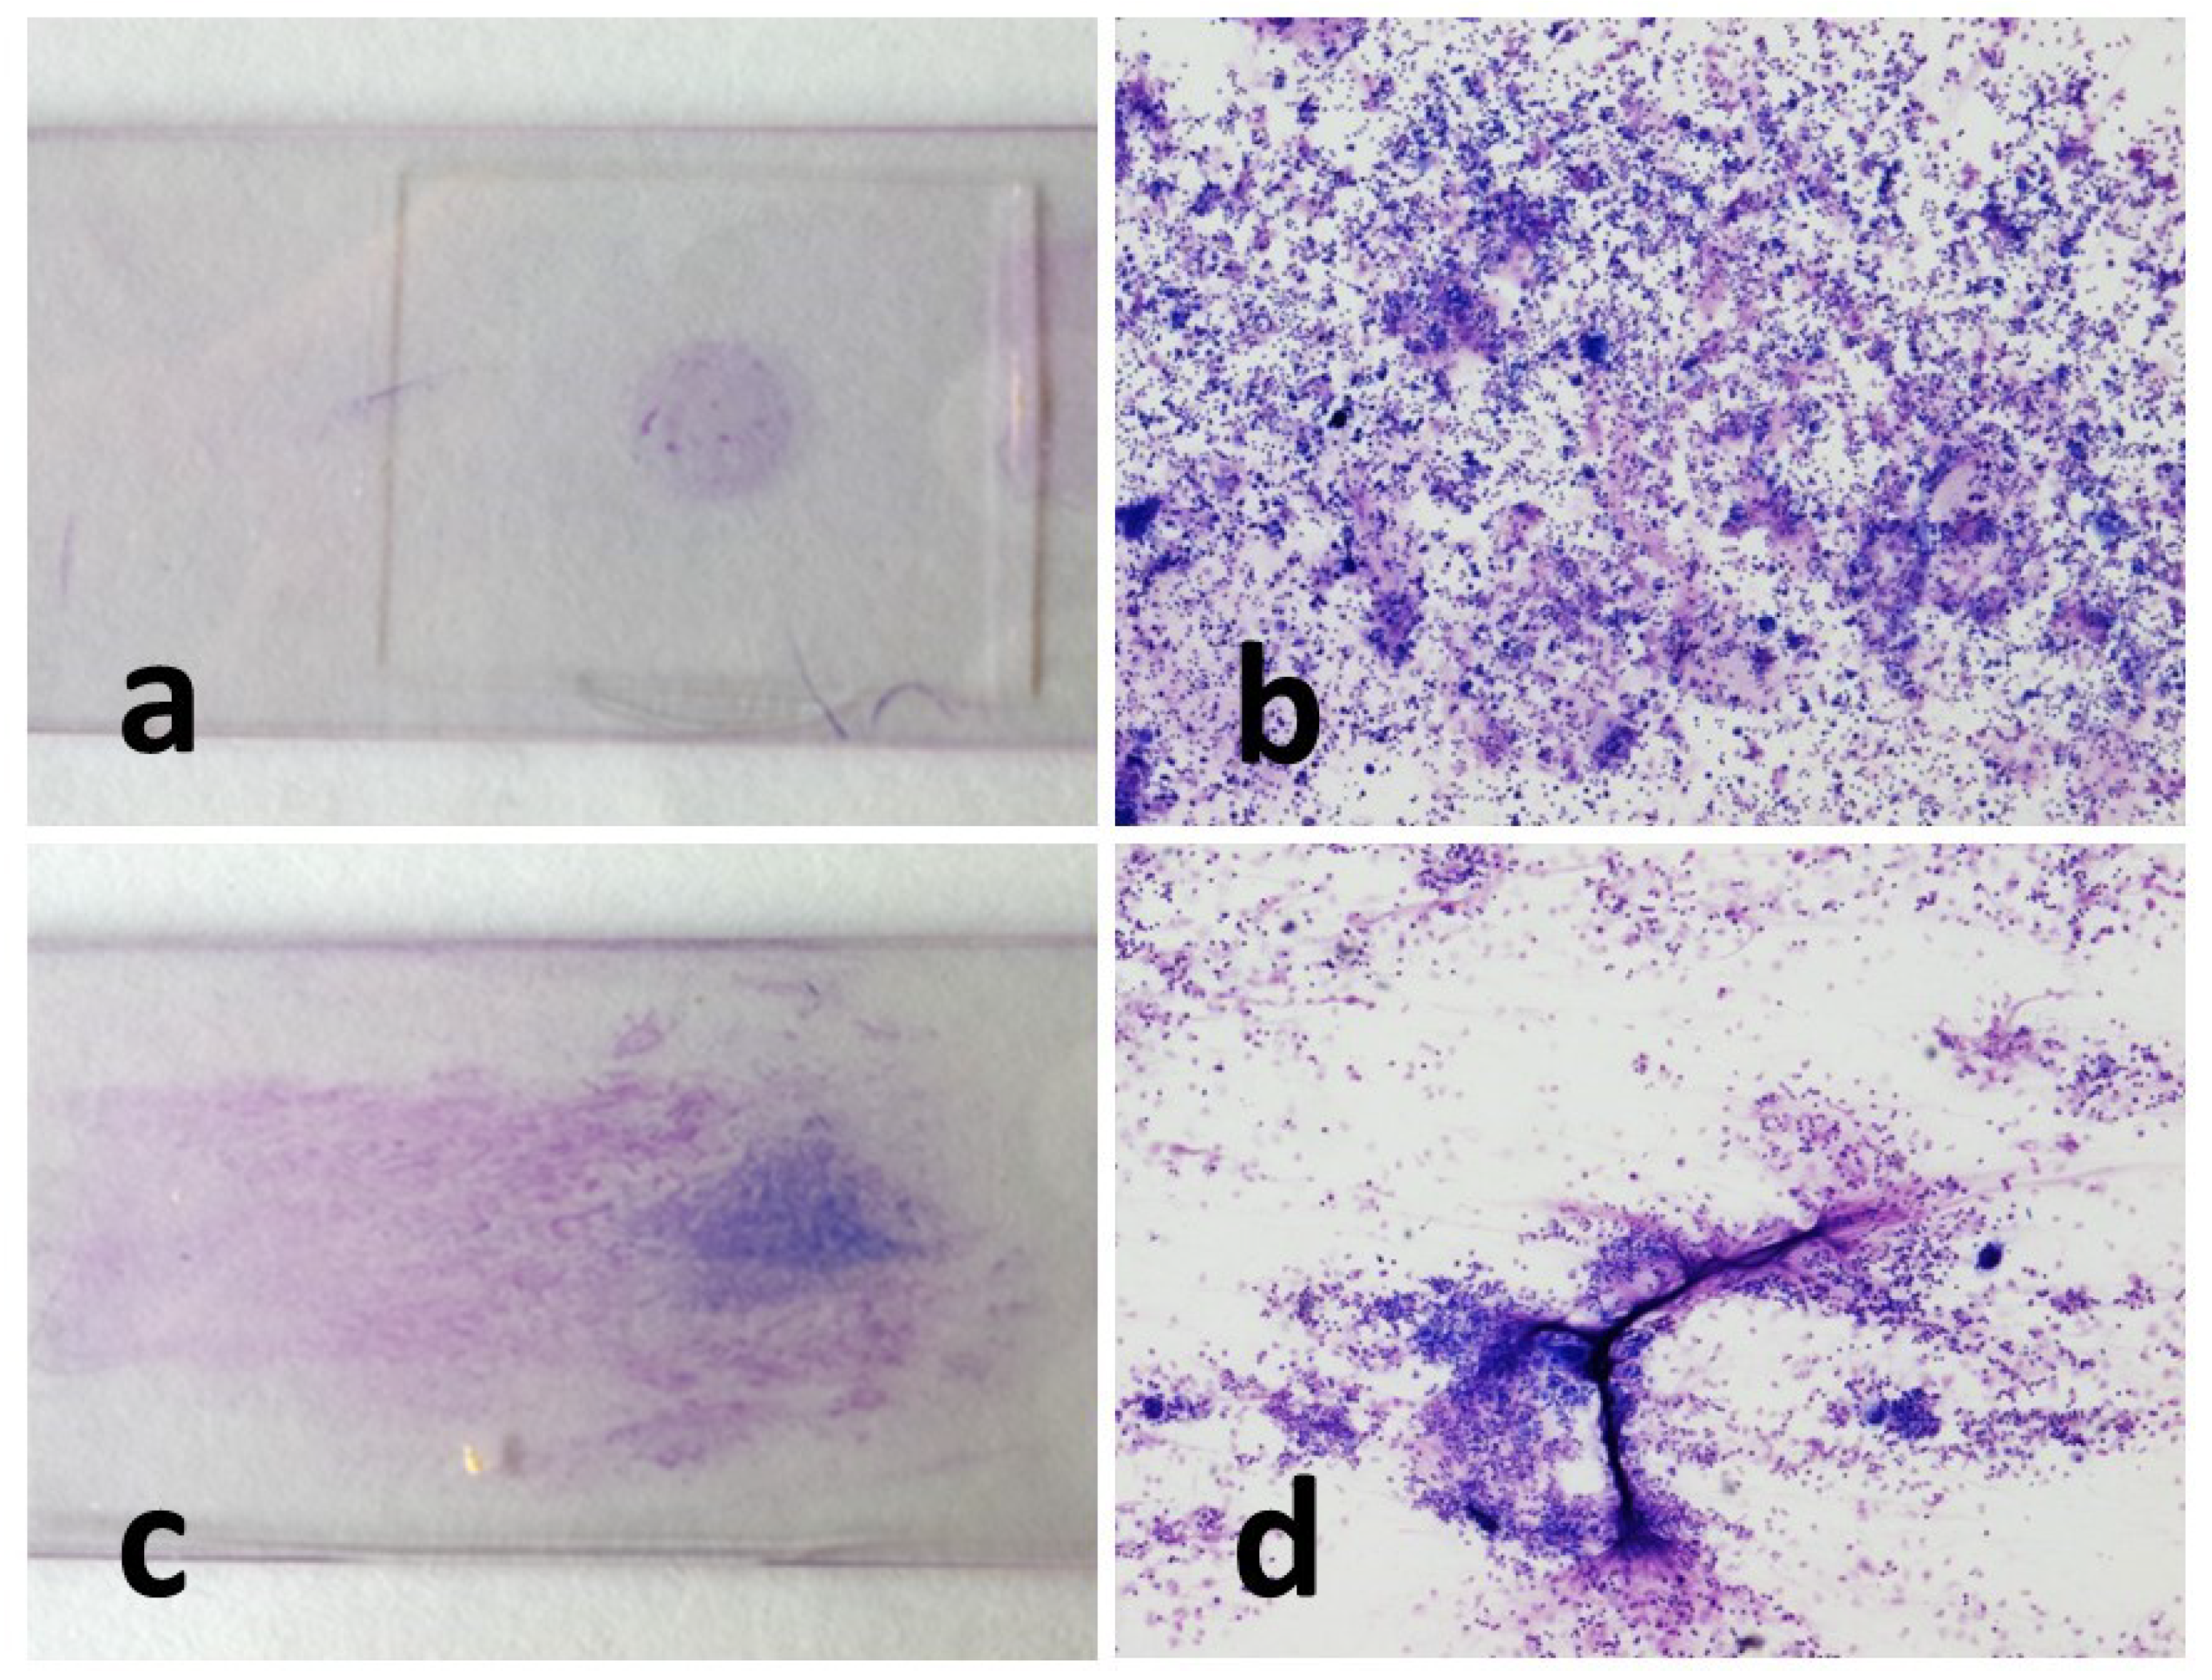
Figure 3.
Representative images of sedimented smear and cytocentrifugated preparation of the same horse at different time point of the study. (a) Sedimented smear (T6). Numerous intertwined strands of mucus (deep pink in colour) are seen, entangling isolated inflammatory cells (predominantly neutrophils). (b) Cytocentrifugated preparation (T5). Voluminous aggregate of faintly pink amorphous material (mucus) mixed with cells mainly represented by lymphocytes and macrophages. (c) Sedimented smear (T4). A heterogeneous population consisting mainly of lymphocytes and macrophages and thin filaments of mucus. (d) Cytocentrifugated preparation (T2). Uniformly distributed macrophages and lymphocytes, and rare eosinophils are observed. MGG stain, magnification 10x.
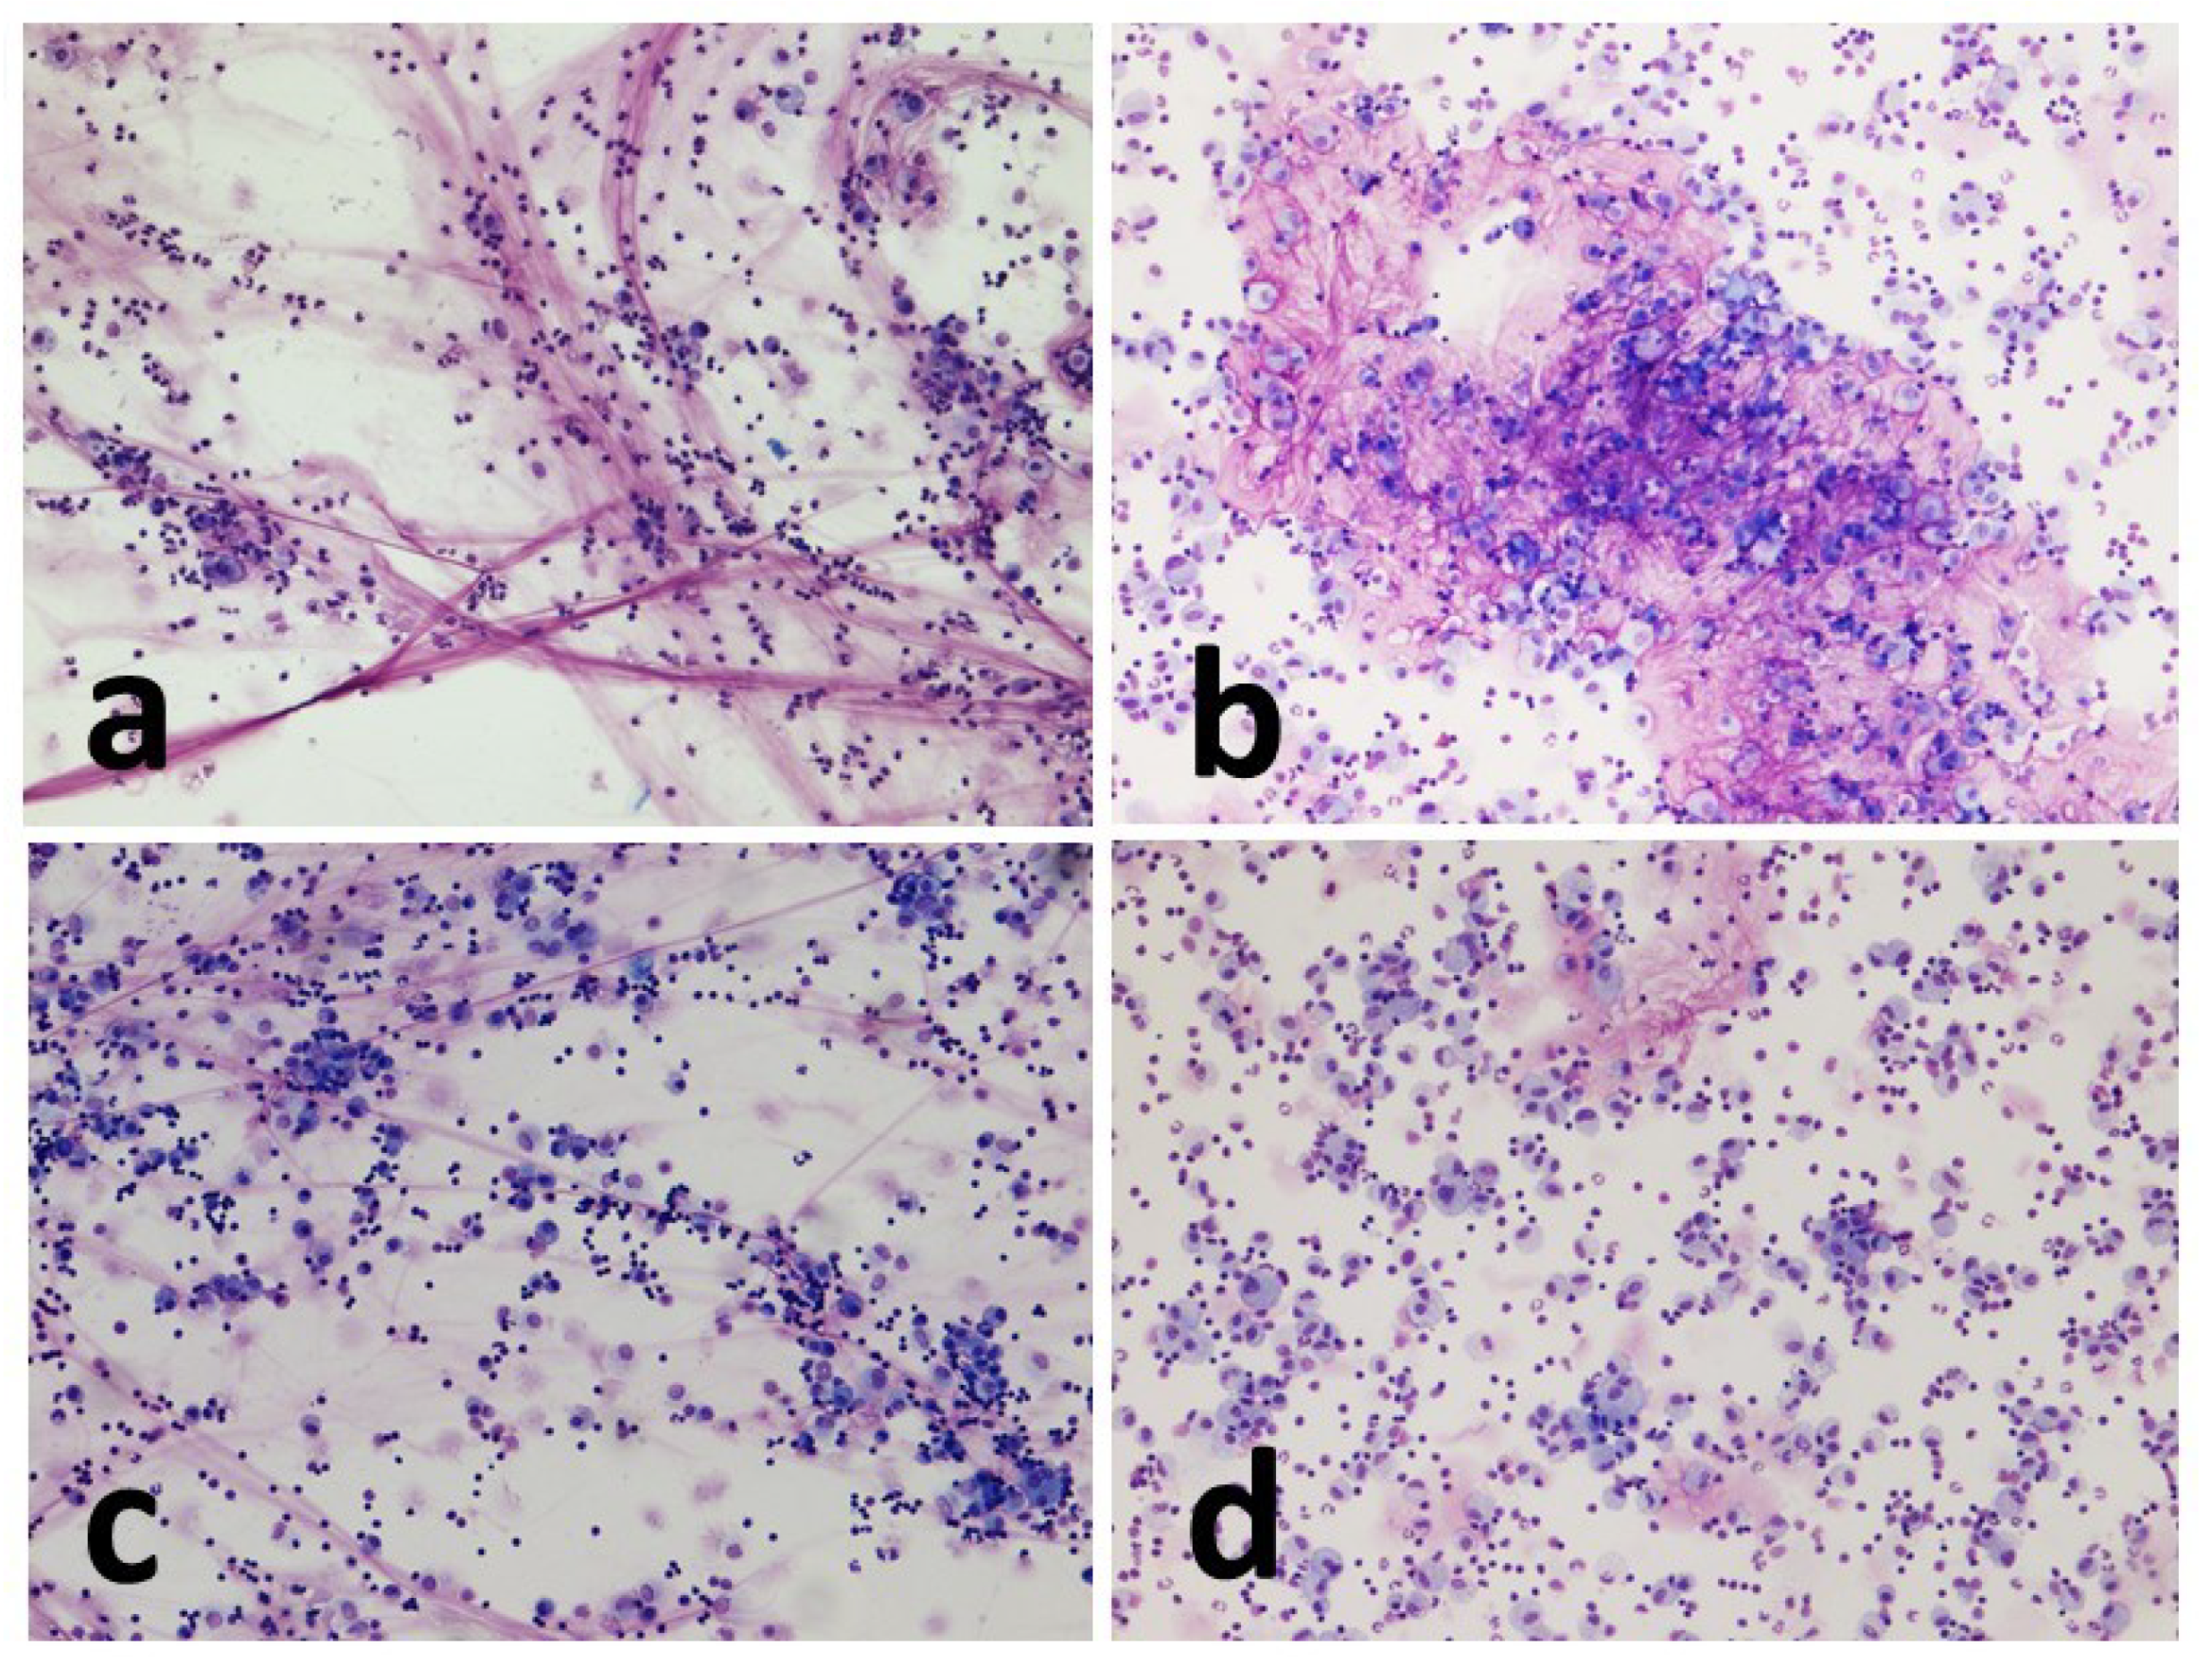
Figure 4.
Representative images of smear and cytocentrifugate of the same horse. (a) Cytocentrifuged preparation (T6). Mixed inflammatory cells with a prevalence of neutrophils. A multinucleated cell can be seen in the center. (b) Sedimented smear (T6). Inflammatory cellular components are mainly represented by lymphocytes and macrophages. Thin filaments of mucus are seen in pink. (c) Cytocentrifuged preparation (T2). Many foamy macrophages are observed. A macrophage that appears engulfed by pink granular material (proteinaceous) is visible in the centre. (d) Microscopic appearance of T2 cytocentrifuge. A mast cell is seen in the center of the picture. MGG stain, magnification 10x a and b and 20x c and d.
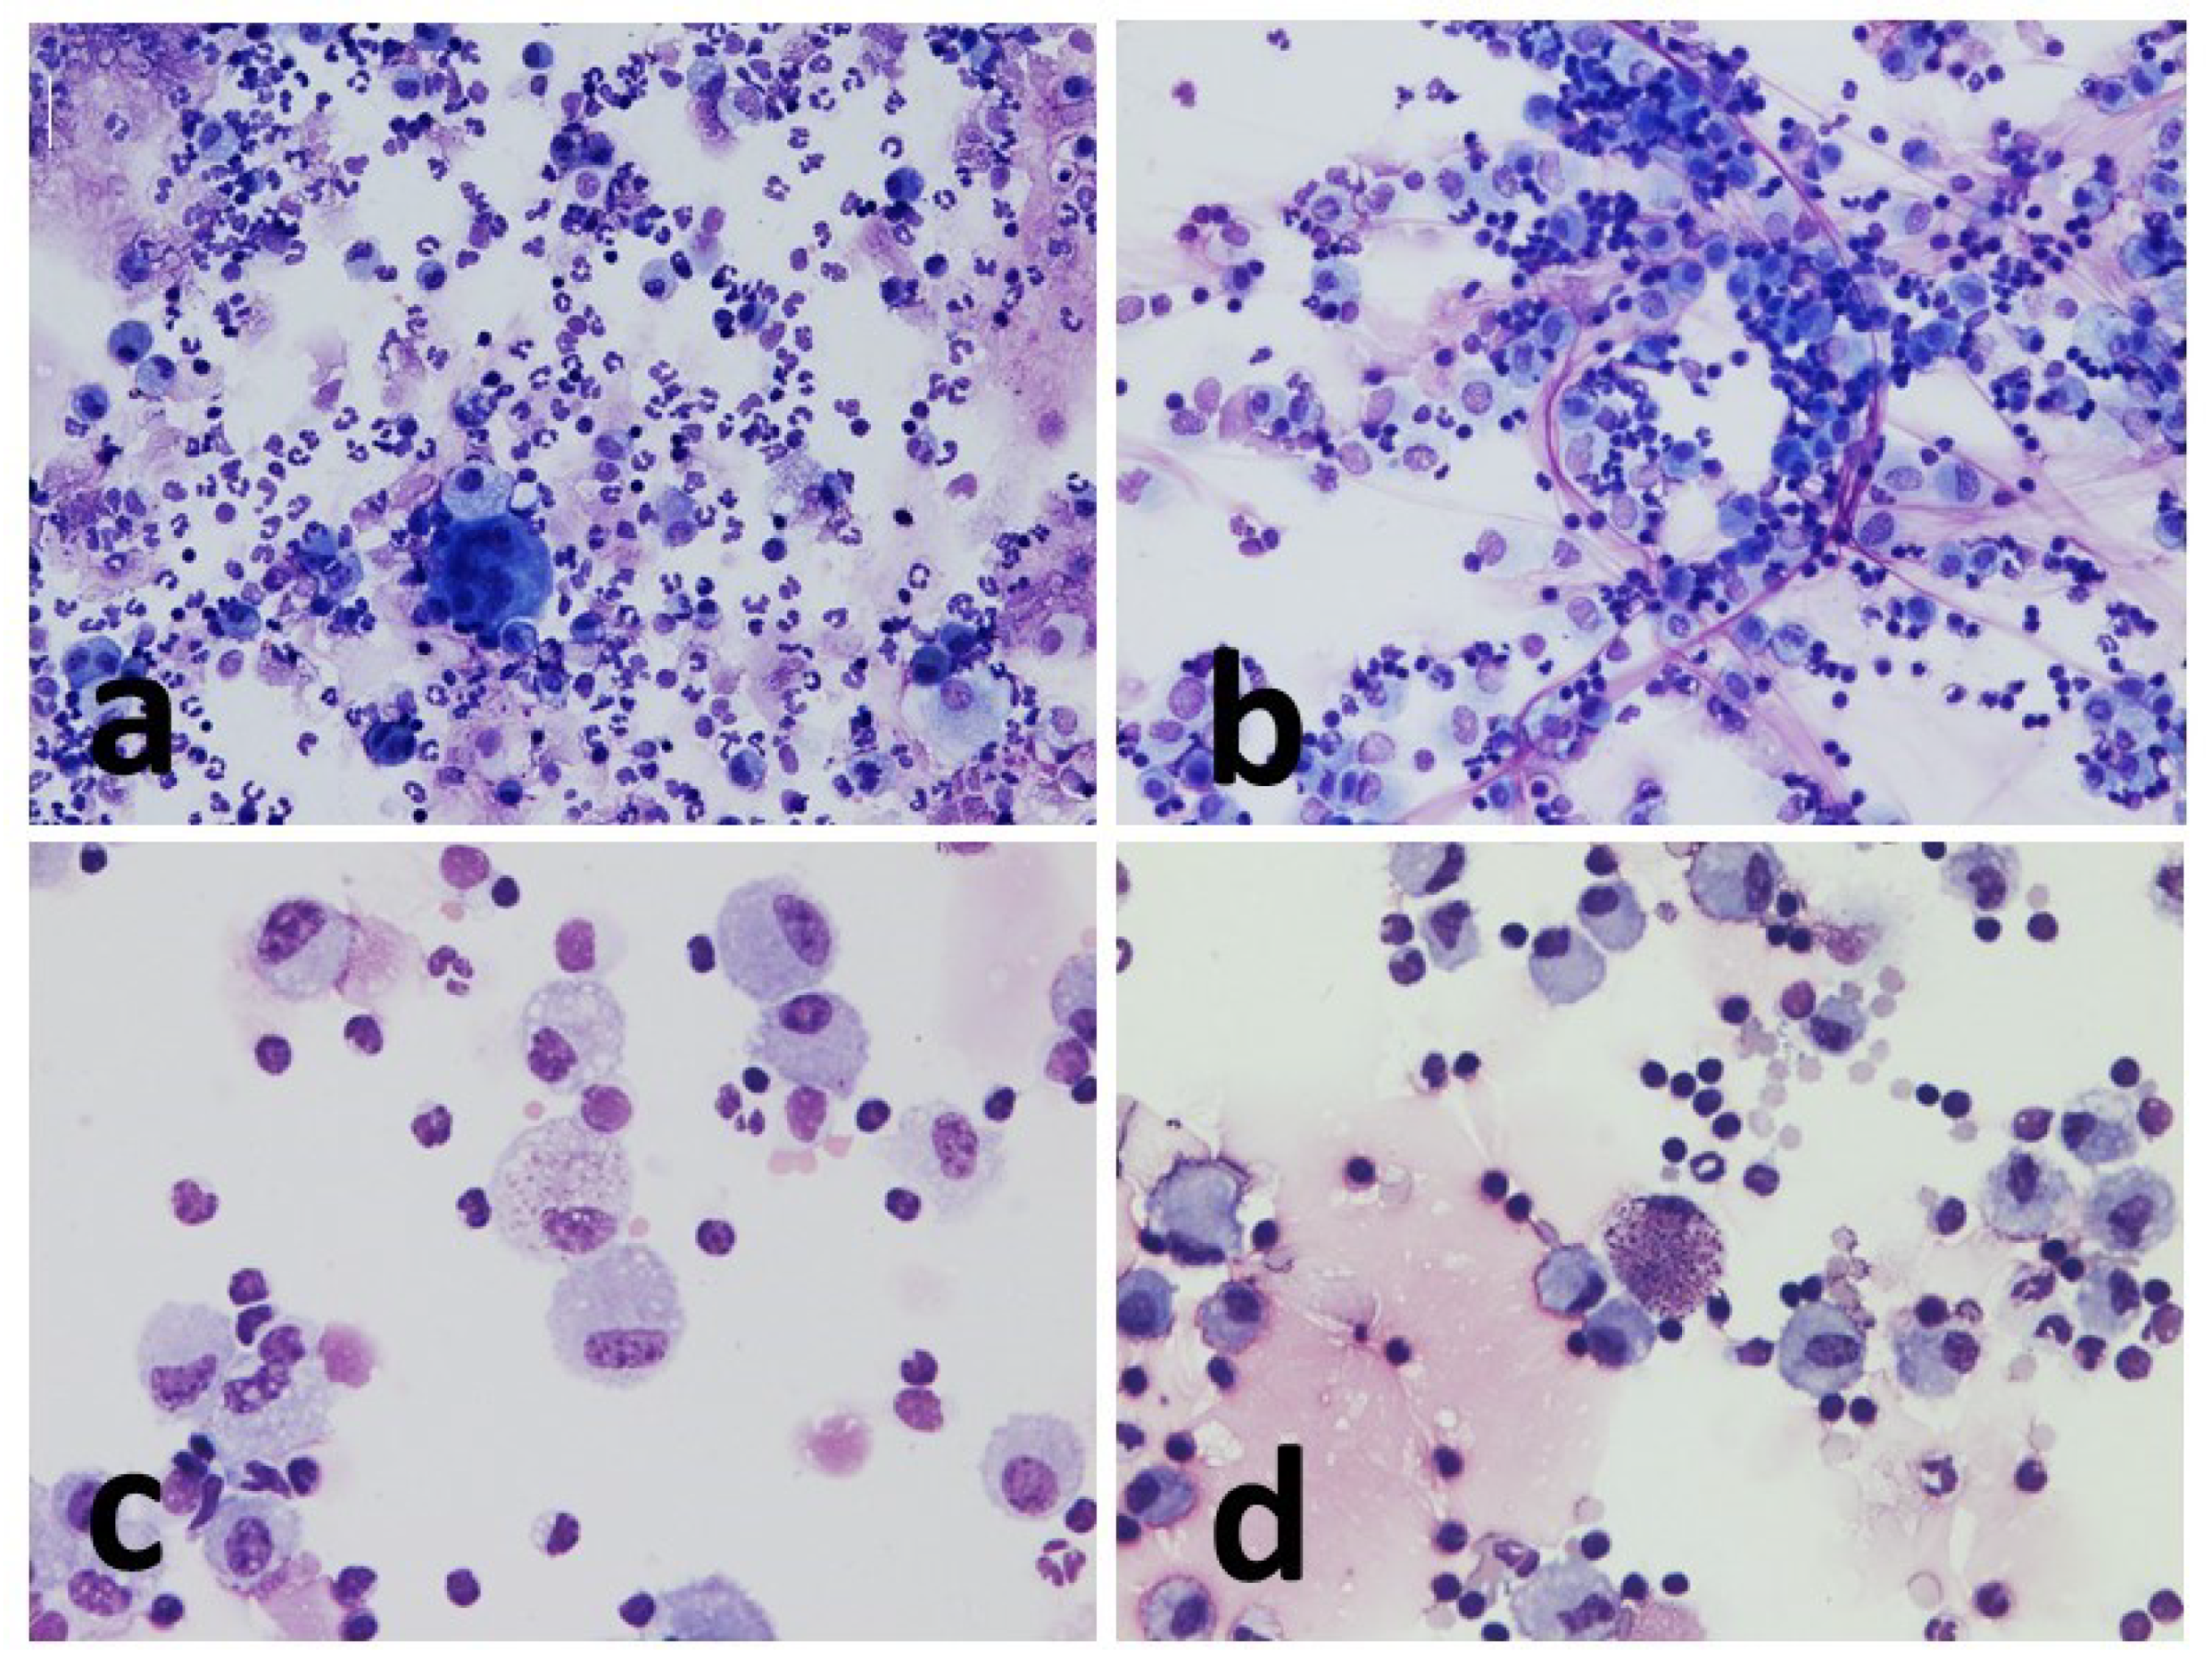
Figure 5.
Left: relationship between the differential neutrophil cell count of cytocentrifugate and sediment smears. Right: relationship between total neutrophil count and the mean in the cytocentrifugate and sediment smears (Bland-Altman).
Figure 5.
Left: relationship between the differential neutrophil cell count of cytocentrifugate and sediment smears. Right: relationship between total neutrophil count and the mean in the cytocentrifugate and sediment smears (Bland-Altman).
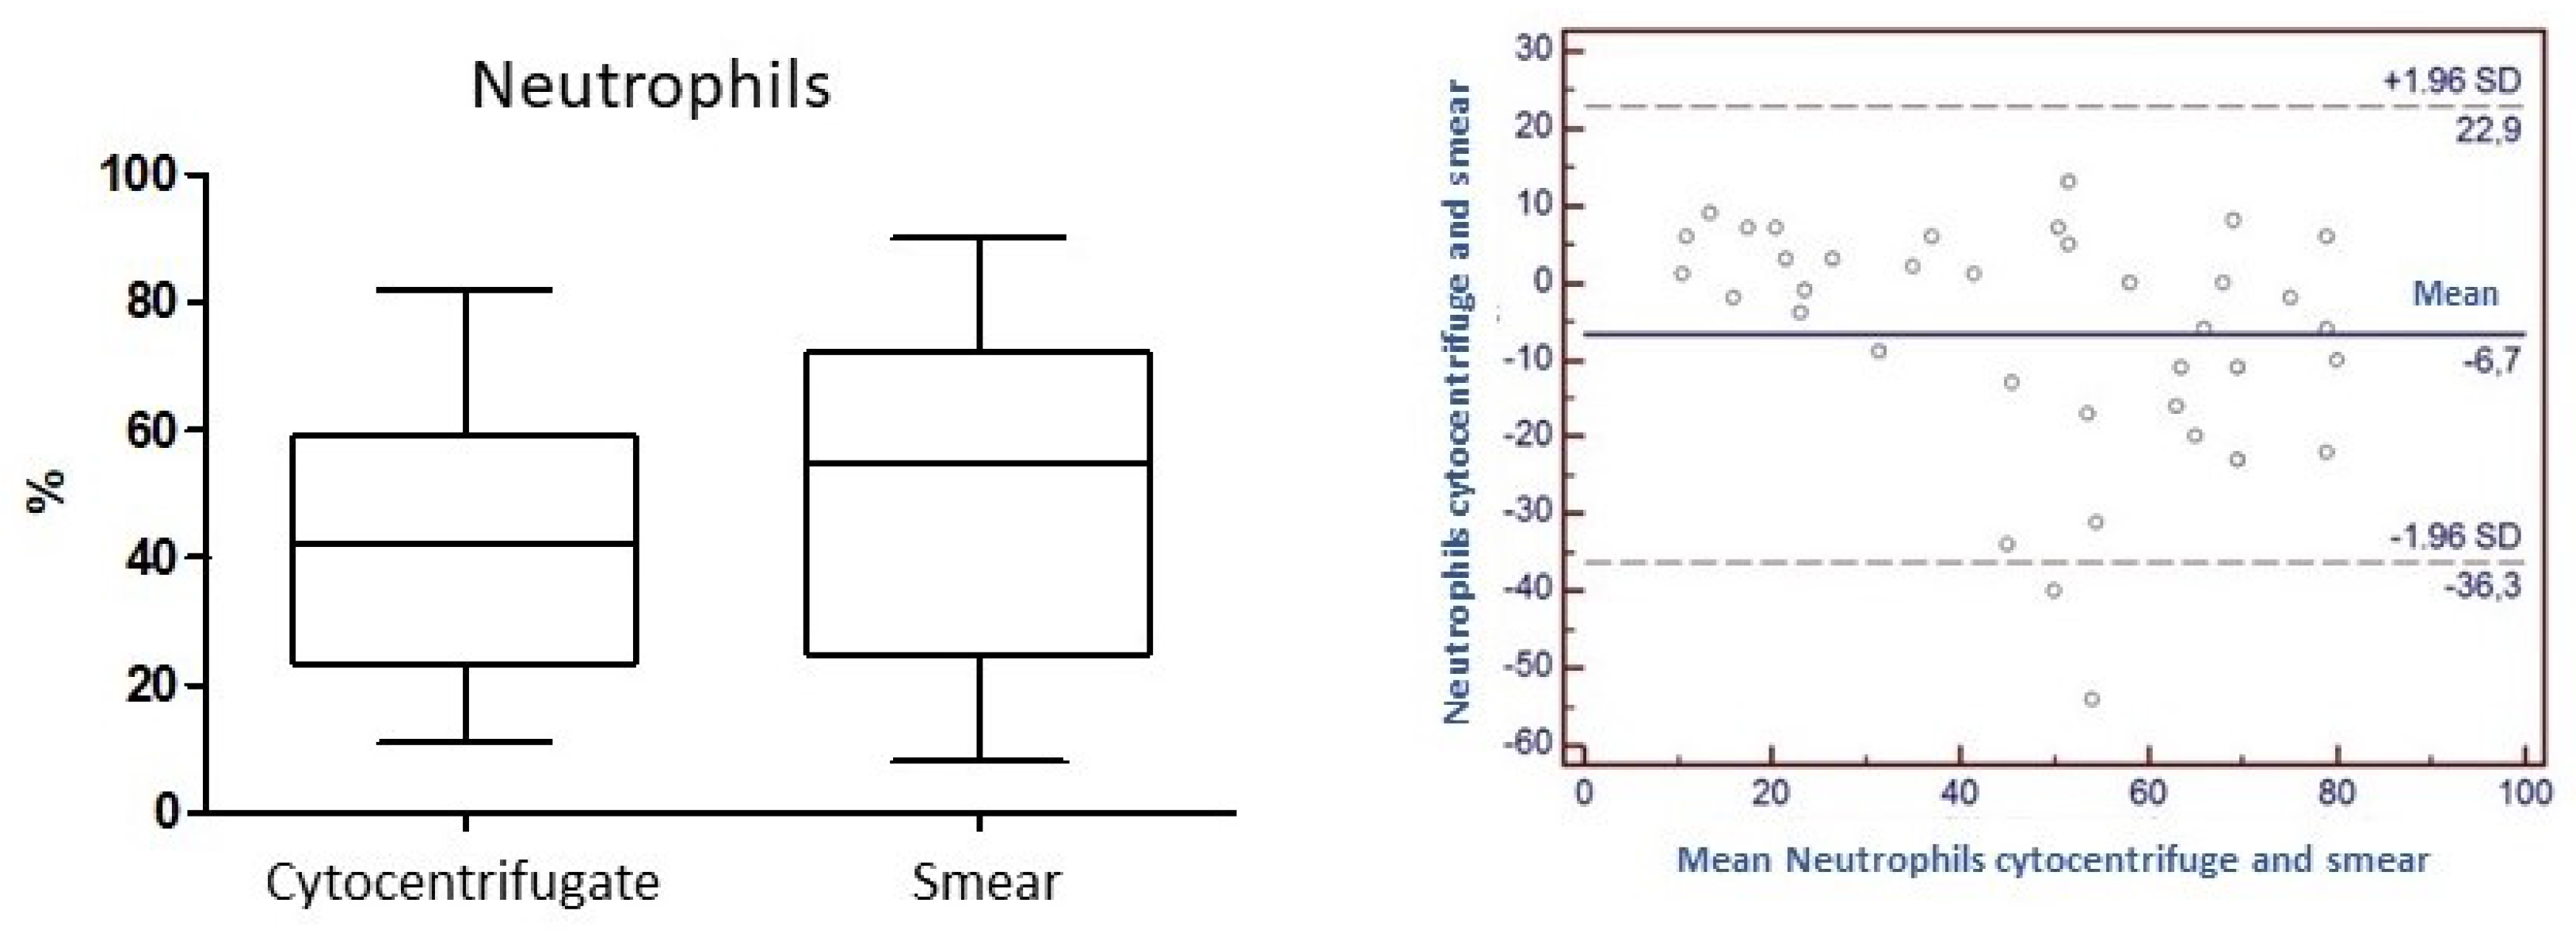
Figure 6.
Left: relationship between differential lymphocyte cell count in cytocentrifugate and sediment smears. Right: relationship between total lymphocyte count and mean in cytocentrifugate and sediment smears (Bland-Altman).
Figure 6.
Left: relationship between differential lymphocyte cell count in cytocentrifugate and sediment smears. Right: relationship between total lymphocyte count and mean in cytocentrifugate and sediment smears (Bland-Altman).
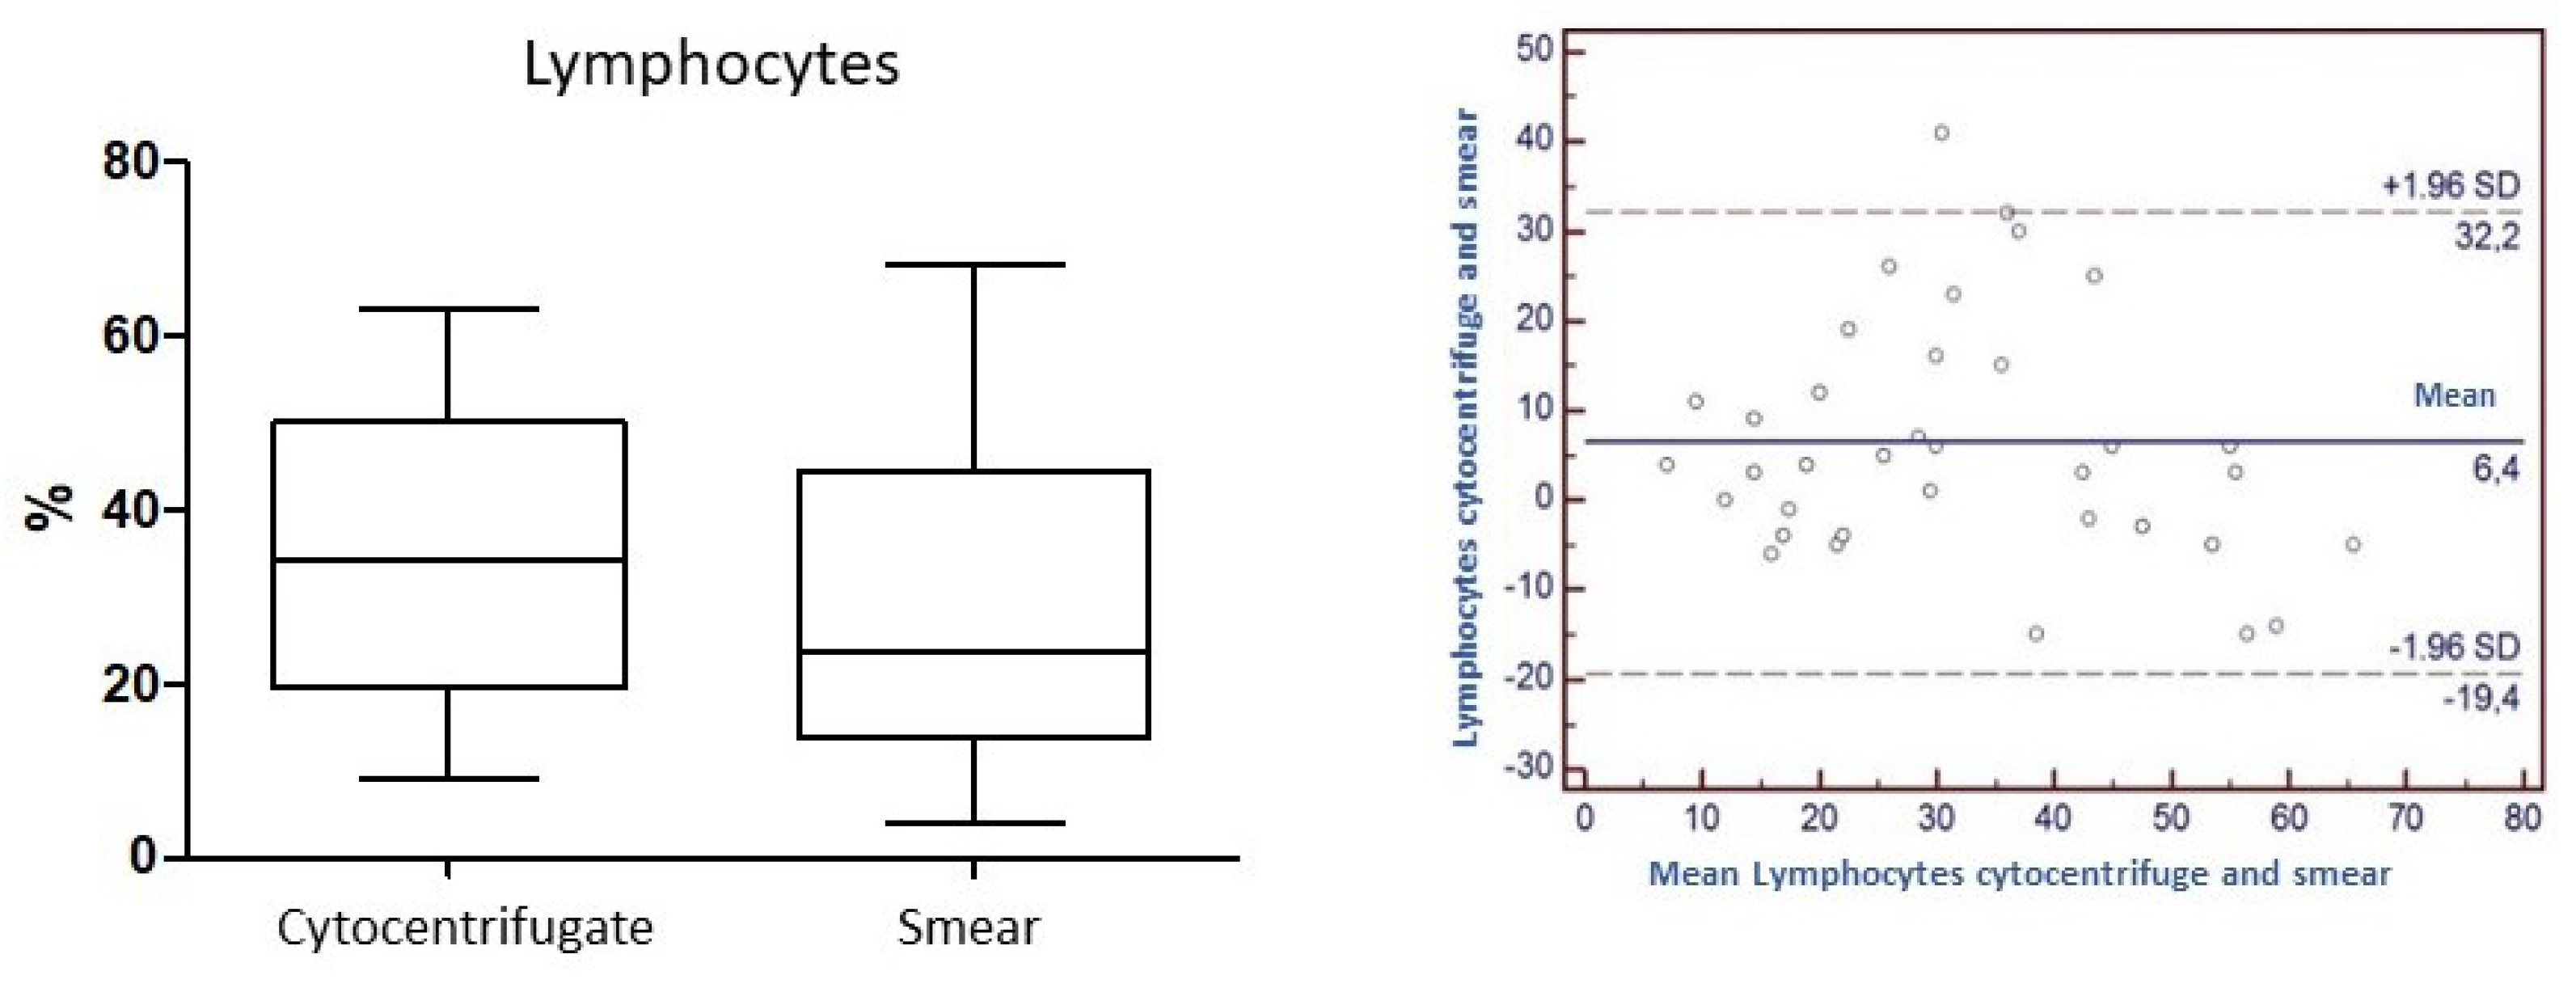
Figure 7.
Left: relationship between differential cell counts of macrophages of cytocentrifugated and concentrated smear. Right: relationship between total macrophage count and mean in the cytocentrifugated and concentrated smear (Bland-Altman).
Figure 7.
Left: relationship between differential cell counts of macrophages of cytocentrifugated and concentrated smear. Right: relationship between total macrophage count and mean in the cytocentrifugated and concentrated smear (Bland-Altman).
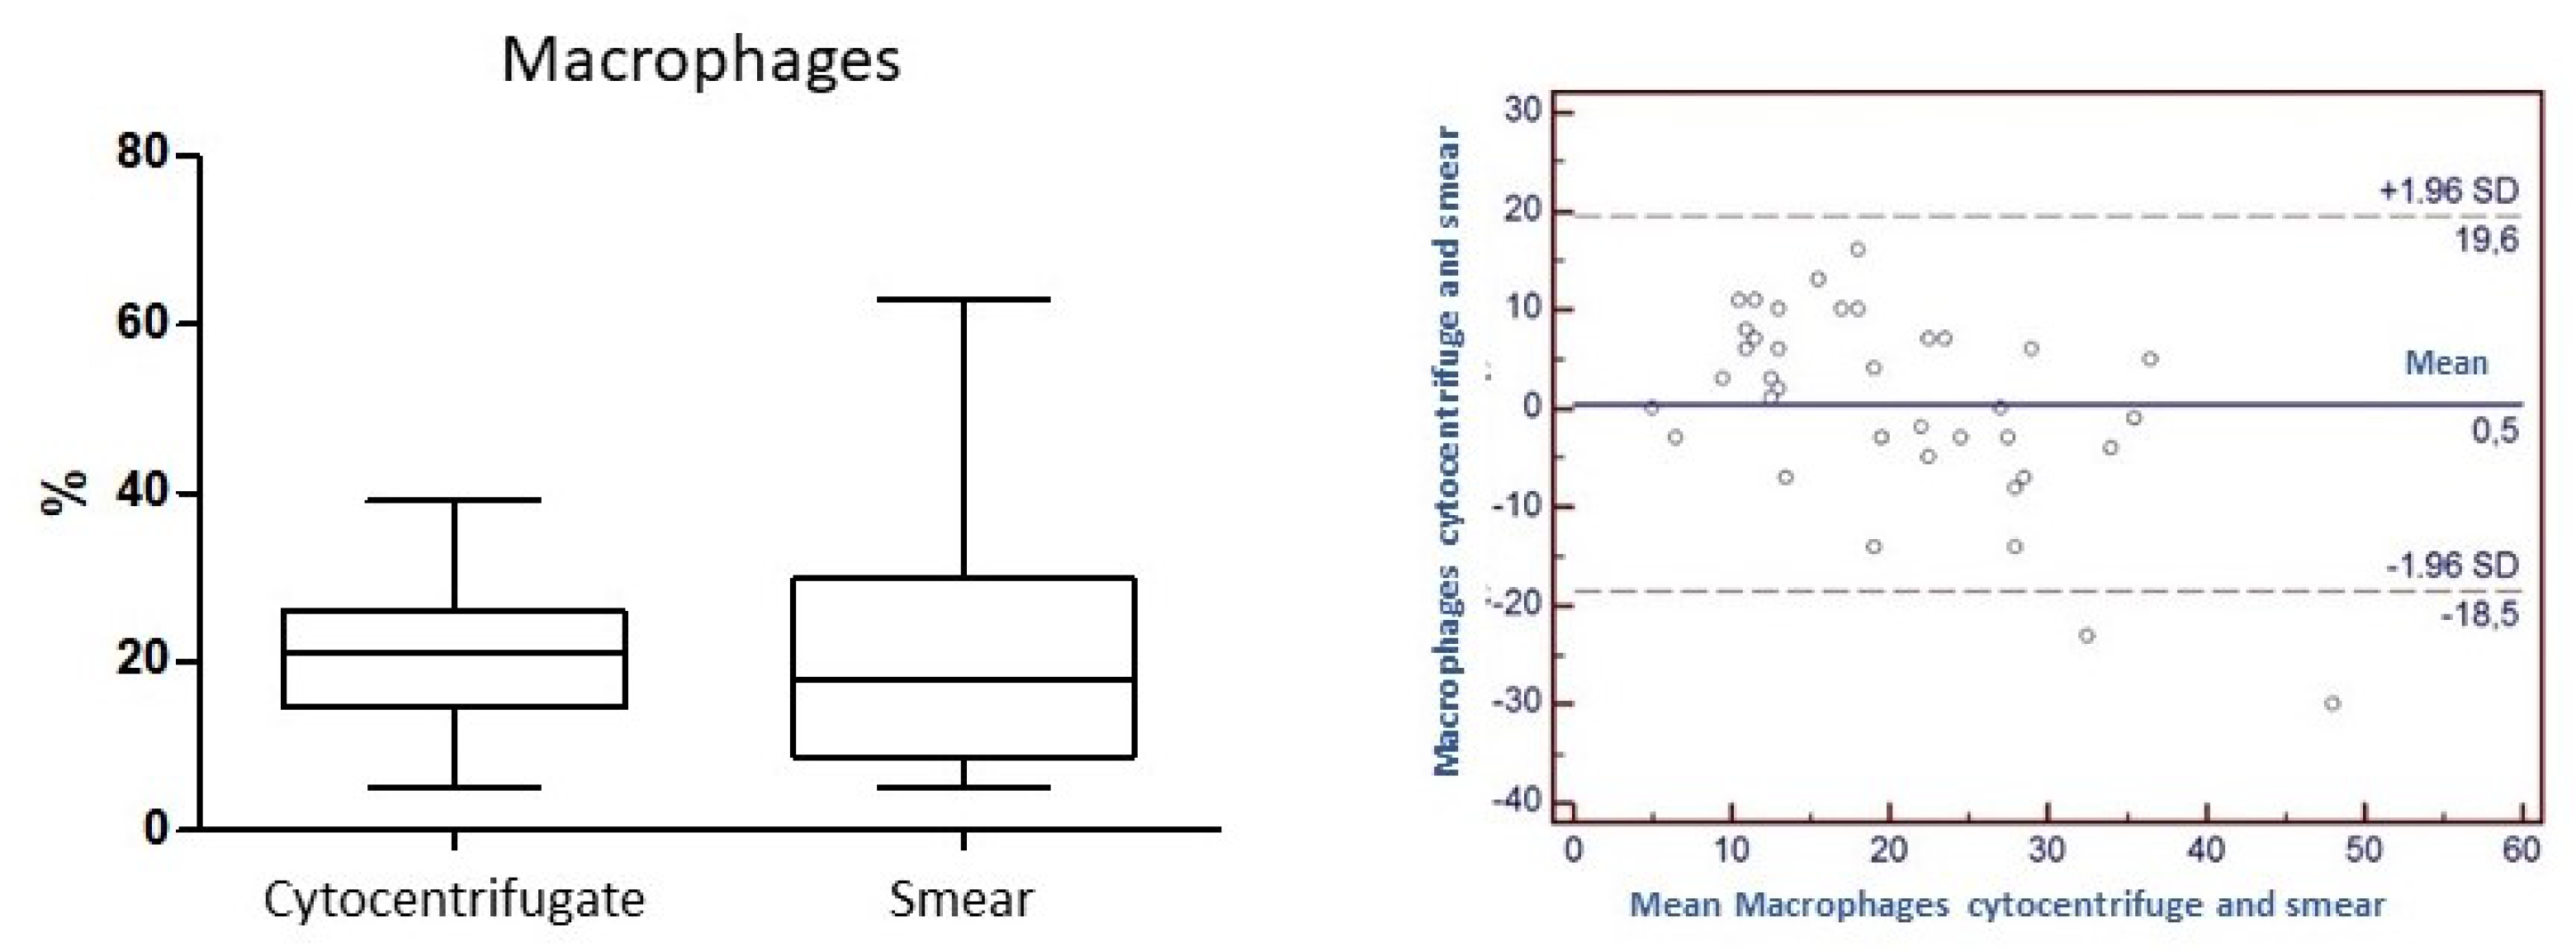

Table 1.
Evaluation grid used for each patient’s preparation.
| Cyto centrifugate | Suitable for analysis |
 Yes Yes |
No |
|||
| 1st field | 2nd field | 3rd field | 4th field | 5th field | Mean | |
| Neutrophils | ||||||
| Mast cells | ||||||
| Lymphocytes | ||||||
| Macrophages | ||||||
| Eosinophils | ||||||
| Epithelial cells |
Yes No |
|||||
| Presence of mucus |
0 1 2 3 |
|||||
| Smear | Suitable for analysis |
Yes |
No |
|||
| 1st field | 2nd field | 3rd field | 4th field | 5th field | Mean | |
| Neutrophils | ||||||
| Mast cells | ||||||
| Lymphocytes | ||||||
| Macrophages | ||||||
| Eosinophils | ||||||
| Epithelial cells |
Yes No |
|||||
| Presence of mucus |
0 1 2 3 |
|||||
Table 2.
Cell count repeatability test. For each cell category of the 4 samples, the mean, standard deviation (SD) and Coefficient of variability (CV) were expressed as a percentage.
Table 2.
Cell count repeatability test. For each cell category of the 4 samples, the mean, standard deviation (SD) and Coefficient of variability (CV) were expressed as a percentage.
| I | Cytocentrifugate | Smear |
| Mean neutrophils (%) | 58.7 | 57.7 |
| Neutrophils CV (%) | 0.02 | 0.01 |
| Mean Lymphocytes (%) | 15 | 13.3 |
| Lymphocytes CV (%) | 0.12 | 0.04 |
| Mean Macrophages (%) | 26.3 | 29 |
| Macrophages CV (%) | 0 | 0 |
| II | Cytocentrifugate | Smear |
| Mean neutrophils (%) | 24 | 16.3 |
| Neutrophils CV (%) | 0 | 0.07 |
| Mean Lymphocytes (%) | 42 | 19.3 |
| Lymphocytes CV (%) | 0.04 | 0.06 |
| Mean Macrophages (%) | 34 | 64 |
| Macrophages CV (%) | 0.05 | 0.03 |
Disclaimer/Publisher’s Note: The statements, opinions and data contained in all publications are solely those of the individual author(s) and contributor(s) and not of MDPI and/or the editor(s). MDPI and/or the editor(s) disclaim responsibility for any injury to people or property resulting from any ideas, methods, instructions or products referred to in the content. |
© 2023 by the authors. Licensee MDPI, Basel, Switzerland. This article is an open access article distributed under the terms and conditions of the Creative Commons Attribution (CC BY) license (http://creativecommons.org/licenses/by/4.0/).
Copyright: This open access article is published under a Creative Commons CC BY 4.0 license, which permit the free download, distribution, and reuse, provided that the author and preprint are cited in any reuse.


