Submitted:
14 June 2023
Posted:
15 June 2023
You are already at the latest version
Abstract
Keywords:
1. Introduction
2. Materials and Methods
3. Results
3.1. Structural Properties
3.2. Microstructural Investigation
3.3. Magnetic Properties
4. Conclusions
Author Contributions
Funding
Data Availability Statement
Acknowledgments
Conflicts of Interest
References
- Wolf, S. A.; Awschalom, D. D.; Buhrman, R. A.; Daughton, J. M.; von Molna ́r, S.; Roukes, M. L.; Chtchelkanova, A. Y.; Treger, D. M. Spintronics: A spin-based electronics vision for the future. Science 2001, 294, pp–1488. [Google Scholar] [CrossRef] [PubMed]
- Alam, J.; et al. ,Cylindrical micro and nanowires: Fabrication, properties and applications, J. Magn. Magn. Mater. 2020, 513, 167074. [Google Scholar] [CrossRef]
- Salaheldeen, M.; et al. , Enhancement of Exchange Bias and Perpendicular Magnetic Anisotropy in CoO/Co Multilayer Thin Films by Tuning the Alumina Template Nanohole Size. Nanomaterials 2022, 12, no–15. [Google Scholar] [CrossRef] [PubMed]
- Salaheldeen, M.; Martínez-Goyeneche, L.; Álvarez-Alonso,P.; and Fernández, A. Enhancement the perpendicular magnetic anisotropy of nanopatterned hard/soft bilayer magnetic antidot arrays for spintronic application, Nanotechnology, 2020, 31, no. 48. [CrossRef]
- Elphick, K.; et al. ,Heusler alloys for spintronic devices: review on recent development and future perspectives. Sci. Technol. Adv. Mater. 2021, 22, 235–271. [Google Scholar] [CrossRef] [PubMed]
- F. Heusler Verhandlungen Dtsch. Phys. Ges., 1903, 5, 219. [Google Scholar]
- Elphick, K.; Frost, W.; Samiepour, M.; Kubota, T.; Takanashi, K.; Sukegawa, H.; Mitani, S.; Hirohata, A. Heusler Alloys for Spintronic Devices: Review on Recent Development and Future Perspectives. Sci. Technol. Adv. Mate. 2021, 22, 235–271. [Google Scholar] [CrossRef]
- Bai, Z.; Shen, L.E.I.; Han, G.; Feng, Y.P. Data Storage: Review of Heusler Compounds. Spin 2012, 2, 1230006. [Google Scholar] [CrossRef]
- Li, P.; Koo, J.; Ning, W.; Li, J.; Miao, L.; Min, L.; Zhu, Y.; Wang, Y.; Alem, N.; Liu, C.X.; et al. Giant Room Temperature Anomalous Hall Effect and Tunable Topology in a Ferromagnetic Topological Semimetal Co2MnAl. Nat. Commun. 2020, 11, 1–8. [Google Scholar] [CrossRef]
- Chumak, O.M.; Pacewicz, A.; Lynnyk, A.; Salski, B.; Yamamoto, T.; Seki, T.; Domagala, J.Z.; Głowiński, H.; Takanashi, K.; Baczewski, L.T.; et al. Magnetoelastic Interactions and Magnetic Damping in Co2Fe0.4Mn0.6Si and Co2FeGa0.5Ge0.5 Heusler Alloys Thin Films for Spintronic Applications. Sci. Rep. 2021, 11, 7608. [Google Scholar] [CrossRef]
- Ahmed, S.J.; Boyer, C.; Niewczas, M. Magnetic and Structural Properties of Co2MnSi Based Heusler Compound. J. Alloy. Compd. 2019, 781, 216–225. [Google Scholar] [CrossRef]
- Jourdan, M.; Minár, J.; Braun, J.; Kronenberg, A.; Chadov, S.; Balke, B.; Gloskovskii, A.; Kolbe, M.; Elmers, H.J.; Schönhense, G.; et al. Direct Observation of Half-Metallicity in the Heusler Compound Co2MnSi. Nat. Commun. 2014, 5, 3974. [Google Scholar] [CrossRef] [PubMed]
- Guillemard, C.; Petit-Watelot, S.; Pasquier, L.; Pierre, D.; Ghanbaja, J.; Rojas-Sánchez, J.C.; Bataille, A.; Rault, J.; le Fèvre, P.; Bertran, F.; et al. Ultralow Magnetic Damping in Co2Mn-Based Heusler Compounds: Promising Materials for Spintronics. Phys. Rev. Appl. 2019, 11, 064009. [Google Scholar] [CrossRef]
- Pradines, B.; Arras, R.; Abdallah, I.; Biziere, N.; Calmels, L. First-Principles Calculation of the Effects of Partial Alloy Disorder on the Static and Dynamic Magnetic Properties of Co2MnSi. Phys. Rev. B 2017, 95, 094425. [Google Scholar] [CrossRef]
- Cheng, S.F.; Nadgorny, B.; Bussmann, K.; Carpenter, E.E.; Das, B.N.; Trotter, G.; Raphael, M.P.; Harris, V.G. Growth and Magnetic Properties of Single Crystal Co2MnX (X = Si, Ge) Heusler Alloys. IEEE Trans. Magn. 2001, 37, 2176–2178. [Google Scholar] [CrossRef]
- Özduran, M.; Candan, A.; Akbudak, S.; Kushwaha, A. K.; İyigör, A. Structural, elastic, electronic, and magnetic properties of Si-doped Co2MnGe full-Heusler type compounds. Journal of Alloys and Compounds, 2020, 845, 155499. [Google Scholar] [CrossRef]
- Thongsamrit, W.; Charoensuk, T.; Saetang, P.; Jantaratana, P.; Ruttanapun, C.; Sirisathitkul, C. Effects of Carbon Doping and Annealing Temperature on Magnetic MnAl Powders and MnAl Polymeric Composites. Appl. Scienc. 2021, 11, 2067. [Google Scholar] [CrossRef]
- Tyrman, M.; Pasko, A.; Perriere, L.; Etgens, V.; Isnard, O.; Mazaleyrat, F. Effect of Carbon Addition on Magnetic Order in Mn–Al–C Alloys. IEEE Trans. Magn. 2017, 53, 2101406. [Google Scholar] [CrossRef]
- Salaheldeen, M.; Garcia-Gomez, A.; Corte-Leon, P.; Ipatov, M.; Zhukova, V.; Gonzalez, J.; Zhukov, A. Anomalous Magnetic Behavior in Half-Metallic Heusler Co2FeSi Alloy Glass-Coated Microwires with High Curie Temperature. J Alloys Compd 2022, 923, 166379. [Google Scholar] [CrossRef]
- Salaheldeen, M.; Garcia-Gomez, A.; Corte-León, P.; Gonzalez, A.; Ipatov, M.; Zhukova, V.; Gonzalez, J.M.; López Antón, R.; Zhukov, A. Manipulation of Magnetic and Structure Properties of Ni2FeSi Glass-Coated Microwires by Annealing. J Alloys Compd 2023, 942, 169026. [Google Scholar] [CrossRef]
- Salaheldeen, M.; Talaat, A.; Ipatov, M.; Zhukova, V.; Zhukov, A. Preparation and Magneto-Structural Investigation of Nanocrystalline CoMn-Based Heusler Alloy Glass-Coated Microwires. Processes, 2022, 10, 2248. [Google Scholar] [CrossRef]
- Salaheldeen, M.; Wederni, A.; Ipatov, M.; Zhukova, V.; Lopez Anton, R.; Zhukov, A. Enhancing the Squareness and Bi-Phase Magnetic Switching of Co2FeSi Microwires for Sensing Application. Sensors 2023, 23, 5109. [Google Scholar] [CrossRef] [PubMed]
- Zhukov, A.; Garcia, C.; Ilyn, M.; Varga, R.; del Val, J.J.; Granovsky, A.; Rodionova, V.; Ipatov, M.; Zhukova, V. Magnetic and transport properties of granular and Heusler-type glass-coated microwires. J. Magn. Magn. Mater. 2012, 324, 3558–3562. [Google Scholar] [CrossRef]
- Salaheldeen M.; Zhukova, V.; Wederni, A.; Ipatov M.; Zhukov, A. Magnetic Properties of Co2MnSi-based Heusler Alloy Glass-coated Microwires. IEEE Transactions on Magnetics, 2023. [CrossRef]
- Salaheldeen, M.; Garcia, A.; Corte-Leon, P.; Ipatov, M.; Zhukova, V.; Zhukov, A. Unveiling the Effect of Annealing on Magnetic Properties of Nanocrystalline Half-Metallic Heusler Co2FeSi Alloy Glass-Coated Microwires. J. Mater. Res. Technol. 2022, 20, 4161–4172. [Google Scholar] [CrossRef]
- Salaheldeen, M.; Ipatov, M.; Zhukova, V.; García-Gomez, A.; Gonzalez, J.; Zhukov, A. Preparation and magnetic properties of Co2-based Heusler alloy glass-coated microwires with high Curie temperature. AIP Adv. 2023, 13, 025325. [Google Scholar] [CrossRef]
- Ulitovsky AV, Maianski I M, Avramenco A I 1960 Method of continuous casting of glass coated microwire, Patent No 128427 (USSR), 15.05.60, Bulletin, No 10, p. 14.
- Gemperle R, Kraus L and Schneider J 1978 Magnetization reversal in amorphous (Fe1−xNix)80P10B10 microwires Czezh. J. Phys. B. 28 1138–1145.
- Chiriac, H.; Lupu, N.; Stoian, G.; Ababei, G.; Corodeanu, S.; Óvári, T.A. Ultrathin Nanocrystalline Magnetic Wires. Crystals 2017, 7, 48. [Google Scholar] [CrossRef]
- Salaheldeen, M.; Wederni, A.; Ipatov, M.; Gonzalez, J.; Zhukova, V.; Zhukov, A. Elucidation of the Strong Effect of the Annealing and the Magnetic Field on the Magnetic Properties of Ni2-Based Heusler Microwires. Crystals 2022, 12, 1755. [Google Scholar] [CrossRef]
- Zhukova, V.; Cobeño, A.F.; Zhukov, A.; de Arellano Lopez, A.R.; López-Pombero, S.; Blanco, J.M.; Larin, V.; Gonzalez, J. Correlation between magnetic and mechanical properties of devitrified glass-coated Fe71.8Cu1Nb3.1Si15B9.1 microwires. J. Magn. Magn. Mater. 2002, 249, 79–84. [Google Scholar] [CrossRef]
- Salaheldeen, M.; Garcia-Gomez, A.; Ipatov, M.; Corte-Leon, P.; Zhukova, V.; Blanco, J.M.; Zhukov, A. Fabrication and Magneto-Structural Properties of Co2-Based Heusler Alloy Glass-Coated Microwires with High Curie Temperature. Chemosensors 2022, 10, 225. [Google Scholar] [CrossRef]
- Talaat, A.; Alonso, J.; Zhukova, V.; Garaio, E.; García, J.A.; Srikanth, H.; Phan, M.H.; Zhukov, A. Ferromagnetic Glass-Coated Microwires with Good Heating Properties for Magnetic Hyperthermia. Sci. Rep. 2016, 6, 39300. [Google Scholar] [CrossRef]
- Kozejova, D.; Fecova, L.; Klein, P.; Sabol, R.; Hudak, R.; Sulla, I.; Mudronova, D.; Galik, J.; Varga, R. Biomedical Applications of Glass-Coated Microwires. J. Magn. Magn. Mater. 2019, 470, 2–5. [Google Scholar] [CrossRef]
- Salaheldeen, M.; Ipatov, M.; Corte-Leon, P.; Zhukova, V.; Zhukov, A. Effect of Annealing on the Magnetic Properties of Co2MnSi-Based Heusler Alloy Glass-Coated Microwires. Metals 2023, 13, 412. [Google Scholar] [CrossRef]
- Zhukov, A.; Corte-Leon, P.; Gonzalez-Legarreta, L.; Ipatov, M.; Blanco, J.M.; Gonzalez, A.; Zhukova, V. Advanced Functional Magnetic Microwires for Technological Applications. J. Phys. D Appl. Phys. 2022, 55, 253003. [Google Scholar] [CrossRef]
- Zhukov, A. , Ipatov, M., del Val, J.J., Zhukova, V., Chernenko, V.A., Magnetic and structural properties of glass-coated Heusler-type microwires exhibiting martensitic transformation. Sci. Reports 2018, 8, 621. [Google Scholar] [CrossRef]
- Kirat, G. Improving the Magnetocaloric Performance of NiMnSnB Heusler Alloys with V Substitutions. J. Supercond. Nov. Magn. 2022, 35, 3323–3331. [Google Scholar] [CrossRef]
- Ahmad, A.; Mitra, S.; Srivastava, S. K.; Das, A. K. Size-dependent structural and magnetic properties of disordered Co2FeAl Heusler alloy nanoparticles. J. Magn. Magn. Mater. 2019, 474, 599–604. [Google Scholar] [CrossRef]
- Salaheldeen, M.; Wederni, A.; Ipatov, M.; Zhukova, V.; Zhukov, A. Preparation and Magneto-Structural Investigation of High-Ordered (L21 Structure) Co2MnGe Microwires. Processes 2023, 11, 1138. [Google Scholar] [CrossRef]
- Herzer, G. Amorphous and nanocrystalline soft magnets. In Proceedings of the NATO Advanced Study Insititute on Magnetic Hysteresis in Novel Materials, Mykonos, Greece, 1–12 July 1996; Hadjipanayis, G.C., Ed.; NATO ASI Series (Series E: Applied Sciences); Kluwer Academic Publishers: Dordrecht, The Netherlands, 1997; Volume 338, pp. 711–730. [Google Scholar]
- Kohn, A.; Lazarov, V. K. ; The structure of sputter-deposited Co2MnSi thin films deposited on GaAs(001). Journal of Applied Physics 2007, 101, 023915. [Google Scholar] [CrossRef]
- Hong-xi, L.; Yusuke, H.; Tomoyuki, T.; Ken-ichi, M.; Masashi, A.; Tetsuya, U.; Masafumi, Y. ; Giant tunneling magnetoresistance in epitaxial Co2MnSi/MgO/Co2MnSi magnetic tunnel junctions by half-metallicity of Co2MnSi and coherent tunneling. Appl. Phys. Lett. 2012, 101, 132418. [Google Scholar] [CrossRef]
- Elphick, K.; Frost, W.; Samiepour, M.; Kubota, T.; Takanashi, K.; Sukegawa, H.; Mitani, S.; Hirohata, A. Heusler Alloys for Spintronic Devices: Review on Recent Development and Future Perspectives. Sci. Technol. Adv. Mate. 2021, 22, 235–271. [Google Scholar] [CrossRef]

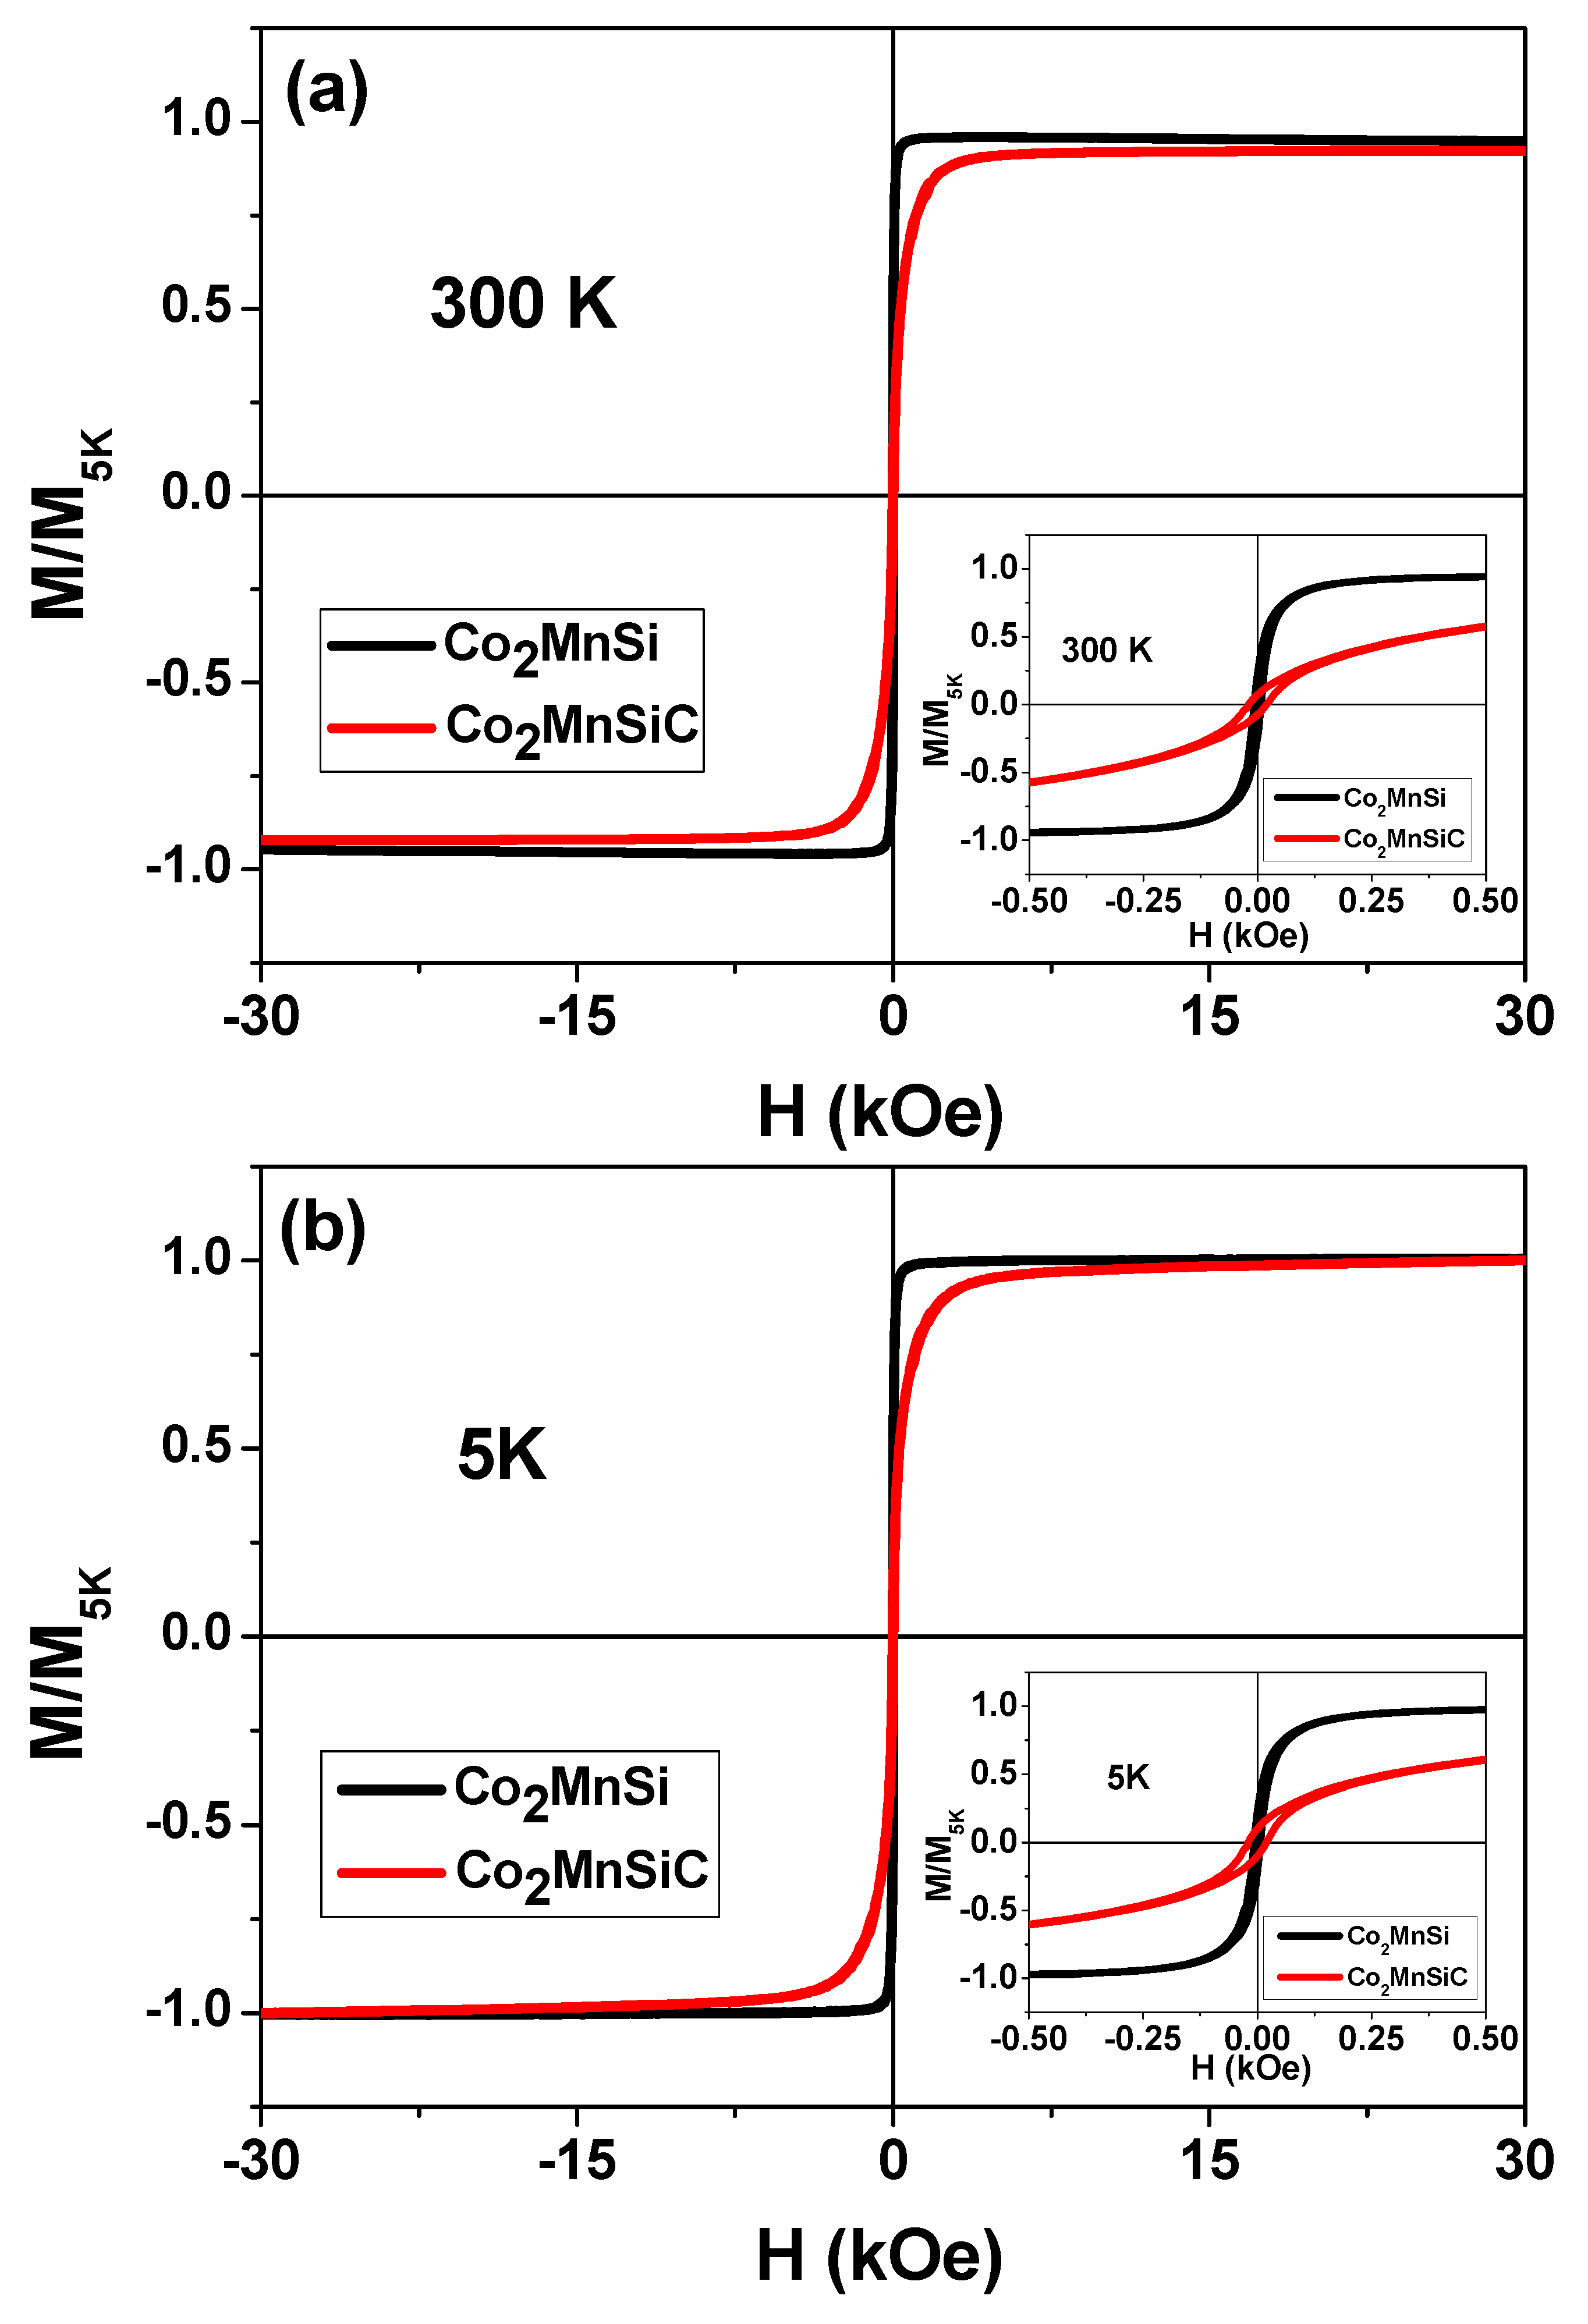
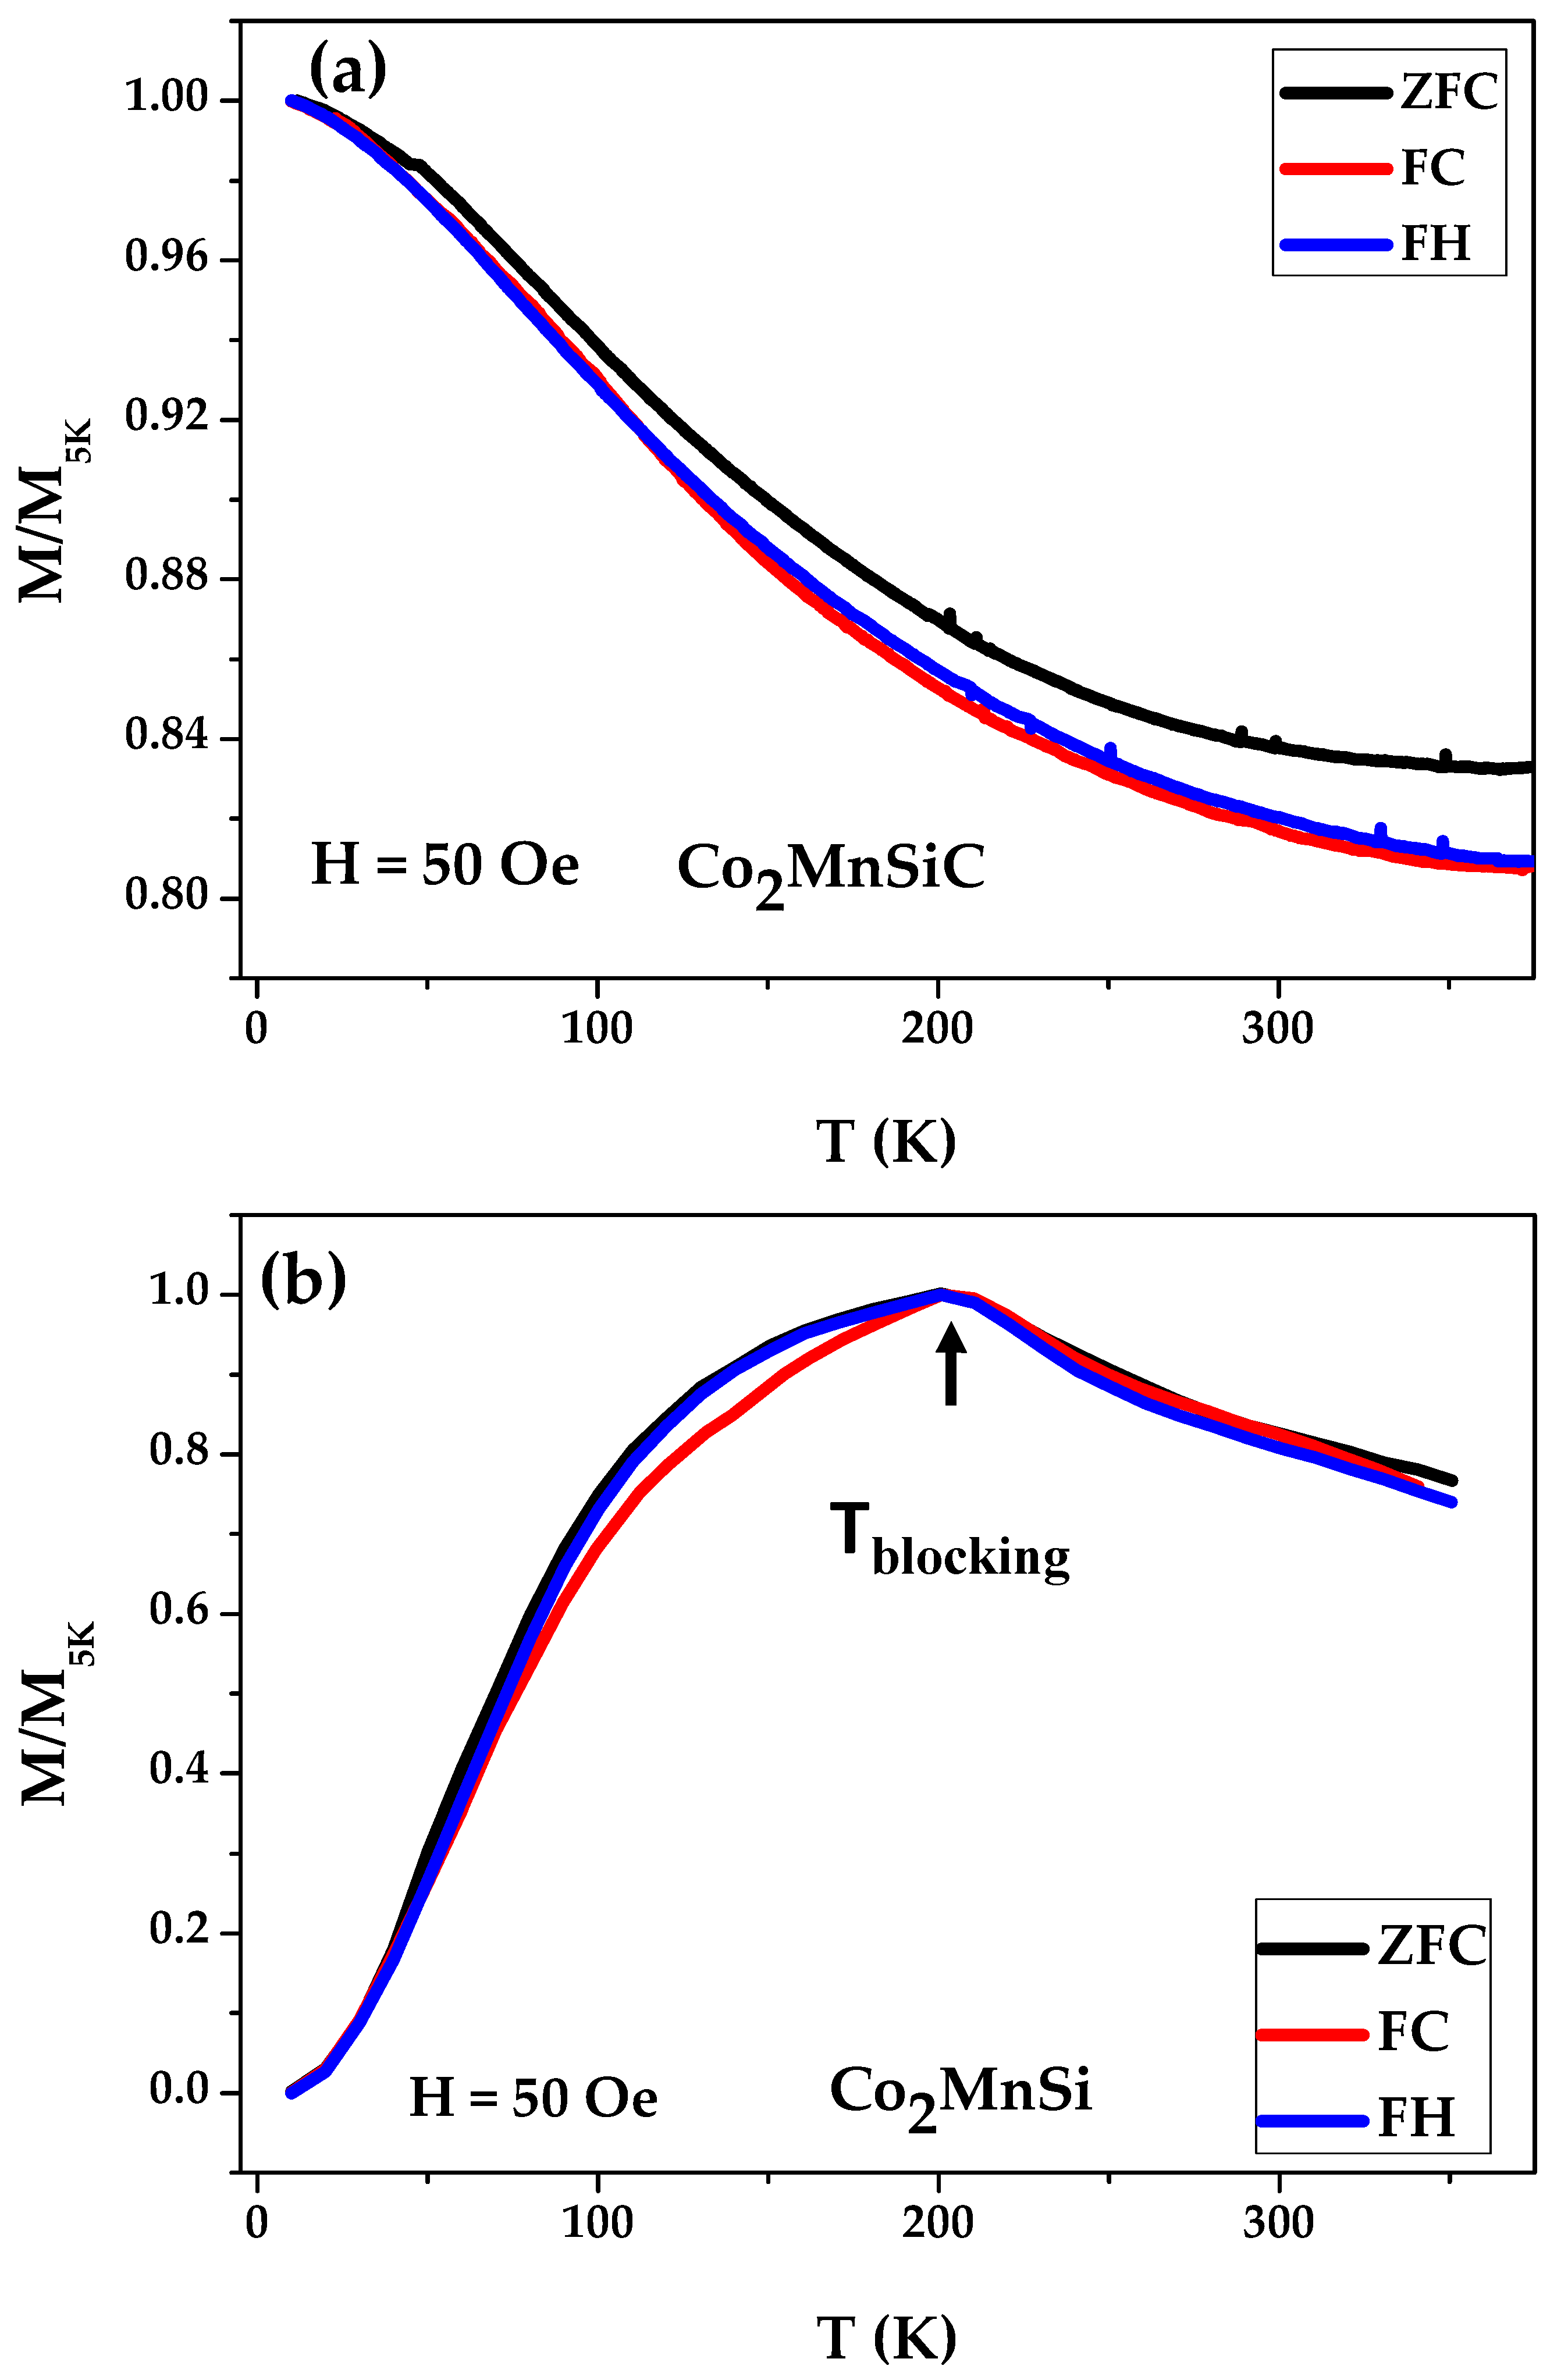
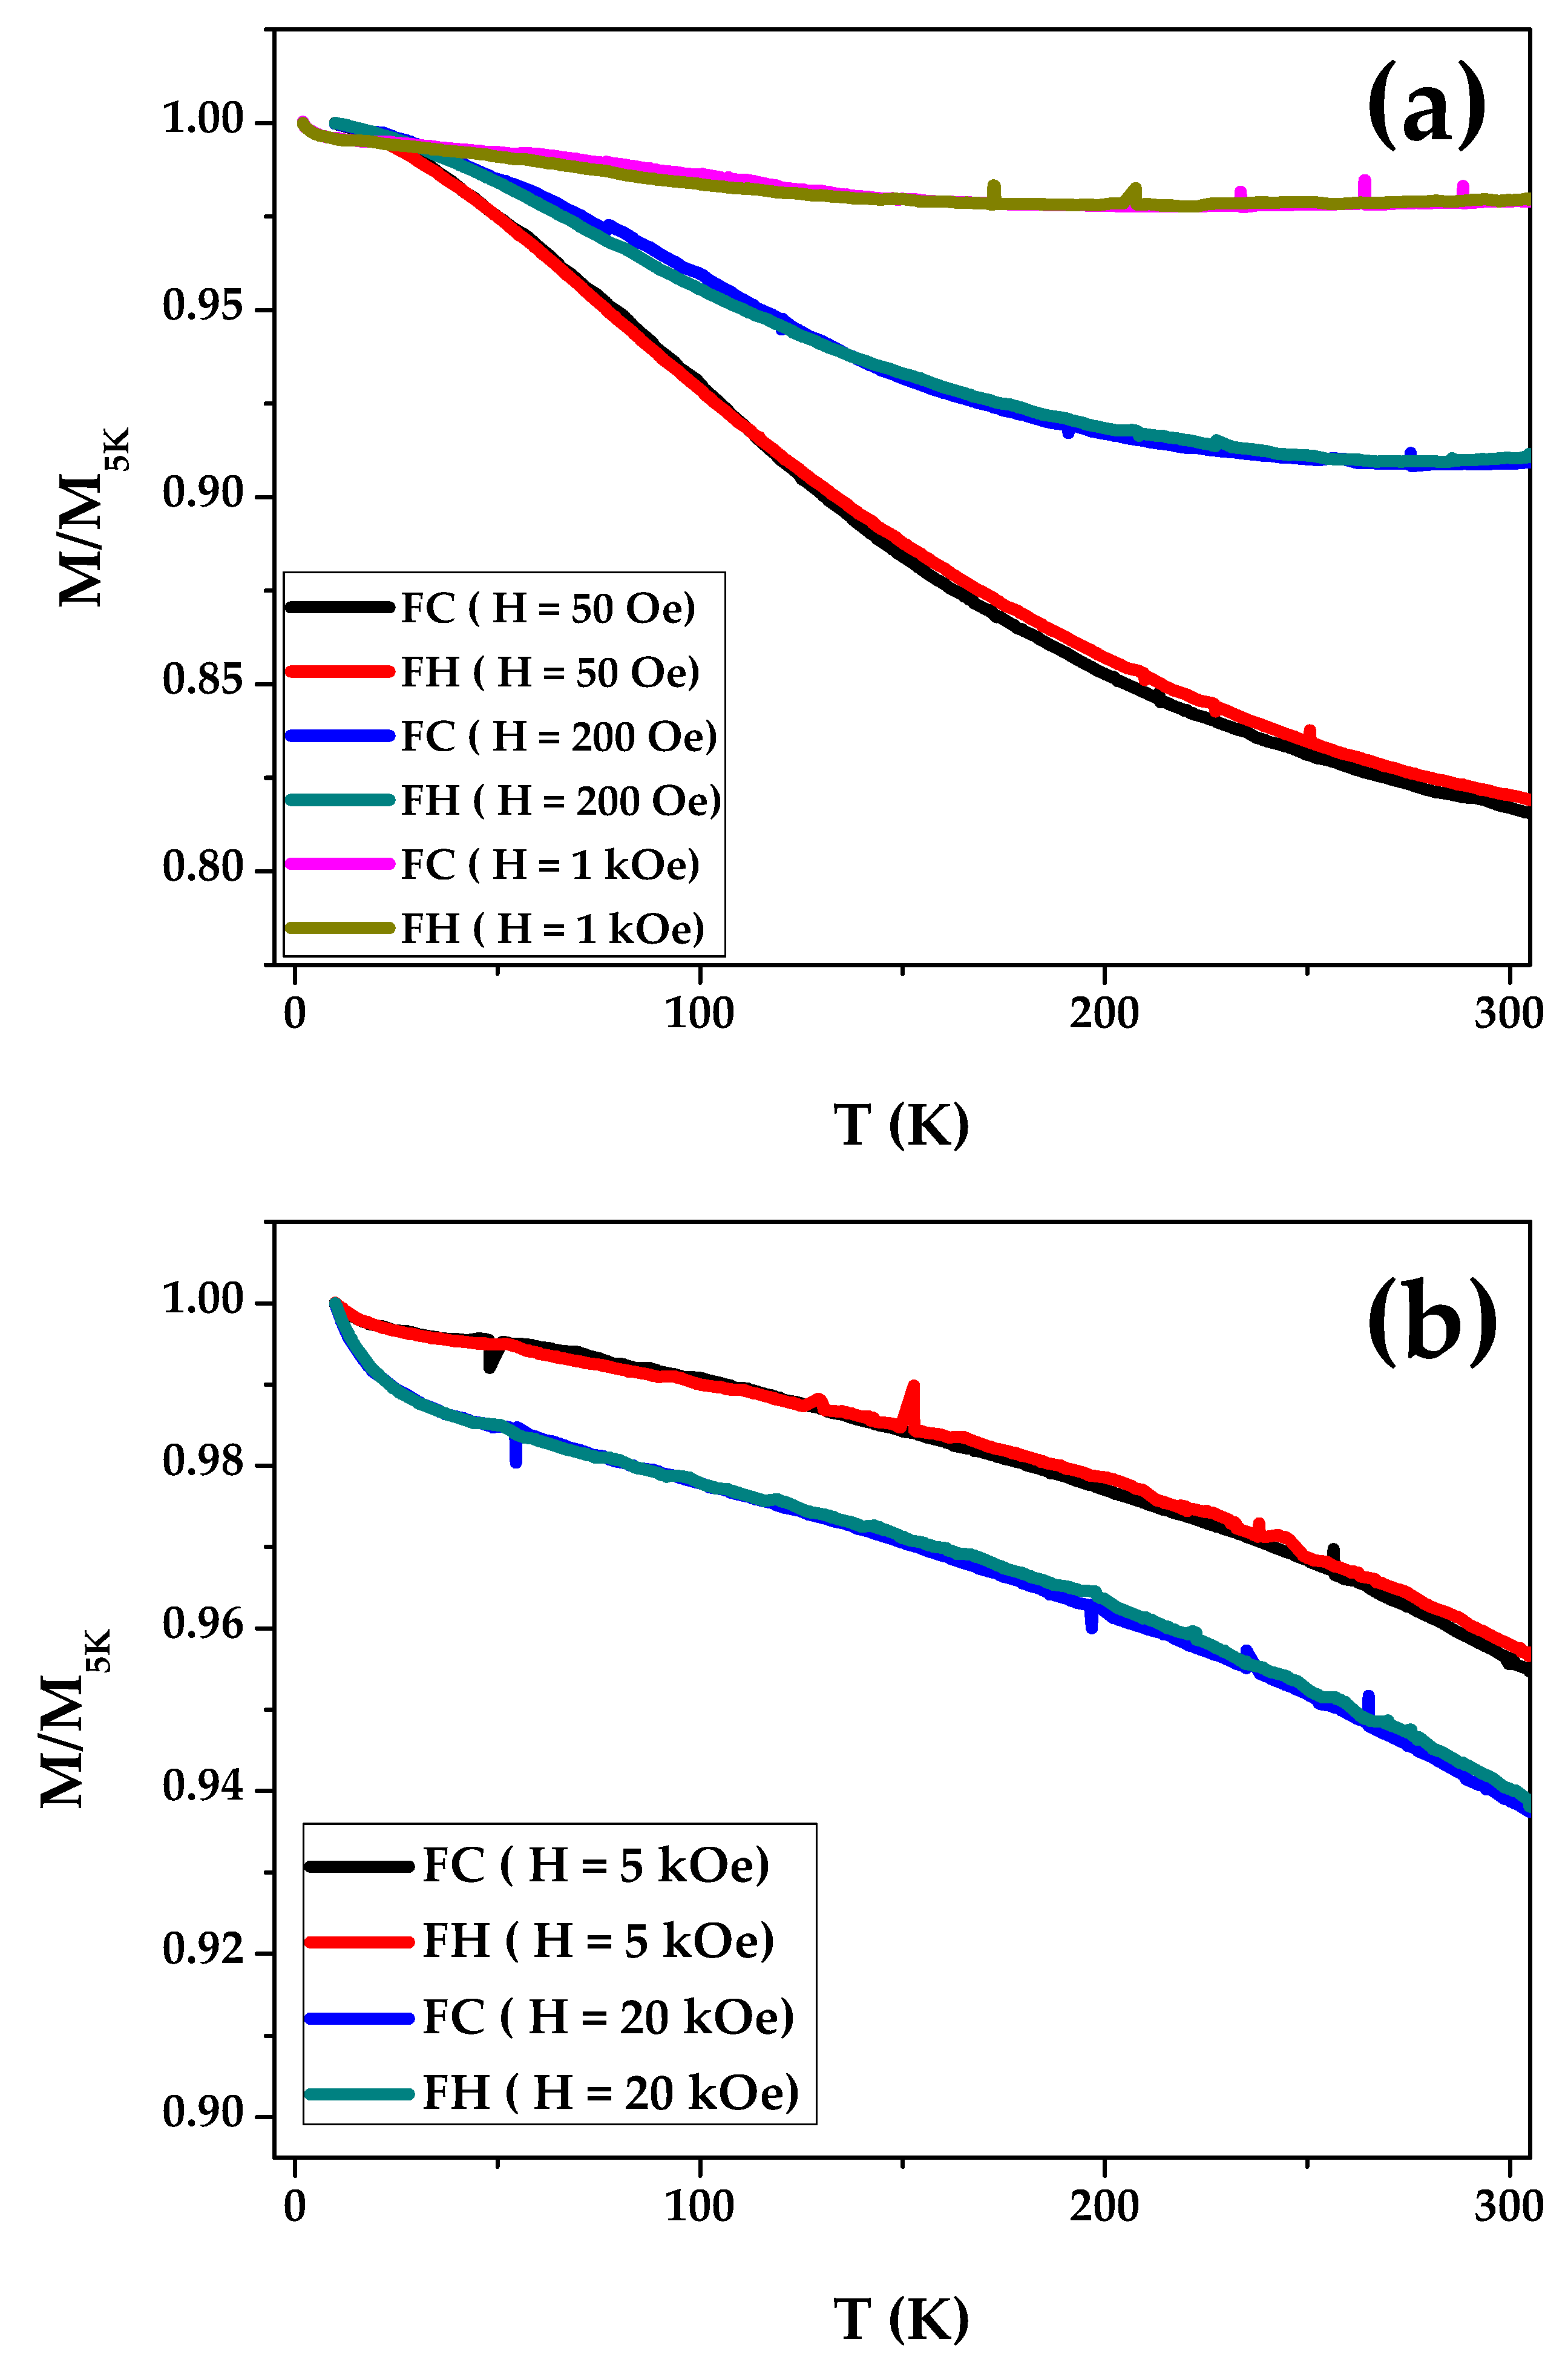
| EDX spectrum | Av. Co(at %) | Av. Mn(at %) | Av. Si (at %) | Av. C (at %) |
|---|---|---|---|---|
| Co2MnSi-MWs | 51±0.6 | 23.9±0.5 | 25.1±0.7 | - |
| Co2MnSiC-MWs | 50.4±0.2 | 23.8±0.3 | 25.4±0.6 | 0.4±0.1 |
| Parameters | Co2MnSi-MWs | Co2MnSiC-MWs |
|---|---|---|
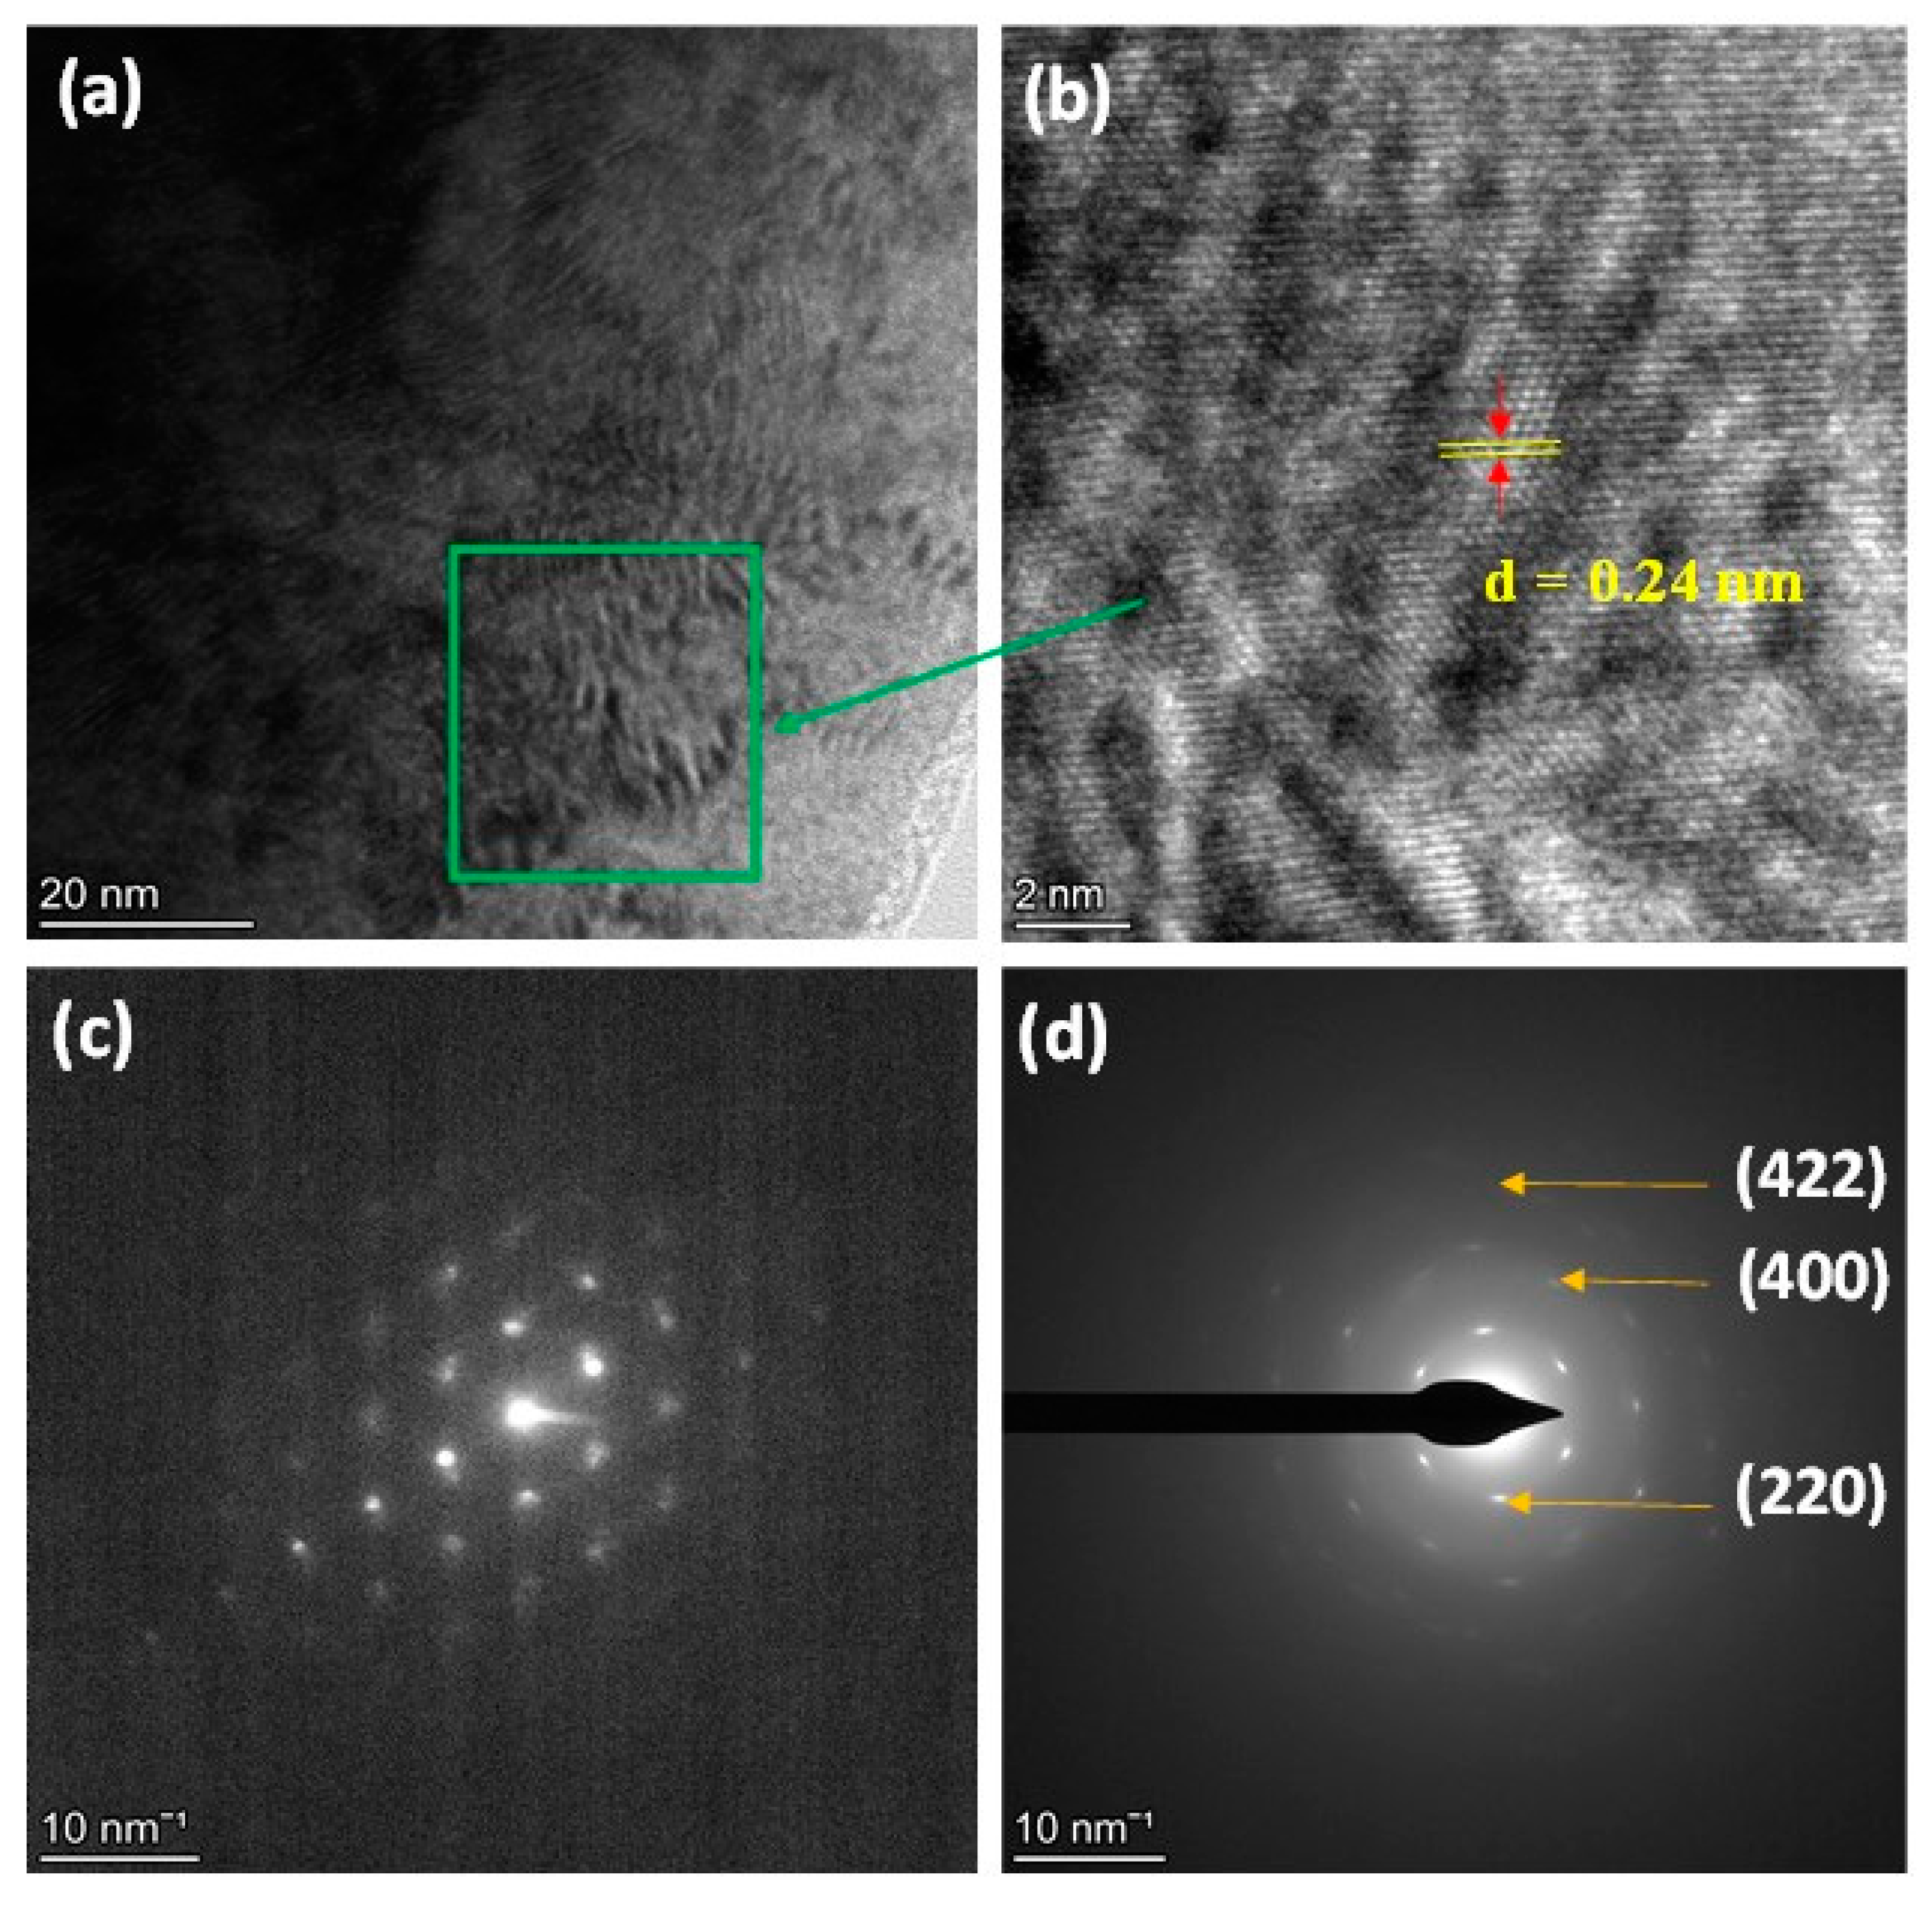
| Dg (nm) | 46±0.7 | 29.2±0.6 |
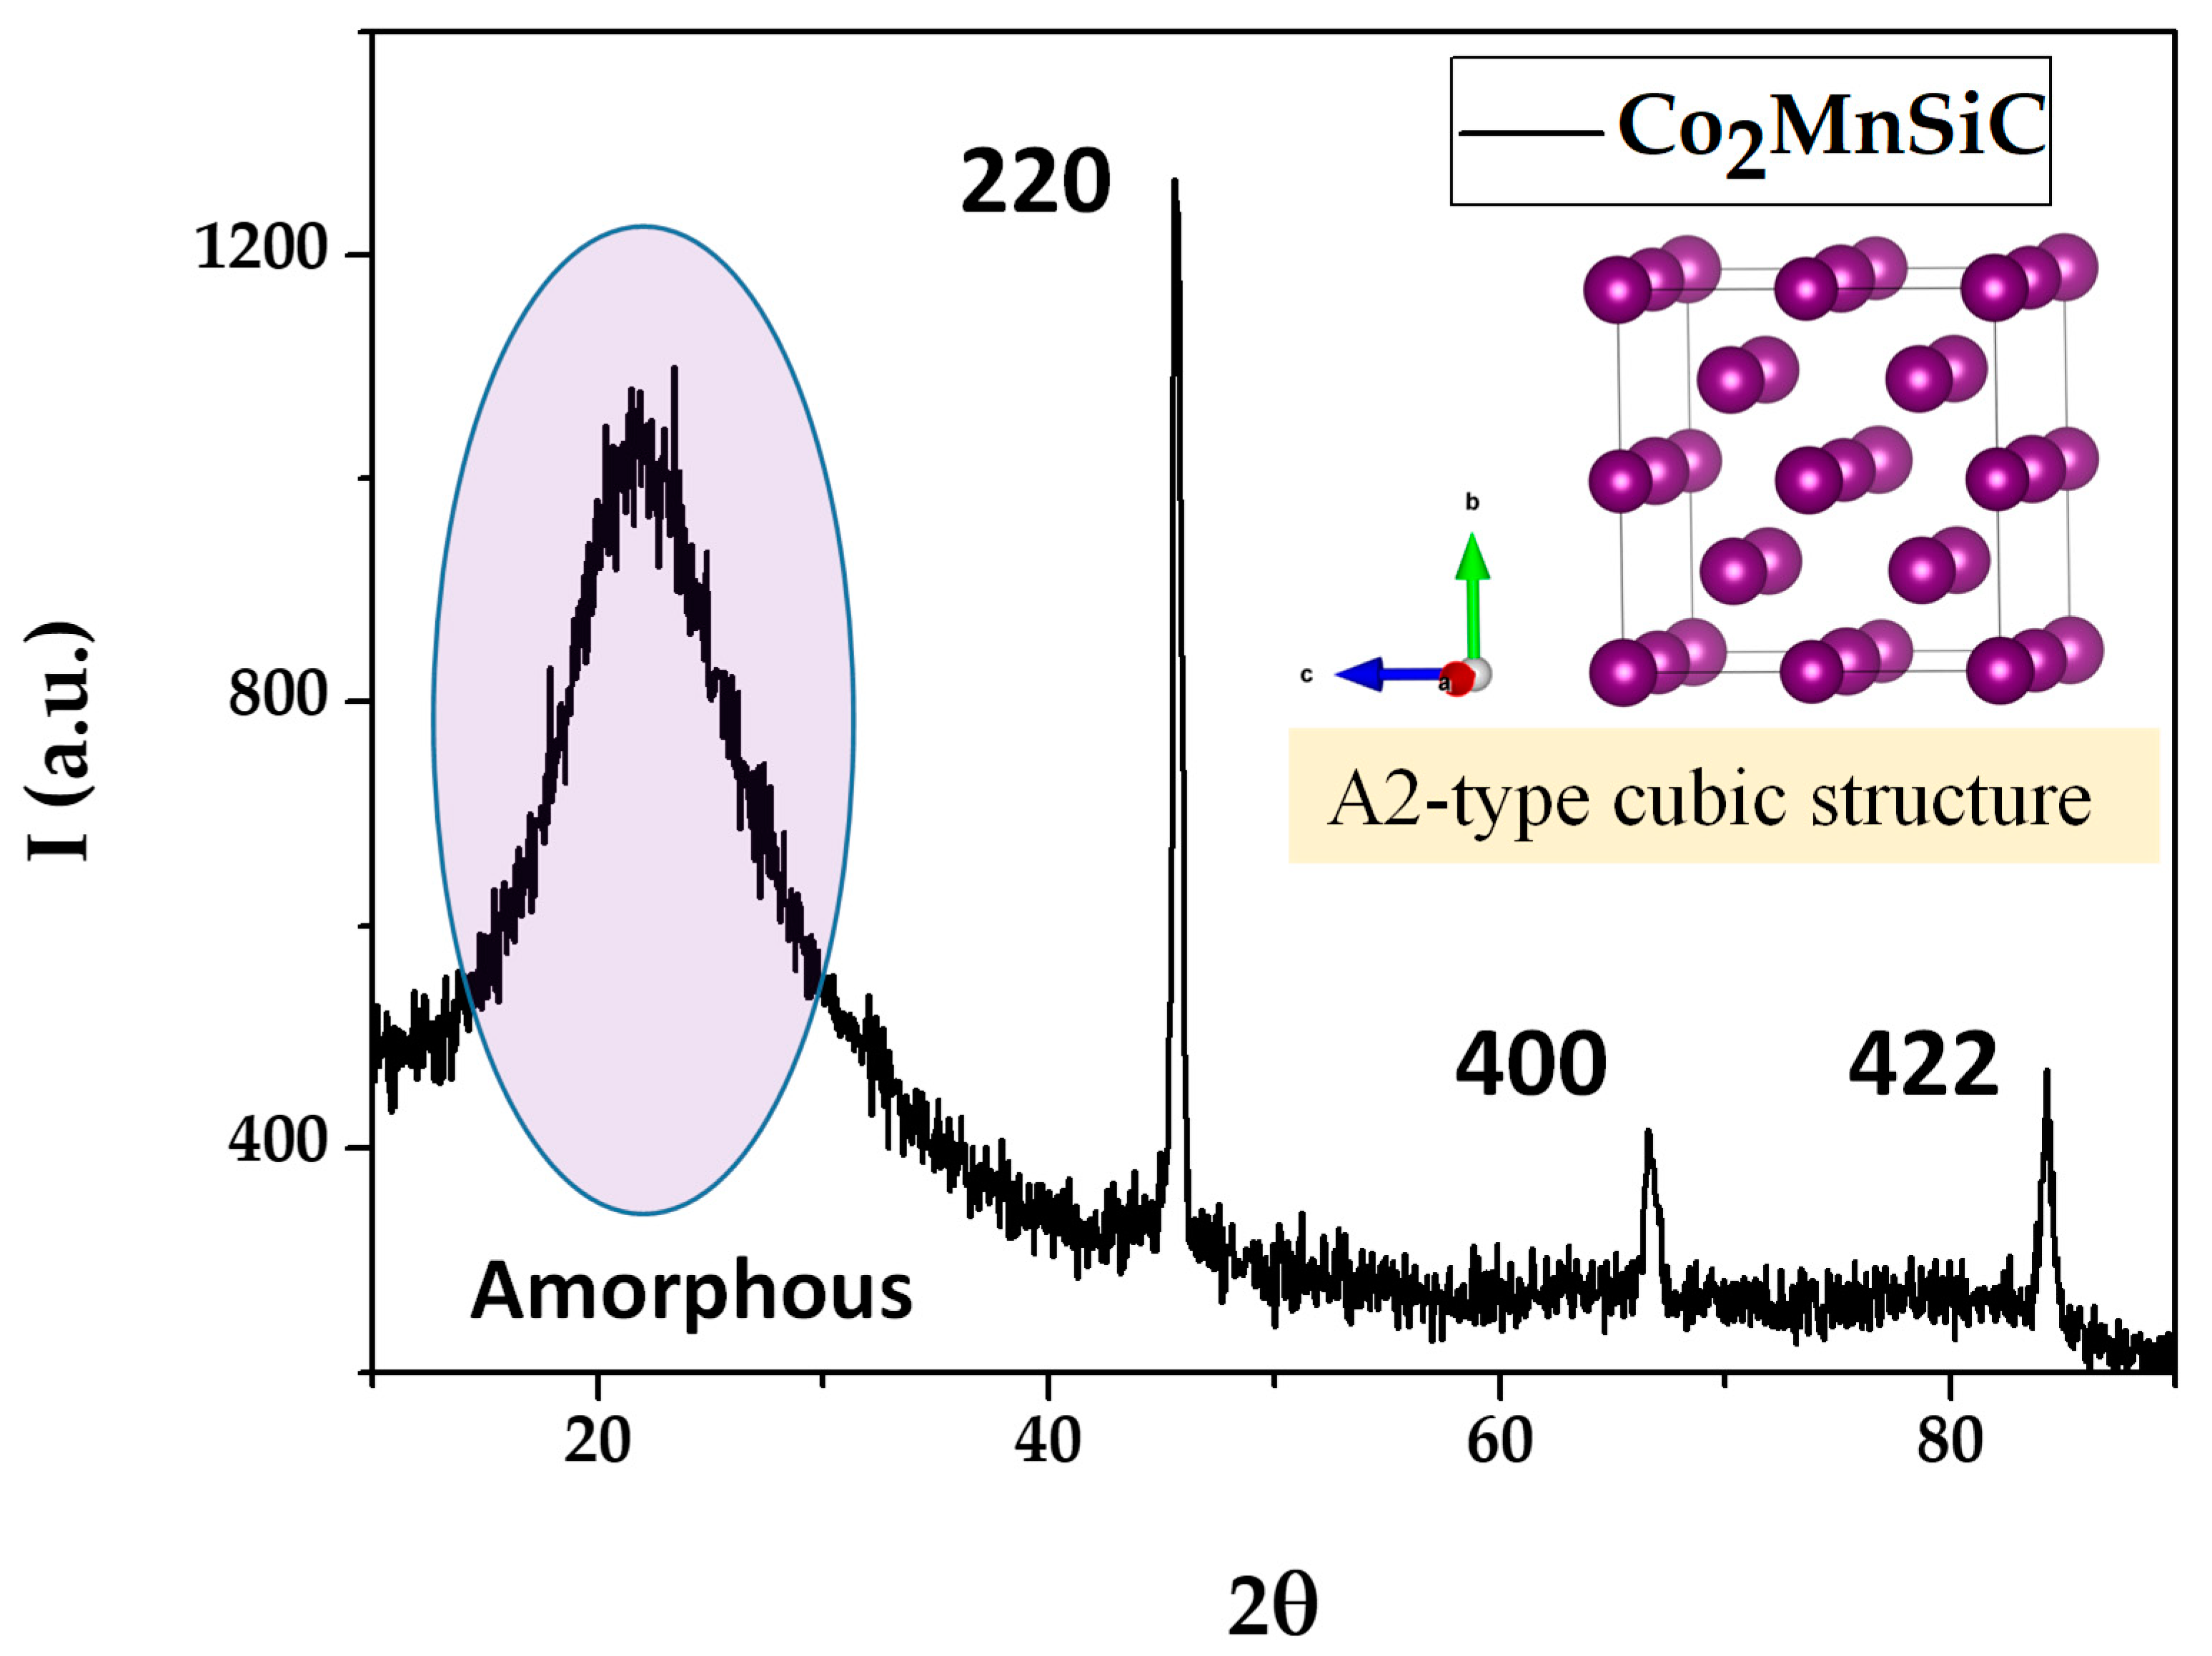
| a (Å) | 5.62 | 2.85 |
| Ordered | L21 & B2 | A2 |
| Co2MnSi-MWs | Co2MnSiC-MWs | |||
|---|---|---|---|---|
| T(K) | Hc(Oe) | Mr | Hc(Oe) | Mr |
| 5 | 7±1 | 0.22±0.01 | 19.8±0.5 | 0.096±0.001 |
| 10 | 6 ±1 | 0.19±0.01 | 19.8±0.5 | 0.1±0.001 |
| 20 | 5±1 | 0.18±0.01 | 19.9±0.5 | 0.096±0.001 |
| 50 | 7±1 | 0.2±0.01 | 20±0.5 | 0.092±0.001 |
| 100 | 6±1 | 0.2±0.01 | 20±0.5 | 0.09±0.001 |
| 150 | 6±1 | 0.2±0.01 | 19.9±0.5 | 0.08±0.001 |
| 200 | 8±1 | 0.2±0.01 | 19.8±0.5 | 0.08±0.001 |
| 250 | 8±1 | 0.22±0.01 | 19.8±0.5 | 0.07±0.001 |
| 300 | 9±1 | 0.23±0.01 | 19.6±0.5 | 0.07±0.001 |
| Δ | 4 (Oe) | 0.05 | 0.4 (Oe) | 0.03 |
| H (Oe) | ΔM (%) (FC) | ΔM (%) (FH) | ΔM (%) Av. |
|---|---|---|---|
| 50 | 81 | 82 | 81.5 |
| 200 | 91 | 91.6 | 91.3 |
| 1000 | 97.3 | 98.1 | 97.7 |
| 5000 | 95.2 | 95.4 | 95.3 |
| 20000 | 93.6 | 93.8 | 93.7 |
| Av. | 91.6 | 92.2 | 91.9 |
Disclaimer/Publisher’s Note: The statements, opinions and data contained in all publications are solely those of the individual author(s) and contributor(s) and not of MDPI and/or the editor(s). MDPI and/or the editor(s) disclaim responsibility for any injury to people or property resulting from any ideas, methods, instructions or products referred to in the content. |
© 2023 by the authors. Licensee MDPI, Basel, Switzerland. This article is an open access article distributed under the terms and conditions of the Creative Commons Attribution (CC BY) license (http://creativecommons.org/licenses/by/4.0/).


