
Submitted:
13 June 2023
Posted:
14 June 2023
You are already at the latest version
Abstract
Background: Understanding the factors that influence the market entry, exit, and stability of community pharmacies (i.e., market dynamics) is important for stakeholders ranging from patients to health policymakers and small business owners to large corporate institutions. The purpose of this article is to provide an update to a 15-year ecological comparison for the market dynamics of Minnesota community pharmacies from 2002 to 2017 [1]. Objectives: The first objective was to update the 15-year study [1] by describing the market dynamics of community pharmacies for each county in the state of Minnesota every five years over a 20-year period (i.e., 2002-2022). The second objective was to update the 15-year study by describing the number and proportion of community pharmacies for each county in the state of Minnesota every five years over a 20-year period (i.e., 2002-2022) by (1) ‘Business Organization Structure’ and (2) ‘Pharmacy Type.’ The third and fourth objectives were new for the 2022 study. In response to evolutionary trends in the pharmacy market, objective three described the number of Minnesota licensed pharmacies located in-state and out-of-state between 2002 and 2022. Objective four described the primary type of service provided by licensed pharmacies categorized as out-of-state in 2002 and in 2022. Methods: Data were obtained from the Minnesota Board of Pharmacy, US Census Bureau, and Minnesota State Demographic Center for 2002, 2007, 2012, 2017, and 2022. Descriptive statistics were used to tabulate and summarize the findings and test associations between study variables. Results: Over the 20-year study period, the total number of community pharmacies in Minnesota remained steady. Findings for 2022 were similar to those for 2017 regarding the effects of population density and metropolitan designation on the market dynamics of community pharmacies and regarding the organizational structures and types of pharmacies. The findings revealed significant growth in the number of proportion of pharmacies licensed in Minnesota that were located out-of-state. In 2002, there were 283 of these pharmacies (19% of the total). By 2022, this grew to 960 (46% of the total). Over that 20-year period, the number of mail order and medical supply service pharmacies rose from 196 to 413. The number of specialty pharmacy distributors rose from 37 to 230 and the number of compounding pharmacies rose from 33 to 202. Discussion: The findings confirmed the shift over the past 20 years from traditional retail convenience models to healthcare access models based on population health metrics. National scalability was another detected shift in order to have profitable margins for some services and was feasible due to advances in technologies. Conclusion: The findings showed that community pharmacy distribution in Minnesota’s 87 counties shifted between 2002 and 2022 from traditional retail convenience models to healthcare access models based on population health metrics and to nationally scalable models based on economic pressures. This signals the need for not only new approaches for tracking community pharmacy market dynamics but also adjustments by community pharmacies to remain relevant in a new environment of patient care services.
Keywords:
Independent
; Chain
; Community pharmacy
; Market dynamics
; trends
; access
; population health
; Minnesota
Introduction
1.1. Background
The purpose of this article is to provide an update to a 15-year ecological comparison for the market dynamics of Minnesota community pharmacies from 2002 to 2017 [1]. The goal for that comparison was to describe the factors that influence the market entry, exit, stability of community pharmacies using environmental attributes drawn from organizational behavior theory [2,3]. Previous findings showed that factors beyond traditional predictors (such as locational convenience) had emerged as being relevant for understanding community pharmacy market dynamics [1]. Community pharmacies are frequently being organized by their capacity to serve as healthcare access points that provide patient care and public health services like medication management services, immunizations, opioid rescue drugs, reproductive health access, drug disposal, health screening, and specialty services [1]. In a recent review by Shcherbakova and Desselle [4], six evolutionary trends in pharmacy were identified for the decade of the 2020s:
- Shift from traditional to specialty drug products
- Growth in pharmacist’s involvement in reimbursed disease management services
- Automation of pharmacy and gradual extinction of traditional dispensing roles
- Transformation of pharmacies into healthy living centers
- Continuing growth of the digital health enterprise
- Rise of analytical pharmacy to test each batch of dispensed medication
In addition to these emergent trends, community pharmacy practice also responded to the COVID-19 pandemic since our last report by providing testing, parenteral antibodies, vaccinations, antiviral therapies, and inpatient care [5]. Thus, there was a need to update our findings using 2022 data in order to monitor the market dynamics of community pharmacies over time.
1.2. Objectives
The first objective of this study was to update the 15-year study [1] by describing the market dynamics of community pharmacies for each county in the state of Minnesota every five years over a 20-year period (i.e., 2002-2022). Methods for this objective were guided by previous work which associated county (a) population density and (b) metropolitan designation with the change in the number of ‘All community pharmacies,’ ‘Chain community pharmacies,’ and ‘Independent community pharmacies’ [1,2,3].
The second objective was to update the 15-year study by describing the number and proportion of community pharmacies for each county in the state of Minnesota every five years over a 20-year period (i.e., 2002-2022) by (1) ‘Business Organization Structure’ and (2) ‘Pharmacy Type.’ These two variables reflect varying approaches to generating revenue and providing health services by community pharmacies in response to environmental factors (i.e., market dynamics) [1,2,3].
The third and fourth objectives were new for the 2022 study. In response to evolutionary trends in the pharmacy market [1,4], objective three described the number of Minnesota licensed pharmacies located in-state and out-of-state between 2002 and 2022. Objective four described the primary type of service provided by licensed pharmacies categorized as out-of-state in 2002 and in 2022. These objectives are new approaches for tracking adjustments by community pharmacies to remain relevant in a new environment of patient care services. The inclusion of Minnesota-licensed pharmacies that are located out-of-state acknowledges the expansion of services provided at the patient’s home, from a remote provider, with nationally-scaled service models [6,7].
Methods
2.1. Data Sources
Publicly available data for the names and addresses of pharmacies that were licensed in Minnesota was obtained from the Minnesota Board of Pharmacy for 2002, 2007, 2012, 2017, and 2022 [8]. Population density and metropolitan designation information for each county were obtained from the US Census Bureau and Minnesota State Demographic Center [9,10].
2.2. Data Analysis
Each pharmacy in Minnesota was categorized from state licensing board records by their location (i.e., county), ‘Business Organization Structure,’ and ‘Pharmacy Type.’ Detailed descriptions for these variables are in our prior report [1] and are included in Appendix A for this paper.
For the new study objectives (3 and 4), each out-of-state pharmacy in the years 2002 (n = 283) and 2022 (n = 960) was categorized by (a) Walk-In Pharmacy and (b) Primary Service. ‘Walk-In Pharmacy’ was operationally defined as a community pharmacy that provides general prescription medication dispensing services to any person who physically “walks in” with a valid prescription. The facility’s primary function is to store, prepare and legally dispense prescription drugs under the professional supervision of a licensed pharmacist. It meets any licensing or certification standards set forth by the jurisdiction where it is located. It was coded as ‘Yes’ or ‘No’.
‘Primary Service’ was operationally defined as the primary service function offered to Minnesota residents as described in publicly available records. Five codes were used:
- Mail-order and medical supply service (use of common carriers to deliver goods)
- Specialty pharmacy distributor (low volume/high cost/specialized delivery or administration)
- Compounding pharmacy (combining/mixing/altering ingredients tailored to an individual)
- Medication management support services (to achieve planned, therapeutic outcomes)
- Specialized packaging services (customized packs/devices for improving access/adherence)
Each out-of-state pharmacy in 2002 and in 2022 was coded for the ‘Walk-In Pharmacy’ and ‘Primary Service’ variables using an “online virtual visit” approach. These visits were accomplished by visiting the pharmacy’s website, social media, advertising, customer portals, client portals, maps, news coverage, and publicly available government agency records. Two authors (J.C.S. and S.L.) independently coded 20 pharmacies to assess inter-judge reliability using the Perrault and Leigh reliability index (I): I = {[(F/N) – (1/k)] [k/(k – 1)]} ½, where F = the observed frequency of agreement between judges, N = the total number of judgments, and k = the number of categories [11]. The Interjudge reliability scores were 0.95 and 0.94 for ‘Walk-In Pharmacy’ and ‘Primary Service’, respectively. In light of a reliability score well above the recommended level of 0.90 [11], coding was completed by one researcher (J.C.S.).
Descriptive statistics were used for tabulating and summarizing the findings for the years 2002, 2007, 2012, 2017, and 2022. Statistical associations between independent and dependent variables were described using Pearson Chi-square analysis. A p-value of less than 0.05 was the significance threshold used for each test and was computed using IBM SPSS version 27.0. Likelihood-ratio and Fisher’s exact tests confirmed that all study comparisons were stable, with none altering the interpretation of significance.
Results
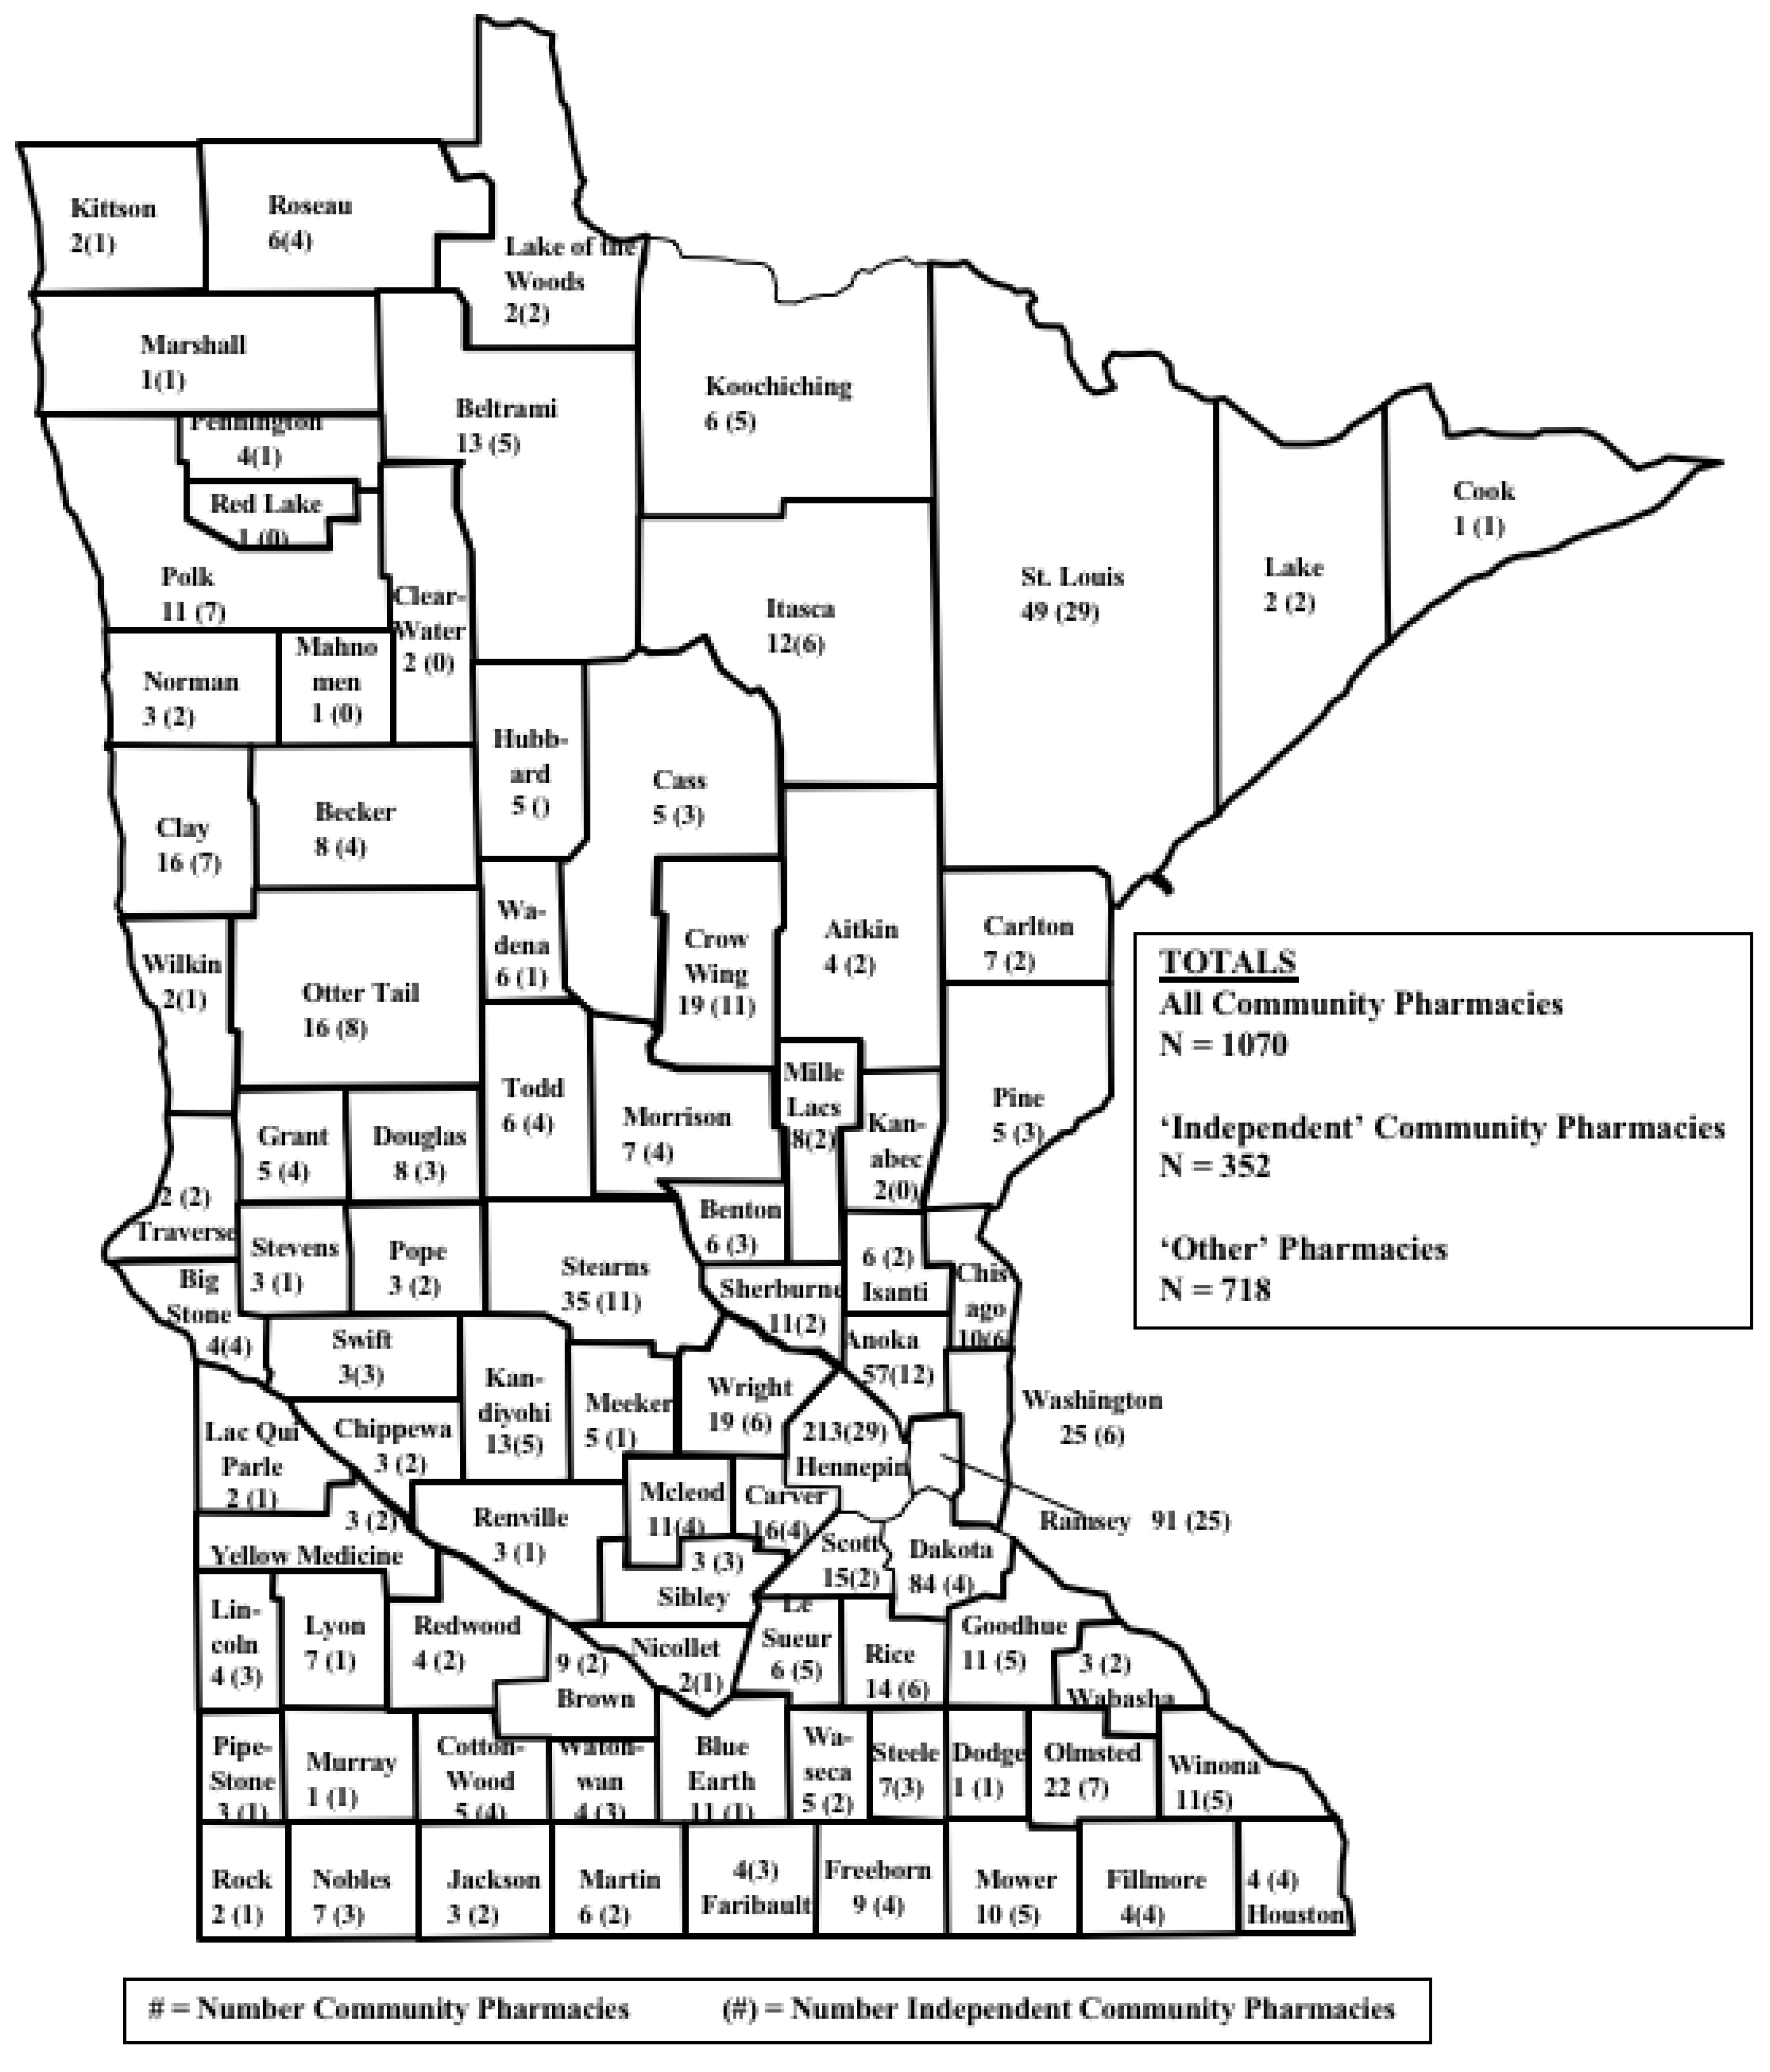
Findings for objectives 1 and 2 build upon our previous article [1] and updates are in Appendix B. The first study objective was to describe the market dynamics of community pharmacies for each county in the state of Minnesota every five years over a 20-year period (i.e., 2002-2022). Maps A through E show that every county in Minnesota had at least one community pharmacy for all of the data collection years. Over the 20-year study period, the total number of community pharmacies in Minnesota remained steady (from 996 in 2002 to 1039 in 2022; 4% increase) even though the population changed from 5,018,935 in 2022 to 5,717,184 in 2022 (14% increase). Table A1, Table A2, Table A3, Table A4, Table A5, Table A6, Table A7, Table A8 and Table A9 and Figure A1, Figure A2, Figure A3, Figure A4, Figure A5 and Figure A6 update our previous article [1] that tracks changes in each county’s (a) population density and (b) metropolitan designation with the change in the number of ‘All community pharmacies,’ ‘Chain community pharmacies,’ and ‘Independent community pharmacies.’ The second objective was to describe the number and proportion of community pharmacies for each county in the state of Minnesota every five years over a 20-year period from 2002 through 2022 by (1) ‘Business Organization Structure’ and (2) ‘Pharmacy Type.’ In Appendix B, Table A10 and Figure A7, Figure A8 and Figure A9 update our previous article [1].
The inclusion of the 2022 data in our earlier report [1] confirmed that community pharmacy distribution in Minnesota’s 87 counties shifted from traditional retail convenience models to healthcare access models based on population health needs. In addition, new forces are shaping pharmacy such as specialty drugs, automation, digital health, analytical testing [4], pharmacogenomics, smart home technology, real-time patient monitoring devices, and nationally-scaled service models [6,7]. This signals the need for new approaches for tracking community pharmacy dynamics and leads us to the findings for study objectives 3 and 4.
Objective 3 described the number of Minnesota licensed pharmacies located in-state and out-of-state between 2002 and 2022. Table 1 shows that 283 licensed pharmacies in Minnesota during 2002 were located out-of-state and accounted for 19% of the 1,454 pharmacies in total. By 2022, there were 960 licensed Minnesota pharmacies that were located out-of-state, accounting for 46% of the total (2,089 pharmacies).
Objective 4 described the number and proportion of the types of services provide by Minnesota pharmacies that were located out-of-state in 2002 and 2022. In those 20 years, Table 2 shows that the number of mail-order and medical supply service pharmacies rose from 196 to 413. The number of specialty pharmacy distributors rose from 37 to 230 and the number of compounding pharmacies rose from 33 to 202.

Table 2.
Primary Service Provided by Minnesota Licensed Pharmacies (n, % of total). that are Located Out-of-State (n = 283 in 2002 and n = 960 in 2022)
Table 2.
Primary Service Provided by Minnesota Licensed Pharmacies (n, % of total). that are Located Out-of-State (n = 283 in 2002 and n = 960 in 2022)
| 2002 | 2022 | |
|---|---|---|
| Mail-order and medical supply service | 196 (69%) | 413 (43%) |
| Specialty pharmacy distributor | 37 (13%) | 230 (24%) |
| Compounding pharmacy | 33 (12%) | 202 (21%) |
| Medication management support services | 17 (6%) | 96 (10%) |
| Specialized packaging services | 0 (0%) | 19 (2%) |
| Total | 283 (100%) | 960 (100%) |
| In both 2002 and 2022, 20% of the total were considered ‘Walk-In’ Pharmacies.‘Primary Service’ was operationally defined as the primary service function offered to Minnesota residents as described in publicly available records. | ||
Discussion
4.1. Update for the Market Dynamics of Minnesota Community Pharmacies
Findings from this study provided an update to our previously published ecological comparison for the market dynamics of Minnesota pharmacies [1] and confirmed the shift over the past 20 years from traditional retail convenience models to healthcare access models based on population health needs. Traditional models aimed to maximize the sale of products to customers with inventory generating revenue and success measured by the number of prescriptions dispensed and other products sold [12]. The new healthcare access models strive to connect service providers and patients, with service provision creating revenue [12]. Success is now achieved by attainment of population health outcomes [12]. We propose that pharmacies are becoming less reliant on space that is organized to display and sell products and are organizing their work systems and processes for patients to receive services [1,13,14].
4.2. The Emergence of Nationally-Scaled Service Models
For 2022, we added study objectives 3 and 4 in order to learn about the market dynamics of pharmacies licensed in Minnesota, but located outside of the state. Over the past 20 years, the proportion of Minnesota licensed pharmacies that were located out-of-state rose from 19% in 2002 to almost half (46%) in 2022. The services provided appear to need national scalability in order to have profitable margins. Examples include mail order/virtual pharmacy services, specialty drugs, compounded medications, medication management support, and tailored packaging services. Furthermore, we propose that national scalability is feasible through advances in communications, automation, internet technology, smart home technology, remote monitoring, digital health, machine learning and artificial intelligence algorithms. A survey conducted in 2022 revealed that over 70% of healthcare consumers are open to having medications prescribed by a specially-trained pharmacist instead of a physician, are willing to provide blood samples for genomic testing, and would prefer to have medication sent directly to their homes [15]. Businesses that are developing nationally scaled service models seem to be taking advantage of these trends.
4.3. Recommendations for Future Research
The findings raise questions for future inquiry. What do these findings mean for existing pharmacies and their current business models? What scope of practice changes are needed that relate to provider status, collaborative practice agreements, and pharmacist prescribing? What changes are needed to patient confidentiality laws? Do the new market dynamics create internet, technology or access deserts for some populations? Are current state-level regulations of pharmacies sufficient for consumer protection in light of the new market trends? Are healthcare access models that are based on population health metrics and the development of nationally-scalable models that are in reaction to economic pressures creating good models of care for individual patients? Can health care providers meet the expectations of these new models without suffering burnout?
4.4. Study limitations
The findings of this study should be interpreted within the limitations of the project. First, analyses were performed for only one state (Minnesota) and might not apply to other states. Second, only licensed pharmacies were considered, rather than all locations where patient care services are provided such as managed care organizations, medical centers, hospitals, community centers, and dental clinics. Finally, there may be other characteristics pertaining to pharmacy organizations and the populations they serve which can explain the market dynamics in this study.
Conclusions
The findings showed that community pharmacy distribution in Minnesota’s 87 counties shifted between 2002 and 2022 from traditional retail convenience models to healthcare access models based on population health metrics and to nationally scalable models based on economic pressures. This signals the need for not only new approaches for tracking community pharmacy market dynamics but also adjustments by community pharmacies to remain relevant in a new environment of patient care services.
Author Contributions
Conceptualization, Jon Schommer, Anthony Olson, Caroline Gaither and Timothy Stratton; Data curation, Anthony Olson; Formal analysis, Jon Schommer and Anthony Olson; Investigation, Jon Schommer and Anthony Olson; Methodology, Jon Schommer, SuHak Lee and Anita Jelodari; Project administration, Jon Schommer; Software, SuHak Lee; Validation, SuHak Lee, Gavin Wilson, Anita Jelodari, Caroline Gaither and Timothy Stratton; Writing – original draft, Jon Schommer; Writing – review & editing, Jon Schommer, Anthony Olson, SuHak Lee, Gavin Wilson, Anita Jelodari, Caroline Gaither and Timothy Stratton.
Funding
This project received no funding.
Acknowledgments
The authors thank Ronald S. Hadsall and Stephen W. Schondelmeyer for their insightful advice and for their previous research on this topic, which served as inspiration for this work.
Conflicts of Interest
The authors declare no conflict of interest.
Appendix A
- OPERATIONAL DEFINITIONS FOR VARIABLES
- USED IN THE 2002-2017 STUDY [1]
Study Objective 1: Update the 15-year study [1] by describing the market dynamics of community pharmacies for each county in the state of Minnesota every five years over a 20-year period (i.e., 2002-2022).
Dependent Variables
Changes in frequency for three dependent variables were used to fulfill study objective 1: ‘All Community Pharmacies,’ ‘Independent community pharmacies,’ and ‘Chain community pharmacies.’ There were operationally defined as:
- All community pharmacies: Per the state of Minnesota, an “established place(s) in which prescriptions, drugs, medicines, chemicals, and poisons are prepared, compounded, dispensed, vended, distributed, or sold to or for the use of non-hospitalized patients and from which related pharmaceutical care services are provided.”
- Independent community pharmacies: A community pharmacy owned as a single entity or as part of an organization comprising of 10 or fewer community pharmacies.
- Chain community pharmacies: Any community pharmacy owned as part of an organization comprising of more than 10 community pharmacies.
Frequency changes for each dependent variable were totalled and tracked for each Minnesota county in 2002, 2007, 2012, 2017, and 2022. Each of these variables was coded as: -1 if the county lost pharmacies, 0 if the number of pharmacies in county stayed the same, and 1 if the county gained pharmacies.
Independent Variables
‘Change in Population Density’ was defined as the change in person per square mile in each county for every five years from 2002-2022. This variable was coded as: -1 = negative change, 0 = change was from 0 to 5 people per square mile, and 1 = change was greater than 5 people per square mile. This variable represented the change in population for each county in a standardized unit of measurement. Metropolitan designation was defined by the US Census Bureau (core urban area of 50,000 or more population) wherein counties were coded as 0 = non-metro area and 1 = metro area.
Study Objective 2: Update the 15-year study by describing the number and proportion of community pharmacies for each county in the state of Minnesota every five years over a 20-year period (i.e., 2002-2022) by (1) ‘Business Organization Structure’ and (2) ‘Pharmacy Type.’
Variables
Two variables were used to study the second objective: (1) ‘Business Organization Structure’ and (2) ‘Pharmacy Type.’ ‘Business Organization Structure’ related to the number of pharmacies under common ownership and the size of the organization’s geographic markets. It was operationally defined as:
- Single entity: A business organization comprised of one pharmacy in a local market that would be classified under ‘Independent community pharmacies’ for objective 1.
- Small chain: A business organization comprised of 2–10 community pharmacies under common ownership (typically located in a local market) that would be classified under ‘Independent community pharmacies’ for objective 1.
- State/regional chain: A business organization comprised of greater than 10 community pharmacies under common ownership; distributed throughout Minnesota or the Midwest Region (Iowa, Illinois, Indiana, Kansas, Michigan, Minnesota, Missouri, North Dakota, Nebraska, Ohio, South Dakota, Wisconsin) and that would be classified under ‘Chain community pharmacies’ for objective 1.
- National chain: greater than 10 community pharmacies under common ownership; typically comprised of more than 1000 community pharmacies nationwide, located in most of the 50 states, and that would be classified under ‘Chain community pharmacies’ for objective 1.
The variable of ‘Pharmacy Type’ relates to the square footage devoted to the pharmacy department, the proportion of the business’ revenue coming from the pharmacy department, and the typical reason for patronizing the business. It was operationally defined as:
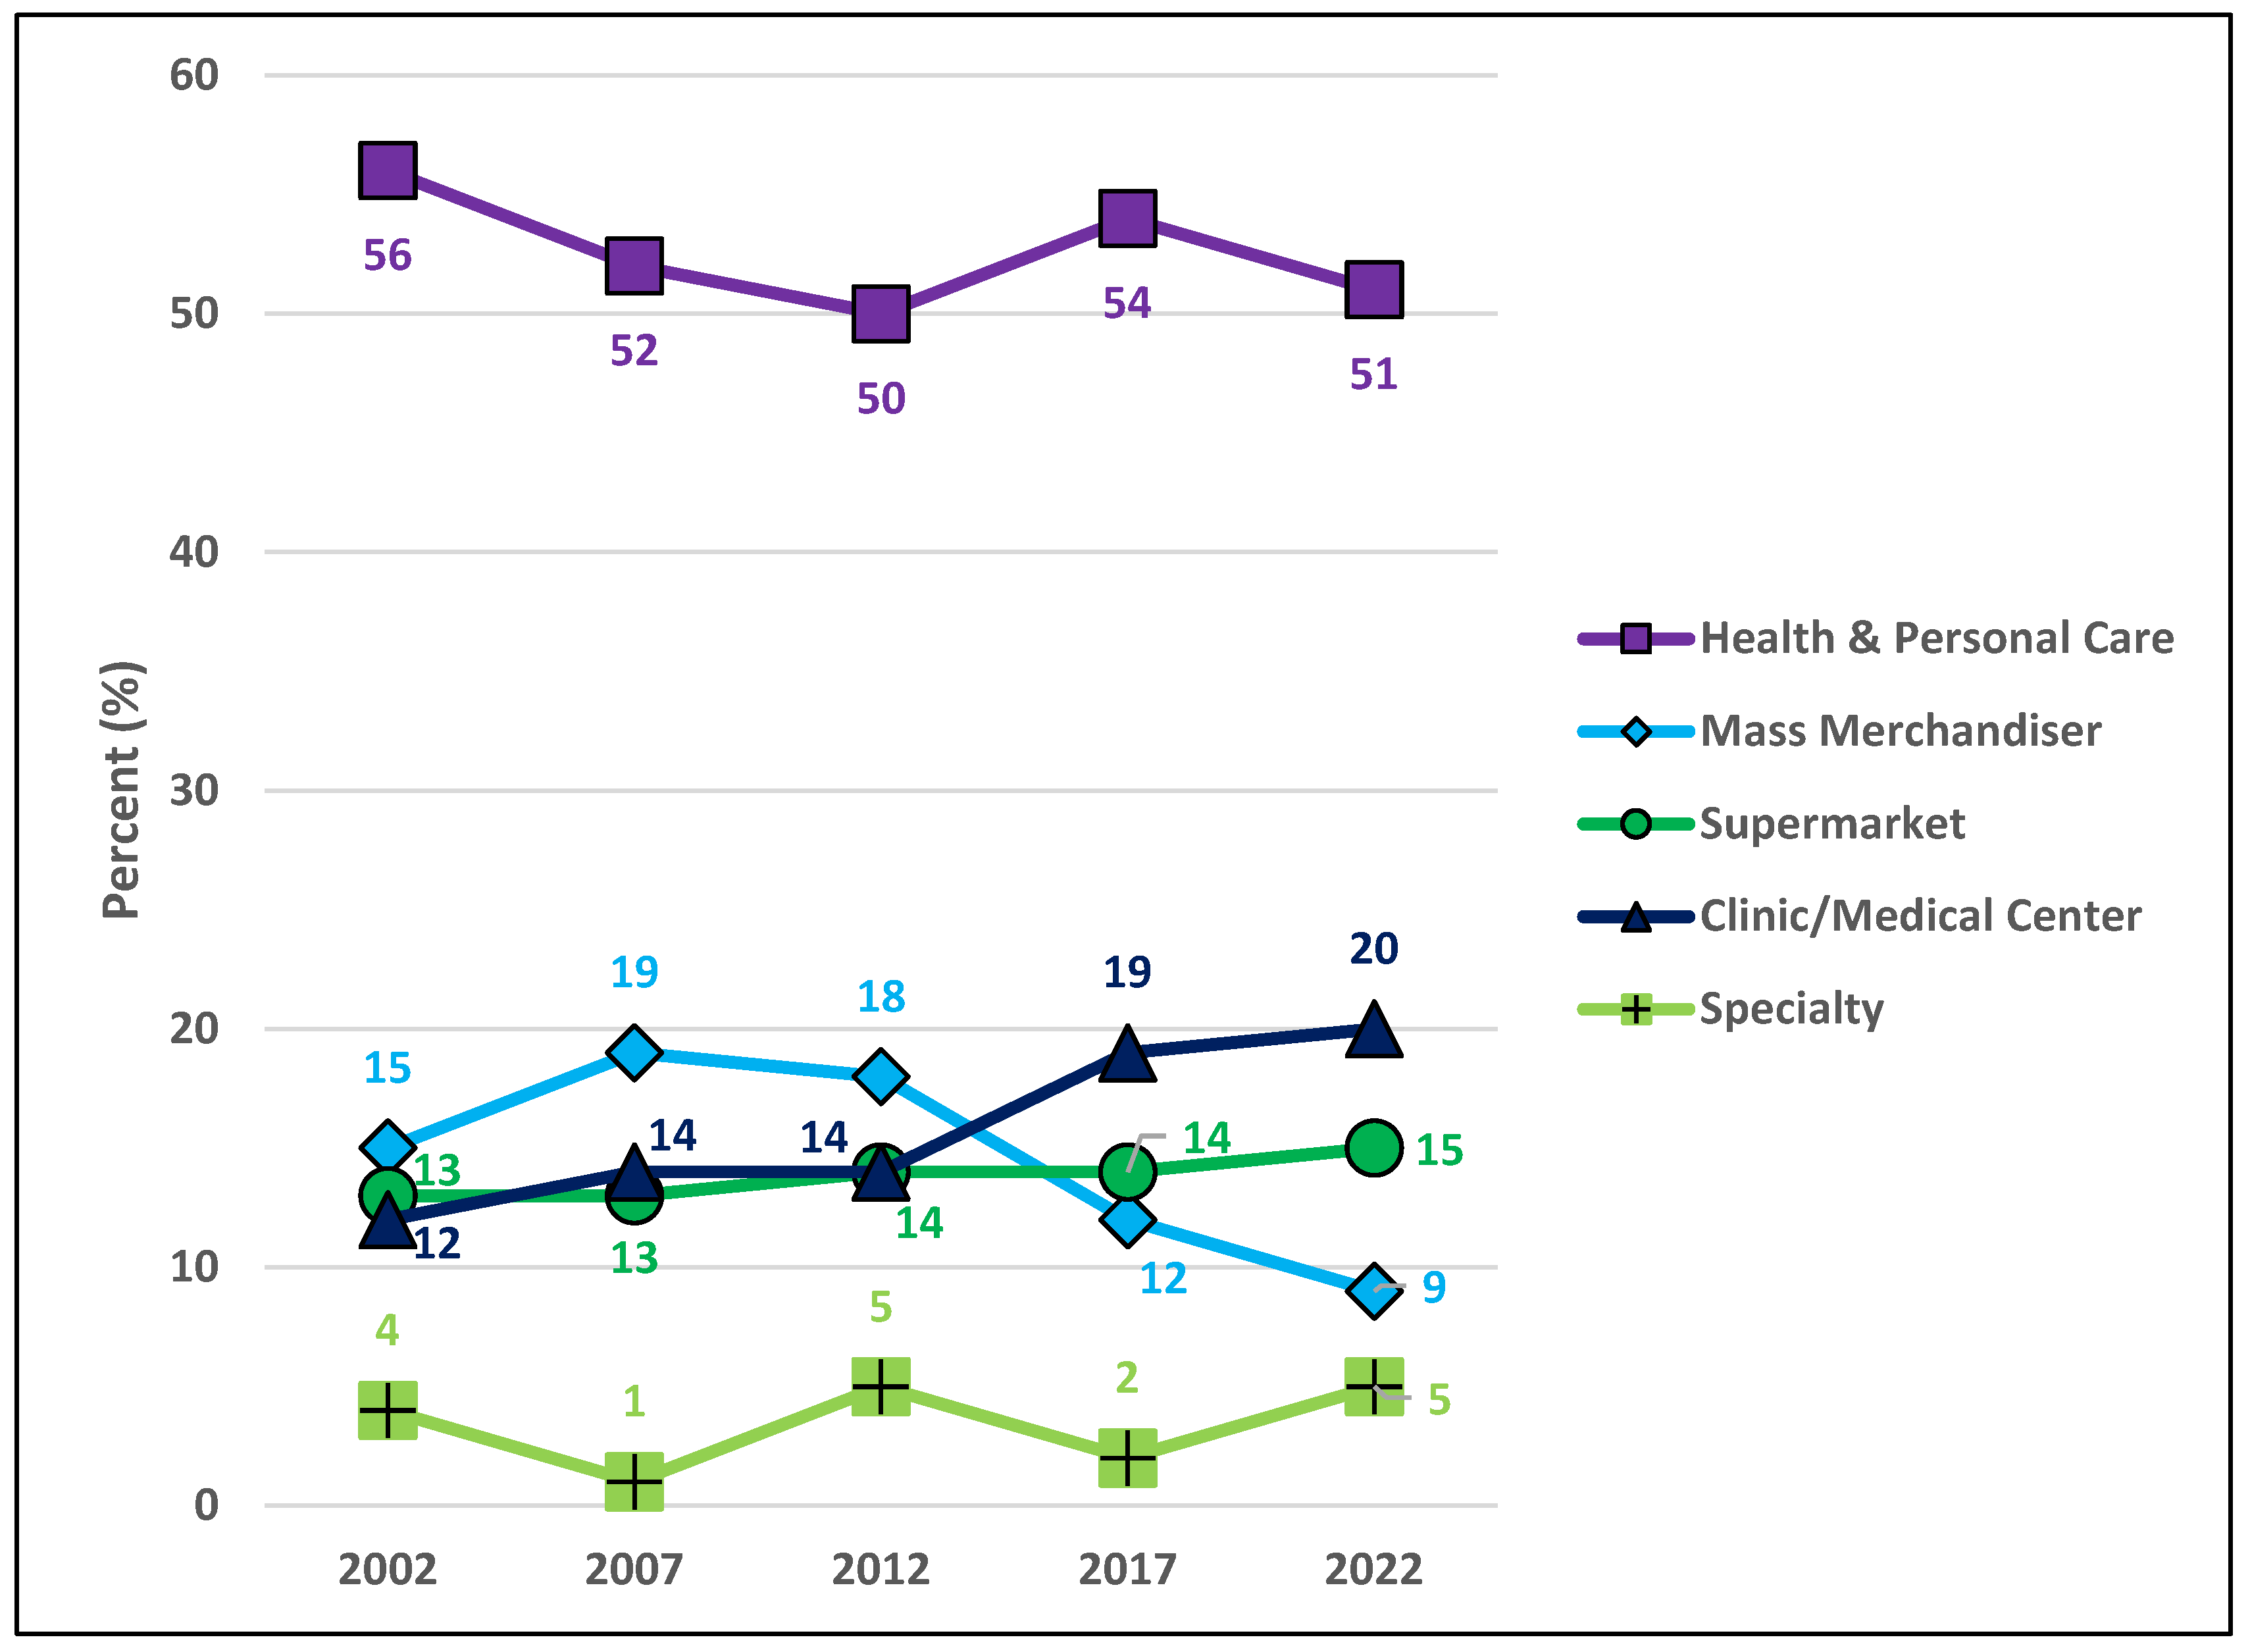
- Health & Personal Care: establishment is considered a pharmacy that also has a “front end”. A relatively large amount of square footage is devoted to the pharmacy and over-the-counter products. Revenue from the pharmacy and over-the-counter product sales is relatively large. The typical reason for patronizing the business is to “go to the pharmacy.” Locational convenience is a primary patronage motive. This type of pharmacy has also been known as a retail pharmacy.
- Mass merchandiser: establishment is considered a big box retail store that also has a “pharmacy.” A relatively small amount of square footage is devoted to the pharmacy and over-the-counter products. Revenue from the pharmacy and over-the-counter product sales is relatively small. The typical reason for patrons to visit the business is to “go to the big box retailer.” Retail shopping convenience is a primary patronage motive.
- Supermarket: establishment is considered a grocery store that also has a “pharmacy.” A relatively small amount of square footage is devoted to the pharmacy and over-the-counter products. Revenue from the pharmacy and over-the-counter product sales is relatively small. The typical reason for patronizing the business is to “go to the grocery store.” Grocery shopping convenience is a primary patronage motive.
- Clinic/medical center: establishment is considered a clinic that also has a “pharmacy.” A relatively small amount of square footage is devoted to the pharmacy and over-the-counter products. Typically, revenue from the pharmacy and over-the-counter product sales is relatively small. The typical reason for patronizing the business is to “go to the clinic.” In some cases, the pharmacy is a stand-alone business but is still considered to be closely associated with the clinic or medical center that is nearby. In many cases, the pharmacy name is the same as the clinic name (XYZ Clinic, XYZ Medical Center, XYZ Pharmacy). Health care visit convenience is a primary patronage motive.
- Specialty: establishment is considered a specialty business. Typically, all of the square footage is devoted to the pharmacy. Revenue for this business typically comes completely from the specialty services offered by the pharmacy. The typical reason for patronizing the business is to “receive unique pharmaceutical services” to meet patient care needs. Examples of specialty pharmacies include those focused upon renal services, compounding, veterinary pharmacy, long-term care, oncology, infusion, nuclear, outpatient treatment centers, HIV medication services, specialty pharmaceuticals. Need for specialty services is a primary patronage motive.
Appendix B
- Findings for Objectives 1 and 2 (2002 through 2022)
Study Objective 1: Update the 15-year study [1] by describing the market dynamics of community pharmacies for each county in the state of Minnesota every five years over a 20-year period (i.e., 2002-2022).
Study Objective 2: Update the 15-year study by describing the number and proportion of community pharmacies for each county in the state of Minnesota every five years over a 20-year period (i.e., 2002-2022) by (1) ‘Business Organization Structure’ and (2) ‘Pharmacy Type.’
Reference for the 15-year study: Olson, A.W.; Schommer, J.C.; Hadsall, R.S. A 15 year ecological comparison for the market dynamics of Minnesota community pharmacies from 2002 to 2017. Pharmacy. 2018, 6, 50.
Map A.
Community pharmacies in Minnesota counties (2002).

Map B.
Community pharmacies in Minnesota counties (2007).
Map C.
Community pharmacies in Minnesota counties (2012).

Map D.
Community pharmacies in Minnesota counties (2017).

Map E.
Community pharmacies in Minnesota counties (2022).
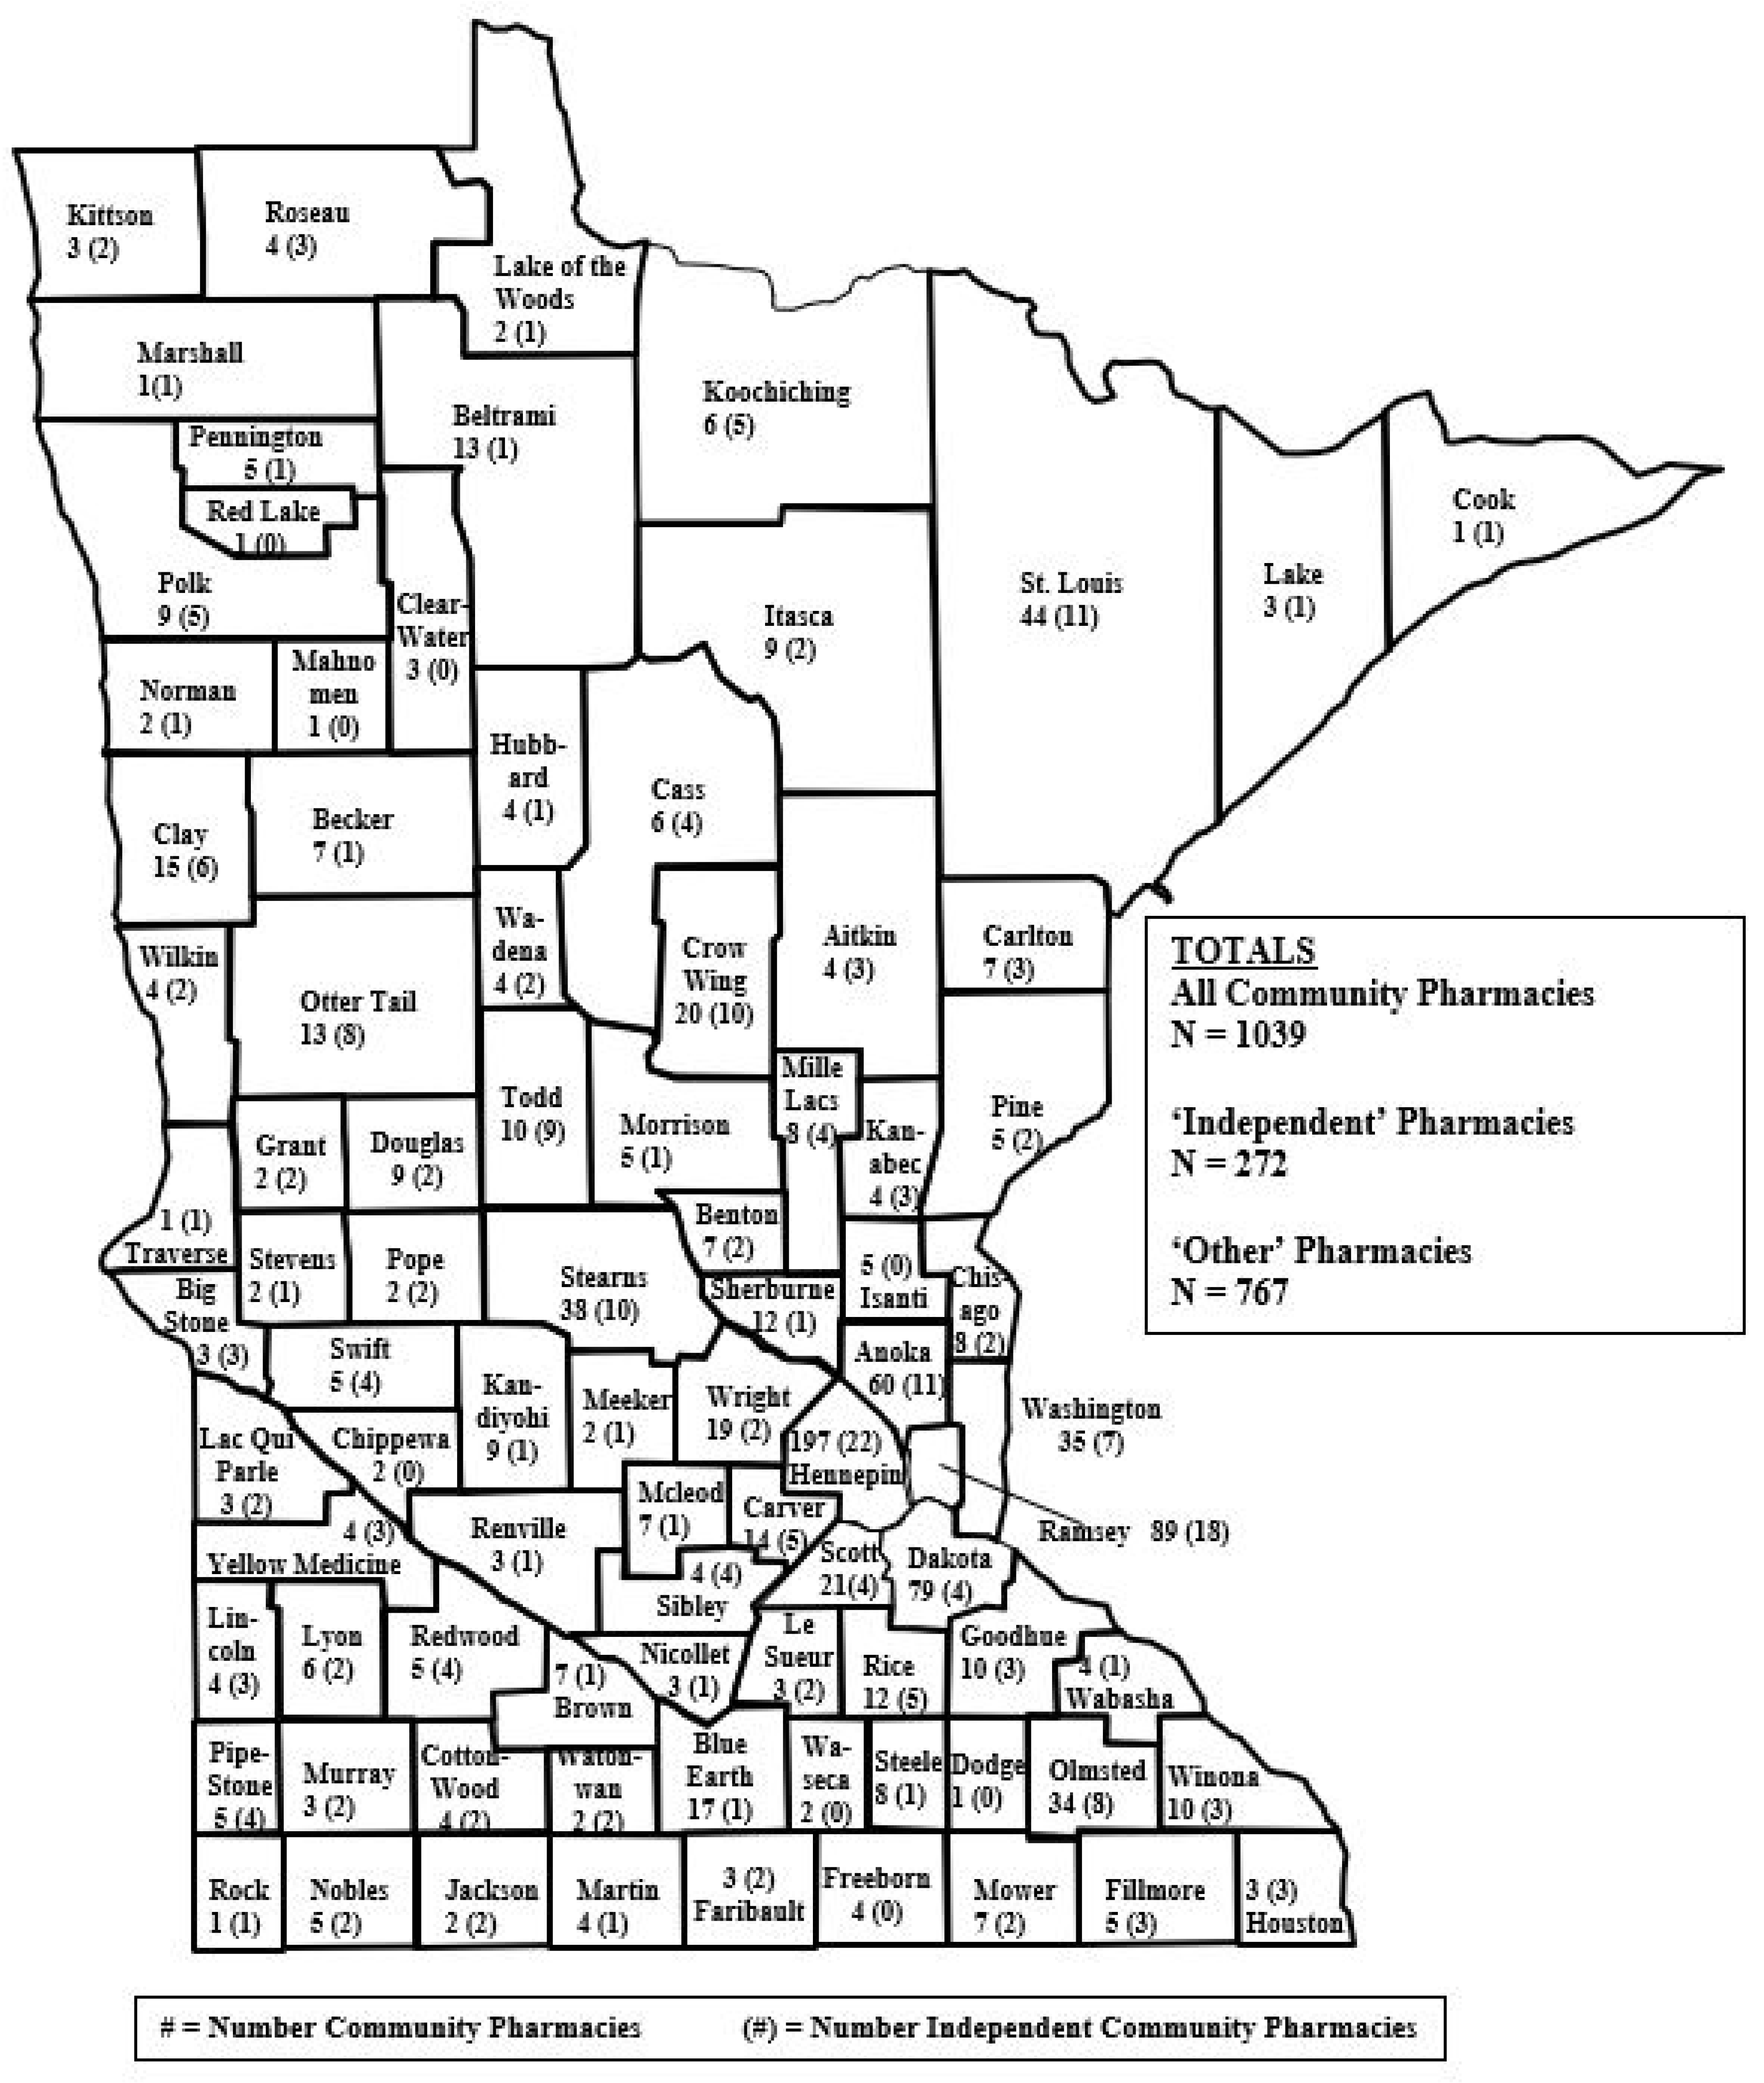
Table A1.
Market dynamics for community pharmacies by county in Minnesota counties every five years between 2002 and 2022 (N = 87).
Table A1.
Market dynamics for community pharmacies by county in Minnesota counties every five years between 2002 and 2022 (N = 87).
|
Pharmacy Category County Market Dynamic |
2002-07 | 2007-12 | 2012-17 | 2017-22 |
| All community pharmacies | ||||
| Lost pharmacies | 18% | 29% | 38% | 36% |
| Stayed the same | 36% | 43% | 40% | 34% |
| Gained pharmacies | 46% | 29% | 22% | 30% |
| Independent pharmacies | ||||
| Lost pharmacies | 55% | 33% | 54% | 14% |
| Stayed the same | 25% | 29% | 30% | 39% |
| Gained pharmacies | 20% | 38% | 16% | 47% |
| Chain pharmacies | ||||
| Lost pharmacies | 8% | 31% | 16% | 49% |
| Stayed the same | 36% | 38% | 45% | 32% |
| Gained pharmacies | 56% | 31% | 39% | 20% |
NOTES: percentages may not total 100% due to rounding.
Table A2.
The relationship between change in population density (p/mi2) and market dynamics for community pharmacies in Minnesota counties between 2002 and 2007 (N = 87).
Table A2.
The relationship between change in population density (p/mi2) and market dynamics for community pharmacies in Minnesota counties between 2002 and 2007 (N = 87).
| Pharmacy Category County Market Dynamic | Counties with <0 p/mi2 change | Counties with 0-5 p/mi2 change | Counties with >5 p/mi2 change | Overall |
| N = 43 | N = 29 | N = 15 | N = 87 | |
| All community pharmacies | ||||
| Lost pharmacies | 23% | 17% | 7% | 18% |
| Stayed the same | 51% | 24% | 13% | 36% |
| Gained pharmacies | 26% | 59% | 80% | 46% |
| p = 0.002 | ||||
| Independent pharmacies | ||||
| Lost pharmacies | 56% | 41% | 80% | 55% |
| Stayed the same | 23% | 35% | 13% | 25% |
| Gained pharmacies | 21% | 24% | 7% | 20% |
| p = 0.185 | ||||
| Chain pharmacies | ||||
| Lost pharmacies | 12% | 3% | 7% | 8% |
| Stayed the same | 42% | 45% | 0% | 36% |
| Gained pharmacies | 47% | 52% | 93% | 56% |
| p = 0.014 |
NOTES: p/mi2 = persons per square mile; percentages may not total 100% due to rounding.
Table A3.
The relationship between change in population density (p/mi2) and market dynamics for community pharmacies in Minnesota counties between 2007 and 2012 (N = 87).
Table A3.
The relationship between change in population density (p/mi2) and market dynamics for community pharmacies in Minnesota counties between 2007 and 2012 (N = 87).
| Pharmacy Category County Market Dynamic | Counties with <0 p/mi2 change | Counties with 0-5 p/mi2 change | Counties with >5 p/mi2 change | Overall |
| N = 44 | N = 31 | N = 12 | N = 87 | |
| All community pharmacies | ||||
| Lost pharmacies | 30% | 26% | 33% | 29% |
| Stayed the same | 55% | 36% | 17% | 43% |
| Gained pharmacies | 16% | 39% | 50% | 29% |
| p = 0.052 | ||||
| Independent pharmacies | ||||
| Lost pharmacies | 43% | 23% | 25% | 33% |
| Stayed the same | 39% | 19% | 17% | 29% |
| Gained pharmacies | 18% | 58% | 58% | 38% |
| p = 0.005 | ||||
| Chain pharmacies | ||||
| Lost pharmacies | 18% | 45% | 42% | 31% |
| Stayed the same | 54% | 26% | 8% | 38% |
| Gained pharmacies | 27% | 29% | 50% | 31% |
| p = 0.009 |
NOTES: p/mi2 = persons per square mile; percentages may not total 100% due to rounding
Table A4.
The relationship between change in population density (p/mi2) and market dynamics for community pharmacies in Minnesota counties between 2012 and 2017 (N = 87).
Table A4.
The relationship between change in population density (p/mi2) and market dynamics for community pharmacies in Minnesota counties between 2012 and 2017 (N = 87).
|
Pharmacy Category County Market Dynamic |
Counties with <0 p/mi2 change N = 44 |
Counties with 0-5 p/mi2 change N = 33 |
Counties with >5 p/mi2 change N = 10 |
Overall N = 87 |
| All community pharmacies | ||||
| Lost pharmacies | 32% | 46% | 40% | 38% |
| Stayed the same | 48% | 36% | 20% | 40% |
| Gained pharmacies | 21% | 18% | 40% | 22% |
| p = 0.349 | ||||
| Independent pharmacies | ||||
| Lost pharmacies | 43% | 61% | 80% | 54% |
| Stayed the same | 36% | 27% | 10% | 30% |
| Gained pharmacies | 21% | 12% | 10% | 16% |
| p = 0.234 | ||||
| Chain pharmacies | ||||
| Lost pharmacies | 16% | 12% | 30% | 16% |
| Stayed the same | 59% | 36% | 10% | 45% |
| Gained pharmacies | 25% | 52% | 60% | 39% |
| p = 0.022 |
NOTES: p/mi2 = persons per square mile; percentages may not total 100% due to rounding.
Table A5.
The relationship between change in population density (p/mi2) and market dynamics for community pharmacies in Minnesota counties between 2017 and 2022 (N = 87).
Table A5.
The relationship between change in population density (p/mi2) and market dynamics for community pharmacies in Minnesota counties between 2017 and 2022 (N = 87).
|
Pharmacy Category County Market Dynamic |
Counties with <0 p/mi2 change N = 31 |
Counties with 0-5 p/mi2 change N = 30 |
Counties with >5 p/mi2 change N = 26 |
Overall N = 87 |
| All community pharmacies | ||||
| Lost pharmacies | 16% | 44% | 42% | 36% |
| Stayed the same | 56% | 32% | 0% | 34% |
| Gained pharmacies | 28% | 24% | 25% | 30% |
| p = 0.004 | ||||
| Independent Pharmacies | ||||
| Lost pharmacies | 8% | 20% | 0% | 14% |
| Stayed the same | 52% | 38% | 18% | 39% |
| Gained pharmacies | 40% | 42% | 83% | 47% |
| p = 0.038 | ||||
| Chain Pharmacies | ||||
| Lost pharmacies | 28% | 60% | 50% | 49% |
| Stayed the same | 52% | 26% | 8% | 32% |
| Gained pharmacies | 20% | 14% | 42% | 20% |
| p = 0.010 |
NOTES: p/mi2 = persons per square mile; percentages may not total 100% due to rounding.
Table A6.
The relationship between Metropolitan Designation and market dynamics for community pharmacies in Minnesota counties between 2002 and 2007 (N = 87).
Table A6.
The relationship between Metropolitan Designation and market dynamics for community pharmacies in Minnesota counties between 2002 and 2007 (N = 87).
|
Pharmacy Category County Market Dynamic |
Metropolitan counties N = 21 |
Non-metropolitan counties N = 66 |
Overall N = 87 |
| All community pharmacies | |||
| Lost pharmacies | 14% | 19% | 18% |
| Stayed the same | 19% | 41% | 36% |
| Gained pharmacies | 67% | 39% | 46% |
| p = 0.083 | |||
| Independent pharmacies | |||
| Lost pharmacies | 81% | 47% | 55% |
| Stayed the same | 14% | 29% | 25% |
| Gained pharmacies | 5% | 24% | 20% |
| p = 0.021 | |||
| Chain pharmacies | |||
| Lost pharmacies | 5% | 9% | 8% |
| Stayed the same | 19% | 41% | 36% |
| Gained pharmacies | 76% | 50% | 56% |
| p = 0.108 |
NOTES: percentages may not total 100% due to rounding
Table A7.
The relationship between Metropolitan Designation and market dynamics for community pharmacies in Minnesota counties between 2007 and 2012 (N = 87).
Table A7.
The relationship between Metropolitan Designation and market dynamics for community pharmacies in Minnesota counties between 2007 and 2012 (N = 87).
|
Pharmacy Category County Market Dynamic |
Metropolitan counties N = 21 |
Non-metropolitan counties N = 66 |
Overall N = 87 |
||
| All community pharmacies | |||||
| Lost pharmacies | 33% | 27% | 29% | ||
| Stayed the same | 24% | 49% | 43% | ||
| Gained pharmacies | 43% | 24% | 29% | ||
| p = 0.111 | |||||
| Independent pharmacies | |||||
| Lost pharmacies | 33% | 33% | 33% | ||
| Stayed the same | 14% | 33% | 29% | ||
| Gained pharmacies | 52% | 33% | 38% | ||
| p = 0.171 | |||||
| Chain pharmacies | |||||
| Lost pharmacies | 48% | 26% | 31% | ||
| Stayed the same | 24% | 42% | 38% | ||
| Gained pharmacies | 29% | 32% | 31% | ||
| p = 0.138 | |||||
NOTES: percentages may not total 100% due to rounding
Table A8.
The relationship between Metropolitan Designation and market dynamics for community pharmacies in Minnesota counties between 2012 and 2017 (N = 87).
Table A8.
The relationship between Metropolitan Designation and market dynamics for community pharmacies in Minnesota counties between 2012 and 2017 (N = 87).
|
Pharmacy Category County Market Dynamic |
Metropolitan counties N = 27 |
Non-metropolitan counties N = 60 |
Overall N = 87 |
| All community pharmacies | |||
| Lost pharmacies | 41% | 37% | 38% |
| Stayed the same | 30% | 45% | 40% |
| Gained pharmacies | 30% | 18% | 22% |
| p = 0.323 | |||
| Independent pharmacies | |||
| Lost pharmacies | 67% | 48% | 54% |
| Stayed the same | 22% | 33% | 30% |
| Gained pharmacies | 11% | 18% | 16% |
| p = 0.282 | |||
| Chain pharmacies | |||
| Lost pharmacies | 19% | 15% | 16% |
| Stayed the same | 22% | 55% | 45% |
| Gained pharmacies | 59% | 30% | 39% |
| p = 0.013 |
NOTES: percentages may not total 100% due to rounding
Table A9.
The relationship between Metropolitan Designation and market dynamics for community pharmacies in Minnesota counties between 2017 and 2022 (N = 87).
Table A9.
The relationship between Metropolitan Designation and market dynamics for community pharmacies in Minnesota counties between 2017 and 2022 (N = 87).
|
Pharmacy Category County Market Dynamic |
Metropolitan counties N = 27 |
Non-metropolitan counties N = 60 |
Overall N = 87 |
| All community pharmacies | |||
| Lost pharmacies | 37% | 35% | 36% |
| Stayed the same | 22% | 40% | 35% |
| Gained pharmacies | 41% | 25% | 30% |
| p = 0.195 | |||
| Independent pharmacies | |||
| Lost pharmacies | 15% | 13% | 14% |
| Stayed the same | 19% | 48% | 39% |
| Gained pharmacies | 67% | 38% | 47% |
| p = 0.024 | |||
| Chain pharmacies | |||
| Lost pharmacies | 48% | 50% | 49% |
| Stayed the same | 15% | 38% | 32% |
| Gained pharmacies | 37% | 12% | 20% |
| p = 0.009 |
NOTES: percentages may not total 100% due to rounding
Table A10.
Community pharmacy business organization structures and pharmacy types in Minnesota for 2002, 2007, 2012, 2017, and 2022 (Number, column %).
Table A10.
Community pharmacy business organization structures and pharmacy types in Minnesota for 2002, 2007, 2012, 2017, and 2022 (Number, column %).
| Business organization structure | Pharmacy type | 2002 | 2007 | 2012 | 2017 | 2022 |
| N = 996 | N = 1070 | N = 1094 | N = 1063 | N = 1039 | ||
| Single entity | Health & Personal Care | 281 (28%) | 185 (17%) | 199 (18%) | 127 (12%) | 100 (10%) |
| Mass merchandiser | 0 (0%) | 0 (0%) | 0 (0%) | 0 (0%) | 0 (0%) | |
| Supermarket | 0 (0%) | 0 (0%) | 0 (0%) | 0 (0%) | 1 (<1%) | |
| Clinic/medical center | 36 (4%) | 32 (3%) | 28 (3%) | 19 (2%) | 18 (2%) | |
| Specialty | 29 (3%) | 10 (1%) | 33 (3%) | 5 (1%) | 24 (2%) | |
| Total | 346 (35%) | 227 (21%) | 260 (24%) | 151 (14%) | 143 (14%) | |
| Small chain | Health & Personal Care | 98 (10%) | 97 (9%) | 91 (8%) | 83 (8%) | 79 (8%) |
| Mass merchandiser | 0 (0%) | 0 (0%) | 0 (0%) | 0 (0%) | 0 (0%) | |
| Supermarket | 0 (0%) | 0 (0%) | 0 (0%) | 0 (0%) | 1 (<1%) | |
| Clinic/medical center | 20 (2%) | 26 (2%) | 30 (3%) | 17 (2%) | 43 (4%) | |
| Specialty | 2 (<1%) | 2 (<1%) | 6 (1%) | 5 (1%) | 6 (1%) | |
| Total | 120 (12%) | 125 (12%) | 127 (12%) | 105 (10%) | 129 (12%) | |
| ALL INDEP | Single Entity + Small Chain | 466 (47%) | 352 (33%) | 387 (35%) | 256 (24%) | 272 (26%) |
| State/regional chain | Health & Personal Care | 99 (10%) | 120 (11%) | 63 (6%) | 66 (6%) | 63 (6%) |
| Mass merchandiser | 13 (1%) | 0 (0%) | 17 (2%) | 0 (0%) | 0 (0%) | |
| Supermarket | 127 (13%) | 139 (13%) | 155 (14%) | 150 (14%) | 151 (15%) | |
| Clinic/medical center | 61 (6%) | 96 (9%) | 83 (8%) | 162 (15%) | 108 (10%) | |
| Specialty | 5 (1%) | 0 (0%) | 12 (1%) | 5 (1%) | 14 (1%) | |
| Total | 305 (31%) | 355 (33%) | 330 (30%) | 383 (36%) | 336 (32%) | |
| National chain | Health & Personal Care | 81 (8%) | 152 (14%) | 201 (18%) | 294 (28%) | 287 (28%) |
| Mass merchandiser | 144 (14%) | 209 (20%) | 173 (16%) | 127 (12%) | 92 (9%) | |
| Supermarket | 0 (0%) | 0 (0%) | 0 (0%) | 0 (0%) | 0 (0%) | |
| Clinic/medical center | 0 (0%) | 0 (0%) | 0 (0%) | 0 (0%) | 41 (4%) | |
| Specialty | 0 (0%) | 2 (<1%) | 3 (<1%) | 2 (<1%) | 11 (1%) | |
| Total | 225 (23%) | 363 (34%) | 377 (34%) | 423 (40%) | 431 (42%) | |
| ALL CHAIN | State/regional National | 530 (53%) | 718 (67%) | 707 (65%) | 807 (76%) | 767 (74%) |
NOTES: percentages may not total 100% due to rounding
Figure A1.
The relationship between change in population density (p/mi2) and market dynamics for ‘All community pharmacies’ in Minnesota counties for 2002, 2007, 2012, 2017, and 2022 (N = 87).
Figure A1.
The relationship between change in population density (p/mi2) and market dynamics for ‘All community pharmacies’ in Minnesota counties for 2002, 2007, 2012, 2017, and 2022 (N = 87).
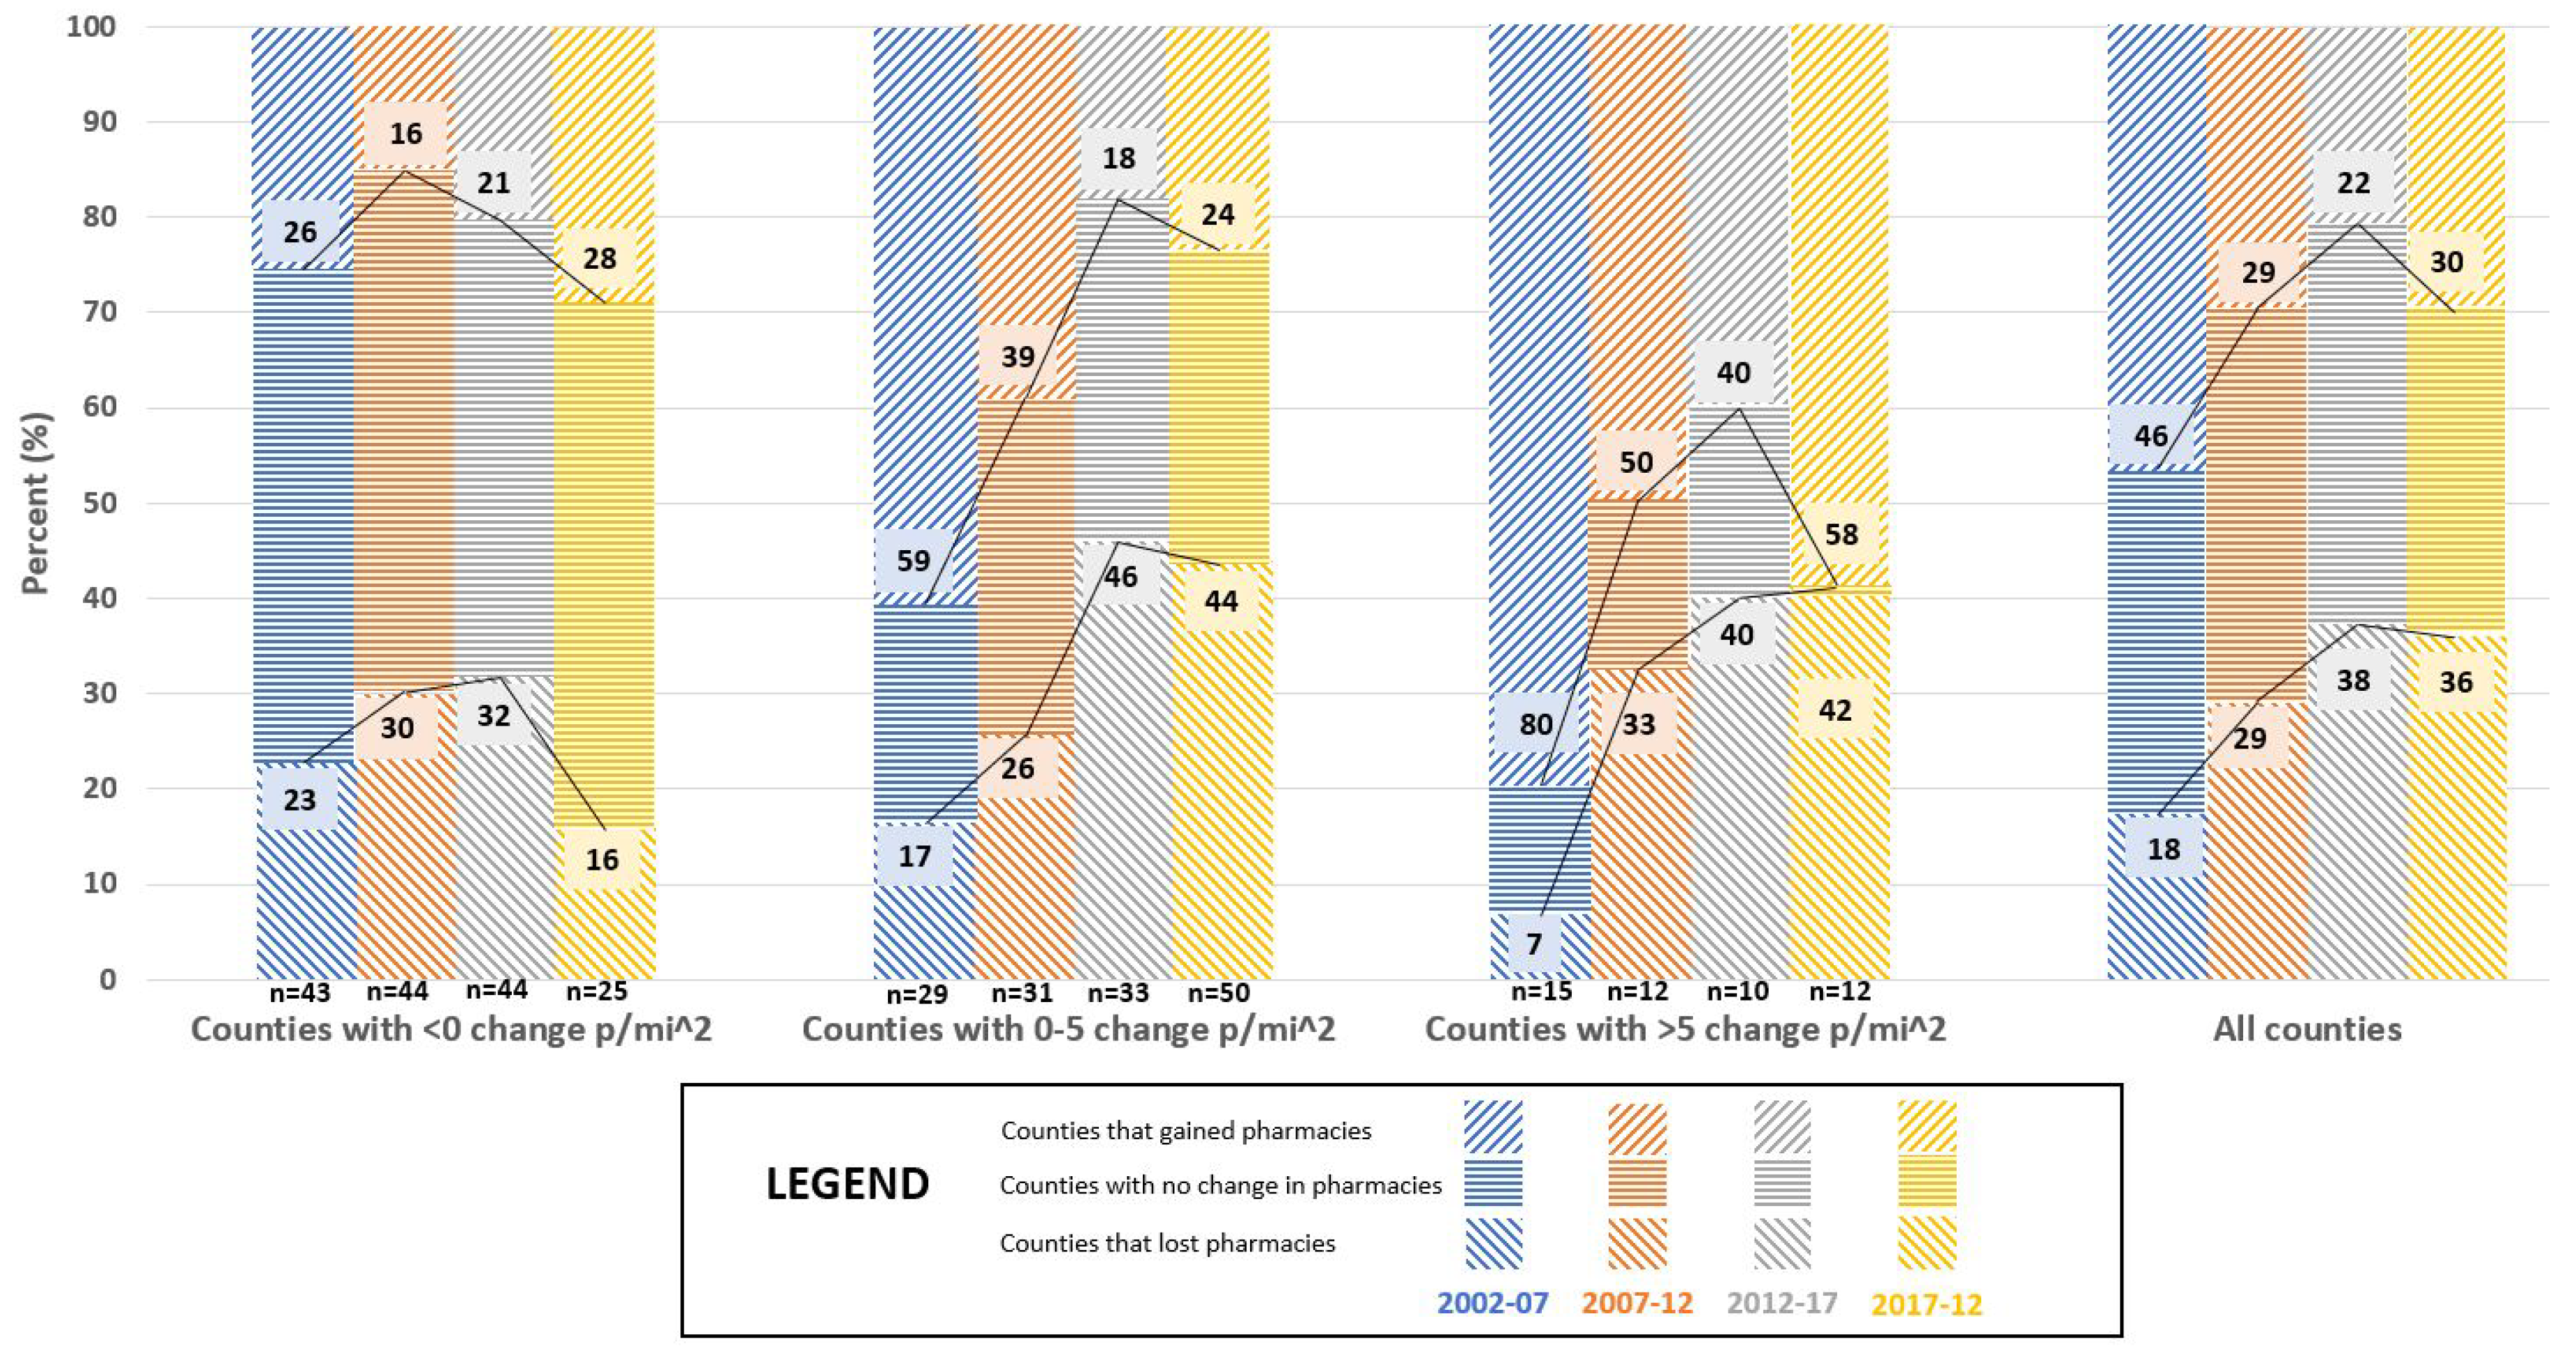
Figure A2.
The relationship between change in population density (p/mi2) and market dynamics for ‘Independent community pharmacies’ in Minnesota counties for 2002, 2007, 2012, 2017, and 2022 (N = 87).
Figure A2.
The relationship between change in population density (p/mi2) and market dynamics for ‘Independent community pharmacies’ in Minnesota counties for 2002, 2007, 2012, 2017, and 2022 (N = 87).
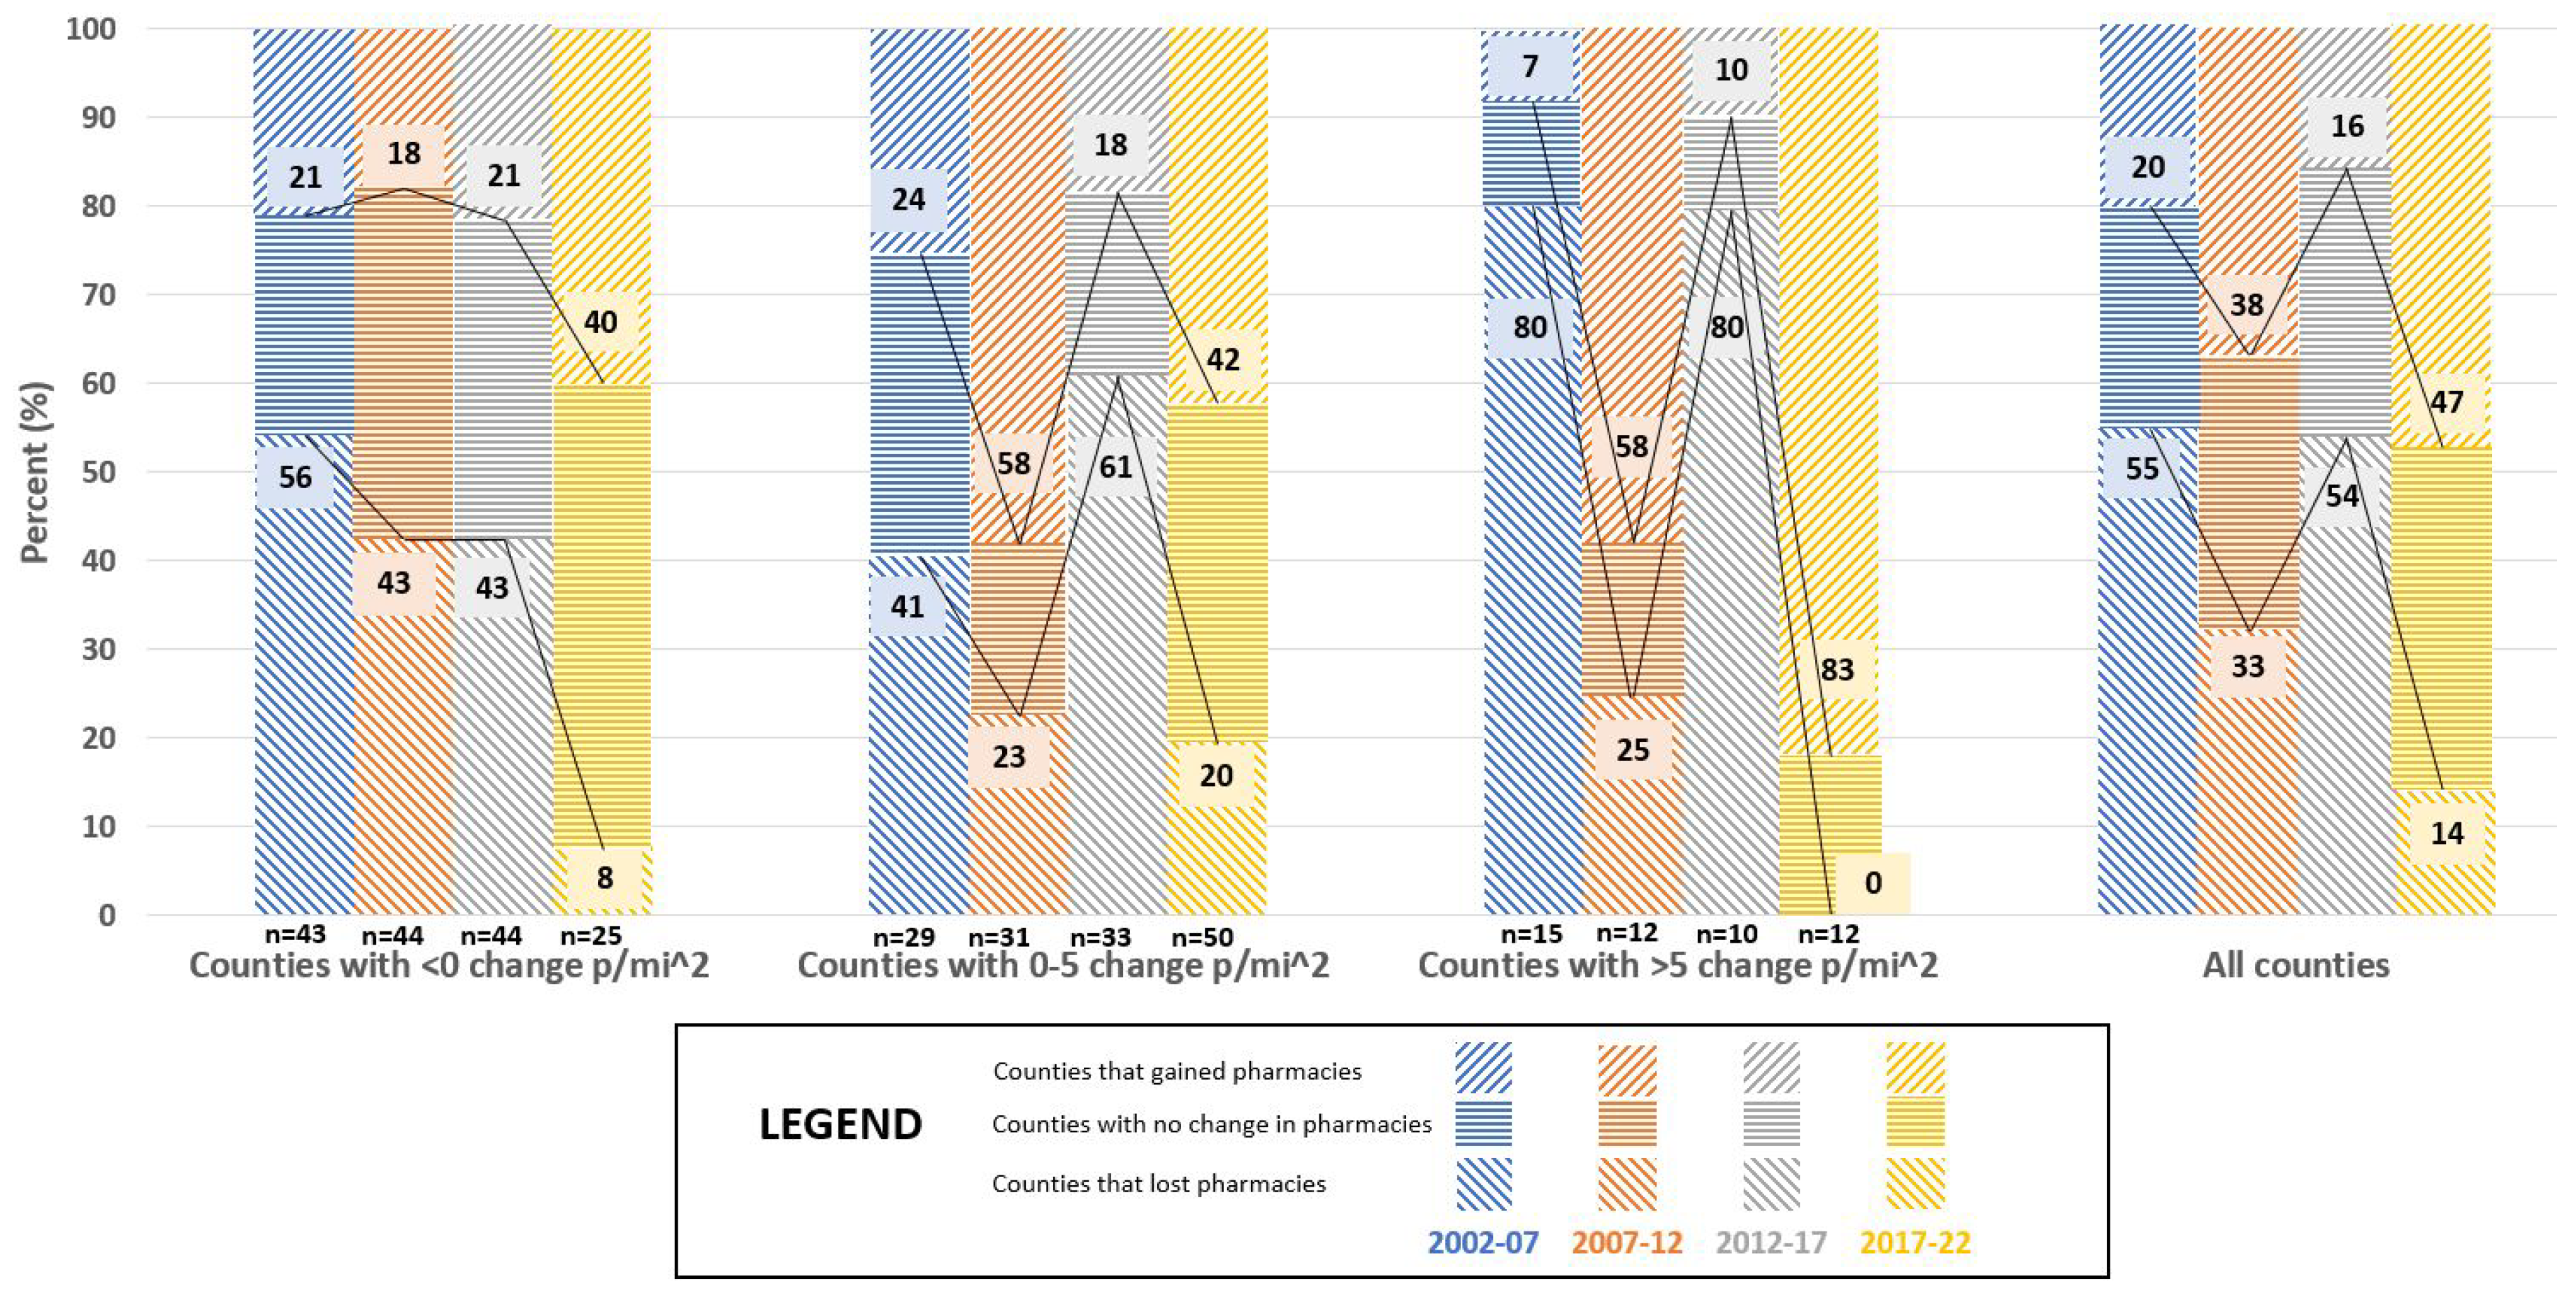
Figure A3.
The relationship between change in population density (p/mi2) and market dynamics for ‘Chain community pharmacies’ in Minnesota counties for 2002, 2007, 2012, 2017, and 2022 (N = 87).
Figure A3.
The relationship between change in population density (p/mi2) and market dynamics for ‘Chain community pharmacies’ in Minnesota counties for 2002, 2007, 2012, 2017, and 2022 (N = 87).
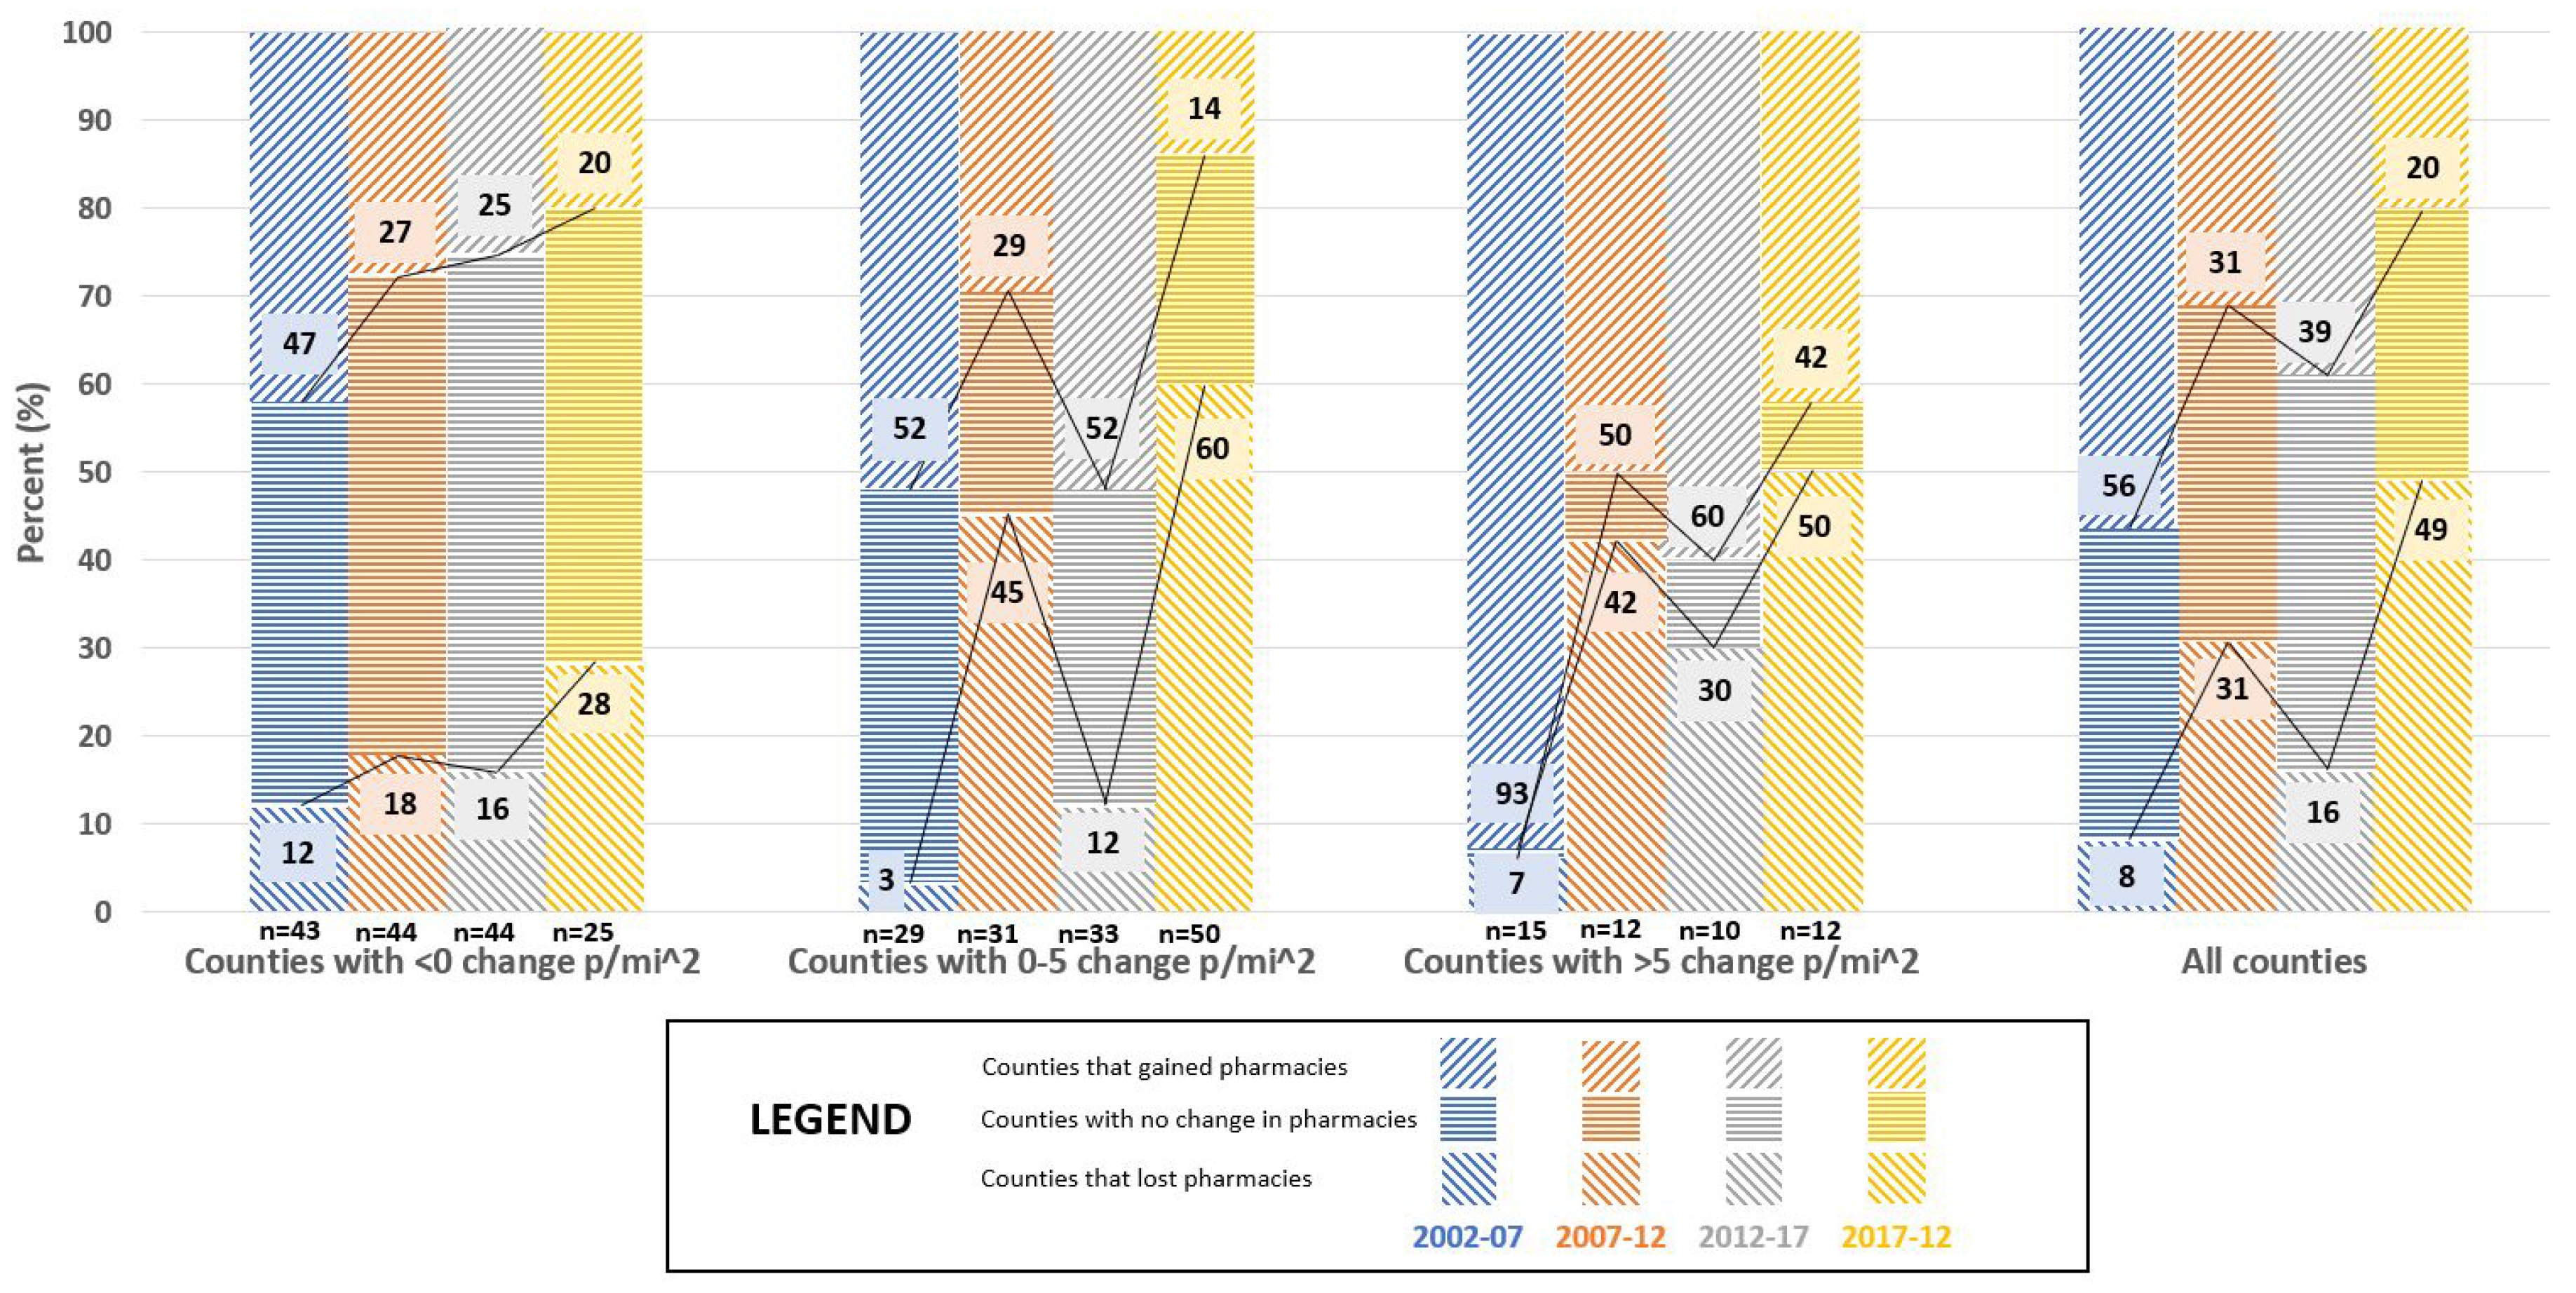
Figure A4.
The relationship between Metropolitan Designation and market dynamics for ‘All community pharmacies’ in Minnesota counties for 2002, 2007, 2012, 2017, and 2022 (N = 87).
Figure A4.
The relationship between Metropolitan Designation and market dynamics for ‘All community pharmacies’ in Minnesota counties for 2002, 2007, 2012, 2017, and 2022 (N = 87).
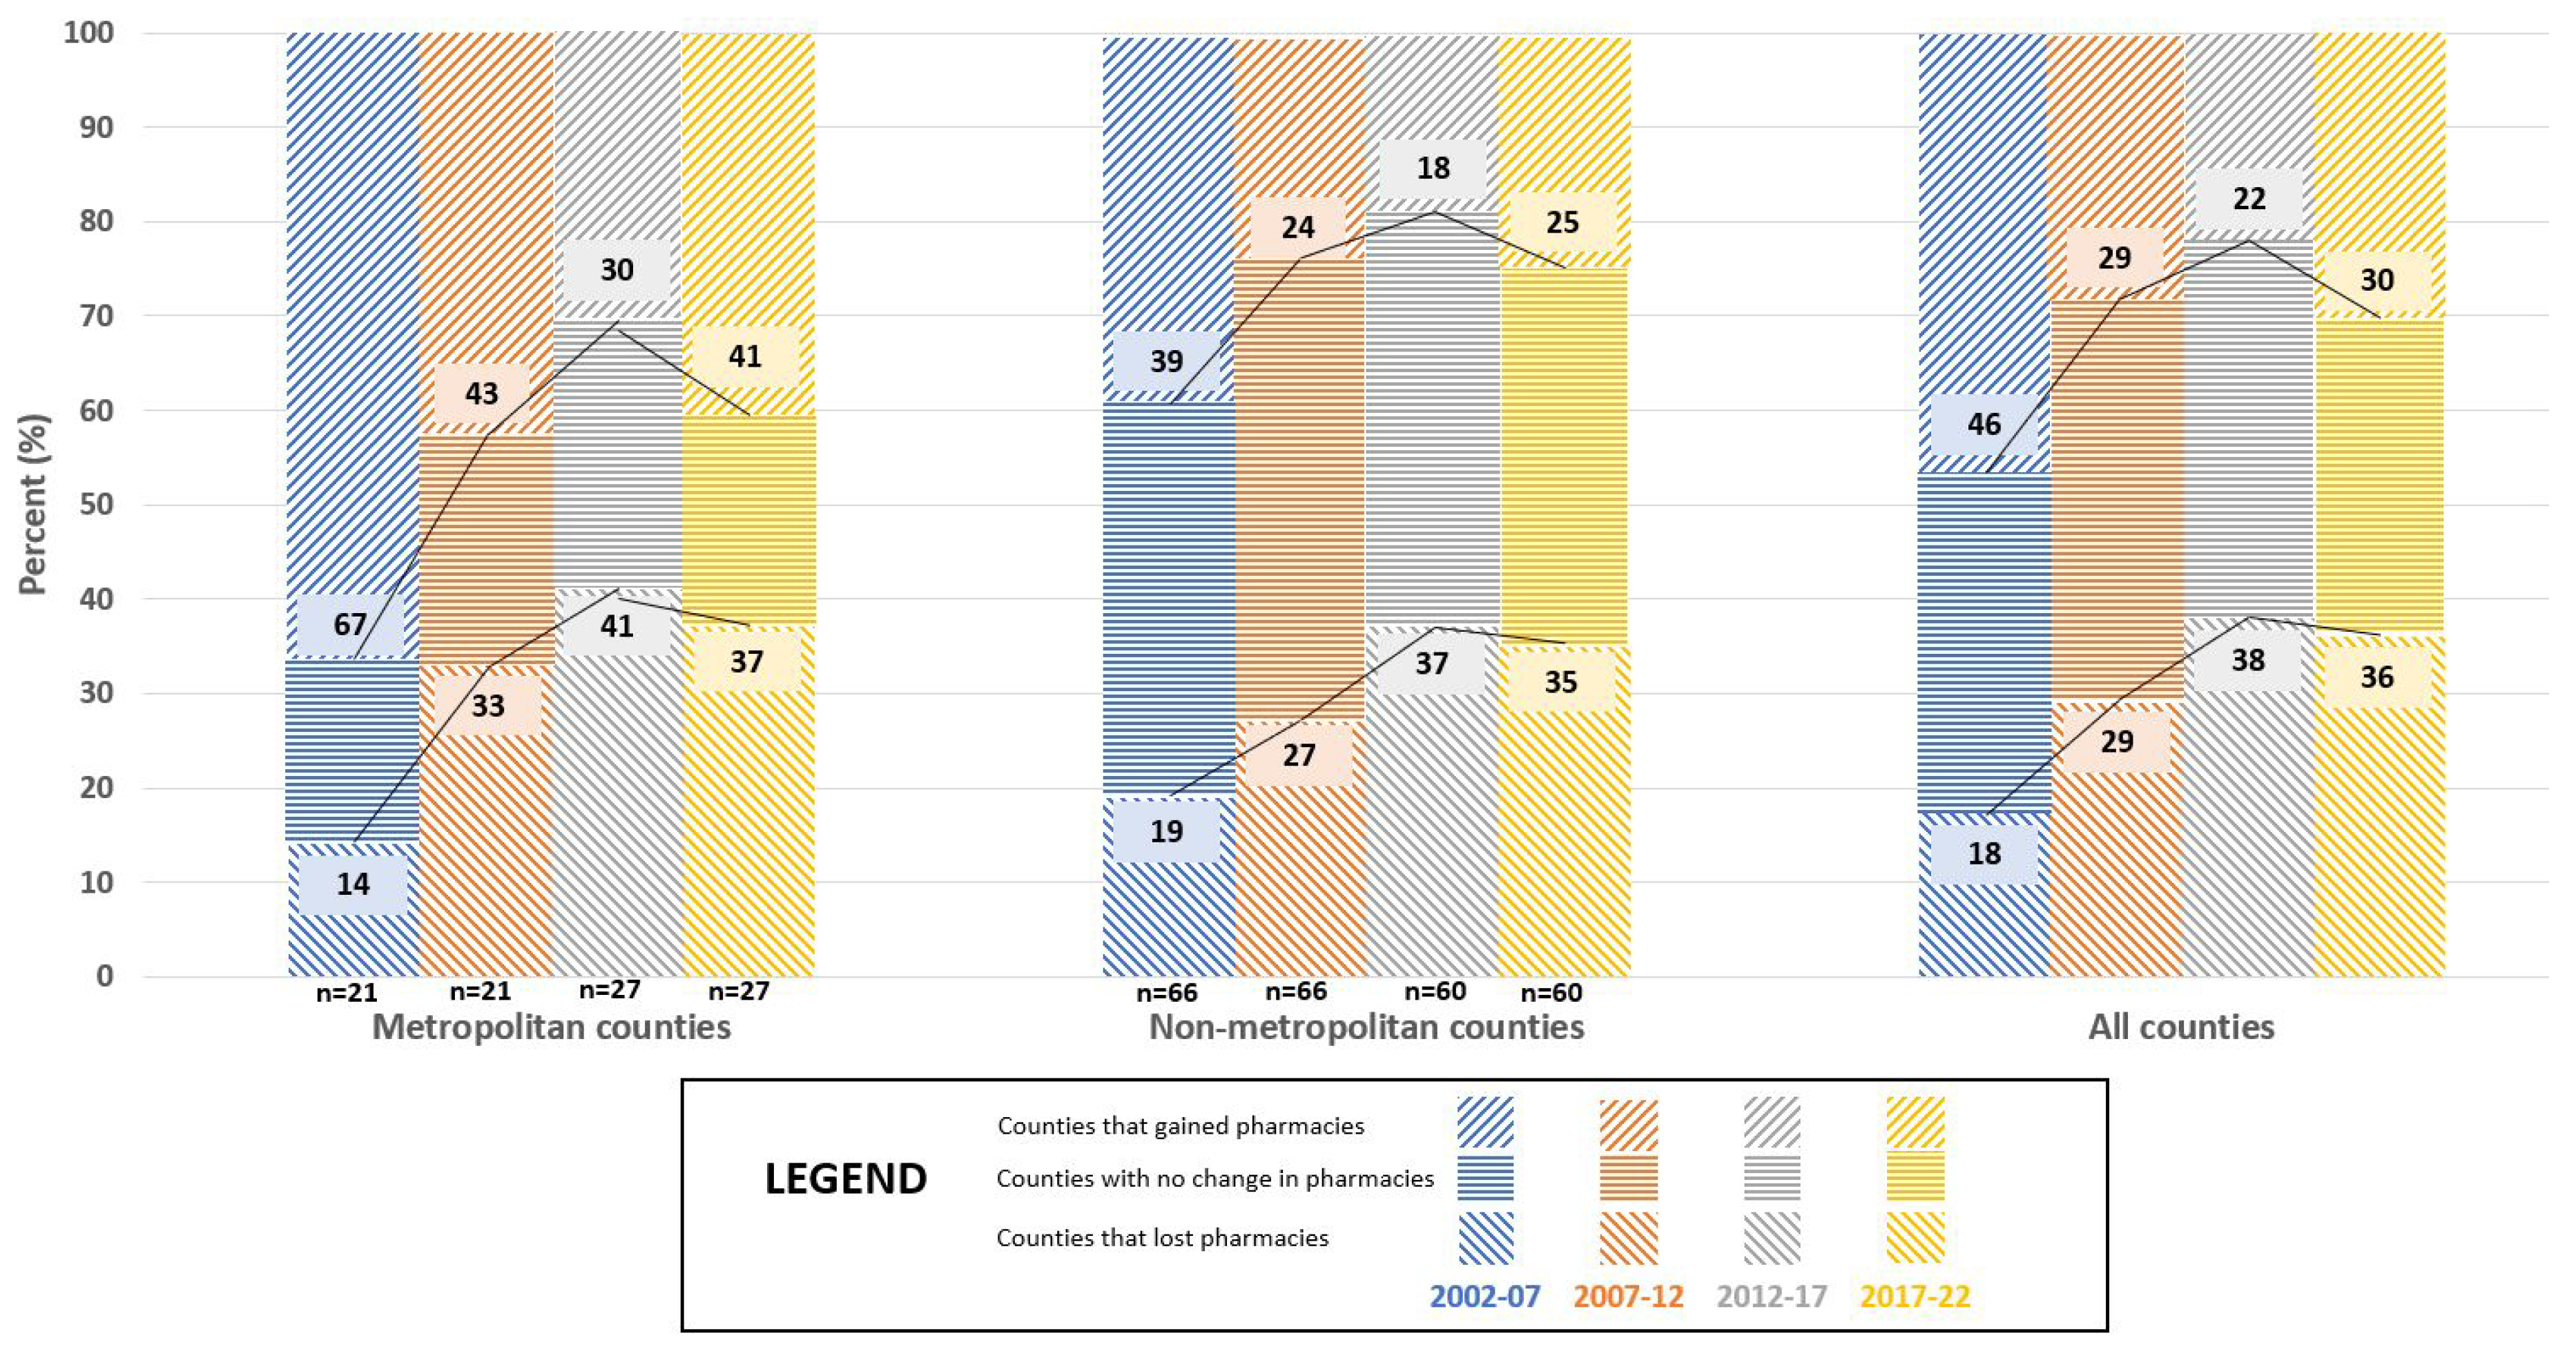
Figure A5.
The relationship between Metropolitan Designation and market dynamics for ‘Independent community pharmacies’ in Minnesota counties for 2002, 2007, 2012, 2017, and 2022 (N = 87).
Figure A5.
The relationship between Metropolitan Designation and market dynamics for ‘Independent community pharmacies’ in Minnesota counties for 2002, 2007, 2012, 2017, and 2022 (N = 87).
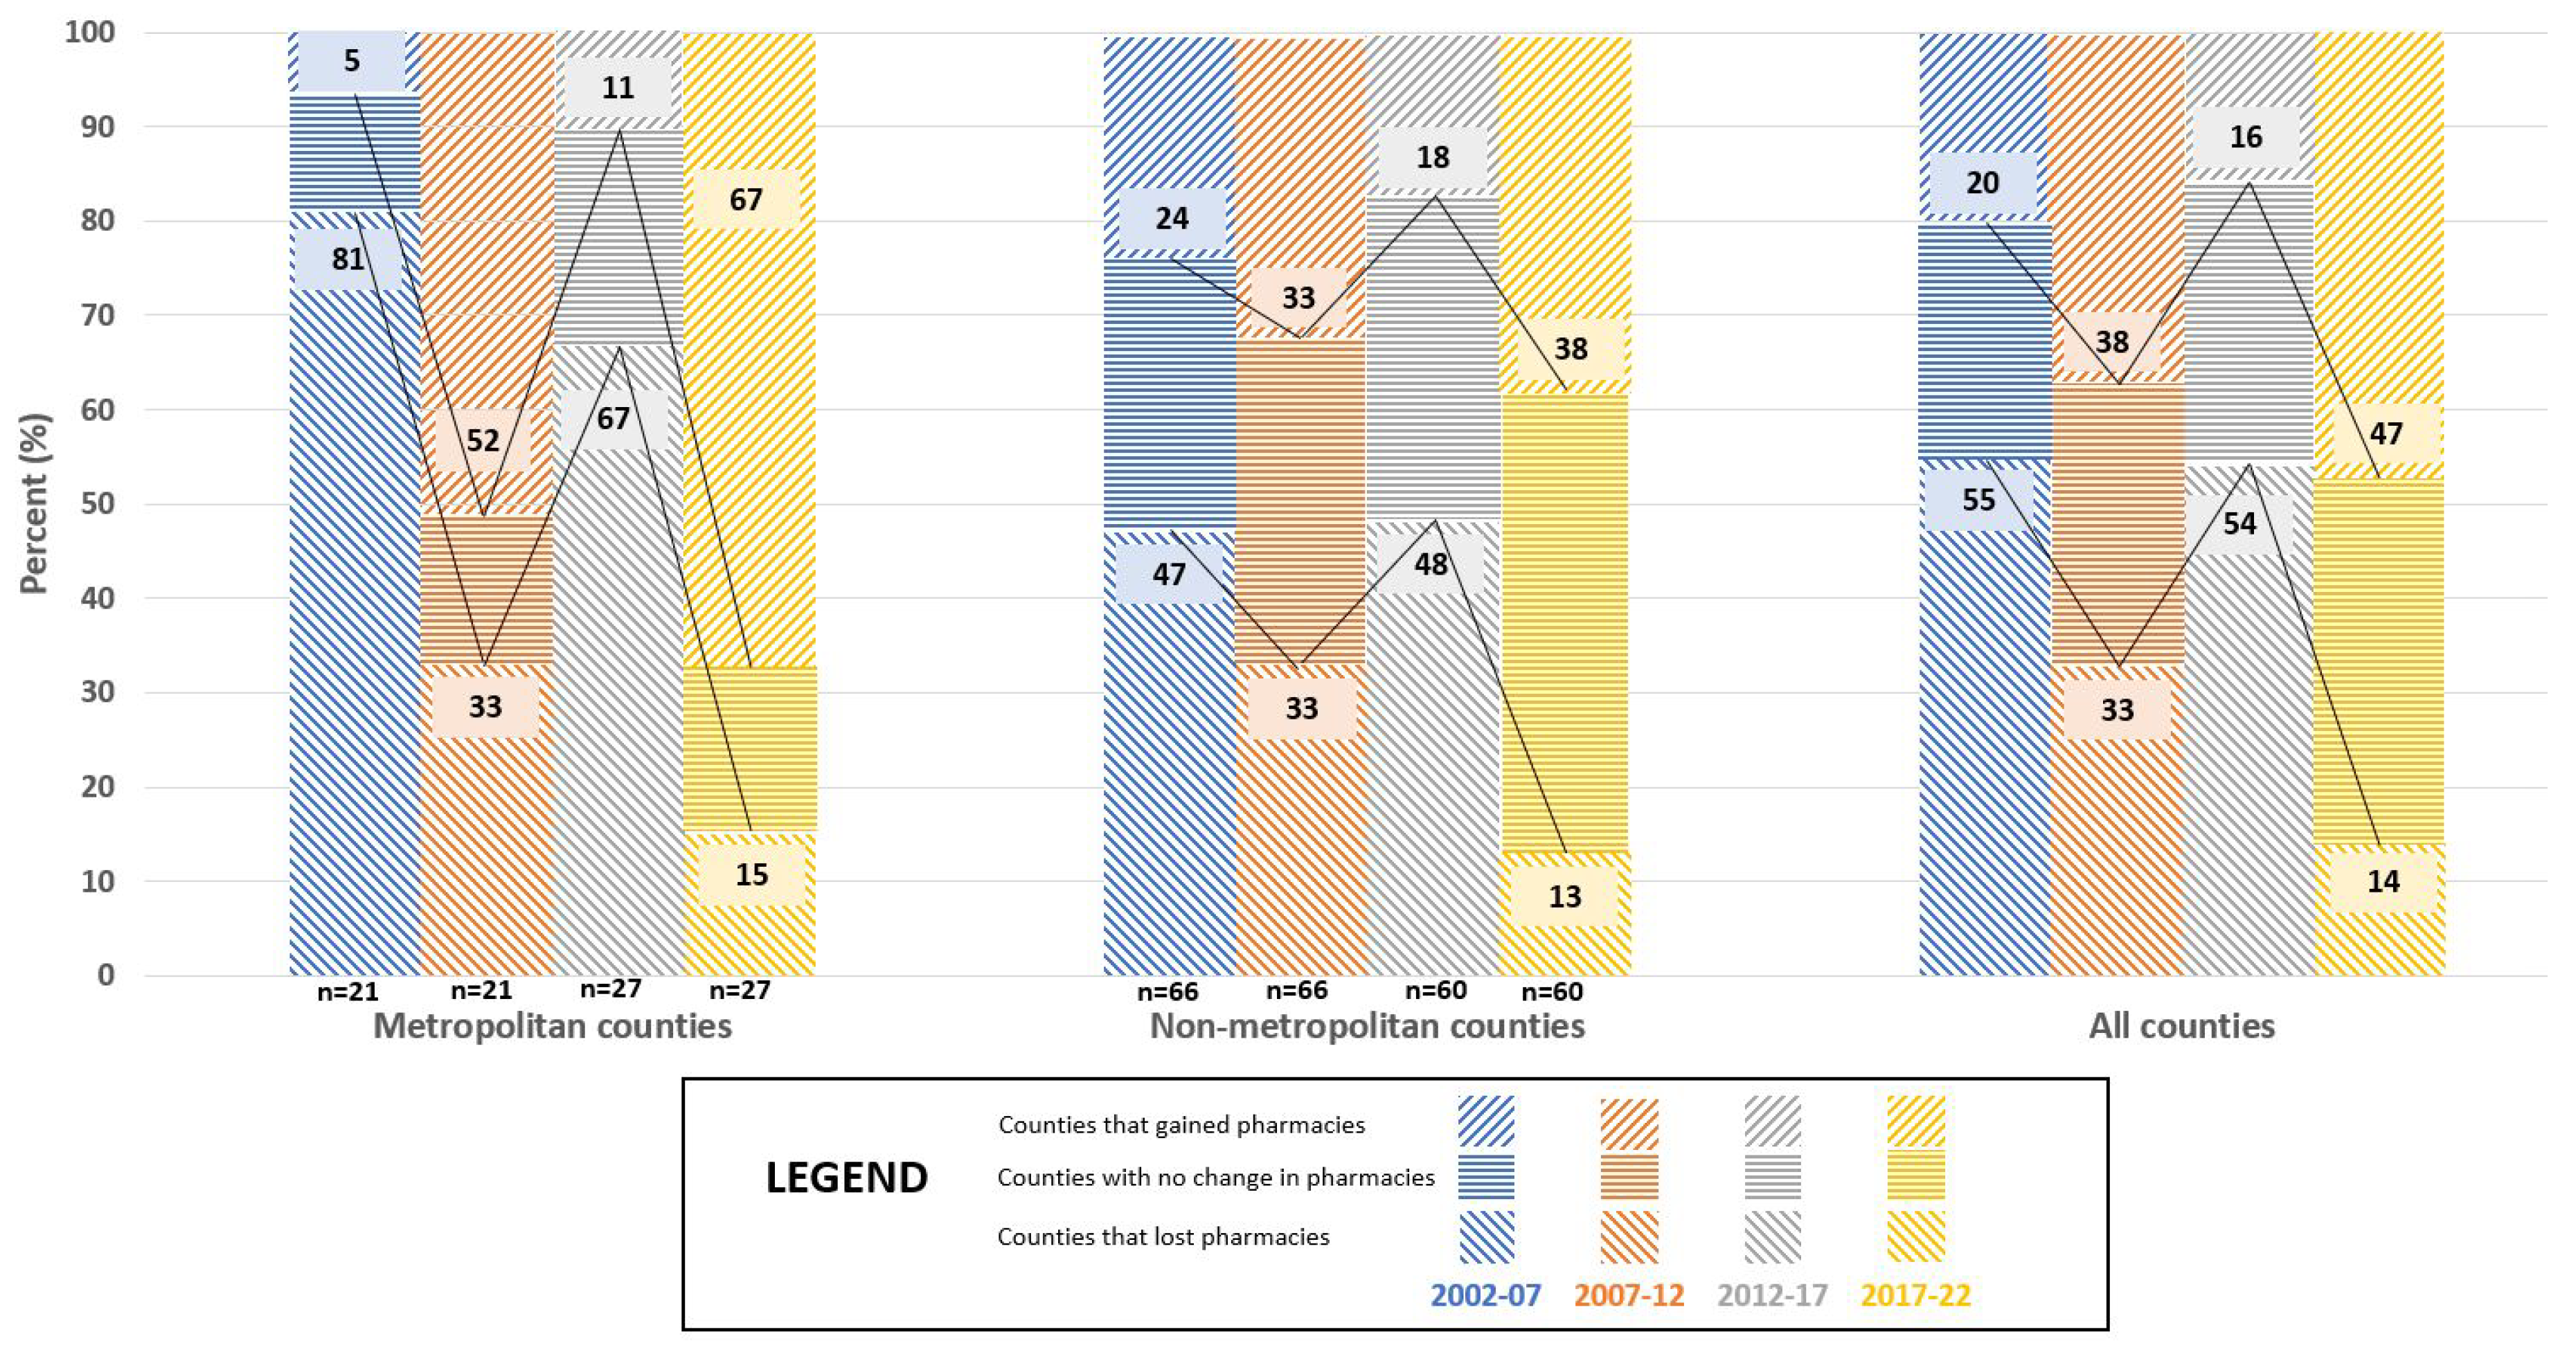
Figure A6.
The relationship between Metropolitan Designation and market dynamics for ‘Chain community pharmacies’ in Minnesota counties for 2002, 2007, 2012, 2017, and 2022 (N = 87).
Figure A6.
The relationship between Metropolitan Designation and market dynamics for ‘Chain community pharmacies’ in Minnesota counties for 2002, 2007, 2012, 2017, and 2022 (N = 87).
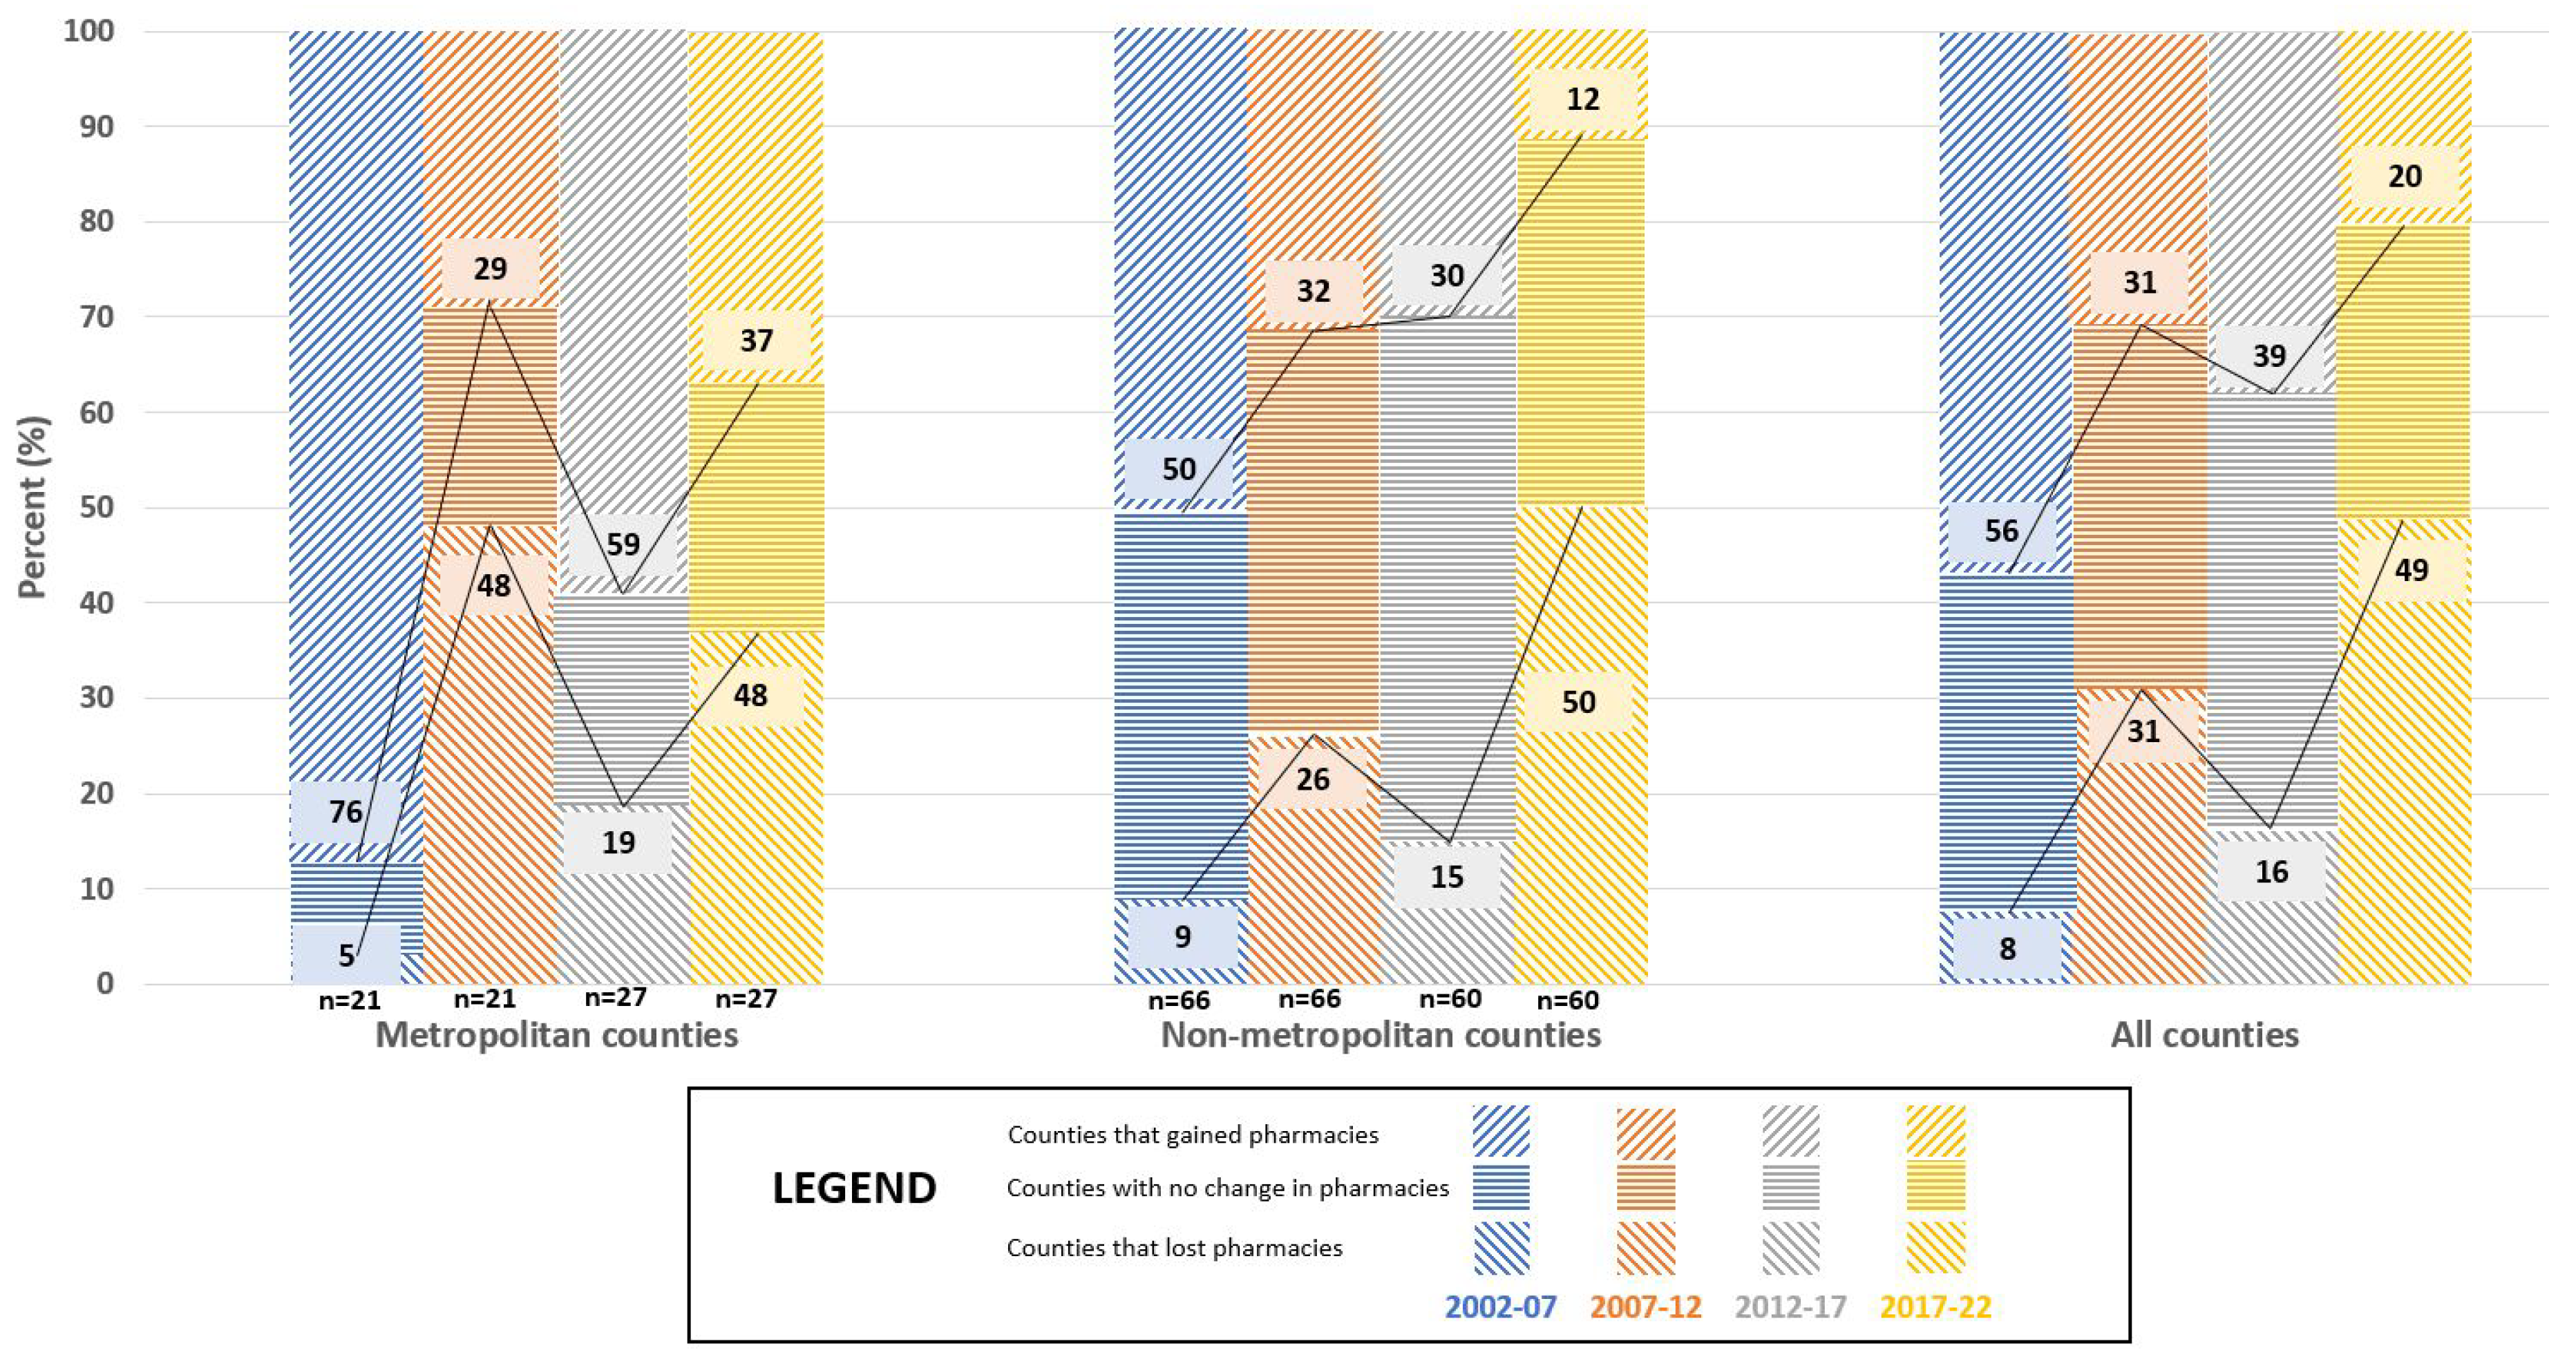
Figure A7.
The number of ‘Independent community pharmacies’ and ‘Chain community pharmacies’ in Minnesota for 2002, 2007, 2012, 2017, and 2022.
Figure A7.
The number of ‘Independent community pharmacies’ and ‘Chain community pharmacies’ in Minnesota for 2002, 2007, 2012, 2017, and 2022.
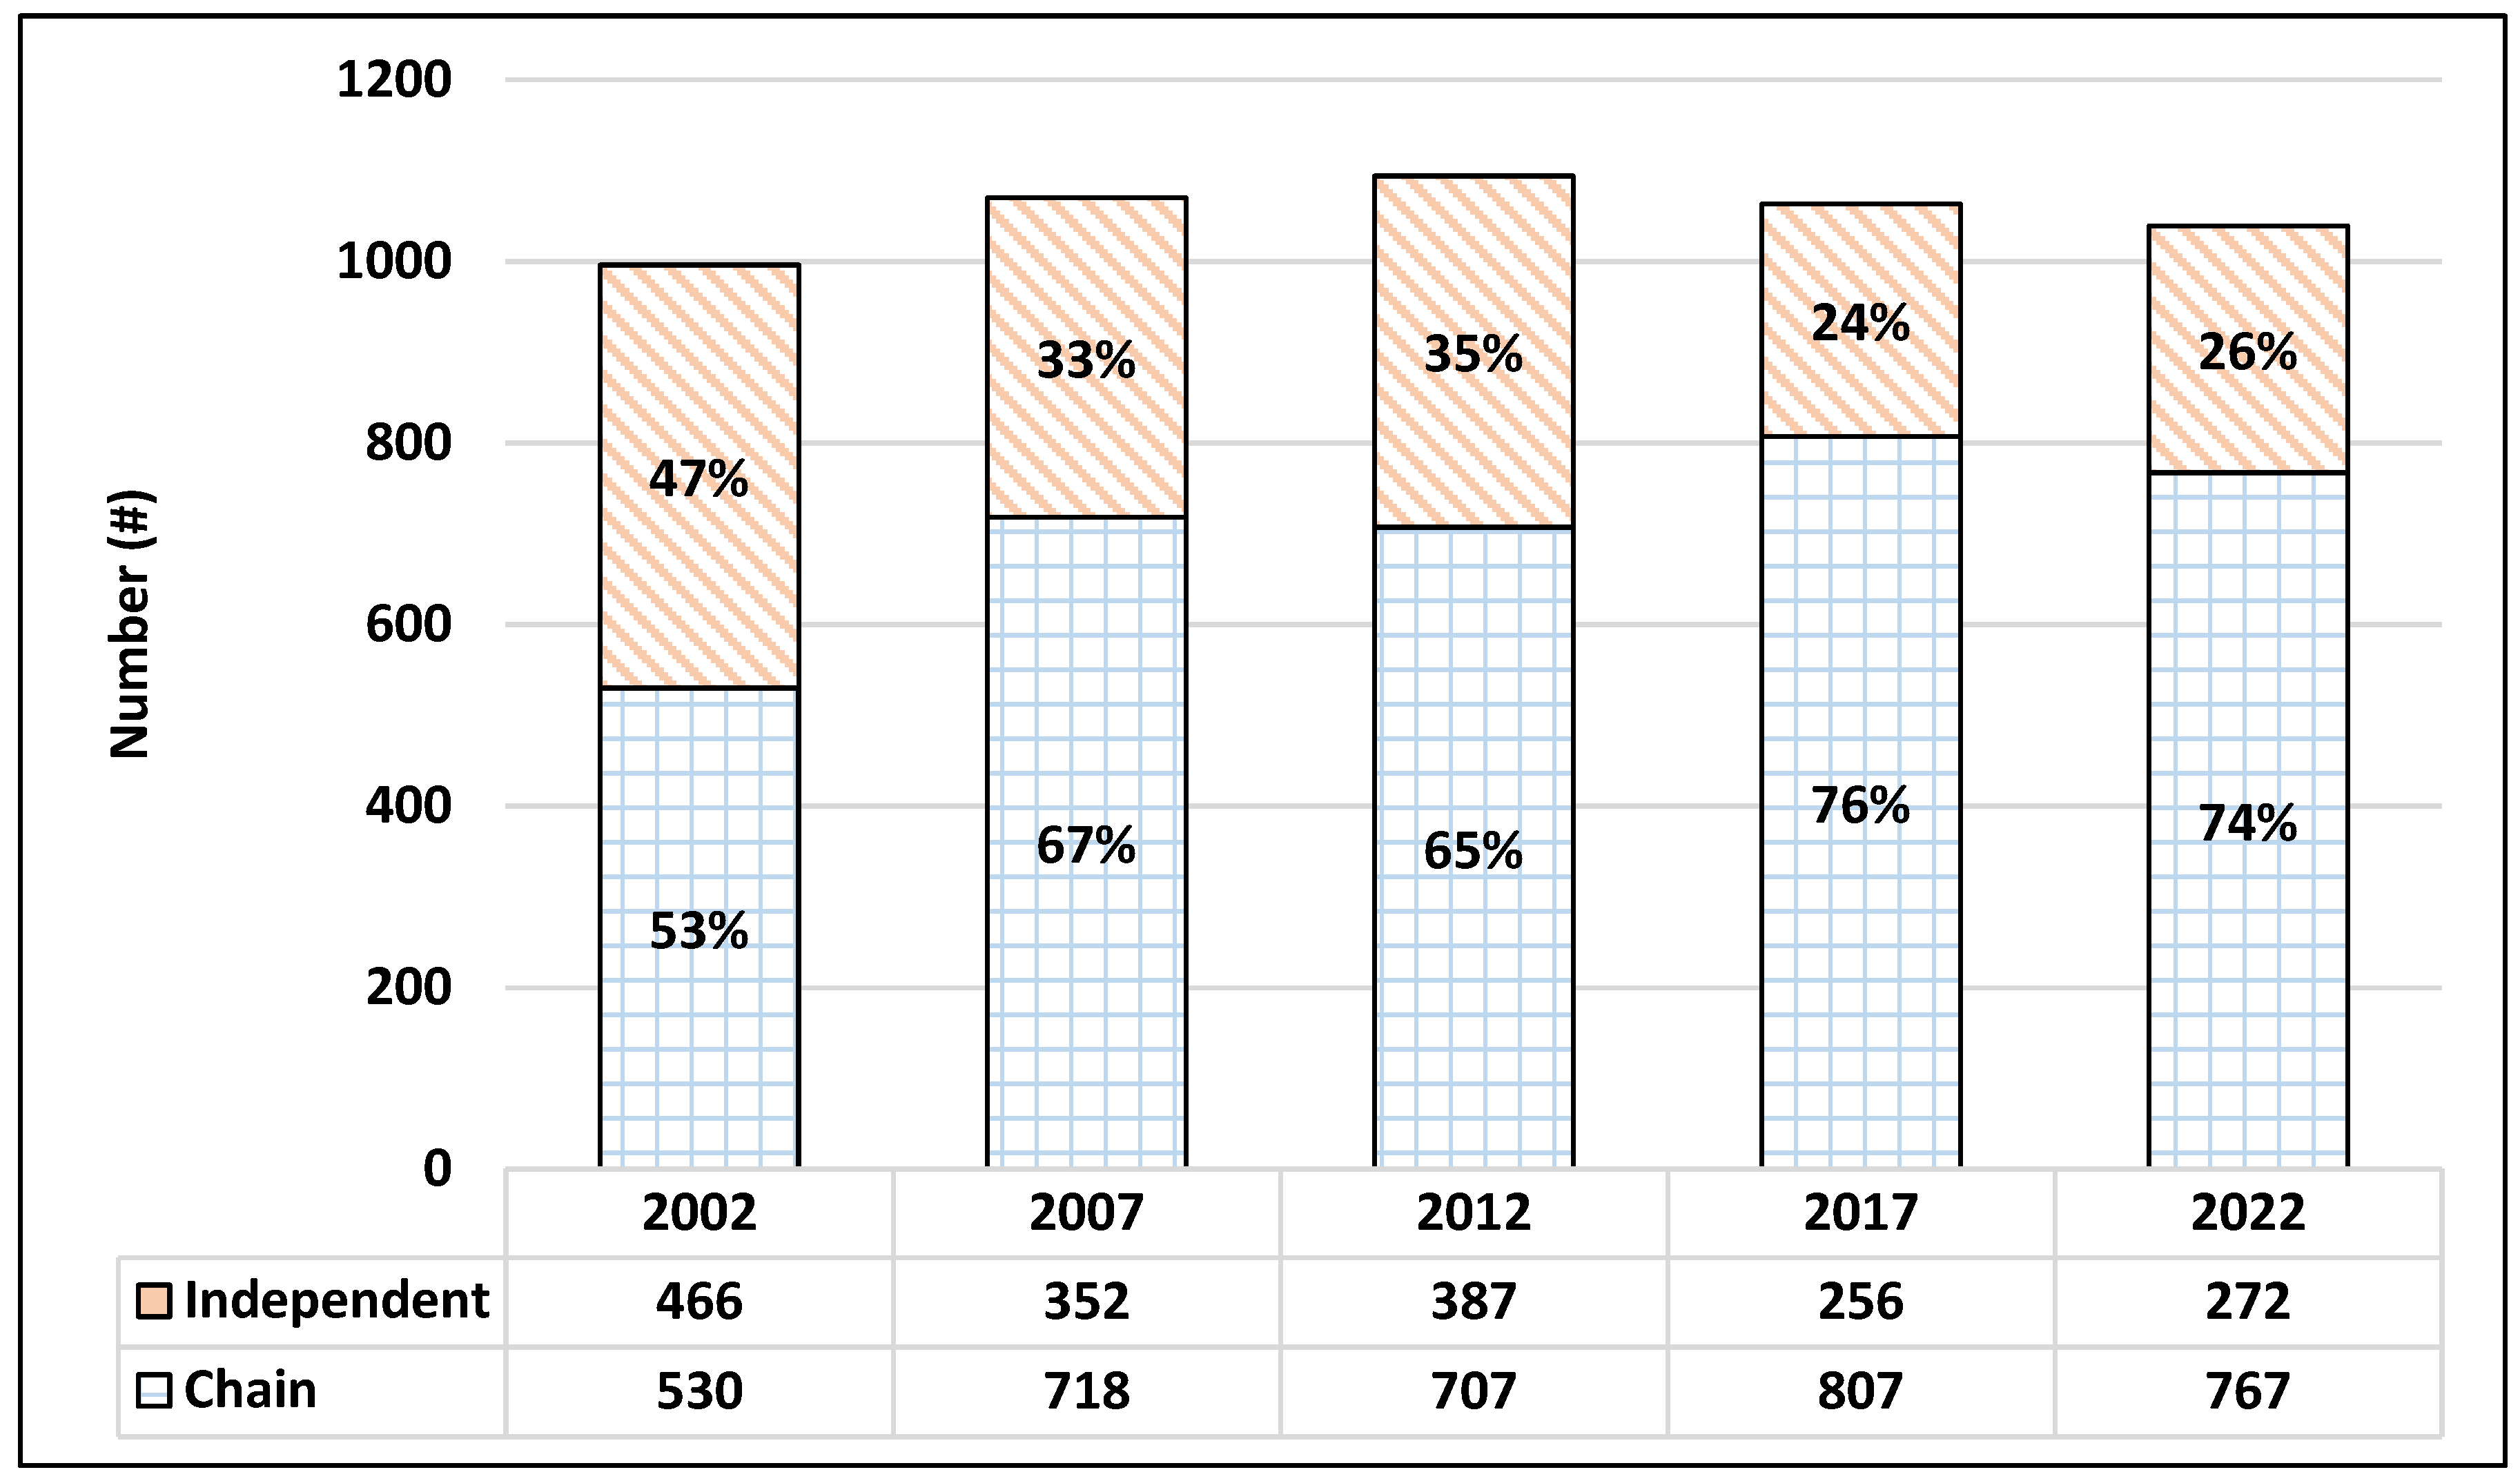
Figure A8.
The proportion of business organization structures for community pharmacies in Minnesota for 2002, 2007, 2012, 2017, and 2022.
Figure A8.
The proportion of business organization structures for community pharmacies in Minnesota for 2002, 2007, 2012, 2017, and 2022.
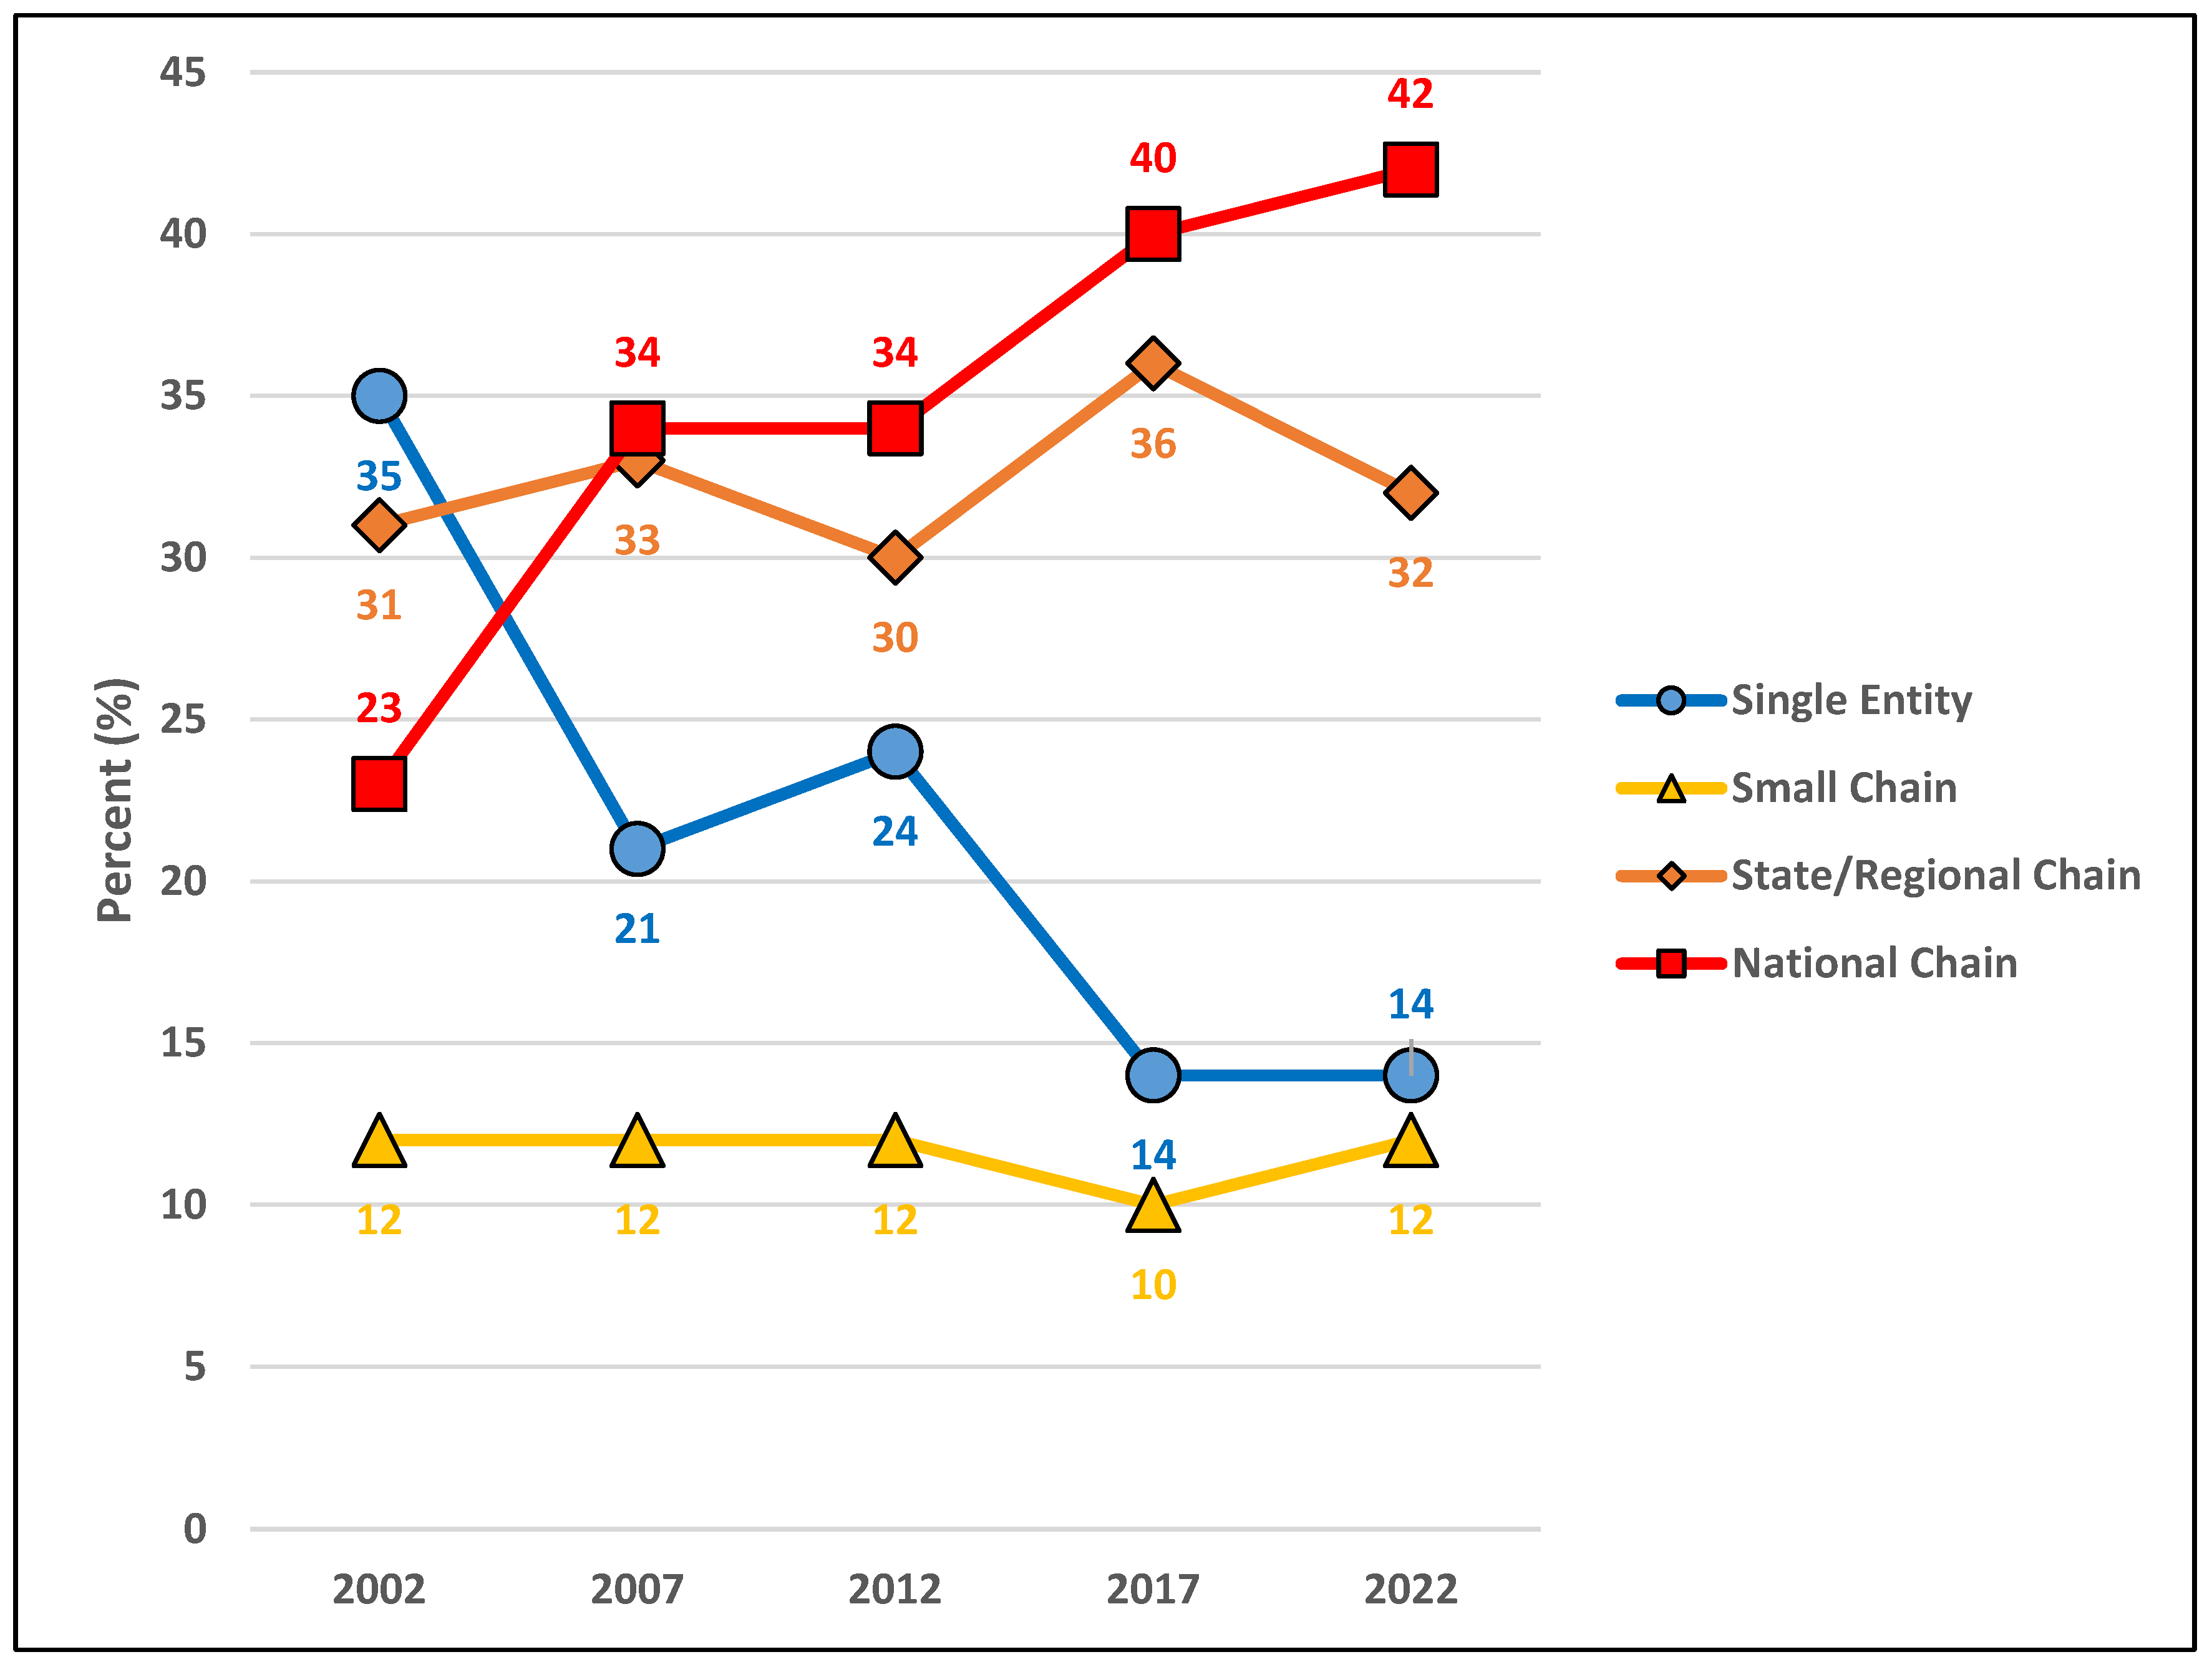
Figure A9.
The proportion of community pharmacy types in Minnesota for 2002, 2007, 2012, 2017, and 2022.
Figure A9.
The proportion of community pharmacy types in Minnesota for 2002, 2007, 2012, 2017, and 2022.
References
- Olson, A.W.; Schommer, J.C.; Hadsall, R.S. A 15 year ecological comparison for the market dynamics of Minnesota community pharmacies from 2002 to 2017. Pharmacy 2018, 6, 50. [Google Scholar] [CrossRef]
- Schommer, J.C.; Singh, R.L.; Cline, R.R.; Hadsall, R.S. Market dynamics of community pharmacies in Minnesota. Res. Soc. Adm. Pharm. 2006, 2, 347–358. [Google Scholar] [CrossRef] [PubMed]
- Schommer, J.C.; Yusuf, A.A.; Hadsall, R.S. Market dynamics of community pharmacies in Minnesota, U.S. from 1992 through 2012. Res. Soc. Adm. Pharm. 2014, 10, 217–231. [Google Scholar] [CrossRef] [PubMed]
- Shcherbakova, N.; Desselle, S. Looking back at US pharmacy’s past to help discern its future. Annals of Pharmacotherapy 2020, 54, 907–920. [Google Scholar] [CrossRef] [PubMed]
- Grabenstein, J.D. Essential services: Quantifying the contributions of America’s pharmacists in COVID-19 clinical interventions. J. Am. Pharm. Assoc. 2022, 62, 1929–1945. [Google Scholar] [CrossRef] [PubMed]
- Lund, M.; Nielsen, C. The concept of business model scalability. Journal of Business Models 2018, 6, 1–18. [Google Scholar]
- Angeli, F.; Jaiswal, A.K. Business model innovation for inclusive health care delivery at the bottom of the pyramid. Organization & Environment 2016, 29, 486–507. [Google Scholar] [CrossRef]
- Services MD of H. Minnesota Board of Pharmacy. 2022. Available online: https://mn.gov/boards/pharmacy/ (accessed on 15 November 2022).
- US Census Bureau. Statistical Abstract of the United States. US Dep Commer. 1AD. Available online: https://www.census.gov/history/www/reference/publications/statistical_abstracts.html (accessed on 7 December 2022).
- Minnesota State Demographic Center (SDC). Available online: https://mn.gov/admin/demography/ (accessed on 15 November 2022).
- Perrault, W.D.; Leigh, L.E. Reliability of nominal data based on qualitative judgments. J. Marketing Res. 1989, 26, 135–148. [Google Scholar] [CrossRef]
- Cipolle, R.J.; Strand, L.M.; Morley, P.C. Pharmaceutical Care Practice; McGraw-Hill: New York, NY, USA, 1998; pp. 237–265. [Google Scholar]
- Glazer, R. Smart services: Competitive advantage through information-intensive strategies. In Handbook of Services Marketing & Management; Swartz and Iaobucci, Ed.; Sage Publications, Inc.: Thousand Oaks, CA, USA, 2000; pp. 409–418. [Google Scholar]
- Schommer, J.C.; Doucette, W.R.; Johnson, K.A.; Planas, L.G. Positioning and integrating medication therapy management. J. Amer. Pharm. Assoc. 2012, 53, 12–24. [Google Scholar] [CrossRef] [PubMed]
- Rebelo, A. US survey signals big shifts in primary care to pharmacy and clinic settings as consumers seek lower medication and healthcare costs. Wolters Kluwer, Health, 7 December 2022. Available online: https://www.wolterskluwer.com/en/news/us-survey-signals-big-shifts-in-primary-care-to-pharmacy-and-clinic-settings (accessed on 10 January 2023).
Table 1.
Number (%) of Minnesota Licensed Pharmacies Located In-State and Out-of-State (2002 – 2022).
Table 1.
Number (%) of Minnesota Licensed Pharmacies Located In-State and Out-of-State (2002 – 2022).
| 2002 | 2007 | 2012 | 2017 | 2022 | |
|---|---|---|---|---|---|
| In-State | 1171 (81%) | 1263 (76%) | 1253 (69%) | 1262 (62%) | 1129 (54%) |
| Out-of-State | 283 (19%) | 395 (24%) | 557 (31%) | 881 (41%) | 960 (46%) |
| Total | 1454 (100%) | 1658 (100%) | 1810 (100%) | 2143 (100%) | 2089 (100%) |
Disclaimer/Publisher’s Note: The statements, opinions and data contained in all publications are solely those of the individual author(s) and contributor(s) and not of MDPI and/or the editor(s). MDPI and/or the editor(s) disclaim responsibility for any injury to people or property resulting from any ideas, methods, instructions or products referred to in the content. |
© 2023 by the authors. Licensee MDPI, Basel, Switzerland. This article is an open access article distributed under the terms and conditions of the Creative Commons Attribution (CC BY) license (http://creativecommons.org/licenses/by/4.0/).
Copyright: This open access article is published under a Creative Commons CC BY 4.0 license, which permit the free download, distribution, and reuse, provided that the author and preprint are cited in any reuse.


