Submitted:
12 June 2023
Posted:
14 June 2023
You are already at the latest version
Abstract
Keywords:
1. Introduction
2. Results and Discussion
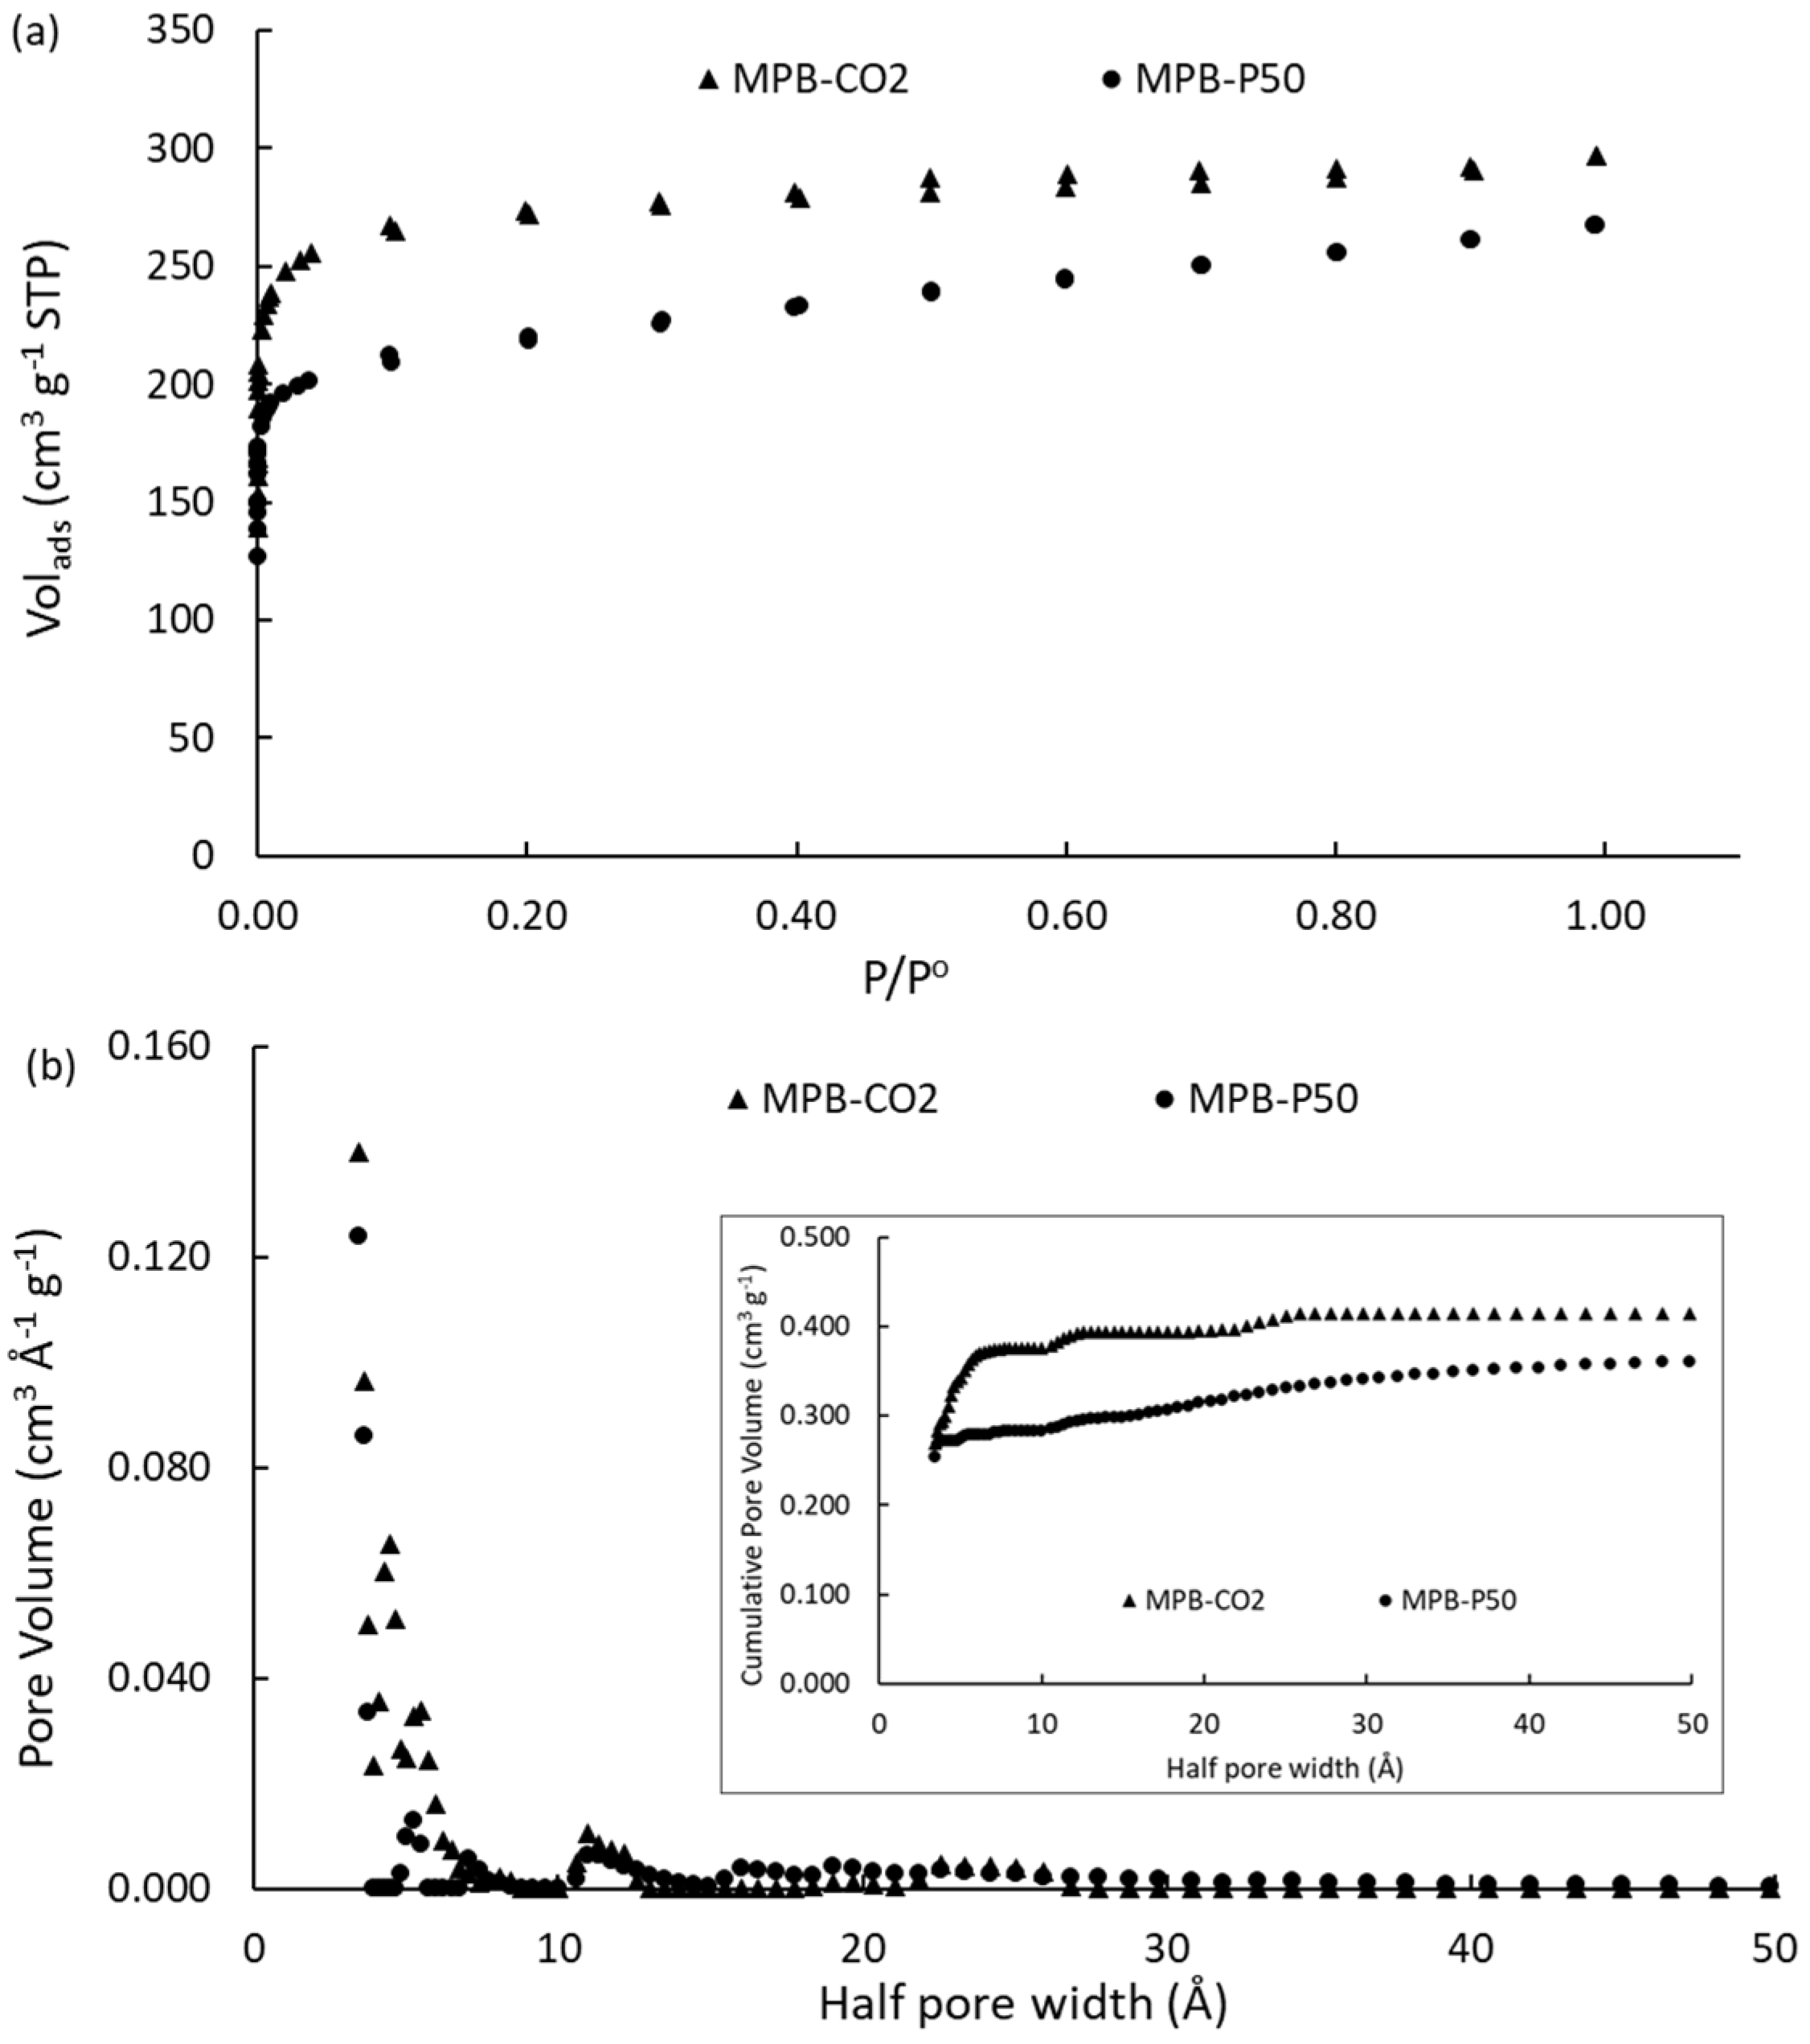
2.1. N2 Adsorption-Desorption Isotherms
|
Samples |
Yield (%) a |
SBET (m2.g-1) b |
Vmic (cm3.g-1) c |
W (nm) c | Vtot (cm3 g-1) d |
Vmic/Vtot (%) e |
|---|---|---|---|---|---|---|
| MPB | 35 | 20 | 0.001 | -- | 0.030 | 0.03 |
| MPB-CO2 | 24 | 1080 | 0.420 | 0.72 | 0.459 | 0.92 |
| MPB-P50 | 32 | 847 | 0322 | 1.38 | 0.414 | 0.78 |
| ACM f | -- | 775 | 0.402 | 0.96 | 0.495 | 0.81 |
| ACPC f | -- | 1240 | 0.390 | 1.98 | 0.650 | 0.60 |
2.2. Scanning Electron Microscopy (SEM) and Surface Analysis
| Sample | Carboxylic | Lactones | Phenol | Total acid | Total basic | Total |
pHPZC |
|---|---|---|---|---|---|---|---|
| (mmol·g-1) | (mmol·g-1) | (mmol·g-1) | (mmol·g-1) | (mmol·g-1) | (mmol·g-1) | ||
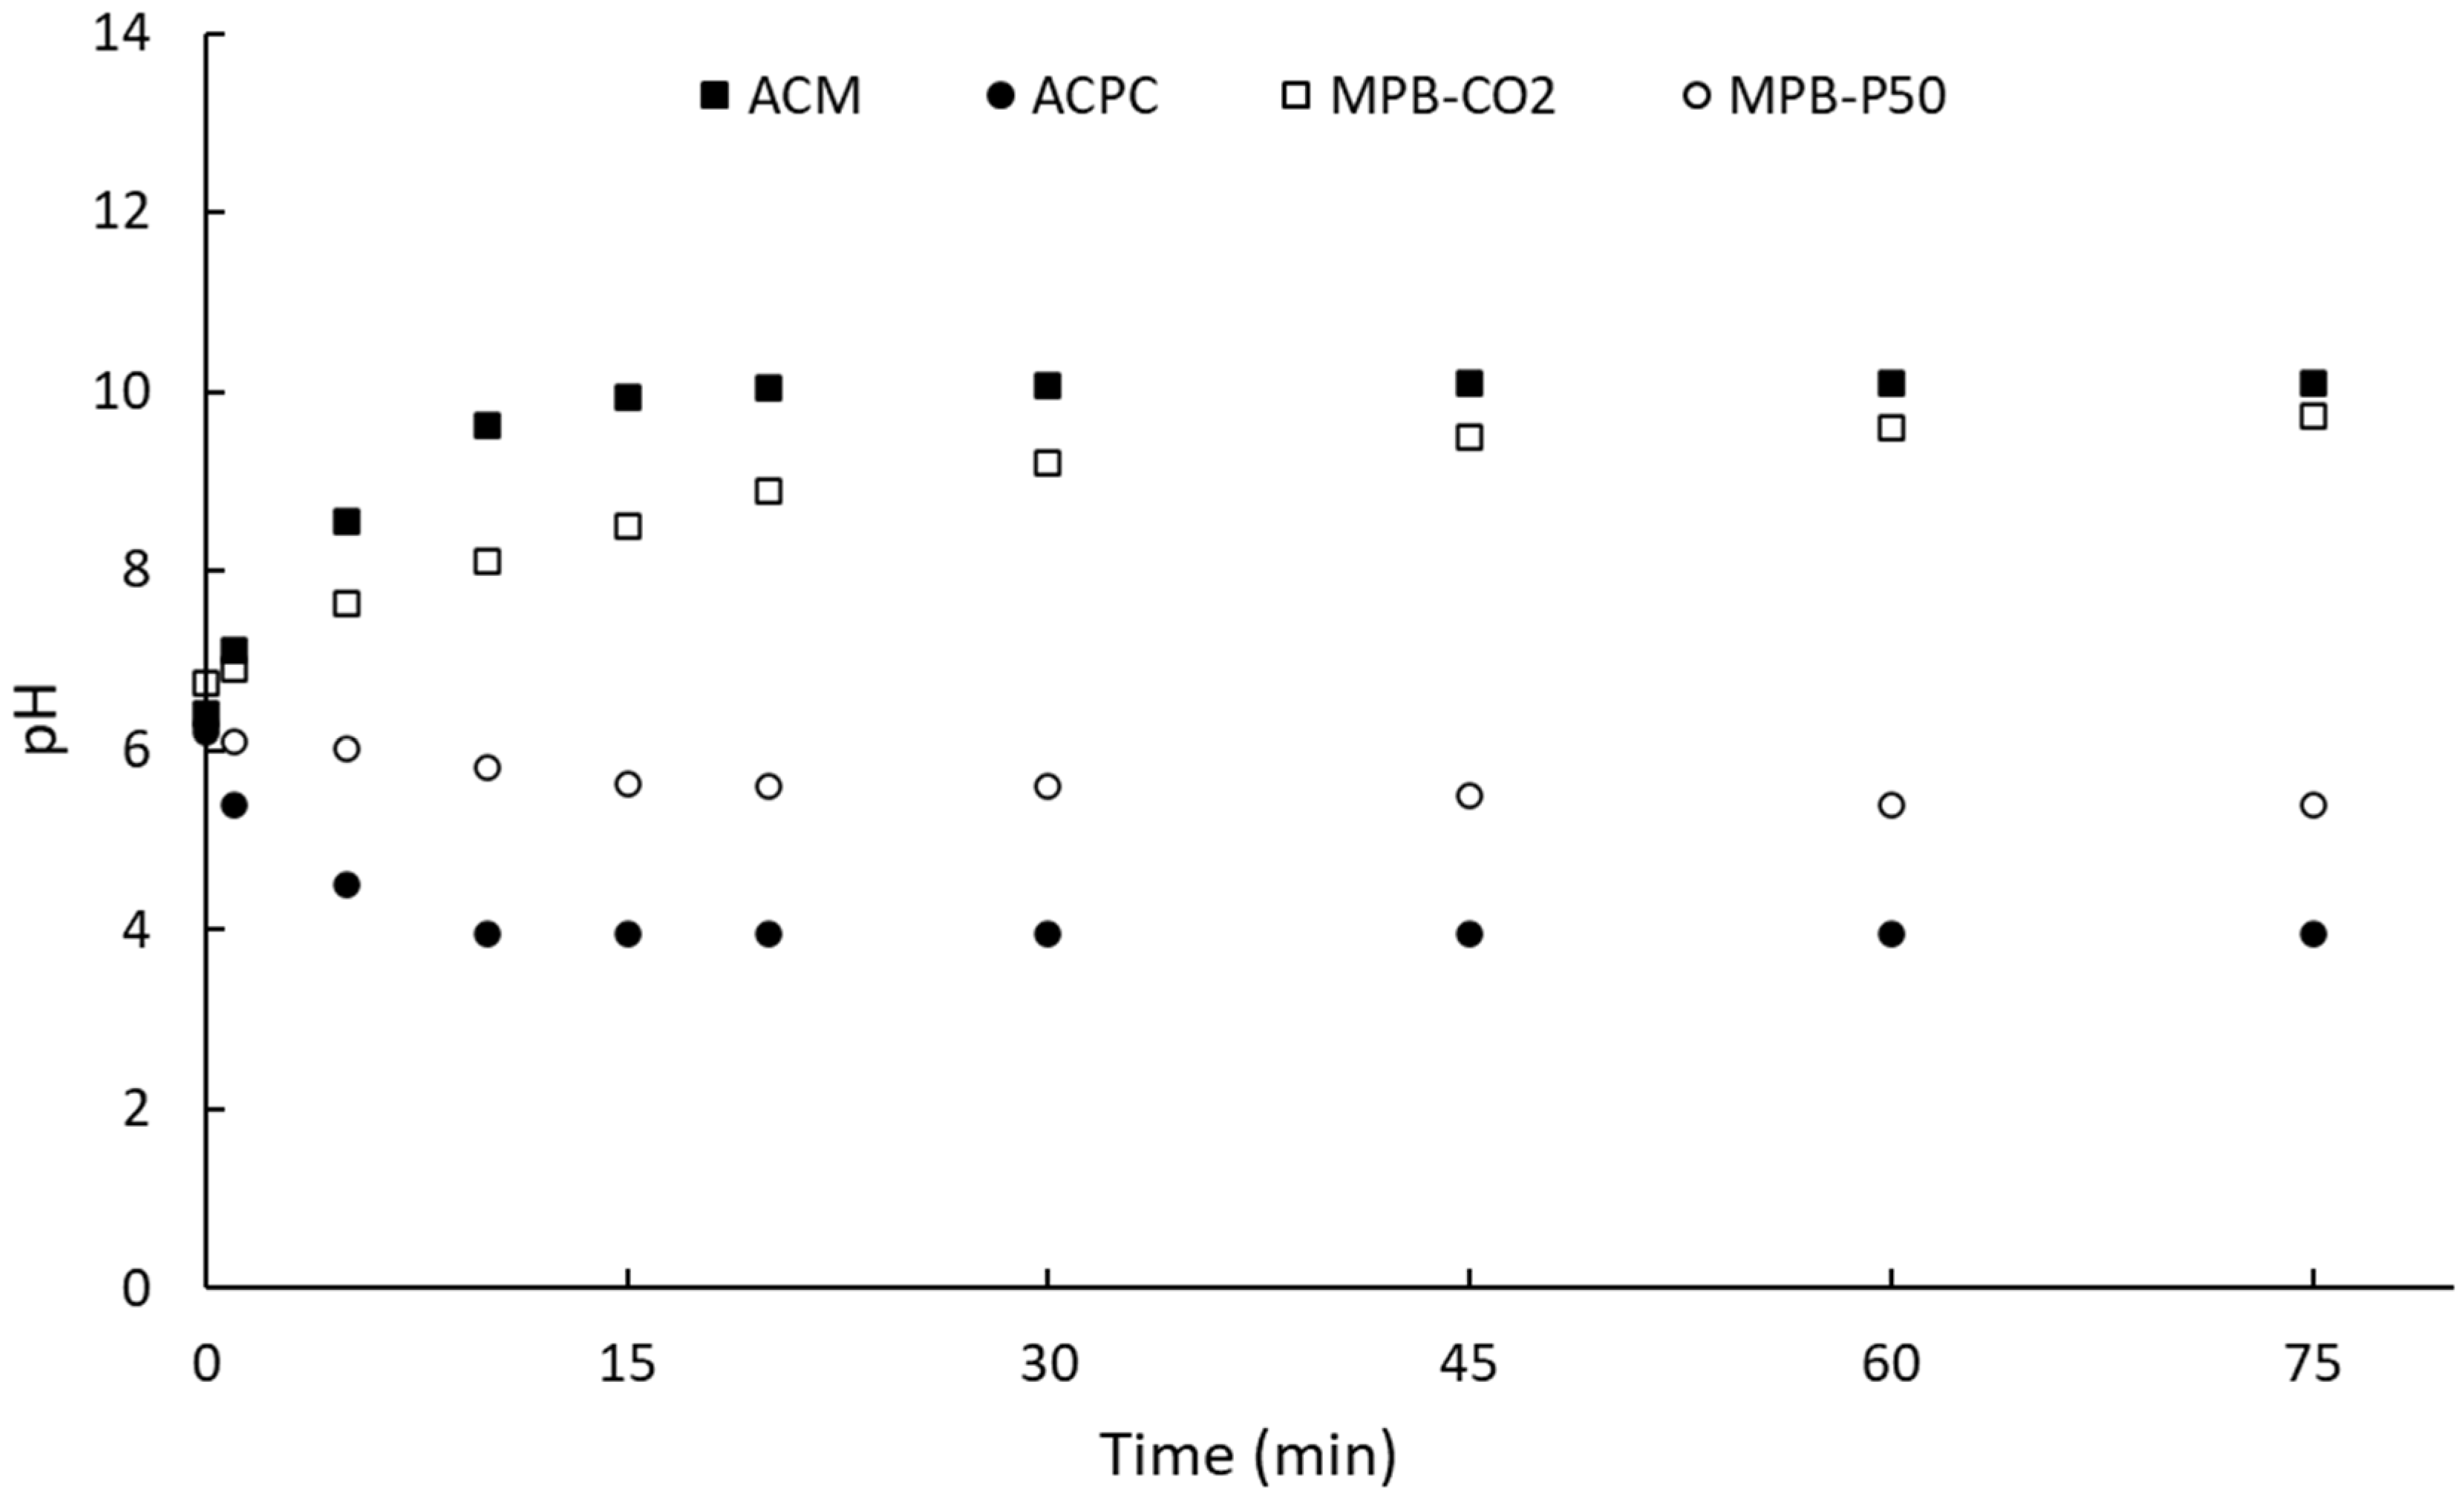
| MPB-CO2 | 0.053 | 0.532 | 0.360 | 0.413 | 0.532 | 0.945 | 9.7 |
| MPB-P50 | 0.619 | 0.137 | 5.444 | 6.063 | 0.137 | 6.200 | 5.4 |
2.3. Atrazine Adsorption
2.3.1. Kinetic Studies
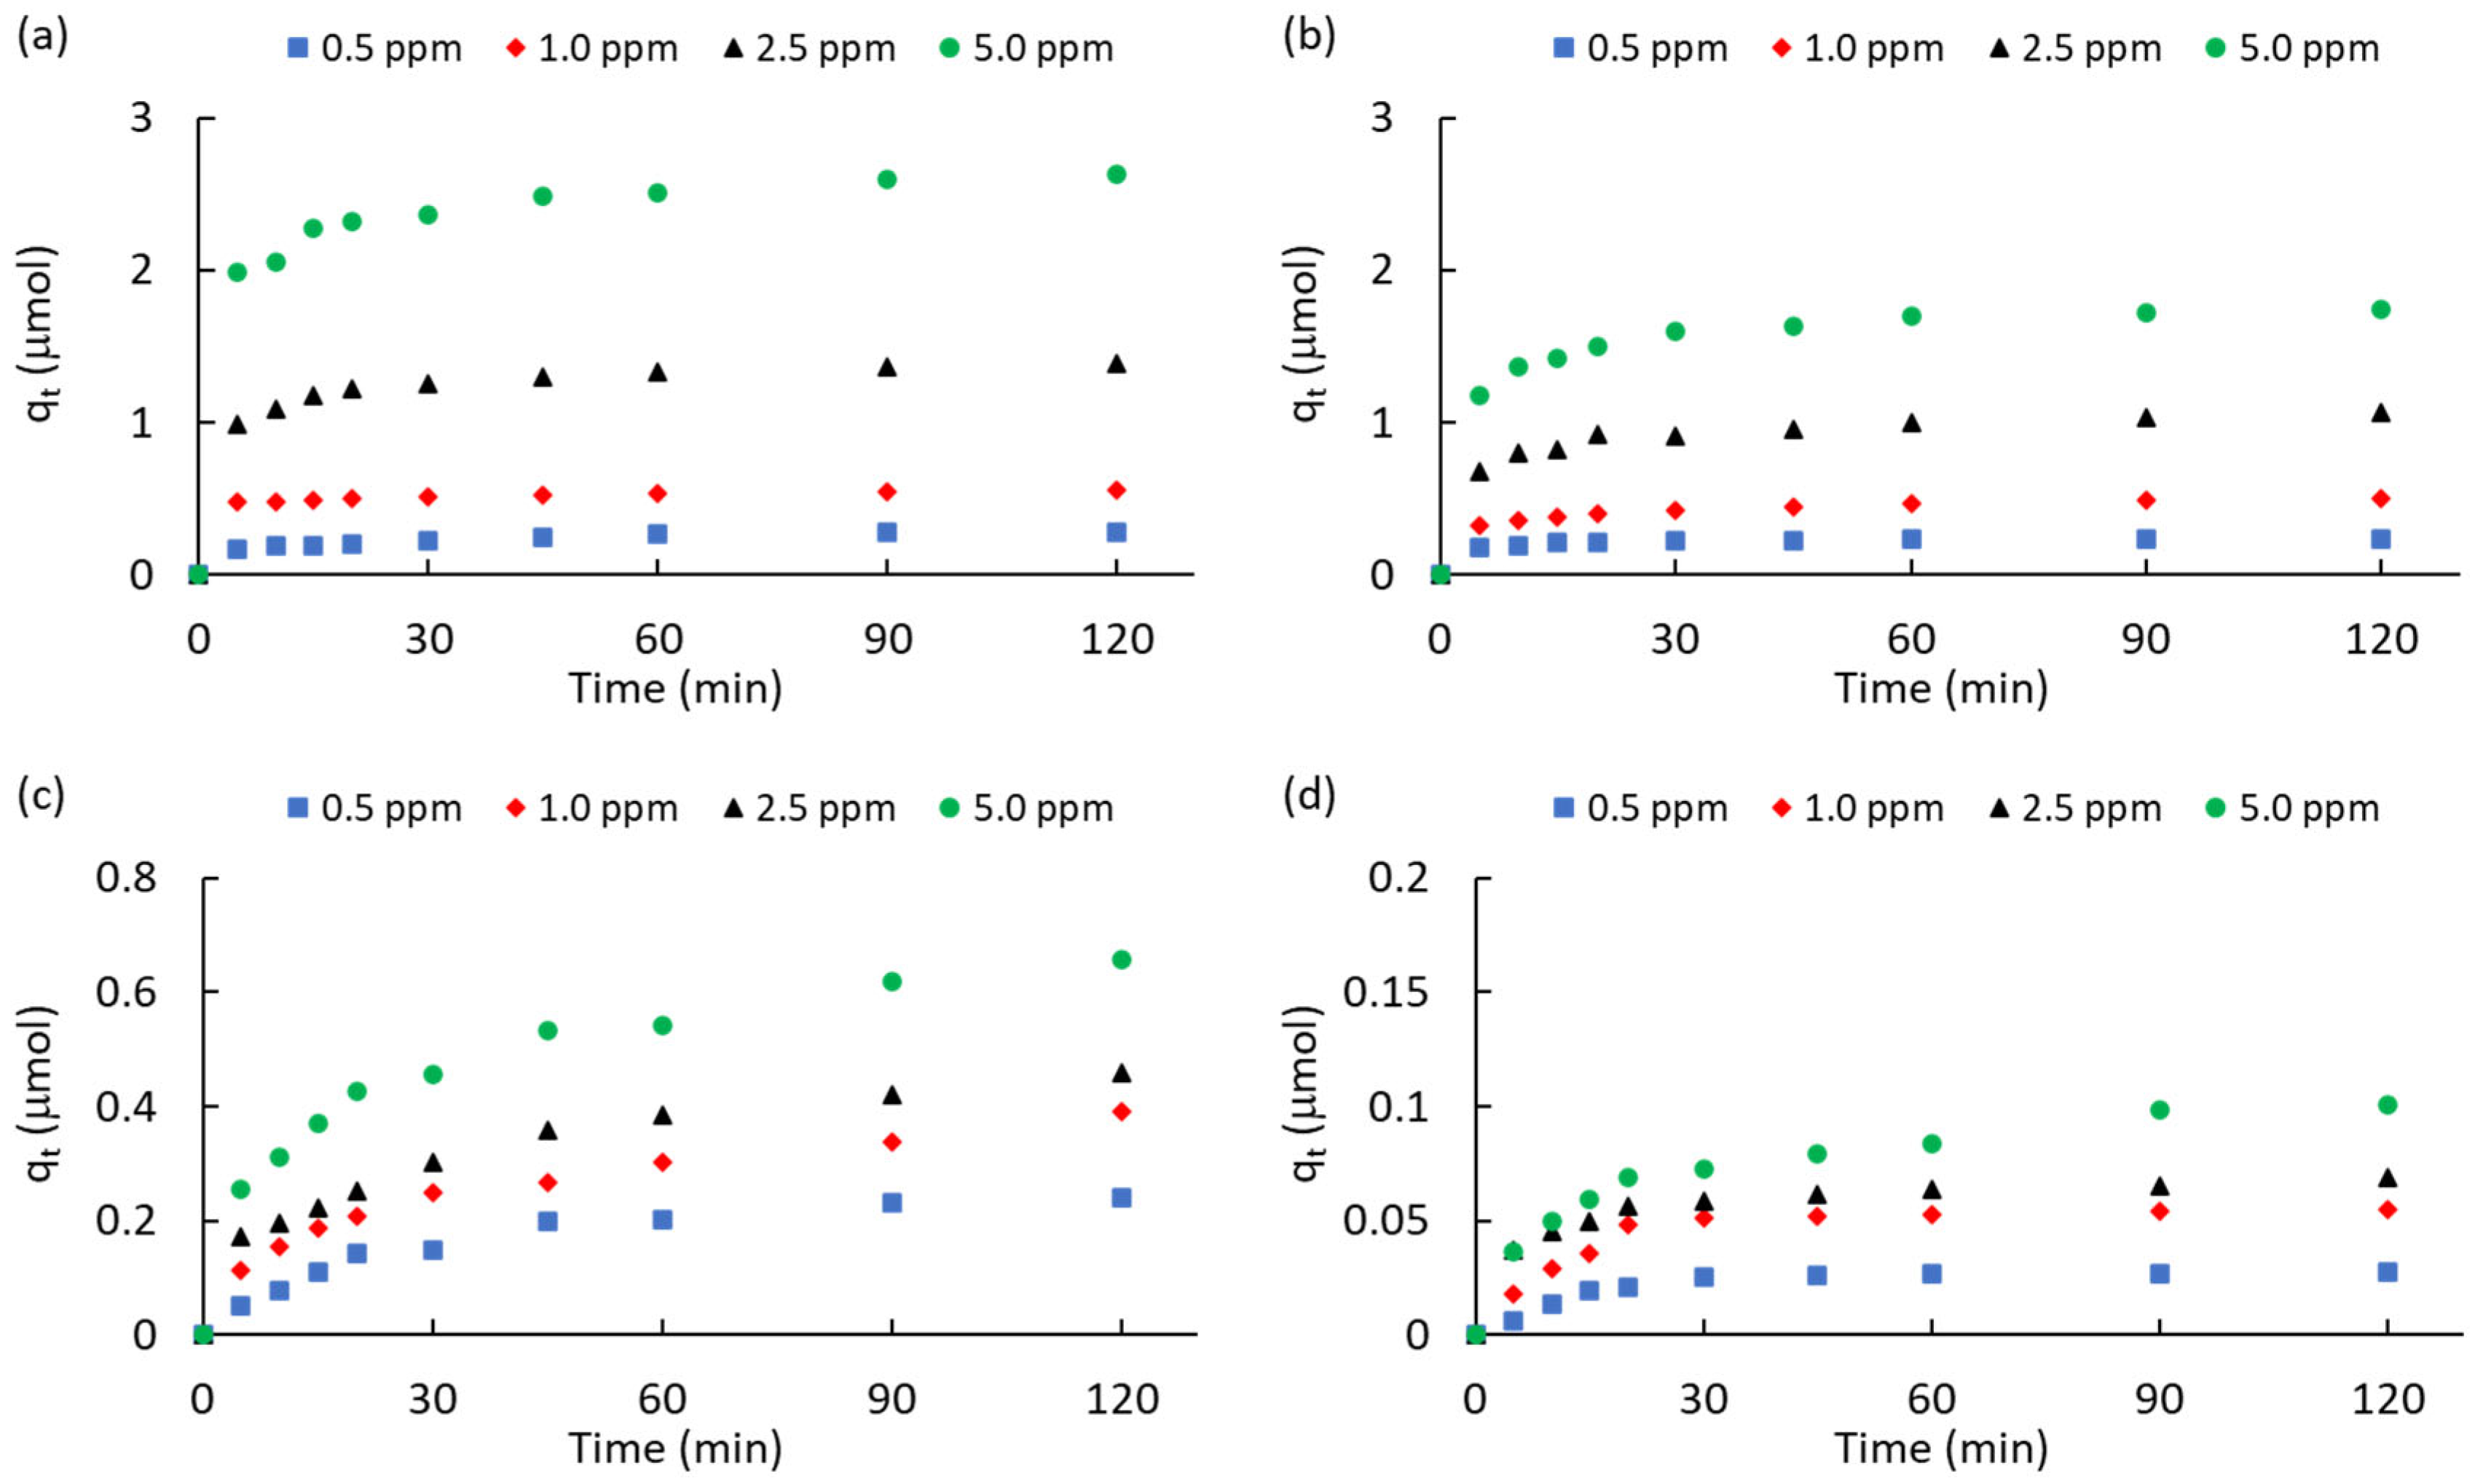
|
Carbon |
ATZ (ppm) | qeq a (μmol) | k1 b (min-1) |
R2k1 c | k2 d (μmol-1·min-1) |
R2k2 e | kp f (μmol-1·min-0.5) |
C g (μmol) |
R2kp h |
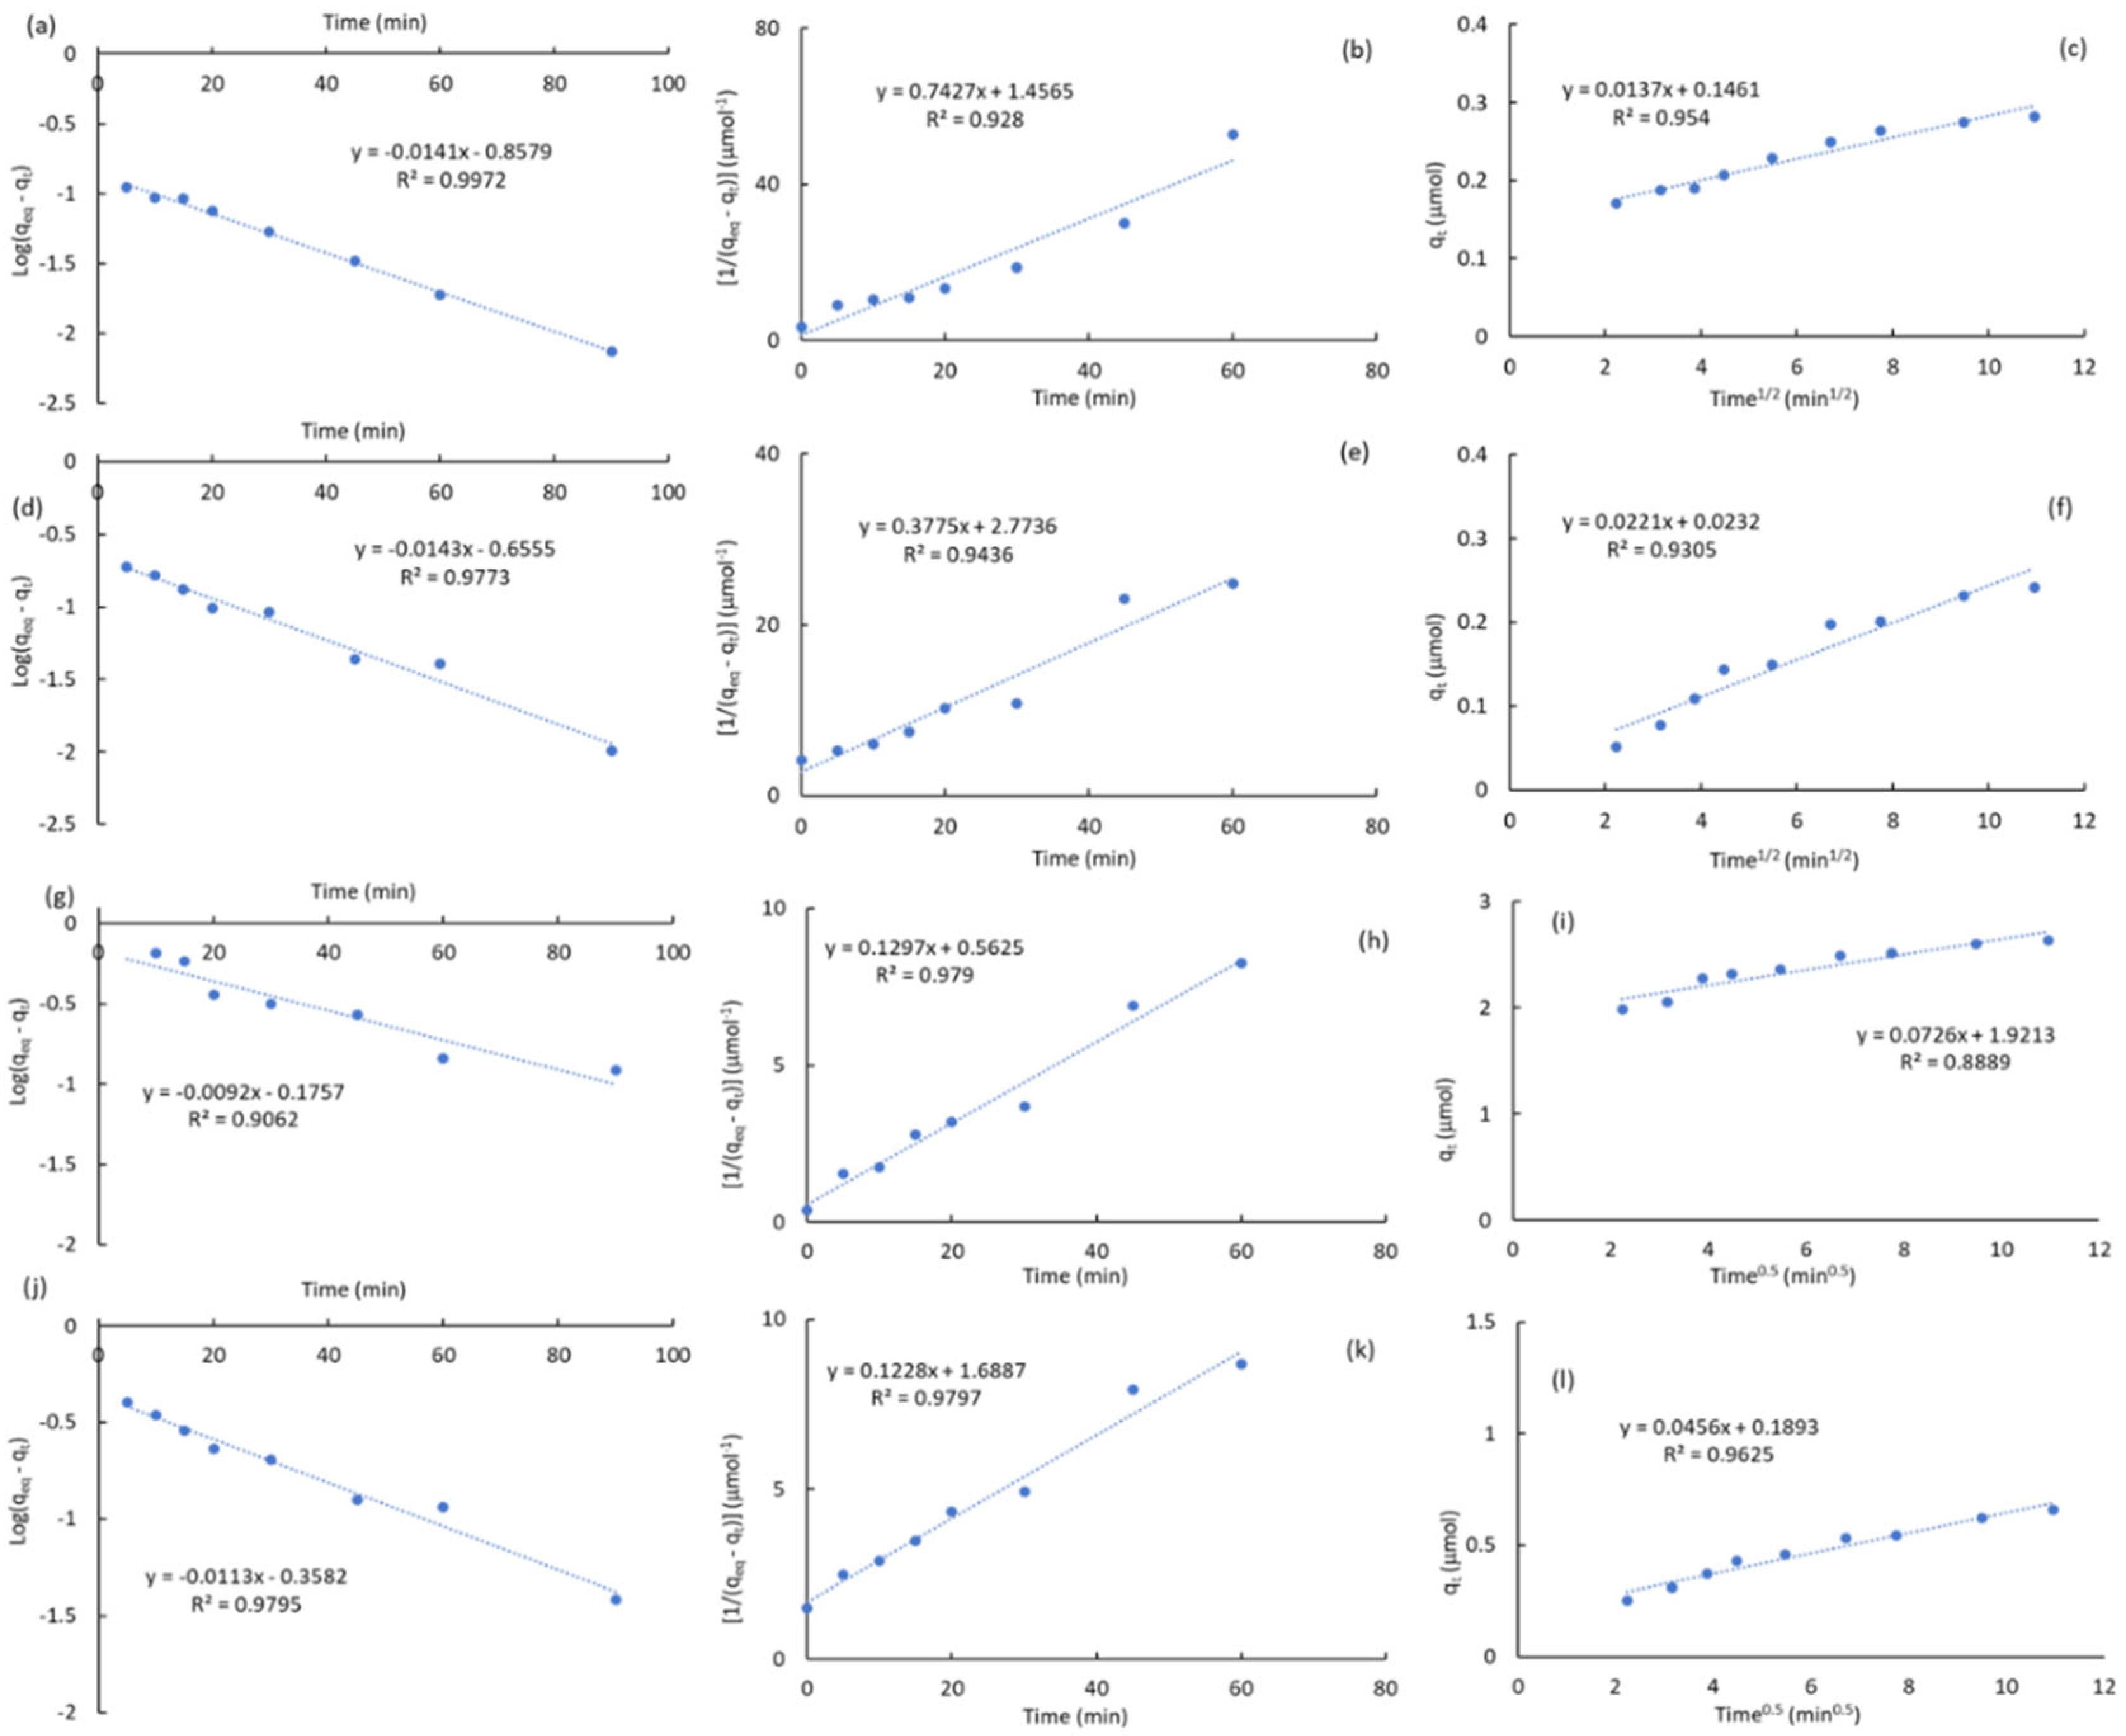
| ACM | 0.5 | 0.282 | 0.032 | 0.997 | 0.743 | 0.928 | 0.014 | 0.146 | 0.954 |
| 1 | 0.556 | 0.024 | 0.996 | 0.638 | 0.966 | 0.009 | 0.458 | 0.981 | |
| 2.5 | 1.385 | 0.033 | 0.985 | 0.285 | 0.963 | 0.042 | 0.981 | 0.863 | |
| 5 | 2.632 | 0.021 | 0.906 | 0.130 | 0.979 | 0.073 | 1.921 | 0.889 | |
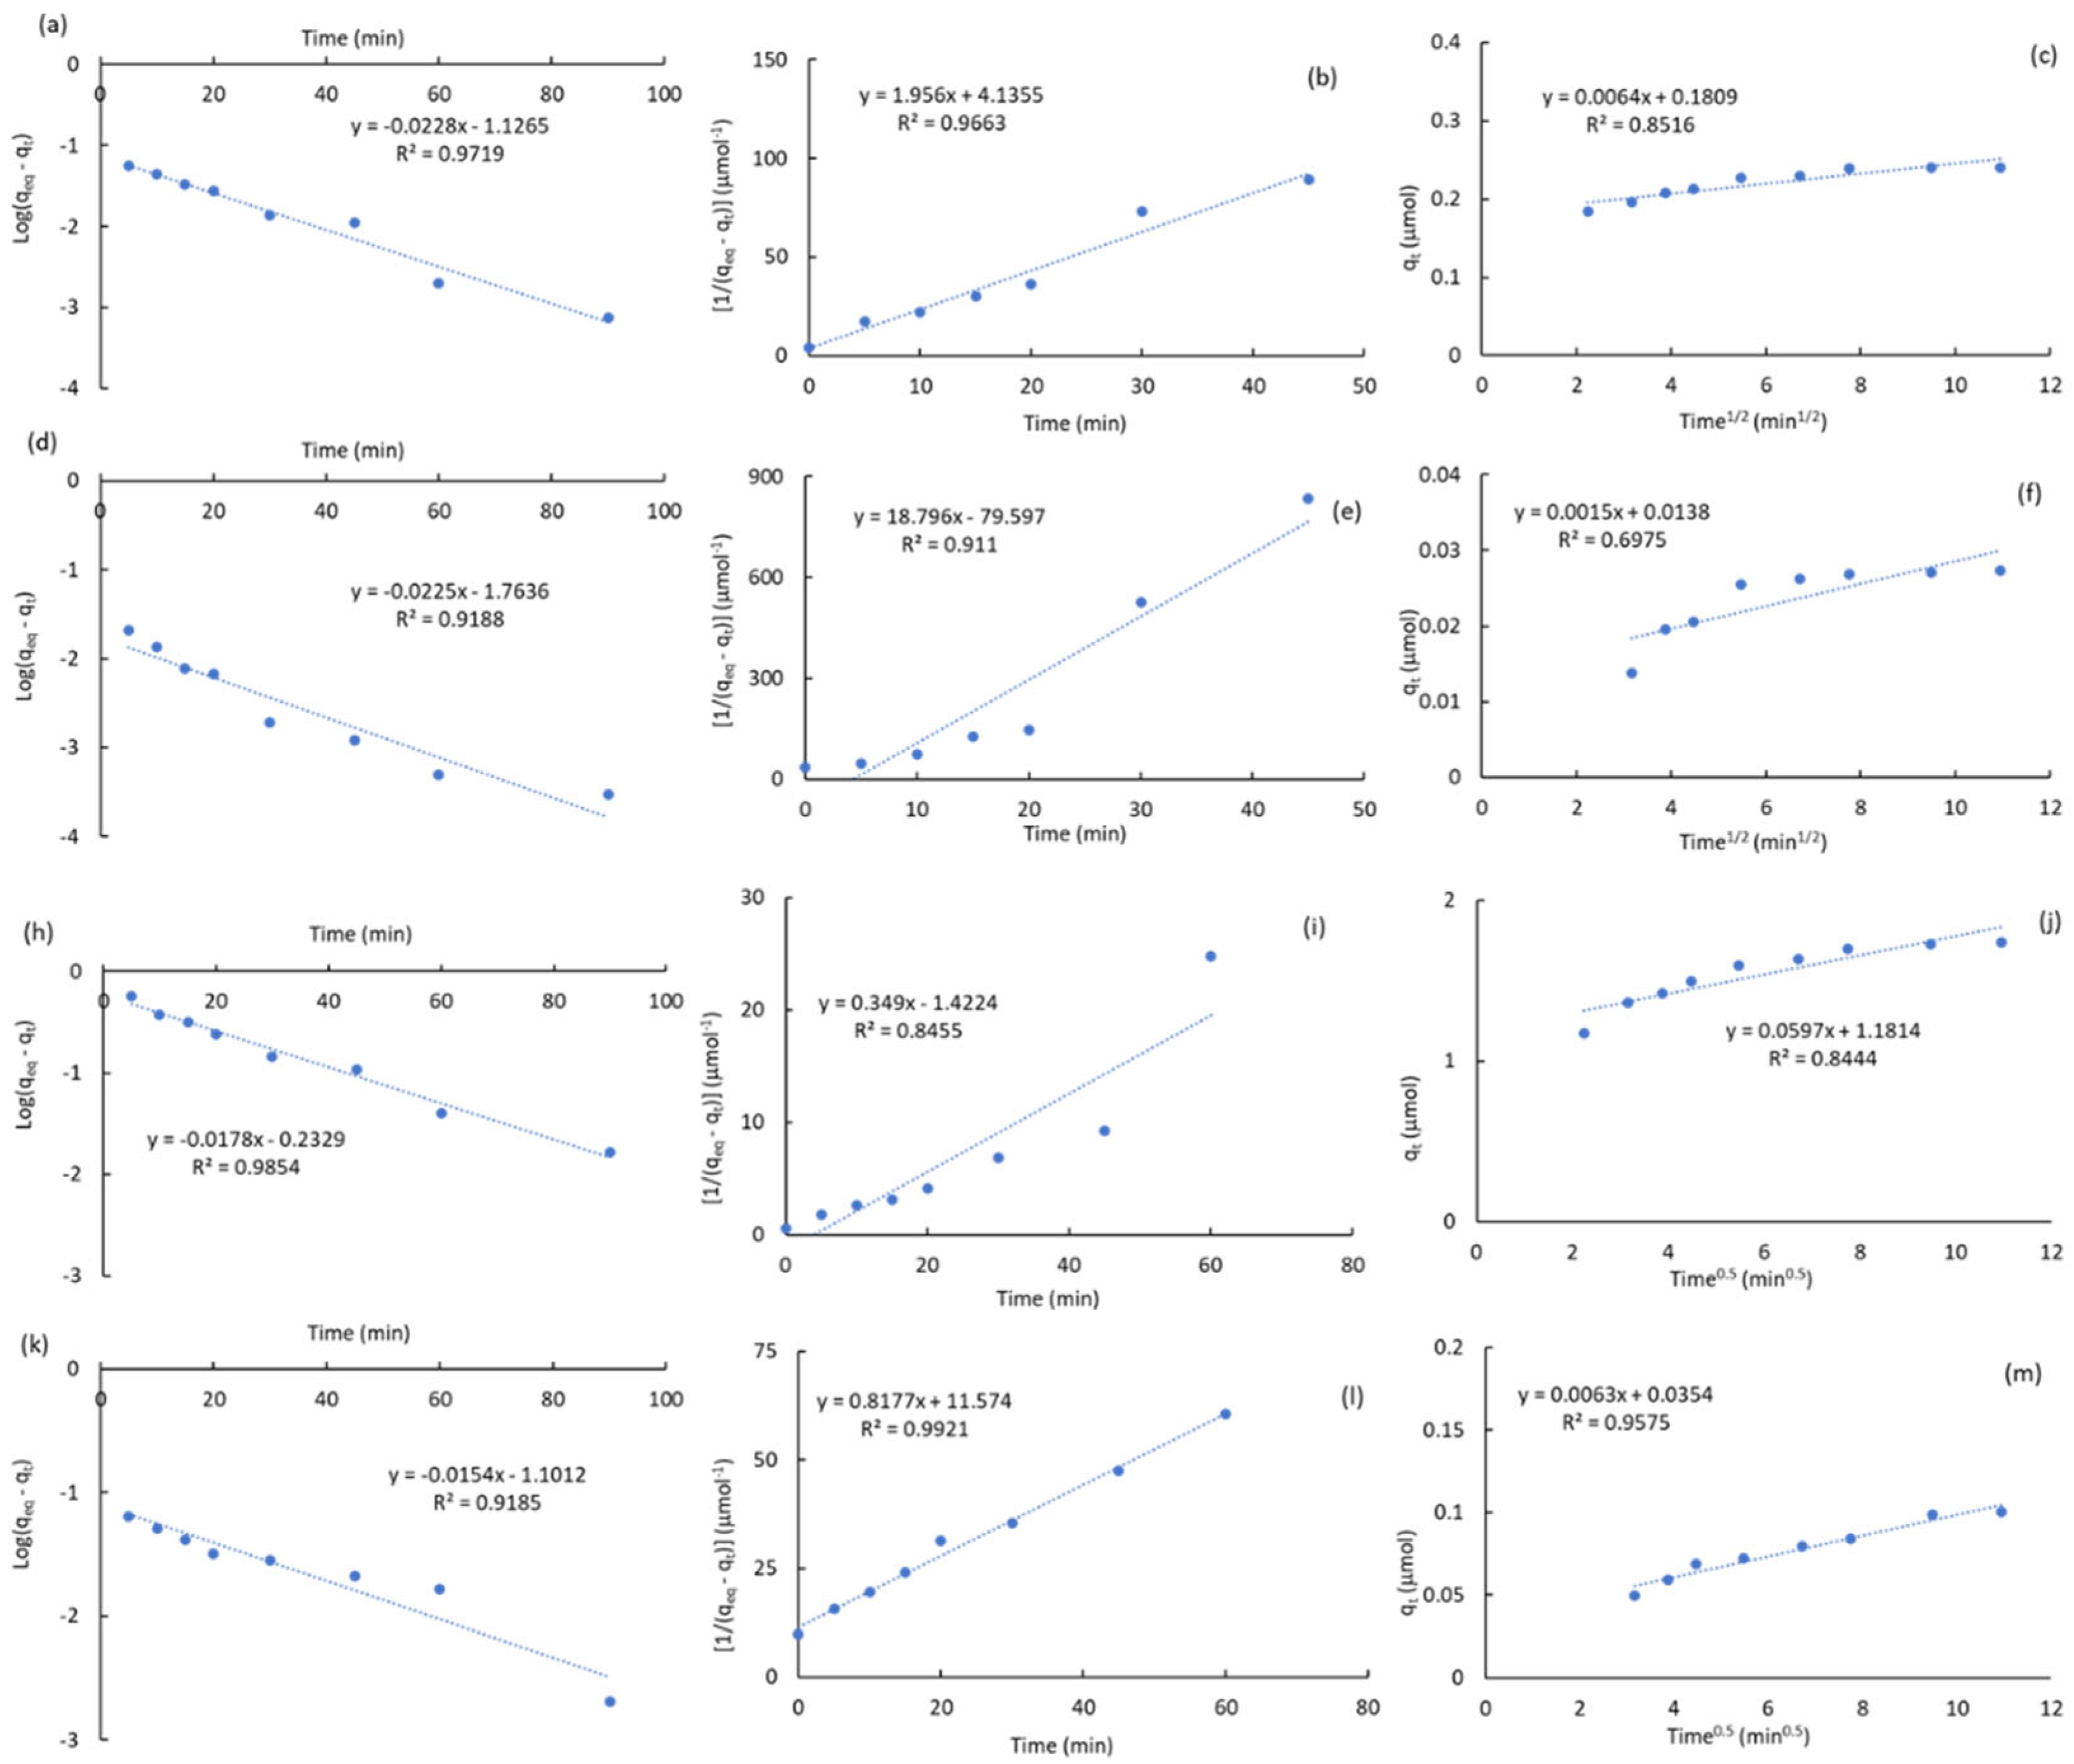
| ACPC | 0.5 | 0.241 | 0.053 | 0.972 | 1.956 | 0.966 | 0.006 | 0.181 | 0.852 |
| 1 | 0.503 | 0.028 | 0.996 | 0.394 | 0.950 | 0.020 | 0.299 | 0.955 | |
| 2.5 | 1.064 | 0.028 | 0.965 | 0.227 | 0.949 | 0.039 | 0.675 | 0.879 | |
| 5 | 1.742 | 0.041 | 0.985 | 0.349 | 0.846 | 0.060 | 1.181 | 0.844 | |
| MPB-CO2 | 0.5 | 0.241 | 0.033 | 0.977 | 0.378 | 0.944 | 0.022 | 0.023 | 0.931 |
| 1 | 0.391 | 0.019 | 0.987 | 0.133 | 0.983 | 0.030 | 0.063 | 0.984 | |
| 2.5 | 0.459 | 0.024 | 0.996 | 0.185 | 0.971 | 0.035 | 0.099 | 0.977 | |
| 5 | 0.658 | 0.026 | 0.980 | 0.124 | 0.980 | 0.046 | 0.189 | 0.963 | |
| MPB-P50 | 0.5 | 0.027 | 0.052 | 0.919 | 18.796 | 0.911 | 0.002 | 0.014 | 0.698 |
| 1 | 0.055 | 0.042 | 0.872 | 8.395 | 0.972 | 0.003 | 0.029 | 0.643 | |
| 2.5 | 0.069 | 0.023 | 0.900 | 2.684 | 0.993 | 0.003 | 0.041 | 0.875 | |
| 5 | 0.101 | 0.035 | 0.919 | 0.818 | 0.992 | 0.006 | 0.035 | 0.958 |
2.3.2. Adsorption Isotherms of Atrazine
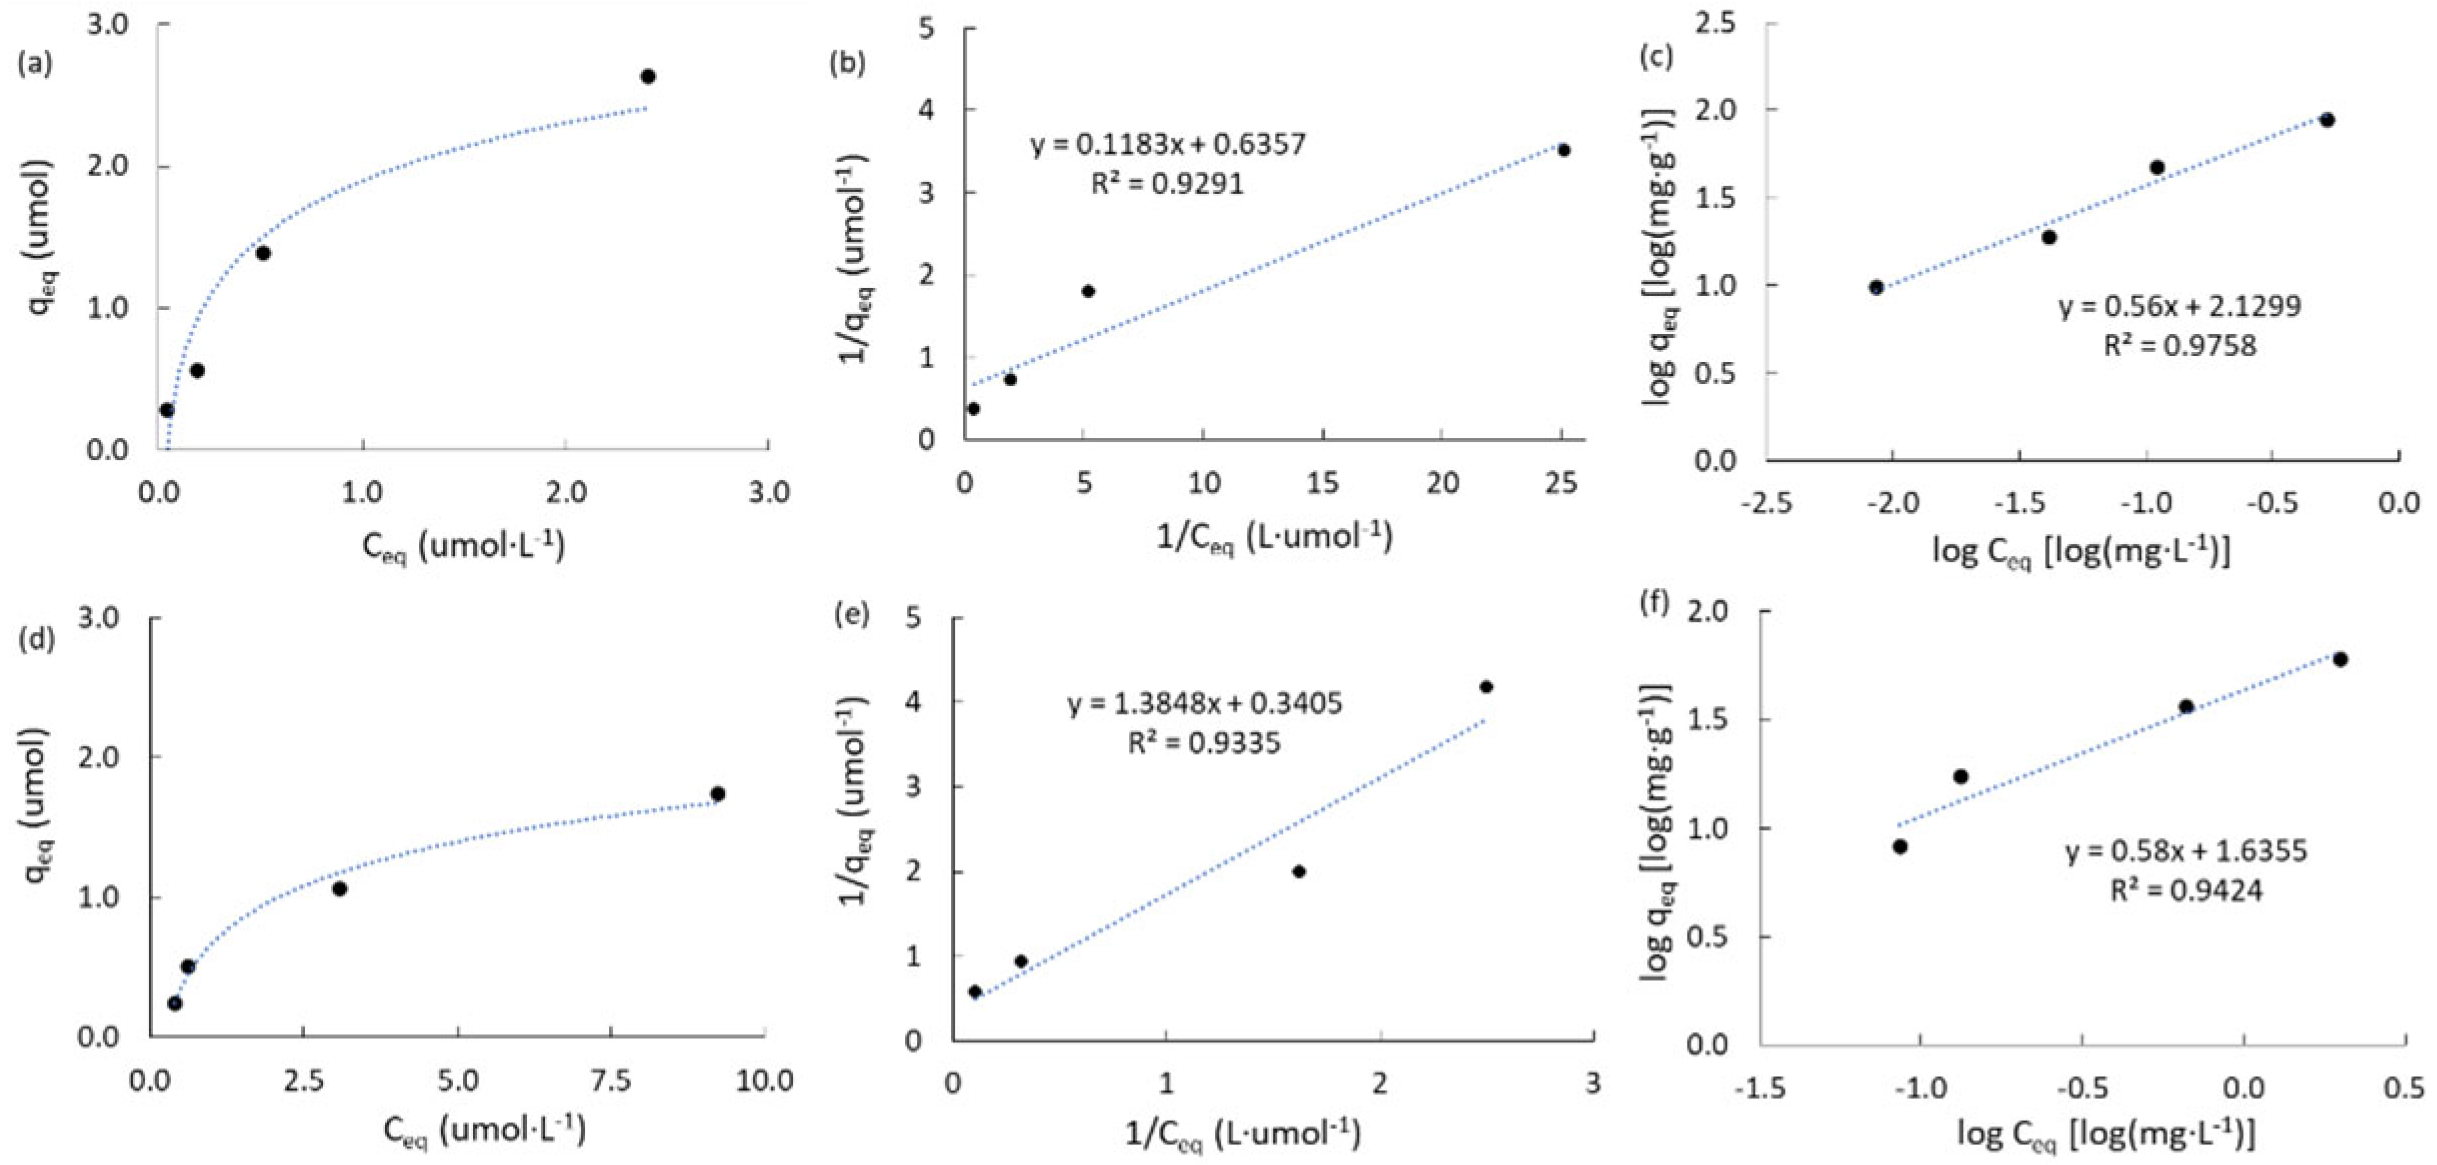
|
Carbon |
qT (μmol) a |
KL (L·μmol-1) b |
R2L c | KF d (mg·g-1) |
nF e | R2F f |
| ACM | 1.573 | 5.374 | 0.929 | 134.9 | 1.79 | 0.976 |
| ACPC | 2.937 | 0.246 | 0.934 | 43.2 | 1.72 | 0.942 |
| MPB-CO2 | 0.565 | 1.574 | 0.952 | 15.3 | 4.12 | 0.923 |
| MPB-P50 | 0.139 | 0.120 | 0.964 | 1.59 | 1.99 | 0.921 |
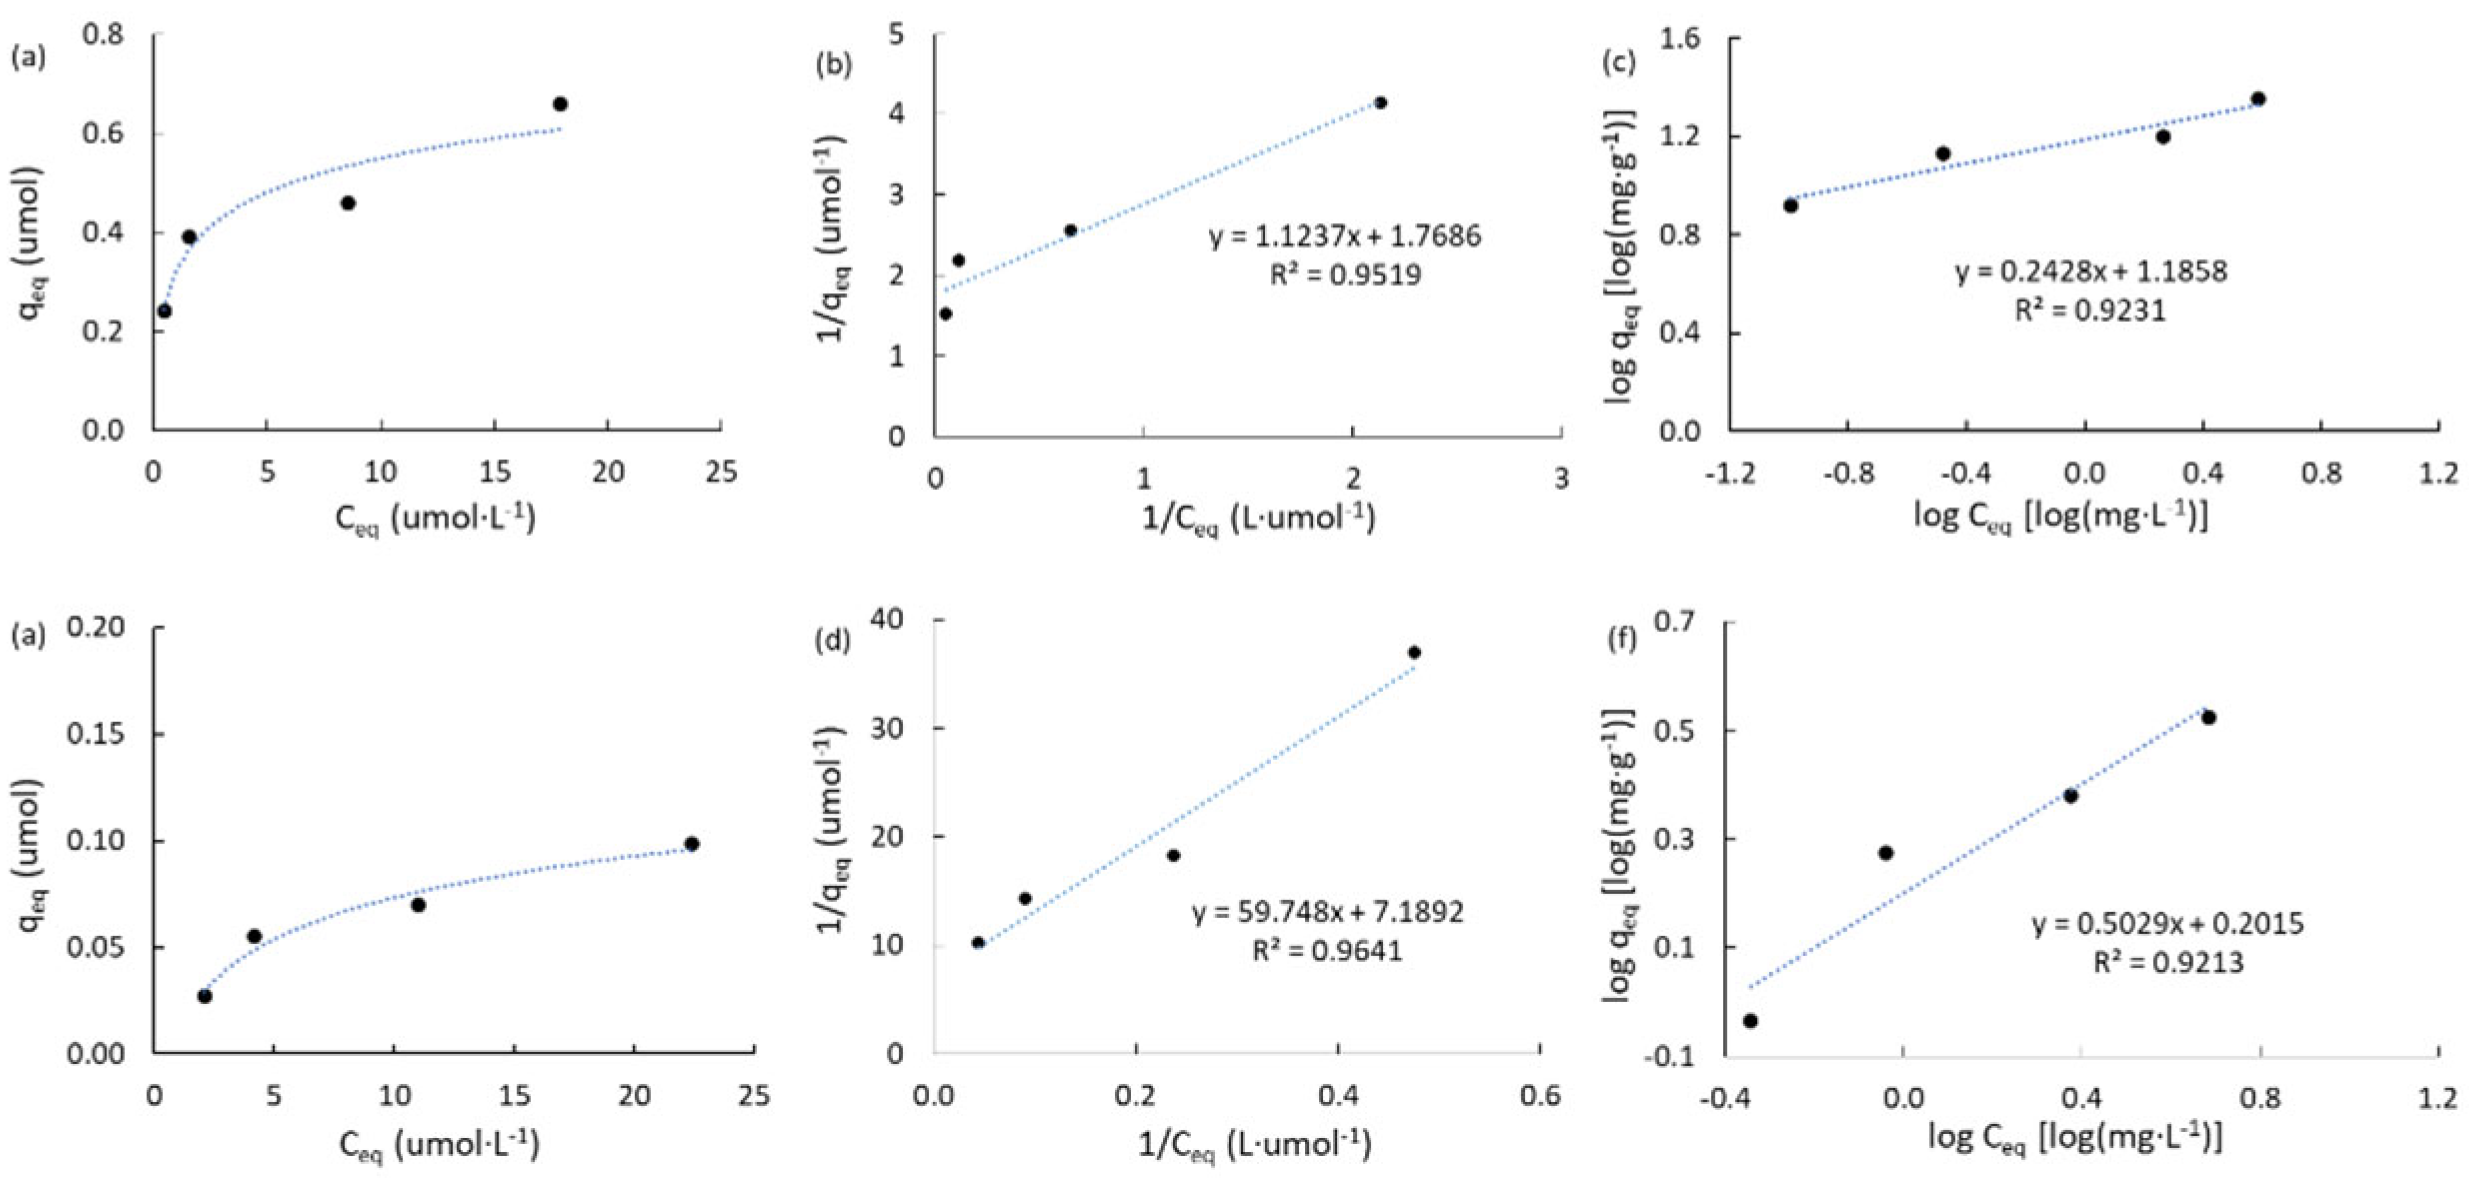
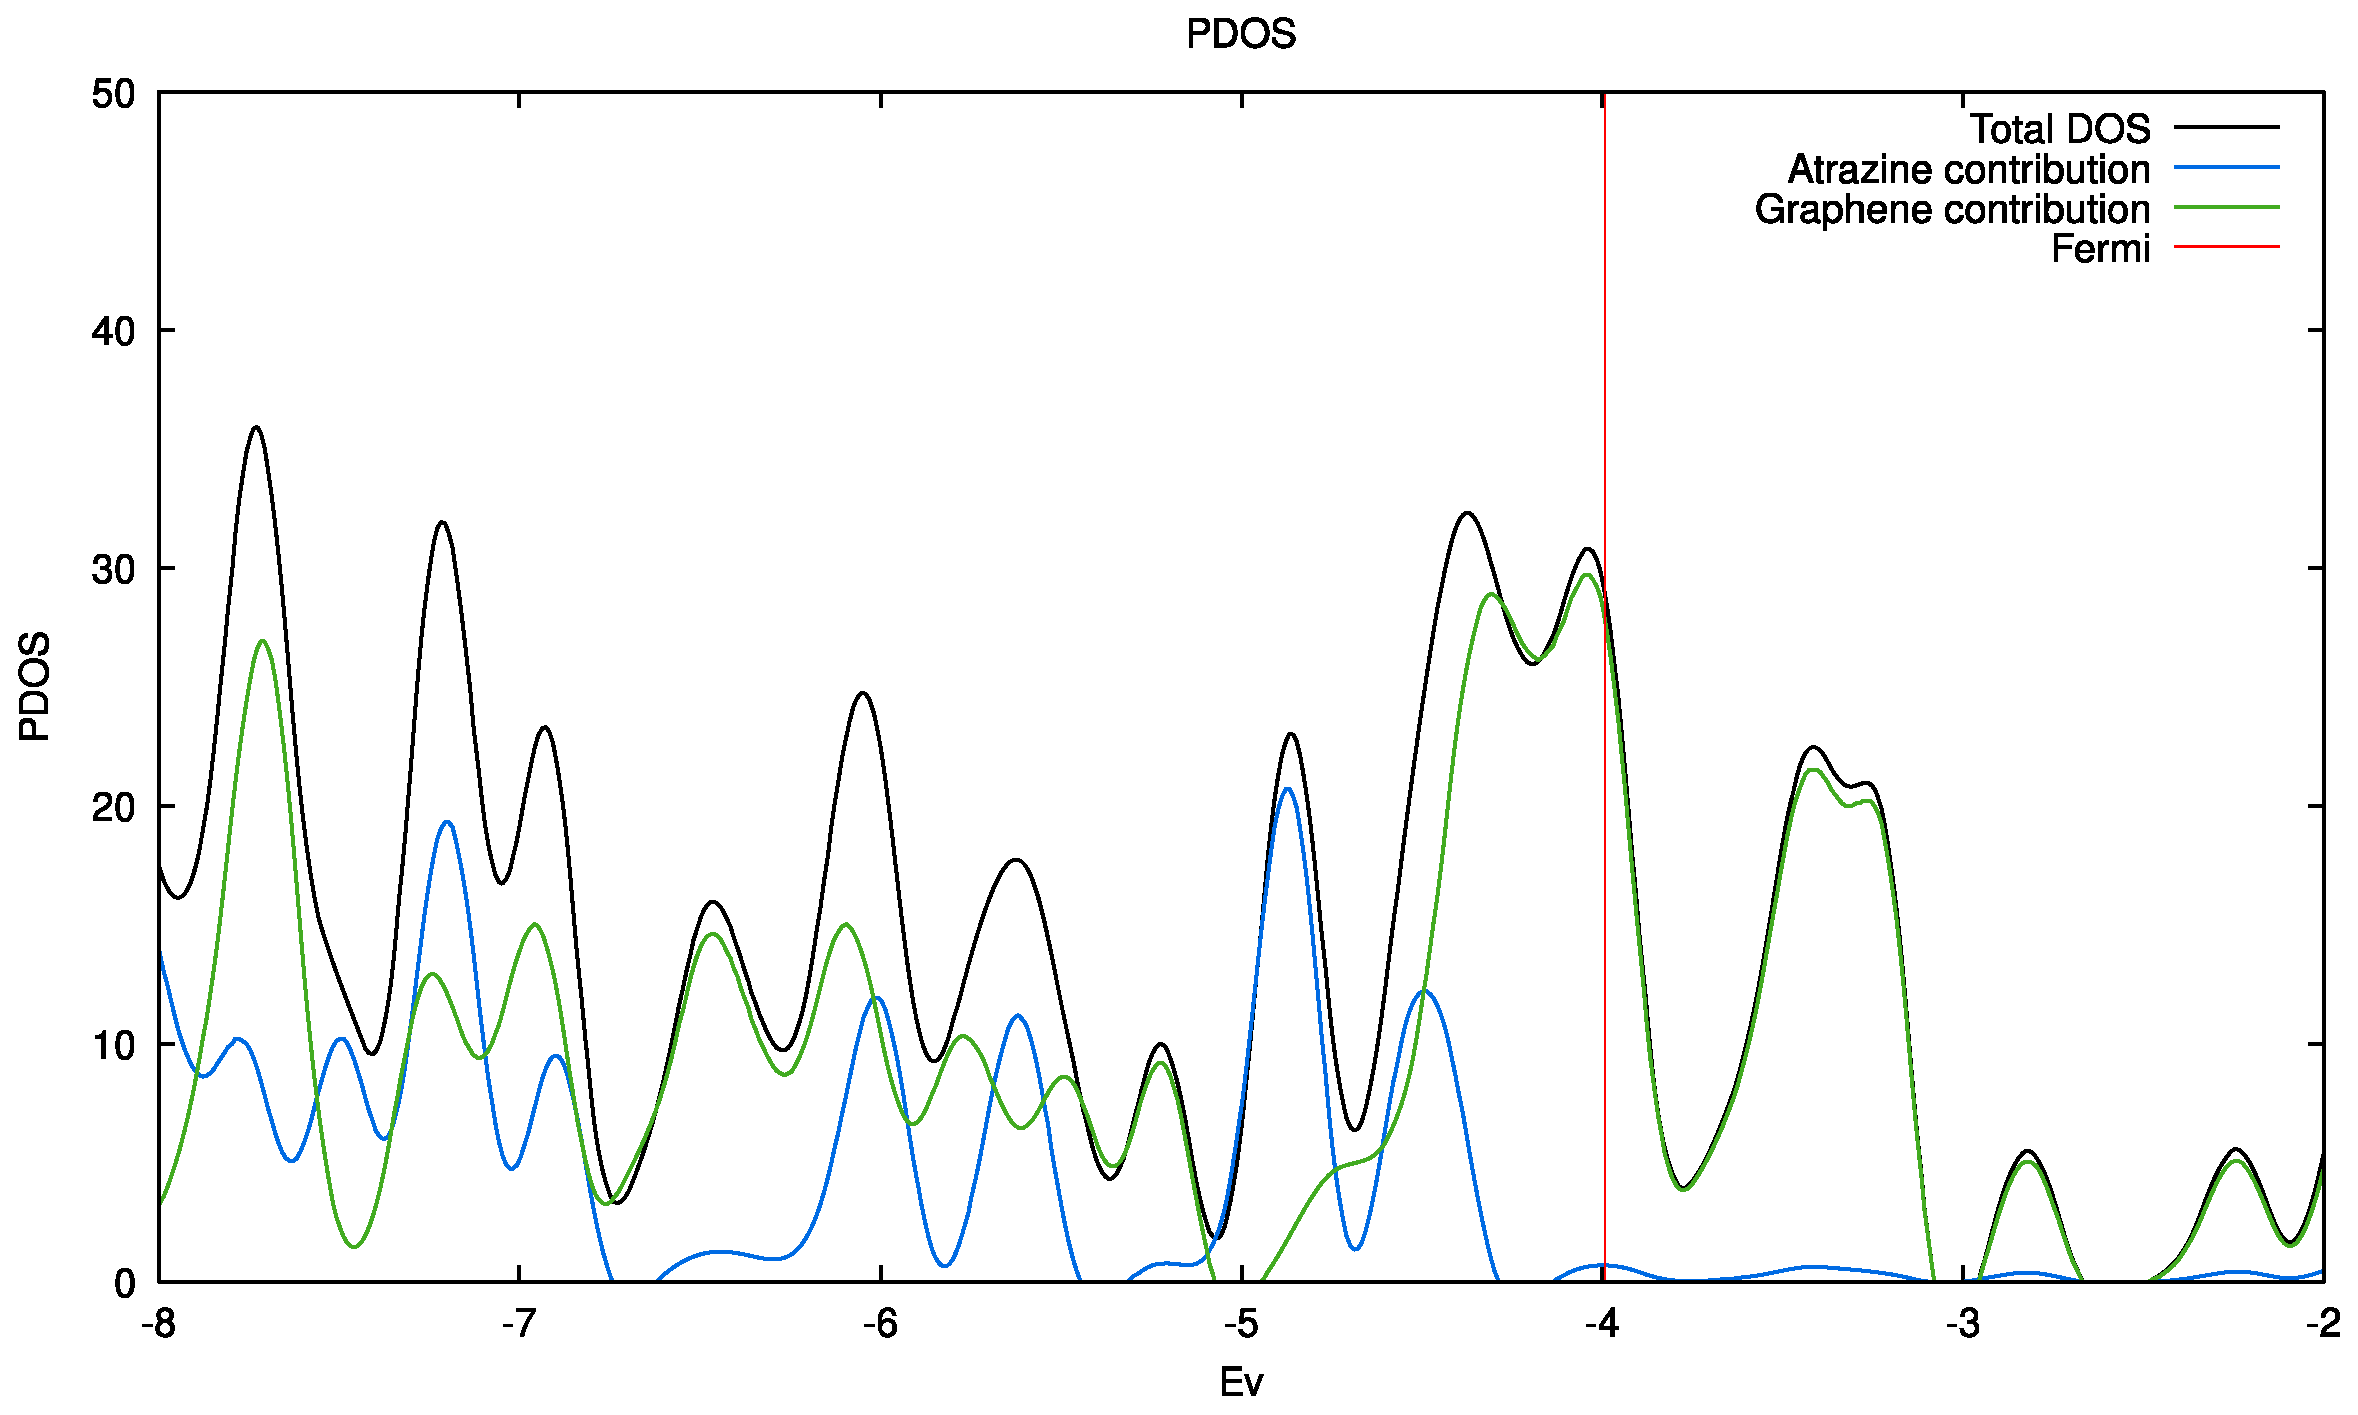
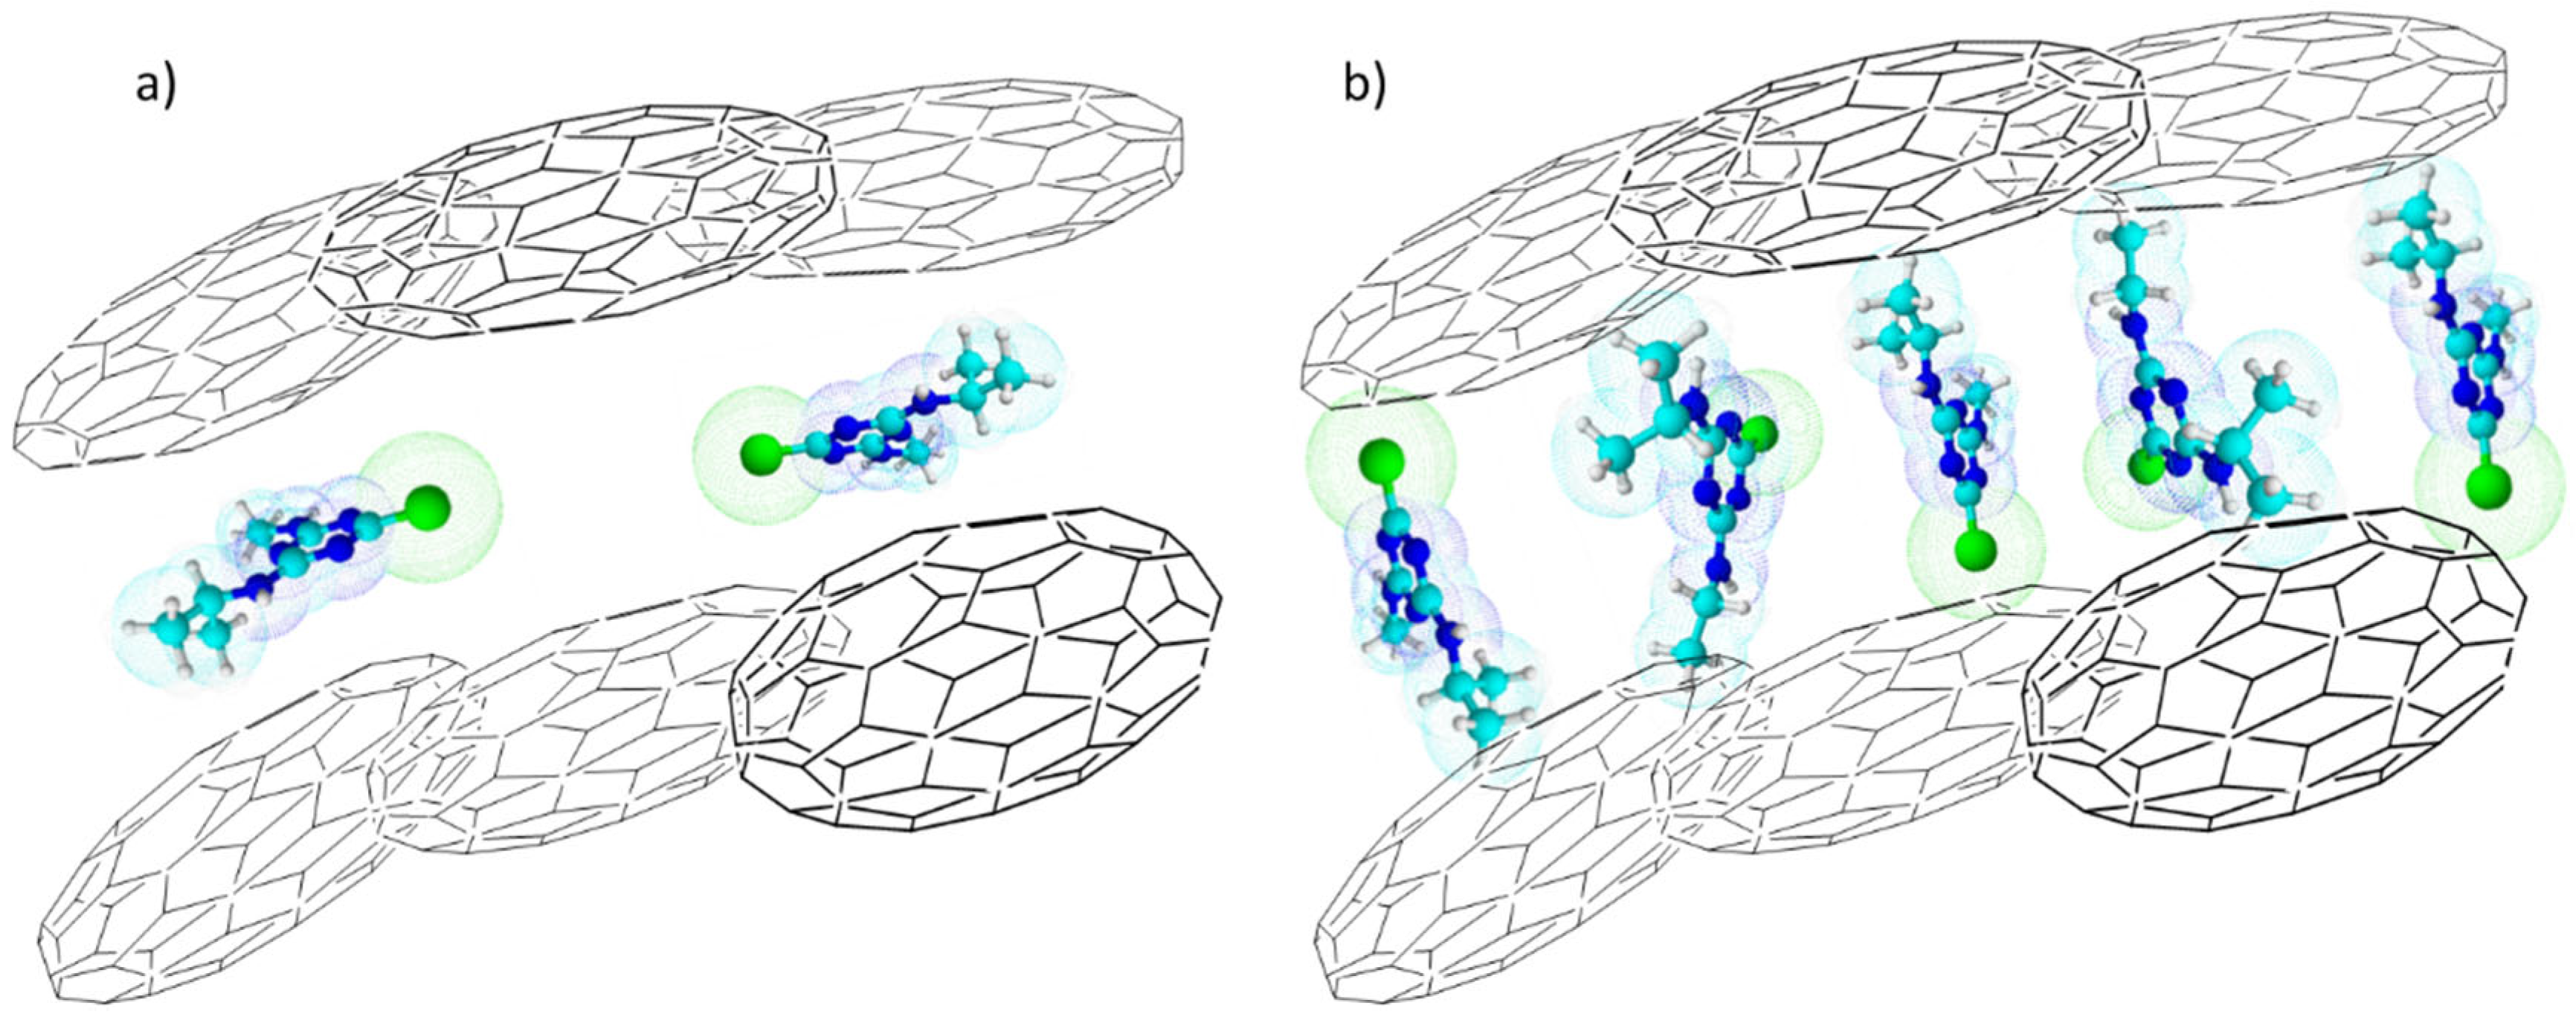
2.4. General Discussion and Theoretical Estimations
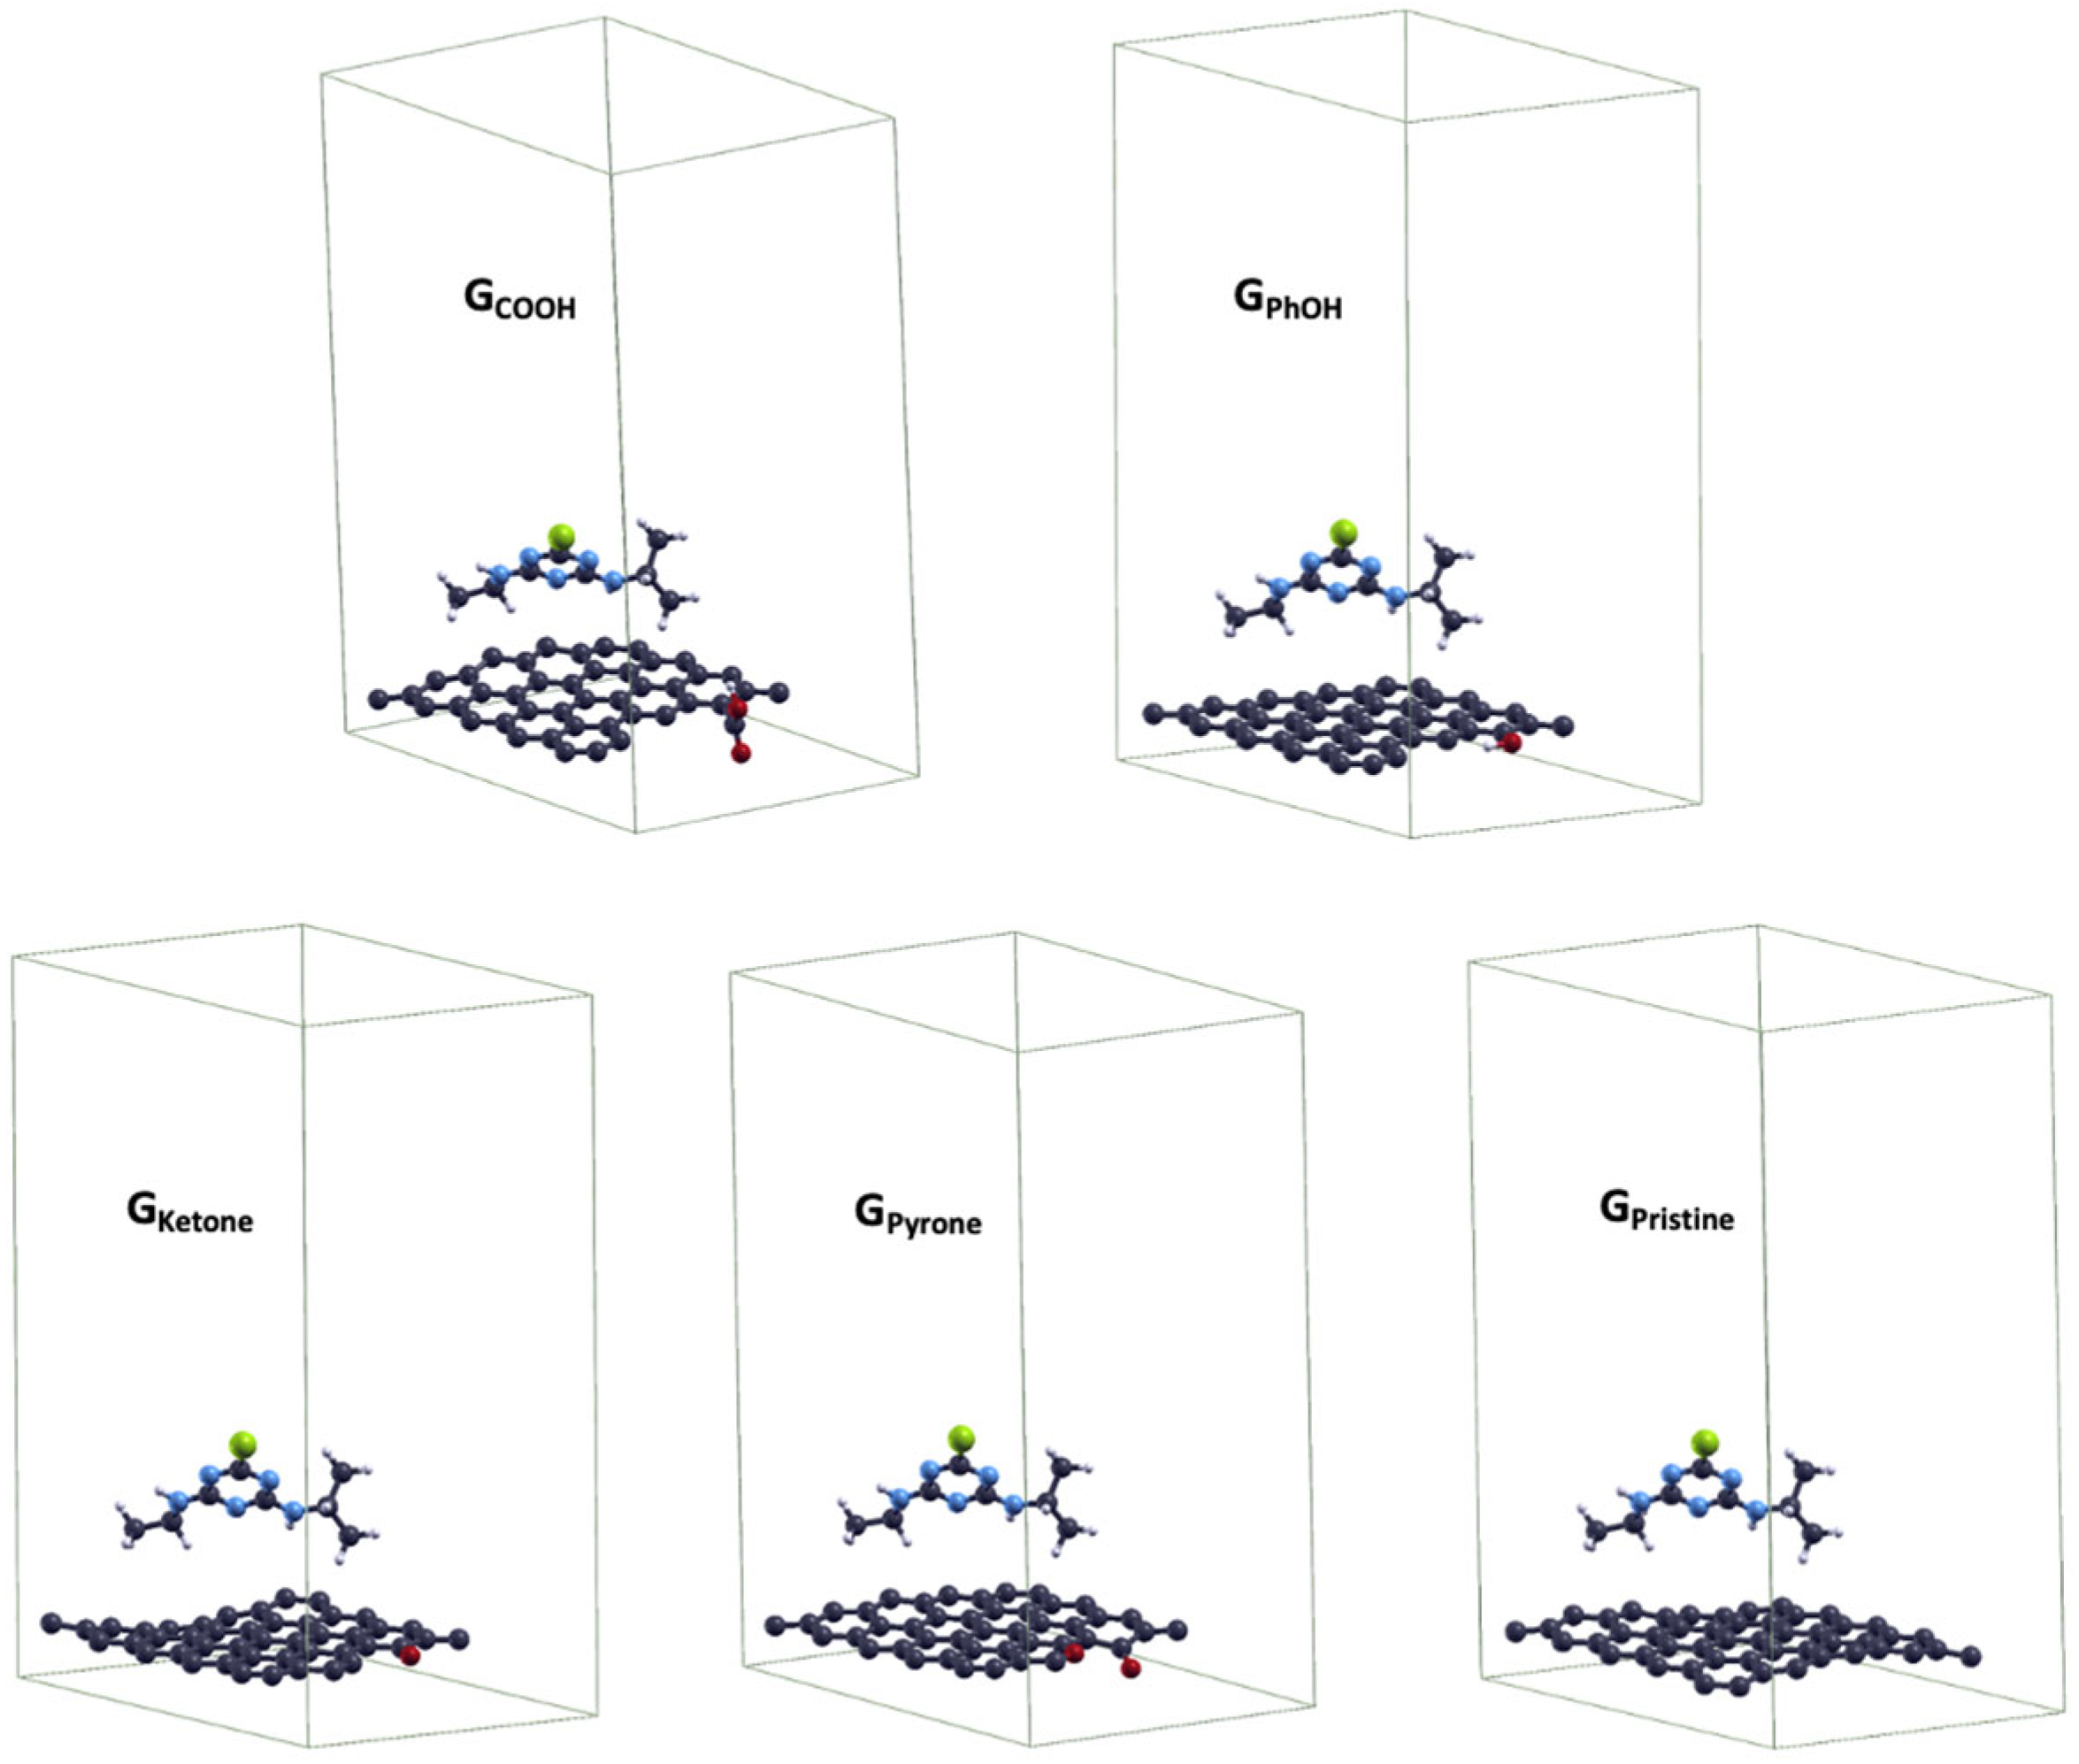
| System | GPhOH | GCOOH | GKetone | GPyrone | GPristine |
|---|---|---|---|---|---|
| Eads-ATZ (eV) | -0.024 | -0.048 | -0.063 | -0.099 | -0.169 |
| µ (D) | 1.103 | 3.290 | 1.917 | 1.791 | 0.001 |
3. Experimental
3.1. Synthesis of Nanoporous Biochars
3.2. Characterization
3.3. Kinetics and Equilibrium Studies of the Atrazine Adsorption
3.4. Theoretical Estimations
4. Conclusions
Supplementary Materials
Author Contributions
Funding
Ethical Approval
Institutional Review Board Statement
Informed Consent Statement
Data Availability Statement
Sample Availability
Conflicts of Interest
References
- D.D. Ratnayaka, M.J. Brandt, K.M. Johnson. Specialized and advanced water treatment processes. In D. Ratnayaka, M. J. Brandt, & K. M. Johnson. (Eds.), Water Supply. Elsevier (2009) 6th Ed., pp. 365–423.
- J.C. Crittenden, R.R. Trussell, D.W. Hand, K.J. Howe, G. Tchobanoglous. Granular filtration. In MWH’s Water Treatment: Principles and Design Wiley & Sons, Inc (2012) pp. 727–818.
- S. Sauvé, M. Desrosiers, A review of what is an emerging contaminant. Chemistry Central Journal 8 (2014) 1-7. [CrossRef]
- T.A. Ternes, M. Meisenheimer, D. McDowell, F. Sacher, H.-J. Brauch, B. Haistgulde, N. Zulei-Seibert, Removal of pharmaceuticals during drinking water treatment. Environmental Science & Technology 36 (2002) 3855–3863. [CrossRef]
- G.A. Loraine, M.E. Pettigrove, Seasonal variations in concentrations of pharmaceuticals and personal care products in drinking water and reclaimed wastewater in southern California. Environmental Science & Technology 40 (2006) 687–695. [CrossRef]
- J. Gibs, P.E. Stackelberg, E.T. Furlong, M. Meyer, S.D. Zaugg, R.L. Lippincott, Persistence of pharmaceuticals and other organic compounds in chlorinated drinking water as a function of time. Science of The Total Environment 373 (2007) 240–249. [CrossRef]
- P.E. Stackelberg, J. Gibs, E.T. Furlong, M. Meyer, S.D. Zaugg, R. Lippincott (2007). Efficiency of conventional drinking-water-treatment processes in removal of pharmaceuticals and other organic compounds. Science of The Total Environment 377 (2007) 255–272. [CrossRef]
- M. Syafrudin, R.A. Kristanti, A. Yuniarto, T. Hadibarata, J. Rhee, W.A. Al-Onazi, T.S. Algarni, A.H. Almarri, A.M. Al-Mohaimeed, Pesticides in drinking water—A review. Int. J. Environ. Res. Public Health 18 (2021) 468. [CrossRef]
- I. Buchanan, H.C. Liang, W. Khan, Z. Liu, R. Singh, K. Ikehata, P. Chelme-Ayala. Pesticides and Herbicides Water Environment Research 81 (2009) 1731-1815.
- Agency for Toxic Substances and Disease Registry (ATSDR). ATRAZINE, CAS # 1912-24-9, September 2003.
- United States Environmental Protection Agency (USEPA), Washington, D.C., 2003. https://www3.epa.gov/pesticides/chem_search/reg_actions/reregistration/ired_PC-080803_1-Jan-03.pdf.
- T.K. James, H. Ghanizadeh, K.C. Harrington, N.S. Bolan, Degradation of atrazine and bromacil in two forestry waste products. Sci. Rep. 11 (2021) 3284. [CrossRef]
- M. Graymore, F. Stagnitti, G. Allinson, Impacts of atrazine in aquatic ecosystems. Environment International 26 (2001) 483–495.
- A. Mudhoo, V.K. Garg, Sorption, Transport and transformation of atrazine in soils, minerals and composts: A review. Pedosphere 21 (2011) 11–25. [CrossRef]
- K. Nödler, T. Licha, D. Voutsa, Twenty years later – Atrazine concentrations in selected coastal waters of the Mediterranean and the Baltic Sea. Marine Pollution Bulletin 70 (2013) 112–118. [CrossRef]
- S. Singh, V. Kumar, A. Chauhan, S. Datta, A.B. Wani, N. Singh, J. Singh, Toxicity, degradation and analysis of the herbicide atrazine. Environ. Chem. Lett. 16 (2018) 211–237. [CrossRef]
- L. Spanò, C.R. Tyler C.R, R. van Aerle, P. Devos, S.N. Mandiki, F. Silvestre, J.P. Thomé, P. Kestemont. Effects of atrazine on sex steroid dynamics, plasma vitellogenin concentration and gonad development in adult goldfish (Carassius auratus). Aquat. Toxicol. 66 (2004) 369-379. [CrossRef]
- T.B. Hayes, A. Collins, M. Lee, M. Mendoza, N. Noriega, A. Stuart, A. Vonk, Hermaphroditic, demasculinized frogs after exposure to the herbicide atrazine at low ecologically relevant doses. PNAS 99 (2002) 5476-5480. [CrossRef]
- F.P. Albuquerque, J.L. de Oliveira, V. Moschini-Carlos, L.F. Fraceto, An overview of the potential impacts of atrazine in aquatic environments: perspectives for tailored solutions based on nanotechnology, Science of the Total Environment 700 (2019) 134868.
- W. Fan, T. Yanase, H. Morinaga, S. Gondo, T. Okabe, M. Nomura, T. Komatsu, K. Morohashi, T.B. Hayes, R. Takayanagi, H. Nawata, Atrazine-induced aromatase expression is SF-1 dependent: implications for endocrine disruption in wildlife and reproductive cancers in humans. Environ Health Perspect. 115 (2017) 720. [CrossRef]
- J.L. Rinsky, C. Hopenhayn, V. Golla, S. Browning, H. Bush, Atrazine exposure in public drinking water and preterm birth. Public Health Reports 127 (2012), 72–80. [CrossRef]
- K.S. Almberg, M.E. Turyk, R.M. Jones, K. Rankin, S. Freels, L.T. Stayner, Atrazine contamination of drinking water and adverse birth outcomes in community water systems with elevated atrazine in Ohio, 2006–2008. Int. J. Environ. Res. Public Health 15 (2018) 1889. [CrossRef]
- V. Galbiati, E. Buoso, B. d’Emmanuele di Villa Bianca, R.D. Paola, F. Morroni, G. Nocentini, M. Racchi, B. Viviani, E. Corsini, Immune and nervous systems interaction in endocrine disruptors toxicity: The case of atrazine. Front. Toxicol. 3 (2021) 649024. [CrossRef]
- Commission decision concerning the non-inclusion of atrazine in Annex I to Council Directive 91/414/EEC and the withdrawal of authorizations for plant protection products containing this active substance. Official J. European Union (2004) 3. https://eur-lex.europa.eu/legal-content/EN/TXT/PDF/?uri=CELEX:52020SC0087&rid=1.
- Directive 2000/60/EC of the European Parliament and of the Council of 23 October 2000 establishing a framework for Community action in the field of water policy. Official Journal of the European Communities (2000) 72. https://www.eea.europa.eu/policy-documents/directive-2000-60-ec-of.
- PAN International. The Consolidated List of Banned Pesticides, 6th Edition, May 2022 Pesticide Action Network International, Penang (2022). https://pan-international.org/pan-international-consolidated-list-of-banned-pesticides/.
- World Health Organization (WHO). 2011. Guidelines for Drinking Water Quality. http://whqlibdoc.who.int/publications/2011/9789241548151_eng.pdf.
- C.M. Villanueva, G. Durand, M.B. Coutté, C. Chevrier, S. Cordier, Atrazine in municipal drinking water and risk of low birth weight, preterm delivery, and small-for-gestational-age status. Occupational and environmental medicine, 62 (2005) 400-405. [CrossRef]
- A. Hildebrandt, M. Guillamon, S. Lacorte, R. Tauler, D. Barcelo, Impact of pesticides used in agriculture and vineyards to surface and groundwater quality (NorthSpain). Water Res., 42 (2008) 3315-3326.
- T. Bohn, E. Cocco, L. Gourdol, C. Guignard, L. Hoffmann, Determination of atrazine and degradation products in Luxembourgish drinking water: origin and fate of potential endocrine disrupting pesticides. Food Additives & Contaminants 28 (2011) 1041-1054. [CrossRef]
- A.I. Gómez-Gutiérrez, E. Jover, L. Bodineau, J. Albaigés, J.M. Bayona, Organic contaminant loads into the Western Mediterranean Sea: Estimate of Ebro river inputs. Chemosphere 65 (2006) 224-236. [CrossRef]
- R. Carafa, J. Wollgast, E. Canuti, J. Ligthart, S. Dueri, G. Hanke, S.J. Eisenreich, P. Viaroli, J.M. Zaldívar, Seasonal variations of selected herbicides and related metabolites in water, sediment, seaweed and clams in the Sacca di Goro coastal lagoon (Northern Adriatic). Chemosphere 69 (2007) 1625-1637. [CrossRef]
- Ministerio de Ambiente, Vivienda y Desarrollo Territorial. Resolución 2115 (2017). https://www.minsalud.gov.co/sites/rid/Lists/BibliotecaDigital/RIDE/DE/DIJ/Resoluci%C3%B3n_2115_de_2007.pdf.
- United Nations Environment Program (UNEP), Central America, and the Caribbean Regional Report. Regionally based assessment of persistent toxic substances. (2002). http://www.oas.org/dsd/Quimicos/Central%20America%20Caribbean%20Report%20UNEP.pdf.
- A. Hernandez-Antonio. Modelo conceptual de contaminación de aguas superficiales por uso de atrazina en zonas agrícolas. PhD Thesis. Universidad Nacional Autónoma de México, Morelos, México (2013). https://repositorio.unam.mx/contenidos/modelo-conceptual-de-contaminacion-de-aguas-superficiales-por-uso-de-atrazina-en-zonas-agricolas-74101?c=r1gbgE&d=false&q=*:*&i=2&v=1&t=search_0&as=0.
- M.P. Ormad, N. Miguel, A. Claver, J.M. Matesanz, J.L. Ovelleiro, Pesticides removal in the process of drinking water production. Chemosphere 71 (2008), 97–106. [CrossRef]
- K. Ignatowicz, Selection of sorbent for removing pesticides during water treatment. Journal of Hazardous Materials 169 (2009) 953–957. [CrossRef]
- Y. Chen, B. Huang, M. Huang, B. Cai, On the preparation and characterization of activated carbon from mangosteen shell, J. Taiwan Inst. Chem. Eng. 42 (2011) 837–842. [CrossRef]
- M.I. Yusufu, C.C. Ariahu, B.D. Igbabul, Production and characterization of activated carbon from selected local raw materials Afr. J. Pure Appl. Chem. 6 (2012) 123–131.
- V.K. Gupta, I. Ali, Water treatment for organic pollutants by adsorption technology. In V. K. Gupta & I. Ali (Eds.), Environmental Water: Advances in Treatment, Remediation and Recycling. Elsevier (2013) 29–91.
- M.A. Yahya, Z. Al-Qodah, C.W.Z. Ngah, Agricultural bio-waste materials as potential sustainable precursors used for activated carbon production: A review. Renewable and Sustainable Energy Reviews, 46 (2015) 218–235. [CrossRef]
- I. Lupul, J. Yperman, R. Carleer, G. Gryglewicz, Adsorption of atrazine on hemp stem-based activated carbons with different surface chemistry. Adsorption 21 (2015) 489–498. [CrossRef]
- Y. Li, X. Wang, M. Cao, Three-dimensional porous carbon frameworks derived from mangosteen peel waste as promising materials for CO2 capture and supercapacitors. J. CO2 Utilization 27 (2018) 204-216. [CrossRef]
- A. Dasgupta, J. Matos, H. Muramatsu, Y. Ono, V. González, H. Liu, C. Rotella, K. Fujizawa, R. Cruz-Silva, Y. Hashimoto, M. Endo, K. Kaneko, L. Radovic, M. Terrones. Nanostructured carbon materials for enhanced nitrobenzene adsorption: Physical vs. Chemical surface properties. Carbon 139 (2018) 833-844.
- C.P. Amézquita-Marroquín, P. Torres-Lozada, L. Giraldo, P.D. Húmpola, E. Rivero, P.S. Poon, J. Matos, J.C. Moreno-Piraján. Sustainable production of nanoporous carbons: Kinetics and equilibrium studies in the removal of atrazine. J. Coll. Inter. Science. 562 (2020) 252-267. [CrossRef]
- J. Rouquerol, P. Llewellyn, F. Rouquerol. Characterization of porous solids VII. Stud. Surf. Sci. Catal. 160 (2007) 49–56.
- M. Thommes, K.A. Cychosz. Physical adsorption characterization of nanoporous materials: progress and challenges. Adsorption 20 (2014) 233–250. [CrossRef]
- M.M. Dubinin. Description of adsorption equilibria of vapors on zeolites over wide ranges of temperature and pressure. Adv. Chem. Ser. 102 (1971) 69–85.
- J. Matos, J. Laine. Ethylene Conversion on Activated Carbon Supported NiMo Catalysts: Effect of the Support. Applied Catalysis A: General, 241, 1-2 (2003) 25-38. [CrossRef]
- J. Matos, M. Labady, A. Albornoz, J. Laine, J.L. Brito. Topological organization and textural changes of carbon macro-networks submitted to activation with N2 and CO2. J. Mater. Science 39 (2004) 3705-3716. [CrossRef]
- J. Matos, M. Labady, A. Albornoz, J. Laine, J.L. Brito. Catalytic Effect of KOH on textural changes of carbon macronetworks by physical activation. J. Molec. Catal. A: Chemical 228 (2005) 189-194. [CrossRef]
- L.A. Alves, A.H. de Castro, F.G. de Mendonça, J.P. de Mesquita. Characterization of acid functional groups of carbon dots by nonlinear regression data fitting of potentiometric titration curves. Appl. Surf. Sci. 370 (2016) 486–495.
- J. Matos, J. Arcibar-Orozco, P.S. Poon, G. Pecchi, J.R. Rangel-Mendez. Influence of phosphorous upon the formation of DMPO-•OH and POBN-O2•¯ spin-trapping adducts in carbon-supported P-promoted Fe-based photocatalysts. J. Photochem. Photobiol. A: Chem. 391 (2020) 112362. [CrossRef]
- F.-C. Wu, R.-L. Tseng, R.-S. Juang, Initial behavior of intraparticle diffusion model used in the description of adsorption kinetics, Chem. Eng. J. 153 (2009) 1-8. [CrossRef]
- G. McKay, M.S. Otterburn, A.G. Sweeney, The removal of color from effluent using various adsorbents—III. Silica: Rate processes, Water Res. 14 (1980) 15-20.
- Y.S. Ho, G. McKay, A Comparison of Chemisorption Kinetic Models Applied to Pollutant Removal on Various Sorbents, Process Saf. Environ. Prot. 76 (1998) 332-340. [CrossRef]
- F.-C. Wu, R.-L. Tseng, R.-S. Juang, Kinetic modeling of liquid-phase adsorption of reactive dyes and metal ions on chitosan, Water Res. 35 (2001) 613-618. [CrossRef]
- S. Lagergren. Zur theorie der sogenannten adsorption geloster stoffe, K. Sven. Vetenskapsakademiens. Handl. 24 (1898) 1–39.
- Y. Ho, G. McKay. Pseudo-second order model for sorption processes. Process Biochem. 34 (1999) 451–465. [CrossRef]
- G. Tan, W. Sun, Y. Xu, H. Wang, N. Xu. Sorption of mercury (II) and atrazine by biochar, modified biochars and biochar based activated carbon in aqueous solution. Bioresour. Technol. 211 (2016) 727–735. [CrossRef]
- R. Leyva-Ramos, R. Ocampo-Perez, J. Mendoza-Barrón. External mass transfer and hindered diffusion of organic compounds in the adsorption on activated carbon cloth. Chem. Eng. J. 183 (2012) 141-151. [CrossRef]
- I. Langmuir. The constitution and fundamental properties of solids and liquids. Part I. Solids. J. Am. Chem. Soc. 38 (1916) 2221–2295. [CrossRef]
- H. Freundlich, Über die adsorption in Lösungen, Zeitschrift für Physikalische Chemie – Stöchiometrie und Verwandschaftslehre 57 (1907) 385–470.
- G. Tan, W. Sun, Y. Xu, H. Wang, N. Xu. Sorption of mercury (II) and atrazine by biochar, modified biochars and biochar based activated carbon in aqueous solution. Bioresource Technol. 211 (2016) 727–735. [CrossRef]
- I. Lupul, J. Yperman, R. Carleer, G. Gryglewicz. Adsorption of atrazine on hemp stem-based activated carbons with different surface chemistry. Adsorption 21 (2015) 489–498. [CrossRef]
- J. Matos, V. Fierro, R. Montaña, E. Rivero, A. Martínez de Yuso, W. Zhao, A. Celzard. High surface area microporous carbons as photoreactors for the catalytic photodegradation of methylene blue under UV-vis irradiation. Appl. Catal. A: Gen. 517 (2016) 1-11.
- J. Matos, J. Ocares-Riquelme, P.S. Poon, R. Montaña, X. García, K. Campos, J.C. Hernández-Garrido, M.M. Titirici. C-doped anatase TiO2: Adsorption kinetics and photocatalytic degradation of methylene blue and phenol, and correlations with DFT estimations. J. Colloid Inter. Science 547 (2019) 14-29.
- M.D. Borisover, E.R. Graber, Comment on competitive sorption between atrazine and other organic compounds in soils and model sorbents. Environ. Sci. Technol. 31 (1997) 1577. [CrossRef]
- J.P. Perdew, K. Burke, M. Ernzerhof, Generalized gradient approximation made simple. Physical Review Letters 78 (1997) 1396. [CrossRef]
- Wang, W.; Zhang, Y.; Shen, C.; Chai, Y., Adsorption of CO molecules on doped graphene: A first-principles study. AIP Advances 2016, 6 (2), 025317. [CrossRef]
- Bagri, A.; Grantab, R.; Medhekar, N. V.; Shenoy, V. B., Stability and Formation Mechanisms of Carbonyl- and Hydroxyl-Decorated Holes in Graphene Oxide. The Journal of Physical Chemistry C 2010, 114 (28), 12053-12061. [CrossRef]
- H.P. Boehm, Surface oxides on carbon and their analysis: a critical assessment. Carbon 40 (2002) 145–149. [CrossRef]
- M.C. Fernández de Cordoba, J. Matos, R. Montaña, P.S. Poon, S. Lanfredi, F.R. Praxedes, J.C. Hernández-Garrido, J.J. Calvino, E. Rodríguez-Aguado, E. Rodríguez-Castellón, C.O. Ania. Sunlight photoactivity of rice husks-derived biogenic silica. Catalysis Today 328 (2019) 125-135.
- P. Giannozzi, S. Baroni, N. Bonini, M. Calandra, R. Car, C. Cavazzoni, D. Ceresoli, G.L. Chiarotti, M. Cococcioni, I. Dabo, A. Dal Corso, S. de Gironcoli, S. Fabris, G. Fratesi, R. Gebauer, U. Gerstmann, C. Gougoussis, A. Kokalj, M. Lazzeri, L. Martin-Samos, N. Marzari, F. Mauri, R. Mazzarello, S. Paolini, A. Pasquarello, L. Paulatto, C. Sbraccia, S. Scandolo, G. Sclauzero, A.P. Seitsonen, A. Smogunov, P. Umari, R.M. Wentzcovitch, Quantum Espresso: a modular and open-source software project for quantum simulations of materials. J. Physics: Condensed Matter 21 (2009) 395502.
- http://pseudopotentials.quantum-espresso.org/legacy_tables/ps-library/o.
Disclaimer/Publisher’s Note: The statements, opinions and data contained in all publications are solely those of the individual author(s) and contributor(s) and not of MDPI and/or the editor(s). MDPI and/or the editor(s) disclaim responsibility for any injury to people or property resulting from any ideas, methods, instructions or products referred to in the content. |
© 2023 by the authors. Licensee MDPI, Basel, Switzerland. This article is an open access article distributed under the terms and conditions of the Creative Commons Attribution (CC BY) license (http://creativecommons.org/licenses/by/4.0/).


