1. Introduction
Molecular aggregation in solution to form crystalline solids is the target of numerous interdisciplinary studies [
1,
2]. During the nucleation and crystal growth many supramolecular aspects, such as the molecular structures and the possible interactions between them, drive the outcome towards different crystallization forms, producing materials with different chemical-physical properties. The understanding of such aspects would allow for controlling the whole crystallization process [
3].
The presence of solvent molecules is known to be crucial in determining the resulting crystal form. The employment of different crystallization solvents can produce indeed different crystal forms, where the solvent molecules could affect the solid state assembly [
4,
5]. The effect of the solvent can indeed influence the growth, the morphology and the packing of crystal structures [
6,
7,
8,
9,
10,
11,
12,
13,
14], so that the same ligand can crystallize in different forms [
4].
When looking at transition metal complexes, the metal center plays a key role in defining the molecular conformation, due to specific requirements that span different geometries, from square planar to square pyramid to octahedral, as examples for coordination number 4, 5 and 6 [
15]. The metal ion could also provide the preorganization of the structure, aspect that sometimes is relevant to further applications of the complex, such as the binding in aqueous solution of species generally difficult to pick up in such environment or the selective binding of guests usually difficult to distinguish in solution [
16,
17,
18]. Different metal complexes of the same ligand can be obtained when using diverse crystallization solvents. In this case, the solvent molecules could either non-covalently interact with the complex, affecting the crystal packing and forming solvates [
19,
20,
21], or be covalently bound to the metal center, as to fulfill its specific coordination requirement. The coordinated solvent molecules could have an impact on several aspect, such as single-crystal-to-single-crystal transformations [
22,
23], catalysis [
24] and structural variations in coordination polymers [
25].
Metal complexes having similar molecular structures could anyway significantly differ in their crystal packing, that can be affected by the bound solvent molecules and their involvement in intermolecular interactions. In a previous work [
26], we reported five different metal complexes (
1-
5) of the same fluorescent ligand containing two 2,2’-biphenol (BPH) units linked through a N,N’-dimethylethylenediamine scaffold (N,N′-bis[(2,2′-dihydroxybiphen-3-yl)methyl]-N,N′-dimethylethylenediamine,
L) with transition metal ions such as Ni(II), Cd(II), Cu(II) and Pd(II). Of note, the five complexes, along with a Na(I) complex of a similar ligand still from our group [
19], are the only one structures containing non-derivatized BPH moieties deposited in the Cambridge Structural Database (CSD, v. 5.43) [
27] so far. The five complexes were obtained from different solvents or solvent mixtures, and were described mainly as for their molecular structures, revealing a similarity between the two Ni(II) complexes, featuring both a hexa-coordination with an octahedral geometry around the metal ion, and between the Cu(II) and Pd(II) complexes, featuring respectively a penta- and a tetra-coordination with a square pyramidal or square planar environment around the metal center. The hexa-coordinated Cd(II) complex showed instead a different molecular conformation. In all cases, except for the Pd(II) complex, solvent molecules are coordinated to the metal centers to complete their coordination sphere. In the case of the Pd(II) complex, a solvent molecule (DMF) lies 3.657(3) Å apart from the metal cation, in such a relative favorable orientation that a [4+1] coordination could be hypothesized.
In order to investigate more in detail these specific aspects, in the present paper a new Pd(II) complex (
6) of the same ligand
L was synthesized from a different solvent mixture (DMF, H
2O) and the crystal structure determined by Single Crystal X-Ray Diffraction. Then, a comparative analysis was performed on all structures, seeking for the role of the solvent molecules and the metal ions (that affect the molecular structure) in driving the solid state assembly. To this purpose, Hirshfeld surface and fingerprint analyses were performed on all the structures to assess the intermolecular interactions within the crystal packing. Finally, energy frameworks were calculated for all complexes, to shed light on the energies involved in the different packings of similar complexes [
28,
29].
2. Materials and Methods
2.1. General methods
All chemicals were purchased in the highest quality commercially available. The solvents were RP grade, unless otherwise indicated, and used without further purification. Elemental analysis was performed with a Thermo Finnigan Flash 1112 EA CHN analyser. Mass spectrum was performed with an Agilent 1200 Series HPLC system equipped with a binary pump and a C18 column (Phenomenex Synergi™ 4 µm Fusion-RP 80 Å, LC Column 50 x 2 mm, Ea), coupled to a SCIEX mod. API 4000 QqQ triple quadrupole mass spectrometer with ESI source.
2.2. Synthesis
Ligand
L (N,N′-Bis[(2,2′-dihydroxybiphen-3-yl)methyl]-N,N′-dimethylethylenediamine) has been synthesized as previously described as disodium salt monohydrate (Na
2H
−2L·H
2O) [
26].
Complexes of
L with Ni(II) (
1 and
2), Cd(II) (
3), Cu(II) (
4) and Pd(II) (
5) have been synthesized as previously described [
26].
[Pd(H−2L)] complex (6). K2PdCl4 (20 mg, 0.061 mmol) in H2O (1 cm3) was added to a DMF solution (5 cm3) containing Na2H−2L·H2O (33 mg, 0.061 mmol), and the solution was stirred at 80 °C for 3 h. Crystals suitable for X-ray analysis were obtained by slow evaporation. (26 mg, 73%). Anal. Calcd for C30H30N2PdO4 (MM = 589.00 g/mol): C, 61.18; H, 5.13; N, 4.76. Found: C, 61.2; H, 5.3; N, 4.5. MS (ESI): m/z 589.1 – 591.1 – 587.1 ([PdH−1L]+).
2.3. Single-Crystal X-ray Diffraction
Single crystal X-ray diffraction data of [Pd(H
-2L)] (
6) were collected at 150 K on an Oxford Diffraction Xcalibur diffractometer equipped with a CCD area detector, using Mo-Kα radiation (0.71073 Å), monochromated with a graphite prism. Data were collected and reduced through the CrysAlisPro program [
30]. Absorption correction was performed with the ABSPACK program in CrysAlisPro.
The crystal structure was solved using the SIR-2004 package [
31] and refined by full-matrix least squares against
F2 using all data (SHELXL-2018/3) [
32]. All the non-hydrogen atoms were refined with anisotropic displacement parameters. Concerning the hydrogen atoms, those bonded to O2 and O4 were found in the Fourier Density Map and their position was freely refined while their thermal parameter was set in accordance with the atom to which they are bonded. All the hydrogen bonded to carbon atoms were set in in calculated positions.
Geometrical calculations were performed by PARST97 [
33] and molecular plots were produced by the program Mercury (v2022.3.0) [
34] and Discovery Studio Visualizer 2019 [
35].
Crystallographic data and refinement parameters are reported in
Table 1. In
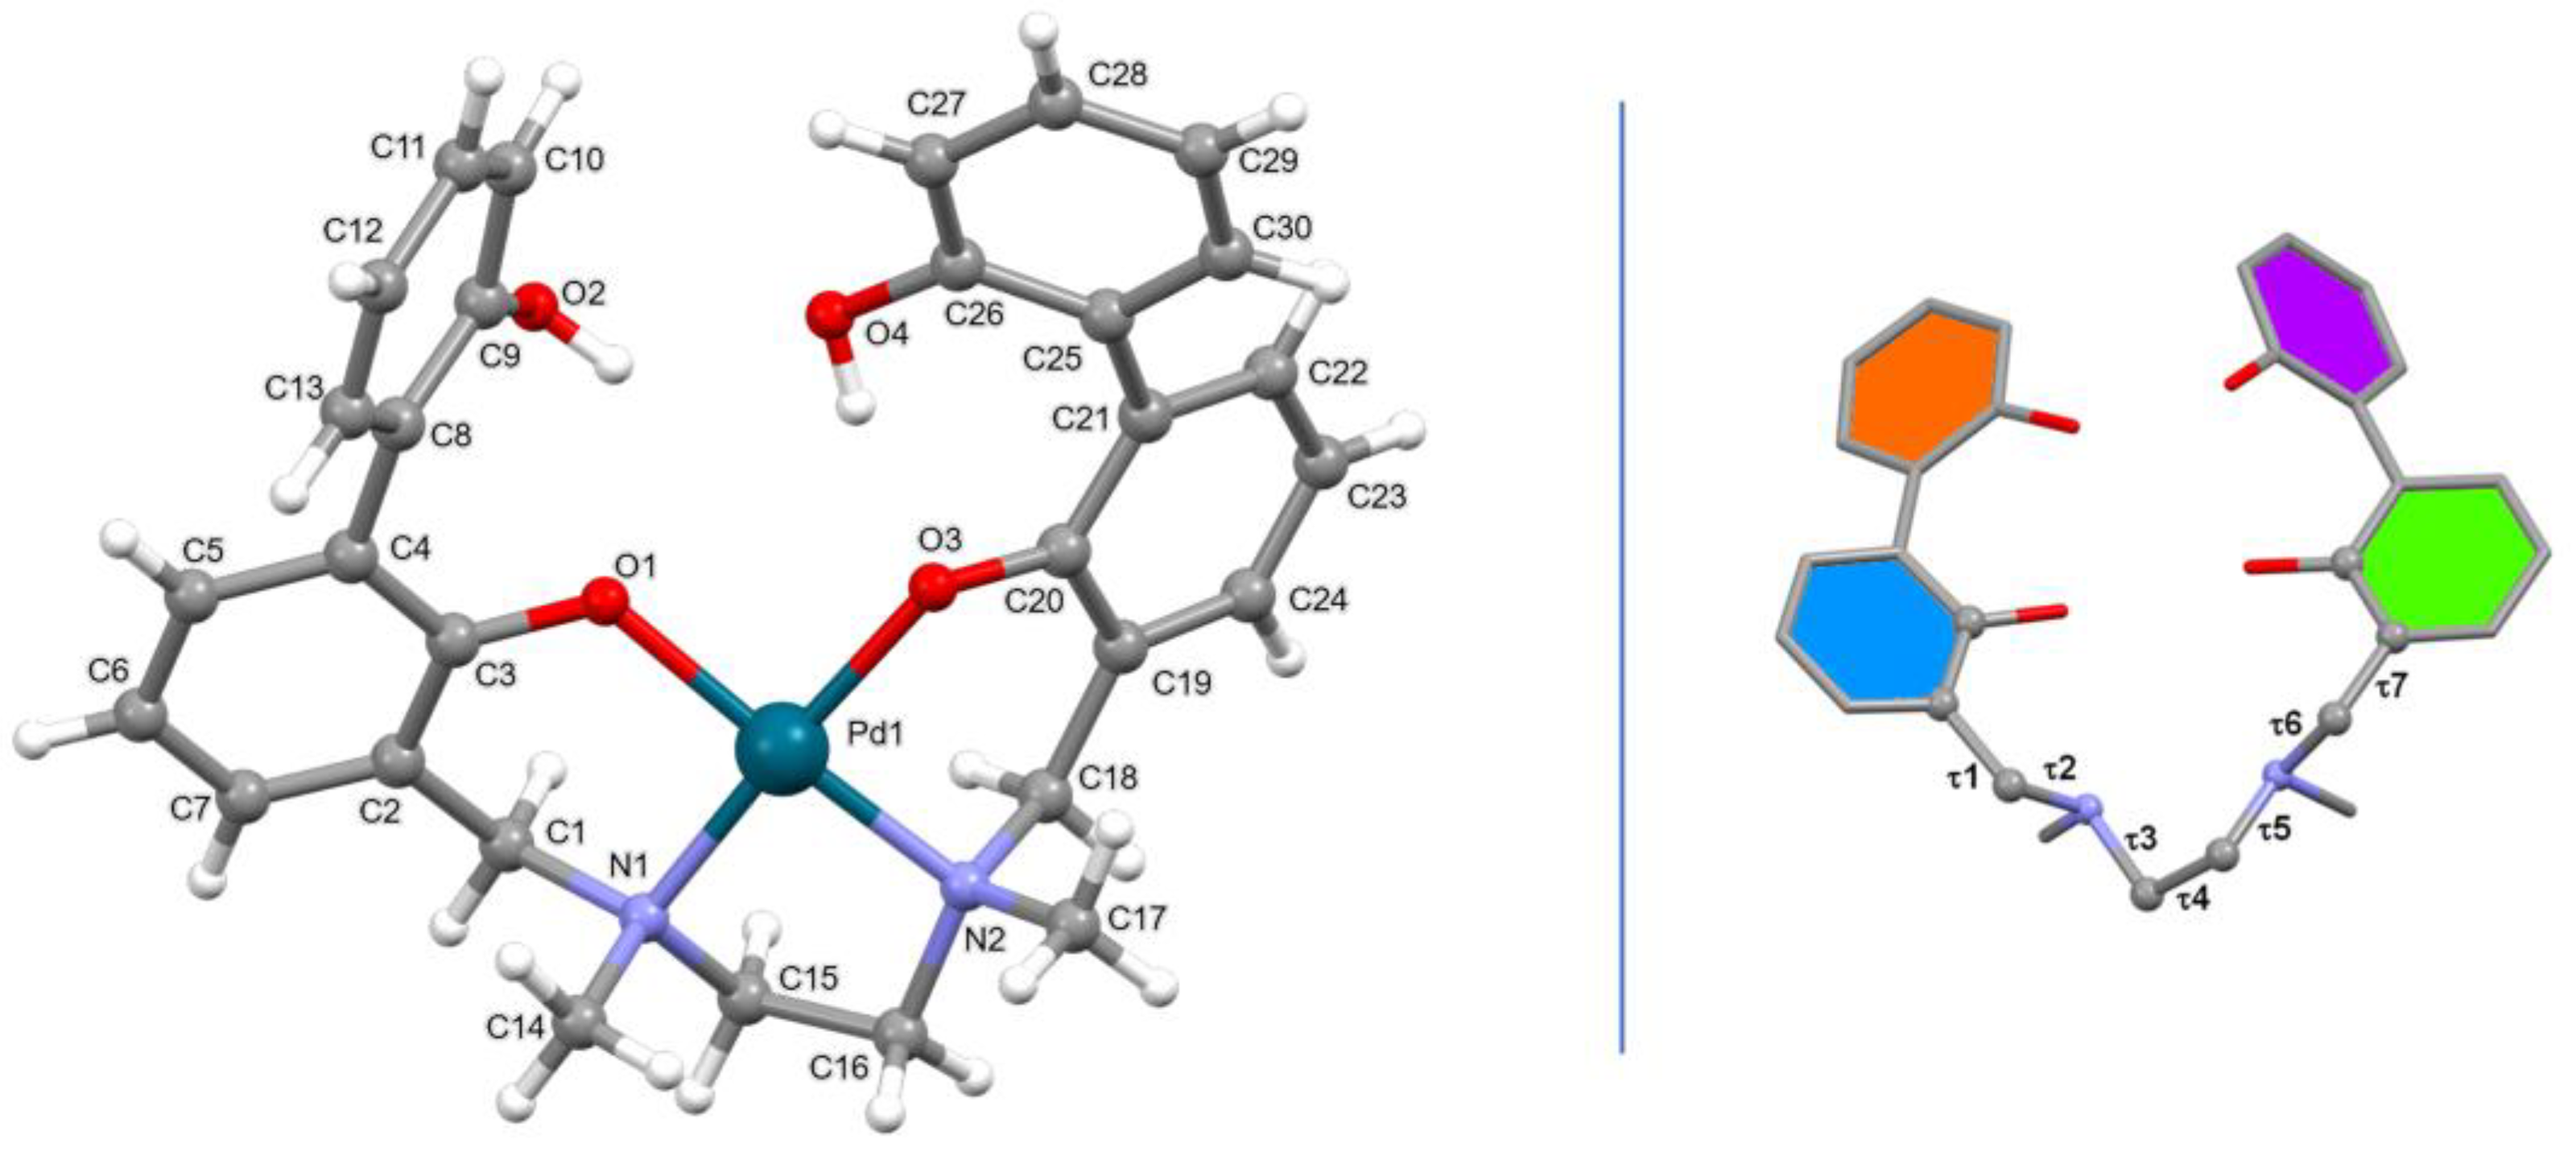
Figure 1, left, a ball and stick representation of the palladium complex (
6) is reported along with atom labels.
2.4. Crystal packing analysis
Hirshfeld surface analysis, 2D fingerprint plot and energy frameworks calculations on complexes
1-
6 were conducted using the CrystalExplorer software (version 17.5, revision f4e298a) [
28,
29]. Energy frameworks were calculated using the B3LYP/3-21G energy model available in CrystalExplorer. Scale factors for benchmarked energy models are k_ele 1.057, k_pol 0.740, k_disp 0.871, k_rep 0.618 [
29].
3. Results and Discussion
3.1. Synthesis of complex [Pd(H-2L)] (6)
The complex
6 has been obtained by a small modification of the previously reported procedure [
26]. In particular, the K
2PdCl
4 salt was dissolved in water instead of DMF and added in equimolar amount to a DMF solution of
L (N,N′-Bis[(2,2′-dihydroxybiphen-3-yl)methyl]-N,N′-dimethylethylenediamine) as sodium salt (Na
2H
−2L·H
2O). Crystals were then obtained from slow evaporation of the solution. In
Table 2 are reported the solvents used in the synthesis of
6 and the previously reported complexes
1-
5 containing the same ligand but different metal ions, along with the solvents retrieved in the crystal structures.
3.2. Description of solid state structure of [Pd(H-2L)] (6)
In the asymmetric unit of [Pd(H
-2L)] a palladium complex is present. The H
-2L-2 anion provides four donor atoms,
i.e. two nitrogen atoms and two oxygen atoms, one for each BPH unit. The resulting coordination geometry of the tetracoordinated Pd(II) cation is, as expected, planar, with the metal cation well in the plane defined by the donor atoms (see
Figure 2). The Pd-X distances are comparable with those retrieved in the CSD for similar complexes (see
Table S1).
As evidenced in a previous paper [
26], the H
-2L-2 anion is able to form several complexes with different metal ions, suggesting a great flexibility of the ligand, that results capable of wrapping around metal cations of different size. When necessary, due to the coordination requirements of the metal centres, external coordinative agents such as solvent molecules, are present. Molecular analogies were found between complex
6 and complexes
4 and
5 (
Table 2), therefore suitable comparisons will be made between those structures.
In the case of complex [Pd(H
-2L)] (
6), the values adopted by the dihedral angles τ3, τ4 and τ5 (see
Table S1 and
Figure 1, right), that define the conformation of the ethylenediamine unit, as well as those taken by the dihedral angles τ1, τ2, τ6 and τ7, that define the disposition of the side arms, are comparable with those observed in the copper complex [Cu(H
-2L)]
.DMF (
4) (CSD Refcode = OTIYEX) [
26]. As a consequence, the conformation taken by the coordinative moiety of the H
-2L-2 anion in the two complexes results quite well superimposable (
Figure S1). The two asymmetric nitrogen atoms, N1 and N2, have a [R,S] configuration, as already observed in
4, thus resulting in a [R,S]-trans topology. A search performed in the CSD shows that this topology is the preferred one for complexes with a ligand similar to
L having a trans disposition [
36]. When considering the [Pd(H
-2L)
.DMF] palladium complex (
5) (CSD Refcode = OTIYIB) [
26], where the metal cation is [4+1] coordinated by the H
-2L-2 anion and one DMF molecule, a [R,R]/[S,S]-trans topology is observed, with the two methyl groups pointing toward opposite directions with respect to the mean plane defined by the four donor atoms (
Figures S2 and S3).
Table 3 reports the angles between the mean planes containing the aromatic rings (for rings’ colors see
Figure 1, right). It can be noticed that the main difference concerning the disposition of the two BPH side arms between the two palladium complexes (
6 and
5) and the copper one (
4), is related to the mutual disposition of the two O-H groups (see angle between the C8-C13 (orange) and C25-C30 (violet) mean planes,
Figure 1, right). In the copper complex (
4) the two O-H groups point toward opposite direction with respect to the mean plane defined by the N1, N2, O1 and O3 donor atoms, while in the two palladium complexes (
6 and
5) they point toward the same direction. In all the three complexes an intramolecular H-bond interaction connects the two aromatic rings of the same BPH unit (
Table 3).
3.3. Crystal packing analysis of complex [Pd(H-2L)] (6)
The intermolecular interactions within the crystal packing of complex
6 were assessed by Hirshfeld surface analysis, fingerprint plots and energy frameworks calculations using CrystalExplorer [
28,
29,
37].
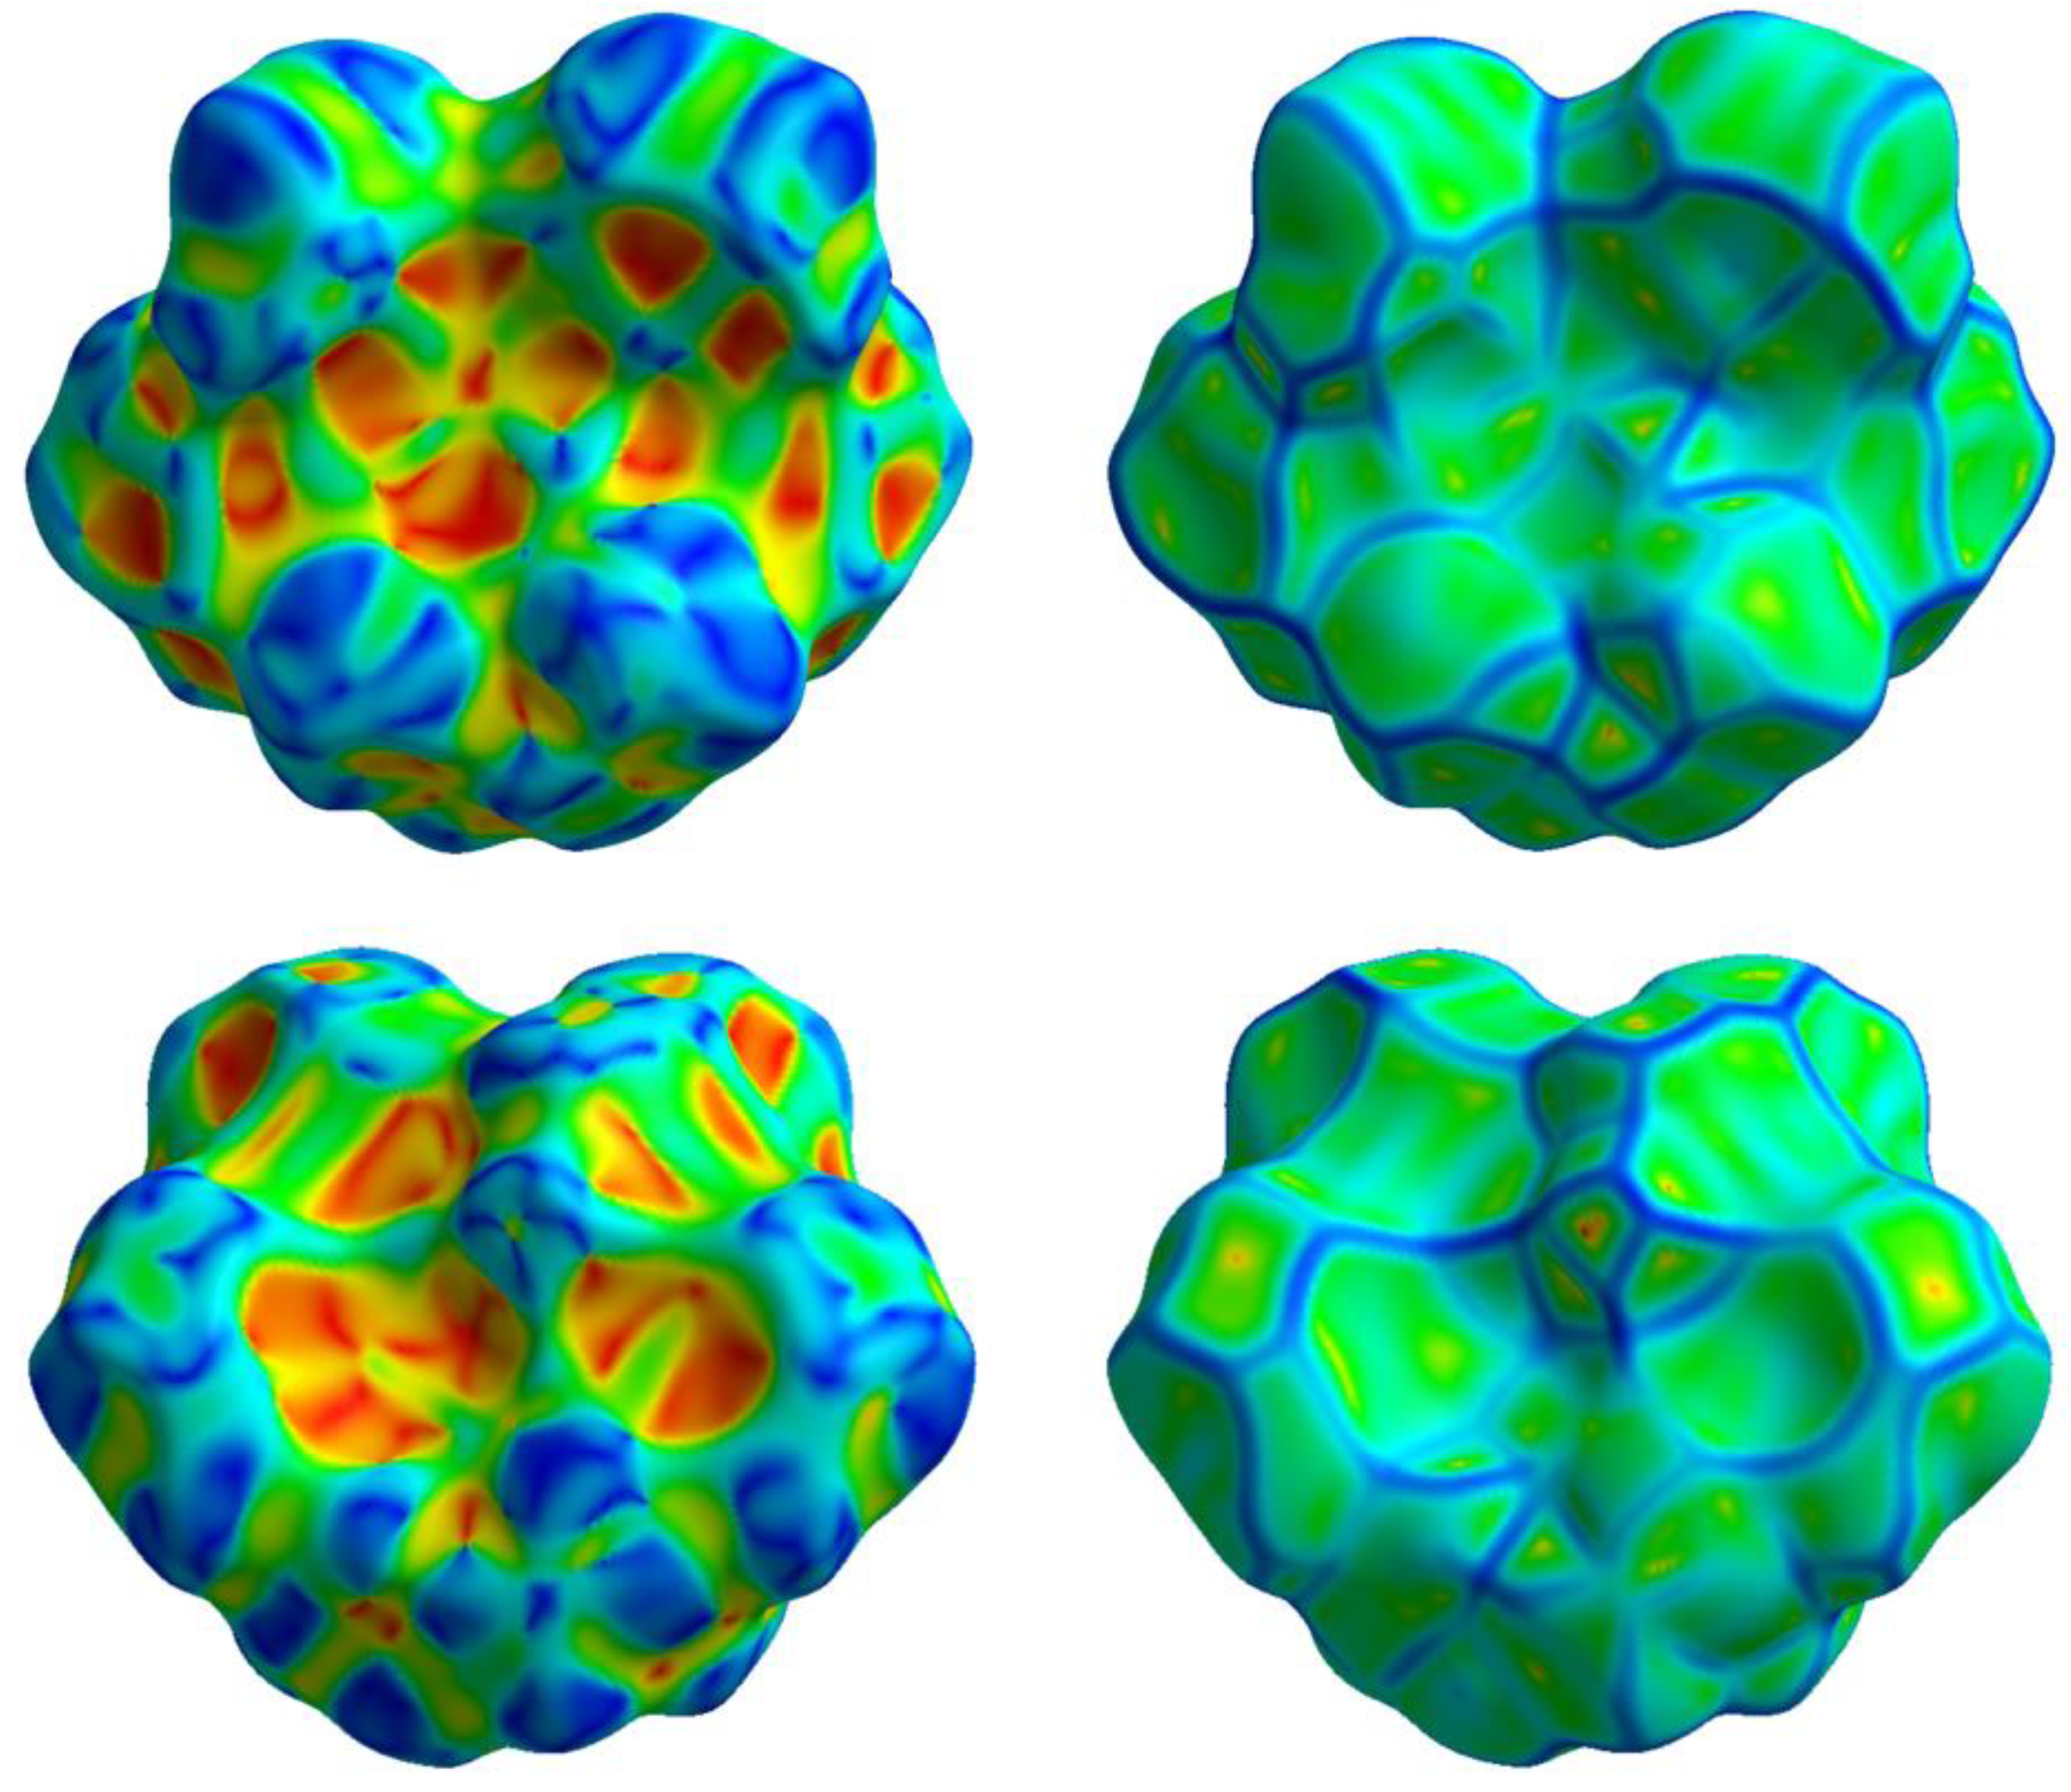
The Hirshfeld surface analysis allows to visualize all the intermolecular interactions in the crystal and provides information on their strength. The normalized contact distance (d
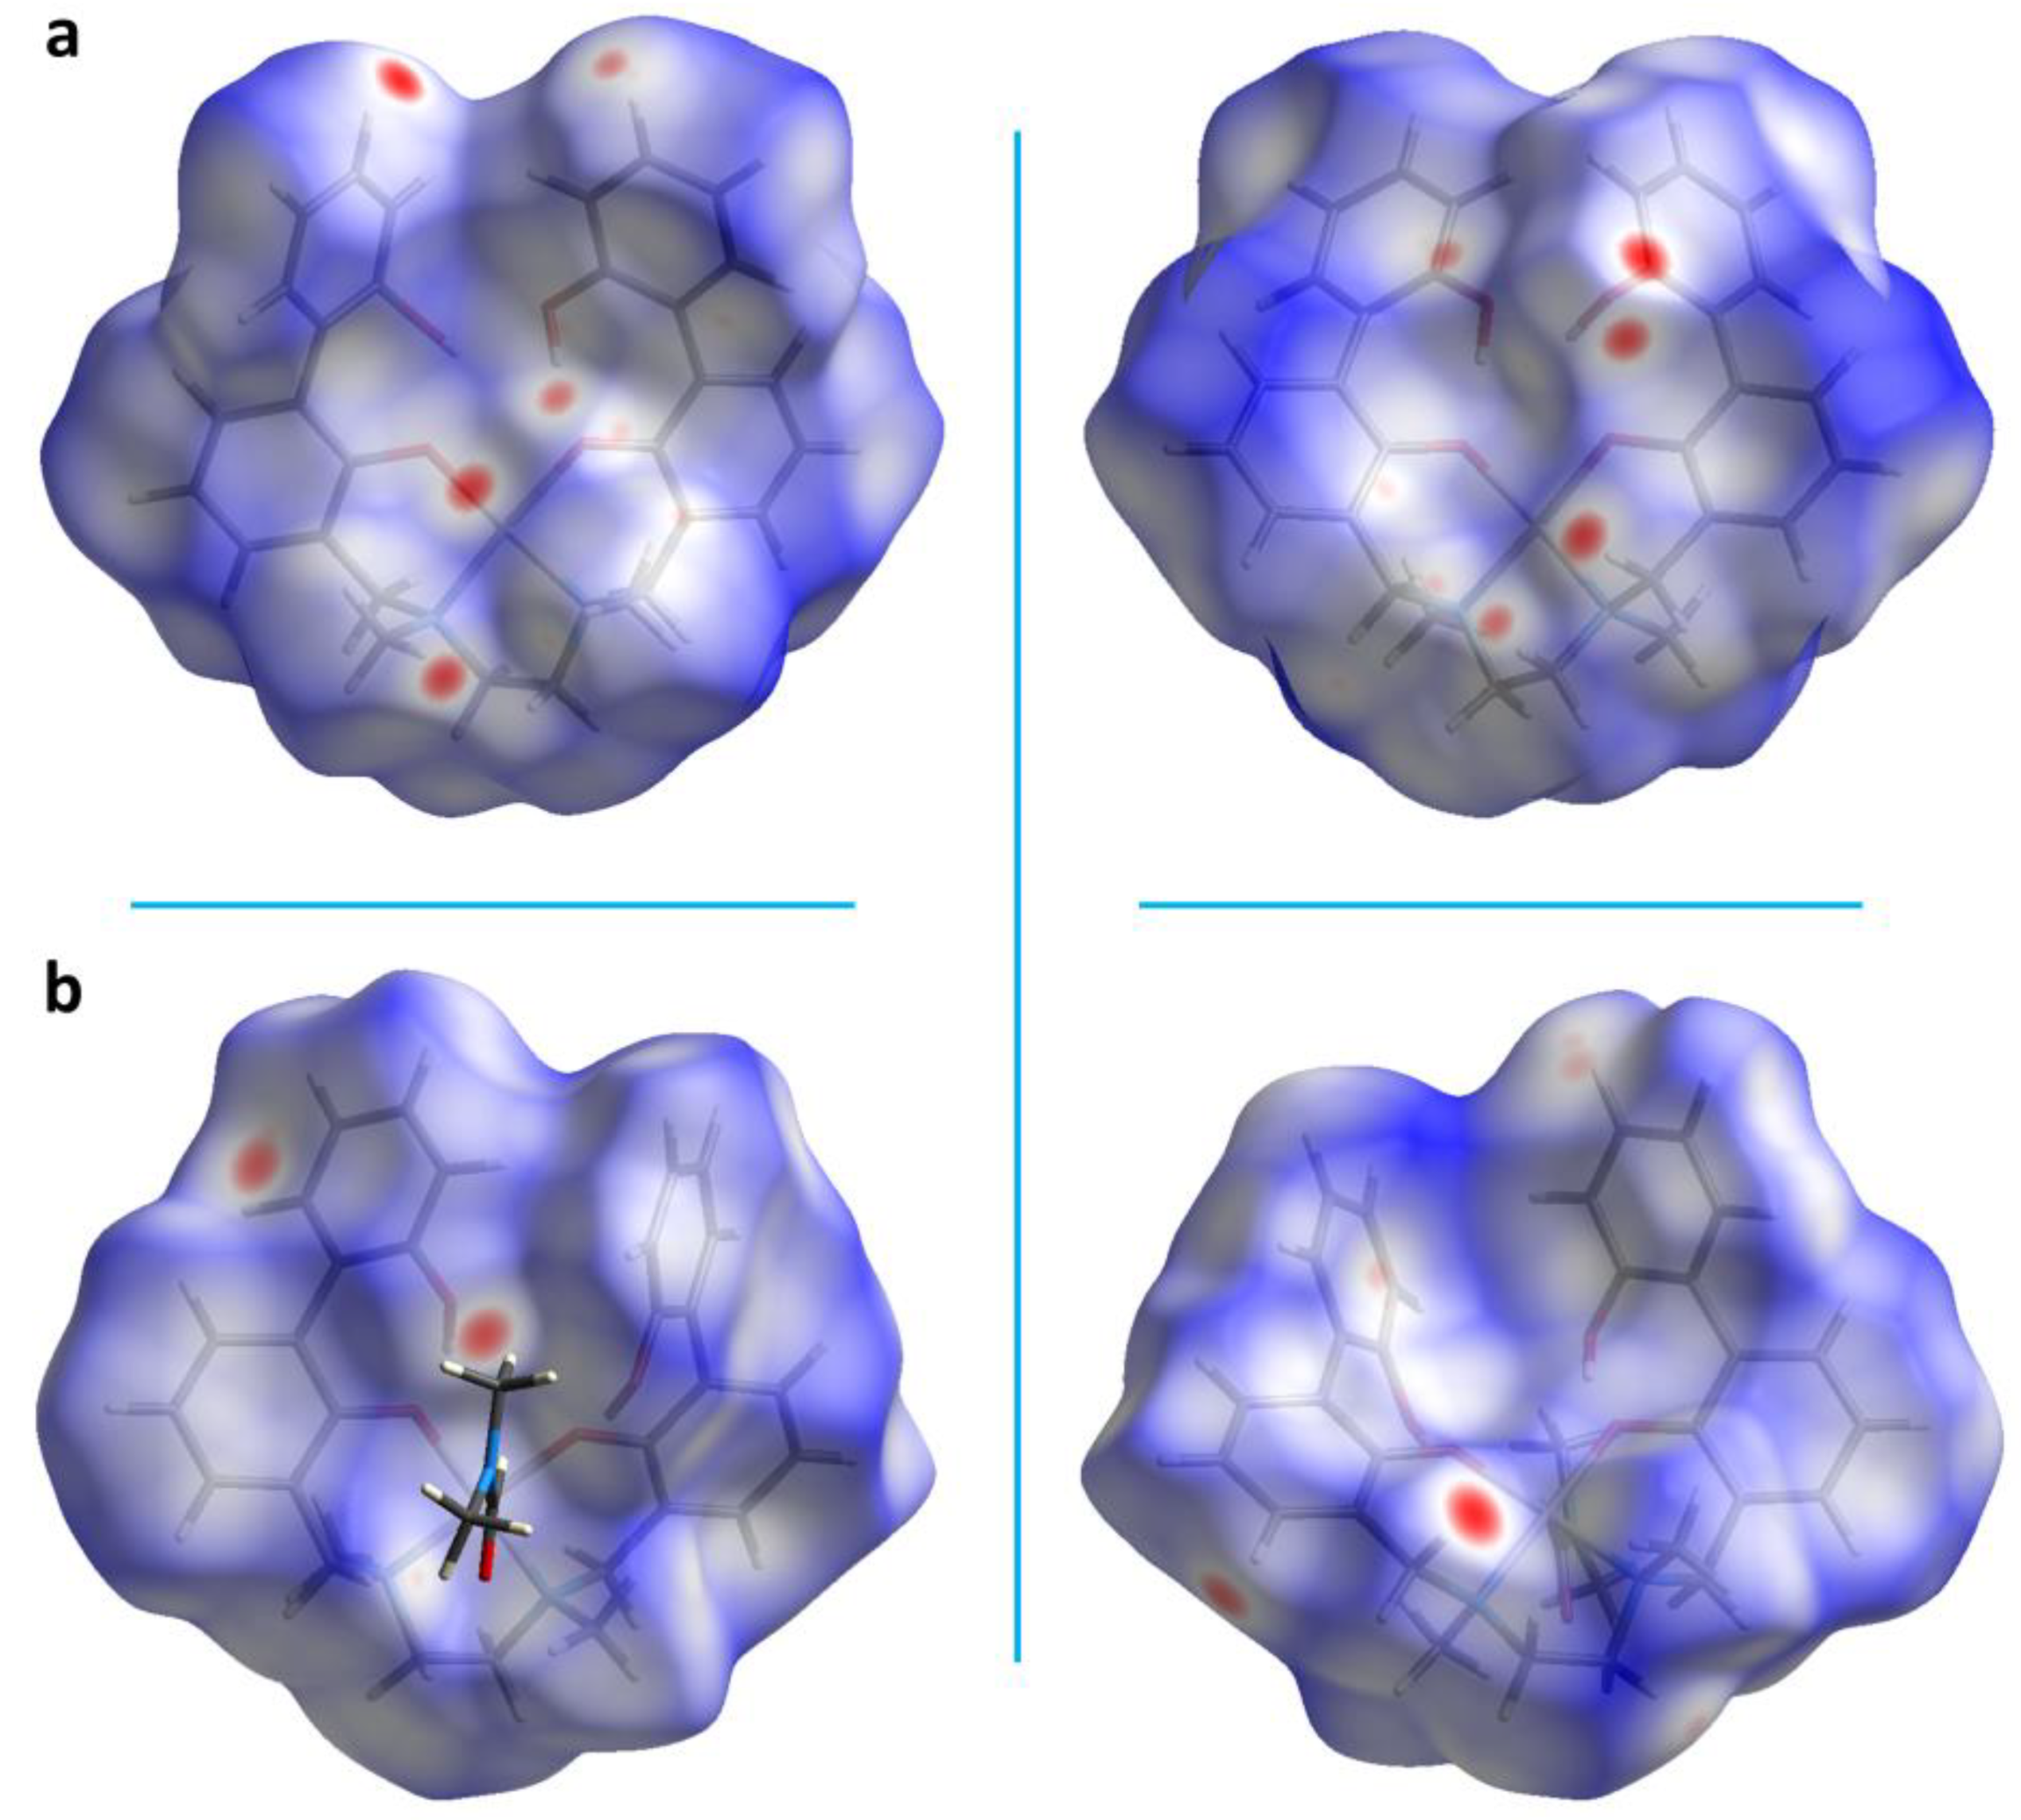
norm) values mapped onto the Hirshfeld surface return different colored areas: red and blue colors indicate contacts with distances shorter or longer than the sum of van der Waals radii, respectively, while the white surface indicates contacts with distances equal to the sum of vdW radii. The Hirshfeld surface of complex
6 mapped over d
norm is depicted in
Figure 3a. The red spots refer to tight contacts between acceptor and donor atoms, the closer the contact the more intense the color.
The globularity of the complex is found to be 0.719 (<1), which indicates that the molecular structure is not a sphere but is more structured, while the asphericity, that is a measure of anisotropy, is 0.101. The measures of curvature (shape index and curvedness) provide further information about the packing [
38]. The shape index mapped onto the Hirshfeld surface highlights the presence of hydrogen donor and acceptor groups as, respectively, blue (bumps) or red (hollows) regions; the curvedness surface indicates flat regions as green areas and edges as blue areas. A low curvedness appoints a flat region and may be indicative of π–π stacking in the crystal, whereas a high curvedness suggests an absence of π–π stacking [
37]. As for complex
6, both shape index and curvedness indicate the absence of π–π stacking interactions (
Figure 4).
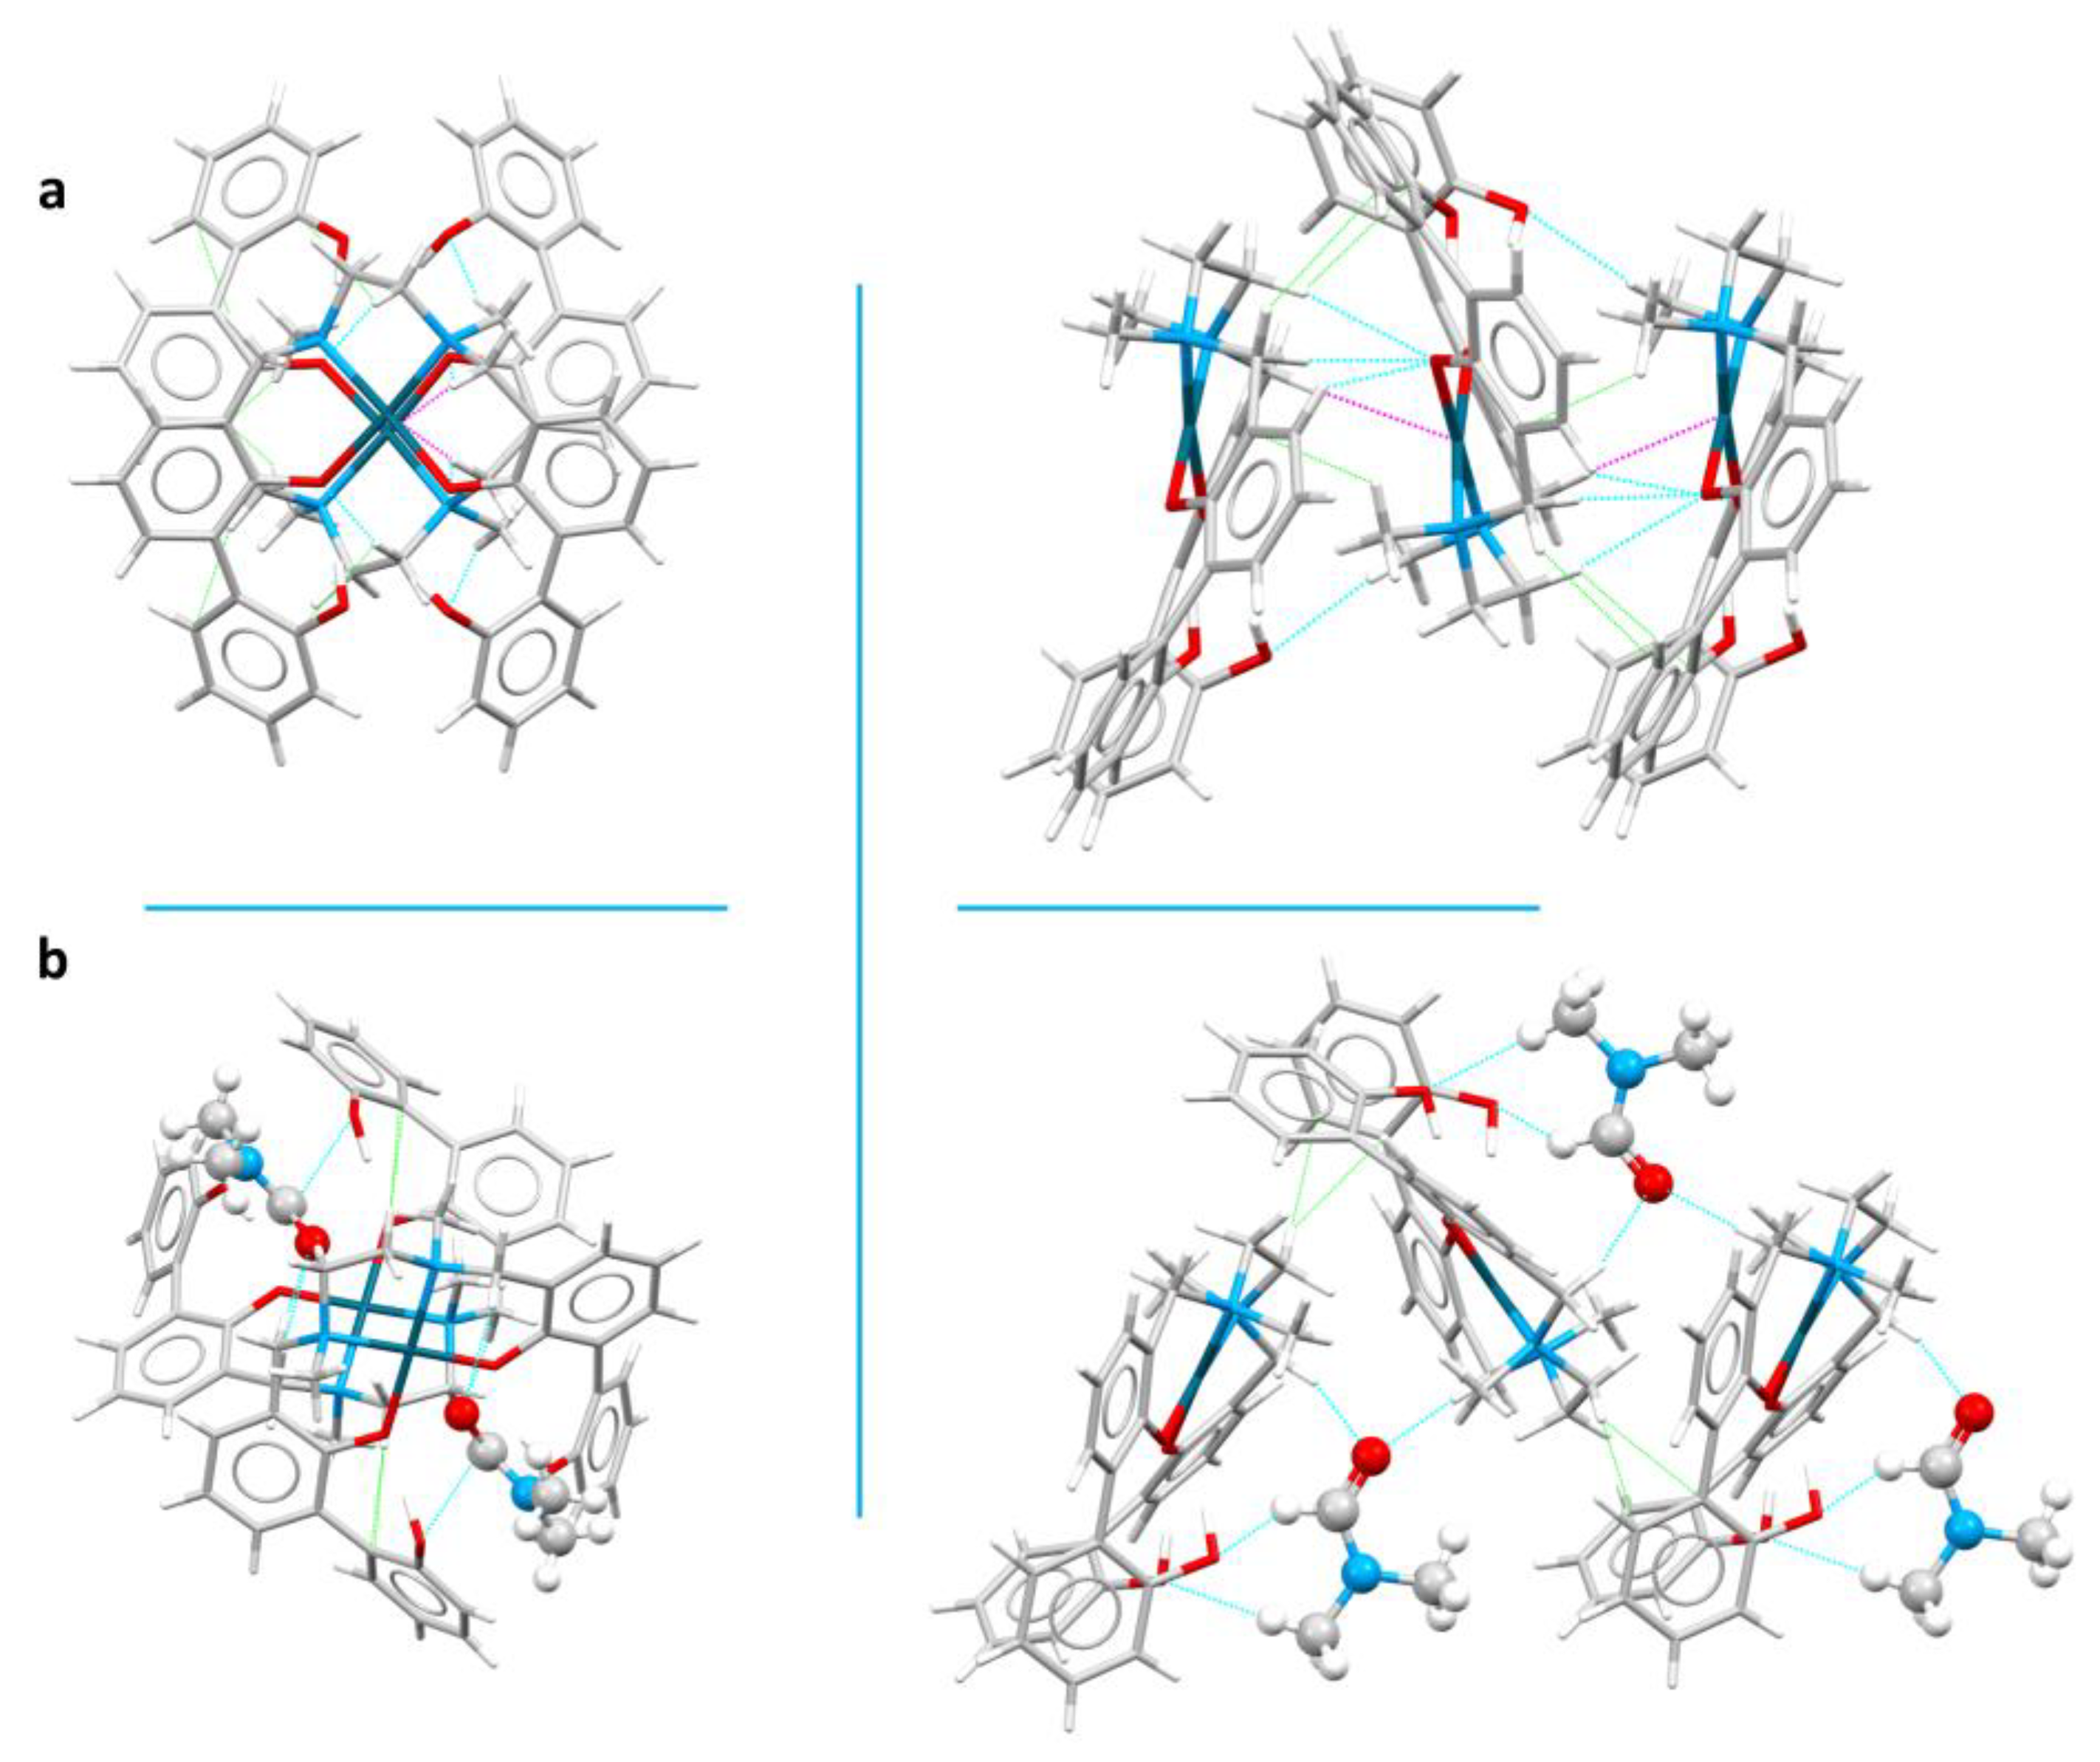
Complexes in
6 are assembled in the packing to form ribbons that develop along the
a axis (
vide infra) (
Figure 5a). Ribbons are mainly formed by O…HC (between biphenol/biphenolate functions and methylene hydrogens), C…HC (between aromatic carbons and methylene or methyl hydrogens) and Pd…HC (between the Pd(II) center and methylene hydrogens) interactions and are connected to other ribbons through O…HC (biphenol functions with aromatic hydrogens) and C…HC (CH…π) contacts (
Table S2 and
Figure 5a). Within each ribbon, complexes are assembled alternatively upside-down, with OH functions and methyl groups pointing always the same direction. All Pd(II) ions within the ribbon are well aligned.
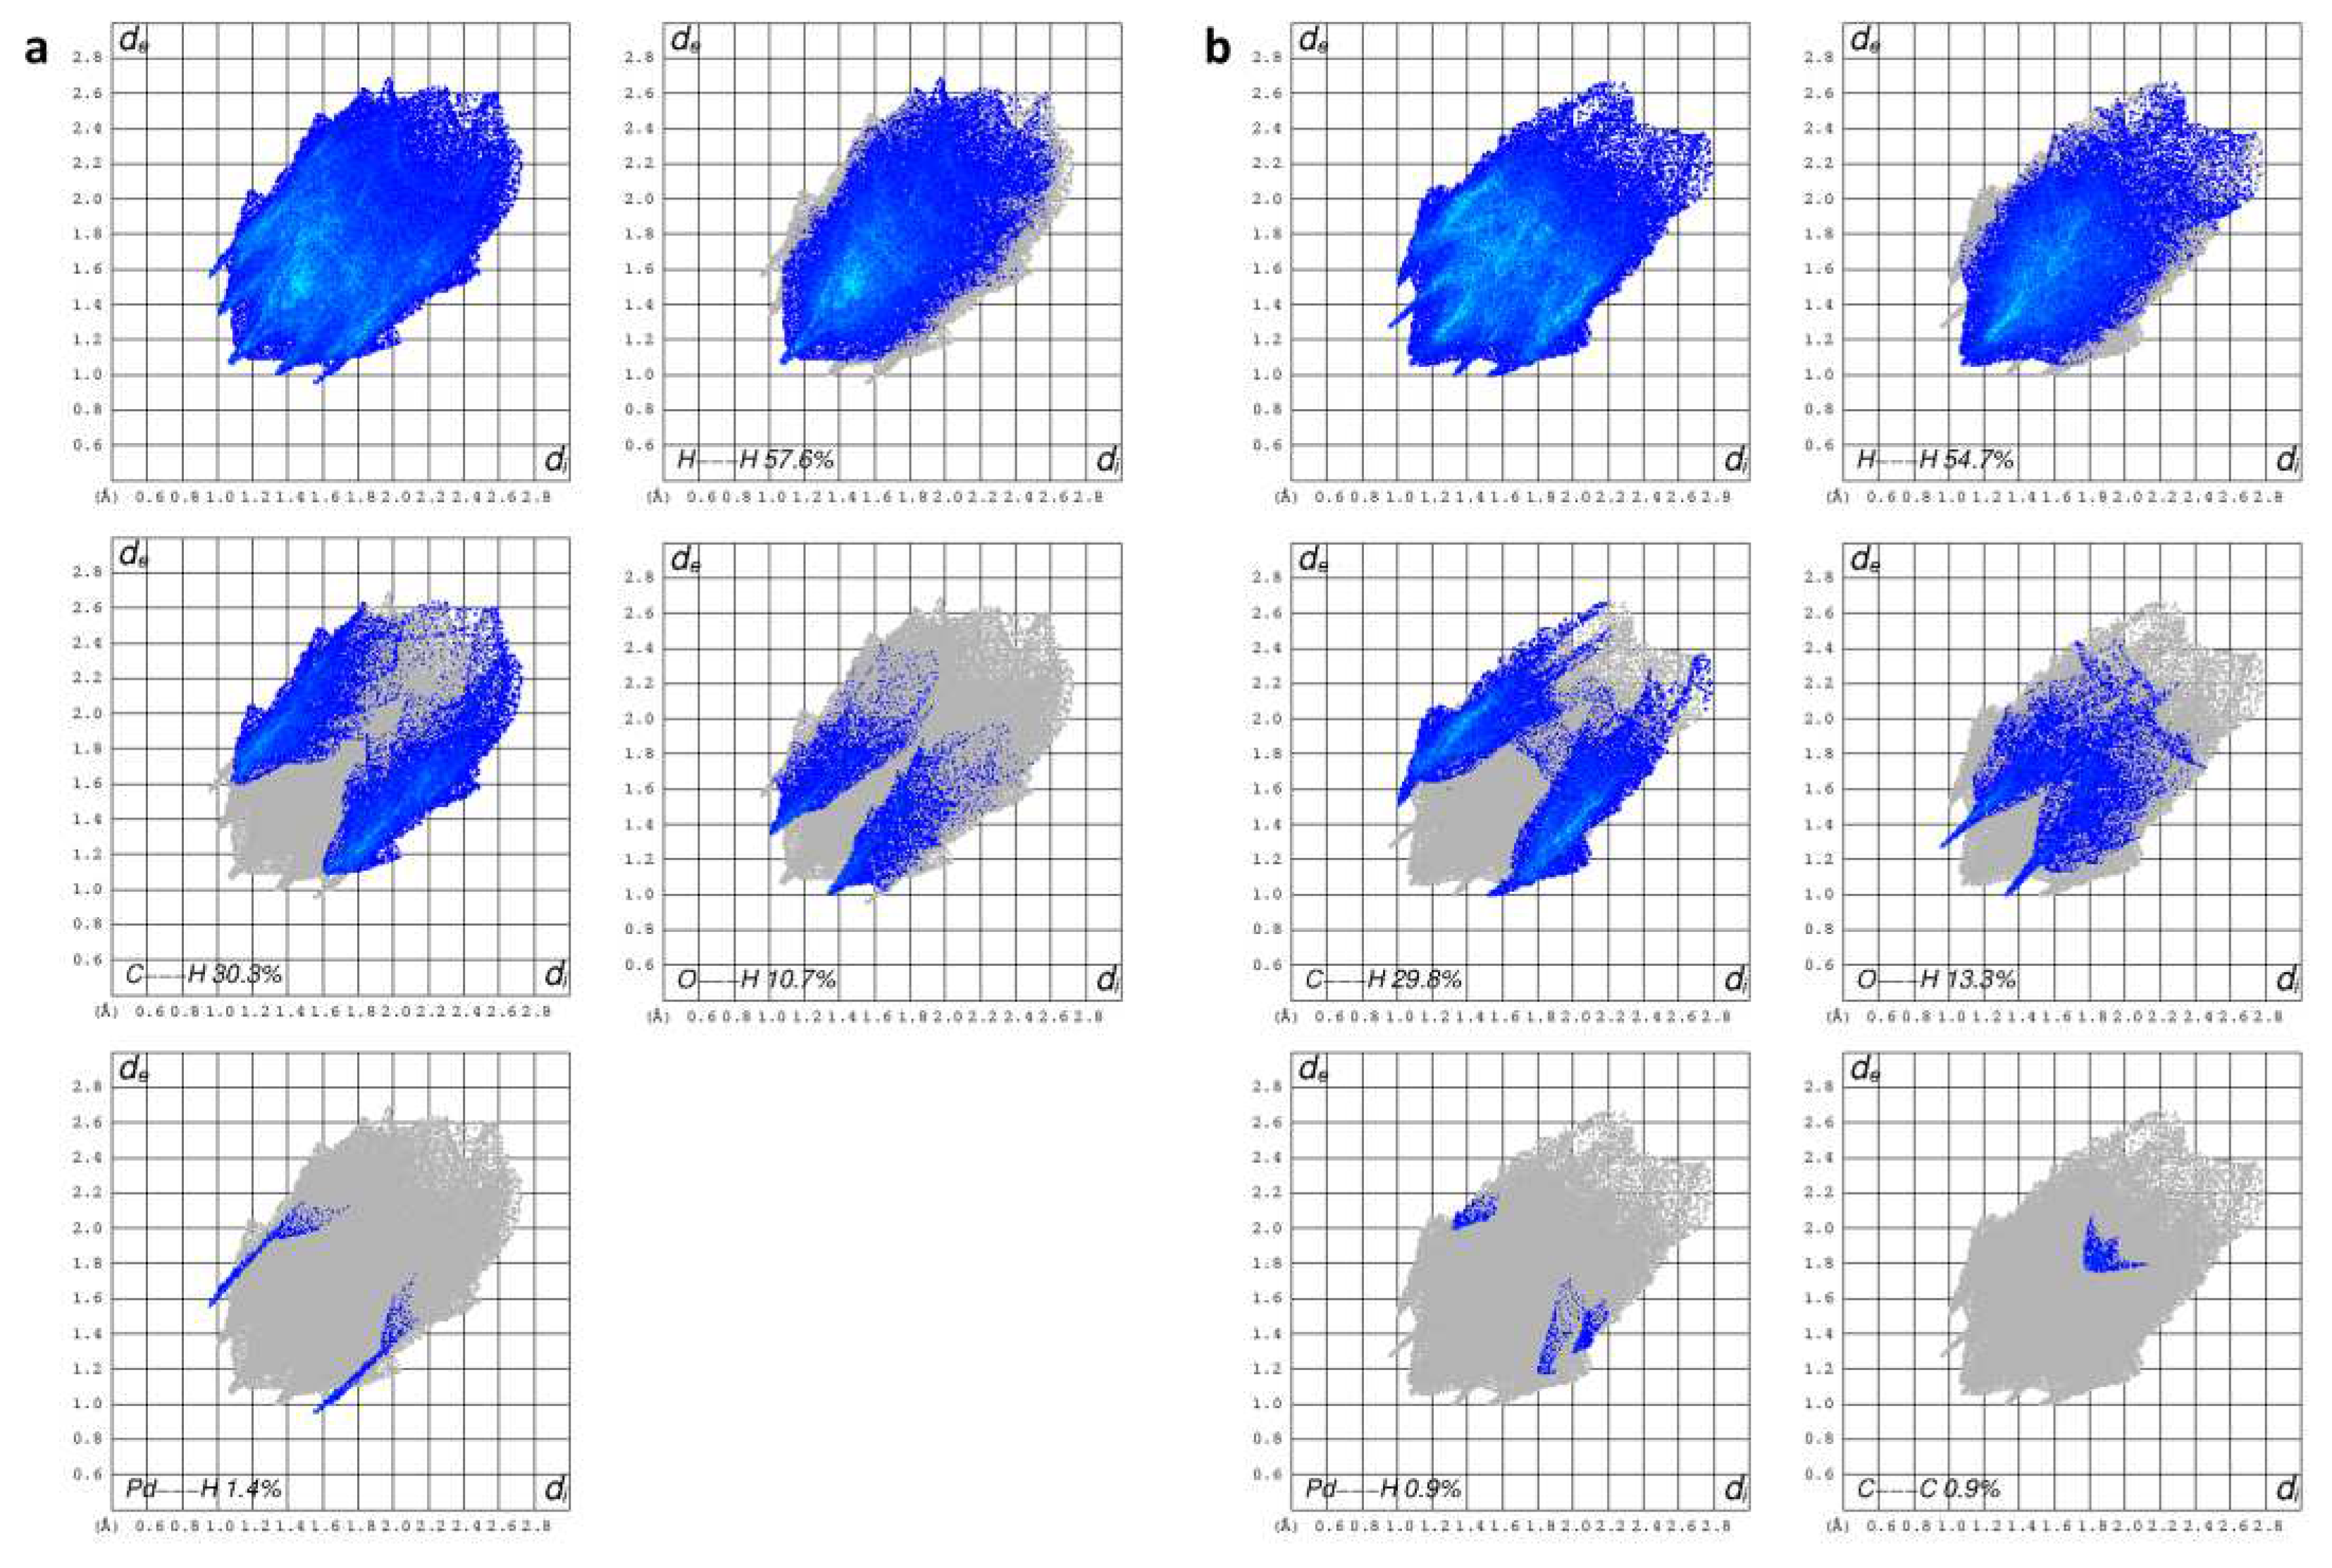
The fingerprint plots allow to gather all intermolecular interactions contained in a molecular crystal structure into a single 2D graph, that gives a quantitative summary of the nature and type of intermolecular contacts in the crystal. The colors on the plot are related to the contribution of the interactions on the surface (no contribution: uncolored; small to great contribution: blue to green to red). The decomposed 2D fingerprint plots of
6 reveal that, after H…H interactions (57.6%), the most frequent contacts in the crystal are C…H (30.3%) and O…H (10.7%). Interestingly, spikes related to Pd…H interactions are present (1.4%) (
Figure 6a), indeed Pd…HC interactions were found within each ribbon. Finally, C…C contacts are not present in
6. It appears clear from the shape of the fingerprint plot that all contacts of are quite long.
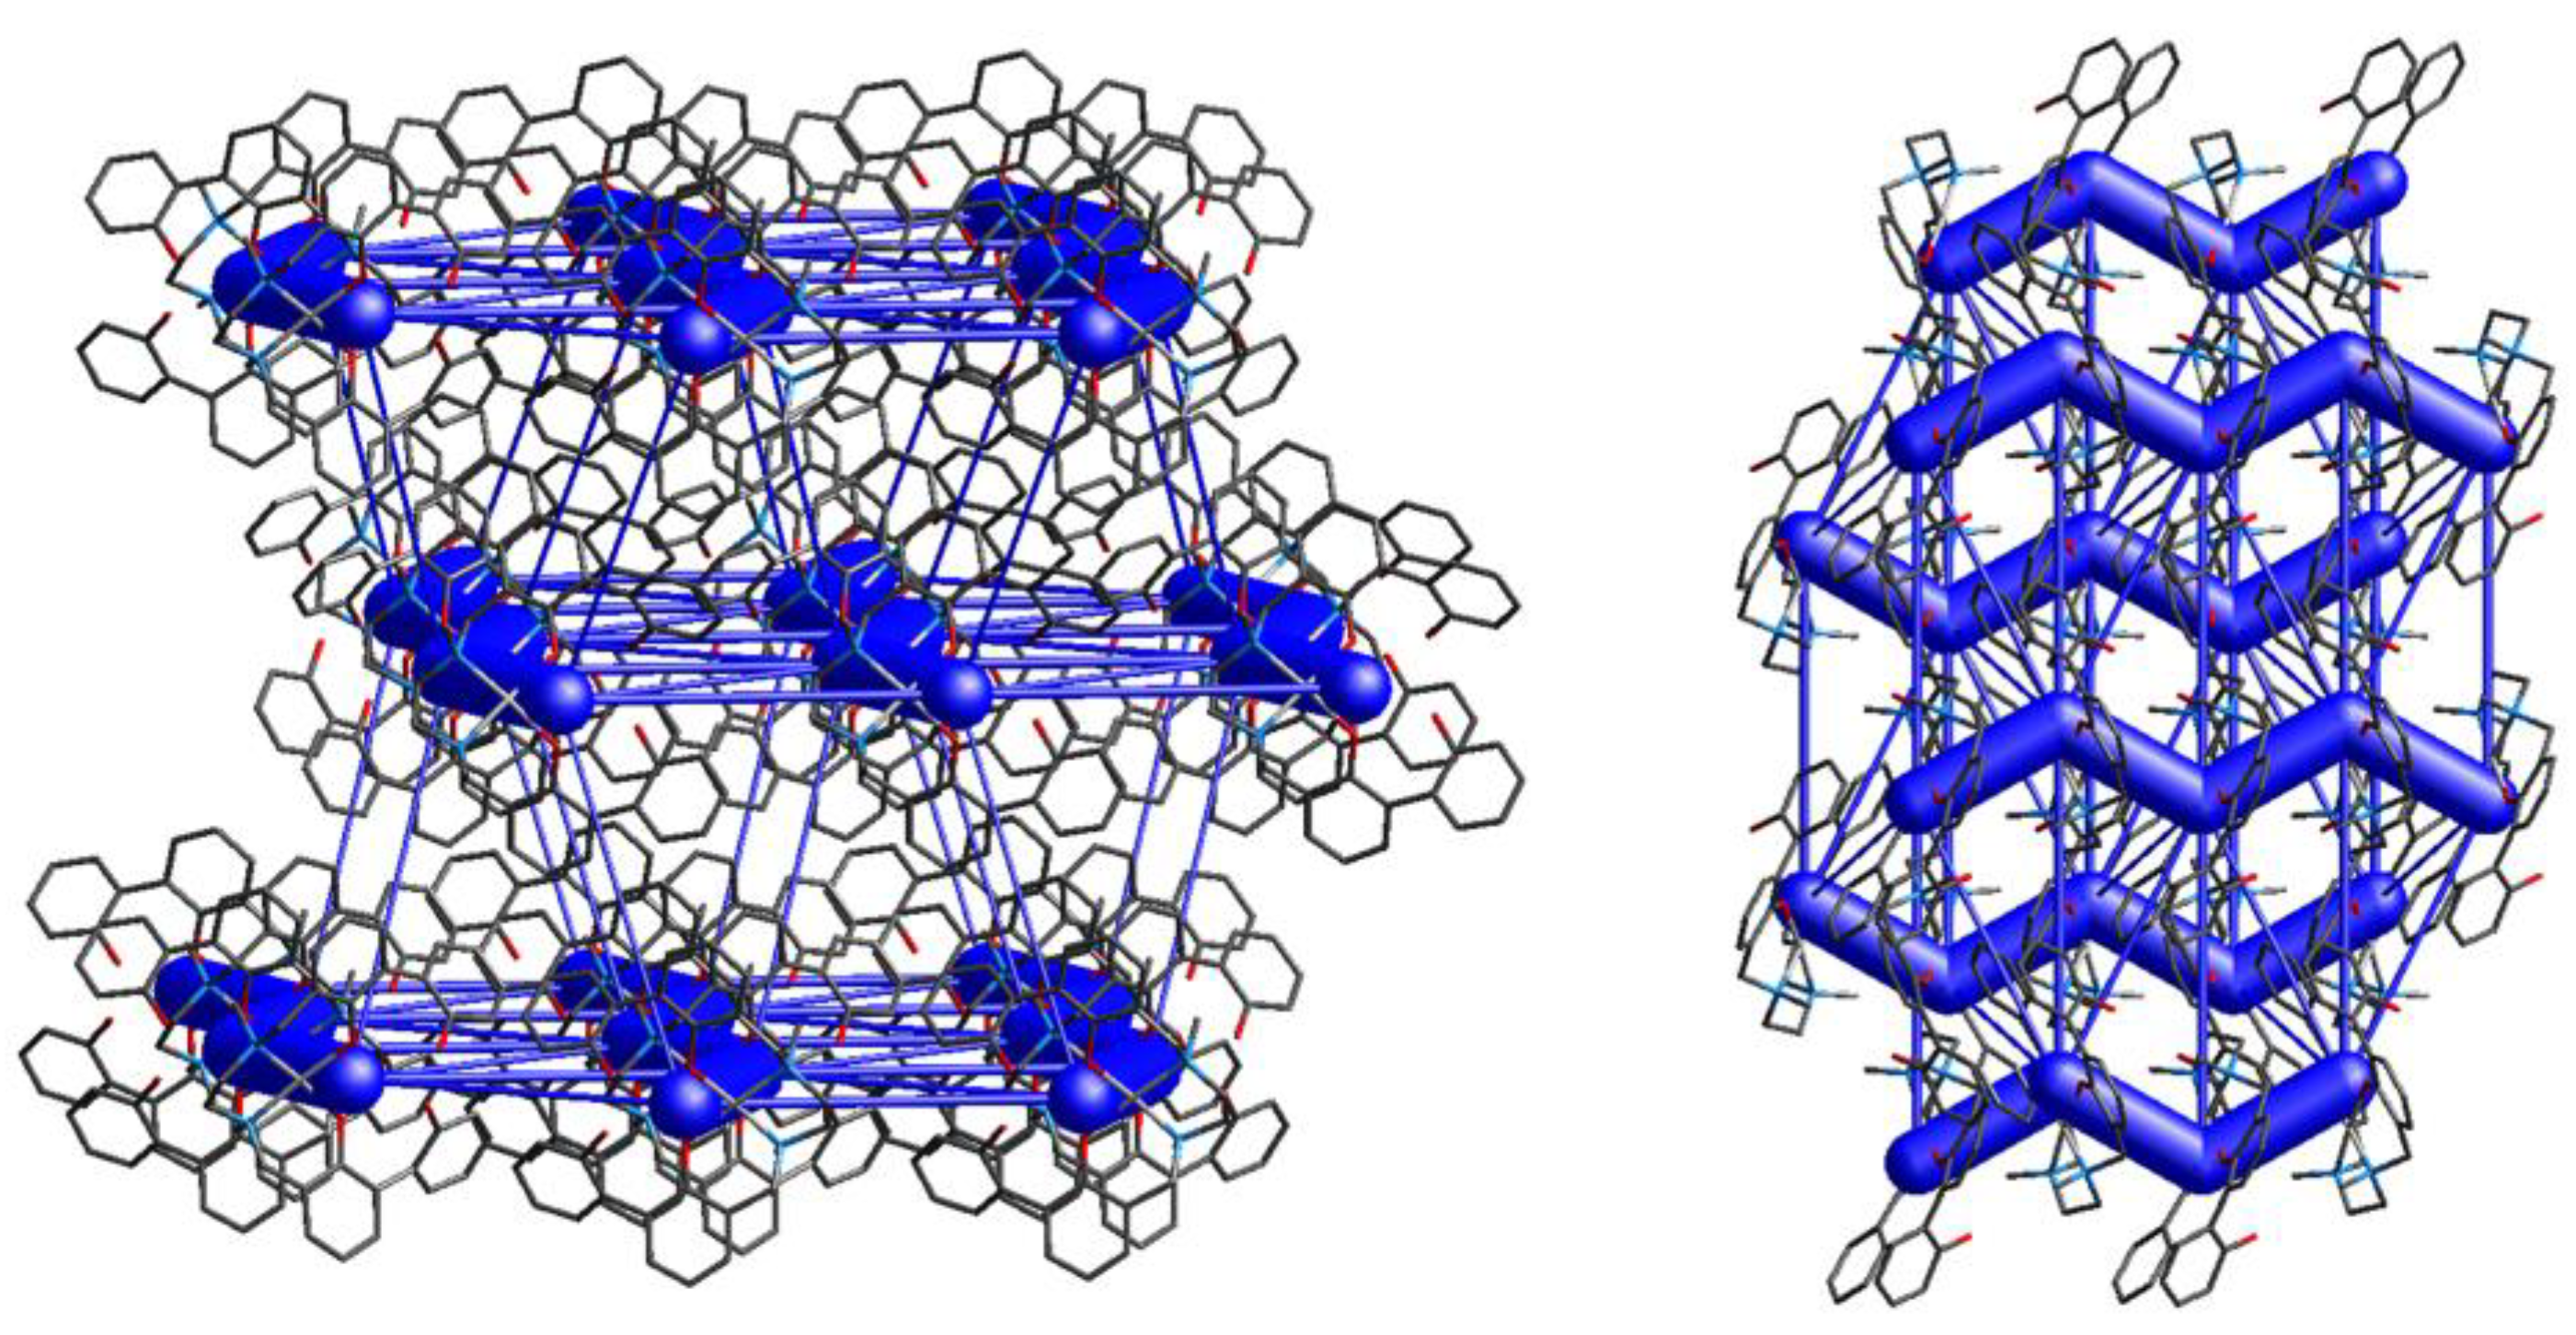
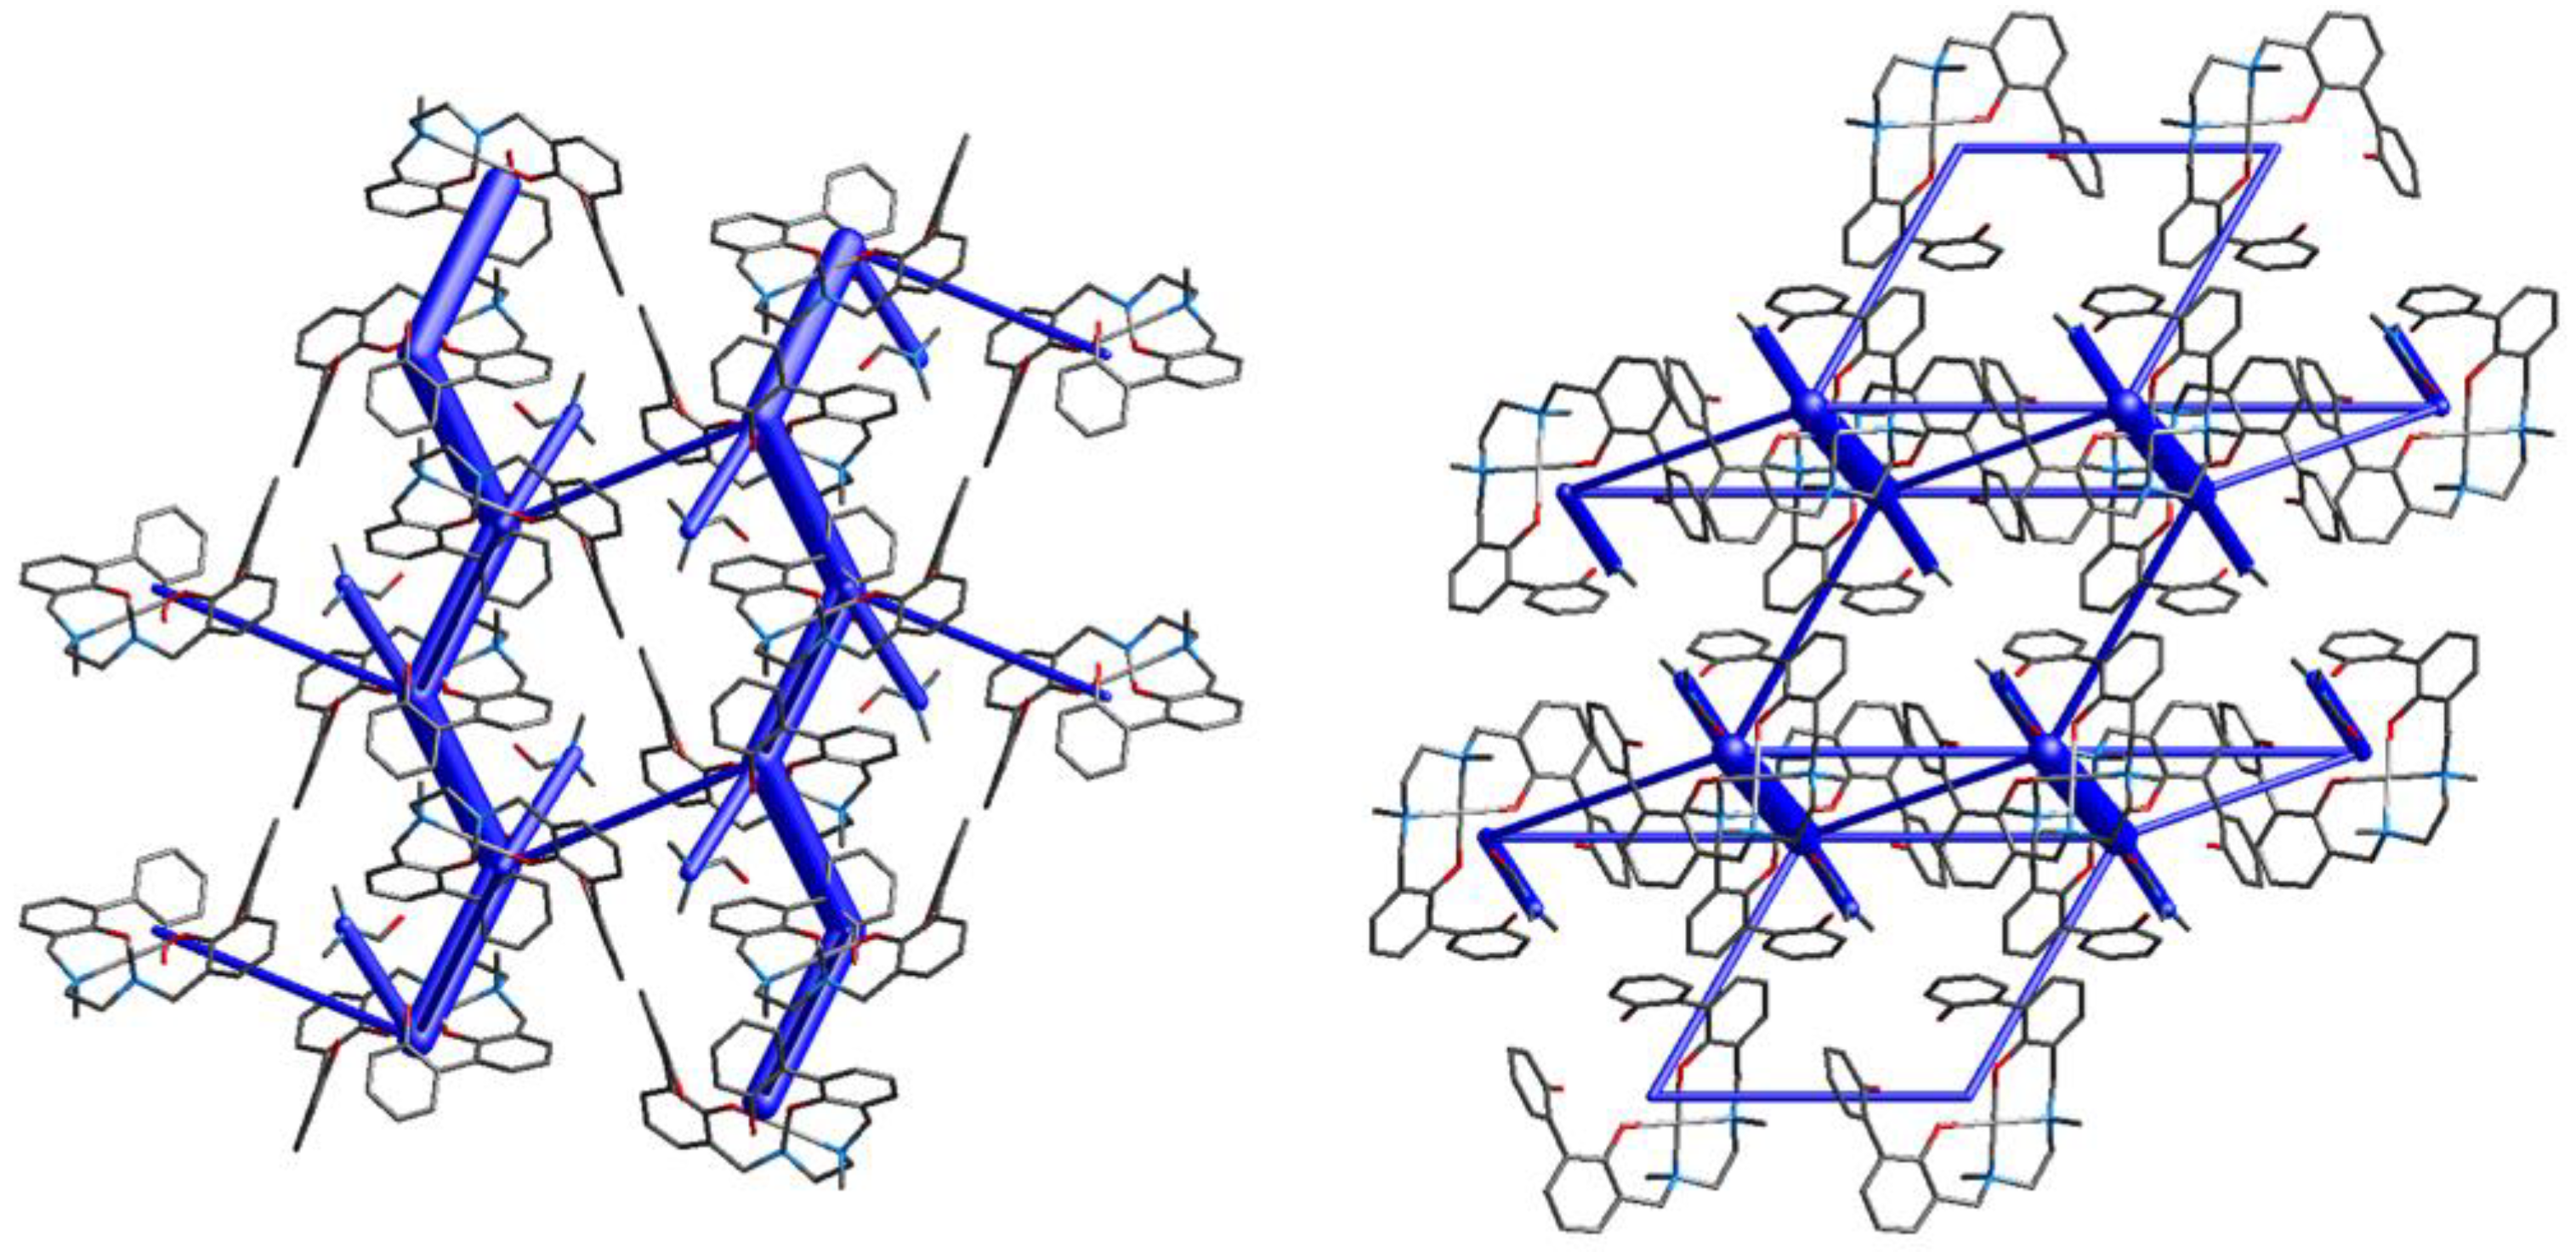
Energy frameworks calculations allow to quantify the contacts within the crystal packing and to visualize them as cylinders, whose dimensions are proportional to the energy values of the interactions between two specific molecules. In
Figure 7 it can be observed that, as already mentioned, the complexes arrange to form zig-zag ribbons that develop along the
a axis. The interaction energy within this motif is indeed by far the strongest (Etot: -228.3 kJ/mol,
Table 4), and is represented by big cylinders connecting the related complexes. More views of the zig-zag ribbons (along
b and
c axes) are depicted in
Figure S4. As can be observed from the figures, ribbons are interconnected, still the interaction energies of these contacts are negligible compared to ribbons’ interaction energies (-228.3 kJ/mol
vs < -35 kJ/mol,
Table 4). All intermolecular interactions within and between ribbons in
6 are listed in
Table S2.
3.4. Comparison between the crystal packing of [Pd(H-2L)] (6) and [Pd(H-2L).DMF] (5)
Complexes 6 and 5 share the same ligand, L, and the same metal ion, Pd(II), but they were obtained by slow evaporation of different solutions containing, respectively, DMF and 20% water (6) and sole DMF (5). As shown above, complex 6 is a pure structure, without solvent molecules in the crystal, while 5 is a DMF solvate, where the solvent molecule is weakly bonded to the metal ion in a [4+1] coordination. Therefore, the presence of water changed the composition of the complex, switching from a solvate (5) to a pure form (6), as already found in other crystal structures [
4].
To assess whether the presence of the solvent molecules affected the crystal packing, Hirshfeld analysis, 2D fingerprint plots and energy frameworks calculations were performed also for 5. A smaller number of red spots on the Hirshfeld surface (globularity: 0.723; asphericity: 0.087) can be detected in the case of 5 with respect to 6 (
Figure 3b). This means that a lower number of close contacts form in the crystal packing of 5.
Moreover, from 2D fingerprint plots (
Figure 4b) it can be observed that O…H contacts increased compared to 6 (13.3
vs 10.7%), due to the presence of the DMF molecule. Also, both O…H and C…H contacts are shorter than those found in 6, indeed two sharp spikes can be observed in this case in the O…H plot (
di +
de = 2.2 (5)
vs 2.3 (6) Å) and a sort of spikes can be recognized also in the C…H plot (
di +
de = 2.5 (5)
vs 2.7 (6) Å). The Pd…H plot shows a lesser contribute of such interactions in 5 with respect to 6. Finally, the C…C plot suggests the presence of some π-π interactions. This is supported by both shape index and curvedness mapped on the Hirshfeld surface, as the π-π stacking interactions appear as adjacent red and blue triangles on the shape index surface, and are also indicated by flat regions on the curvedness surface (
Figure S5).
Also in the case of 5, as for 6, the molecules in the crystal packing assemble to form zig-zag ribbons that develop along the
b axis (
Figure 5b). In 5 the ribbons are mainly due to C…HC contacts between aromatic carbons and methylene hydrogen atoms, rather than to O…HC contacts, as in complex 6. However, the solvent molecules create a net of O…HC hydrogen bonds that strengthen the ribbon (
Figure 5b, right). As in 6, complexes within each ribbon are assembled alternatively upside-down, with OH functions pointing always the same direction. Contrarily to 6, Pd(II) ions within the ribbon are not all aligned (
Figure 5b, left). Intermolecular interactions within and between ribbons are listed in
Table S3.
The energy frameworks calculations confirmed the ribbon-like assembly of 5 (
Figure 8 and Figure S6). The energy values, mirrored by the cylinders’ sizes, showed indeed that the interactions within the ribbons are the strongest (-133.5 kJ/mol), followed by the interactions with DMF molecules (-75.0 kJ/mol,
Table 4), that form the above mentioned O…HC hydrogen bonds network (
Table S3). All other interactions energies are lower than -35 kJ/mol (
Table 4). In other words, the packing is ruled by the ribbons interactions, with the contribution of DMF molecules in strengthening the ribbons. Ribbons are then interconnected, in particular through CH…π and π…π interactions; anyway, the interaction energies of these contacts are much lower than those of ribbons (
Table 4).
Comparing the two Pd(II) complexes (6 and 5), it can be inferred that in both cases the compounds are arranged in the crystal packing to form ribbons. In the case of 5, DMF molecules replaced the complexes in forming O…HC contacts: in other words, O…HC interactions found between complexes in 6 are substituted by O…HC interactions between DMF molecules and complexes in 6. This induced a disalignment of complexes in 5, with Pd(II) ions not laying on the same line anymore as observed in 6.
3.5. Comparison between the crystal packing of [Ni(H-2L).2n-BuOH] (1) and [Ni(H-2L).2MeOH] (2)
Complexes [Ni(H
-2L)
.2n-BuOH] (1) and [Ni(H
-2L)
.2MeOH] (2) share the same ligand and metal center. They were synthesized by slow evaporation of different solvent mixtures, namely 1:1 (v/v) ACN/BuOH or ACN/MeOH for 1 and 2, respectively. The Ni(II) center in 1 and 2 features different solvent molecules coordinated to the metal ion (BuOH in 1, MeOH in 2) but both the molecular structure [
26] and the solid state assembly of the two complexes are similar. Hirshfeld surfaces and 2D fingerprint plots are indeed quite similar, revealing the presence of only a few tight contacts (
Figures S7 and S8). In particular, H…H and O…H are the shortest interactions present in the crystal packing, according to the sharp spikes in the fingerprint plots (
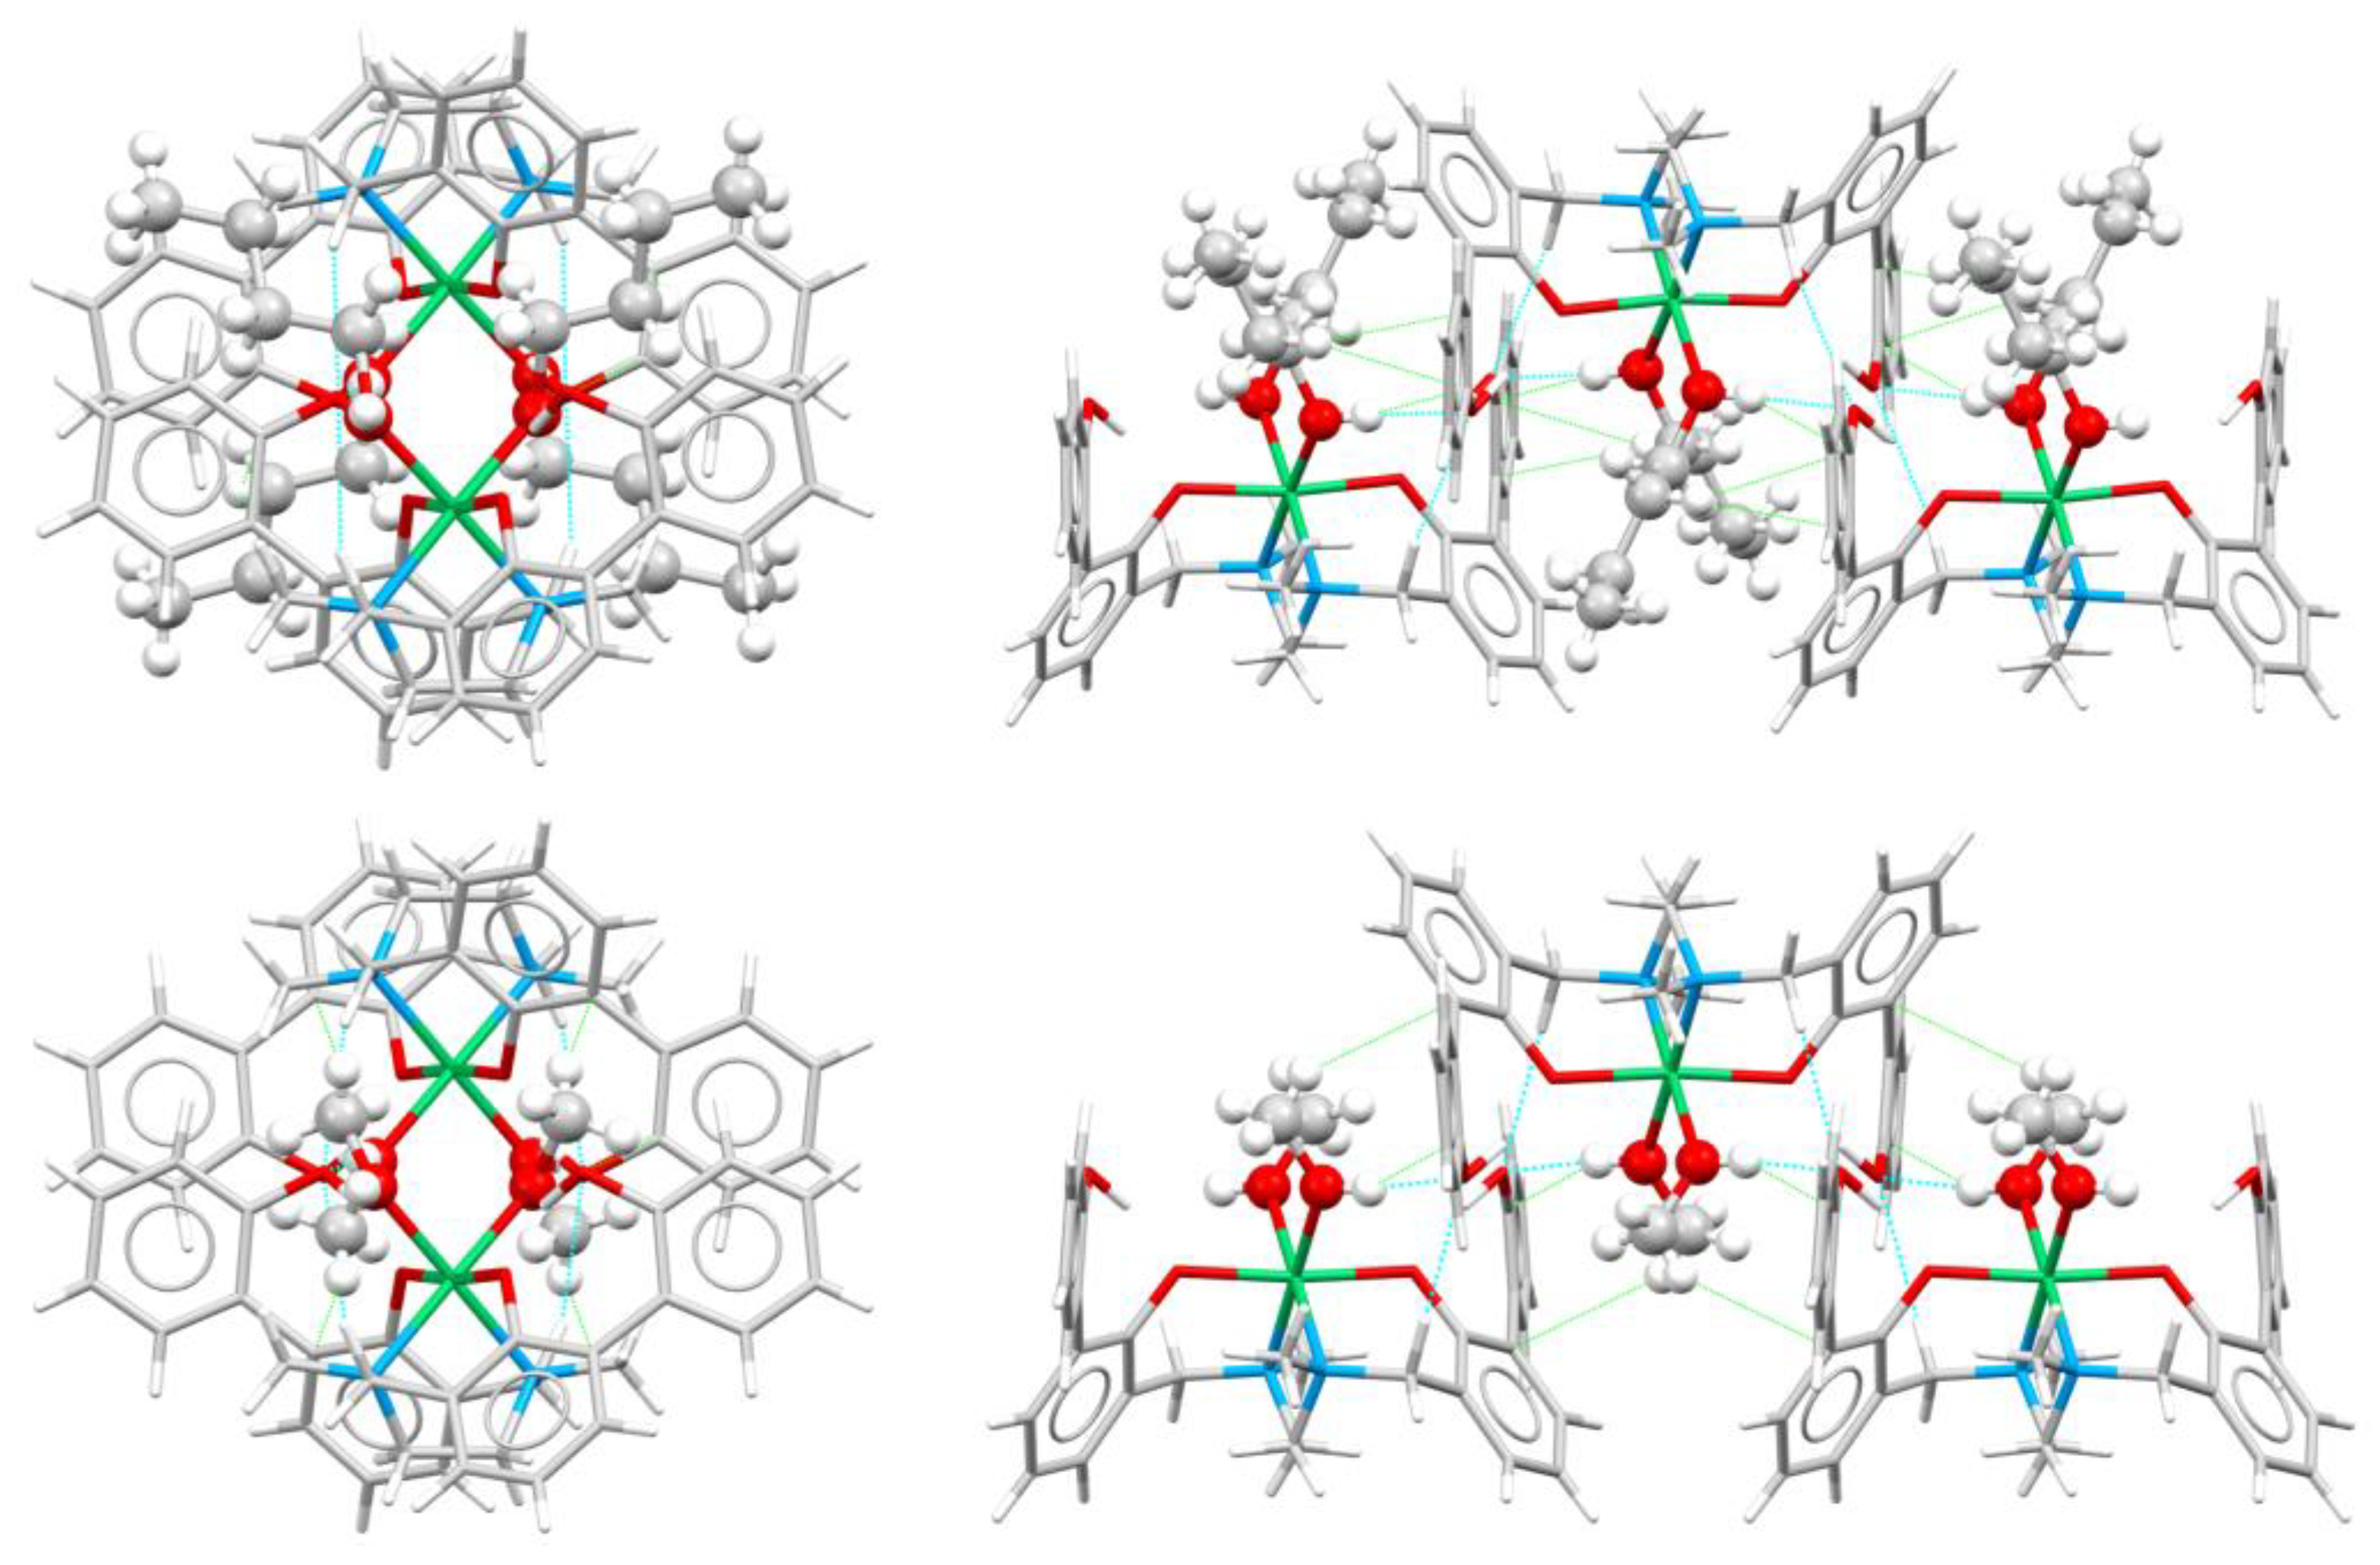
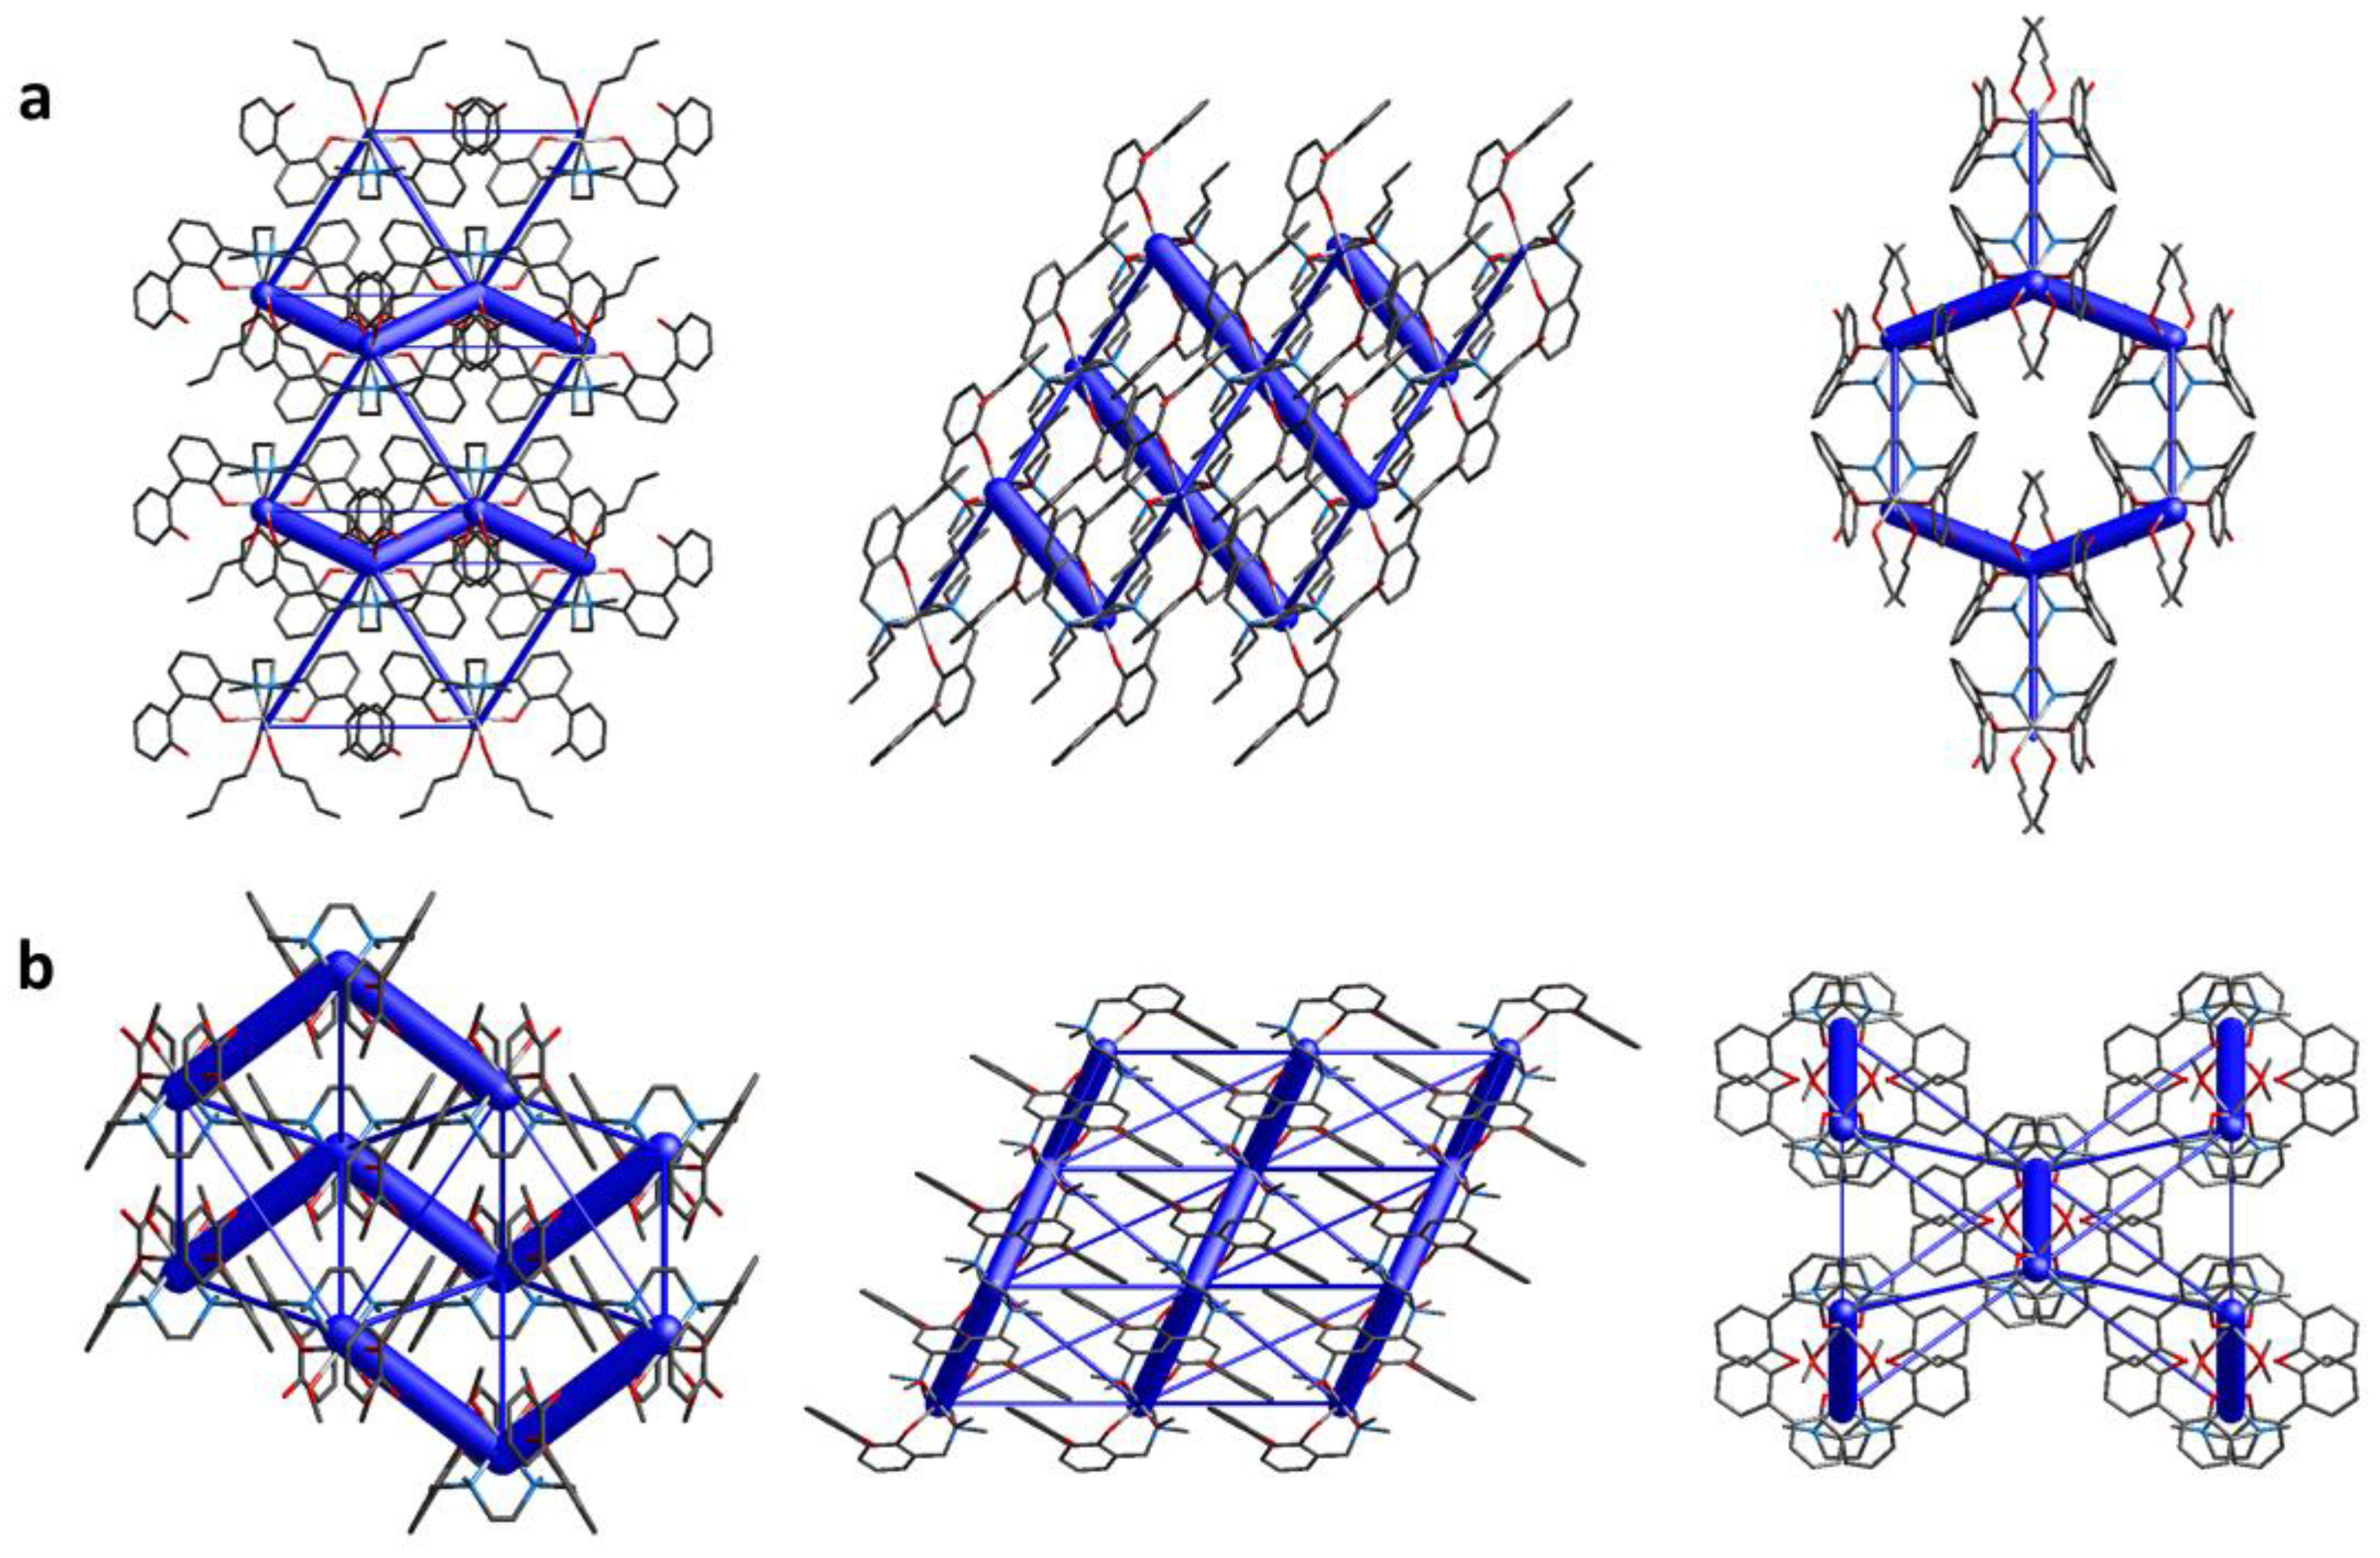
Figure S8). The energy frameworks clearly show that the complexes arrange to form zig-zag ribbons, as in the previous cases, in which molecules are connected through O…HO, O…HC/C…HO and C…HC contacts mainly involving the coordinated solvent molecules and aromatic carbon atoms (
Figure 9 and
Figure 10). In both 1 and 2 the intra-ribbon interaction energies are by far the strongest ones (
Figure 10). Intermolecular interactions within and between ribbons are listed in
Table S4.
In this case, the presence of a different solvent type basically did not affect the solid state assembly, with BuOH and MeOH being interchangeable in the interactions within the crystal packing.
3.6. Comparison between the crystal packing of [Cd(H-2L).2DMF] (3) and [Cu(H-2L).DMF] (4)
Complexes [Cd(H-2L).2DMF] (3) and [Cu(H-2L).DMF] (4) share the same crystallization solvent (1:1 (v/v) ACN/DMF mixture) but contain different metal ions.
Complex (3) contains two molecules of DMF coordinated to Cd(II). Notwithstanding the octahedral environment around the metal center is the same found also in 1 and 2, the molecular structure of 3 is different. Contrarily to what observed for the previously described solid state assemblies (compounds 6, 5, 1 and 2), where the ribbons arrangement was a common feature, the crystal packing of 3 appears quite diverse. The Hirshfeld surface (
Figure S9) and the fingerprint plots (
Figure S10) suggest the presence of a few short contacts, mainly of H…H (70.0%) and C…H (19.8%) type. Intermolecular interactions within the packing are listed in
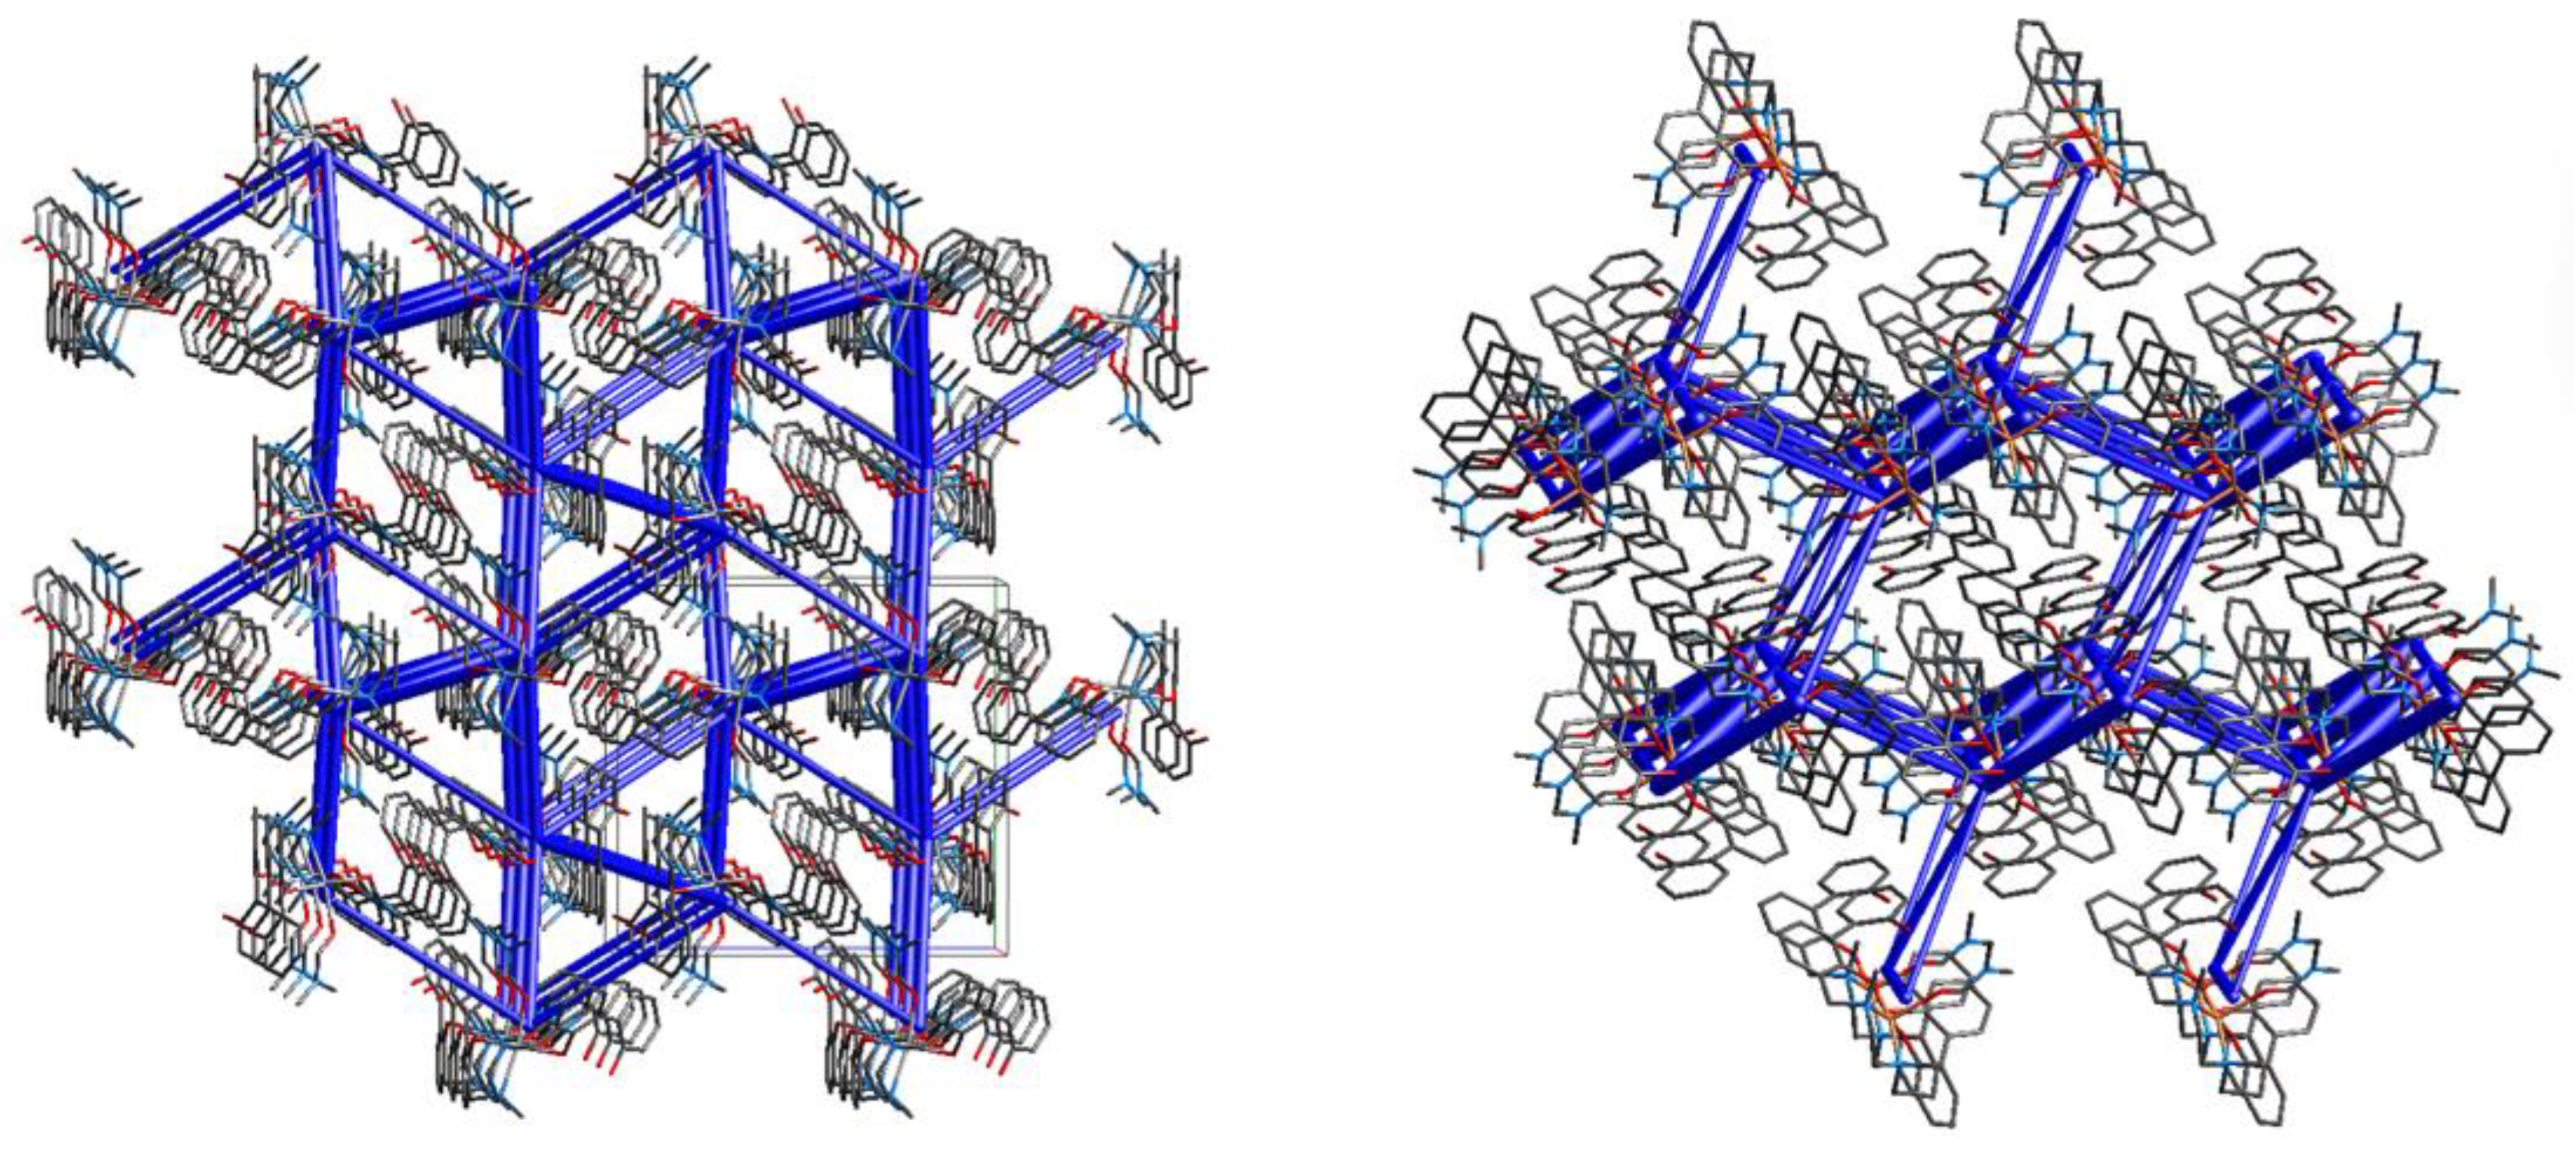
Table S5. Several motifs in the crystal packing show similar interaction energies (
Table 4), for this reason the solid state assembly of 3 can be described as a 3D network with interactions mainly involving the solvent molecules and the aromatic rings of the complexes (
Figure 11, left).
Compound [Cu(H
-2L)
.DMF] (4) contains a DMF molecule coordinated to Cu(II) to form a square pyramid, with the oxygen atom of the DMF occupying the apex. The Hirshfeld surface (
Figure S11) and the fingerprint plots (
Figure S12) show that the shortest contacts present in the crystal packing are H…H interactions. In this case, the DMF molecules are only marginally involved in the intermolecular interactions, that are instead mainly found between aromatic moieties. Intermolecular interactions within the packing are listed in
Table S5. As in the case of compound 3, several motifs in the crystal packing of 4 show similar interaction energies (
Table 4), so the solid state arrangement of compound 4 can be described as an hexagonal net (
Figure 11, right).
5. Conclusions
The newly synthesized Pd(II)-complex 6 has been characterized in the solid state and compared to other five complexes of the same ligand L (1-5), featuring different metal ions. Their solid state assemblies have been studied and compared by Hirshfeld surface analysis, 2D fingerprint plots and energy framework calculations, to assess the intermolecular interactions within each crystal packing, reveal analogies or differences between them and unveiling the role of the metal centers and the solvent molecules in the crystal packing.
By comparing complexes containing the same metal ion, the final outcome could depend on the solvent employed. By comparing Pd(II) complexes (6 and 5), the presence of water in the crystallization solvent gave rise to the pure form 6, contrarily to the DMF solvate 5 obtained by using the sole DMF. This could be due to the possible favorable interaction in 6 between DMF and water, this latter competing with the complex for the interaction with the solvent (DMF). Nevertheless, in both 6 and 5 the molecules assemble in the solid state to form zig-zag ribbons, with the solvent molecules in 5 replacing the interactions found between complexes in 6. Comparing the solid state assemblies of Ni(II) complexes (1 and 2), that feature respectively BuOH or MeOH molecules coordinated to the metal center, again they are similar, being assembled also in these cases as zig-zag ribbons.
By comparing complexes containing different metal ions but obtained from the same solvent mixture, the final outcome could be affected by the metal ion contained in the complex, that indeed drives the molecular conformation. Complexes 3 and 4, featuring respectively a Cd(II) or a Cu(II) metal center, were both obtained by ACN/DMF mixtures. They show crystal packings that differ both among themselves as well as compared to all other compounds. In those cases, the solid state assemblies can be indeed described as 3D networks, with solvent molecules participating in the intermolecular interactions only in the case of complex 3.
From this study, it seems that in this system (L) the transition metal center present in the complex mainly drives the final solid state assembly, while the crystallization solvent only plays a minor role.
Supplementary Materials
The following supporting information can be downloaded at the website of this paper posted on Preprints.org, Table S1: Distances (Å) and angles (°) involving the Pd(II) ion and dihedral angles in compound 6.; Figure S1: Superimposition of the [Pd(H-2L)] complex (6) (ball and stick) and OTIYEX (4) (stick, green); Figure S2: Superimposition of the [Pd(H-2L)] complex (6) (ball and stick) and OTIYIB (5) (stick, pink); Figure S3: Disposition of the two methyl groups in [Pd(H-2L)] (6) (left, yellow) and OTIYIB (5) (right, pale blue); Table S2: Selected interactions within the crystal packing of 6; Figure S4: Energy frameworks of 6 (view along the b (top) and c (bottom) axes). Total energy as blue cylinders, Coulomb energy as red cylinders, dispersion energy as green cylinders; Figure S5: Hirshfeld surface of 5 mapped over shape index (left) and curvedness (right). Magenta ovals refer to π-π stacking interactions; Table S3: Selected interactions within the crystal packing of 5; Figure S6: Energy frameworks of 5 (view along the a (top), b (middle) and c (bottom) axes). Total energy as blue cylinders, Coulomb energy as red cylinders, dispersion energy as green cylinders; Figure S7: Hirshfeld surfaces mapped over dnorm (left), shape index (middle) and curvedness (right) of 1 (top) and 2 (bottom). Globularity: 0.727 (1), 0.777 (2); asphericity: 0.085 (1), 0.136 (2); Figure S8: 2D and decomposed fingerprint plots for compounds 1 (a) and 2 (b); Table S4: Selected interactions within the crystal packing of 1 and 2; Figure S9: Hirshfeld surfaces mapped over dnorm (left), shape index (middle) and curvedness (right) of 3. Front (top) and back (bottom) views. Globularity: 0.751; asphericity: 0.008; Figure S10: 2D and decomposed fingerprint plots for compound 3; Figure S11: Hirshfeld surfaces mapped over dnorm (left), shape index (middle) and curvedness (right) of 4. Front (top) and back (bottom) views. Globularity: 0.531; asphericity: 0.050; Figure S12: 2D and decomposed fingerprint plots for compound 4; Table S5: Selected interactions within the crystal packing of 3 and 4.
Funding
This work has been funded by the European Union - NextGenerationEU - under the Italian Ministry of University and Research (MUR) National Innovation Ecosystem grant ECS00000041 - VITALITY - CUP [H33C22000430006]; by the Italian Ministero dell’Istruzione dell’Università e della Ricerca (MIUR, projects 20173X8WA4 and 2017EKCS35); by University of Urbino (Department of Pure and Applied Sciences – Grant DISPEA_Macedi_Prog21).
Data Availability Statement
Data presented in this study are available on request from the corresponding author.
Acknowledgments
CRIST (Centro di Cristallografia Strutturale, University of Florence), where the X-ray diffraction data were collected, is greatly acknowledged.
Conflicts of Interest
The authors declare no conflict of interest.
References
- Gavezzotti, A. Molecular Aggregation: Structure Analysis and Molecular Simulation of Crystals and Liquids; Oxford University Press, 2006; ISBN 9780198570806.
- Mullin, J.W. Crystallization; Mullin, J.W.B.T.-C. (Fourth E., Ed.; 4th ed.; Butterworth-Heinemann: Oxford, 2001; ISBN 978-0-7506-4833-2.
- Bøjesen, E.D.; Iversen, B.B. The Chemistry of Nucleation. CrystEngComm 2016, 18, 8332–8353. [CrossRef]
- Macedi, E.; Meli, A.; De Riccardis, F.; Rossi, P.; Smith, V.J.; Barbour, L.J.; Izzo, I.; Tedesco, C. Molecular Recognition and Solvatomorphism of a Cyclic Peptoid: Formation of a Stable 1D Porous Framework. CrystEngComm 2017, 19, 4704–4708. [CrossRef]
- Meli, A.; Macedi, E.; De Riccardis, F.; Incent, V.; Smith, J.; Barbour, L.; Izzo, I.; Tedesco, C. Solid-State Conformational Flexibility at Work: Zipping and Unzipping within a Cyclic Peptoid Single Crystal. Angew. Chemie 2016, 128, 4757–4760. [CrossRef]
- Chen, J.; Wang, J.; Ulrich, J.; Yin, Q.; Xue, L. Effect of Solvent on the Crystal Structure and Habit of Hydrocortisone. Cryst. Growth Des. 2008, 8, 1490–1494. [CrossRef]
- Mirocki, A.; Sikorski, A. The Influence of Solvent on the Crystal Packing of Ethacridinium Phthalate Solvates. Materials (Basel). 2020, 13, 1–13. [CrossRef]
- Grześkiewicz, A.M.; Ostrowska, A.; Kubicki, M. Solvent Influence on the Crystal Packing of 6-Aminothiocytosine. Acta Crystallogr. Sect. C Struct. Chem. 2020, 76, 250–257. [CrossRef]
- Wang, H.; Lin, Q.; Dou, X.; Yang, T.; Han, Y. A Different View of Solvent Effects in Crystallization. Crystals 2017, 7, 357. [CrossRef]
- Zhu, S.F.; Zhang, S.H.; Gou, R.J.; Wu, C.L.; Han, G.; Jia, H.Y. Understanding the Effect of Solvent on the Growth and Crystal Morphology of MTNP/CL-20 Cocrystal Explosive: Experimental and Theoretical Studies. Cryst. Res. Technol. 2018, 53, 1700299. [CrossRef]
- Rosbottom, I.; Ma, C.Y.; Turner, T.D.; O’connell, R.A.; Loughrey, J.; Sadiq, G.; Davey, # R J; Roberts, K.J. Influence of Solvent Composition on the Crystal Morphology and Structure of P-Aminobenzoic Acid Crystallized from Mixed Ethanol and Nitromethane Solutions. Cryst. Growth Des. 2017, 17, 4151–4161. [CrossRef]
- Sun, X.P.; Wei, R.J.; Yao, Z.S.; Tao, J. Solvent Effects on the Structural Packing and Spin-Crossover Properties of a Mononuclear Iron(II) Complex. Cryst. Growth Des. 2018, 18, 6853–6862. [CrossRef]
- Montis, R.; Fusaro, L.; Falqui, A.; Hursthouse, M.B.; Tumanov, N.; Coles, S.J.; Threlfall, T.L.; Horton, P.N.; Sougrat, R.; Lafontaine, A.; et al. Complex Structures Arising from the Self-Assembly of a Simple Organic Salt. Nature 2021, 590, 275–278. [CrossRef]
- Fusaro, L.; Tumanov, N.; Saielli, G.; Montis, R. Insights into the Self-Assembly of Fampridine Hydrochloride: How the Choice of the Solvent Affects the Crystallization of a Simple Salt. Pure Appl. Chem. 2023. [CrossRef]
- Borgogelli, E.; Formica, M.; Fusi, V.; Giorgi, L.; Macedi, E.; Micheloni, M.; Paoli, P.; Rossi, P. Preorganizing Binding Side-Arms on a Cyclen Scaffold: The Choice of a Suitable Metal Ion. Dalt. Trans. 2013, 42, 2902–2912. [CrossRef]
- Benelli, C.; Borgogelli, E.; Formica, M.; Fusi, V.; Giorgi, L.; Macedi, E.; Micheloni, M.; Paoli, P.; Rossi, P. Di-Maltol-Polyamine Ligands to Form Heterotrinuclear Metal Complexes: Solid State, Aqueous Solution and Magnetic Characterization. Dalt. Trans. 2013, 42, 5848–5859. [CrossRef]
- Amatori, S.; Ambrosi, G.; Fanelli, M.; Formica, M.; Fusi, V.; Giorgi, L.; Macedi, E.; Micheloni, M.; Paoli, P.; Rossi, P. A Preorganized Metalloreceptor for Alkaline Earth Ions Showing Calcium versus Magnesium Selectivity in Water: Biological Activity of Selected Metal Complexes. Chem. - A Eur. J. 2014, 20, 11048–11057. [CrossRef]
- Macedi, E.; Paderni, D.; Formica, M.; Conti, L.; Fanelli, M.; Giorgi, L.; Amatori, S.; Ambrosi, G.; Valtancoli, B.; Fusi, V. Playing with Structural Parameters: Synthesis and Characterization of Two New Maltol-Based Ligands with Binding and Antineoplastic Properties. Molecules 2020, 25, 943. [CrossRef]
- Ambrosi, G.; Dapporto, P.; Formica, M.; Fusi, V.; Giorgi, L.; Guerri, A.; Micheloni, M.; Paoli, P.; Pontellini, R.; Rossi[, P. Molecular Switch Triggered by Solvent Polarity : Synthesis ,Acid ± Base Behavior, Alkali Metal Ion Complexation, and Crystal Structure. Chem. - A Eur. J. 2003, 9, 800–810. [CrossRef]
- Kondo, S.; Saruhashi, K.; Seki, K.; Matsubara, K.; Miyaji, K.; Kubo, T.; Matsumoto, K.; Katsuki, T. A m -Oxo- m - h 2 : H 2 -Peroxo Titanium Complex as a Reservoir of Active Species in Asymmetric Epoxidation Using Hydrogen Peroxide. Asymmetric Catal. 2008, 47, 10195–10198. [CrossRef]
- Talsi, E.P.; Rybalova, T. V; Bryliakov, K.P. Ti-Salalen Mediated Asymmetric Epoxidation of Olefins with H 2 O 2 : Effect of Ligand on the Catalytic Performance , and Insight into the Oxidation Mechanism. J. Mol. Catal. A Chem. 2016, 421, 131–137. [CrossRef]
- Zhang, W.; Zhang, W.; Wang, R.; Ren, C.; Li, Q.; Fan, Y.; Liu, B.; Liu, P.; Wang, Y. Effect of Coordinated Solvent Molecules on Metal Coordination Sphere and Solvent-Induced Transformations. Cryst. Growth Des. 2017, 17, 517–526. [CrossRef]
- Li, Q.-Q.; Liu, H.; Zheng, T.-T.; Liu, P.; Song, J.-X.; Wang, Y.-Y. The Effect of Coordinated Solvent Molecules on Metal Coordination Environments in Single-Crystal-to-Single-Crystal Transformations. CrystEngComm 2020, 22, 6750–6775. [CrossRef]
- Racioppi, S.; Orian, L.; Tubaro, C.; Gennaro, A.; Isse, A.A. Solvent Coordination Effect on Copper-Based Molecular Catalysts for Controlled Radical Polymerization. Catalysts 2022, 12, 1656.
- Singh, R.; Kociok-Kohn, G.; Singh, K.; Pandey, S.K.; Singh, L. Influence of Ligand Coordination , Solvent, and Non-Covalent Interaction on the Structural Outcomes in Coordination Polymers with Direct Cd ( II ) -Alkanesulfonate Bonds : A Combined Experimental and Computational Study. J. Solid State Chem. 2019, 280, 120992. [CrossRef]
- Ambrosi, G.; Formica, M.; Fusi, V.; Giorgi, L.; Macedi, E.; Micheloni, M.; Paoli, P.; Rossi, P. A Biphenol-Based Chemosensor for ZnII and CdII Metal Ions: Synthesis, Potentiometric Studies, and Crystal Structures. Inorg. Chem. 2016, 55, 7676–7687. [CrossRef]
- Groom, C.R.; Bruno, I.J.; Lightfoot, M.P.; Ward, S.C. The Cambridge Structural Database. Acta Cryst Sect. B Struct. Sci. Cryst. Eng. Mater. 2016, 72, 171–179. [CrossRef]
- Spackman, P.R.; Turner, M.J.; McKinnon, J.J.; Wolff, S.K.; Grimwood, D.J.; Jayatilaka, D.; Spackman, M.A. CrystalExplorer: A Program for Hirshfeld Surface Analysis, Visualization and Quantitative Analysis of Molecular Crystals. J. Appl. Crystallogr. 2021, 54, 1006–1011. [CrossRef]
- Mackenzie, C.F.; Spackman, P.R.; Jayatilaka, D.; Spackman, M.A. CrystalExplorer Model Energies and Energy Frameworks: Extension to Metal Coordination Compounds, Organic Salts, Solvates and Open-Shell Systems. IUCrJ 2017, 4, 575–587. [CrossRef]
- CrysAlisPro v. 1.171.35.19 (Release 27-10-2011) CrysAlis171.NET.
- Burla, M.C.; Caliandro, R.; Camalli, M.; Carrozzini, B.; Cascarano, G.L.; De Caro, L.; Giacovazzo, C.; Polidori, G.; Spagna, R. SIR2004: An Improved Tool for Crystal Structure Determination and Refinement. J. Appl. Crystallogr. 2005, 38, 381–388. [CrossRef]
- Sheldrick, G.M.; IUCr Crystal Structure Refinement with SHELXL. Acta Crystallogr. Sect. C Struct. Chem. 2015, 71, 3–8. [CrossRef]
- Nardelli, M.; IUCr PARST95 – an Update to PARST: A System of Fortran Routines for Calculating Molecular Structure Parameters from the Results of Crystal Structure Analyses. J. Appl. Cryst. 1995, 28, 659–659. [CrossRef]
- MacRae, C.F.; Sovago, I.; Cottrell, S.J.; Galek, P.T.A.; McCabe, P.; Pidcock, E.; Platings, M.; Shields, G.P.; Stevens, J.S.; Towler, M.; et al. Mercury 4.0: From Visualization to Analysis, Design and Prediction. J. Appl. Cryst. 2020, 53, 226–235. [CrossRef]
- Dassault Systèmes BIOVIA. Discovery Visualizer Discovery Visualizer 2019.
-
Of the 187 Fragments Observed in 120 Hits, 76% Have a [R,S] Topology, While the Remaining 24% Shows a [R,R]/[S,S] One;
- Tan, S.L.; Jotani, M.M.; Tiekink, E.R.T. Utilizing Hirshfeld Surface Calculations, Non-Covalent Inter action (NCI) Plots and the Calculation of Inter action Energies in the Analysis of Mol ecular Packing. Acta Crystallogr. Sect. E Crystallogr. Commun. 2019, 75, 308. [CrossRef]
- Koenderink, J.J.; van Doorn, A.J. Surface Shape and Curvature Scales. Image Vis. Comput. 1992, 10, 557–564. [CrossRef]
Figure 1.
Left: ball and stick view of the asymmetric unit of [Pd(H−2L)] (6) along with atom labelling (non-H atoms); right: dihedral angles defining the H-2L-2 conformation and mean planes containing the aromatic rings (blue: C2-C7; orange: C8-C13; green: C19-C24; violet: C25-C30).
Figure 1.
Left: ball and stick view of the asymmetric unit of [Pd(H−2L)] (6) along with atom labelling (non-H atoms); right: dihedral angles defining the H-2L-2 conformation and mean planes containing the aromatic rings (blue: C2-C7; orange: C8-C13; green: C19-C24; violet: C25-C30).
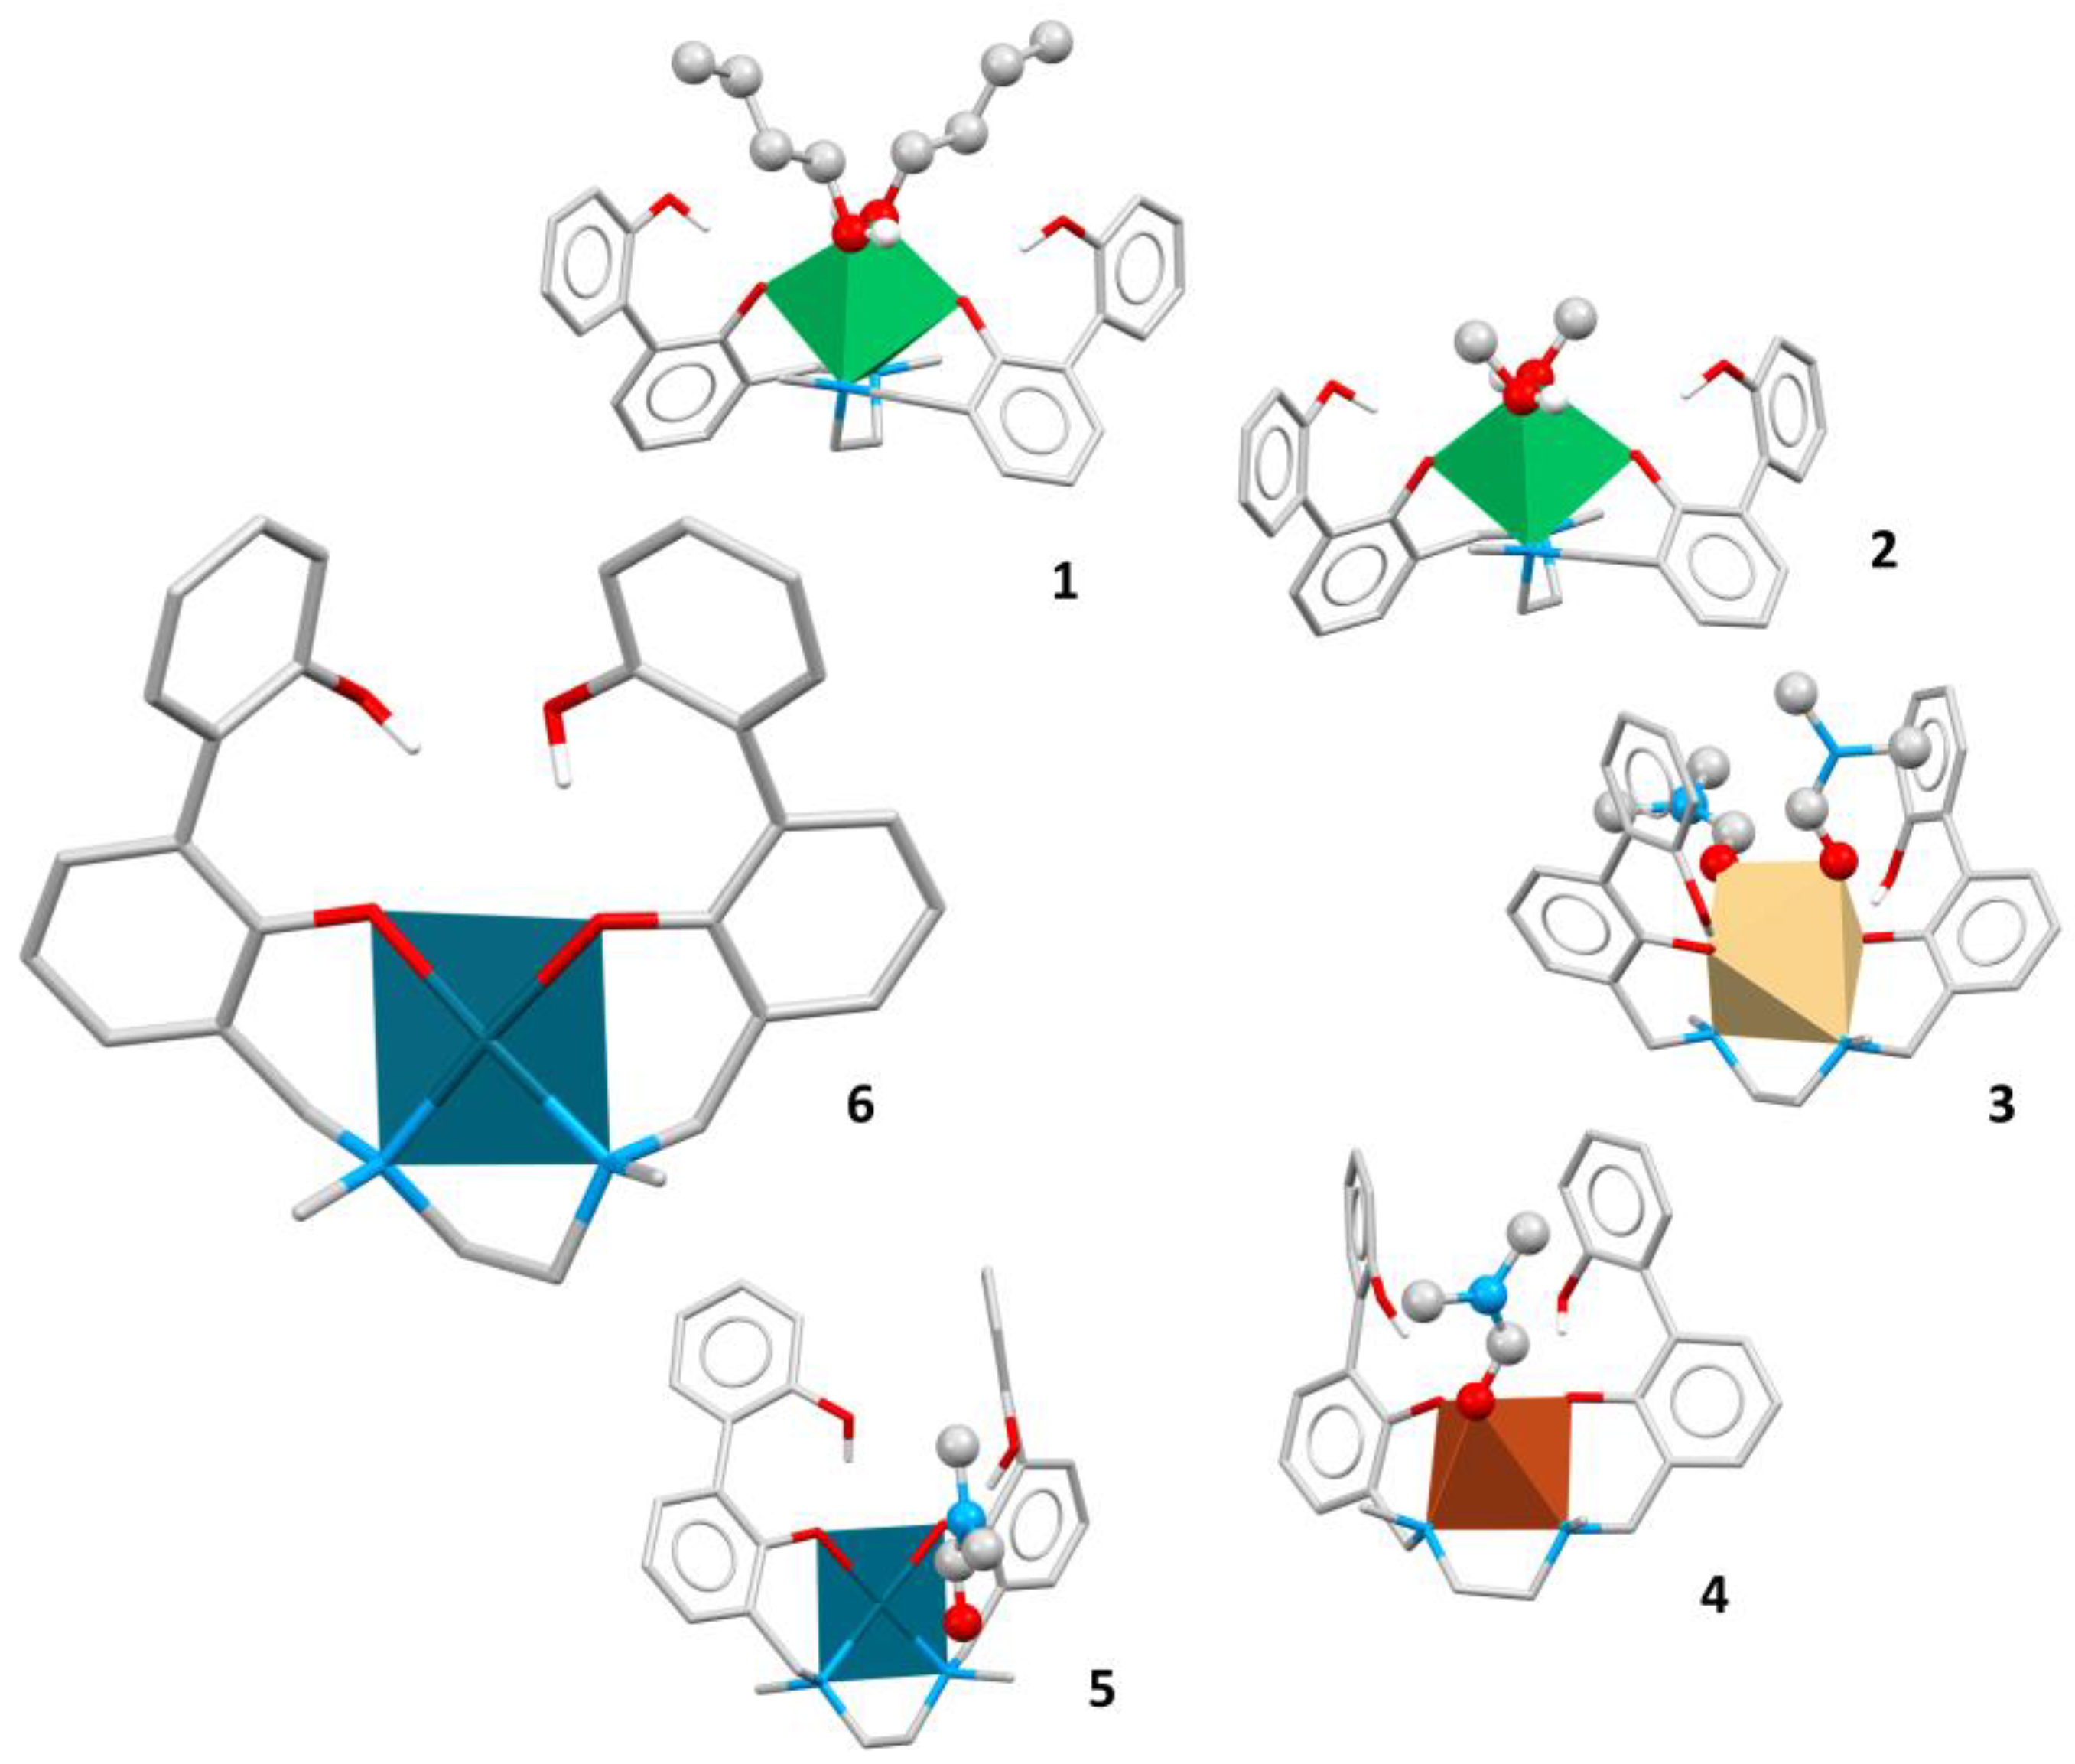
Figure 2.
Molecular structures of complexes [Pd(H-2L)] (6), [Ni(H-2L).2n-BuOH] (1), [Ni(H-2L).2MeOH] (2), [Cd(H-2L).2DMF] (3), [Cu(H-2L).DMF] (4) and [Pd(H-2L).DMF] (5). Molecules are in stick style, except for solvent (ball and stick) and metal (polyhedral) atoms.
Figure 2.
Molecular structures of complexes [Pd(H-2L)] (6), [Ni(H-2L).2n-BuOH] (1), [Ni(H-2L).2MeOH] (2), [Cd(H-2L).2DMF] (3), [Cu(H-2L).DMF] (4) and [Pd(H-2L).DMF] (5). Molecules are in stick style, except for solvent (ball and stick) and metal (polyhedral) atoms.
Figure 3.
Hirshfeld surfaces mapped over dnorm of 6 (a) and 5 (b). Front (left) and back (right) views.
Figure 3.
Hirshfeld surfaces mapped over dnorm of 6 (a) and 5 (b). Front (left) and back (right) views.
Figure 4.
Hirshfeld surface of 6 mapped over shape index (left) and curvedness (right). Top: front view; bottom: back views.
Figure 4.
Hirshfeld surface of 6 mapped over shape index (left) and curvedness (right). Top: front view; bottom: back views.
Figure 5.
View of a ribbon in compounds 6 (a) and 5 (b). Left: front view, right: side view. O…HC contacts in light blue, C…HC contacts in light green, Pd…H contacts in magenta. Molecules are in stick style, except for solvent atoms (ball and stick).
Figure 5.
View of a ribbon in compounds 6 (a) and 5 (b). Left: front view, right: side view. O…HC contacts in light blue, C…HC contacts in light green, Pd…H contacts in magenta. Molecules are in stick style, except for solvent atoms (ball and stick).
Figure 6.
2D and decomposed fingerprint plots for compounds 6 (a) and 5 (b).
Figure 6.
2D and decomposed fingerprint plots for compounds 6 (a) and 5 (b).
Figure 7.
Energy frameworks of 6 as viewed along the a (left) and b (right) axes. Total energies are shown as blue cylinders.
Figure 7.
Energy frameworks of 6 as viewed along the a (left) and b (right) axes. Total energies are shown as blue cylinders.
Figure 8.
Energy frameworks of 5 as viewed along the a (left) and b (right) axes. Total energies are shown as blue cylinders.
Figure 8.
Energy frameworks of 5 as viewed along the a (left) and b (right) axes. Total energies are shown as blue cylinders.
Figure 9.
Left: front view of a ribbon in compounds 1 (top) and 2 (bottom). Right: side view of the ribbons in 1 (top) and 2 (bottom). Complexes in stick style, BuOH/MeOH in ball and stick style. O…H contacts in light blue, C…H contacts in light green.
Figure 9.
Left: front view of a ribbon in compounds 1 (top) and 2 (bottom). Right: side view of the ribbons in 1 (top) and 2 (bottom). Complexes in stick style, BuOH/MeOH in ball and stick style. O…H contacts in light blue, C…H contacts in light green.
Figure 10.
Energy frameworks for 1 (top) and 2 (bottom). Total energies are shown as blue cylinders along the a (left), b (middle) and c (right) axes.
Figure 10.
Energy frameworks for 1 (top) and 2 (bottom). Total energies are shown as blue cylinders along the a (left), b (middle) and c (right) axes.
Figure 11.
Energy frameworks for 3 (left) and 4 (right). Total energies are shown as blue cylinders. The table shows the total energy values (Etot, kJ/mol). R is the distance between molecular centroids in Å.
Figure 11.
Energy frameworks for 3 (left) and 4 (right). Total energies are shown as blue cylinders. The table shows the total energy values (Etot, kJ/mol). R is the distance between molecular centroids in Å.
Table 1.
Crystallographic data and refinement parameters for [Pd(H-2L)] (6).
Table 1.
Crystallographic data and refinement parameters for [Pd(H-2L)] (6).
| Empirical formula |
C30H30N2O4Pd |
| Formula weight |
588.96 |
| T (K) |
150 |
| Crystal system, space group |
Orthorhombic, Pn21a |
| λ (Å) |
0.71073 |
| Unit cell dimensions (Å) |
a = 9.3718(8)
b = 22.849(2)
c = 11.831(18) |
|
V (Å3) |
2533.4(4) |
| Z, dcalc (g/cm3) |
4, 1.544 |
| μ (mm-1) |
0.773 |
| F(000) |
1208 |
| Reflections collected/unique |
14526 / 5138 |
| Data/parameters |
5138 / 341 |
| Final R indices [I>2σ(I)] |
R1 = 0.0799, wR2 = 0.1766 |
| R indices all data |
R1 = 0.1161, wR2 = 0.2065 |
| GoF |
1.078 |
Table 2.
Complexes analyzed in this study (
1-
5 from ref. [
26]), solvents used in the crystallization and present within the crystal packing.
Table 2.
Complexes analyzed in this study (
1-
5 from ref. [
26]), solvents used in the crystallization and present within the crystal packing.
| Complex |
CSD Refcode |
Crystallization
solvent |
Solvent in
the structure |
| [Ni(H-2L).2n-BuOH] (1)
|
OTIXOG |
ACN, BuOH |
BuOH |
| [Ni(H-2L).2MeOH] (2)
|
OTIXUM |
ACN, MeOH |
MeOH |
| [Cd(H-2L).2DMF] (3)
|
OTIYAT |
ACN, DMF |
DMF |
| [Cu(H-2L).DMF] (4)
|
OTIYEX |
ACN, DMF |
DMF |
| [Pd(H-2L).DMF] (5)
|
OTIYIB |
DMF |
DMF |
| [Pd(H-2L)] (6)
|
|
DMF, H2O |
/ |
Table 3.
Selected plane // plane distances and angles and H-bond interactions in [Pd(H-2L)] (6), OTIYEX (4) and OTIYIB (5).
Table 3.
Selected plane // plane distances and angles and H-bond interactions in [Pd(H-2L)] (6), OTIYEX (4) and OTIYIB (5).
| |
[Pd(H-2L)] (6) |
OTIYEX (4) 2
|
OTIYIB (5) 2
|
| Plane/plane angle (°) |
|
|
|
| C2-C7//C8-C13 (blue//orange) 1
|
52.2(5) |
40 |
47 |
| C2-C7//C19-C24 (blue//green) |
29.0(6) |
31 |
32 |
| C8-C13//C25-C30 (orange//violet) |
64.3(5) |
39 |
78 |
| C19-C24//C25-C30 (green//violet) |
43.3(6) |
37 |
48 |
| Centroid…centroid distance (Å) |
|
|
|
| (C2-C7)…(C19-C24) |
7.94(1) |
7.78 |
8.17 |
| (C8-C13)…(C25-C30) |
5.65(1) |
5.34 |
5.27 |
| H-bond intramolecular interactions |
|
|
|
| D-H…A |
D…A (Å) / H…A (Å) / D-H…A (°) |
| O4-H4O...O3 |
2.54(2)/1.72(5)/
168(2) |
2.530(4)/1.70(5)/
166(4) 2
|
2.576(3)/1.65(4)/
158(4) 2
|
| O2-H2O...O1 |
2.62(2)/2.05(9)/
124(7) |
2.508(3)/1.80(4)/
165(4) 2
|
2.544(3)/1.71(4)/161(4) 2
|
Table 4.
Interaction energy values (Etot, kJ/mol) and distance between molecular centroids (R, Å) for compounds 1-6.
Table 4.
Interaction energy values (Etot, kJ/mol) and distance between molecular centroids (R, Å) for compounds 1-6.
| 1 |
2 |
3 |
4 |
5 |
6 |
| R |
Etot |
R |
Etot |
R |
Etot |
R |
Etot |
R |
Etot |
R |
Etot |
| 7.47 |
-171.0 |
7.69 |
-174.6 |
8.70 |
-68.8 |
7.80 |
-86.2 |
7.01 |
-133.5 |
5.42 |
-228.3 |
| 9.79 |
-40.9 |
9.56 |
-28.4 |
10.34 |
-64.4 |
9.92 |
-56.2 |
4.45 |
-75.0 |
11.83 |
-34.7 |
| 12.5 |
-23.4 |
11.92 |
-23.7 |
11.25 |
-44.3 |
9.24 |
-45.1 |
10.73 |
-34.5 |
10.23 |
-23.5 |
| |
|
14.15 |
-22.3 |
11.28 |
-42.2 |
10.27 |
-40.8 |
10.45 |
-34.5 |
|
|
| |
|
|
|
11.47 |
-26.4 |
11.05 |
-31.5 |
6.53 |
-27.8 |
|
|
|
Disclaimer/Publisher’s Note: The statements, opinions and data contained in all publications are solely those of the individual author(s) and contributor(s) and not of MDPI and/or the editor(s). MDPI and/or the editor(s) disclaim responsibility for any injury to people or property resulting from any ideas, methods, instructions or products referred to in the content. |
© 2023 by the authors. Licensee MDPI, Basel, Switzerland. This article is an open access article distributed under the terms and conditions of the Creative Commons Attribution (CC BY) license (http://creativecommons.org/licenses/by/4.0/).
