1. Introduction
Most human motor impairment and dysfunctions originate in the nervous system and the signal transmission between neurons is electrochemical. In this context, electrophysiology studies how these interactions work and an important procedure that is used in this branch of neuroscience is deep brain stimulation (DBS). DBS is a treatment that uses an electrode attached to an implantable pulse generator (IPG) or a neurostimulator that generates electrical Impulses inside the brain and, therefore, the central nervous system recovers partially or totally motor functions in patients with neurological diseases such as Parkinson and essential tremors.
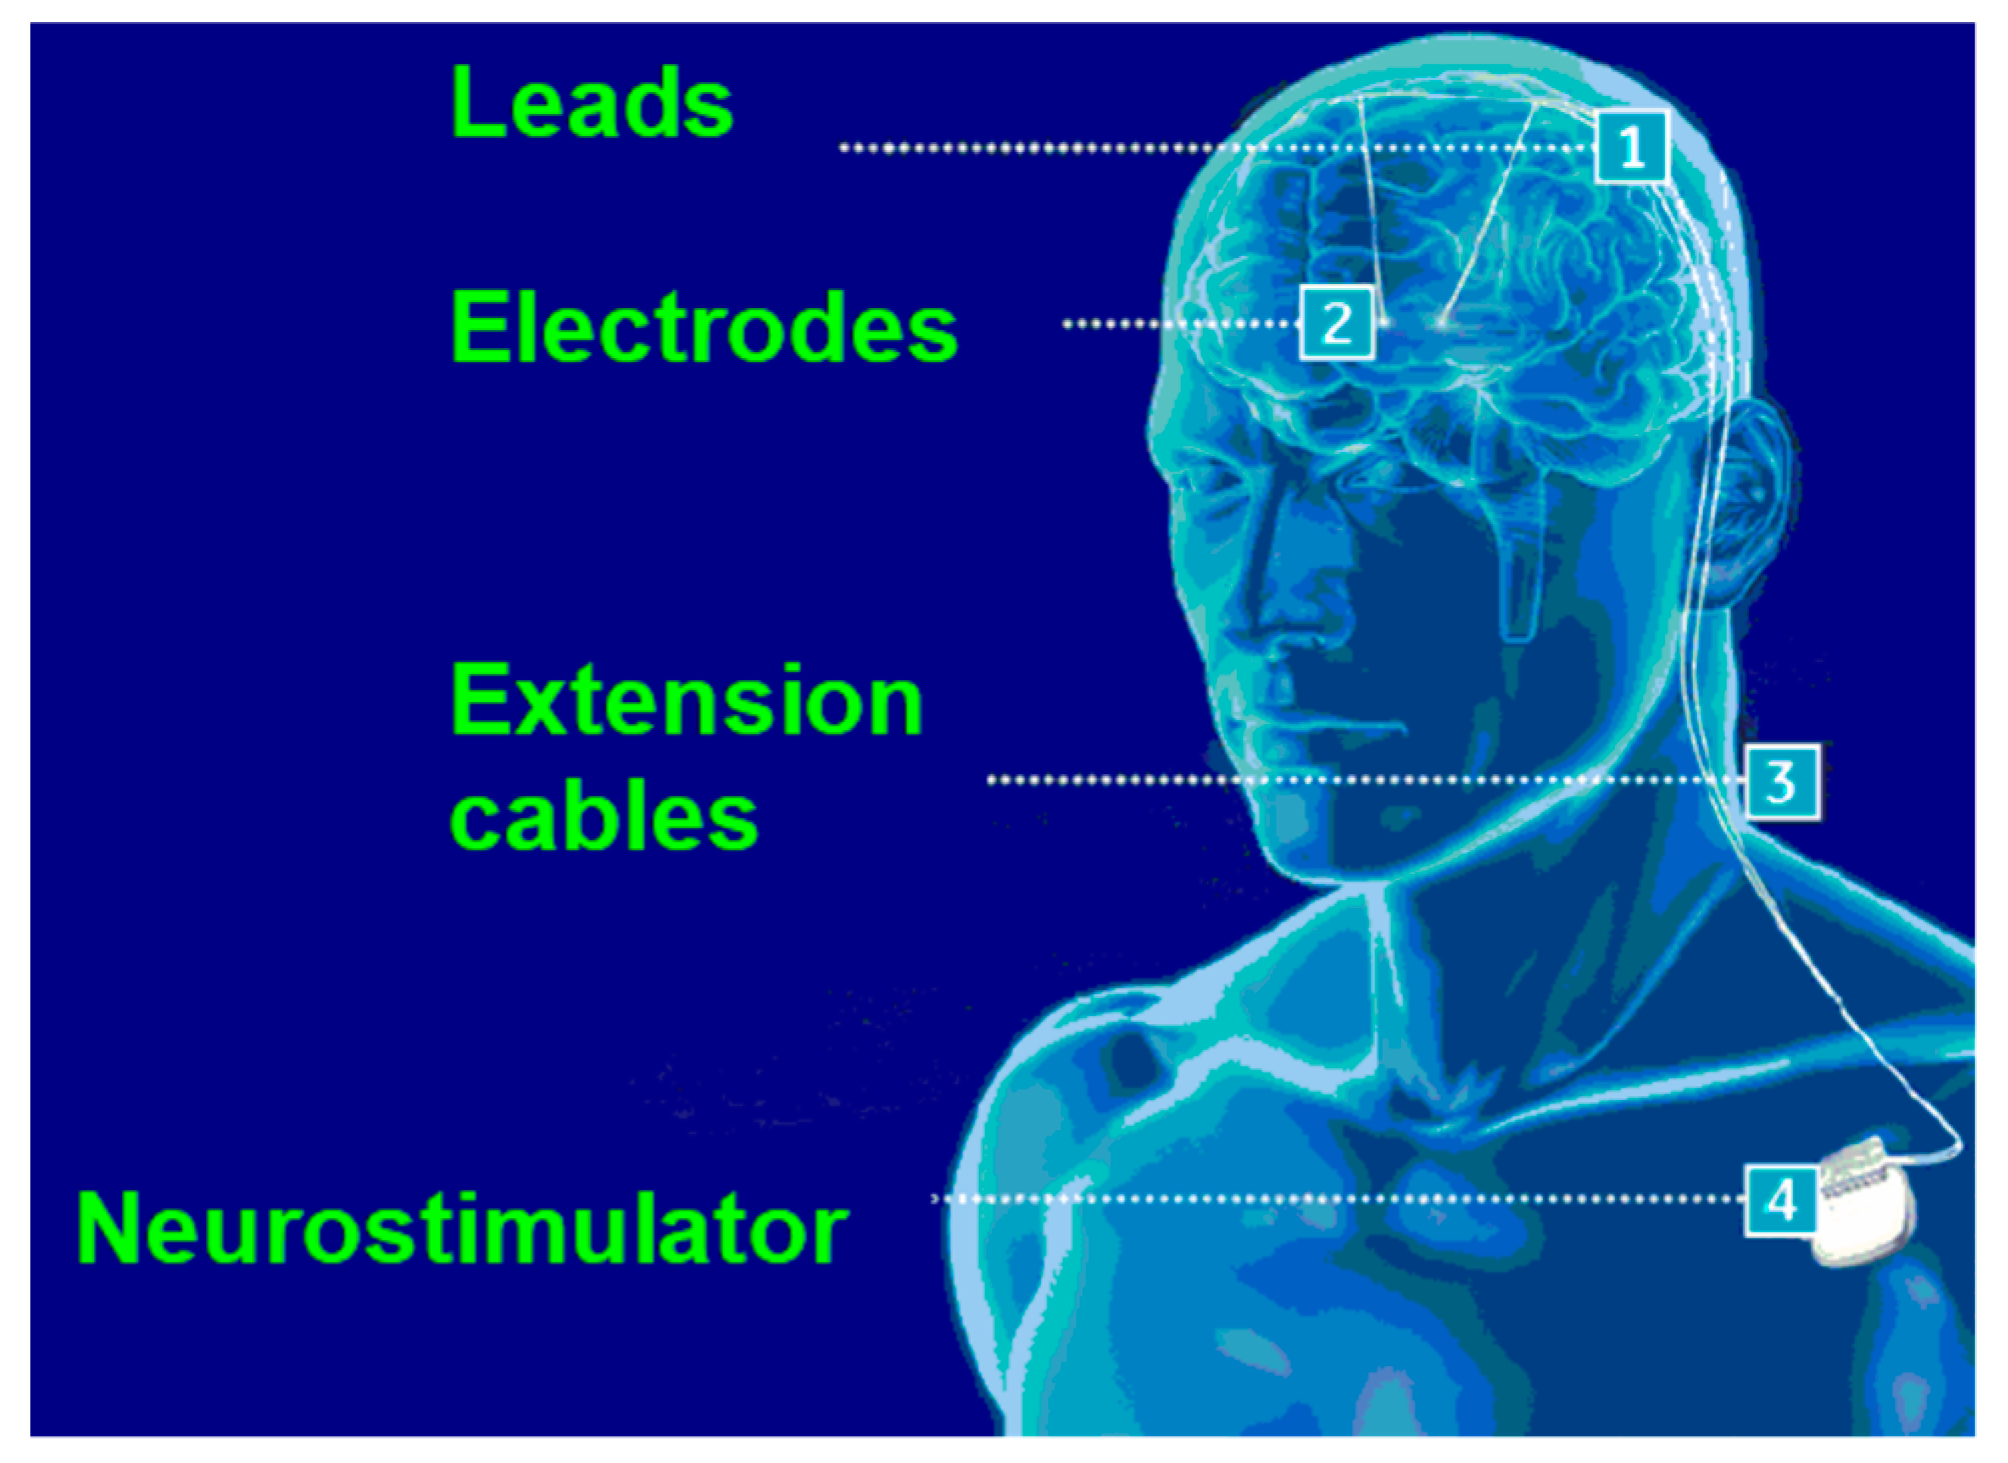
Figure 1 depicts the concept and positioning of a DBS system.
The IPG can be controlled either by electrical current or voltage. The impedance between the brain and the IPG cannot be precisely controlled, and they vary right after the and the clinical response to the DBS is defined by the amount of charge that is injected in the brain cells [
4]. As a consequence, the first DBS systems that used voltage-controlled IPGs are not as safe as current-controlled IPGs that are used nowadays since the systems controlled by electric current. In addition to that, the balance of charges inside the brain should be maintained, otherwise, severe damage may be caused to the brain [
3].
The application of DBS in motor rehabilitation is an alternative to treatments that uses remedy and surgery to remove some of the symptoms of motor impairments. The first surgery procedures used to reduce tremors caused damage to the brain and subsequent procedures involved the use of Levodopa which is a remedy that relieves involuntary movements [
4]. However, Levodopa had collateral effects such as psychosis and hallucinations. As a solution that doesn’t harm the brain and doesn’t create psychological dysfunctions, DBS was successfully used to treat Parkinson's disease [
7,
8], essential tremors [
9,
10], dystonia [
11,
12] and chronic pain [
13,
14]. Furthermore, DBS is also used to treat behavioral dysfunctions such as obsessive-compulsive disorder [
15], obesity [
16] and depression [
17,
18,
19].
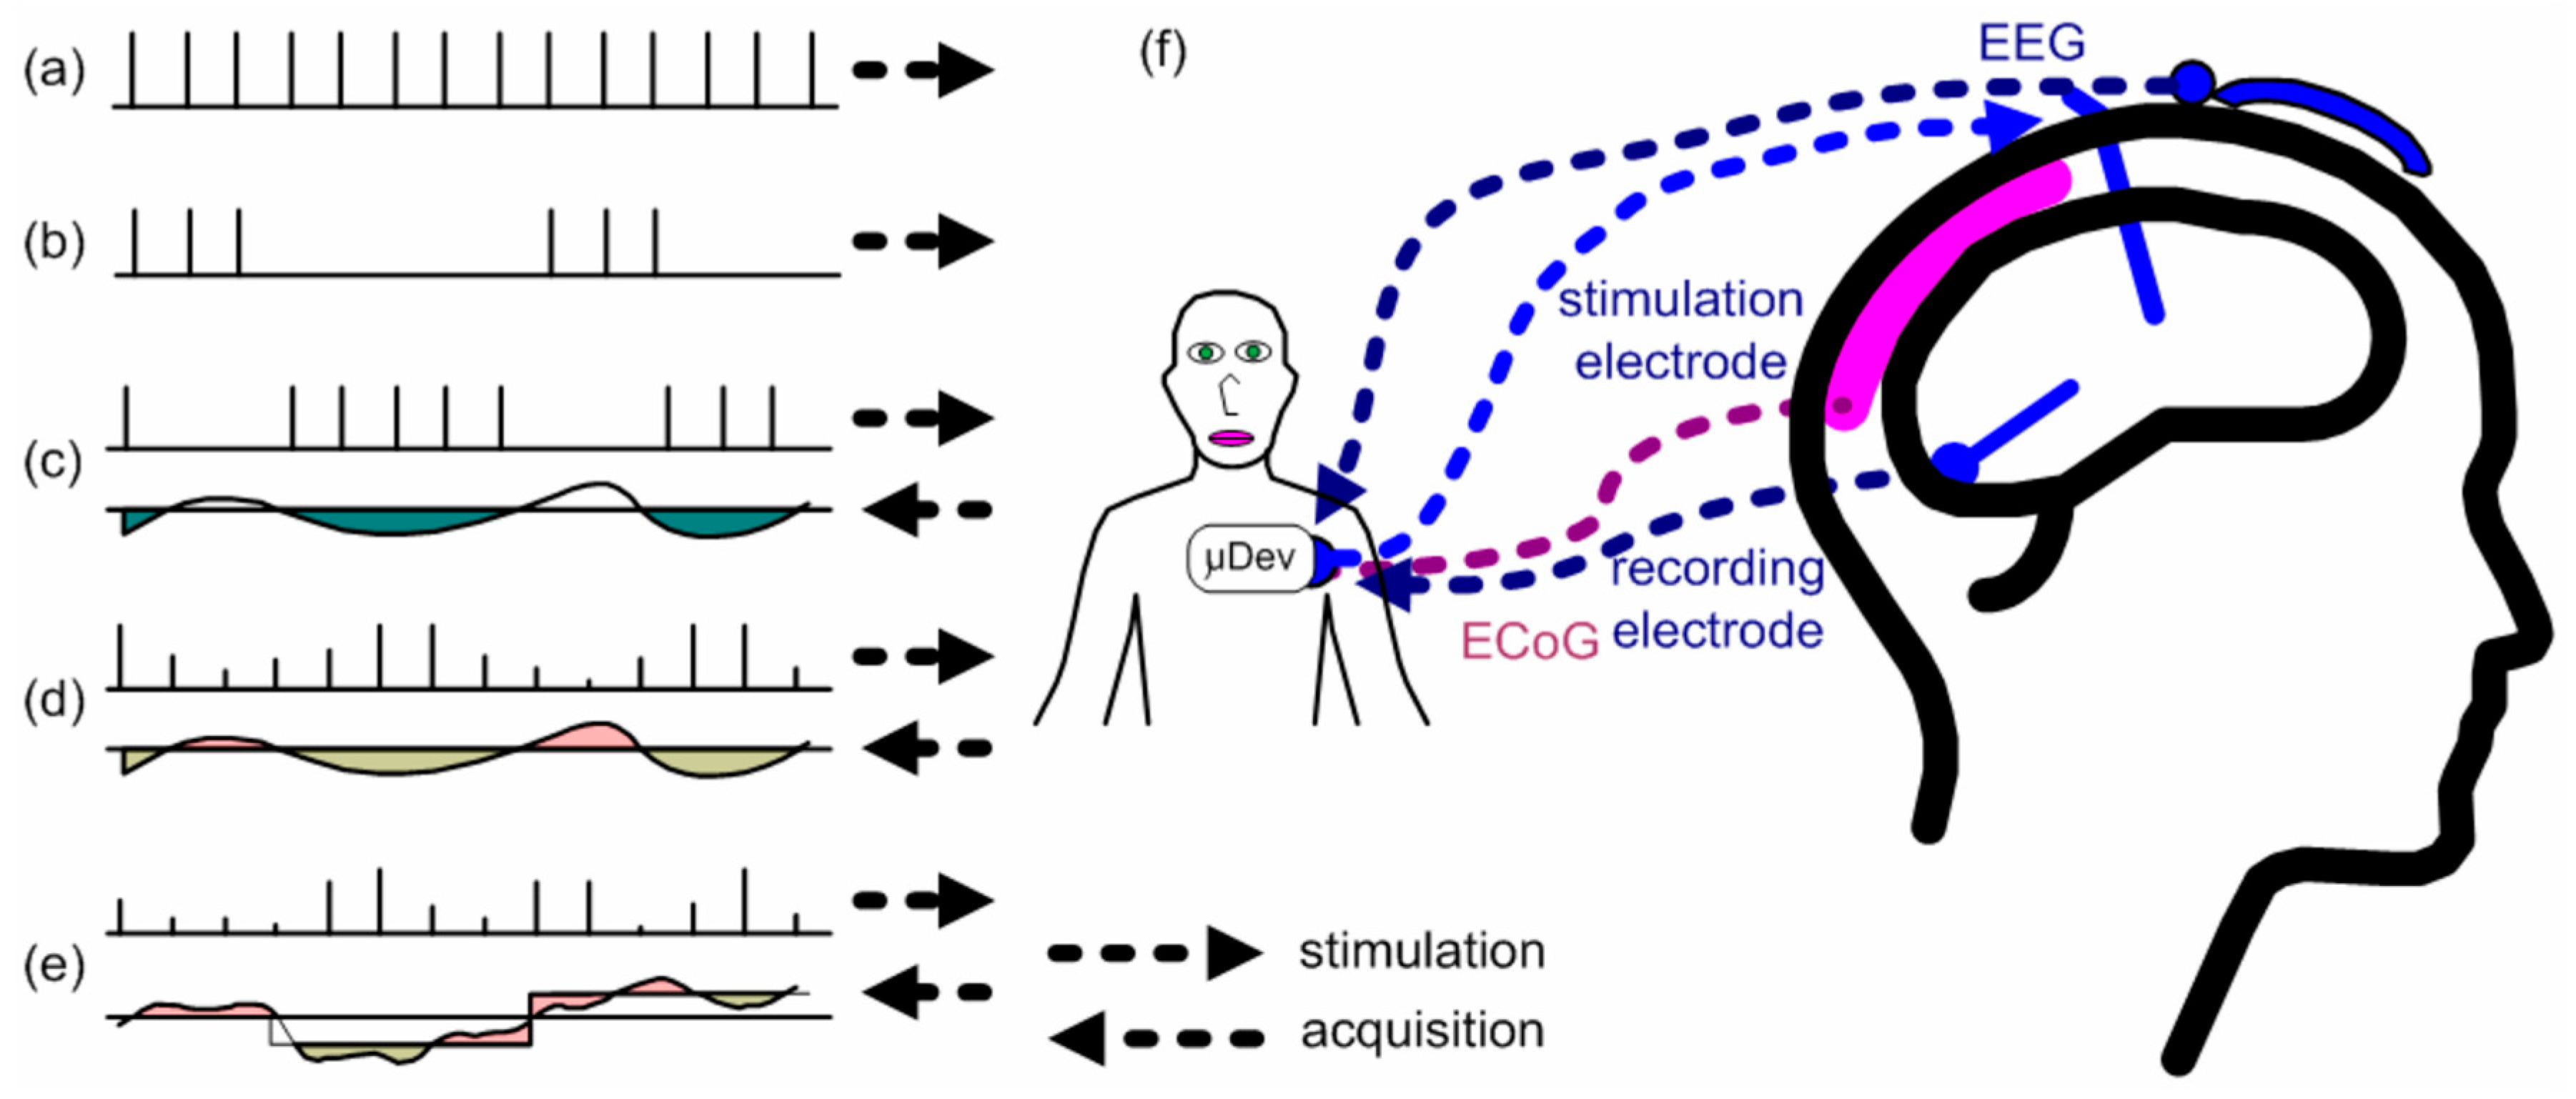
The DBS system control of the amplitude and frequency is done either by a user that changes manually the values or by itself through acquiring biomarkers and adjusting the parameters according to the response of the patient. For example, a biomarker may be an electrical signal generated by cells of a human organism and is an indicator of the response of the human body to electrical stimuli. The first described system is called an open-loop DBS whereas the second one is called a closed DBS. Open-loop DBS has around 75% of efficacy in motor treatment; however, the use of open-loop DBS in psychiatric diseases does not return good results, which indicates that a sophisticated closed-loop DBS may be more suitable for these applications [
20]. There are five main types of control of the DBS system, as shown in
Figure 2.
Figure 2(a) is the simple open-loop DBS with fixed parameters and a continuous pulse sequence and
Figure 2(b) is a similar system with a sequence of pulses separated by a period. In both cases, the parameters can only be modified by a healthcare worker and frequency and amplitude are constant.
Figure 2(c) shows an on/off responsive control, which is a closed-loop DBS where the system responds to the activation of brain cells by changing the pulse width. When the biopotential exceeds a threshold value, the DBS system stops the stimulation, and as the biopotential achieves a value below the threshold, the DBS reactivates the stimulation. Bouthour et al [
21] propose an on/off responsive DBS system by monitoring the frequency components registered by local field potentials produced in the subthalamic nucleus of the brain. A setpoint value is defined, and, if an amplitude signal of the biomarker is greater than the setpoint, the neurostimulation signal is interrupted. Otherwise, if the biomarker signal is lower than the setpoint, the neurostimulation signal is reactivated.
Figure 2(d) depicts a closed-loop DBS named adaptive control, like in
Figure 2(c), but with a variation in the pulse width and the amplitude of the stimulation signal. Finally,
Figure 2(e) illustrates the dynamic stimulation signal control, which is the most complete closed-loop DBS system, since it uses multiple channels to generate pulses in addition to the other features of the system of
Figure 2(d).
Closed-loop DBS systems adjust their response according to a response of a biomarker to the electrical stimulation. Biomarkers as well as techniques and technologies to carry out the signal processing are many and may vary according to the applied pathology. A careful study of the parameters of the signal to be acquired and for the elaboration of algorithms that make it possible to make effective the information carried by the biomarkers in the performance of the stimulation signal. For epilepsy, commonly used biomarkers are electroencephalograms (EEG) acquired from the mesial temporal lobe and transcranial electrical stimulation (TES) signals [
22,
23]. The biomarkers used for Parkinson’s disease are sleep disturbances [
24], freezing of gait [
25], and synchronized frequencies of the mesial temporal lobe [
26,
27,
28,
29] detected by local potential fields of the brain.
Amon and Alesh [
33] compared commercial models from 3 companies: Boston Scientific, Medtronic and St. Jude. Most of the commercial equipment of these companies are used in the treatment of Parkinson’s disease, essential tremors and dystonia. Stimulation parameters can be selected via a device, which is also responsible for assigning parameter values to the IPG via radio frequency coupling. This device is mostly provided by the manufacturer together with the IPG. In the Infinity DBS system at St. Jude Medical, the selection of the parameters occurs through an Apple device that sends the configuration of the parameters to the IPG via Bluetooth [
33].
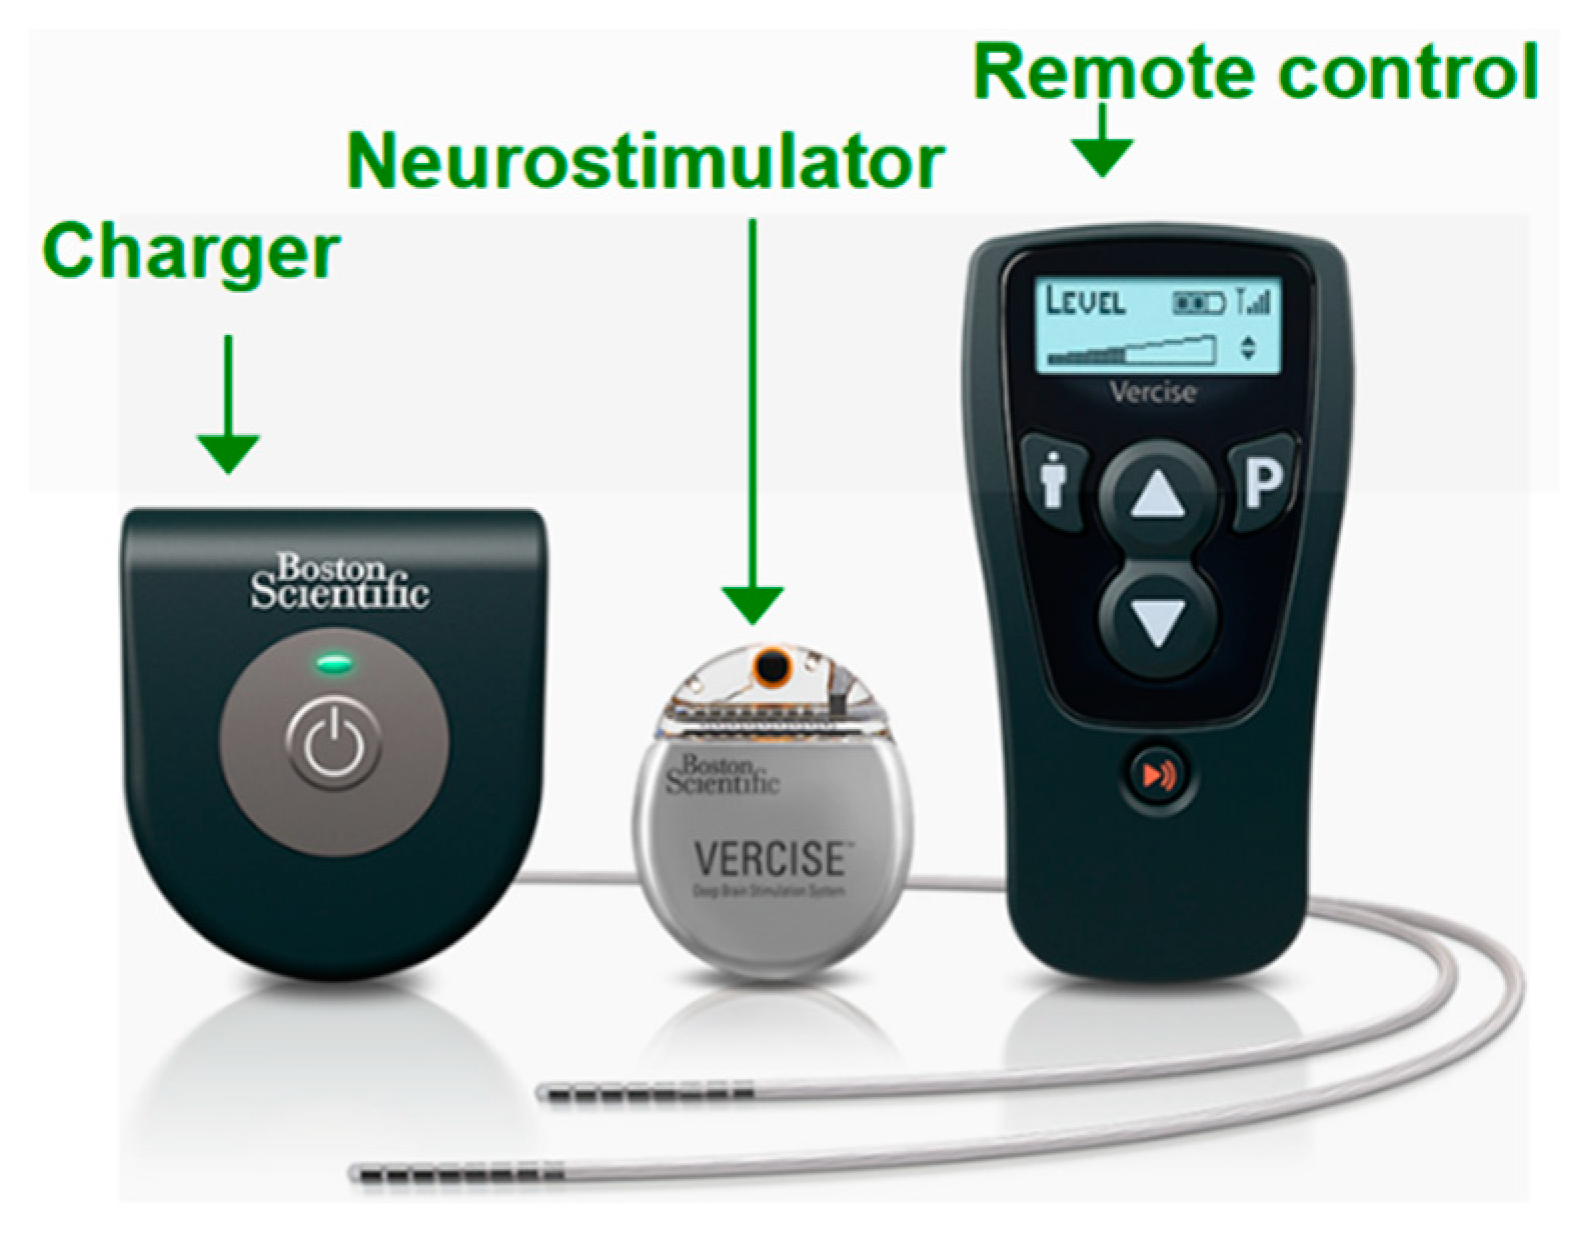
Figure 3 shows a commercial DBS system from the company Boston Scientific to illustrate the dimensions of the devices available on the market [
34]. This paper presents a closed-loop deep brain stimulation (CLDBS) system comprising two stimulation channels and two acquisition channels. This CLDBS system was designed for low-size and easy positioning and at the same time for energy management targeting high efficiency.
The main contributions of this paper is a low-size/power-controlled, compact and complete closed-loop DBS system (CLDBS) with two simultaneously acquisition channels and two simultaneously neurostimulation channels. As further present, it is important to note the existence of a huge number of simple neurostimulators for conventional DBS without acquisition, and the existence of very few works comprising the acquisition subsystem with communication for adaptive stimulation on CLDBS.
The rest of this paper is organized as follows.
Section 2 presented the design of the proposed system.
Section 3 presents the obtained results. Finally,
Section 4 presents the conclusions.
2. Proposed Design
2.1. LowNoise Amplifier (LNA)
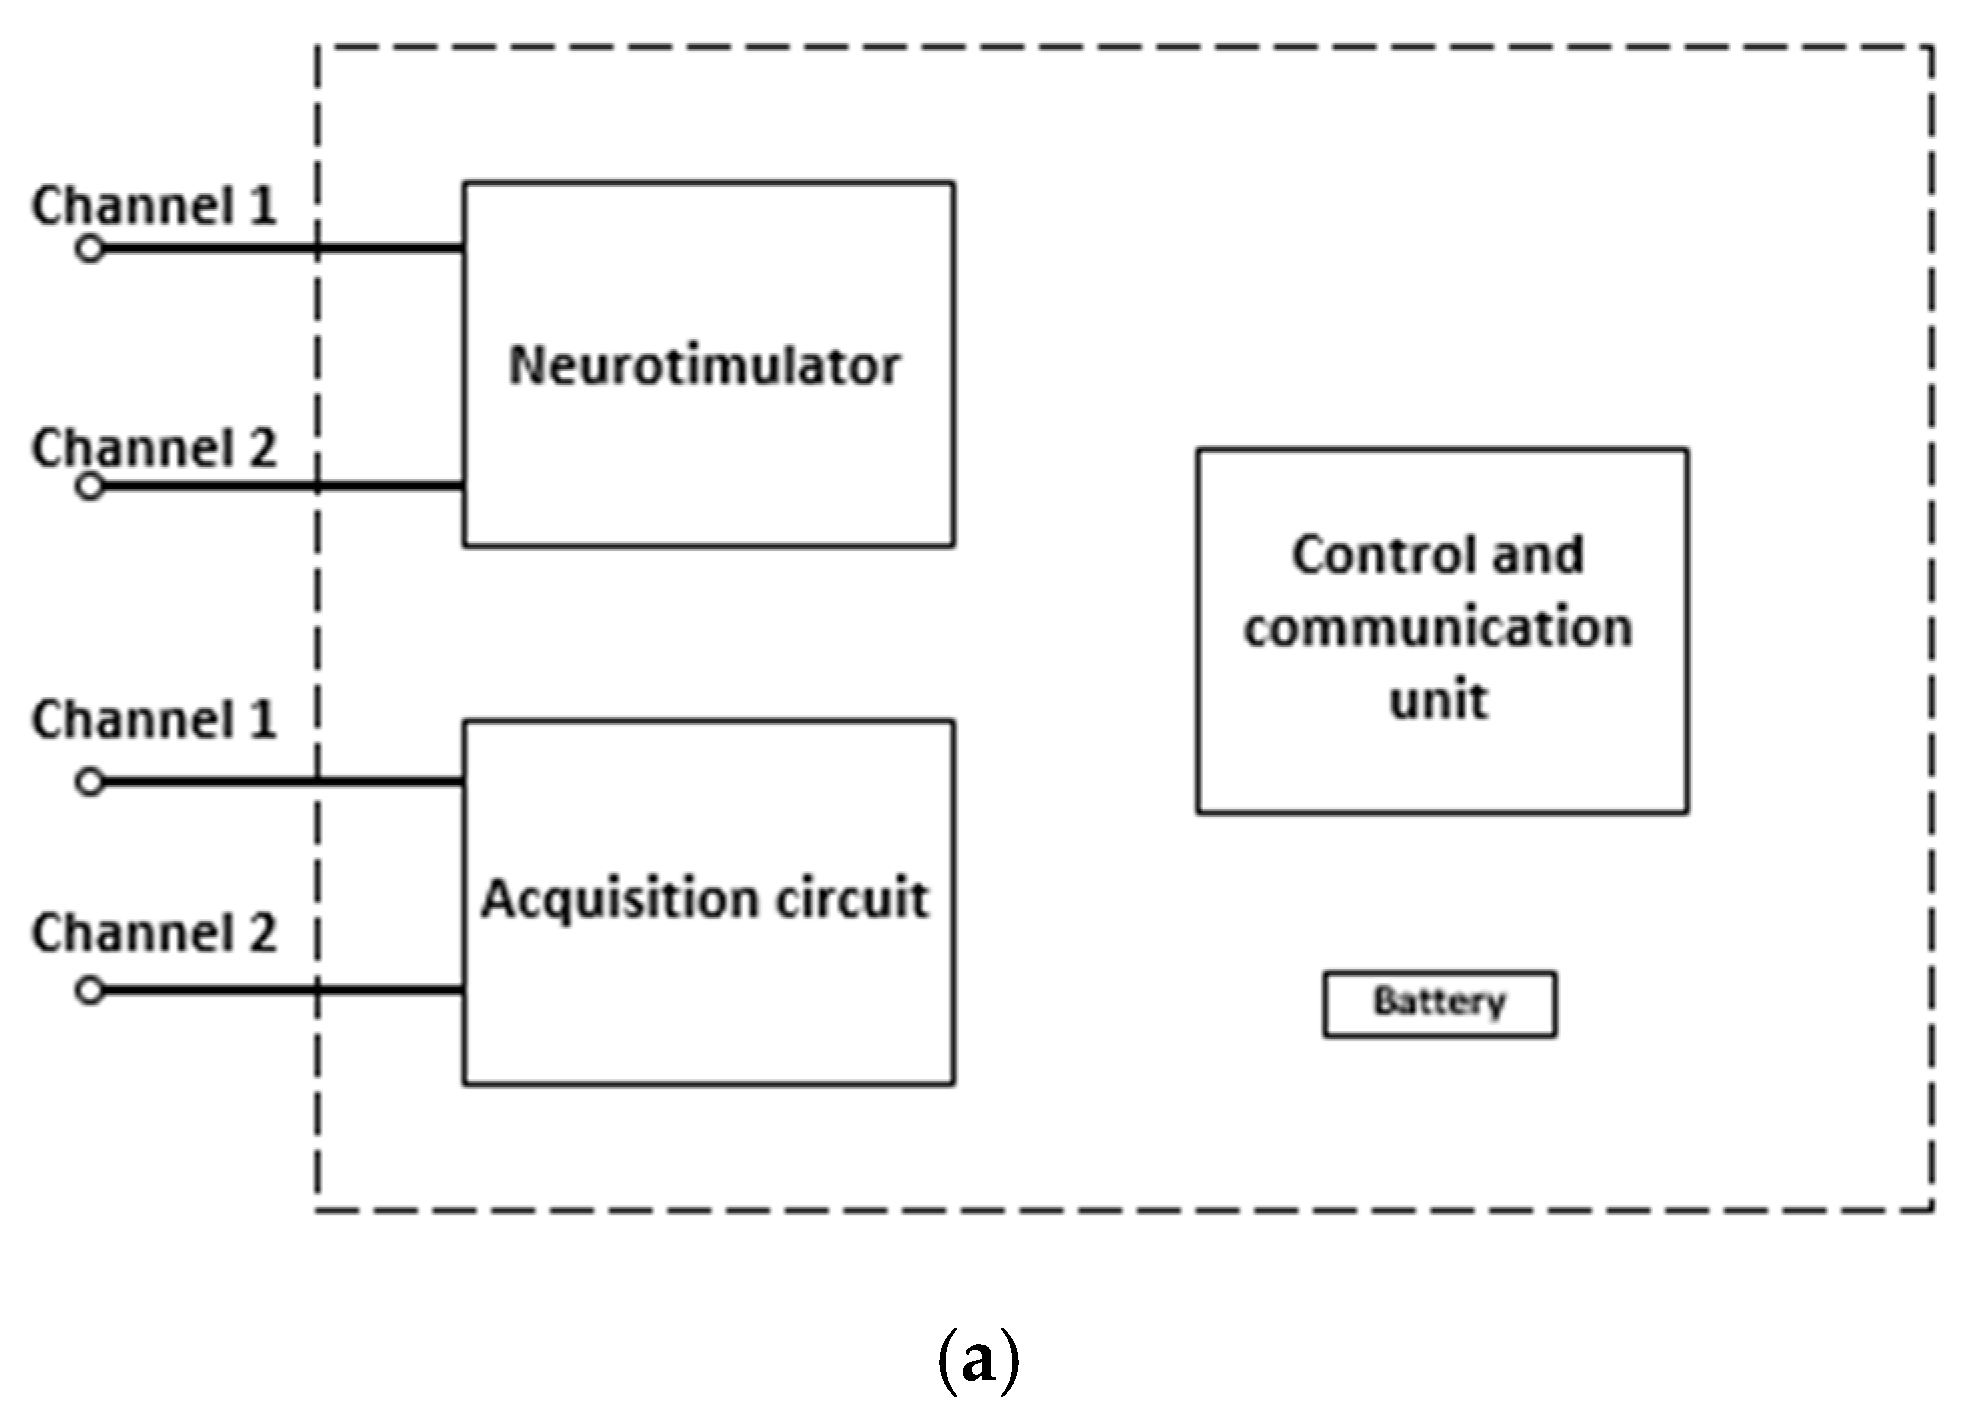
The DBS system presented in this paper is a closed-loop system with both acquisition and stimulation circuits.
Figure 4(a) shows the block diagram of the proposed DBS system. To provide a constant electrical current and to control the waveform parameters, a Howland current pump (HCP) was used alongside a microcontroller. The HCP receives a control signal from a digital-to-analog converter (DAC). The DAC that generates the waveform is internal to the ESP32 microcontroller, which will receive the information from the signals acquired through an analog-to-digital converter (ADC), which is also internal to the ESP32. The choice of the ESP32 development platform is also justified based on its wireless communication interfaces, such as Wi-Fi and Bluetooth. Moreover, the ESP32 has two cores, which allows the DBS system to control the stimulation and acquisition tasks individually. An internal program receives the input signal data and controls the values of the stimulation waveform parameters.
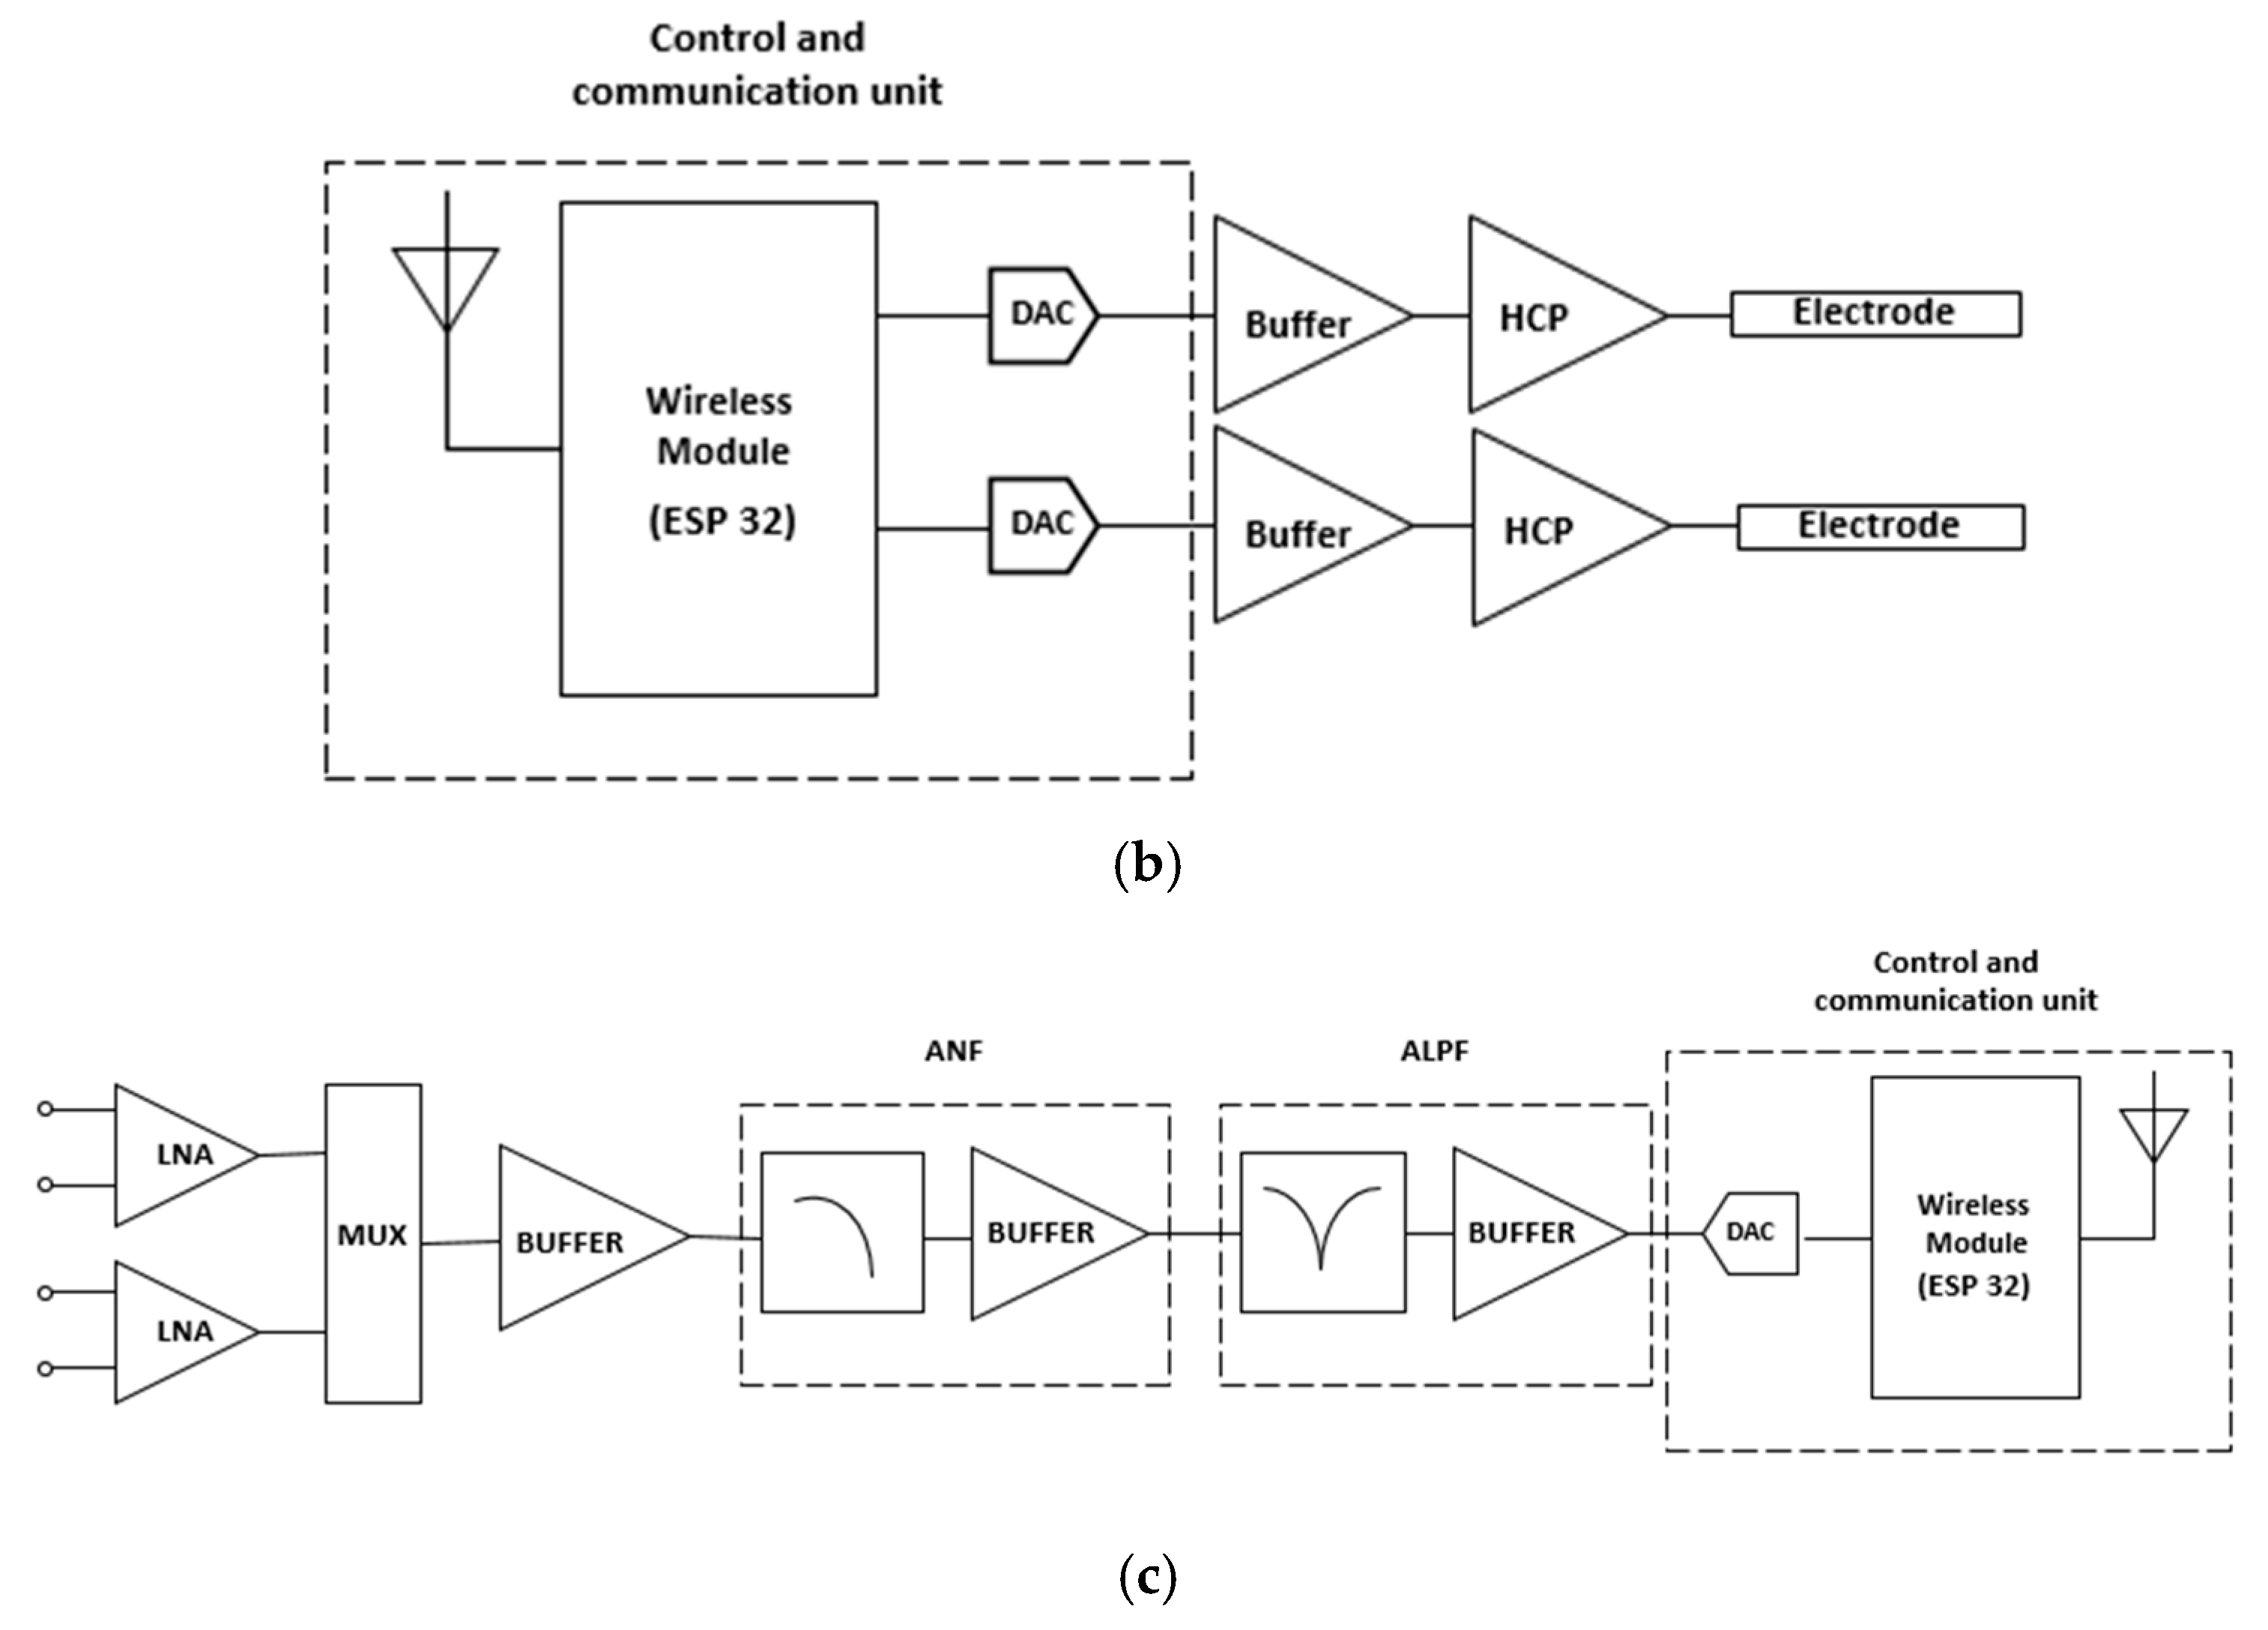
Figure 4(b) shows the block diagram of the stimulation system, composed by the wireless module (ESP32 board), the DAC converters, the buffers, the constant current HCP circuits and the stimulation electrodes.
The acquisition circuit receives the signals delivered by electrodes inserted in brain regions of interest monitoring during stimulation of the brain, sites that can provide biomarker signals for a better analysis of performance of DBS and be the feedback loop in a loop stimulation system closed. The first stage of the circuit has two channels with low noise amplifiers (LNAs) in the differential configuration and is insensitive to DC levels present in the input signal. Both LNAs have the function of improving the signal from the electrodes and blocking the DC levels that are often present on the acquired signal. The second stage has two acquisition channels that conduct the output signals to a multiplex (MUX) and a buffer to promote a good impedance match between the stages. The next stage of the acquisition system is an analog notch filter (ANF) to remove the noise component from the supply. The subsequent stage of the circuit consists of an active low-pass filter (ALPF) that will promote the attenuation of high-frequency noise and provide more gain to the signal. Finally, the signal is conducted to an ADC from the microcontroller ESP32.
Figure 4(c) shows the diagram of blocks of the biopotential acquisition circuit.
The operational amplifier chosen for the design of the signal conditioning is the AD8609 manufactured by Analog Devices, a low-power precision amplifier with low-noise rail-to-rail input technology, a typical common-mode rejection ratio (CMRR) of 100 dB at the output and noise density of 22 nVHz-1/2 [
40]. The gain of the first stage was designed to be around 33 dB and the gain of the ALPF at approximately 21 dB, so the total loop gain is 54 dB. The frequency of ANF count was designed for 60 Hz, configuration shown in
Figure 5, and the cutoff frequency of the ALPF at approximately 10 kHz.
2.2. Neurostimulator
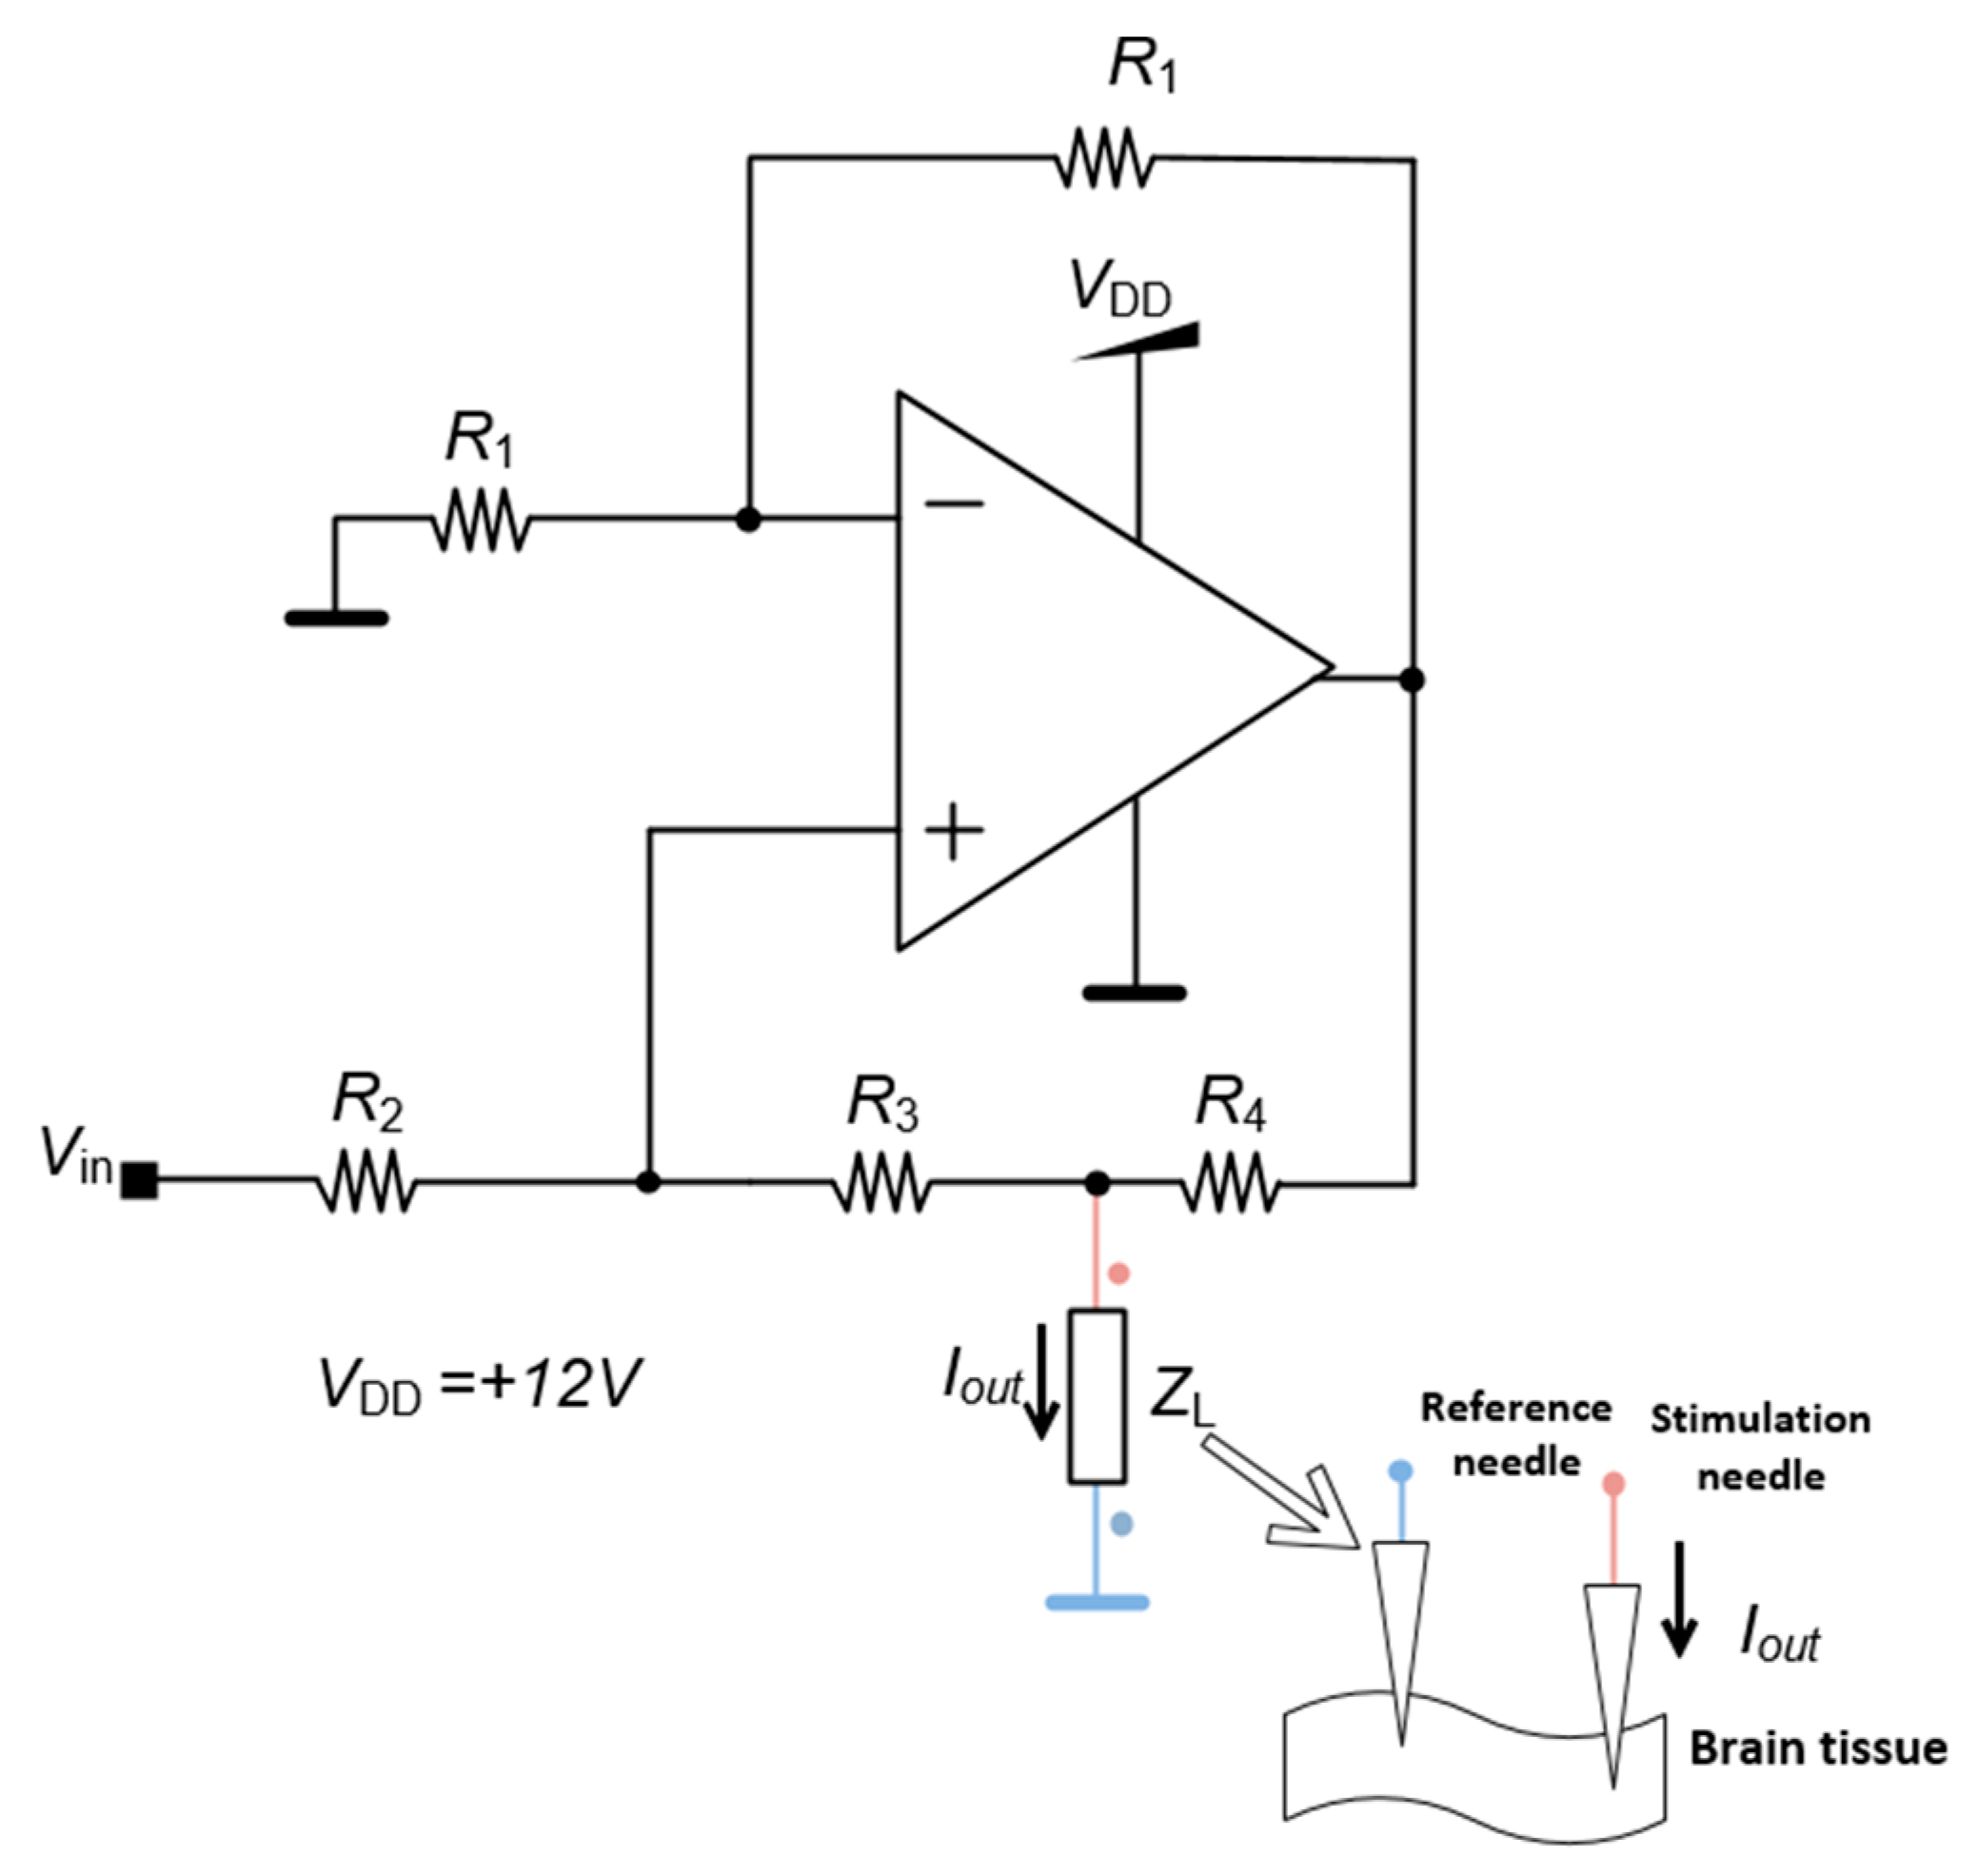
The control unit generates the stimulation signal by an analog output created by a digital-to-analog converter (DAC) of the control unit, which is the input of each channel of the neurostimulator. Even though the pulse amplitude is defined by the control unit the amplitude value could be affected by the impedance of the brain tissue which could vary according to the region where the electrode is implanted. To bypass this problem, the stimulation circuit generates an electrical current with a value proportional to the voltage input and constant regarding the brain impedance. This system is the HCP represented in
Figure 5. The quantity
Iout is the output current and
ZL is the impedance of the brain tissue represented as the load impedance.
The quantity Vin is the input voltage given by the control unit and R1, R2, R3 and R4 are fixed parameters, which means that the microcontroller can directly alter the current even if the impedance of the body tissue changes during the application of the DBS.
The output electrical current I
out produced by the HCP circuit is given by equation (1).
The values used for the built circuit are R1 = R2 = 12.1 kΩ, R3 = 10 kΩ and R4 = 2.2 kΩ, and the output current Iout is 1.4 mA for the maximum output voltage of the DAC.
2.3. Acquisition Circuit
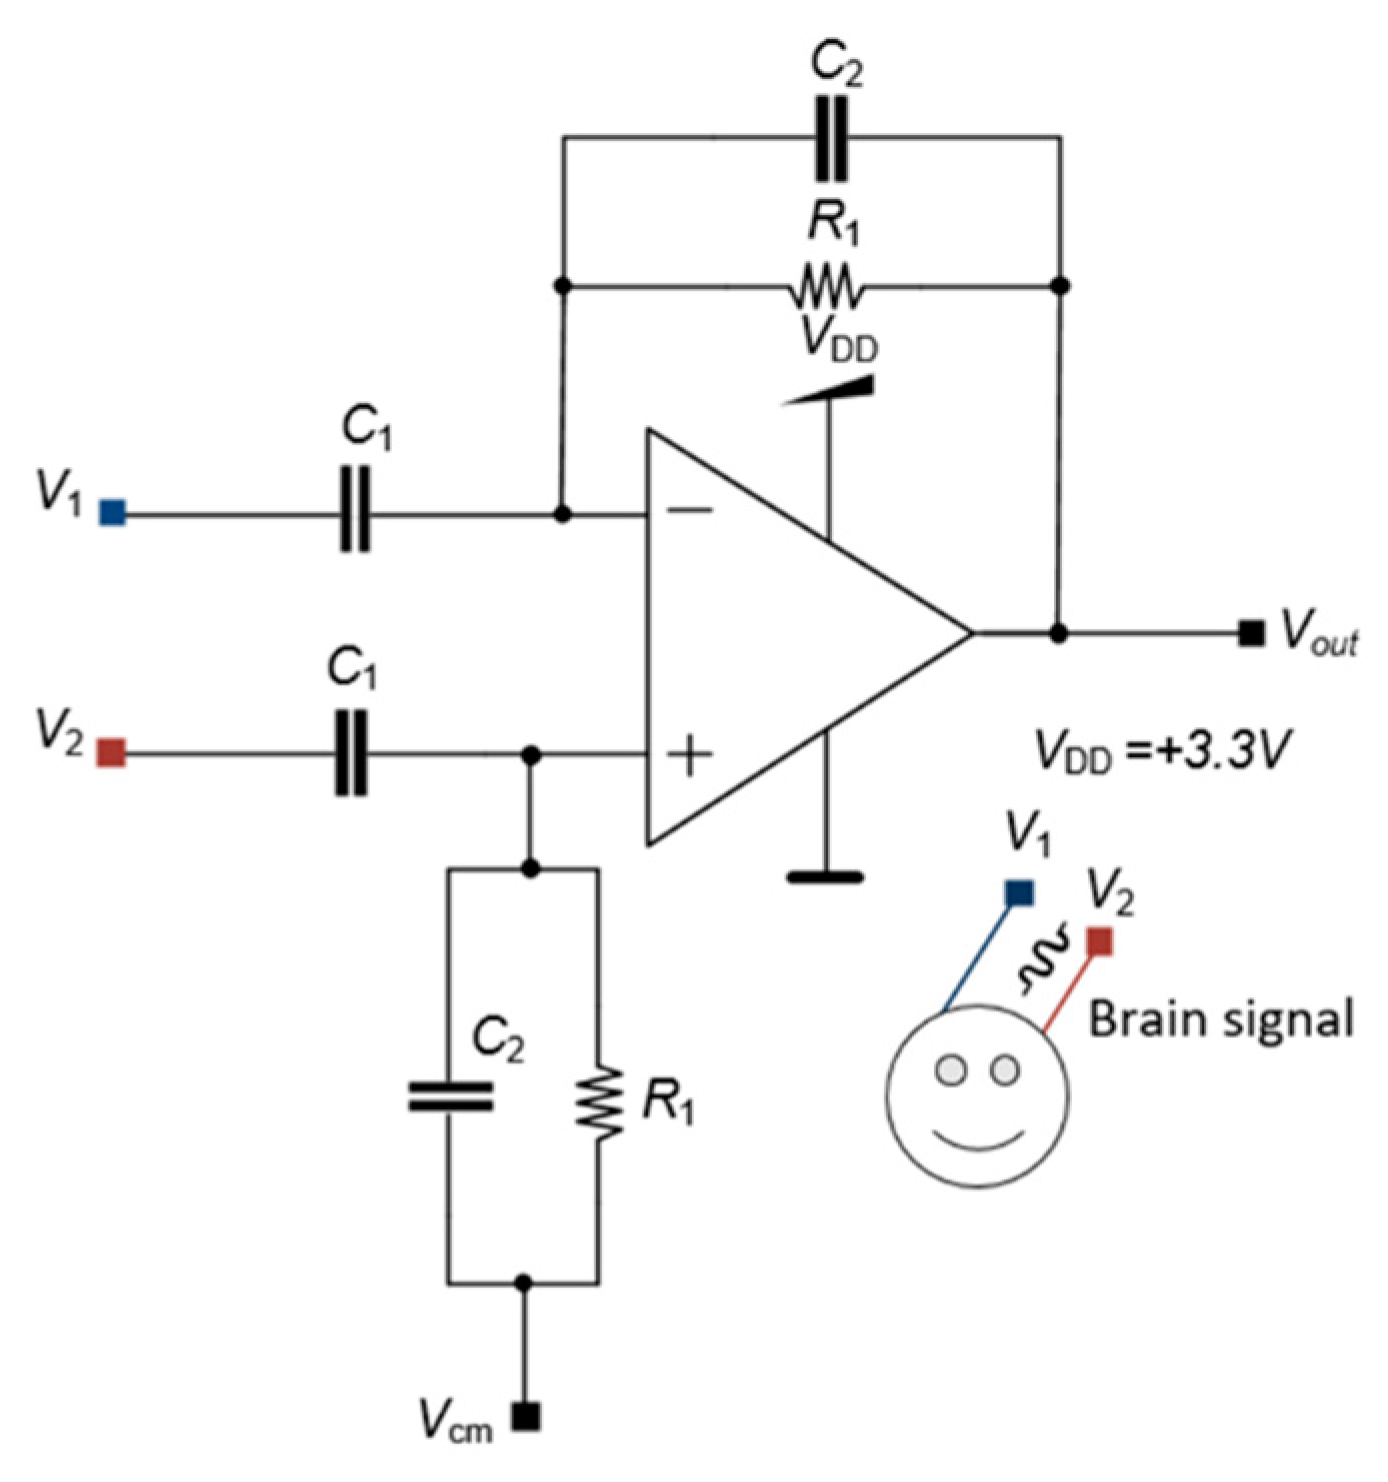
The first stage has an LNA with an elevated gain to amplify low-amplitude signals from biomarkers and improve those signals for the following stages. The LNA also has a high entrance impedance. The LNA circuit has a differential configuration to remove DC components from the input signal.
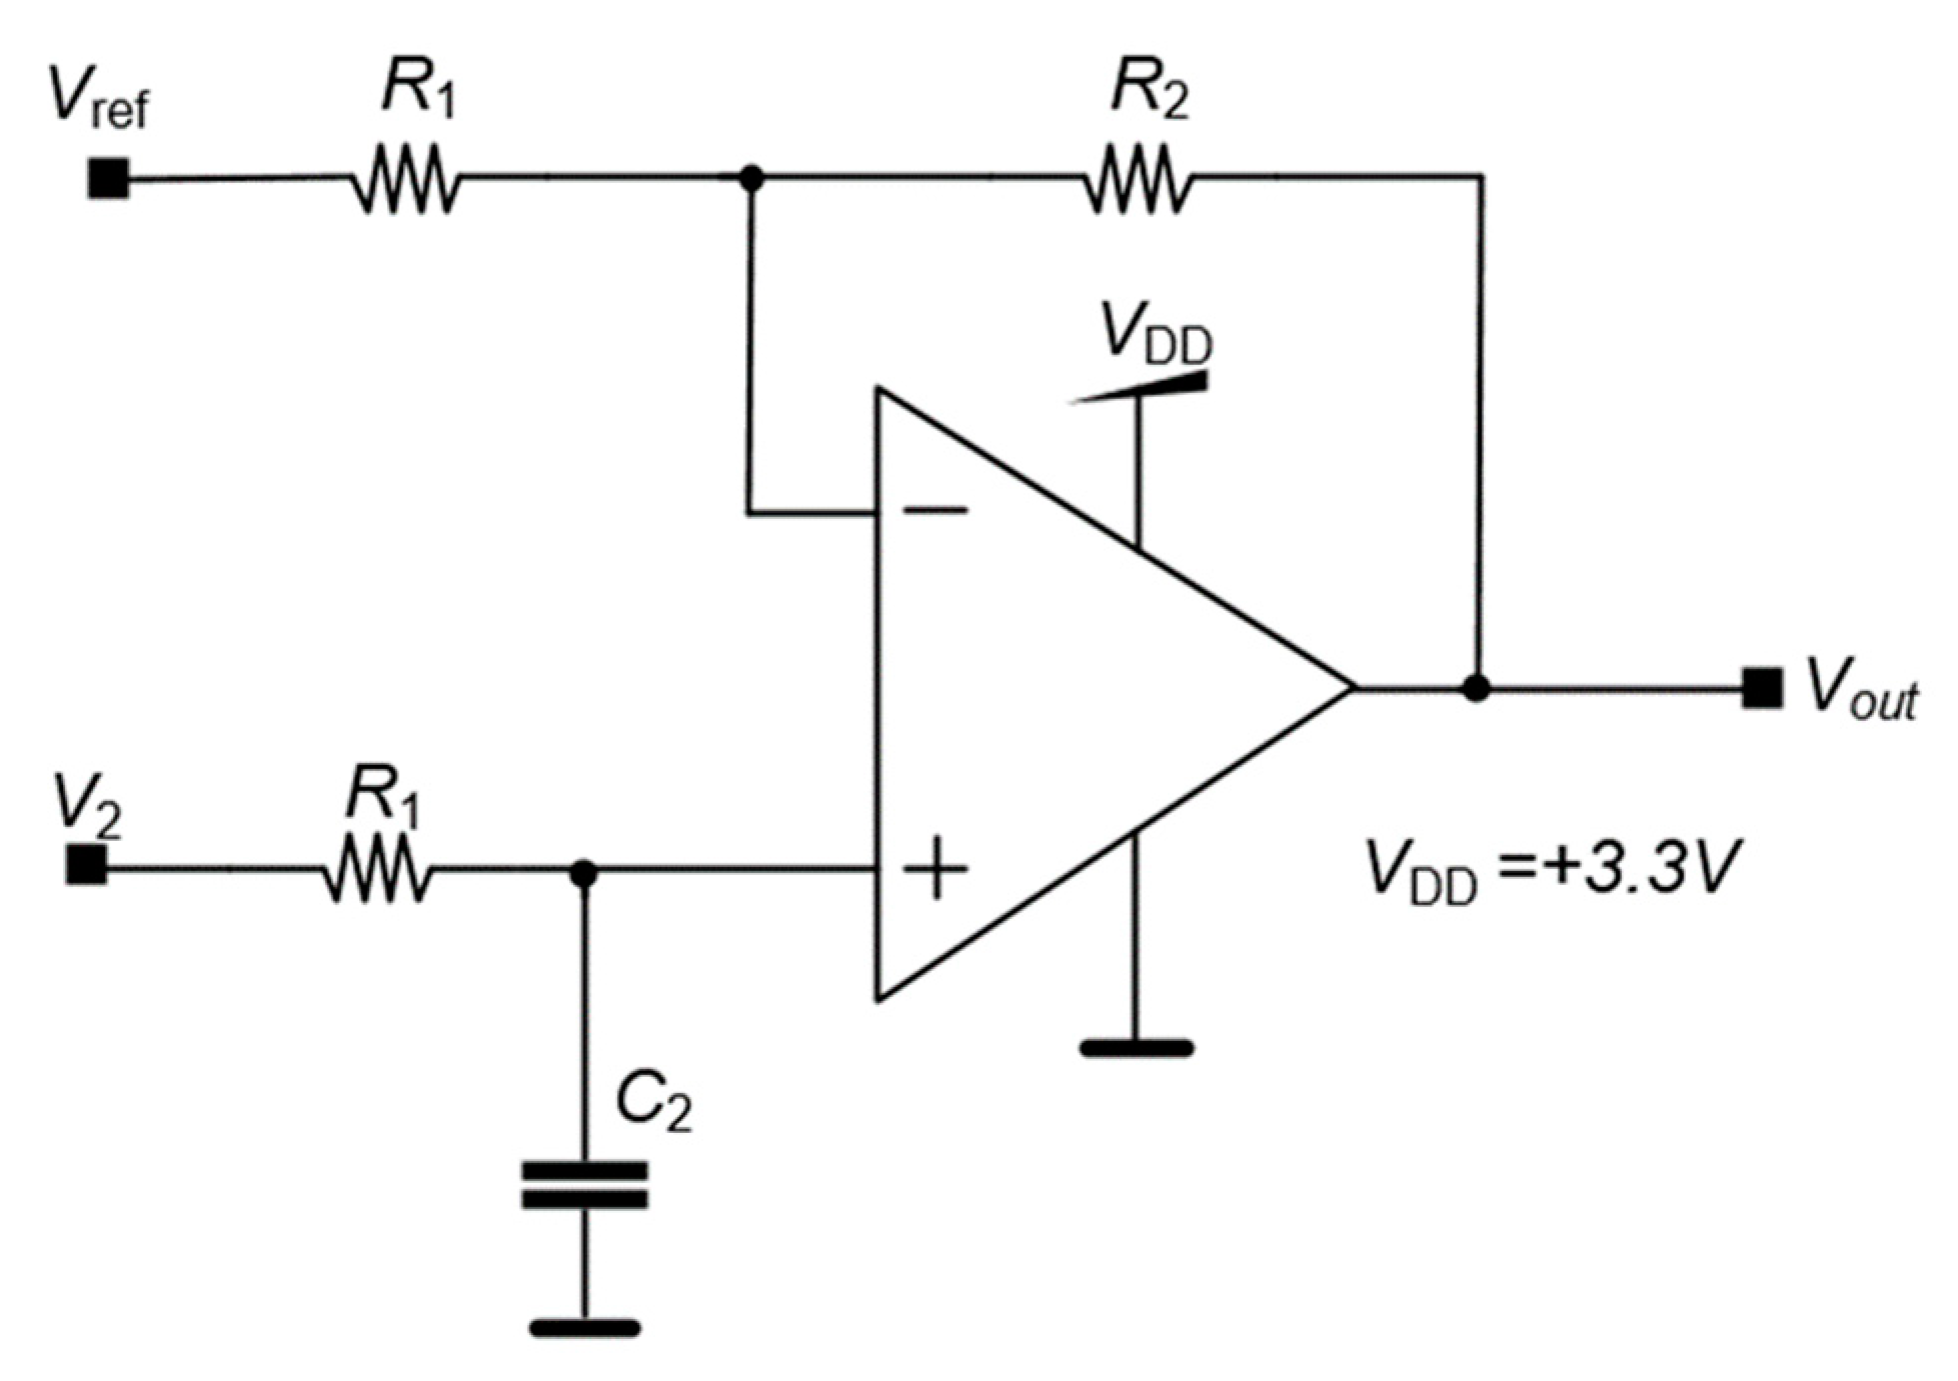
Figure 6 shows the differential circuit with
C1 and
C2 capacitances to remove the DC component alongside two resistances
R1 to polarize the circuit. The electrical supply of the LNA is provided by a single
VDD.
The schematic circuit of Figure
6 has both the inverter and non-inverter configurations that generate
V1 and
V2, respectively. Both the input and feedback impedances
Z1 and
Z2 are given by:
The ratio of the impedances
Z1 and Z
2 with (
Z1 + Z
2) are given by:
The complete LNA forms a difference amplifier, thus, the voltage
Vout at the output of LNA is given by:
The feedback factor
β and its inverse are defined, respectively, as:
Therefore, the gain of the LNA (e.g., the feedback gain)
Af(
s) is given by:
At the medium frequencies,
C1 +
C2 ≈
C1, and [
sR2(
C1+
C2)+1] ≈
sR2C1, making the midband voltage gain equal to:
Normally, in the majority of commercial operational amplifiers,
A(
s) can be expressed with a single pole, or at least with a dominant pole next to the origin. However, the additional poles must be taken into account if they exist. This particular case is a good and general example to deduce the feedback gain and to understand the respective frequency behavior. In the particular case of only one pole:
At the medium frequencies,
A(
s) » 1, and the midband voltage gain results on:
At the medium frequencies, it is already known that [
sR2(
C1+
C2)+1]≈
sR2C1, which combined with [
sR2C2+1]≈
sR2C2 at these frequencies, the midband voltage gain is then equal to:
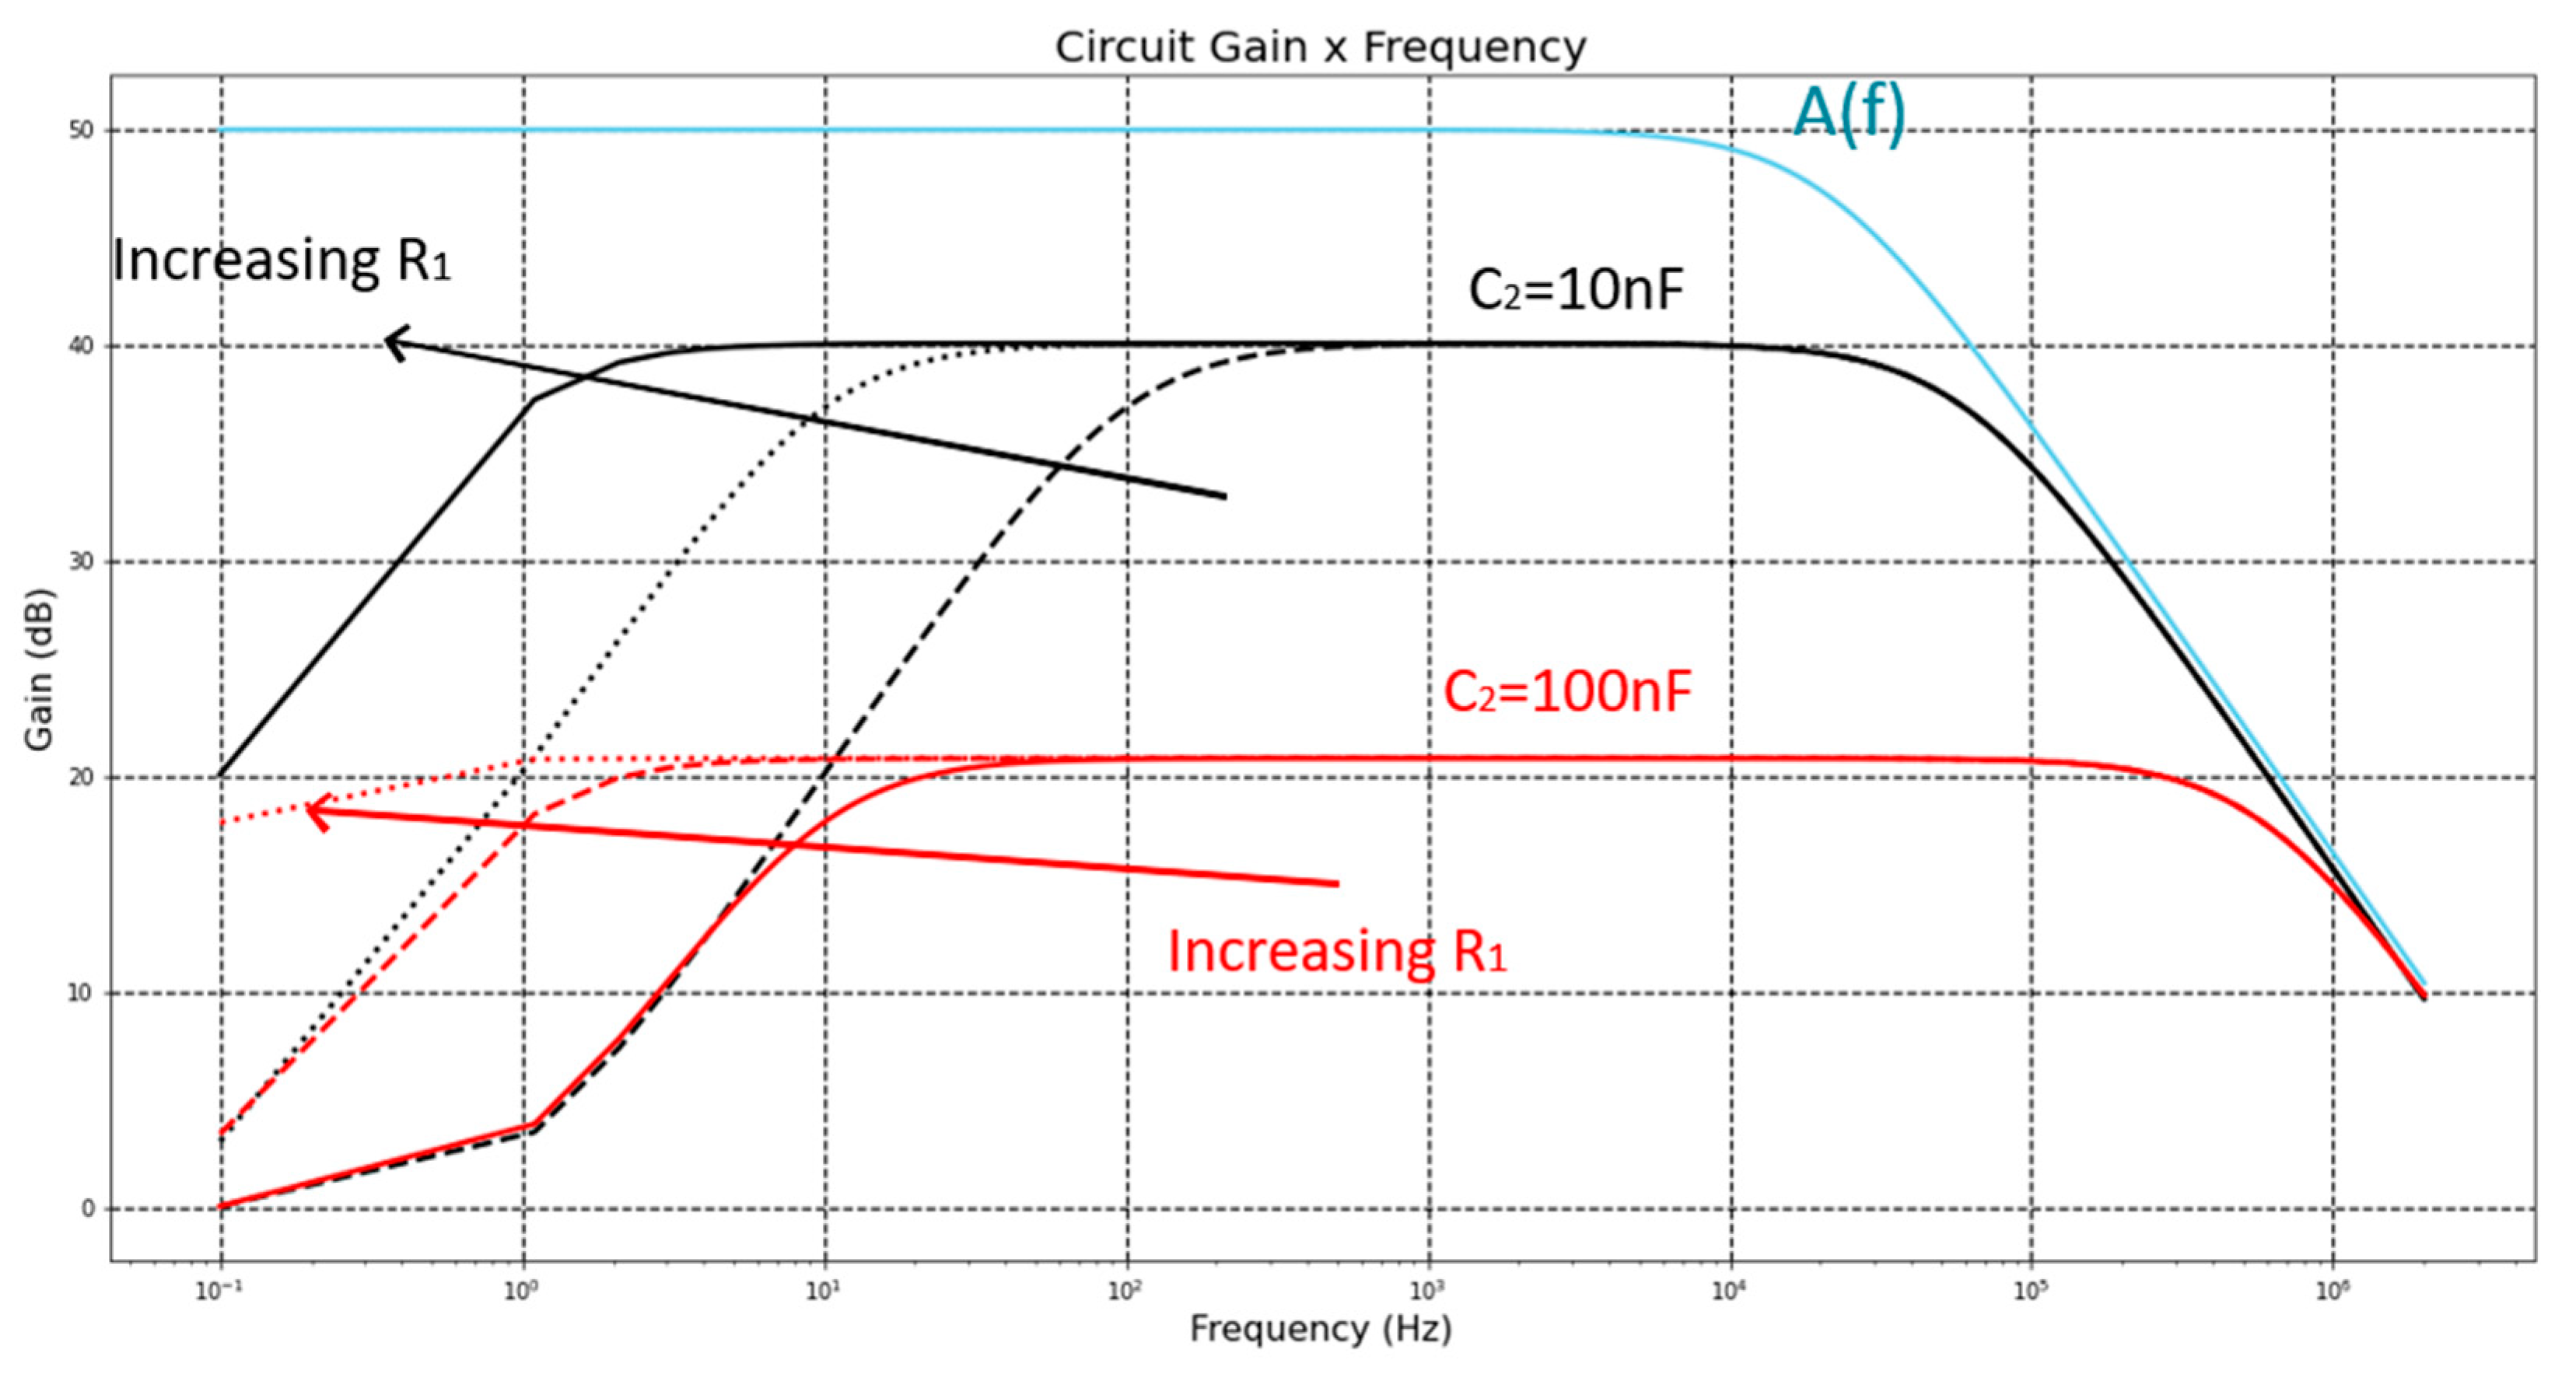
Figure 7 illustrates a Bode plot of a generic transfer function, where it is possible to observe the existence of a zero and two poles, as well as their relative positions. These positions are similar to the zeros and poles of the LNA of this paper, because the equation (8), e.g., the full equation of the gain of the LNA for all frequencies, also contains a zero
fz = 0 Hz in the origin. This zero is canceled by the first pole
fL = 1/(2
πR2C2), flattening the feedback gain. The feedback gain starts to decrease from the midband gain of
A1[dB] at the frequency of:
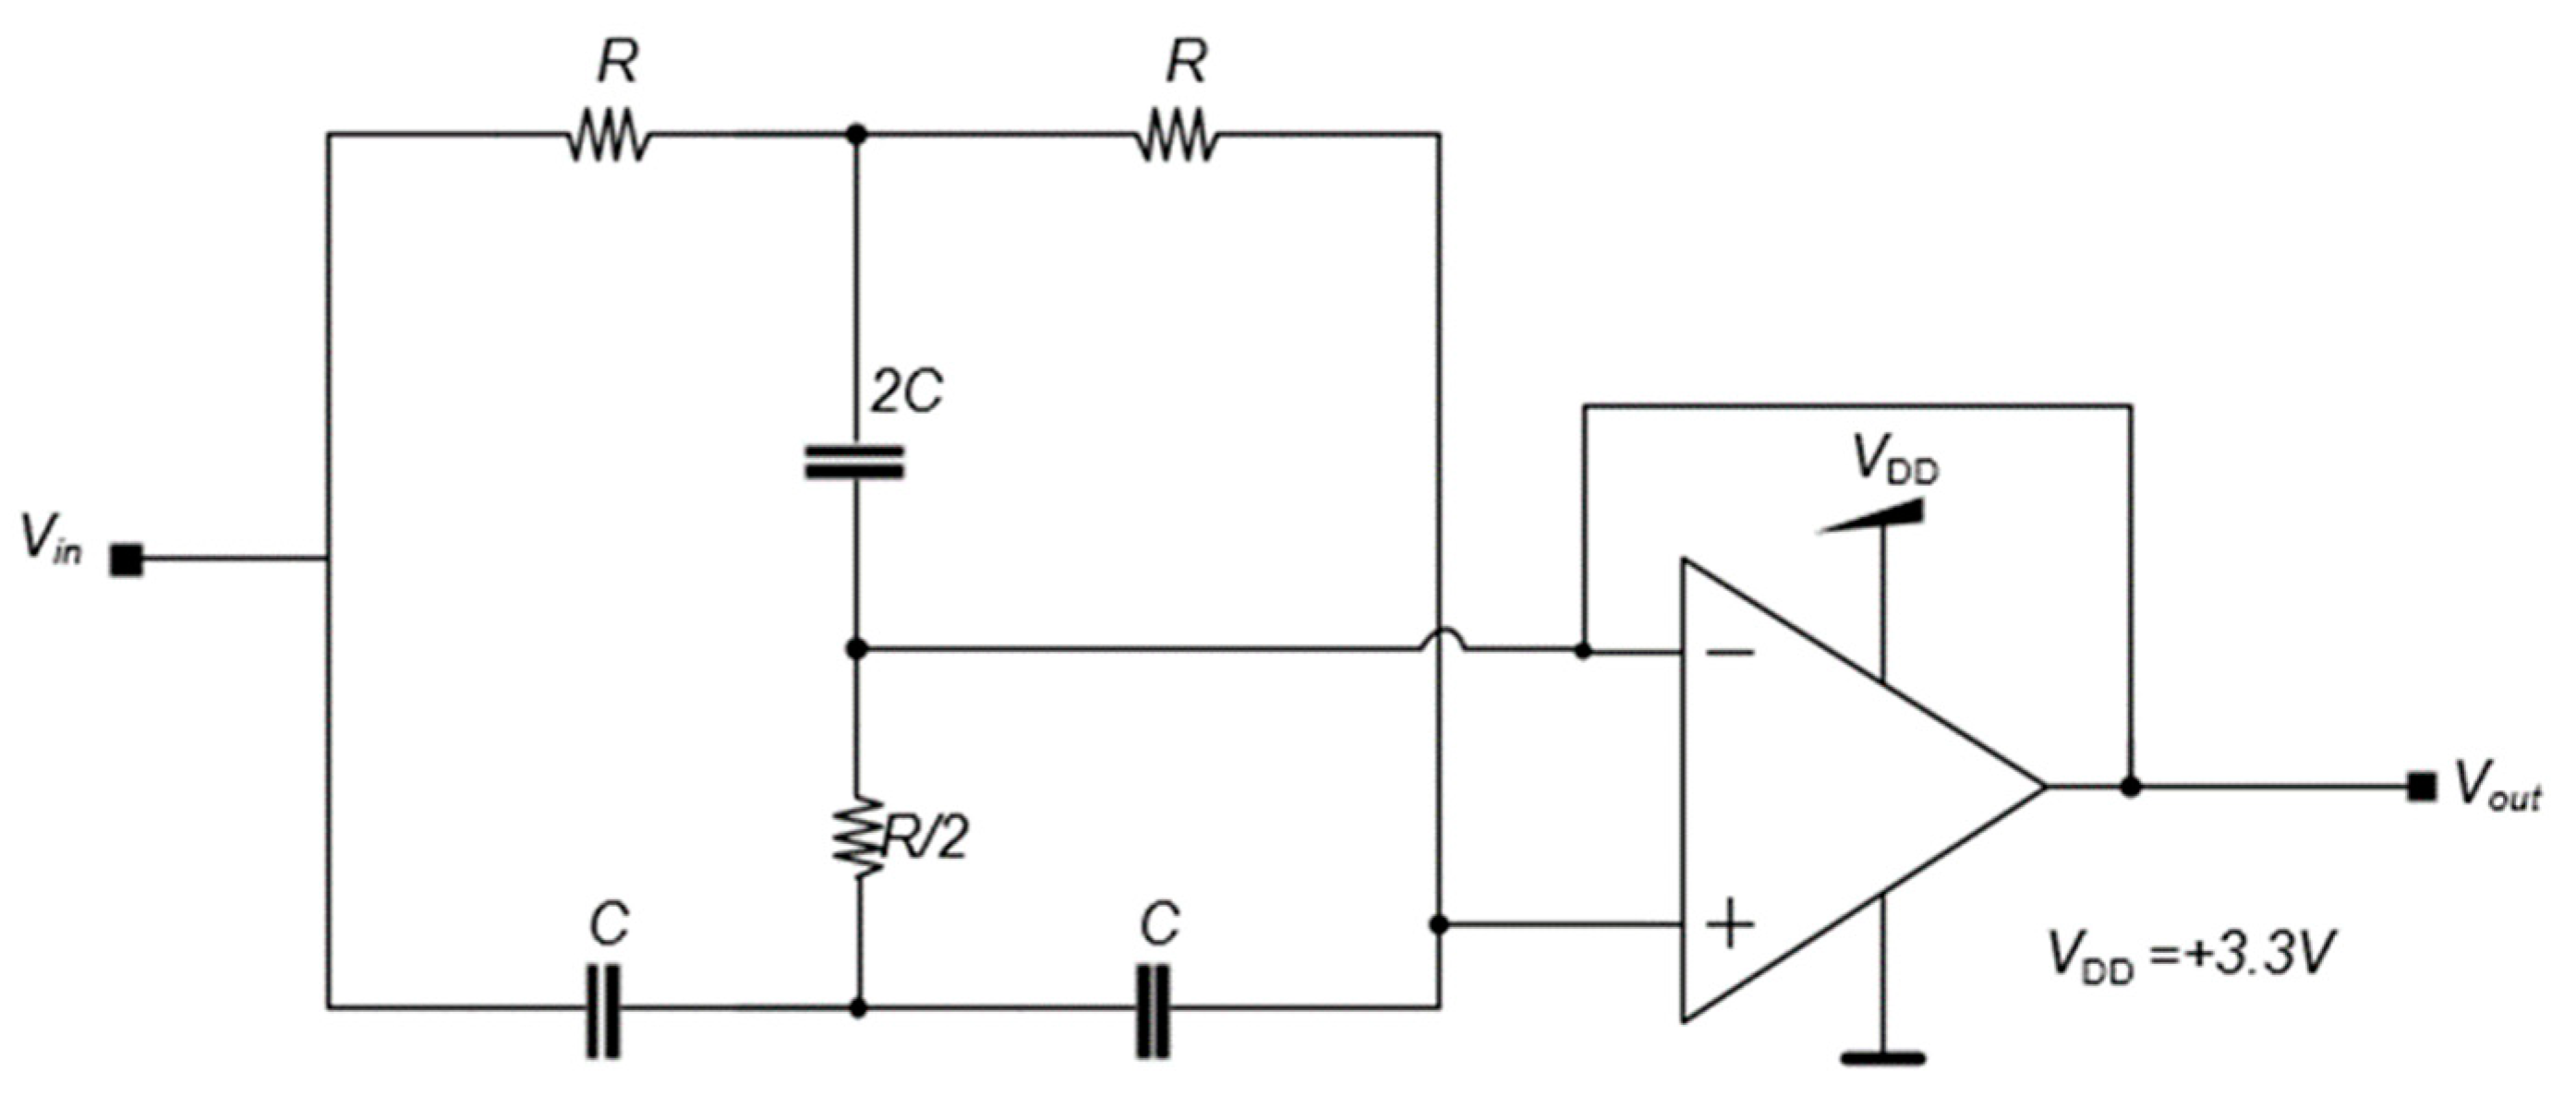
Figure 8 shows the active notch filter (ANF) used to remove the 60 Hz frequency from the energy supply. The
R value used was 10 MΩ and the
C value was 270 pF.
An active low pass filter (ALPF) was built as shown in
Figure 9 with
R1 = 100 kΩ,
R2 = 1 MΩ,
R = 15 kΩ and
C = 1 nF. The cutoff frequency was 6 kHz and the gain obtained was 20.83 dB.
2.4. Control and communication unit
The resolution of the ADC of the ESP32 microcontroller is defined as the minimum voltage that the ESP32 could read. The signal that the ADC receives is amplified by the LNA and the ANF, which improves the resolution of the ADC, as the real value of the biological signal is lower than the read value. The resolution and the total gain of the circuit
Gtotal are given by:
The LNA gain GLNA is 45 V/V, the GALPF is 11 V/V and Nbits is 12 for the ESP32. The maximum voltage input VADC that the ESP32 can read is 3.3 V. Substituting these values in equations (12) and (13) the resolution of the DBS acquisition is 1.628 µV/bit. The resolution is in the same order as the amplitude of biopotentials.
2.5. Energy Control
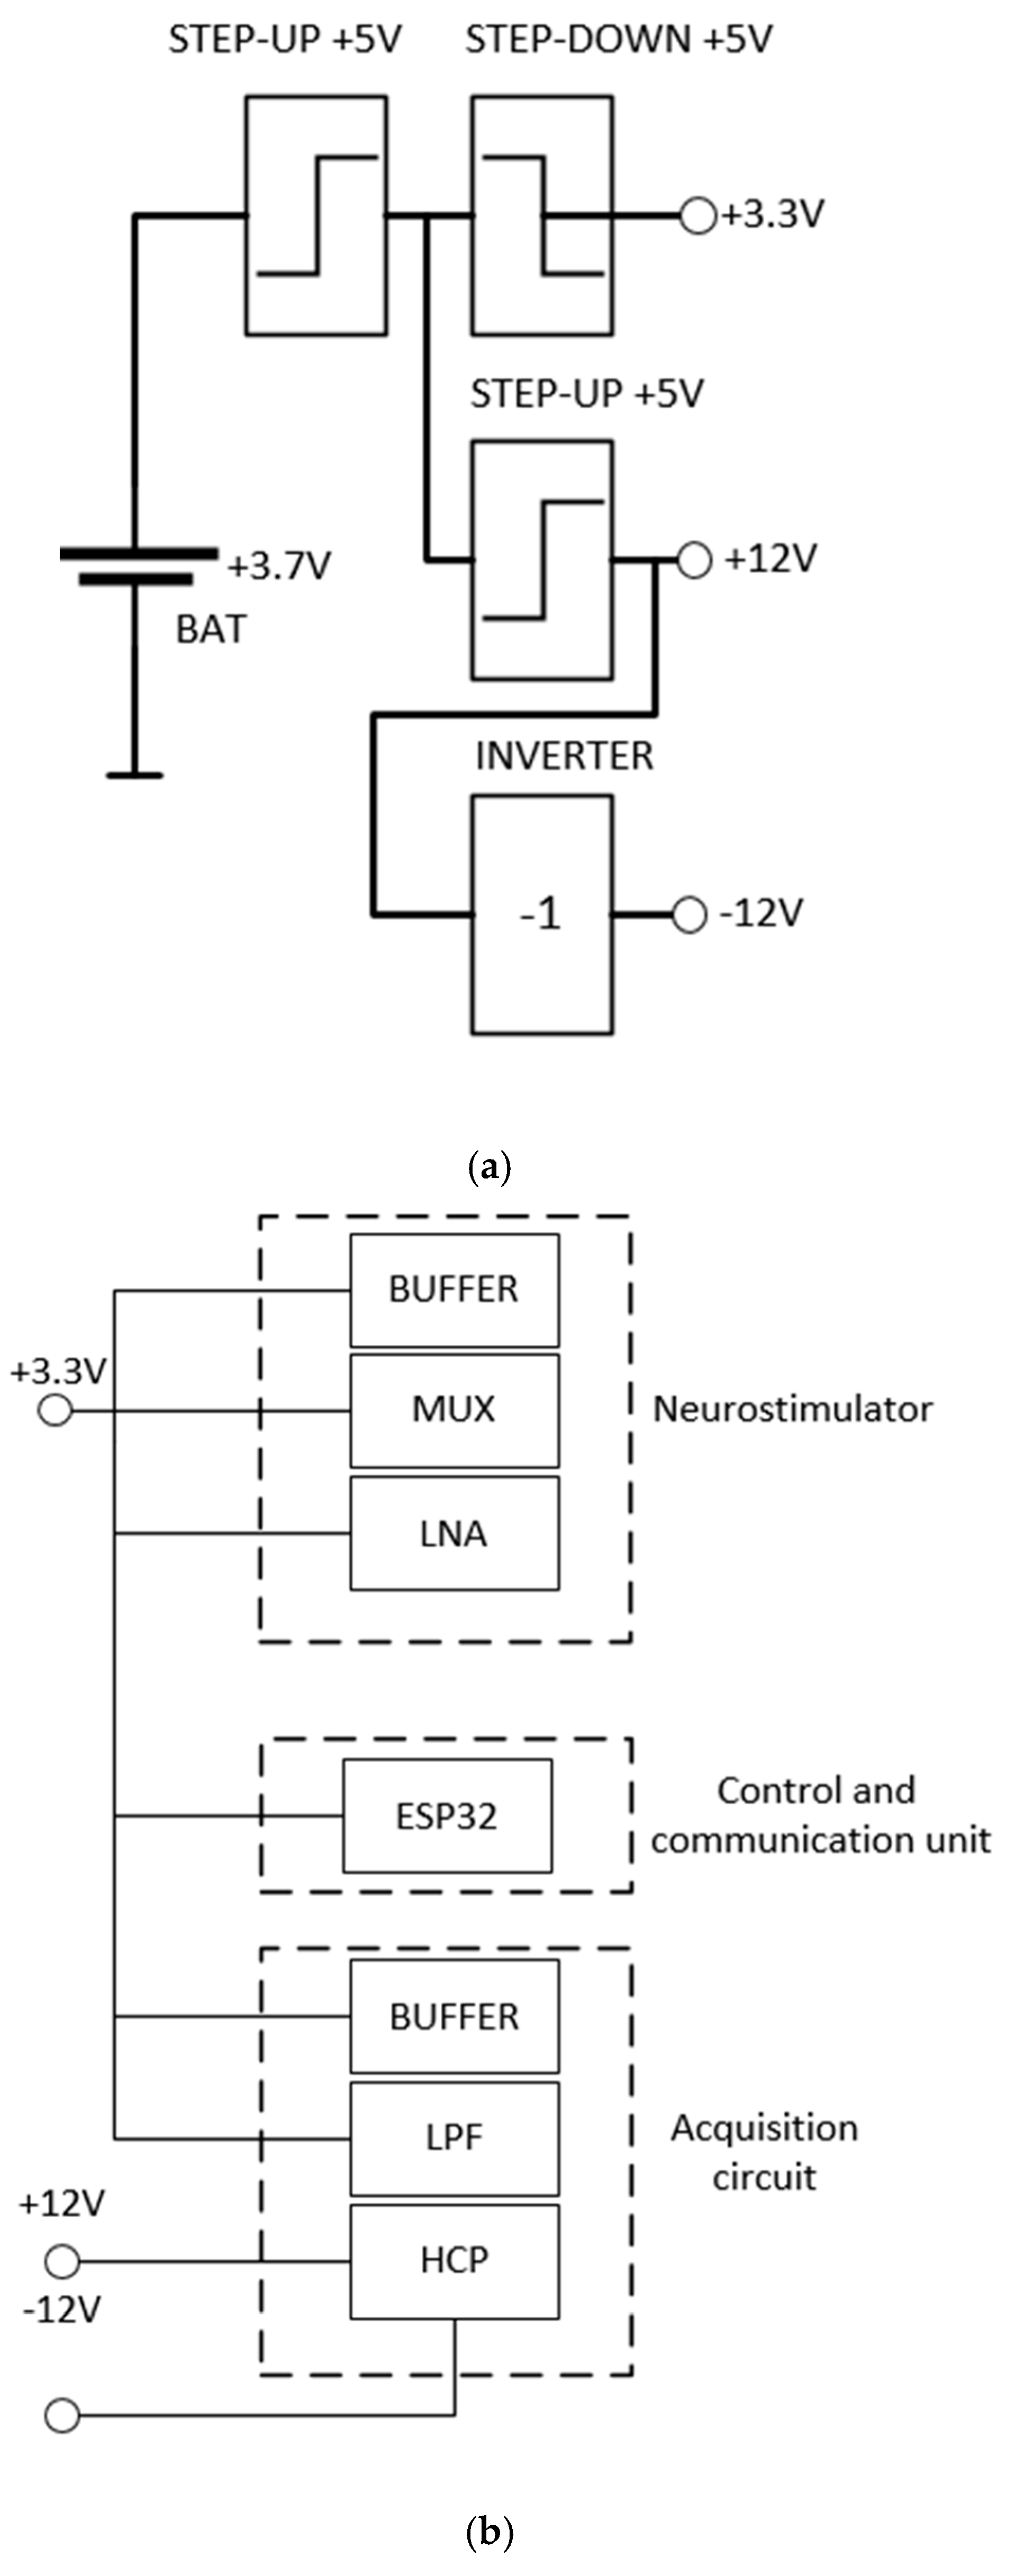
The power supply of the system consists of a 3.7 V lithium battery that supplies +5 V step-up from an MT3608 integrated circuit that generates 5 V. The resulting voltage supplies both a +3.3 V step-down and a +12 V step-up. The +12 V output supplies the circuit and an inverter from an ICL7660 integrated circuit, which results in a symmetrical supply of +12 V and –12 V.
Figure 10 shows the configuration used to supply the system. The 3.3 V output is used in the ESP32 microcontroller and the symmetrical output is used to polarize the amplifiers.
To optimize the use of the battery, and, therefore, to increase the lifetime of the system, the ESP32 can activate the stimulation and the acquisition portion separately.
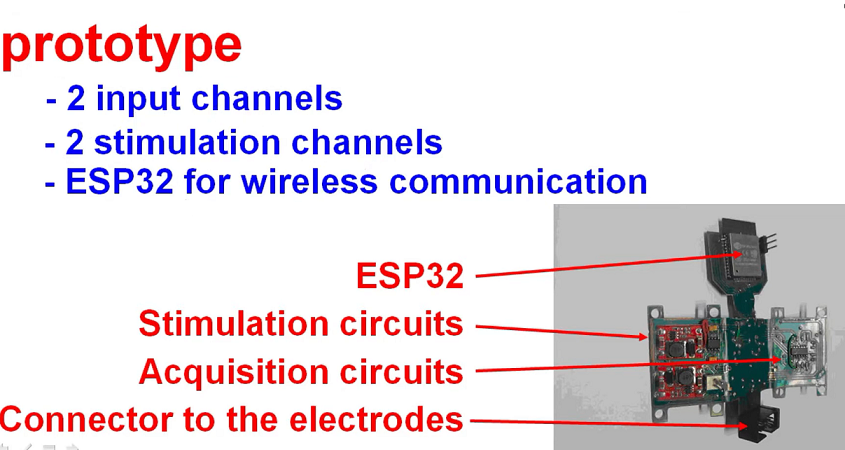
2.6. Prototype
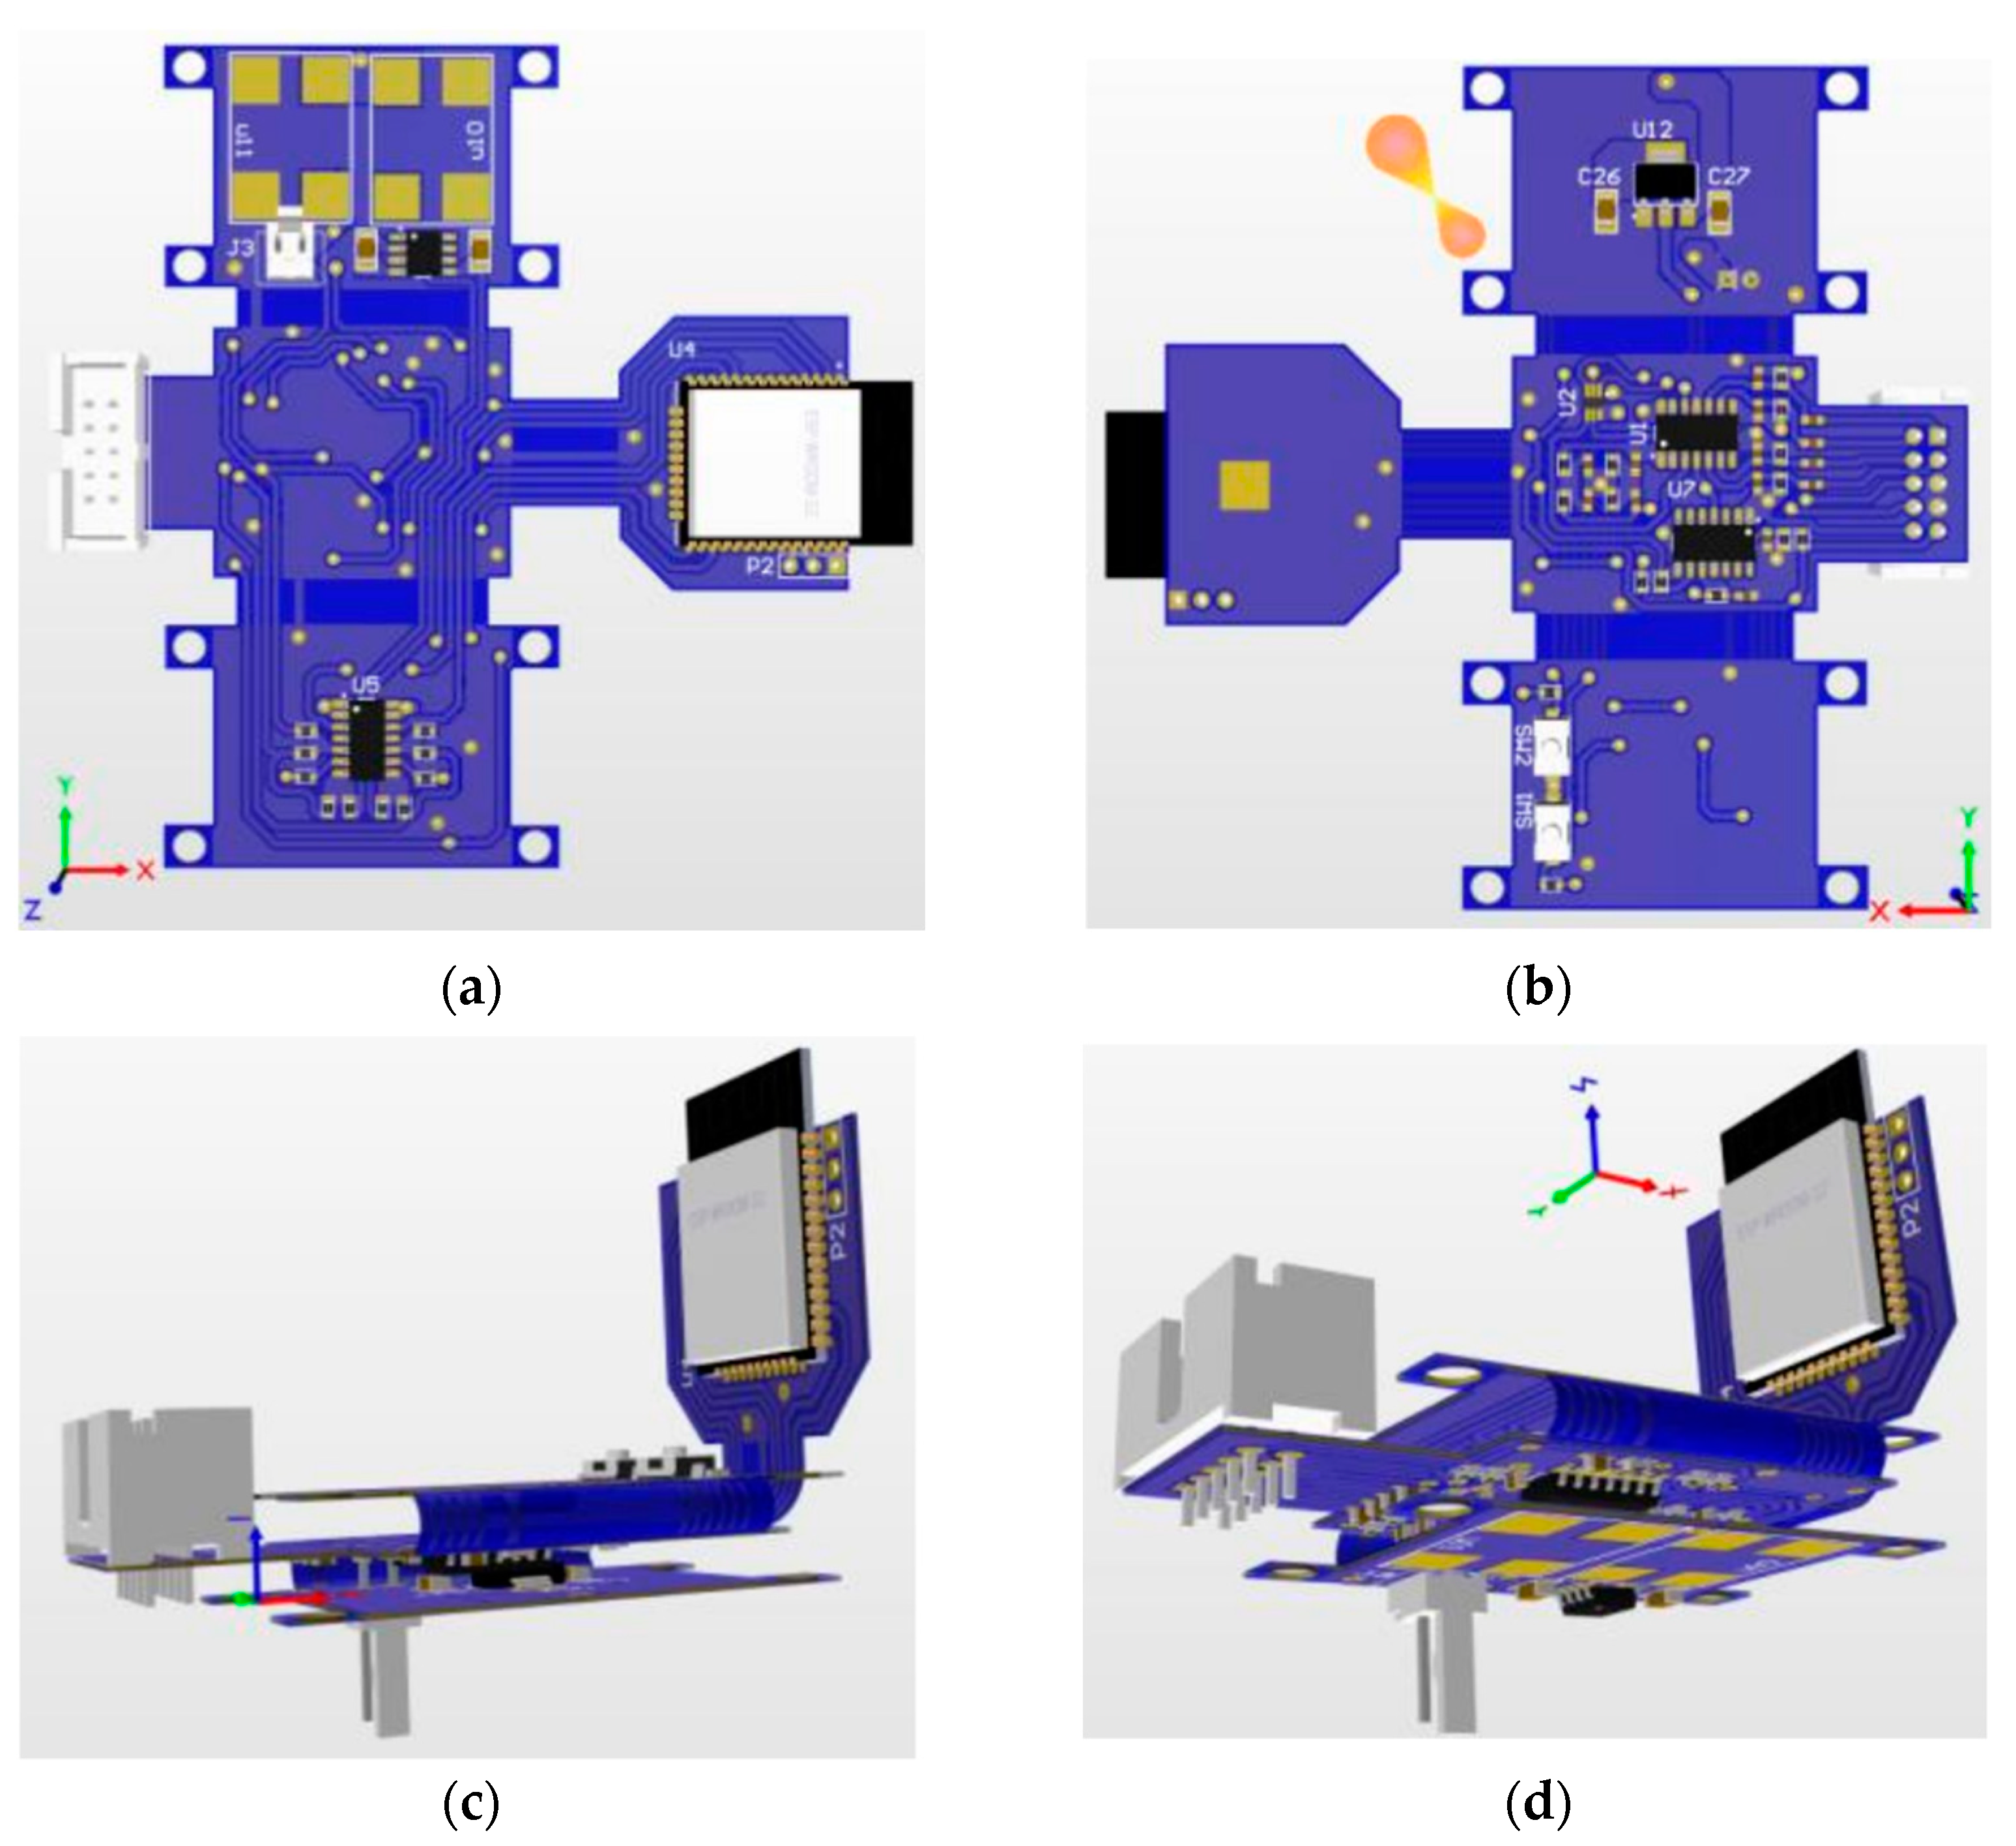
For the design and building of the printed circuit board, the Altium software (Student License) was used, due to its versatility in designing flexible printed circuit boards (PCBs). The PCB has the acquisition and stimulation, power management and wireless communication circuits. To miniaturize the system, the design configuration was flex-rigid, which has flexible parts and reduces the area of the PCB.
The PCB (without folds) had dimensions of 91 cm × 96 cm, totaling an area of 8736 cm². After performing the folds, it had dimensions of 56 cm × 35 cm and a height of 1.2 cm, totaling an area of 1960 cm². Thus, the space occupied by the printed circuit board had an area reduction of approximately 77.56%.
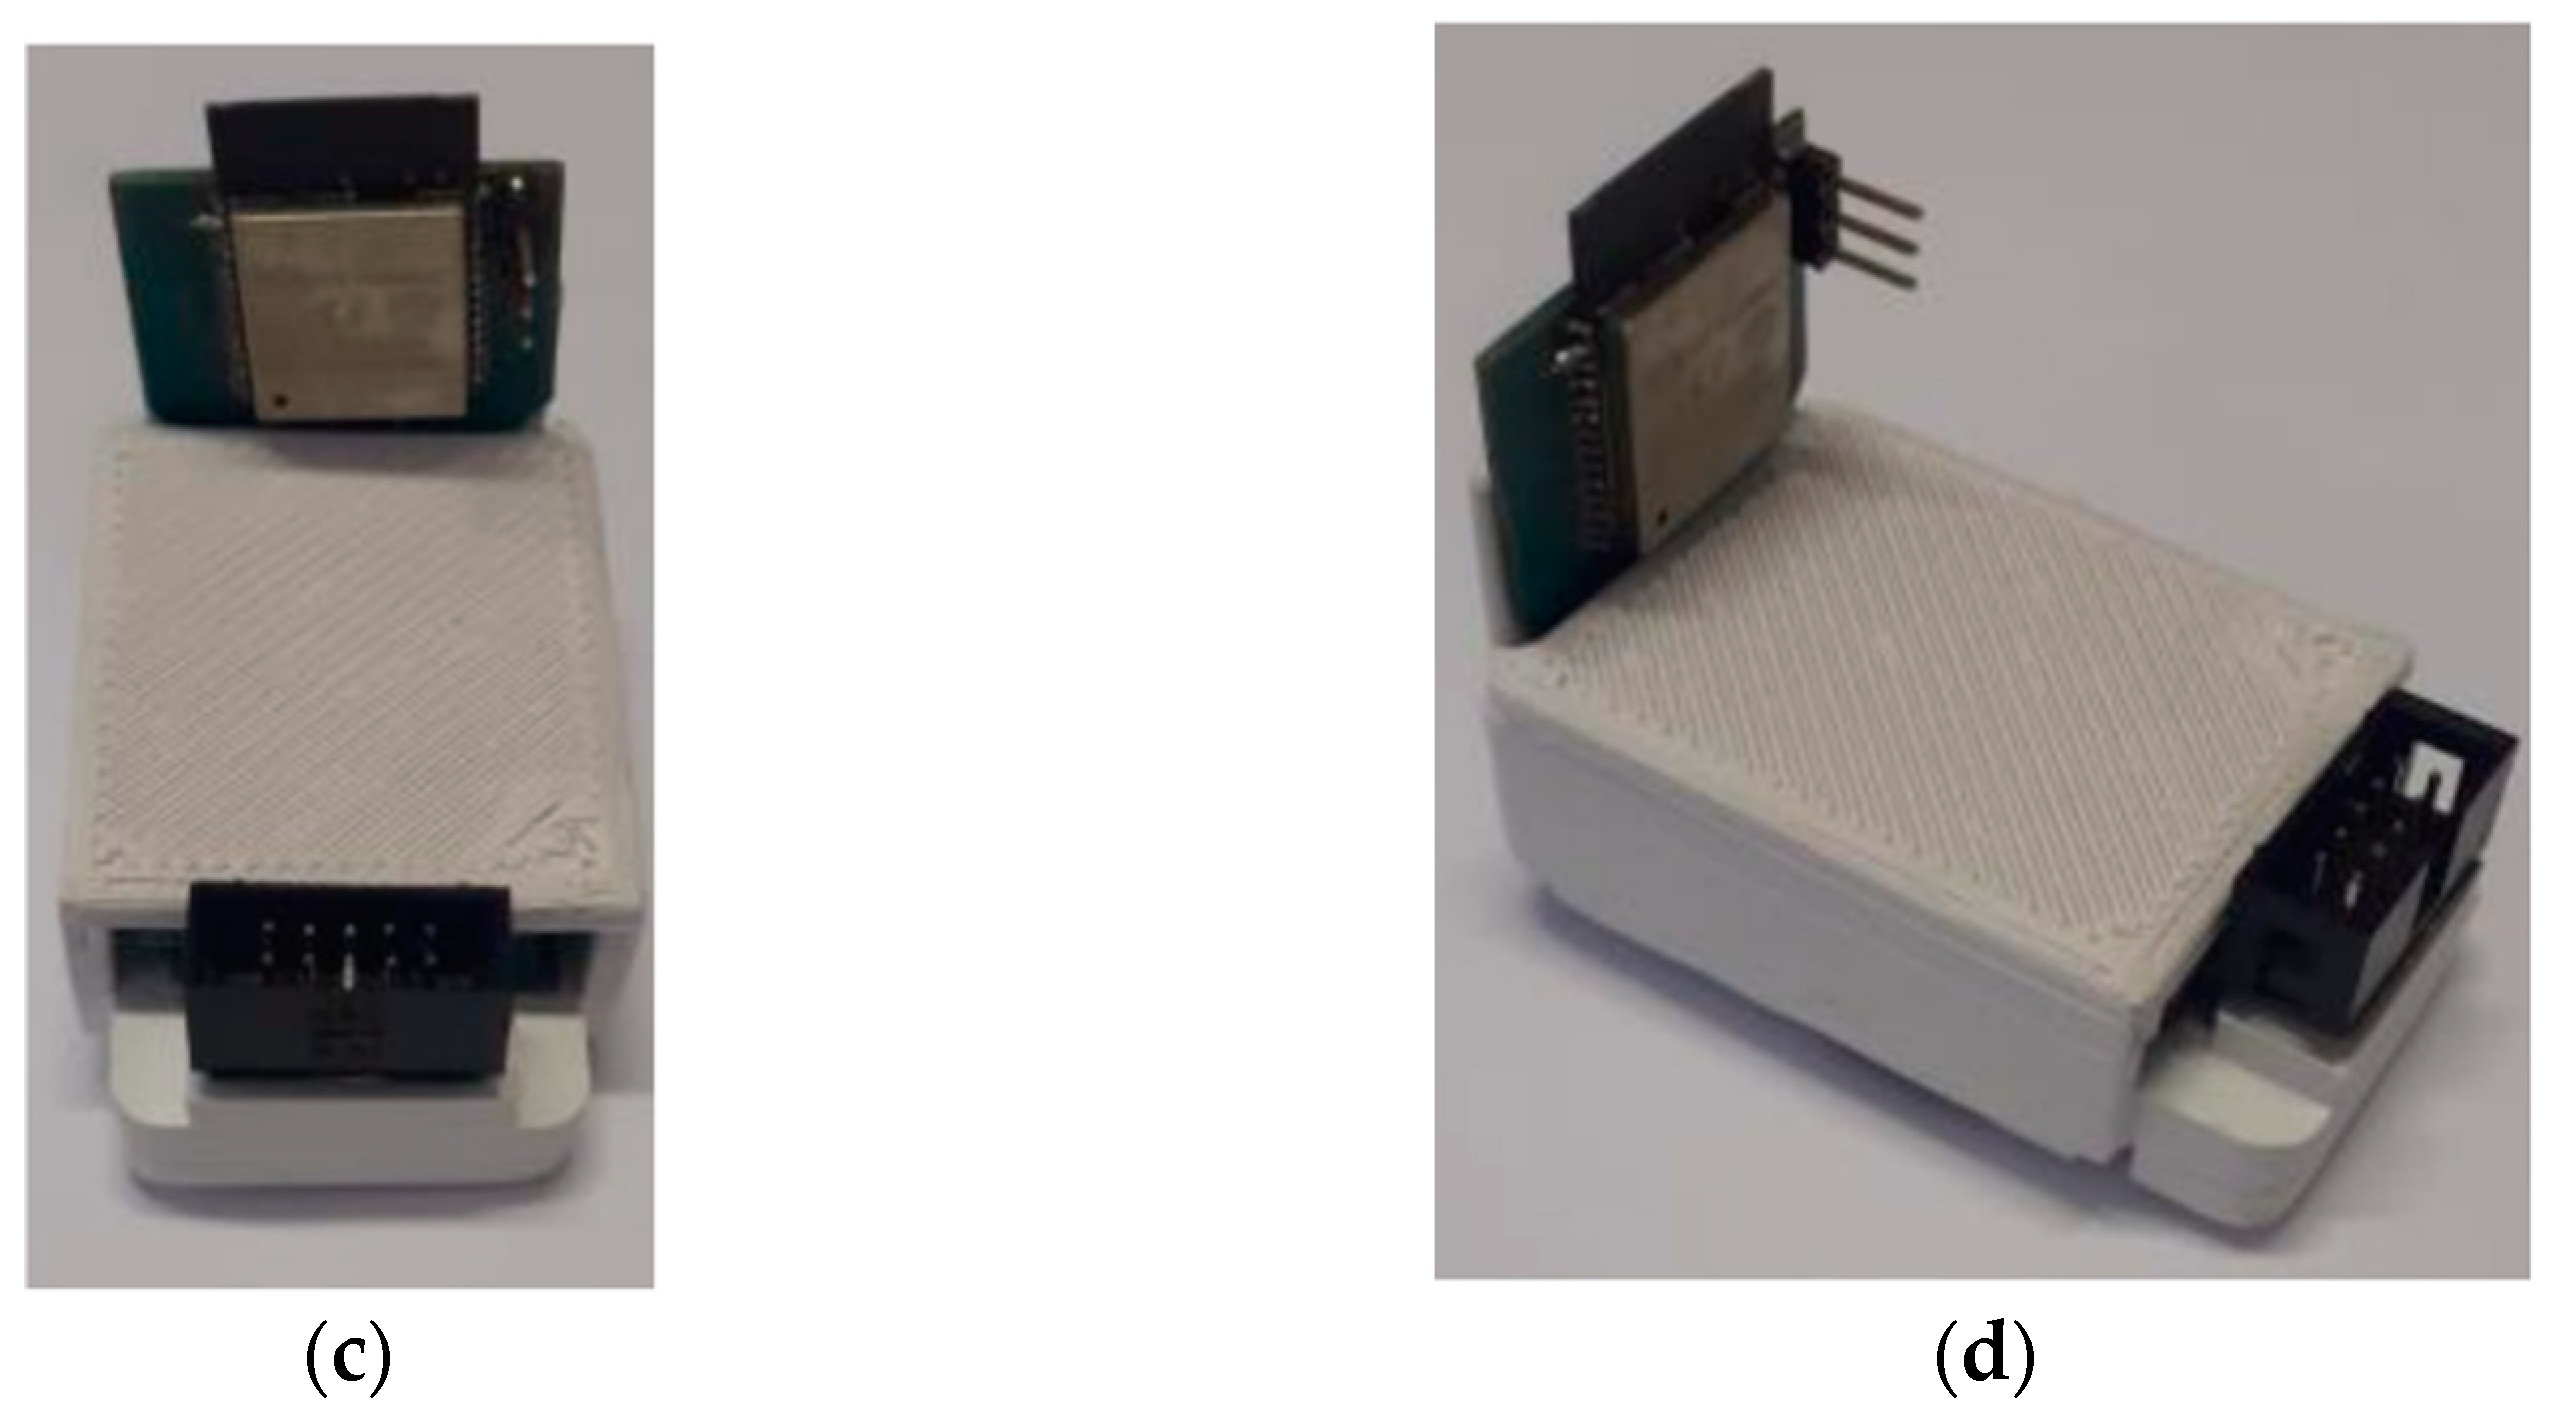
After carrying out the printed circuit board project, and with all the dimensions, the mechanical envelope was defined to house the electronic part. For the design of the box, the Autodesk Inventor 2022 (Student License) software was used. The box, after being finished, had dimensions of 58 cm × 37 cm × 29 cm. After the design, 3D printing was used to manufacture the box.
Figure 11 shows the views of the PCB project, the PCB inserted in the box after manufacture respectively, while
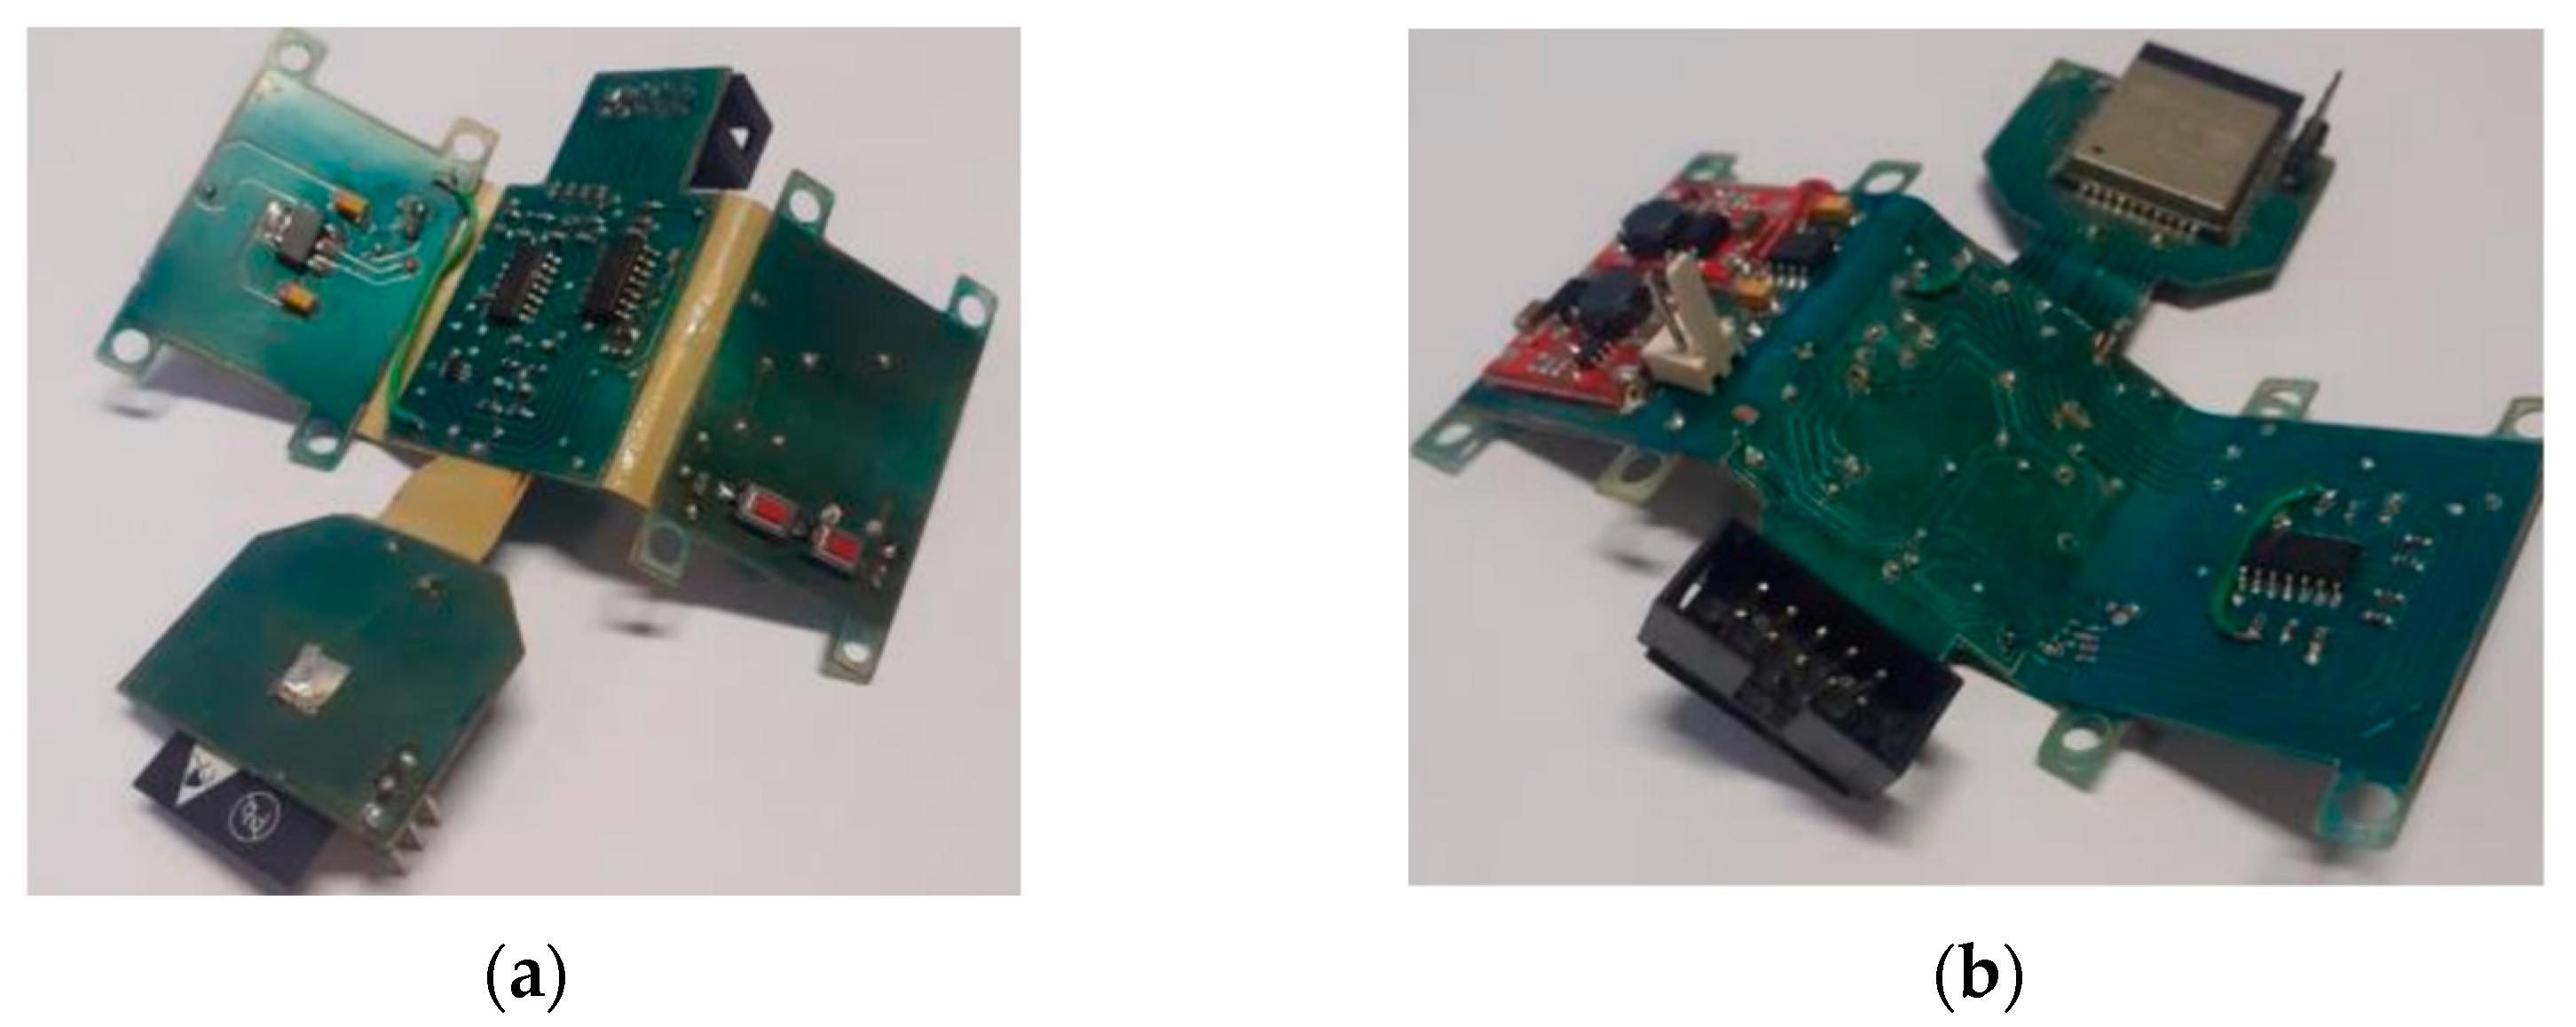
Figure 12 shows the manufactured board.
3. Experimental Results
3.1. Neurostimulator tests
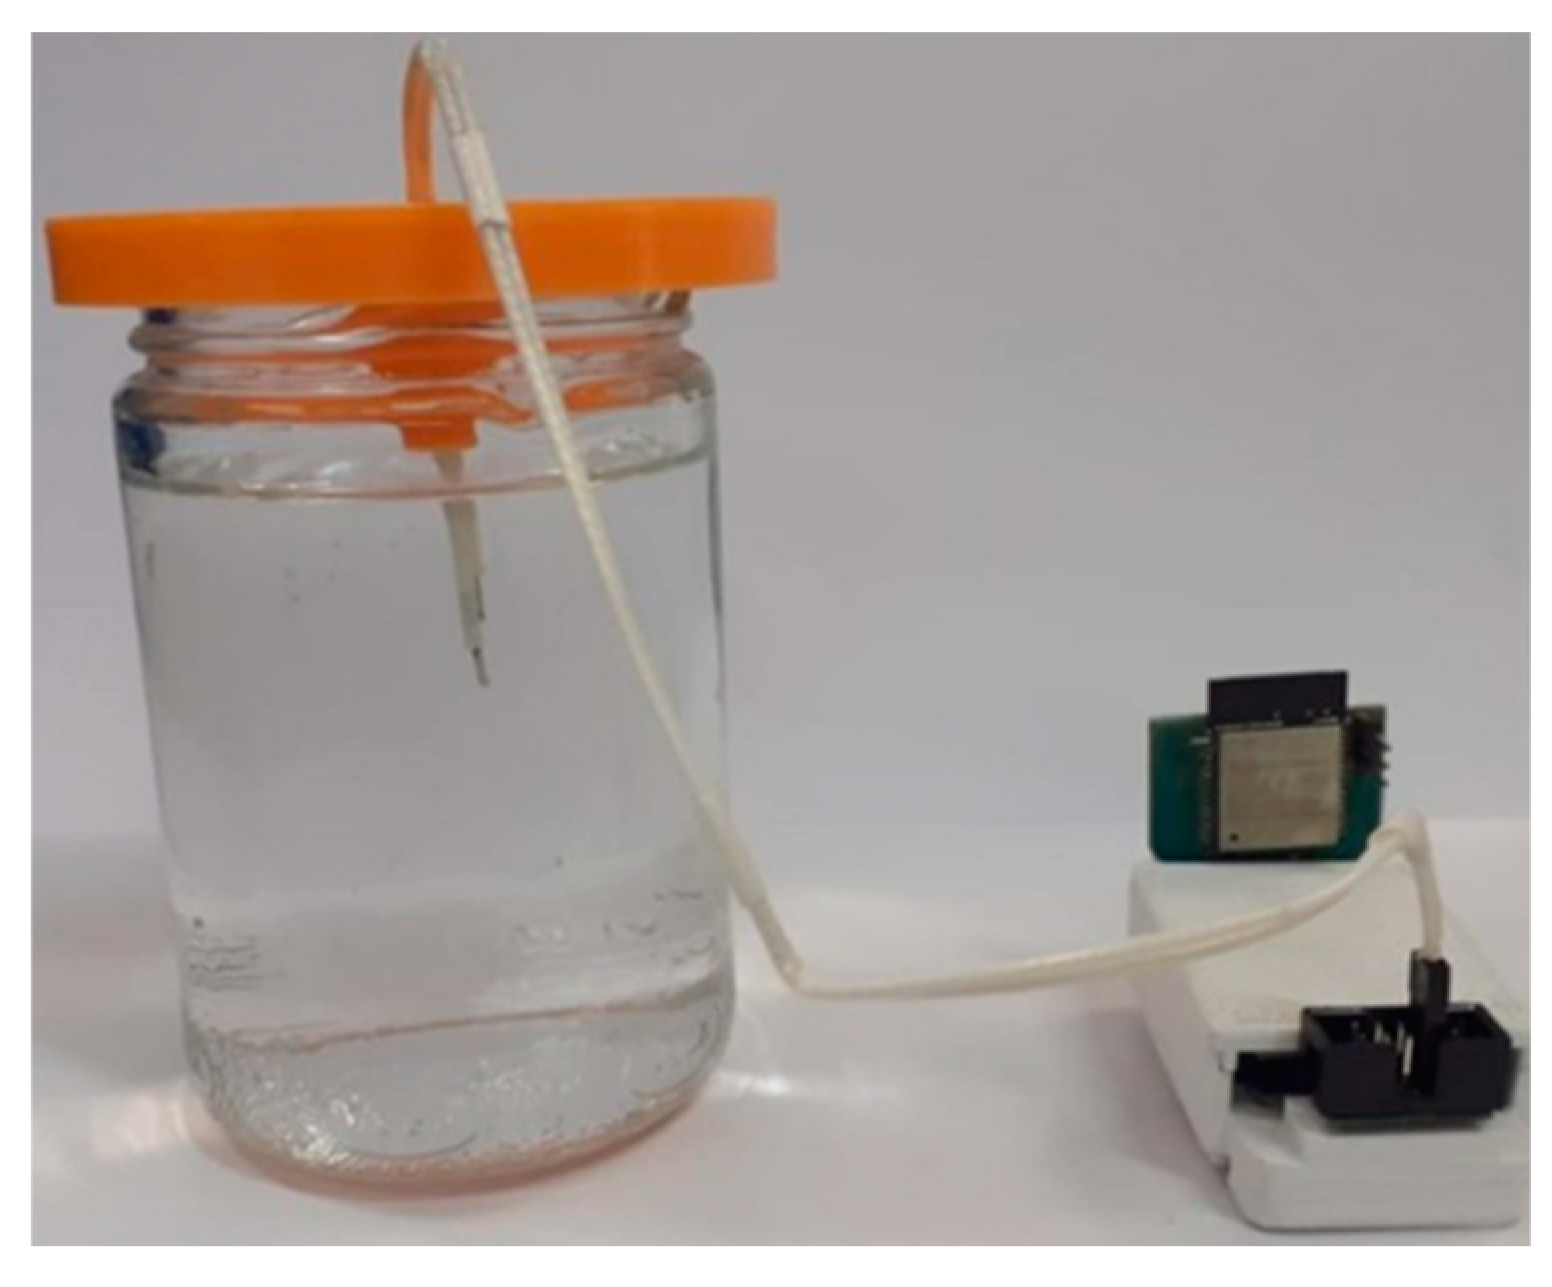
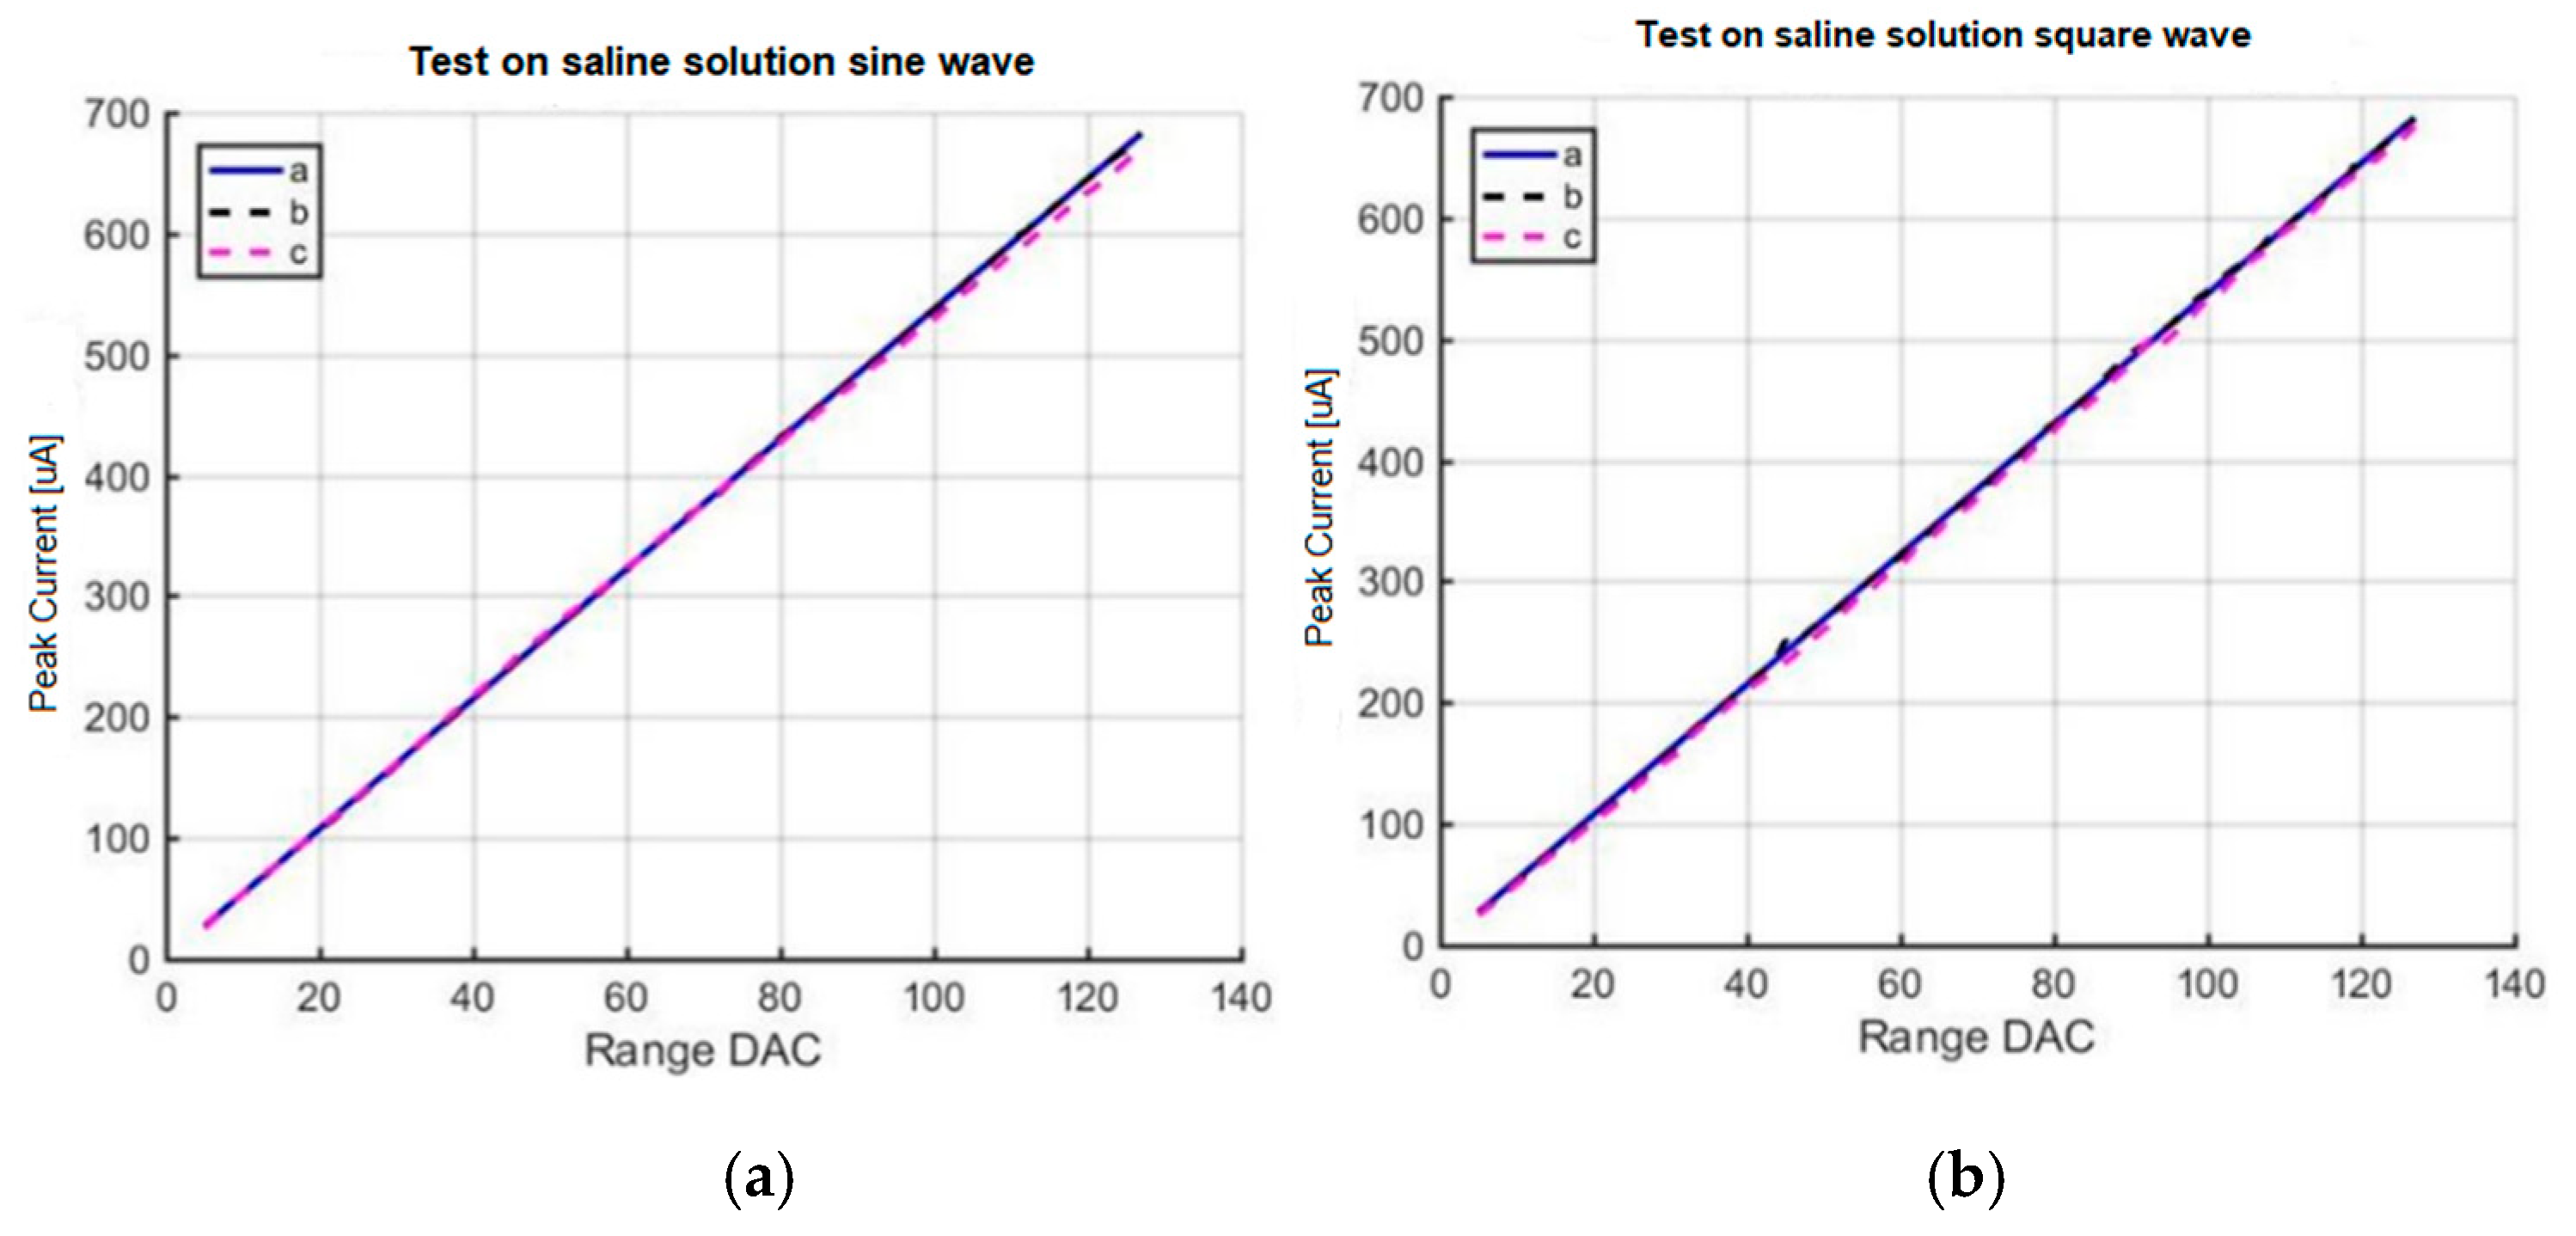
The neurostimulator was tested in a saline solution that simulated brain tissue. The objective of this experiment was to measure the electrical current indirectly by measuring the voltage applied over a variable impedance.
Figure 13 shows the setup of the experiment to test the stimulation circuit.
3.2. Acquisition System
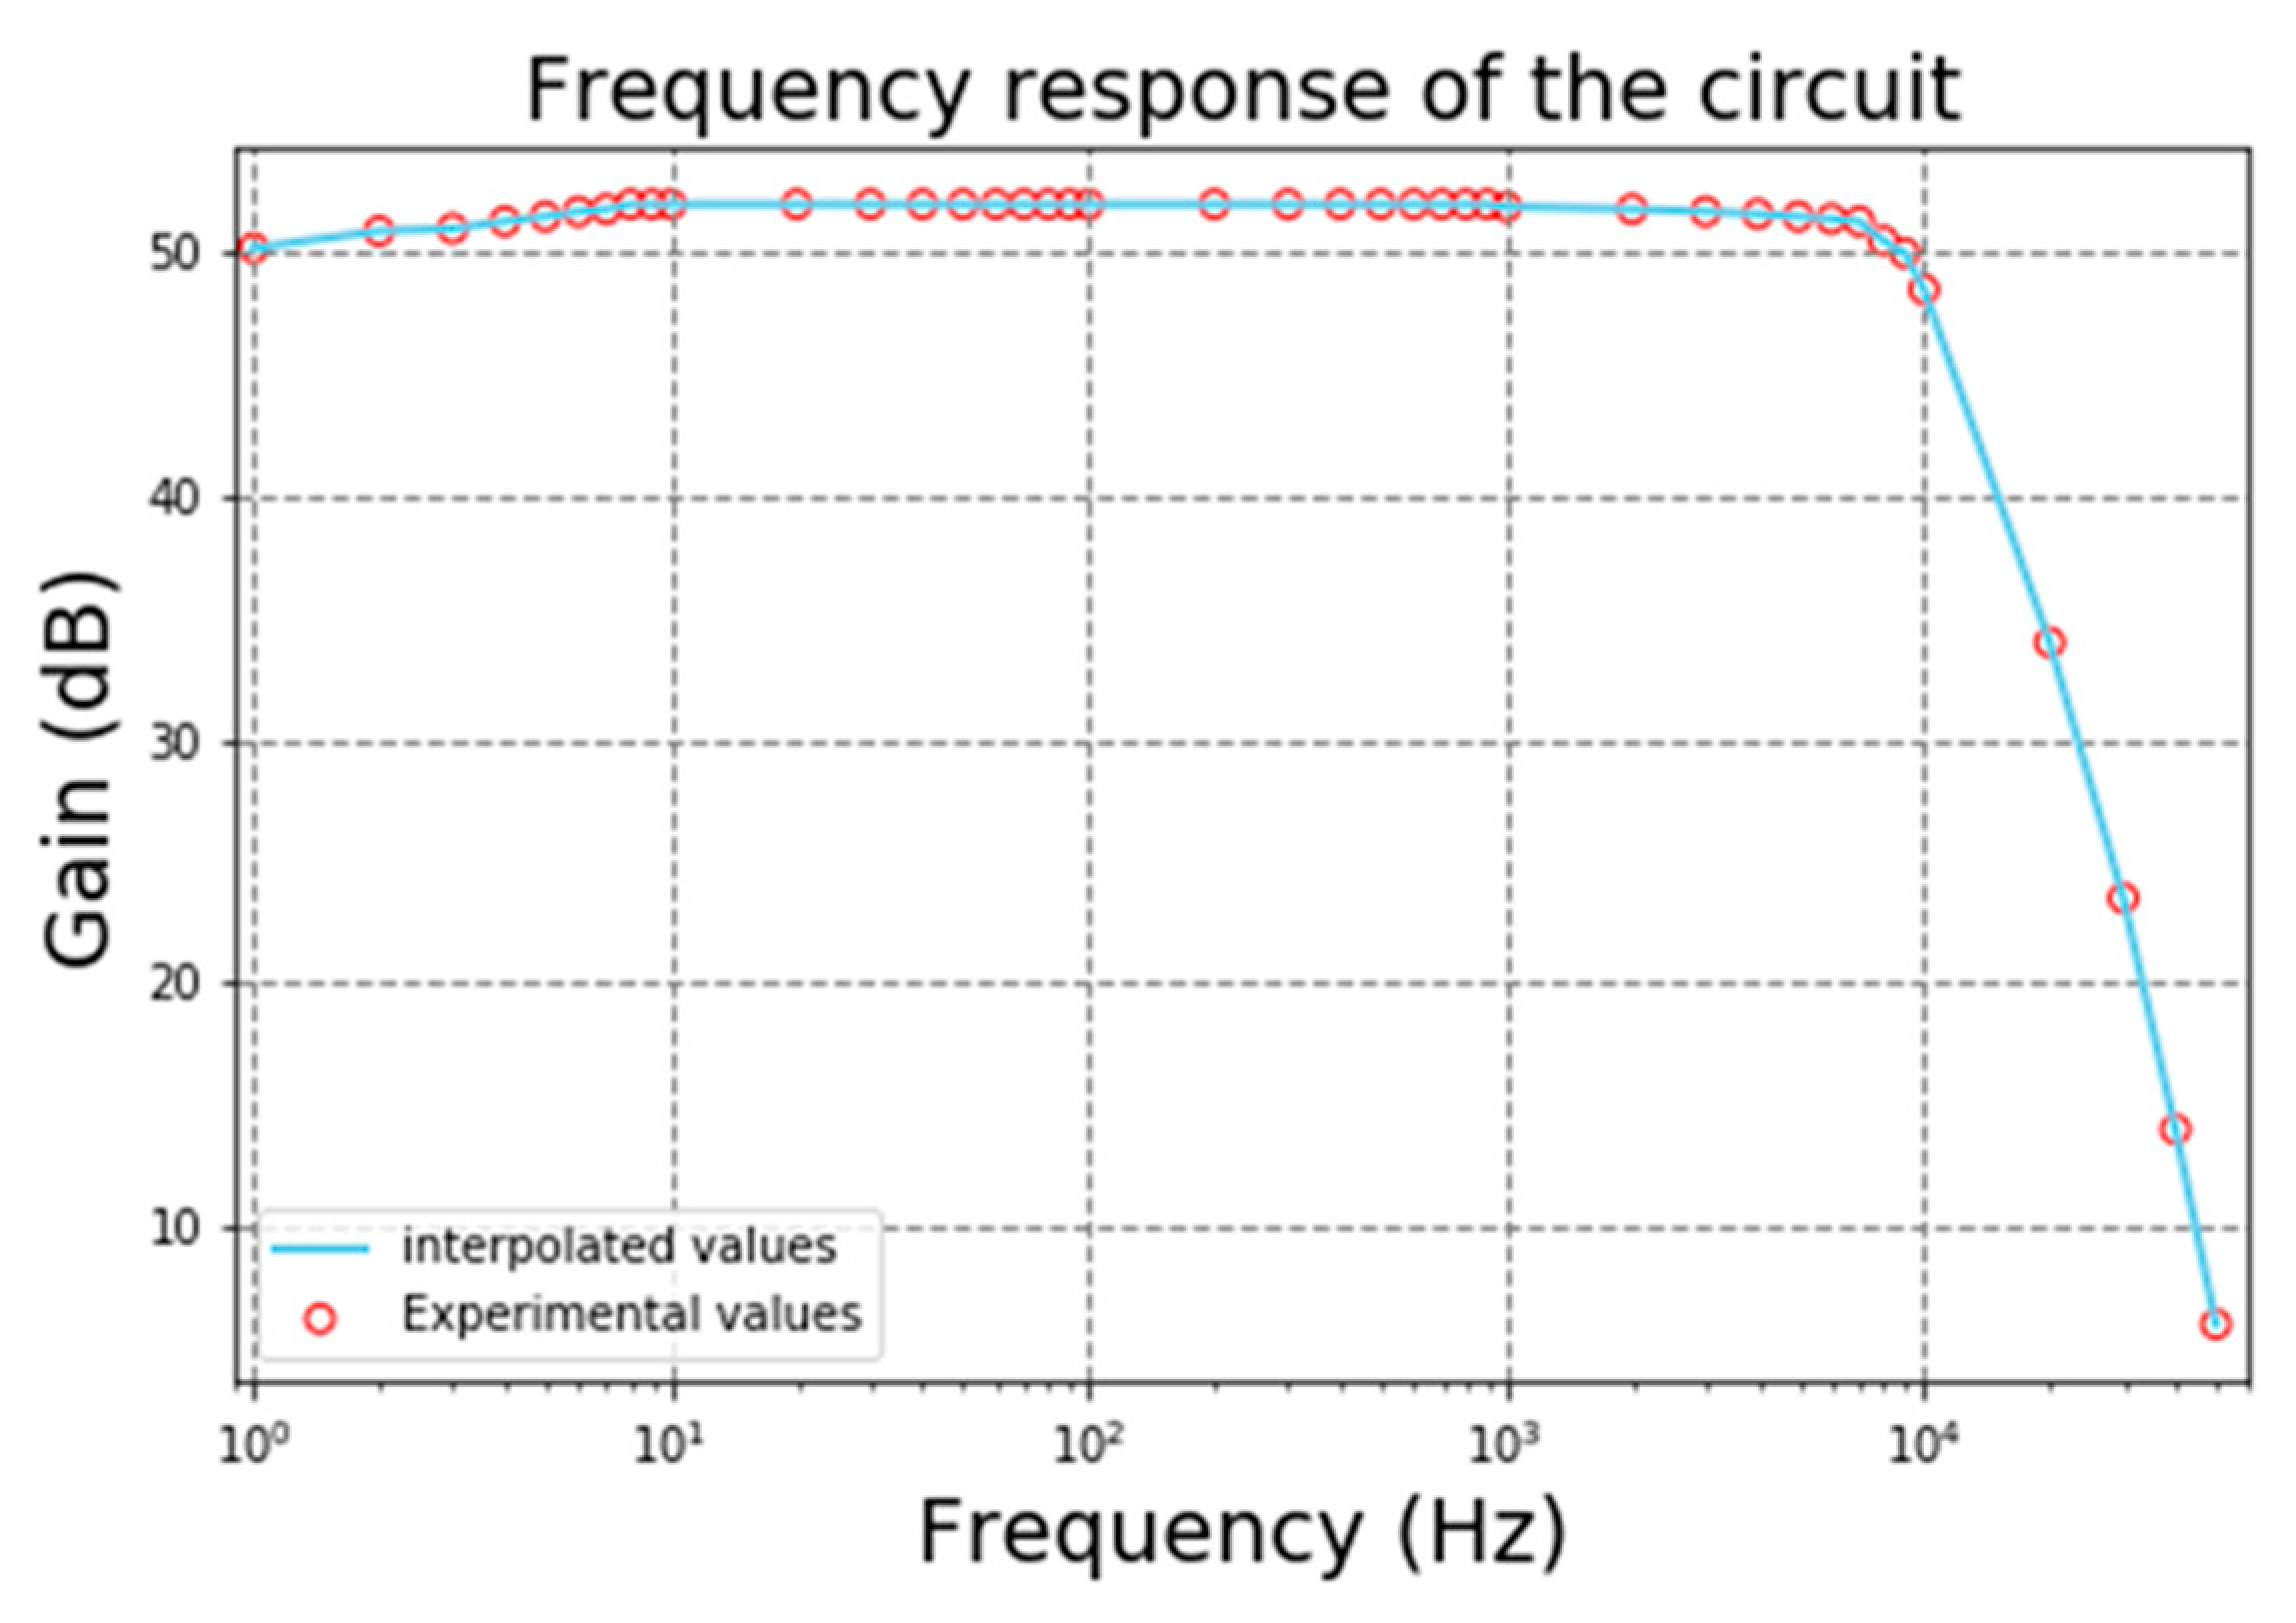
The acquisition system for biopotentials was tested to obtain the frequency response of the gain of the circuit. These tests were made using a small amplitude signal generator with a sine waveform and starting frequency of 1 Hz. The frequency gradually increased until a decrease of 3 dB of the gain, which occurs in the cutoff frequency. The gain plot is depicted in
Figure 15. The blue dots represent the experimental values of gain measured by the oscilloscope. The average gain for most frequencies is approximately 53 dB and the cutoff frequency is roughly 7.5 kHz. The attenuation after the cutoff frequency is around 60 dB per decade.
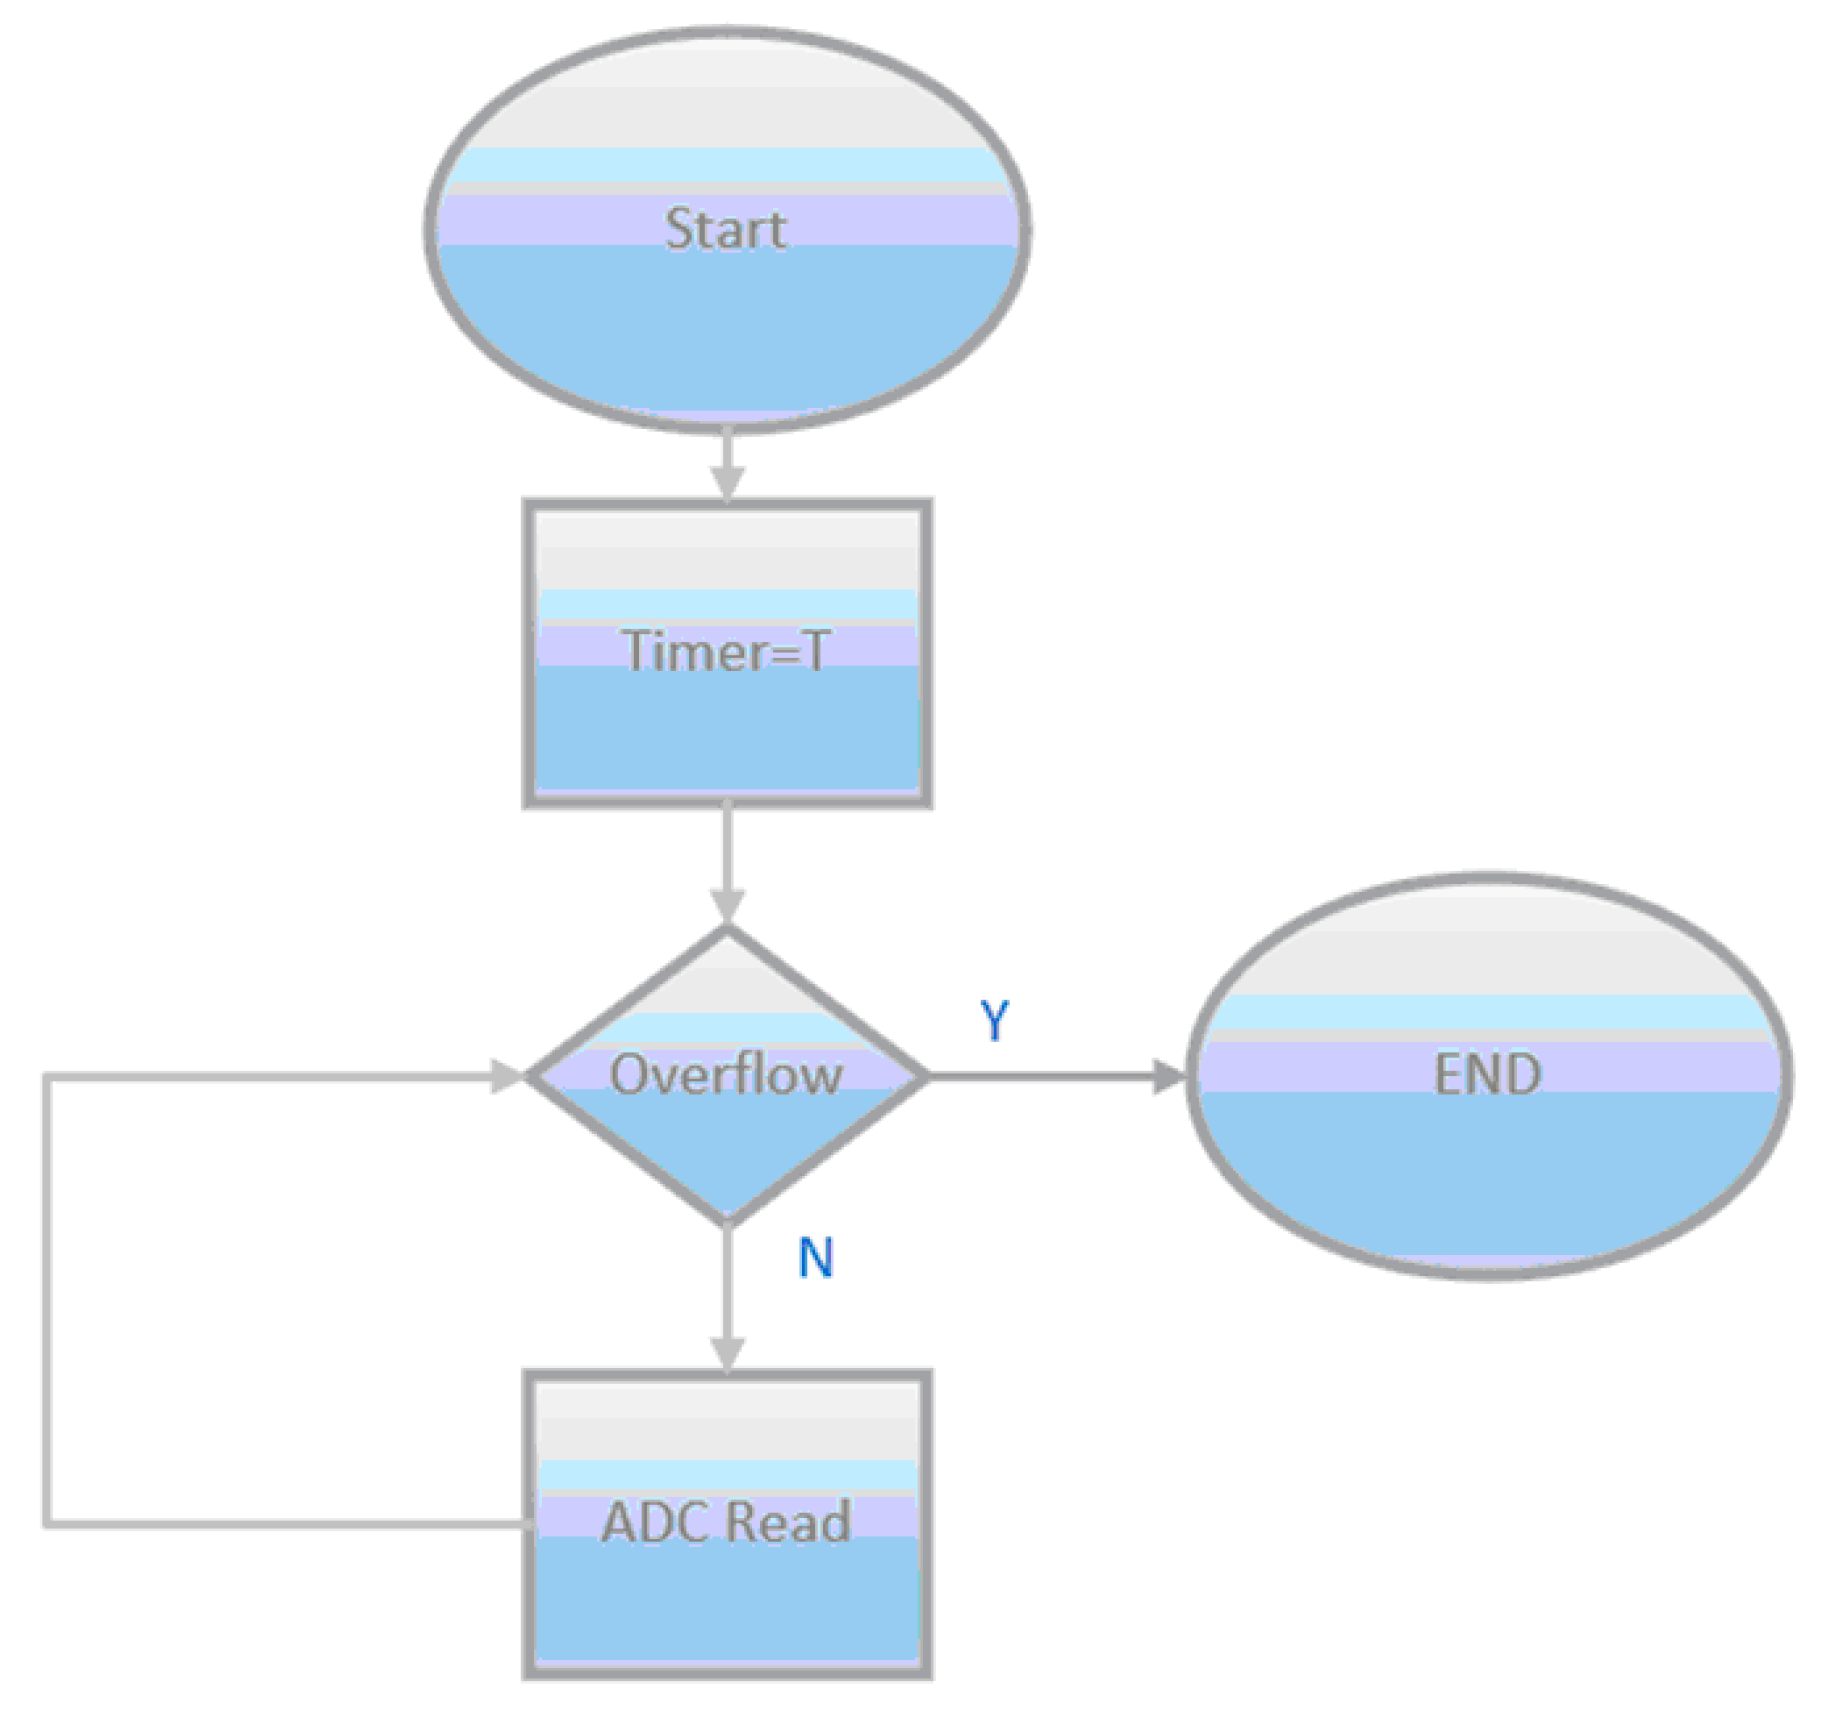
Another important parameter is the acquisition rate, which was obtained experimentally by applying a sinusoidal 1 kHz signal to the ADC of the ESP32. By the time of one whole period of 1 ms, 115 samples were obtained, which implies a sample rate of 115000 samples per second.
3.3. Software Implementation
Figure 16 shows the software routine used to control the test. Initially, the timer receives the period value and successive iterations are performed until the timer reaches zero. The number of iterations before the overflow happens is the acquisition rate by milliseconds which is the period of the signal.
The software that controls the DBS system was developed in C#. It receives data provided by the user, such as waveform, frequency, pulse width and amplitude, and transfers this information to the ESP32. The ESP32 has two cores that control separately the acquisition and stimulation circuits. The ADC reads 100 samples and then the software activates the DAC, which generates the stimulation signal.
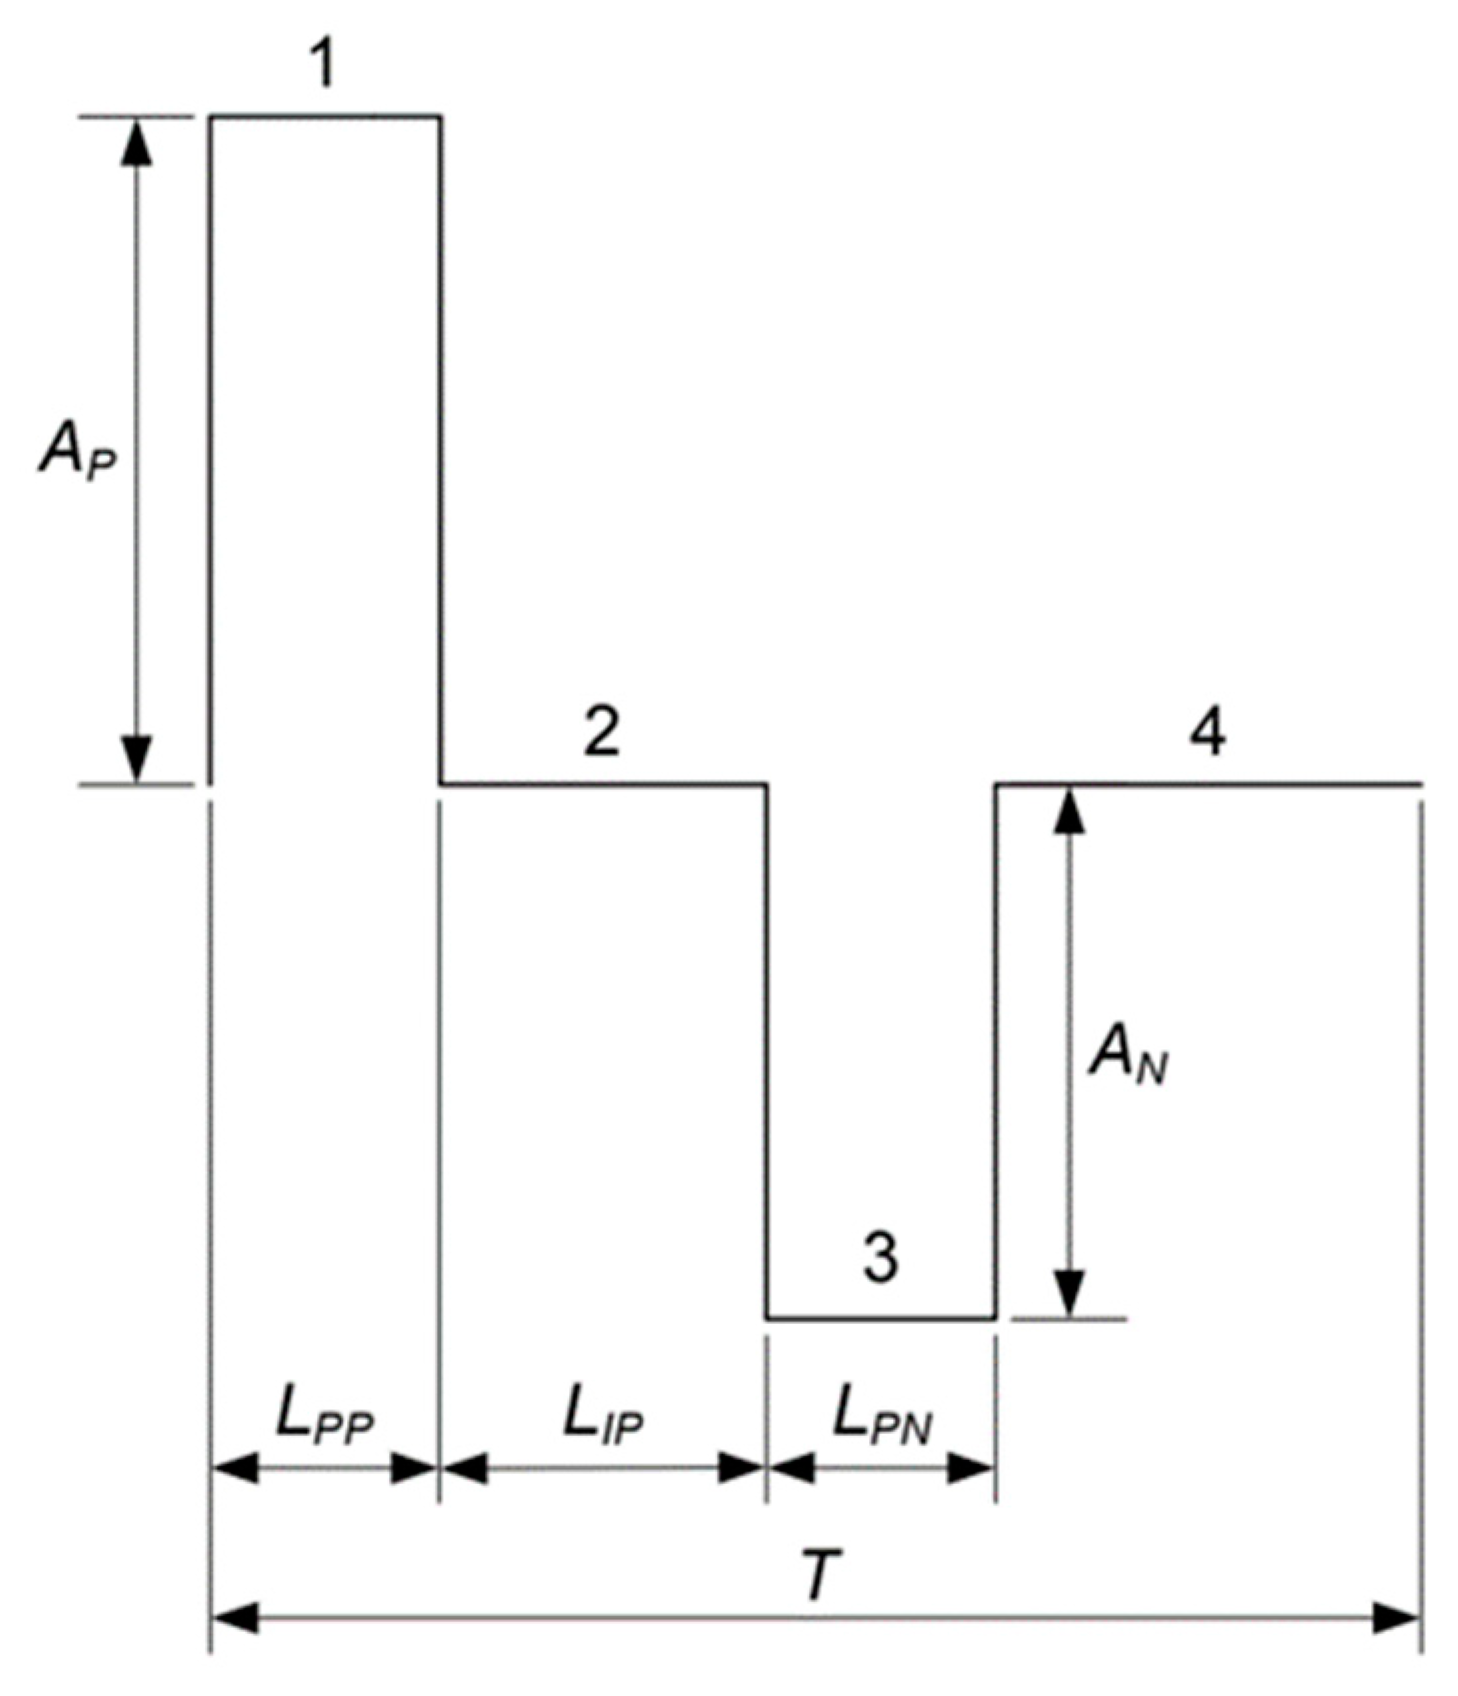
The pulse waveform is divided into four parts. The first step is the positive pulse, the second step is the time between pulses, the third step is the negative pulse, and the final step is the time interval between pulses.
Figure 17 shows a diagram of a generic waveform generated by the system.
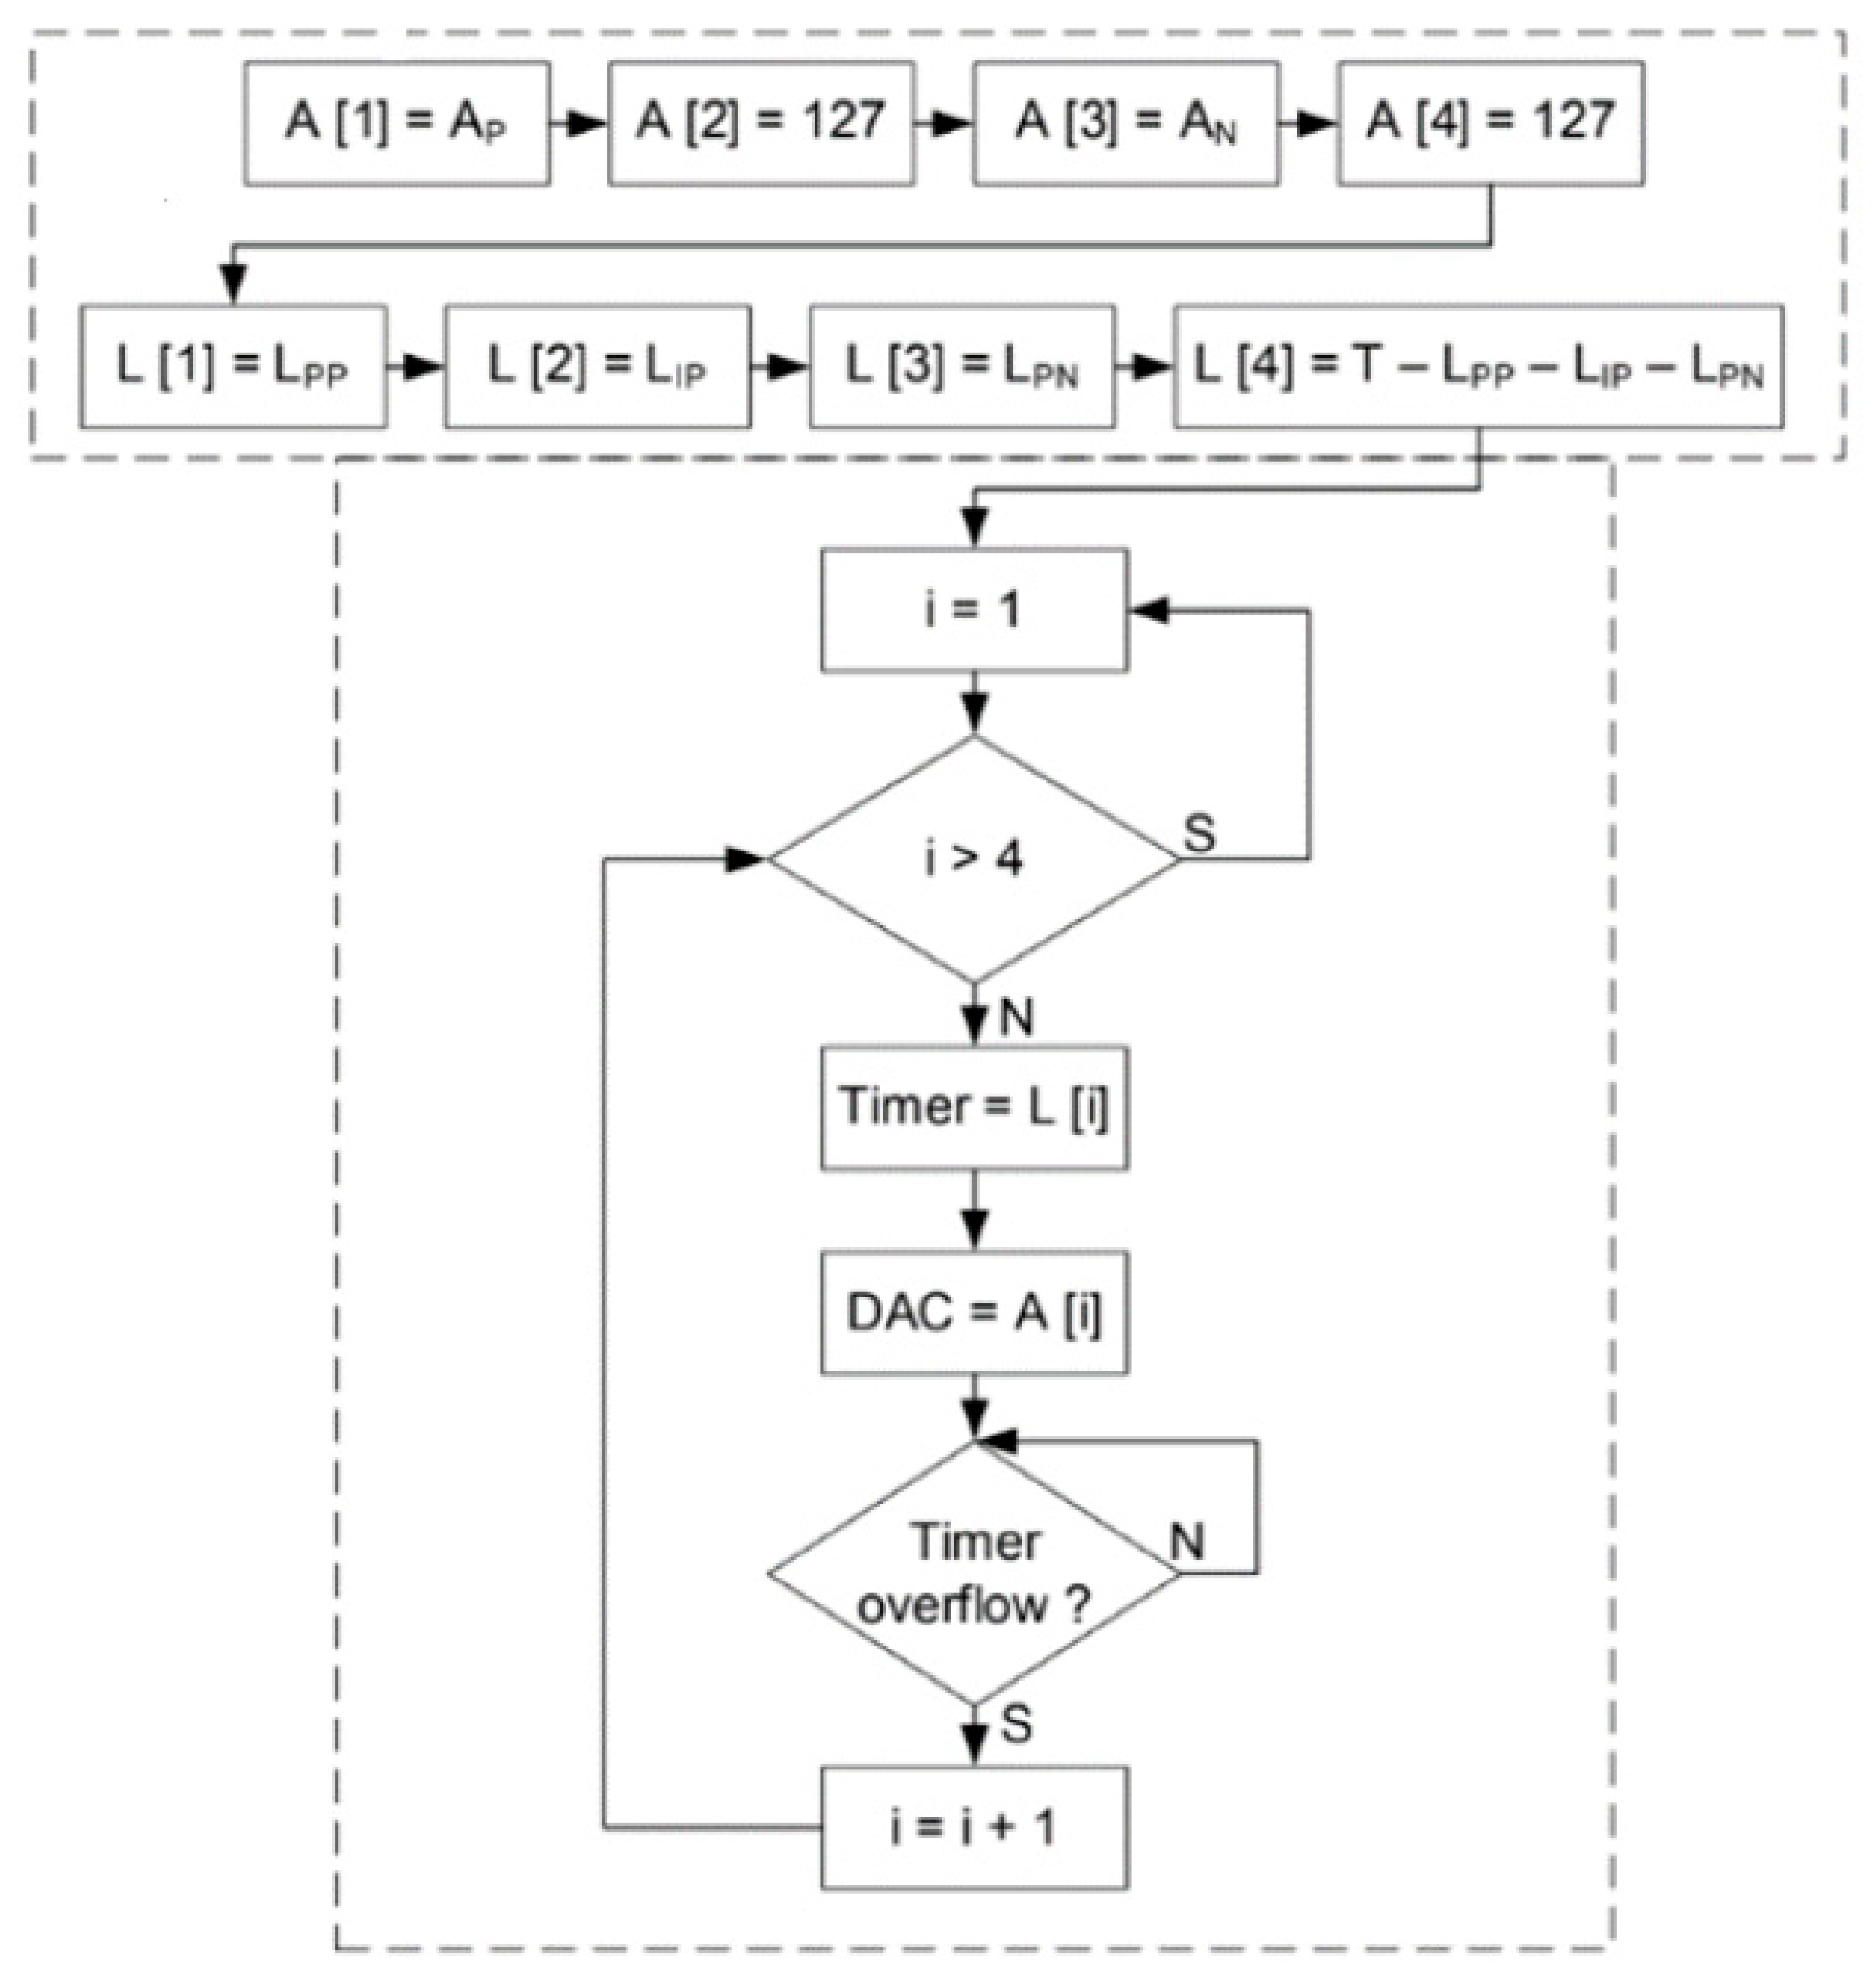
The complete routine from the pulse generation and the timer count is shown in figure
Figure 18.
A and
L are the pulse amplitude and pulse width values over time, respectively. The amplitude value shown in
Figure 18 is expressed in bits and varies from 0 to 255. The 127 value is attributed to A[
2] and to A[
4] as the middle of the maximum and minimum values that could be achieved by the stimulator, whereas the Ap and An values, which are assigned to A[
1] and A[
3], are the maximum and minimum values used for the pulse.
Figure 18 shows also the timer count routine with values like illustrated in the flowchart of
Figure 17.
3.4. Power consumpsion tests
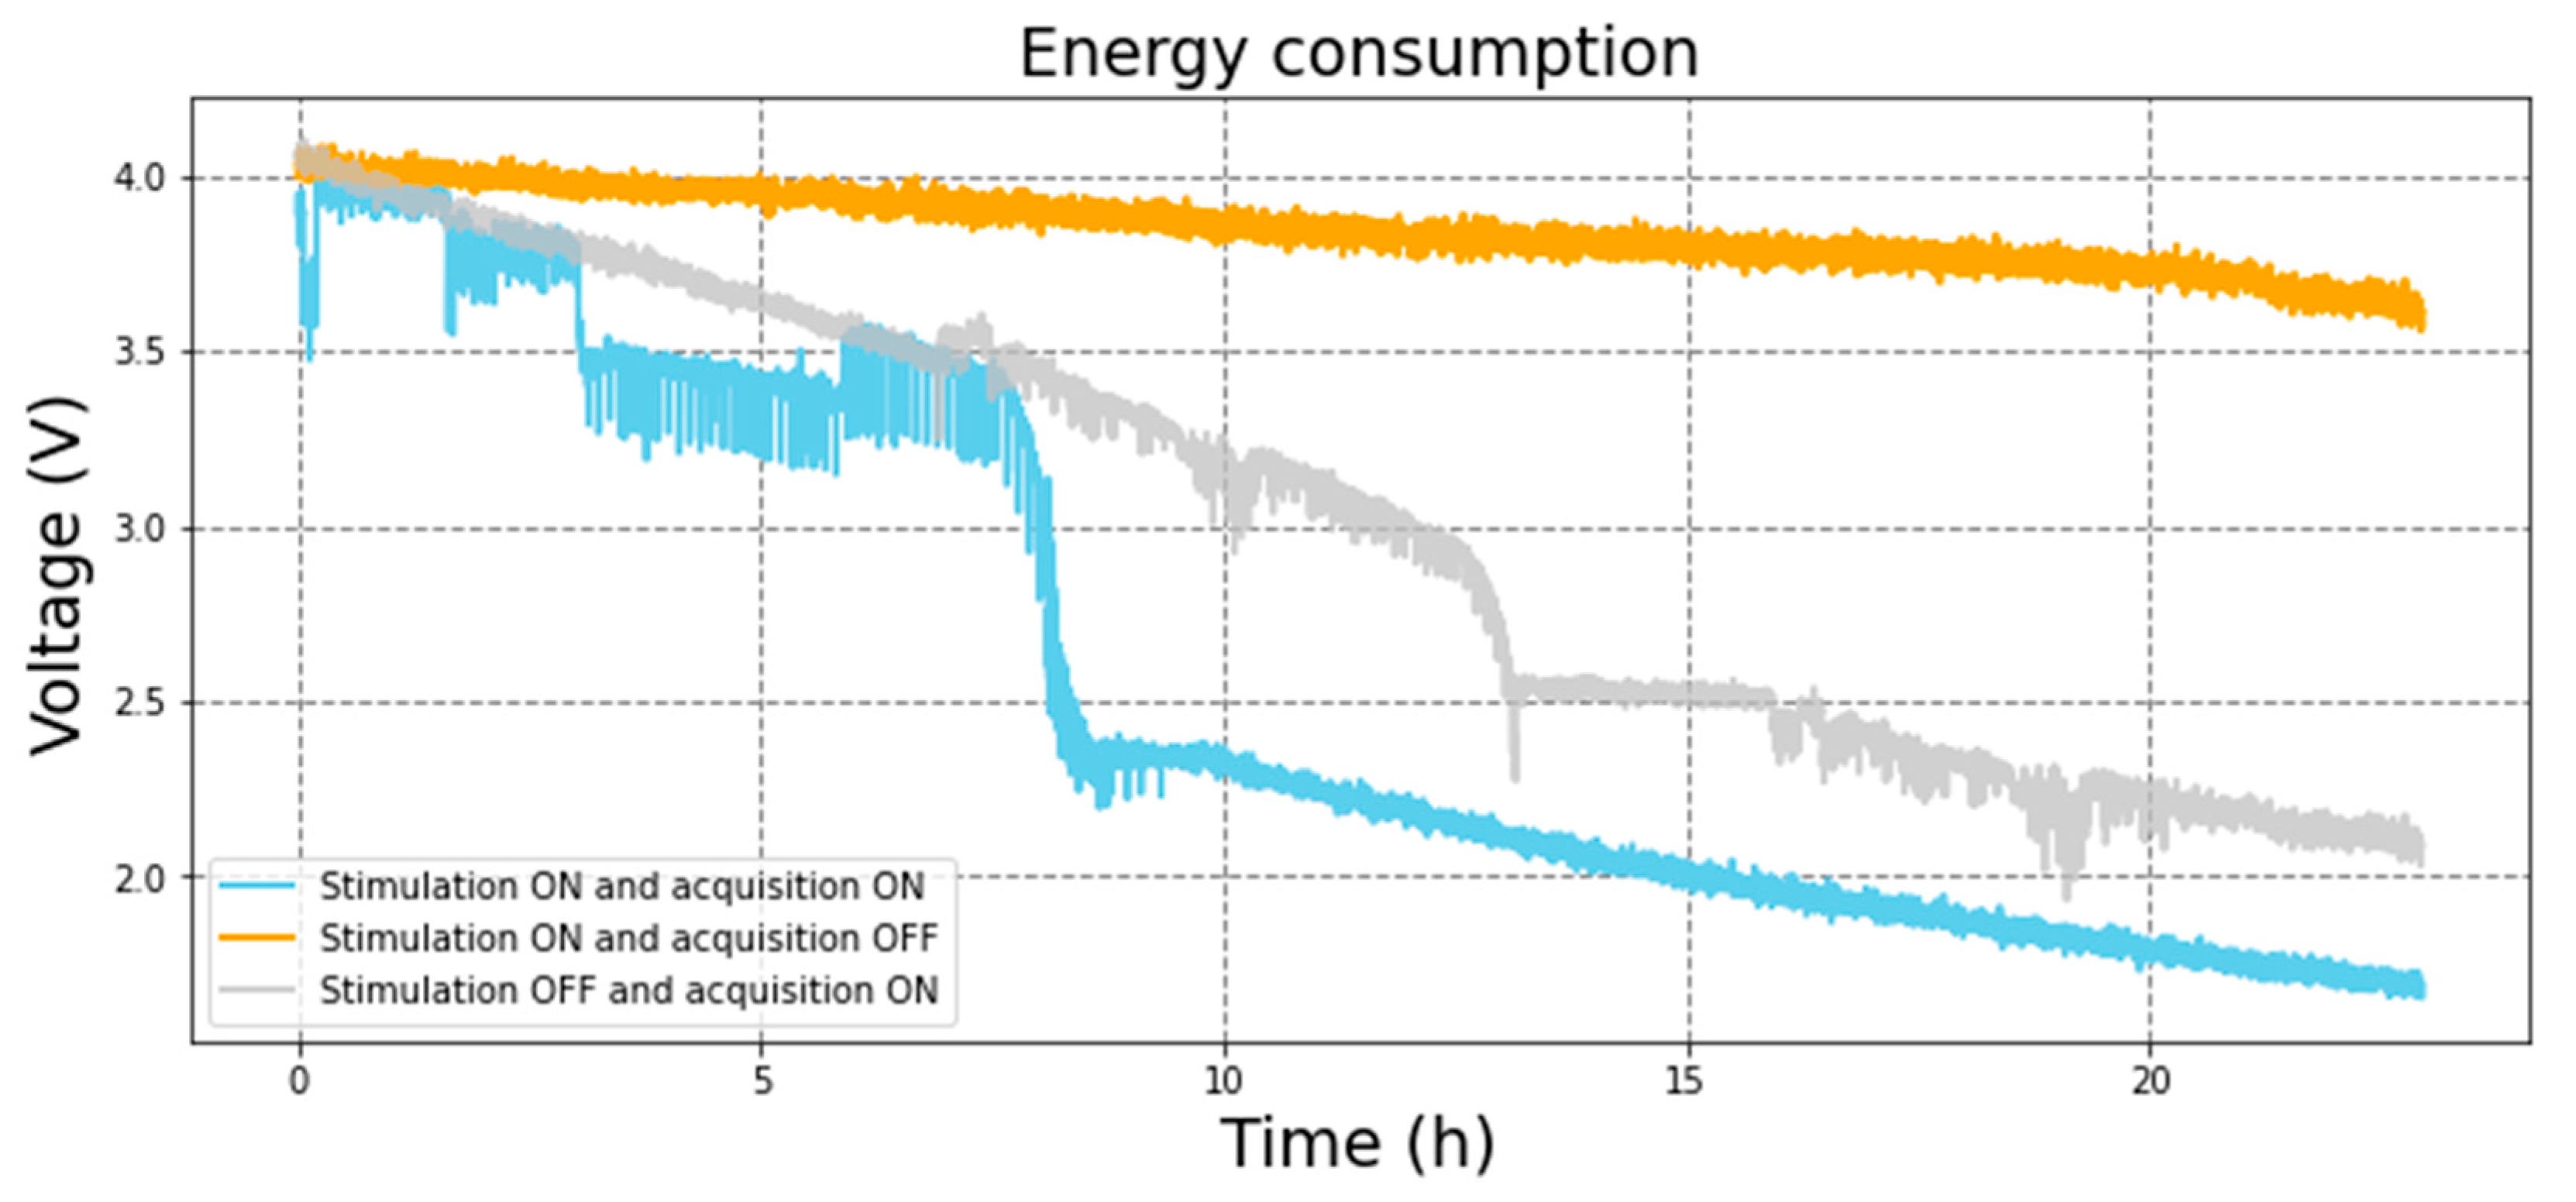
The battery was tested by allowing the CLDBS work until the battery output value reaches below 2.3 V and, therefore, the control unit stops working. Three scenarios were experimented: only the stimulation channel is on and acquisition is off; both stimulation and acquisition are on; and only the acquisition is on and stimulation is off. The results are presented in
Figure 20.
When both circuits are on, the battery can hold up to 10 hours with the ESP32 working well. For more than 8 hours the voltage remains above 3.5 V. When only the stimulation is turned on, the battery can hold the voltage over 3.5 V for more than 20 hours. Finally, when only the acquisition occurs, the battery voltage also decreases, but at a later time, after around 13 hours. It must be noted that a second experimental setup based on an Arduino board was used to read the voltage that supplied the ESP32, and, hence, the battery output for the CLDBS system proposed in this paper.
4. Conclusions
This paper presented a portable and low-cost CLDBS system with two channels for stimulation and two channels for acquisition.
The control and communication unit can improve the durability of the battery by activating individually the acquisition and stimulation circuit. As seen in
Figure 20, the battery voltage only decreases significantly after 8 hours when both the acquisition and circuit are active. If only the acquisition circuit is active the system works for around 13 hours.
This result may lead to the conclusion that the communication of the ESP32 with the computer via Bluetooth is the most energy-consuming attribute of the circuit, even though, in a real application, it would require very few battery exchanges or recharges during a day. Additionally, if only the stimulation channels are used, the lifespan of the battery would be longer than a day. Therefore, the system could operate as a CLDBS for 8 hours straight or as an OLDBS for more than a day.
Table 1 shows the properties of the present work compared with other DBS systems. The main difference between this work and most of the other works is the integration of two acquisition channels that are used to adjust the parameters of the generated wave for stimulation. Another innovation is that the frequency of operation for this work is significantly higher than most of other applications.
Author Contributions
Conceptualization, T.M.N., G.A.G., R.G., and J.P.C.; Methodology, T.M.N., G.A.G., R.G., M.M.A.M. and J.P.C.; Validation, T.M.N., M.M.A.M., and R.G.; Writing—original draft preparation, T.M.N., G.A.G., M.M.A.M., R.G. and J.P.C.; writing—review and editing, J.A.A., V.M. and J.L.A.; Supervision, E.T.F. and E.C.; Project administration, J.P.C., J.A.A., V.M. and J.L.A.; Funding acquisition, J.P.C., J.A.A., V.M. and J.L.A.
Funding
This work was partially supported by the FAPESP agency (Fundação de Amparo à Pesquisa do Estado de São Paulo) through the project with the reference 2019/05248-7. Professor João Paulo Carmo was support by a PQ scholarship with the reference CNPq 304312/2020-7. Colocar mais financiamentos FCT, QREN, etc.
Conflicts of Interest
The authors declare no conflict of interest.
References
- Mayfield Clinic. “Deep Brain Stimulation for Movement Disorders,” Mayfield Clinic, 2018. [Online]. Available: https://mayfieldclinic.com/pe-dbs.htm.
- 2. E. B. Montegomery Jr, Deep Brain Stimulation Programming: Mechanisms, Principles and Practice. New York NY, USA: Oxford University Press, 2017. [CrossRef]
- B. Piallat et al., “Monophasic but not biphasic pulses induce brain tissue damage during monopolar high-frequency deep brain stimulation,” Neurosurgery, vol. 64, no. 1, pp. 156–162, 2009. [CrossRef]
- Hickey and, M. Stacy, “Deep brain stimulation: A paradigm shifting approach to treat Parkinson’s disease,” Front. Neurosci., vol. 10, no. APR, pp. 1–11, 2016. [CrossRef]
- R. G. Bittar, et al., “Deep brain stimulation for movement disorders and pain”, Journal of Clinical Neuroscience, Vol. 12, pp. 457 463, 2005.
- R. G. Cury, R. Galhardoni, E. T. Fonoff, S. P. Lloret, M. G. S. Ghilardi, E. R. Barbosa, M. J. Teixeira, and D. C. de Andrade, “Sensory abnormalities and pain in Parkinson disease and its modulation by treatment of motor symptoms”, European Journal of Pain, Vol. 20, No. 2, pp. 151 165, 2016.
- VerciseTM Deep Brain Stimulator System. Available online: https://www.bostonscientific.com/en-IN/products/deep-brain-stimulation-systems/vercise-deep-brain-stimulation-system.html (accessed on 17th January 2023).
- Hoang, K.B.; Cassar, I.R.; Grill, W.M.; Turner, D.A. Biomarkers and Stimulation Algorithms for Adaptive Brain Stimulation. Front. Neurosci. 2017, 11, 1–15. [Google Scholar] [CrossRef] [PubMed]
- W. J. Marks, Jr, Ed., Deep Brain Stimulation Management, 2nd ed. Cambridge: Cambridge University Press, 2015. [CrossRef]
- M. G. D. S. Ghilardi et al., “Double-target DBS for estential tremor: 8-contact lead for cZI and Vim aligned in the same trajectory,” Neurology, vol. 90, no. 10, pp. 476–478, 2018. [CrossRef]
- M. F. Beal, A. E. Lang and A. C. Ludolph Ed., Neurodegenerative Diseases: Neurobiology, Pathogenesis and Therapeutics. Cambridge: Cambridge University Press, 2005. [Online]. Available: https://libsearch.ncl.ac.uk/primoexplore/fulldisplay?vid=NEWUI&search_scope=NotPC&tab=default_tab&docid=dedupmrg3017138413&lang=en_US&context=L.
- M. Vidailhet et al., “Bilateral Deep-Brain Stimulation of the Globus Pallidus in Primary Generalized Dystonia,” N. Engl. J. Med., vol. 352, no. 5, pp. 459–467, 2005. [CrossRef]
- S. L. Owen, A. L. Green, J. F. Stein, and T. Z. Aziz, “Deep brain stimulation for the alleviation of poststroke neuropathic pain”, Pain, Vol. 120, pp. 202 206, 2006.
- S. Marchand, R. C. Kupers, M. C. Bushnell, and G. H. Duncan, “Analgesic and placebo effects of thalamic stimulation”, Pain, Vol. 105, pp. 481 488, 2003.
- R. F. Pfeiffer, “Parkinsonism and Related Disorders Non-motor symptoms in Parkinson’s disease,” Park. Relat. Disord., vol. 22, pp. S119–S122, 2016. [CrossRef]
- R. Kent, B. D. Swan, D. T. Brocker, D. A. Turner, R. E. Gross, and W. M. Grill, “Measurement of evoked potentials during thalamic deep brain stimulation,” Brain Stimul., vol. 8, no. 1, pp.42–56, 2015. [CrossRef]
- Drobisz D, Damborská A. Deep brain stimulation targets for treating depression. Behav Brain Res. 2019 Feb 1;359:266-273. Epub 2018 Nov 8. PMID: 30414974. [CrossRef]
- Figee M, Riva-Posse P, Choi KS, Bederson L, Mayberg HS, Kopell BH. Deep Brain Stimulation for Depression. Neurotherapeutics. 2022 Jul;19(4):1229-1245. Epub 2022 Jul 11. PMID: 35817944; PMCID: PMC9587188. [CrossRef]
- Sheth SA, Bijanki KR, Metzger B, Allawala A, Pirtle V, Adkinson JA, Myers J, Mathura RK, Oswalt D, Tsolaki E, Xiao J, Noecker A, Strutt AM, Cohn JF, McIntyre CC, Mathew SJ, Borton D, Goodman W, Pouratian N. Deep Brain Stimulation for Depression Informed by Intracranial Recordings. Biol Psychiatry. 2022 Aug 1;92(3):246-251. Epub 2021 Nov 22. PMID: 35063186; PMCID: PMC9124238. [CrossRef]
- K. B. Hoang, I. R. Cassar, W. M. Grill, and D. A. Turner, “Biomarkers and stimulation algorithms for adaptive brain stimulation,” Front. Neurosci., vol. 11, no. OCT, 2017. [CrossRef]
- W. Bouthour, P. Mégevand, J. Donoghue, C. Lüscher, N. Birbaumer, and P. Krack, “Biomarkers for closed-loop deep brain stimulation in Parkinson disease and beyond,” Nat. Rev. Neurol., vol. 15, no. 6, pp. 343–352, 2019. [CrossRef]
- Berényi, M. Belluscio, D. Mao, and G. Buzsáki, “Closed-loop control of epilepsy by transcranial electrical stimulation,” Science (80-.)., vol. 337, no. 6095, pp. 735–737, 2012. [CrossRef]
- H. Halpern, U. Samadani, B. Litt, J. L. Jaggi, and G. H. Baltuch, “Deep Brain Stimulation for Epilepsy,” Neurotherapeutics, vol. 5, no. 1, pp. 59–67, 2008. [CrossRef]
- M. Bočková and I. Rektor, “Impairment of brain functions in Parkinson's disease reflected by alterations in neural connectivity in EEG studies: A viewpoint,” vol. 130, pp. 239–247, 2019. [CrossRef]
- E. Heremans, A. Nieuwboer, and S. Vercruysse, “Freezing of Gait in Parkinson’s Disease: Where Are We Now? 2013. [CrossRef]
- De Solages, B. C. Hill, H. Yu, J. M. Henderson, and H. Bronte-stewart, “Maximal subthalamic beta hypersynchrony of the local field potential in Parkinson’s disease is located in the central region of the nucleus,” pp. 1387–1389. [CrossRef]
- Y. Hou, X. Wu, M. Hallett, P. Chan, and T. Wu, "Frequency-dependent neural activity in Parkinson's disease," in Human Brain Mapping, vol. 35, no. 12, pp. 5815-5833, 2014.
- Whitmer, C. De Solages, B. Hill, H. Yu, J. M. Henderson, and A. Schnitzler, “High frequency deep brain stimulation attenuates subthalamic and cortical rhythms in Parkinson’s disease,” vol. 6, no. June, pp. 1–18, 2012. [CrossRef]
- J. A. H. and Robert, “LFP Power Spectra in V1 Cortex: The Graded Effect of Stimulus Contrast,” J Neurophysiol. pp. 479–490, 2005. [CrossRef]
- N. Maling, R. Hashemiyoon, K. D. Foote, M. S. Okun, and J. C. Sanchez, “Increased Thalamic Gamma Band Activity Correlates with Symptom Relief following Deep Brain Stimulation in Humans with Tourette’s Syndrome,” vol. 7, no. 9, pp. 1–8, 2012. [CrossRef]
- D. Prutchi and M. Norris, “Design and Development of Medical Electronic Instrumentation: A Practical Perspective of the Design, Construction, and Test of Medical Devices”. Hoboken: Wiley-interscience, 2005.
- Arlotti, M. Rosa, S. Marceglia, S. Barbieri, and A. Priori, “The adaptive deep brain stimulation challenge,” Park. Relat. Disord., vol. 28, pp. 12–17, 2016. [CrossRef]
- Amon and F. Alesch, “Systems for deep brain stimulation: review of technical features,” J. Neural Transm., vol. 124, no. 9, pp. 1083–1091, 2017. [CrossRef]
- Medtronic Activa PC DBS system. [Online]. Available: https://www.startribune.com/fda-staff-airs-doubts-on-use-of-medtronic-device-to-cut-seizures/87296557/.
- A. Z. Kouzani, O. A. Abulseoud, S. J. Tye, M D. Kamal Hosain, and M. Berk, “A low power micro deep brain stimulation device for murine preclinical research”, IEEE Journal of Translacional Engineering Health Medicine, Vol. 1, pp. 19, 2013. #1500109. [CrossRef]
- R. C. Pinnell, J. Dempster, and J. Pratt, “Miniature wireless recording and stimulation system for rodent behavioural testing,” Journal of Neural Engineering, Vol. 12, No. 6, pp. 115, 2015. #066015. [CrossRef]
- S. D. Adams, K. E. Bennet, S. J. Tye, M. Berk, and A. Z. Kouzani, “Development of a miniature device for emerging deep brain stimulation paradigms”, PLoS One, Vol. 14, No. 2, pp. 117, 2019. [CrossRef]
- H. Tibara, F. Naudeta, F. Kölblc, B. Ribota, E. Faggiania, G. N’Kaouac, S. Renaudc, N. Lewisc, and A. Benazzouza,“ In vivo validation of a new portable stimulator for chronic deep brain stimulation in freely moving rats”, Journal of Neuroscience Methods, Vol. 333, pp. 19, March 2020.
- F. Fluri, T. Mützel, M. K. Schuhmann, M. Krstić, H. Endres, and J. Volkmann, “Development of a head-mounted wireless microstimulator for deep brain stimulation in rats”, Journal of Neuroscience Methods, Vol. 291, pp. 249256, November 2017.
- Pinnell, R. C. , Dempster, J., & Pratt, J. (2015). “Miniature wireless recording and stimulation system for rodent behavioural testing”, Journal of Neural Engineering, Vol. 12, No. 6, 066015. [CrossRef]
Figure 1.
DBS system positioning (adapted from [
1]).
Figure 1.
DBS system positioning (adapted from [
1]).
Figure 2.
Types of control on DBS systems.
Figure 2.
Types of control on DBS systems.
Figure 3.
Commercial DBS system from the company Boston Scientific (adapted from [
34]).
Figure 3.
Commercial DBS system from the company Boston Scientific (adapted from [
34]).
Figure 4.
(a) Block Diagram for the stimulator circuit of the DBS system. (b) Neurostimulator block diagram. (c) Acquisition system block diagram.
Figure 4.
(a) Block Diagram for the stimulator circuit of the DBS system. (b) Neurostimulator block diagram. (c) Acquisition system block diagram.
Figure 5.
Howland current pump (HCP) circuit diagram.
Figure 5.
Howland current pump (HCP) circuit diagram.
Figure 6.
LNA circuit diagram.
Figure 6.
LNA circuit diagram.
Figure 7.
Gain of the LNA for open loop, C2 = {10, 100} nF, R1 = {1, 10, 100} MΩ.
Figure 7.
Gain of the LNA for open loop, C2 = {10, 100} nF, R1 = {1, 10, 100} MΩ.
Figure 8.
Active notch filter (ANF) circuit diagram.
Figure 8.
Active notch filter (ANF) circuit diagram.
Figure 9.
Active low pass filter circuit diagram.
Figure 9.
Active low pass filter circuit diagram.
Figure 10.
Battery and circuit used to supply the DBS system.
Figure 10.
Battery and circuit used to supply the DBS system.
Figure 11.
Flex-rigid PCB project: (a) top view; (b) bottom view; (c) and (d) two other perspectives of the PCB.
Figure 11.
Flex-rigid PCB project: (a) top view; (b) bottom view; (c) and (d) two other perspectives of the PCB.
Figure 12.
The manufactured PCB: (a) bottom view; (b) top view; (c) and (d) two other perspectives.
Figure 12.
The manufactured PCB: (a) bottom view; (b) top view; (c) and (d) two other perspectives.
Figure 13.
Experimental montage to test the DBS system in a saline solution.
Figure 13.
Experimental montage to test the DBS system in a saline solution.
Figure 14.
Tests on a saline solution for (a) sine wave and (b) square wave.
Figure 14.
Tests on a saline solution for (a) sine wave and (b) square wave.
Figure 15.
Experimental values of the gain of the biopotential LNA.
Figure 15.
Experimental values of the gain of the biopotential LNA.
Figure 16.
Software routine used to test the acquisition rate of the internal ADC of the ESP32.
Figure 16.
Software routine used to test the acquisition rate of the internal ADC of the ESP32.
Figure 17.
Pulse width and amplitude diagram.
Figure 17.
Pulse width and amplitude diagram.
Figure 18.
Complete diagram for pulse generation.
Figure 18.
Complete diagram for pulse generation.
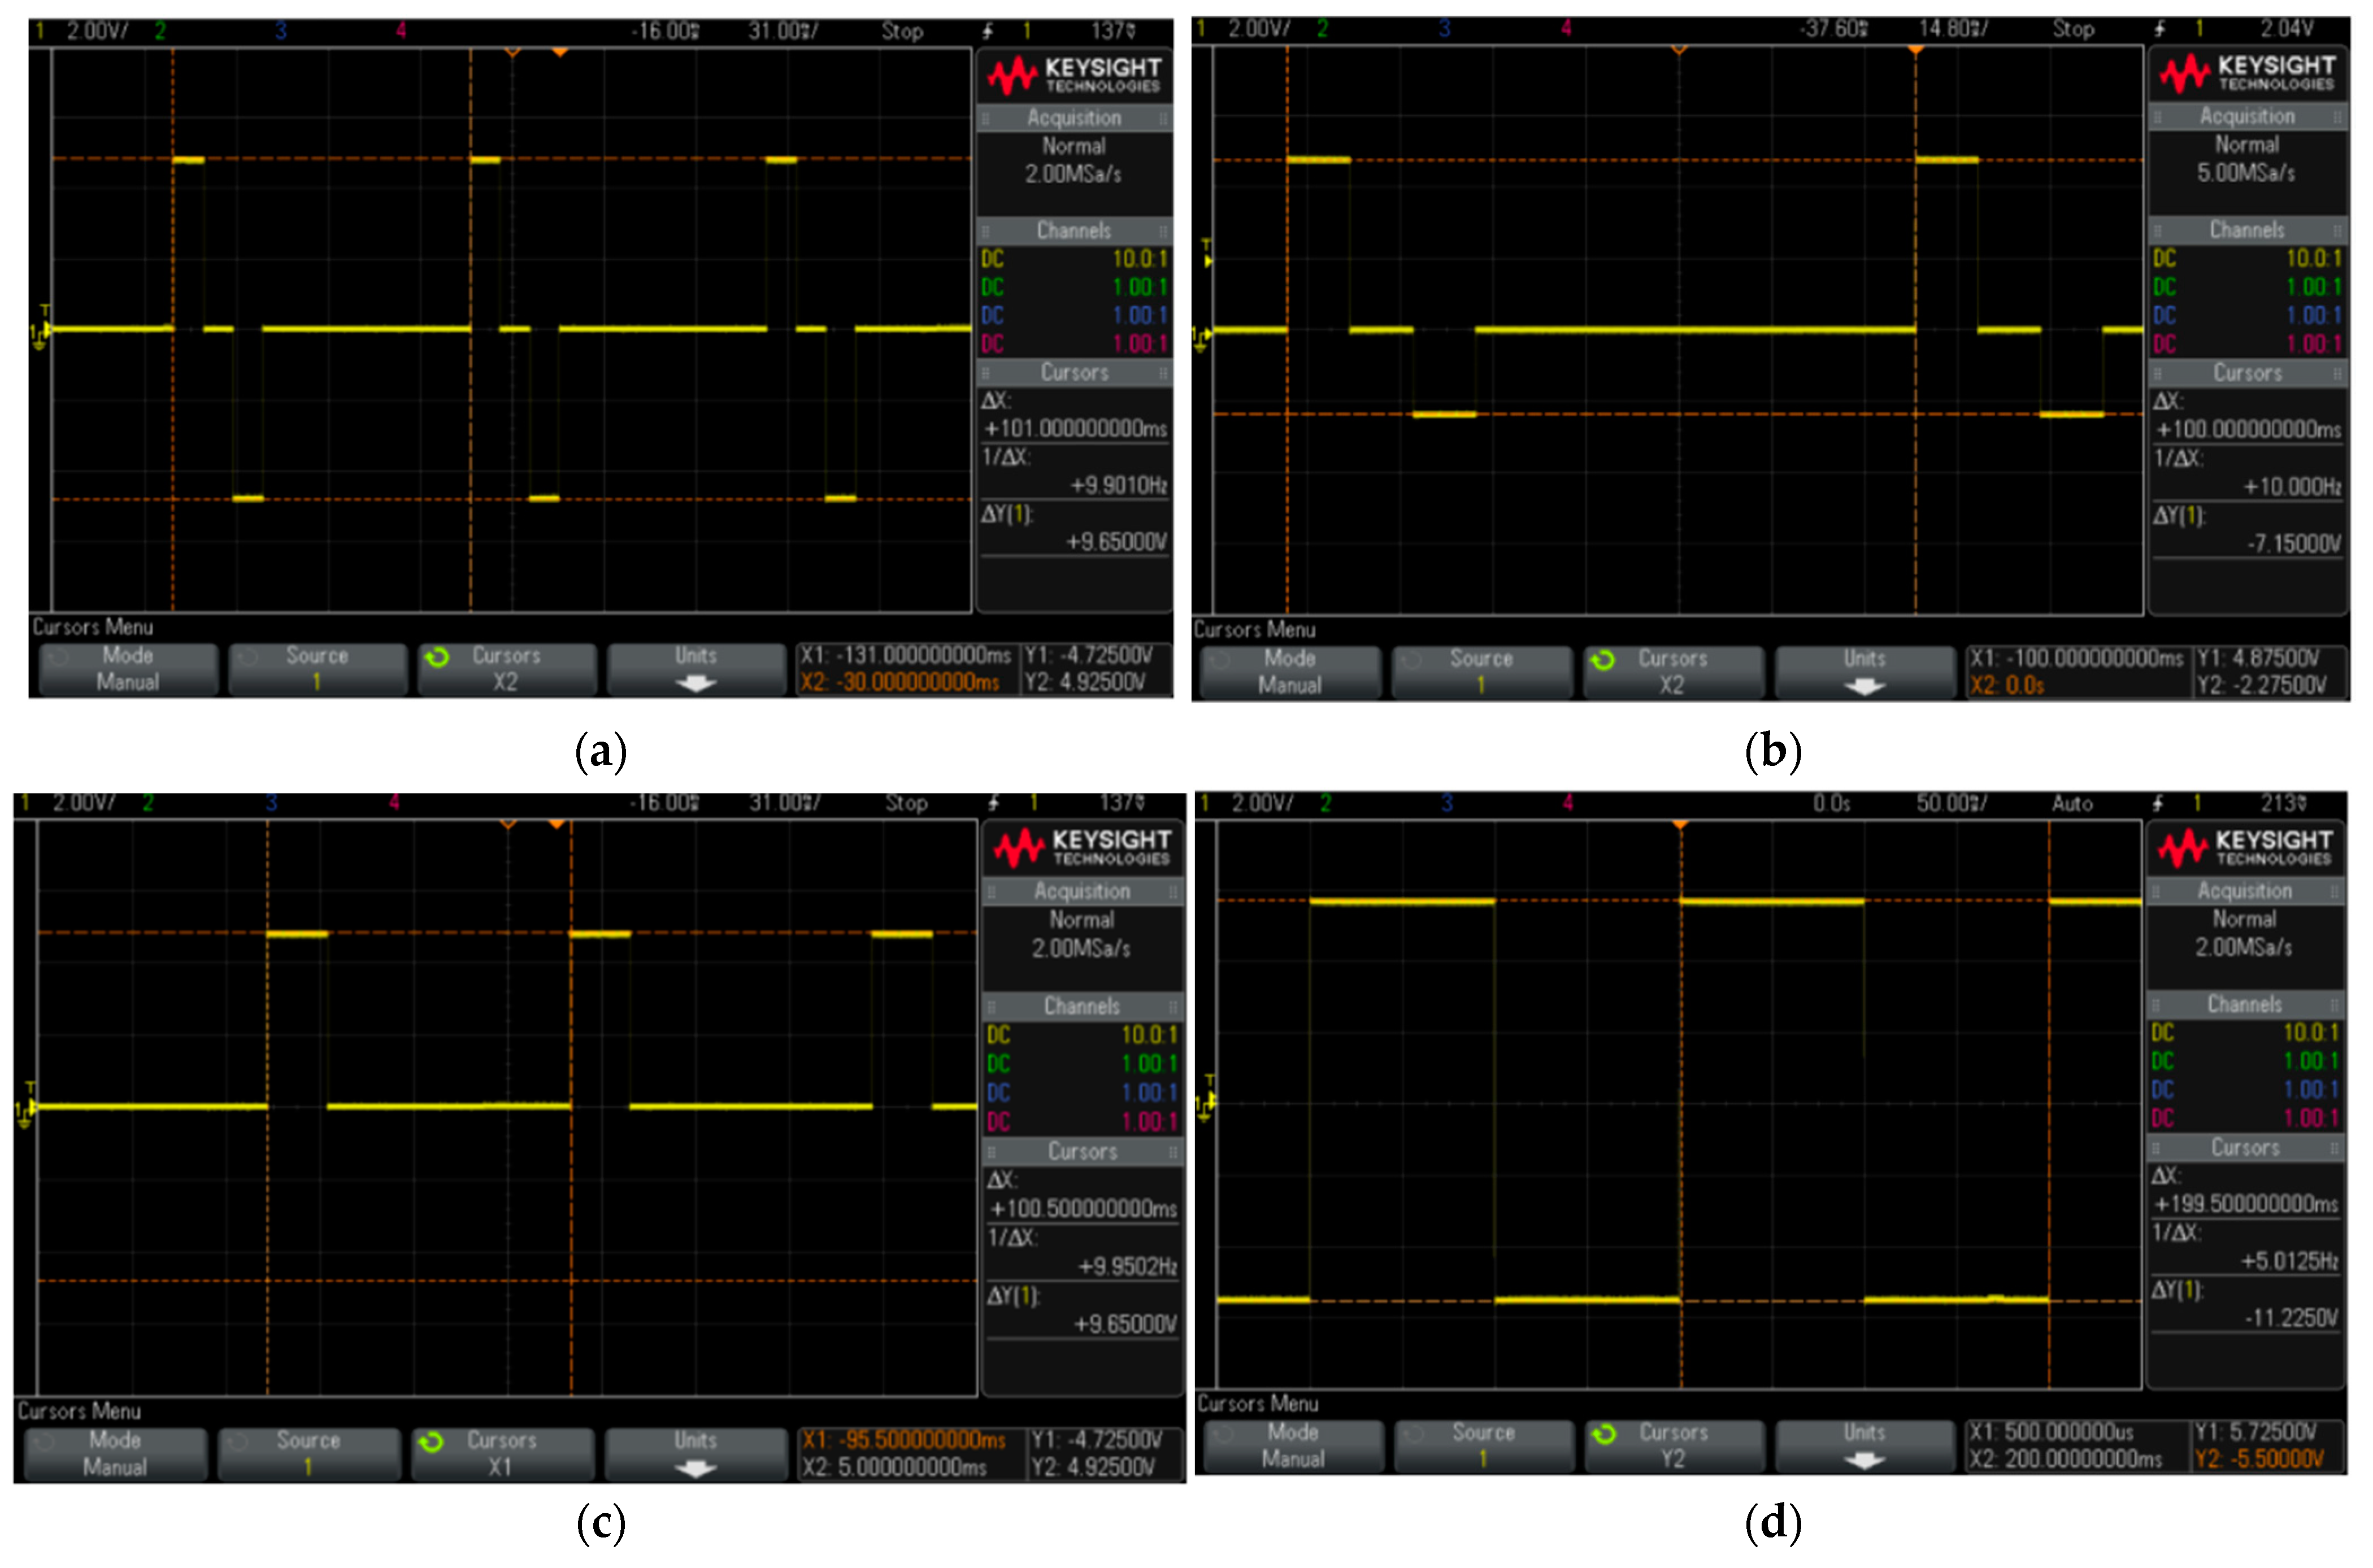
Figure 19.
Pulses generated with several shapes by the program and collected on the oscilloscope to illustrate the ability of the proposed stimulator.
Figure 19.
Pulses generated with several shapes by the program and collected on the oscilloscope to illustrate the ability of the proposed stimulator.
Figure 20.
Power consumption tests of the CLDBS versus time.
Figure 20.
Power consumption tests of the CLDBS versus time.
Table 1.
Comparison of the present work with other DBS systems.
Table 1.
Comparison of the present work with other DBS systems.
| Ref. |
#channels acquisition/stimulation |
Stimulation current
[μA] |
Maximum pulse frequency [Hz]/
Minimum pulse duration [ms] |
Stimulation form |
System size |
| This work |
2/2 |
-325 to +318 |
1.5x10^6/25 |
Active/Continuous (Howland
Current-Pump) |
58x37x29 mm |
| [33] |
2* |
20 to 2000 |
500/10 |
Active/Switched (H-bridge) |
12.5 diameter × 5 mm |
| [34] |
2* |
-200 to +200 |
185/90 |
Active/Switched |
24 mm × 16.8 mm |
| [35] |
2* |
0 to 200 |
130/90 |
Passive/Switched |
12.5 diameter |
| [36] |
2* |
30 to 1000 |
5000/10 |
Active/Switched |
12mm diameter |
| [37] |
1* |
-375 to +250 |
5000/20 |
Active/Continuous (Howland
Current-Pump) |
32.5 × 28 × 8 mm |
| [38] |
1* |
20 to 2000 |
300/40 |
Active/Switched (H-bridge) |
22.2/32.8/23mm |
| [39] |
1* |
10 to 500 |
200/60 |
Passive/Switched |
21 x 11 x 7 mm |
| [40] |
4/2 |
30-1500 |
5*10^3/0.01 |
Active/Constant Current-Generator |
28 × 17 × 7 mm |
|
Disclaimer/Publisher’s Note: The statements, opinions and data contained in all publications are solely those of the individual author(s) and contributor(s) and not of MDPI and/or the editor(s). MDPI and/or the editor(s) disclaim responsibility for any injury to people or property resulting from any ideas, methods, instructions or products referred to in the content. |
© 2023 by the authors. Licensee MDPI, Basel, Switzerland. This article is an open access article distributed under the terms and conditions of the Creative Commons Attribution (CC BY) license (http://creativecommons.org/licenses/by/4.0/).
