Preprint
Article

Convergence Analysis of Phase-Scheduled-Command FXLMS Algorithm with the Phase Error

Altmetrics

Downloads

111

Views

16

Comments

0

A peer-reviewed article of this preprint also exists.

Submitted:

07 June 2023

Posted:

07 June 2023

You are already at the latest version

Alerts
Abstract
In this paper, the Phase-Scheduled-Command FXLMS algorithm with the phase error between the disturbance and command signal is analyzed in detail. The influence of the phase error on the convergence time constant, convergence rate, and performance of convergence is explained for both stationary and nonstationary disturbance signals case. For stationary disturbance, the phase error slightly increases the convergence rate but heavily increases the distance of the optimum vector from the initial value, leading to poor convergence time constant performance. For nonstationary disturbance, the existence of phase error leads to poor convergence performance in every step, resulting in poor sound profiling performance. And the estimation of the phase error influence is developed in the closed form. Simulations are performed to demonstrate the validity of the analysis results.
Keywords: 
Subject: Physical Sciences  -   Acoustics

1. Introduction

In specific acoustic environments, such as the interior of a car, people often do not want to eliminate the engine noise completely, but want to hear the roar of the engine that has a specific sound quality and reflect the driving state accurately. Which can improve the driver's perception of the current car state, thereby enhancing driving pleasure. Therefore, in such a case, the goal of noise control is not to eliminate noise but to control the noise at a specific level, which represents sound quality control. The active sound quality control system based on active noise control (ANC) algorithms provide the possibility of dealing with the problem through equalizing or profiling the sound [1-7].
There are two schemes of the active sound quality control system based on the filtered-x least mean square (FXLMS) algorithm: the active noise equalizer (ANE) [8-12] and the active sound profiling (ASP) algorithms[13-16]. The ANE, first presented by Kuo et al. [8, 9], can either enhance or eliminate the sound level by the insertion of gain factors and ( ), ensuring that the actual noise converges to a desirable value, tuned by . Based on the ANE technique, Kuo et al. [17-19]proposed an optimized filtered-error least mean square (FELMS) scheme with improved the convergence speed and system stability and a frequency-domain delay-less active sound-quality control (ASQC) structure which was more efficient, faster and lower computational complexity compare to time-domain algorithms. In view of this, Oliveira et al. [20] developed an NEX-LMS scheme ASQC algorithm for the equalization of engine noise introducing an adaptive gain factor β(ω). The performance of the NEX-LMS scheme was experimentally validated, and the controller worked effectively when the frequency was increased slowly. And, Mosquera-Sanchez et al. [21-23]introduced a frequency-domain multichannel ANE scheme for independent sound control of multiple locations and a system to control the loudness, roughness, sharpness, and tonality of noise. The performance of the control schemes was verified by simulations and experiments. The ANE-based algorithms have been employed in a popular and important sound equalizing method, but their performance has been studied and concluded that extremely sensitive to misestimation of secondary path. The phase misestimation influence is dominant when is small and the amplitude misestimation influence becomes dominant when [13, 24]. To fundamentally prevent the influence of the secondary model misestimation, Rees et al. [13] proposed an alternative active sound profiling (ASP) scheme, which was featured by converging the residual signal to a generated command value signal. The command value signal has been set with the desirable value amplitude and the same frequency with the reference signal. A pseudo-error signal was used to update the adaptive filter weights, and the real residual noise signal converged to the command signal as the pseudo error converged to zero. Further, for limiting the control effort, the command signal was set being in phase with the primary disturbance signal, the Phase-Scheduled-Command FXLMS (PSC-FXLMS) sound profiling algorithm can be derived. Based on the PSC-FXLMS algorithm, several modifications and improvements have been proposed to address the plant model stability under errors, the convergence speed and the influence of control effort for phase error between the disturbance and command signals[13, 14]. To address the limitation of that these ASP algorithms were always effective for stationary noise conditions, Wang et al. [15]proposed an algorithm for nonstationary noise profiling application. This algorithm inherits the advantages of minimum control effort and insensitivity to the magnitude error of a plant model.
A detailed investigation is important and useful to understand the ANE-based and ASP-based algorithms behavior better and to stimulate and inspire the development of more advanced and practical ANC system structures and algorithms for sound quality control. The detailed investigation of the ANE-based algorithms has been widely studied in references [13, 16, 24, 25]. And the conclusions have been drawn that: when the gain factor is small, the influence of the secondary path phase estimation error is dominant; but when the gain factor is larger than one, the influence of the secondary path amplitude estimation error becomes dominant.
For the ASP-based algorithm, Rees et al. [13] provided a qualitative guide of properties, including the plant model stability and the influence of control effort with phase error between the disturbance and command signals. But the convergence rate and convergence performance of the influence of phase error between disturbance and command signal has not been detailed analyzed. Therefore, in this paper, a detailed analysis of the classical ASP-based algorithm (PSC-FXLMS) considering the convergence rate and convergence performance with the phase error between disturbance and command signal is conducted; particularly, investigating the effect of when the disturbance is nonstationary.
The rest of this paper is organized as follows. Section II provides a brief introduction to the PSC-FXLMS algorithms. Section III conducts the performance analysis of this system with the phase error between the disturbance and command signal. Section IV presents some simulations to demonstrate the validity of the analytical findings. Conclusions are provided in Section V.

2. Active Sound Profiling Algorithms

2.1. Command-FXLMS Algorithm

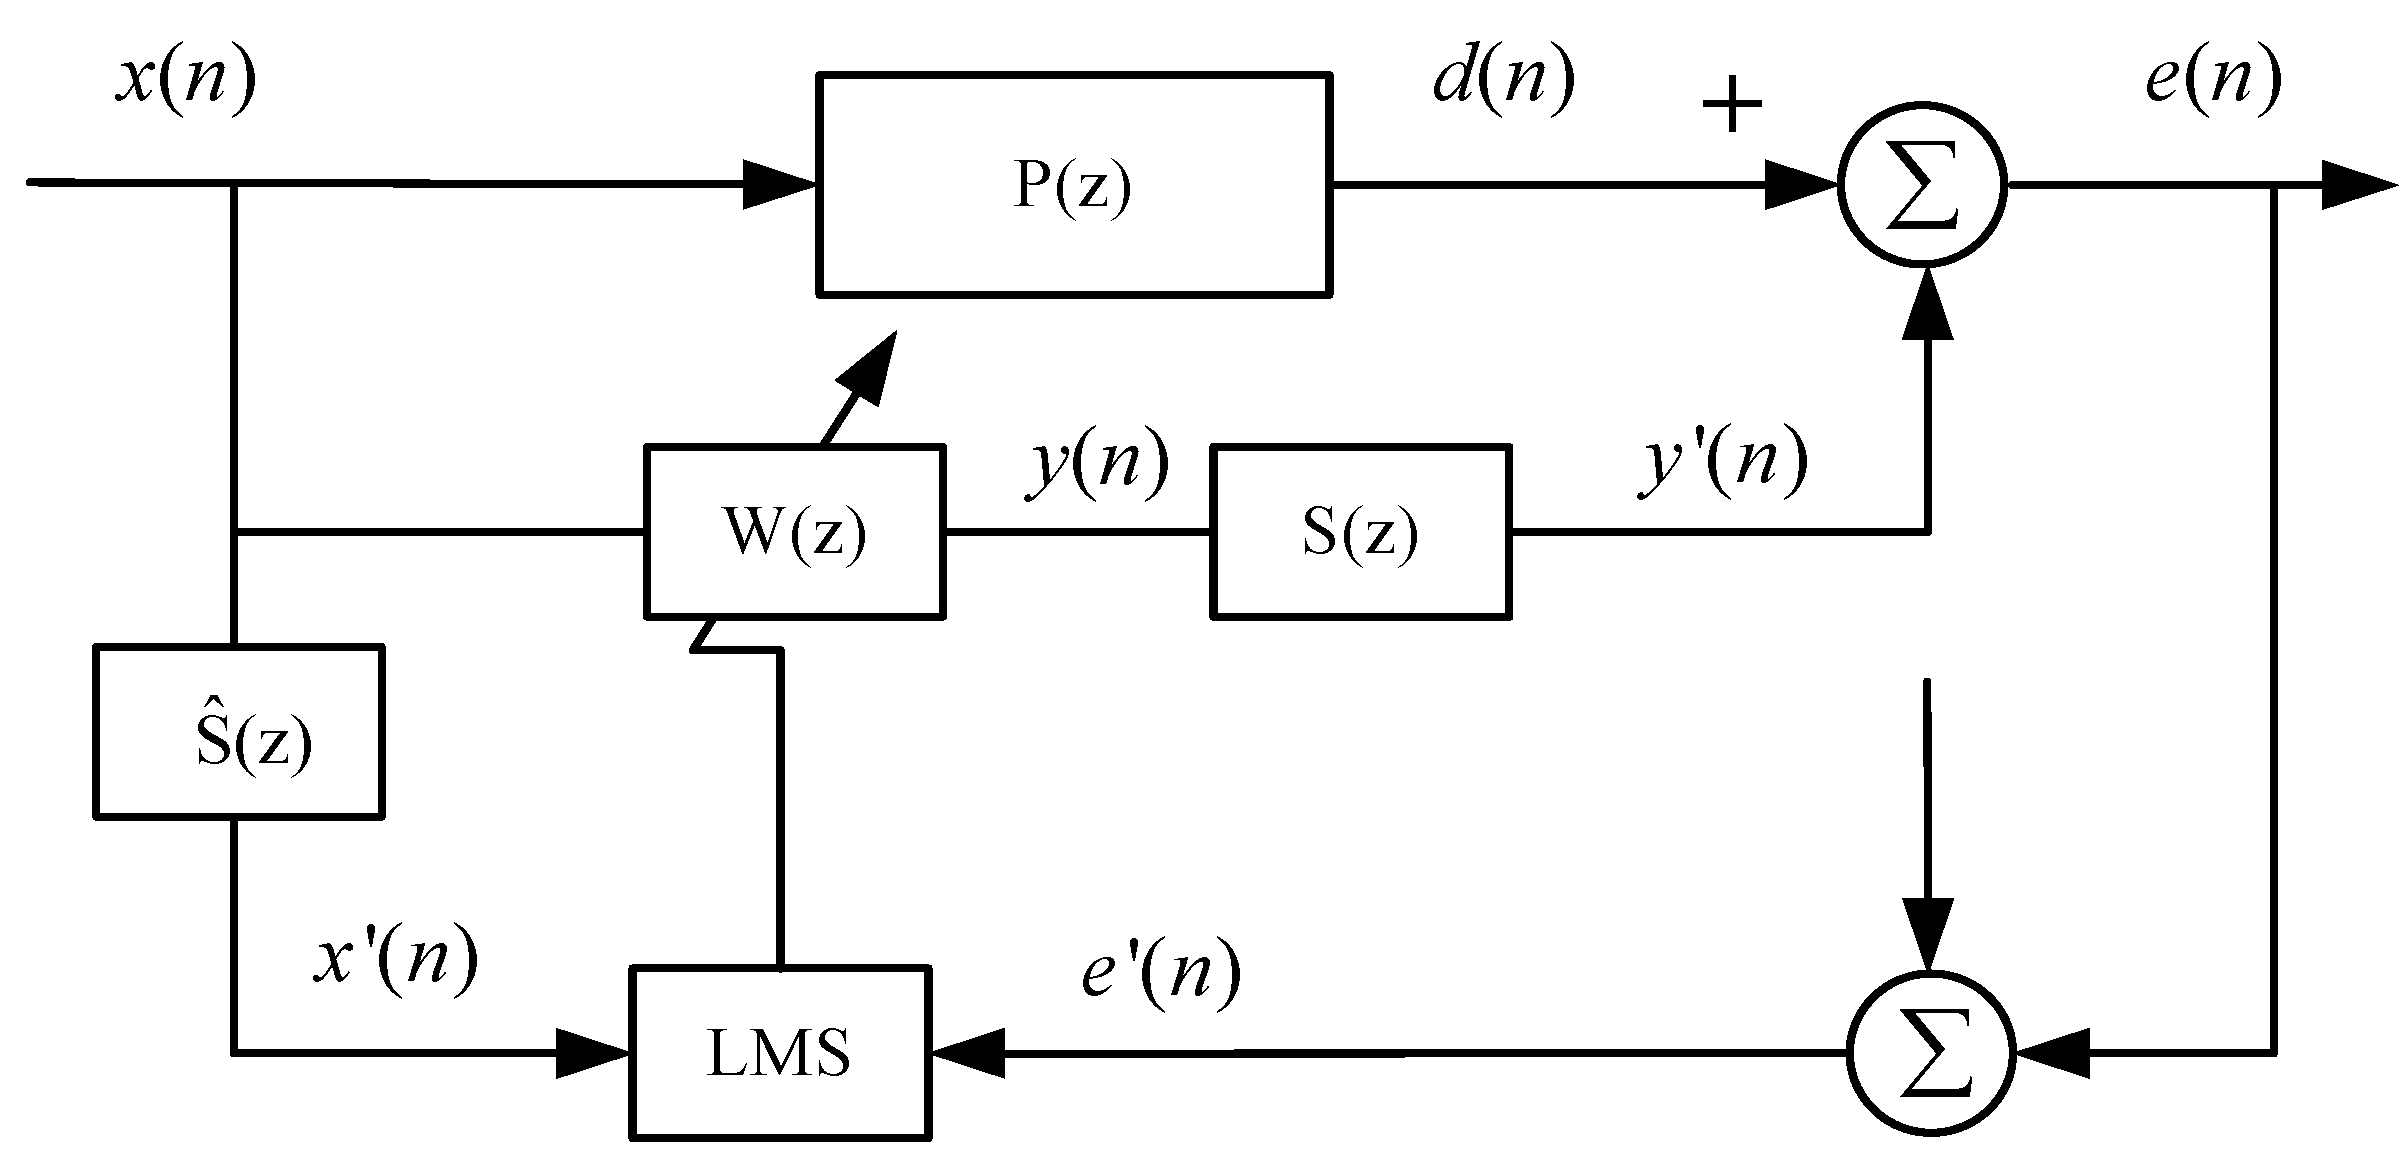
A schematic of the command-FXLMS algorithm is presented in Figure 1, where it can be seen that the command signal c(n) is the predefined value target for the residual error signal e(n). The command signal is set to be in phase with the disturbance signal for achieving minimum control effort. The pseudo error e’(n) converges to zero as the updating of algorithm, and the residual error signal e(n) converges to the predefined value.
In Figure 1, x ( n ) is the reference signal, and d ( n ) is the disturbance signal, which is expressed as follows:
d ( n ) = p ( n ) x ( n )
where p ( n ) is the impulse of the primary path P ( z ) , “*” represents the linear convolution operation, and e ( n ) is the error noise, which is calculated by:
e ( n ) = d ( n ) + y ' ( n ) = d ( n ) + s ( n ) y ( n )
where s ( n ) is the impulse of the primary path S ( z ) ; y ( n ) is the output of W ( z ) , and it is given by:
y ( n ) = w T ( n ) x ( n )
The parameter e ' ( n ) indicates the pseudo error signal, which is expressed by:
e ' ( n ) = e ( n ) c ( n )
Substituting Eq. (2) into Eq. (4) yields:
e ' ( n ) = d ( n ) + y ( n ) * s ( n ) c ( n )
The required Z-transform can be obtained from Eq. (5) as follows:
E ' ( z ) = D ( z ) + Y ( z ) S ( z ) C ( z )
As given in Eq. (21) in [26], the transfer function F(z) can be expressed by:
Y ( z ) E ' ( z ) = F ( z )
where E ' ( z ) and Y ( z ) are the Z-transformations of the pseudo error and output signal, respectively.
Substituting Eq. (5) into Eq. (6) gives the following expression:
[ 1 F ( z ) S ( z ) ] E ' ( z ) = D ( z ) C ( z )
Further, combining the Z-transform of Eq. (2) with Eqs. (6)–(8) gives:
E ( z ) = D ( z ) E ' ( z ) Y ( z ) S ( z ) C ( z ) E ' ( z ) Y ( z ) S ( z )
When the system converges, E ' ( z ) = 0 , so it holds that:
E ( z ) = C ( z )
Thus, the error noise converges to the command signal. Substituting the Z-transform of Eq. (3) into Eq. (6) yields:
W o ( z ) = C ( z ) D ( z ) X ( z ) S ( z ) = C ( z ) D ( z ) X ' ( z )
where the superscript “o” indicates the optimum value.

2.2. PSC-FXLMS Algorithm

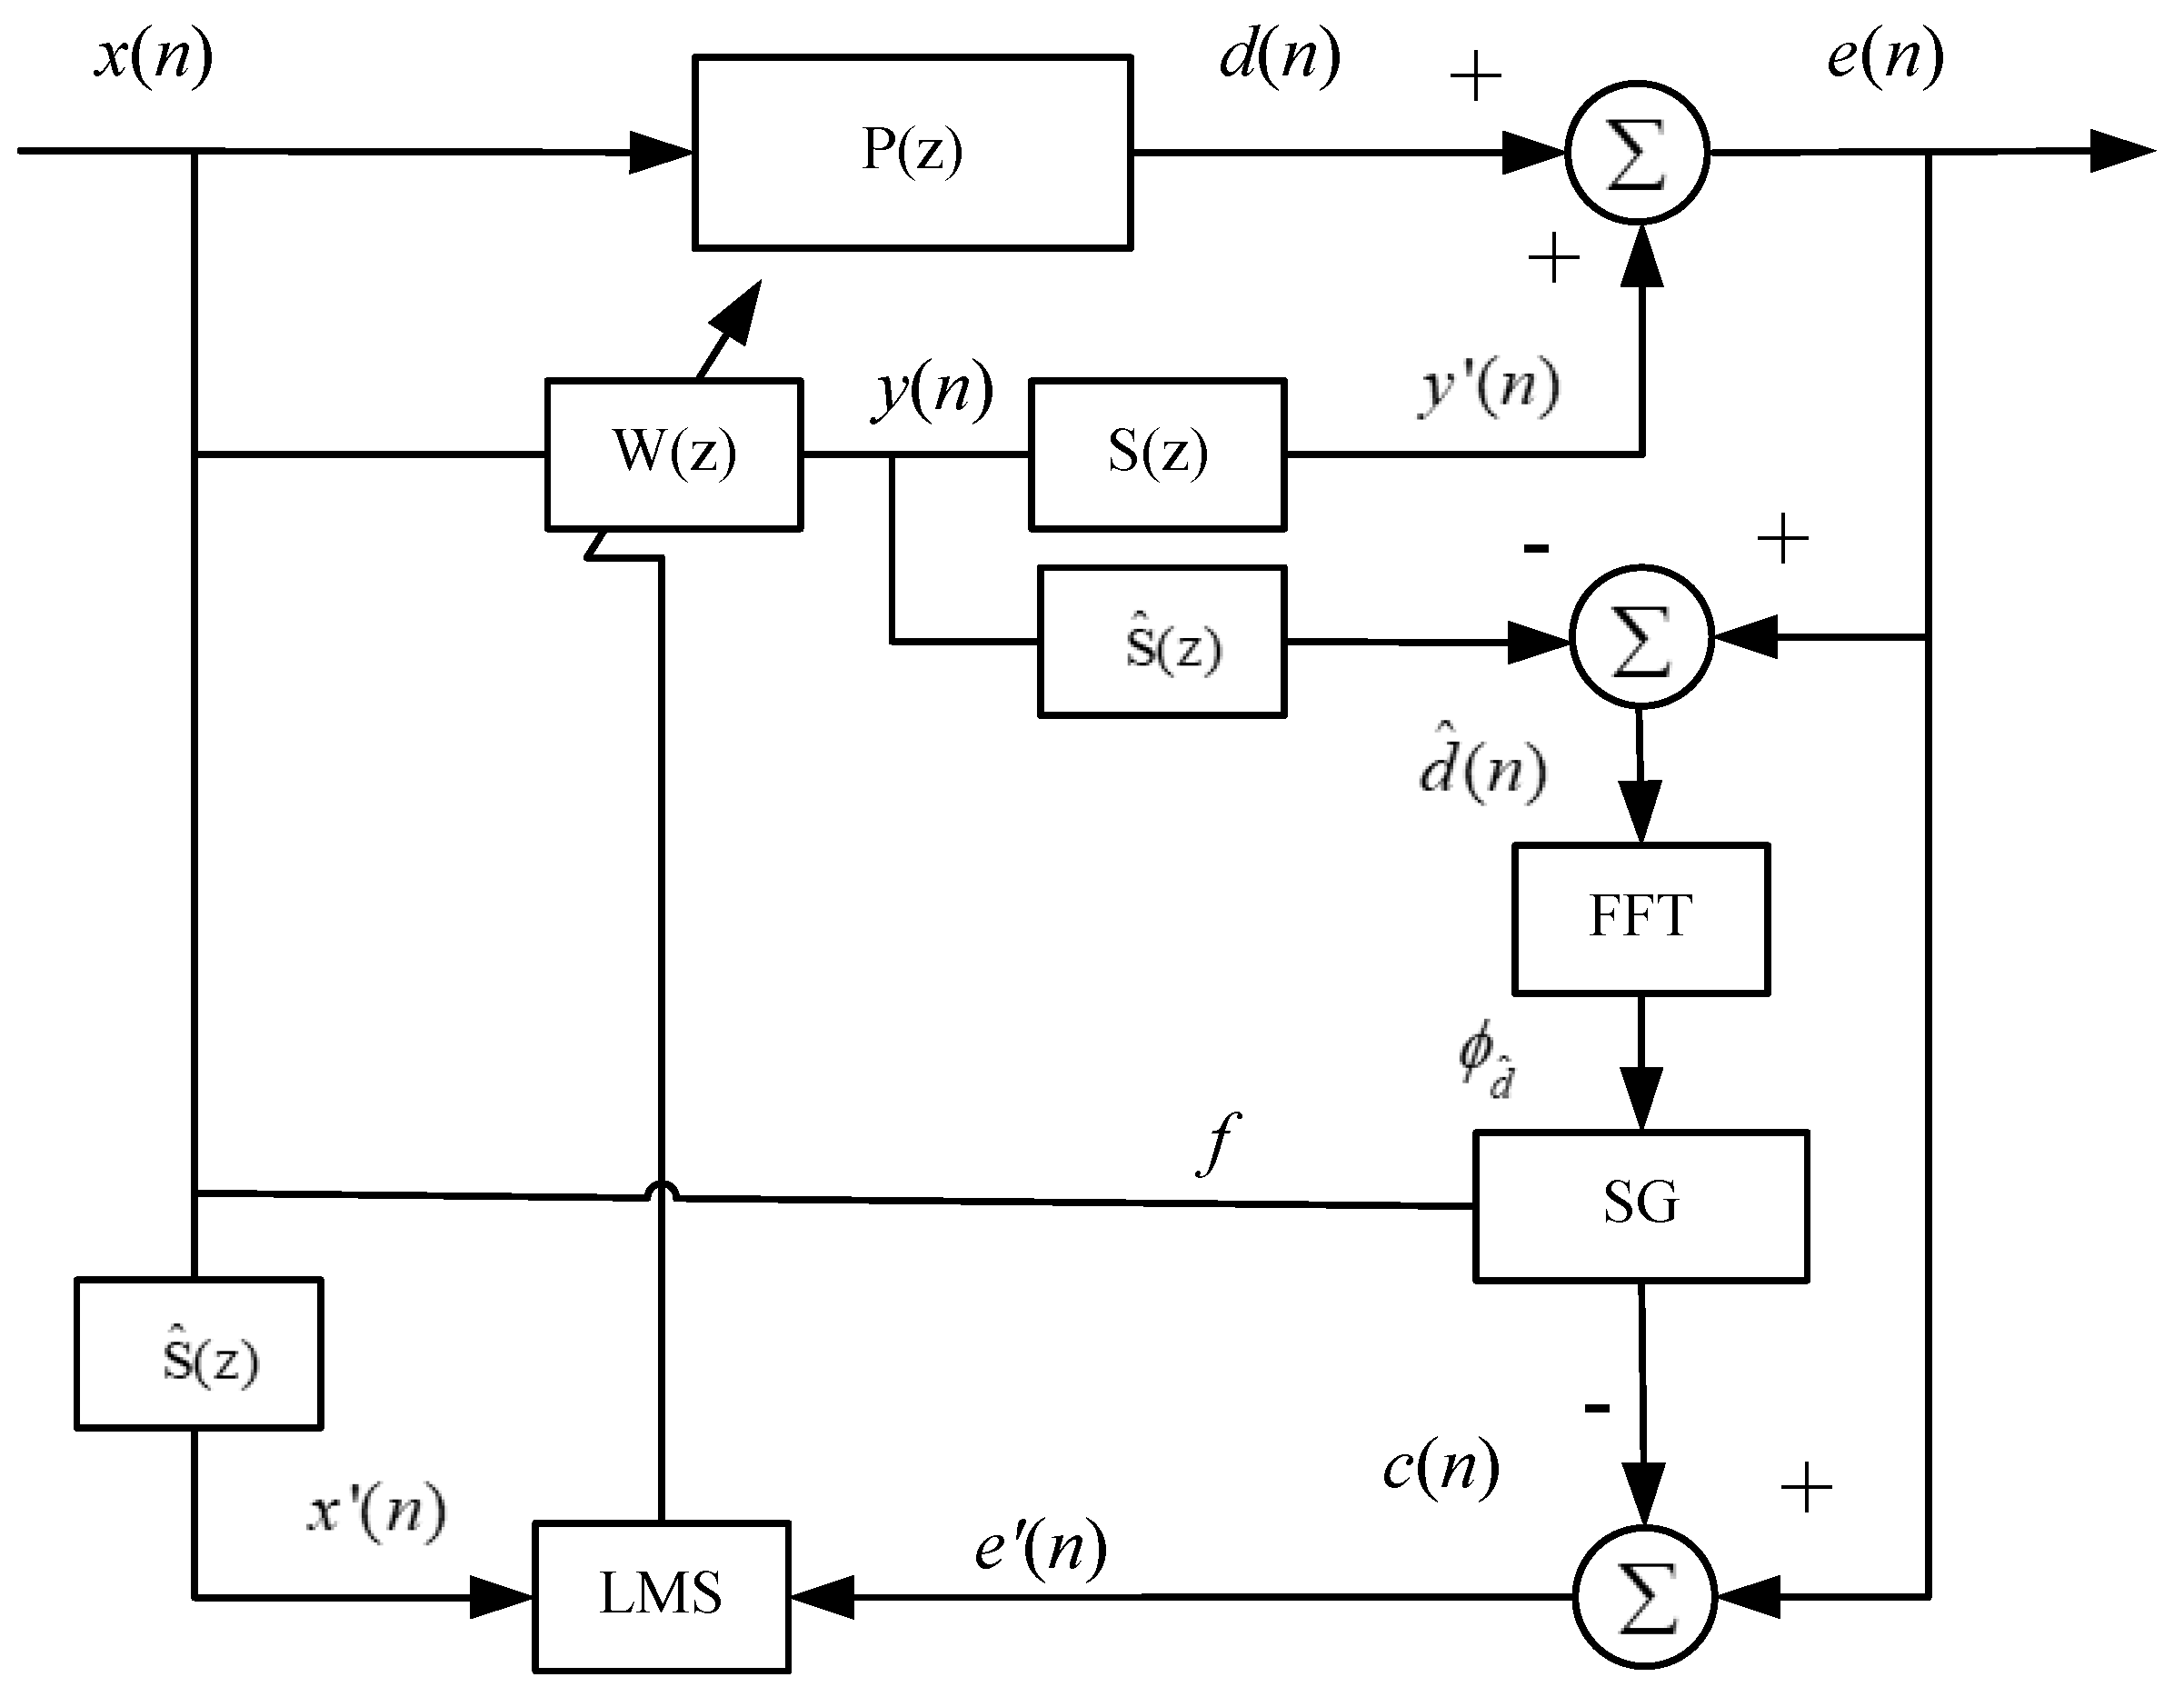
In practical applications, the command-FXLMS algorithm is highly robust to amplitude errors in the plant estimates, which represents a significant advantage over the ANE-based algorithms. However, this algorithm has excessive control effort when the command and disturbance signals are out of phase. To overcome this shortcoming, Rees et al. [18] have proposed the PSC-FXLMS algorithm, which is shown in Figure 2.
The modeled disturbance signal, d ^ ( n ) , can be expressed by:
d ^ ( n ) = e ( n ) y ( n ) s ^ ( n )
where s ^ ( n ) is the impulse response of the secondary path estimate S ^ ( z ) .
The FFT is performed to compute the phase of disturbance signal, which is denoted as ϕ d ^ ; then, the in-phase command signal can be expressed by:
c ( n ) = C cos ( 2 π f n F s + ϕ d ^ )
where C is the predefined amplitude of the command signal, Fs is the sampling rate, and f is the frequency of the disturbance signal, which can be obtained from the reference signal.

3. Performance Analysis

Theoretically, the amplitude of the command signal is the desired predefined value, while the phase of the command signal is unconcerned. However, in practice, for profiling the disturbance signal, while meeting the requirement for limiting the control effort simultaneously, the predefined command signal should be set to be in phase with the disturbance signal. Therefore, the PSC-FXLMS algorithm use the FFT to estimate the phase of modeled disturbance signal as an essential parameter for command signal. But, in practice application, imperfect modeled disturbance signal may lead to the phase error between command signal and real disturbance signal. Therefore, the influence of the phase error between the command and disturbance signals on the convergence is explained in detail in the following.
According to Eqs. (4) and (5), when the pseudo error e ' ( n ) converge to zero, it holds that:
y ' ( n ) = c ( n ) d ( n )
Without loss of generality, assuming that the command and disturbance signals are cosine waves, it can be written that:
d ( n ) = D cos ( ω n )
c ( n ) = C cos ( ω n + ϕ )
where ω is the circular frequency, and ϕ [ 0 , 2 π ) is the phase error between the command and disturbance signals.
Substituting Eqs. (15) and (16) into Eq. (14) yields:
y ' ( n ) = C cos ( ω n + ϕ ) D cos ( ω n ) = C [ cos ( ω n ) cos ϕ sin ( ω n ) sin ϕ ] D cos ( ω n ) = [ C cos ϕ D ] cos ( ω n ) C sin ( ω n ) sin ϕ = Y ' ( C , ϕ ) cos ( ω n + ϕ ' )
where Y ' ( C , ϕ ) and ϕ ' are amplitude and phase of y ' ( n ) , respectively, and they are expressed as follows:
Y ' ( C , ϕ ) = C 2 + D 2 2 C D cos ϕ
ϕ ' = arctan ( C sin ϕ C cos ϕ D )
According to Eq. (18), the control effort is extremely relevant with the phase error ϕ . As concluded in [18], when ϕ : 0 π , the control effort increases, but when ϕ : π 2 π , the control effort decreases. Thus, it is obvious that the control effort is reaching a peak when ϕ = π .
As shown in Figure 2, the filtered reference signal x ' ( n ) can be expressed by:
x ' ( n ) = [ x ' ( n ) x ' ( n 1 ) x ' ( n L + 1 ) ]
where L is the length of vector, and the value of x ' ( n l ) is obtained by:
x ' ( n l ) = x ( n l ) s ^ ( n )
where l = 0 , 1 , L 1 .
Assuming that S ^ ( z ) = S ( z ) , it holds that s ^ ( n ) = s ( n ) . According to Eqs. (3)–(5), (20), and (21), the mean square error (MSE) of the pseudo error, which is related to the phase error, can be expressed by:
ξ ( n , ϕ ) = E [ e ' ( n ) ] 2 = E [ c ( n ) d ( n ) ] 2 2 p ( n , ϕ ) T w ( n , ϕ ) + w T ( n , ϕ ) R ( n ) w ( n , ϕ )
where,
p ( n , ϕ ) = E [ c ( n ) d ( n ) ] x ' ( n )
R ( n ) = E [ x ' ( n ) x ' T ( n ) ] .
It should be noted that the autocorrelation matrix R ( n ) and vector p ( n , ϕ ) are invariable when the system is dealing with stationary signals, but they are time-varying when the system is dealing with nonstationary signals. According to the concept of steepest descent, the algorithm can be implemented into:
w ( n + 1 , ϕ ) = w ( n , ϕ ) μ 2 ξ ( n , ϕ )
where μ is the step size, and vector ξ ( n , ϕ ) denotes the gradient of the error noise function.
From Eq. (22), the gradient can be easily calculated as follows:
ξ ( n , ϕ ) = 2 p ( n , ϕ ) + 2 R ( n ) w ( n , ϕ )
The optimum filter w o ( n , ϕ ) minimizes the MSE cost function ξ ( n , ϕ ) ; Eqs. (22) and (26) give w o ( n , ϕ ) as a solution to:
w o ( n , ϕ ) = p ( n , ϕ ) / R ( n )
To obtain the minimum MSE, the optimum weight vector w o ( n , ϕ ) given by Eq. (27) is used to obtain w ( n , ϕ ) in Eq. (22), which yields:
ξ min = E [ c ( n ) d ( n ) ] 2 p ( n , ϕ ) T w o ( n , ϕ )
By combining Eq. (28) with Eqs. (22) and (27), the MSE can be calculated by:
ξ ( n , ϕ ) = ξ min + [ w ( n , ϕ ) w o ( n , ϕ ) ] T R ( n ) [ w ( n , ϕ ) w o ( n , ϕ ) ] = ξ min + w ( n , ϕ ) T R ( n ) w ( n , ϕ )
where,
w ( n , ϕ ) = w ( n , ϕ ) w o ( n , ϕ )
Substituting Eq. (26) into Eq. (25) gives:
w ( n + 1 , ϕ ) = ( I μ R ( n ) ) w ( n , ϕ ) + μ p ( n , ϕ )
Combining Eqs. (27) and (30), Eq. (31) can be rewritten as follows:
w ( n + 1 , ϕ ) = ( I μ R ( n ) ) w ( n , ϕ )
The autocorrelation matrix defined in Eq. (24) can be decomposed into:
R ( n ) = Q ( n ) Λ ( n ) Q T ( n )
where Q is the modal matrix formed by the eigenvectors of R, and it satisfies the following relationship:
I = Q ( n ) Q T ( n )
and,
Λ ( n ) = d i a g ( λ 0 ( n ) , λ 1 ( n ) , , λ L 1 ( n ) )
A rotated weight misalignment vector can be defined by:
w ˜ ( n , ϕ ) = Q T ( n ) w ( n , ϕ )
Then, from Equations (32)–(35), it holds that:
w ˜ ( n + 1 , ϕ ) = ( I μ Λ ( n ) w ˜ ( n , ϕ )
and,
w ˜ ( n , ϕ ) = ( I μ Λ ( n ) n w ˜ ( 0 , ϕ )
Further, Eq. (29) can be rewritten as follows:
ξ ( n , ϕ ) = ξ min + w ˜ ( n , ϕ ) T Λ ( n ) w ˜ ( n , ϕ )
and,
ξ ( n , ϕ ) = ξ min + w ˜ ( 0 , ϕ ) T ( I μ Λ ( n ) ) n Λ ( n ) ( I μ Λ ( n ) ) n w ˜ ( 0 , ϕ ) = ξ min + l = 0 L 1 λ l ( n ) ( 1 μ λ l ( n ) ) 2 n w ˜ l 2 ( 0 , ϕ )
As well-know, that 1 μ λ l ( n ) < 1 , means that when n , then ( 1 μ λ l ( n ) ) 2 n 0 ; from Eq. (38), it can be easily obtained that when n , then w ˜ ( n , ϕ ) 0 , that is, w ( n , ϕ ) w o ( n , ϕ ) . Based on the basic knowledge about the sequence limit, it holds that w ˜ ( n , ϕ ) 0 is equivalent to w ˜ ( n , ϕ ) 2 0 . The norm 2 of Eq. (38) is given by:
w ˜ ( n , ϕ ) 2 = ( I μ Λ ( n ) ) n w ˜ ( 0 , ϕ ) 2 ( I μ Λ ( n ) ) n 2 w ˜ ( 0 , ϕ ) 2 = ( 1 μ λ min ( n ) ) n w ˜ ( 0 , ϕ ) 2 ( 1 μ λ min ( n ) ) n Q T ( n ) 2 ( w o ( n , ϕ ) 2 + w ( 0 , ϕ ) 2 )
Further, based on the knowledge about the LIMIT, the problem w ˜ ( n , ϕ ) 2 0 can be defined as follows. For any ε > 0 , there exists N such that when n > N , it holds that w ˜ ( n , ϕ ) 2 < ε . In practice, a real constant ε 0 1 can be defined, and when n > N , then w ˜ ( n , ϕ ) 2 < ε 0 , which means that w ˜ ( n , ϕ ) 2 has converged. That is, when
( 1 μ λ min ( n ) ) n Q T ( n ) 2 ( w o ( n , ϕ ) 2 + w ( 0 , ϕ ) 2 ) < ε 0
w ˜ ( n , ϕ ) 2 has converged.
From Eqs. (11), (15), (16), and (18), it can be obtained that:
w o ( n , ϕ ) 2 2 = C 2 + D 2 2 C D cos ϕ | X ' | 2
where | X ' | is the magnitude of the reference signal.
From Eqs. (41) and (43), and because the value of w o ( n , ϕ ) 2 is positive, we have:
w ˜ ( n , ϕ ) 2 = ( 1 μ λ min ( n ) ) n Q T ( n ) 2 ( C 2 + D 2 2 C D cos ϕ | X ' | + w ( 0 , ϕ ) 2 )
Thus, it holds that when
( 1 μ λ min ( n ) ) n M ( n , ϕ ) < ε 0
The system is converged. Where
M ( n , ϕ ) = Q T ( n ) 2 ( C 2 + D 2 2 C D cos ϕ | X ' | + w ( 0 , ϕ ) 2 )
When Eq. (46) is satisfied, it holds that:
n 0 ( ϕ ) = log 1 μ λ min ( n ) ( ε 0 / M ( n , ϕ ) )
Since the iteration N ( ϕ ) is a positive integer, it can be written:
N ( ϕ ) = [ n 0 ( ϕ ) ] + 1
where [ n 0 ( ϕ ) ] indicates that n 0 ( ϕ ) is rounded down.
From the above expressions, the following conclusion can be drawn:
1) For stationary signals, according to Eqs. (45)–(48), when sequence w ˜ ( N ( ϕ ) , ϕ ) ) 2 < ε 0 is satisfied, then w ( n , ϕ ) w o ( n , ϕ ) , n = N ( ϕ ) + 1 , N ( ϕ ) + 2 , . Also, N ( ϕ ) indicates the iteration number of the weight vector w ( n , ϕ ) from w ( 0 , ϕ ) to w o ( n , ϕ ) , which corresponds to the convergence of the MSE from ξ ( 0 , ϕ ) to ξ min . The iteration number N ( ϕ ) is related to the phase error ϕ . Based on Eq. (44), the relationship is as follows: when ϕ : 0 π , N ( ϕ ) increases progressively, but when ϕ : π 2 π , N ( ϕ ) decreases progressively. Thus, the iteration number N ( ϕ ) is reaching a peak when ϕ = π . Consequently, in real applications, there can be a large convergence time constant when the disturbance and command signals are out of phase.
2) According to Eqs. (23), (27), and (43), the phase error ϕ has an impact of w o ( n , ϕ ) 2 > w o ( n , 0 ) 2 . Combining this with Eq. (44), it can be concluded that the phase error increases the norm of vector w ˜ ( n , ϕ ) 2 ; in other words, the phase error ϕ may increase the convergence time constant by resulting in w o ( n , ϕ ) more far from w ( 0 , ϕ ) . From Eqs. (45)–(48), if there the value of w ˜ ( n , ϕ ) 2 is large, the iteration number N ( ϕ ) is also large, which implies large convergence time constant. Actually, in the process of w ˜ ( n , ϕ ) 2 0 , this iteration focuses on the MSE difference given by Eq. (40), defining the difference of ξ ( n , ϕ ) as follows:
Δ ξ ( n , ϕ ) = ξ ( n + 1 , ϕ ) ξ ( n , ϕ ) = l = 0 L 1 λ l ( n ) ( 1 μ λ l ( n ) ) 2 n + 2 w ˜ l 2 ( 0 , ϕ ) l = 0 L 1 λ l ( n ) ( 1 μ λ l ( n ) ) 2 n w ˜ l 2 ( 0 , ϕ ) = 2 μ l = 0 L 1 λ l 2 ( n ) ( 1 μ λ l ( n ) ) 2 n w ˜ l 2 ( 0 , ϕ ) + μ 2 l = 0 L 1 λ l 3 ( n ) ( 1 μ λ l ( n ) ) 2 n w ˜ l 2 ( 0 , ϕ )
When the algorithm is far from the convergence, Δ ξ ( n , ϕ ) < 0 , n , and according to the Lyapunov stability theory, the smaller the difference of Lyapunov function is, the faster the system convergence speed is. Therefore, according to w o ( n , ϕ ) 2 > w o ( n , 0 ) 2 , the phase error ϕ satisfies the condition of Δ ξ ( n , ϕ ) < Δ ξ ( n , 0 ) , leading to the faster convergence speed when the command and disturbance signals are out-of-phase. However, due to the slow adaptation and μ 1 , Δ ξ ( n , ϕ ) is mostly determined by μ but slightly by w ˜ l 2 ( 0 , ϕ ) . Therefore, the increase in the convergence rate due to the phase error is minimal, and even negligible. Consequently, the out of phase between command signal and disturbance may lead to an inevitable increase of convergence time constant.
3) Since the MSE is influenced by the phase error ϕ , a ratio can be defined by:
η = ξ ( n , ϕ ) ξ ( n , 0 ) = ξ min + l = 0 L 1 λ l ( n ) ( 1 μ λ l ( n ) ) 2 n w ˜ l 2 ( 0 , ϕ ) ξ min + l = 0 L 1 λ l ( n ) ( 1 μ λ l ( n ) ) 2 n w ˜ l 2 ( 0 , 0 )
Without loss of generality, define w ( 0 , ϕ ) = 0 ; then, from Eqs. (18) and (27), it can be imprecisely obtained:
w l o ( n , ϕ ) w l o ( n , 0 ) = C 2 + D 2 2 C D cos ϕ ( C D ) 2
When the algorithm is far from the convergence, assuming that ξ min is negligibly small, the ratio given by Eq. (50) can be expressed as follows:
η = ξ ( n , ϕ ) ξ ( n , 0 ) l = 0 L 1 λ l ( n ) ( 1 μ λ l ( n ) ) 2 n w ˜ l 2 ( 0 , ϕ ) l = 0 L 1 λ l ( n ) ( 1 μ λ l ( n ) ) 2 n w ˜ l 2 ( 0 , 0 ) = C 2 + D 2 2 C D cos ϕ ( C D ) 2
Therefore, the phase error has nonnegligible influence on w o ( n , ϕ ) . This coincides with the conclusion that the phase error may increase the convergence time constant by resulting in w o ( n , ϕ ) that is far from w ( 0 , ϕ ) . As given in Eq. (50), the term ( 1 μ λ l ( n ) ) 2 n converges to zero, as the adaptive filter convergence. Means that the ξ ( n , ϕ ) converges to ξ min , and η converges to one. Consequently, the MSE performance at the steady state is slightly affected by the phase error ϕ .
4) For nonstationary signals, according to Eq. (27), the optimum weight vector w o ( n , ϕ ) is time-varying as the matrix R and vector P changing. In other words, the adaptive vector w ( n , ϕ ) converges to a time-varying objective by every updating step. Then, the iteration of Eq. (31) can be regarded as a one-step steepest descent update. In case of far from convergence, and the changing speed of w o ( n , ϕ ) is much slower than the adaption speed of w ( n , ϕ ) , it can be assumed that w o ( n + 1 , ϕ ) w o ( n , ϕ ) , and the MSE also can be expressed by Eq. (39). Under these assumptions, the following approximation can be made based on Eqs. (31), (32), (36), (37), and (39):
ξ ( n + 1 , ϕ ) ξ min + w ˜ ( n , ϕ ) T ( I μ Λ ( n ) ) Λ ( n ) ( I μ Λ ( n ) ) w ˜ ( n , ϕ ) ξ min + l = 0 L 1 λ l ( n ) ( 1 μ λ l ( n ) ) 2 w ˜ l 2 ( n , ϕ )
The above equation is similar to Eq. (40), and difference in ξ ( n , ϕ ) can be expressed by:
Δ ξ ( n , ϕ ) = 2 μ l = 0 L 1 λ l 2 ( n ) w ˜ l 2 ( n , ϕ ) + μ 2 l = 0 L 1 λ l 3 ( n ) w ˜ l 2 ( n , ϕ )
which implies that the convergence rate of a one-step adaption has negligible relationship with the phase error. However, when the phase error cases that w o ( n , ϕ ) is far from w ( n , ϕ ) , resulting in the one-step adaption with the out of phase may difficultly make w ( n + 1 , ϕ ) approaching to w o ( n , ϕ ) . Therefore, as the adaptive vector updating, there is a disadvantage of the adaptive filter reaching the optimum every step, which results from the phase error.
To investigate the effect of the phase error on a nonstationary system more clearly, a ratio b can be defined by:
β = ξ ( n , ϕ ) ξ ( n , 0 ) ξ min + l = 0 L 1 λ l ( n ) w ˜ l 2 ( n , ϕ ) ξ min + l = 0 L 1 λ l ( n ) w ˜ l 2 ( n , 0 )
From Eq. (18), (27), and (51), and assuming the ξ min is always negligibly small in the process of continuous one-step update, the ratio given by Eq. (55) can be expressed as follows:
β = ξ ( n , ϕ ) ξ ( n , 0 ) l = 0 L 1 λ l ( n ) w ˜ l 2 ( n , ϕ ) l = 0 L 1 λ l ( n ) w ˜ l 2 ( n , 0 ) = C 2 + D 2 2 C D cos ϕ ( C D ) 2
Therefore, unlike the case of stationary disturbance, the phase error can strongly affect the MSE; in other words, the ASP algorithm performance may decrease in profiling nonstationary disturbance. A prediction of the ASP algorithm’s performance for nonstationary signals with either in-phase or out-of-phase command signals may be obtained from the ratio given by Eq. (56).
4. Simulations

In this section, simulation results for three cases were provided to clarify the provided insights into the influence of the phase error. In cases 1 and 2, simulations were conducted to demonstrate the validity of the derived convergence time constant performance and steady state MSE expressions. The primary and secondary paths were FIR filters created by the MATLAB function (fir1) with the cutoff frequency of 0.4 π and 0.5 π , respectively. The disturbance signal and command signal were defined by Eqs. (15) and (16), the amplitudes of the disturbance and command signals were D = 2 and C =1, respectively. The step size of the FXLMS was 0.000005. In case 3, the influence of phase error was demonstrated in an application of the algorithm of nonstationary noise profiling application in reference [15]. The primary path P(z) and secondary path S(z) are extracted from a real acoustic duct system which was shown in Figure 4 in [15], and their impulse response and frequency response were shown in Figure 4 in [15]. The simulation noise was same with the case C1 of which the chirp rate is 10 in [15].

4.1. Case 1

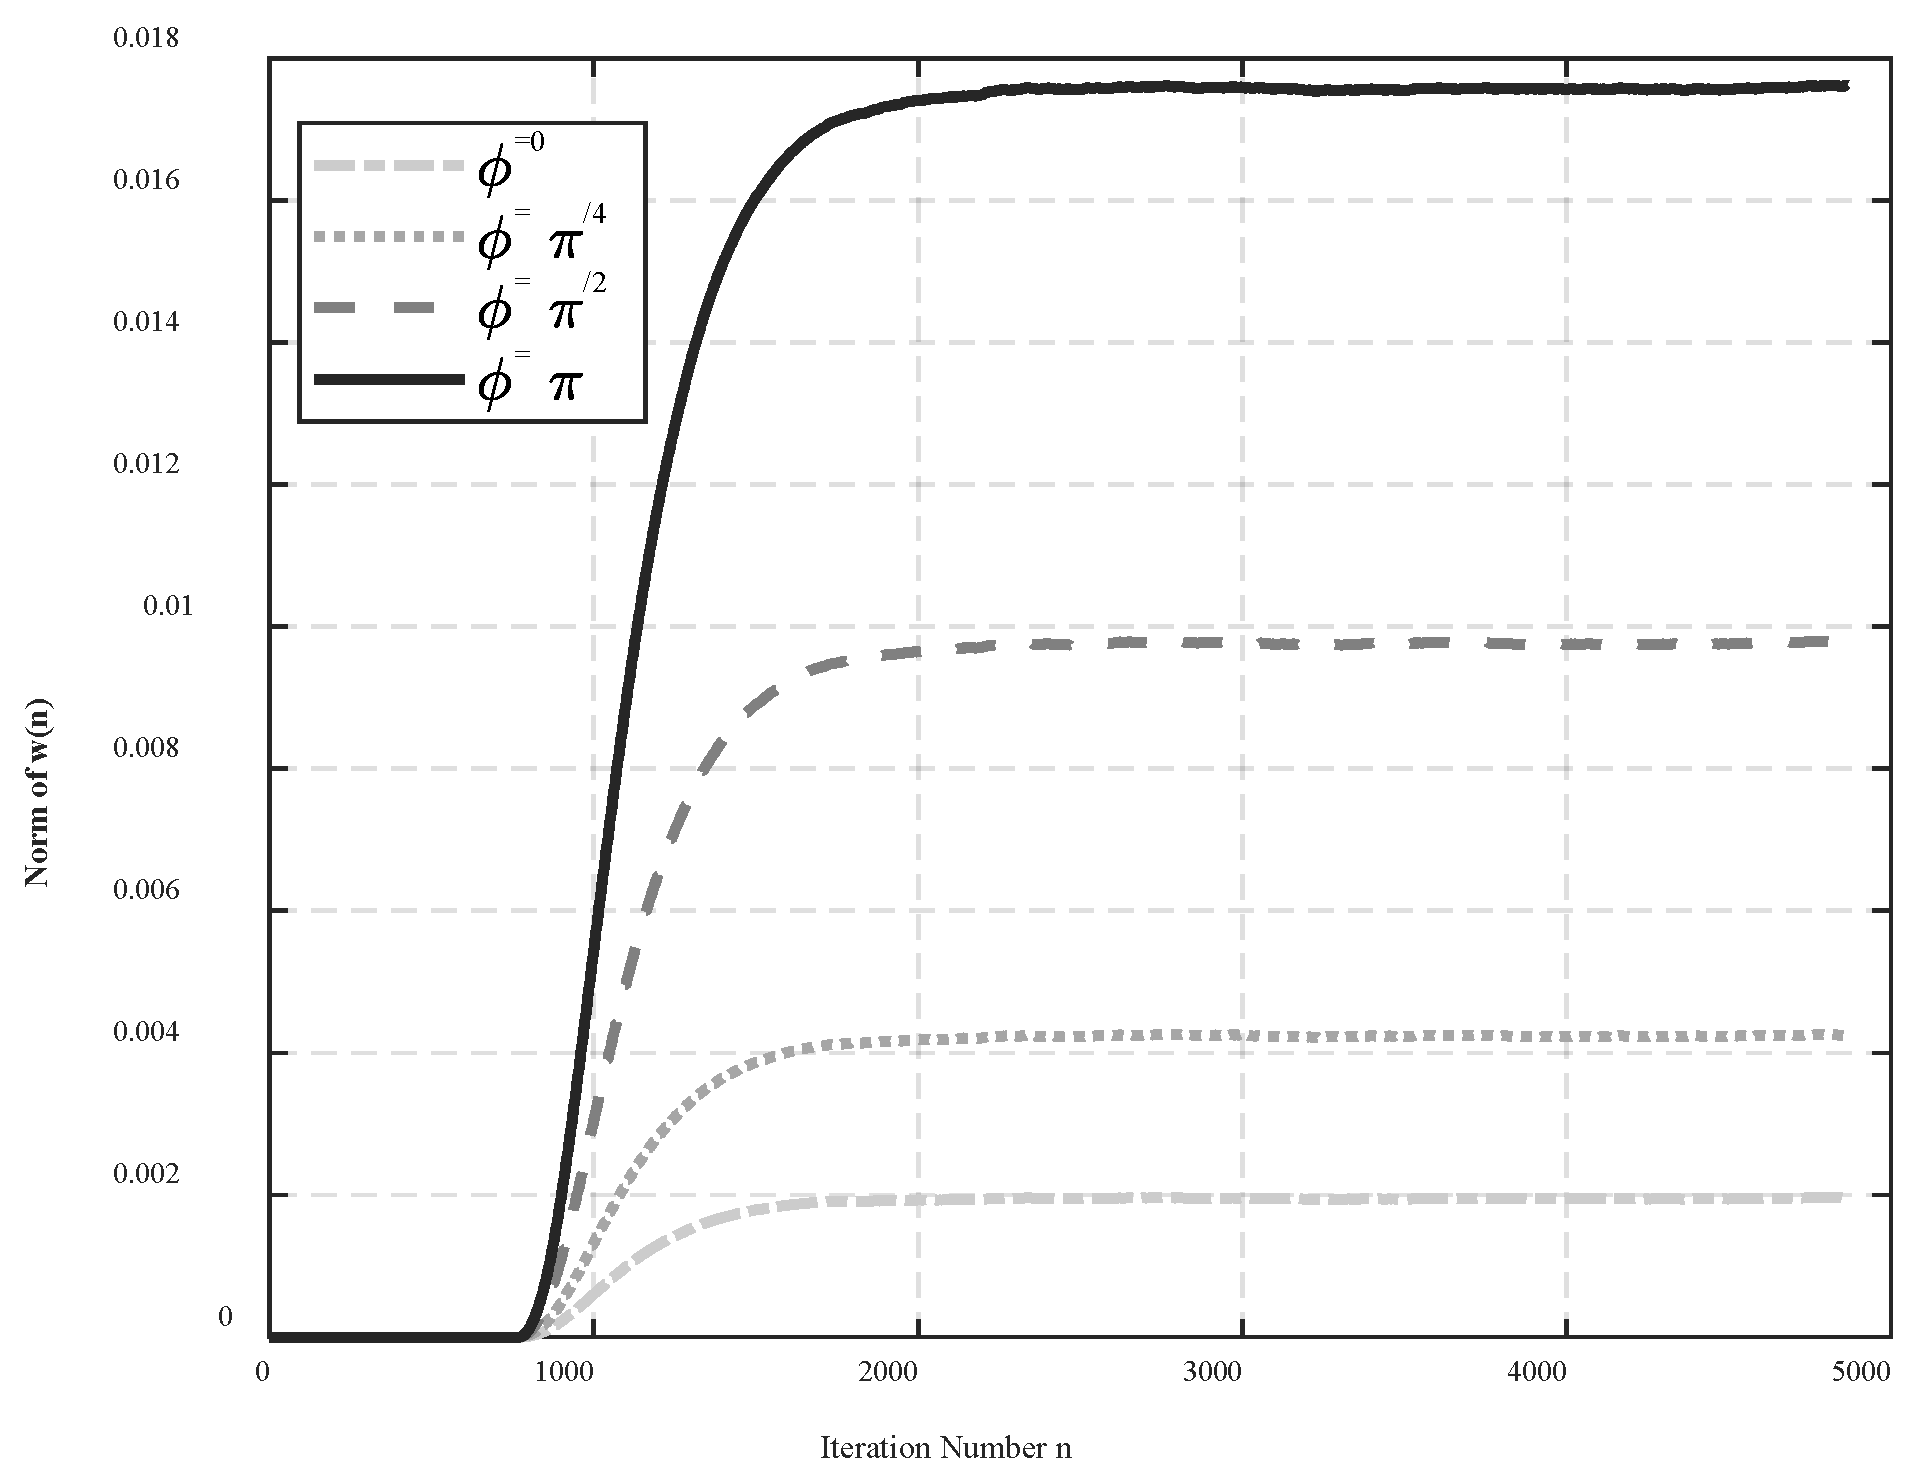
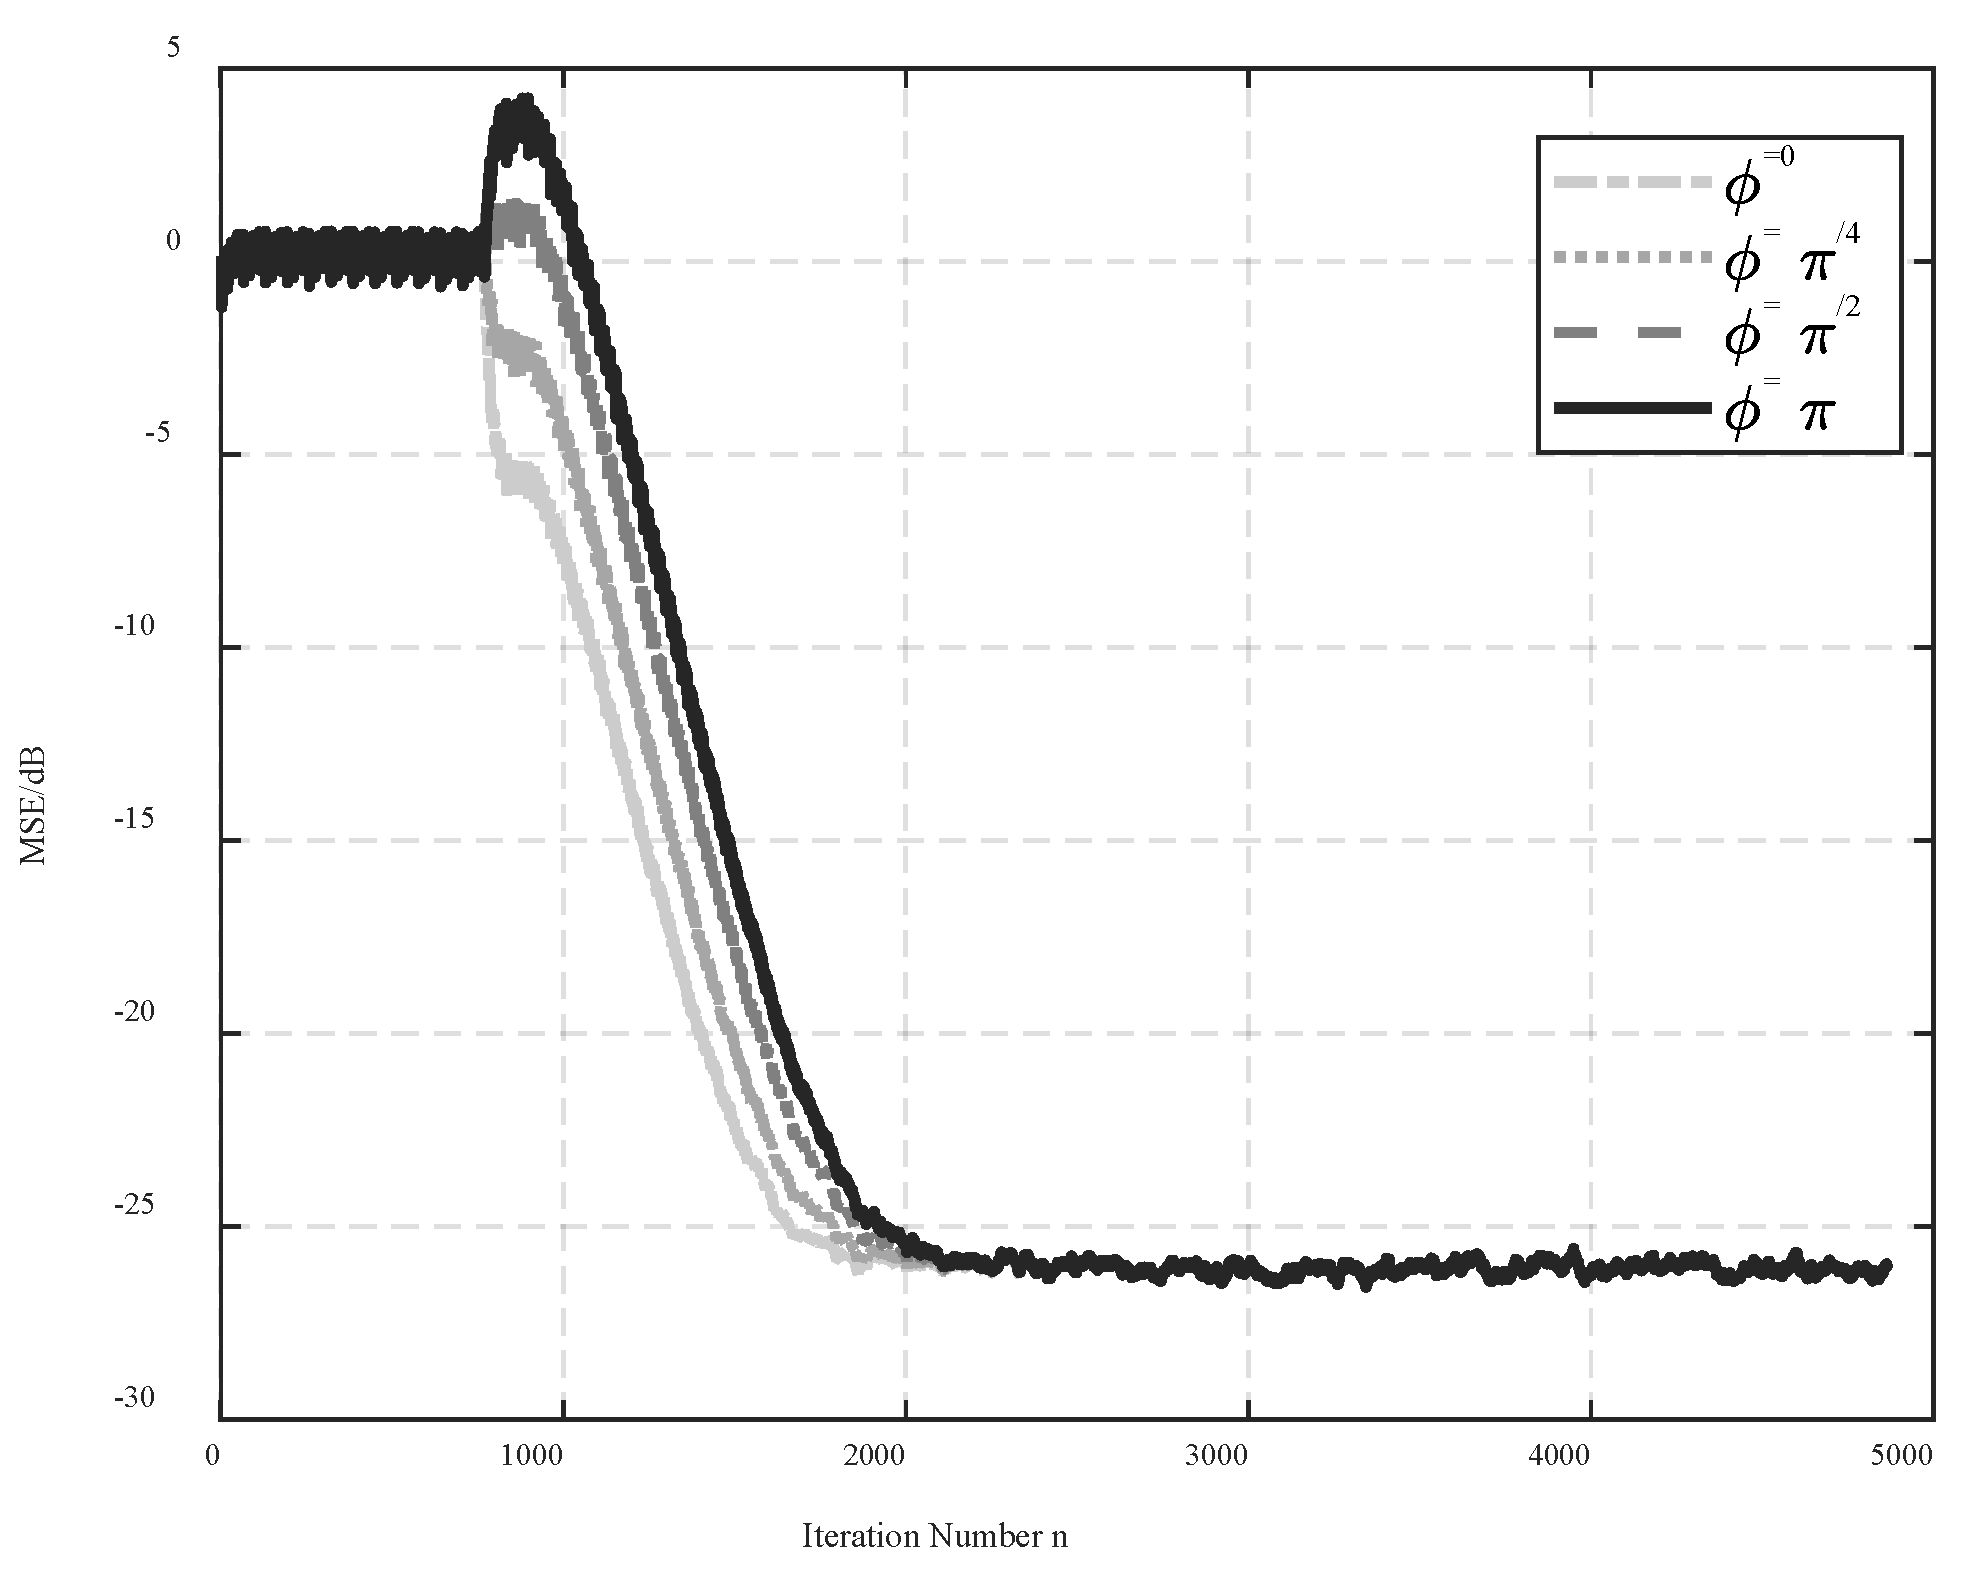
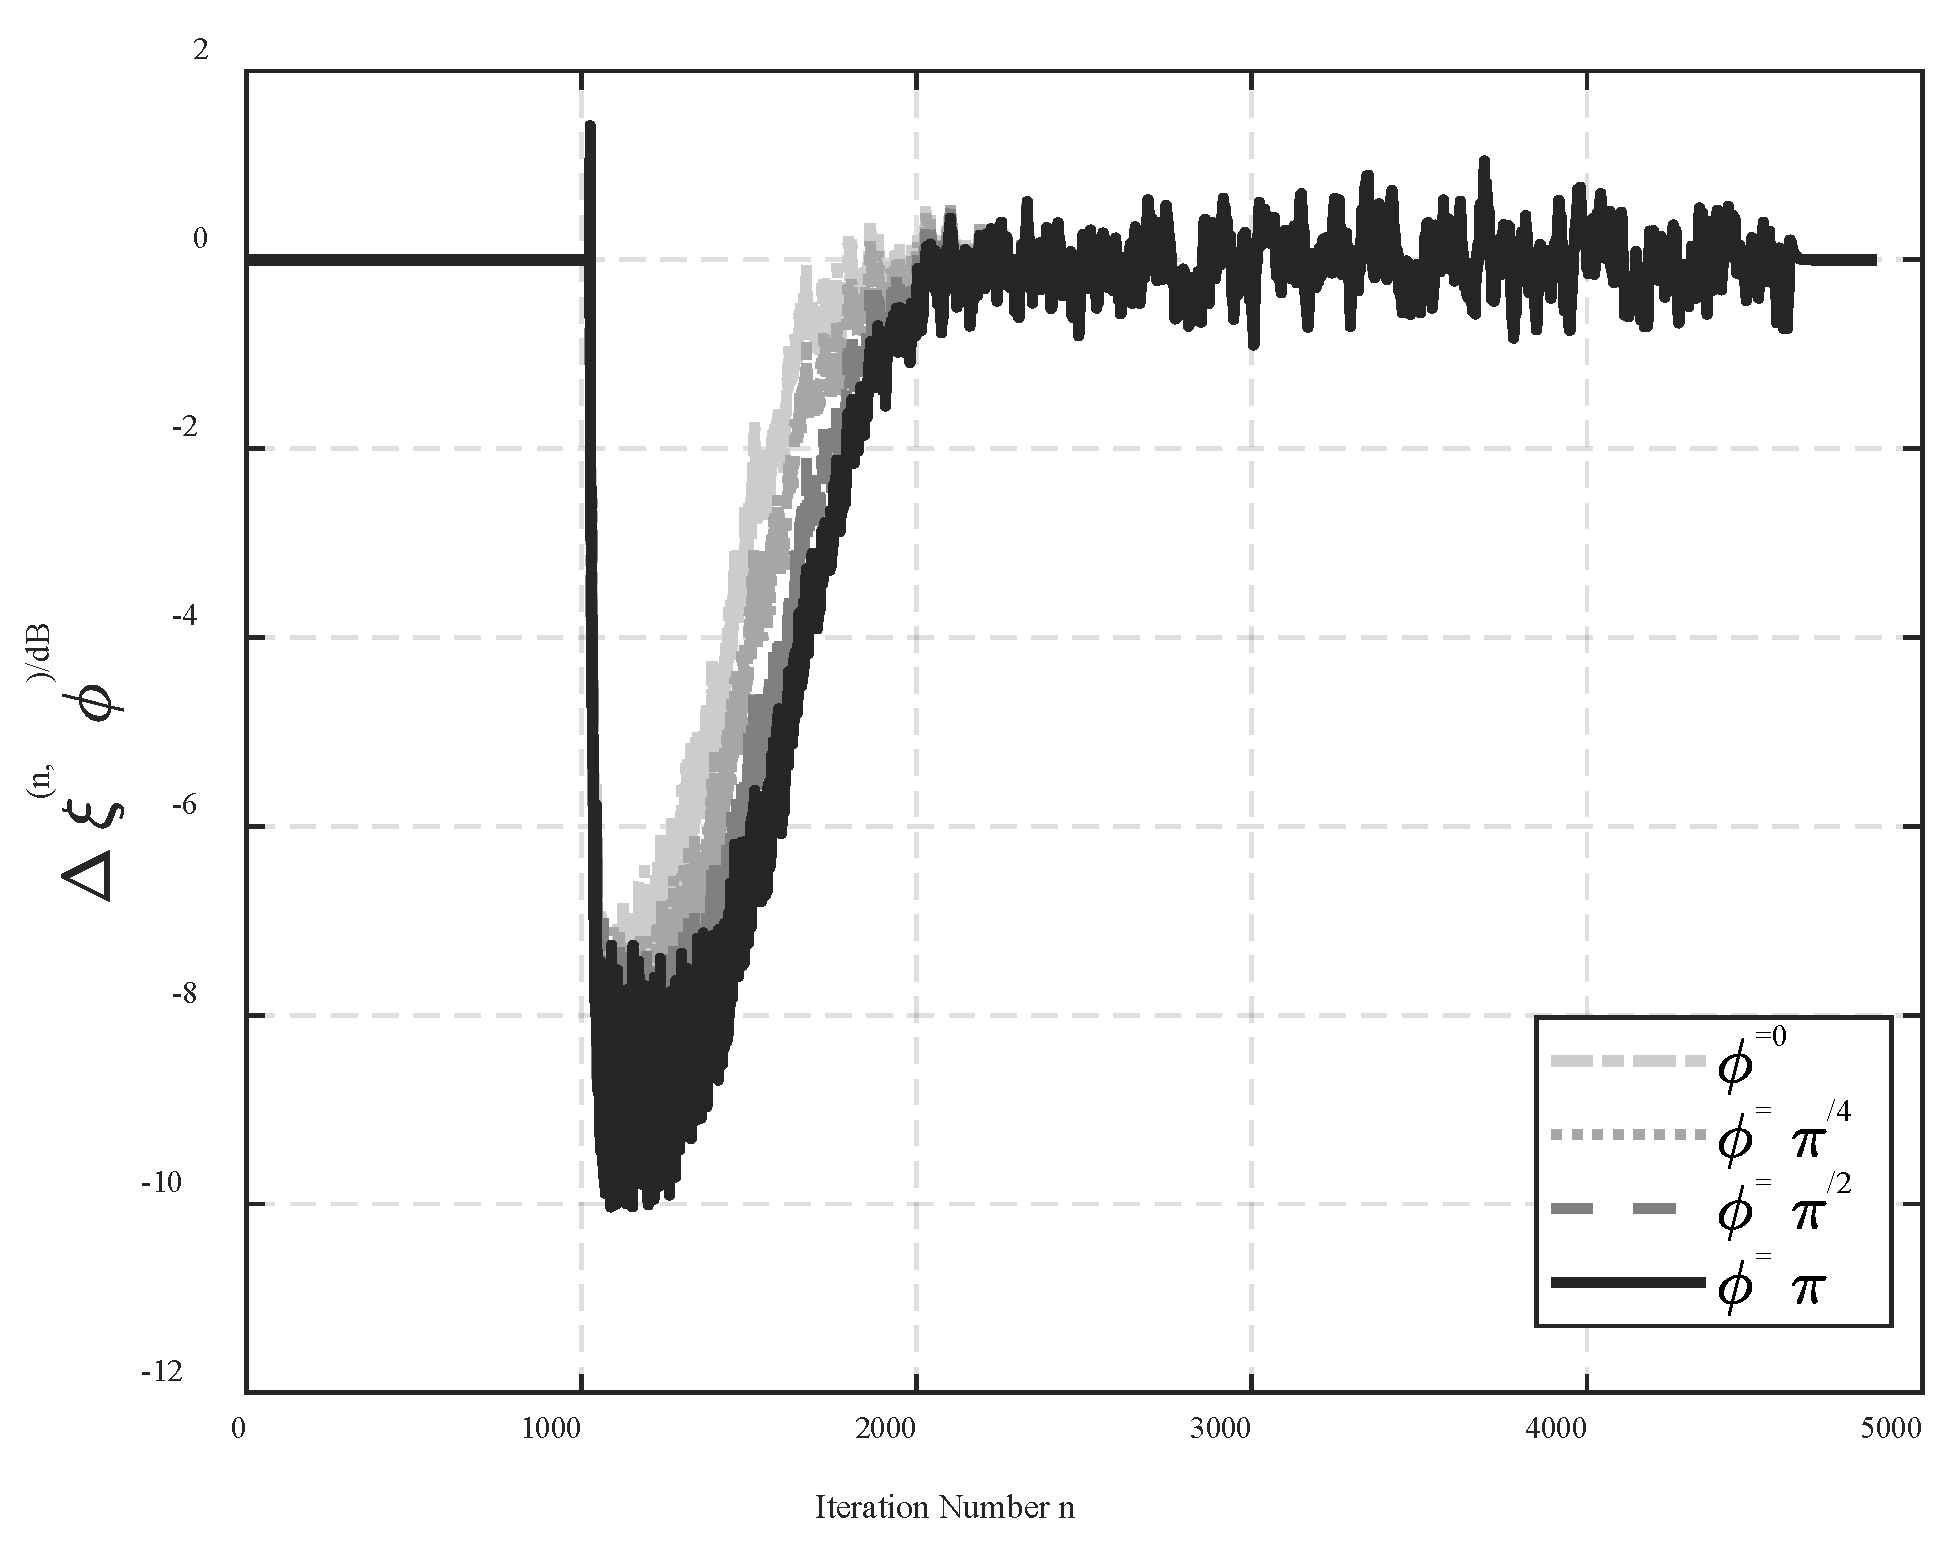
This case considered the stationary disturbance. The frequency of the disturbance signal was set to 120 Hz, and the phase error was in turn set to ϕ = 0 , π / 4 , π / 2 , π . The MSE of the pseudo error under different phase errors is presented in Figure 3. It can be seen that the convergence time constant increased when the phase error changed from zero to π . However, the MSE performance of the pseudo error at the steady state was nearly identical each other. As shown in Figure 4, at the convergence stage, the difference Δ ξ ( n , ϕ ) under different phase error decreased when the phase error increased from zero to π , which implied that the phase error increased the convergence rate, as given in Eq. (49). However, as shown in Figure 3 and Figure 4, the MSE difference under different phase errors ( ξ ( n , ϕ ) ξ ( n , 0 ) ) was large, this increase in the convergence rate was insufficient to counteract the considerable disparity due to which the phase error led to w o ( n , ϕ ) was far from w ( 0 , ϕ ) . The adaptation of w o ( n , ϕ ) 2 under different phase errors ( w ( 0 , ϕ ) = 0 ) is presented in Figure 5, where norm w o ( n , ϕ ) 2 increased when the phase error changed from zero to π . The convergence time constant result of w ( n , ϕ ) , which represented a change from w ( 0 , ϕ ) to w o ( n , ϕ ) , was in accordance with the performance presented by the MSE of the pseudo error.
Figure 3. The MSE result of the pseudo error for different iteration numbers under different phase errors.
Preprints 75924 g003
Figure 4. Difference of ξ ( n , ϕ ) under different phase errors.
Preprints 75924 g004
Figure 5. The adaptation of w o ( n , ϕ ) 2 under different phase errors ( w ( 0 , ϕ ) = 0 ).
Preprints 75924 g005

4.2. Case 2

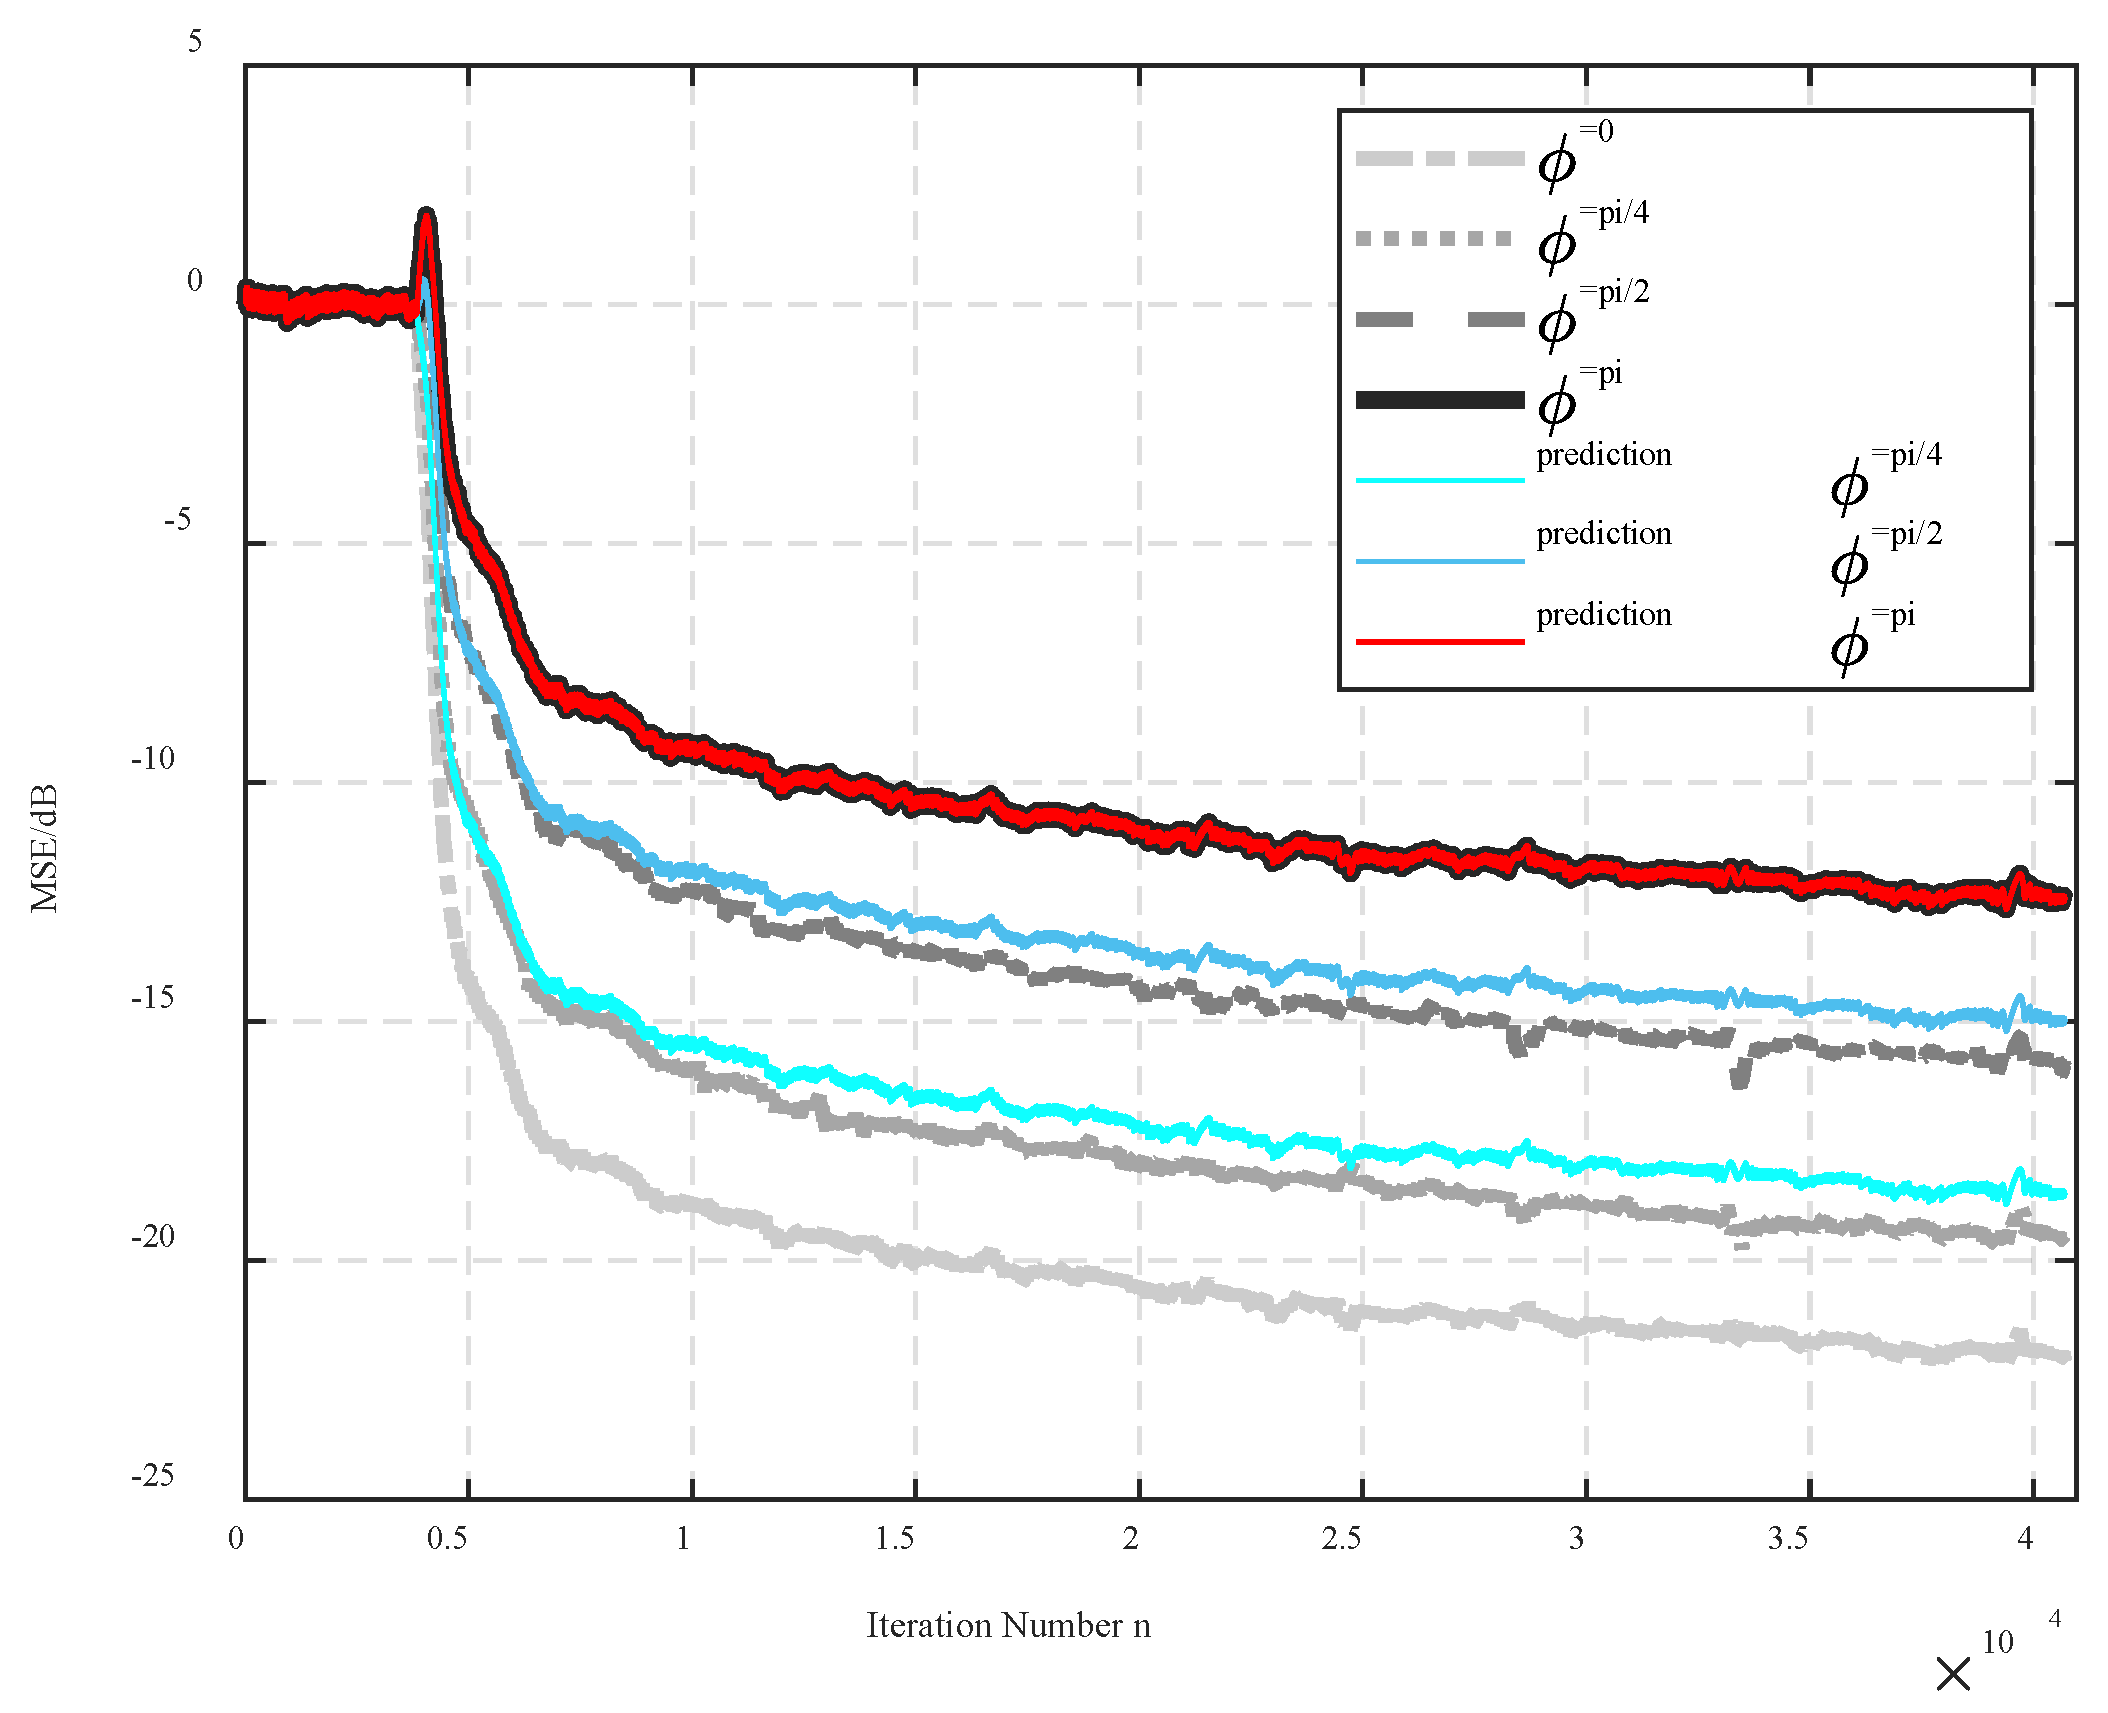
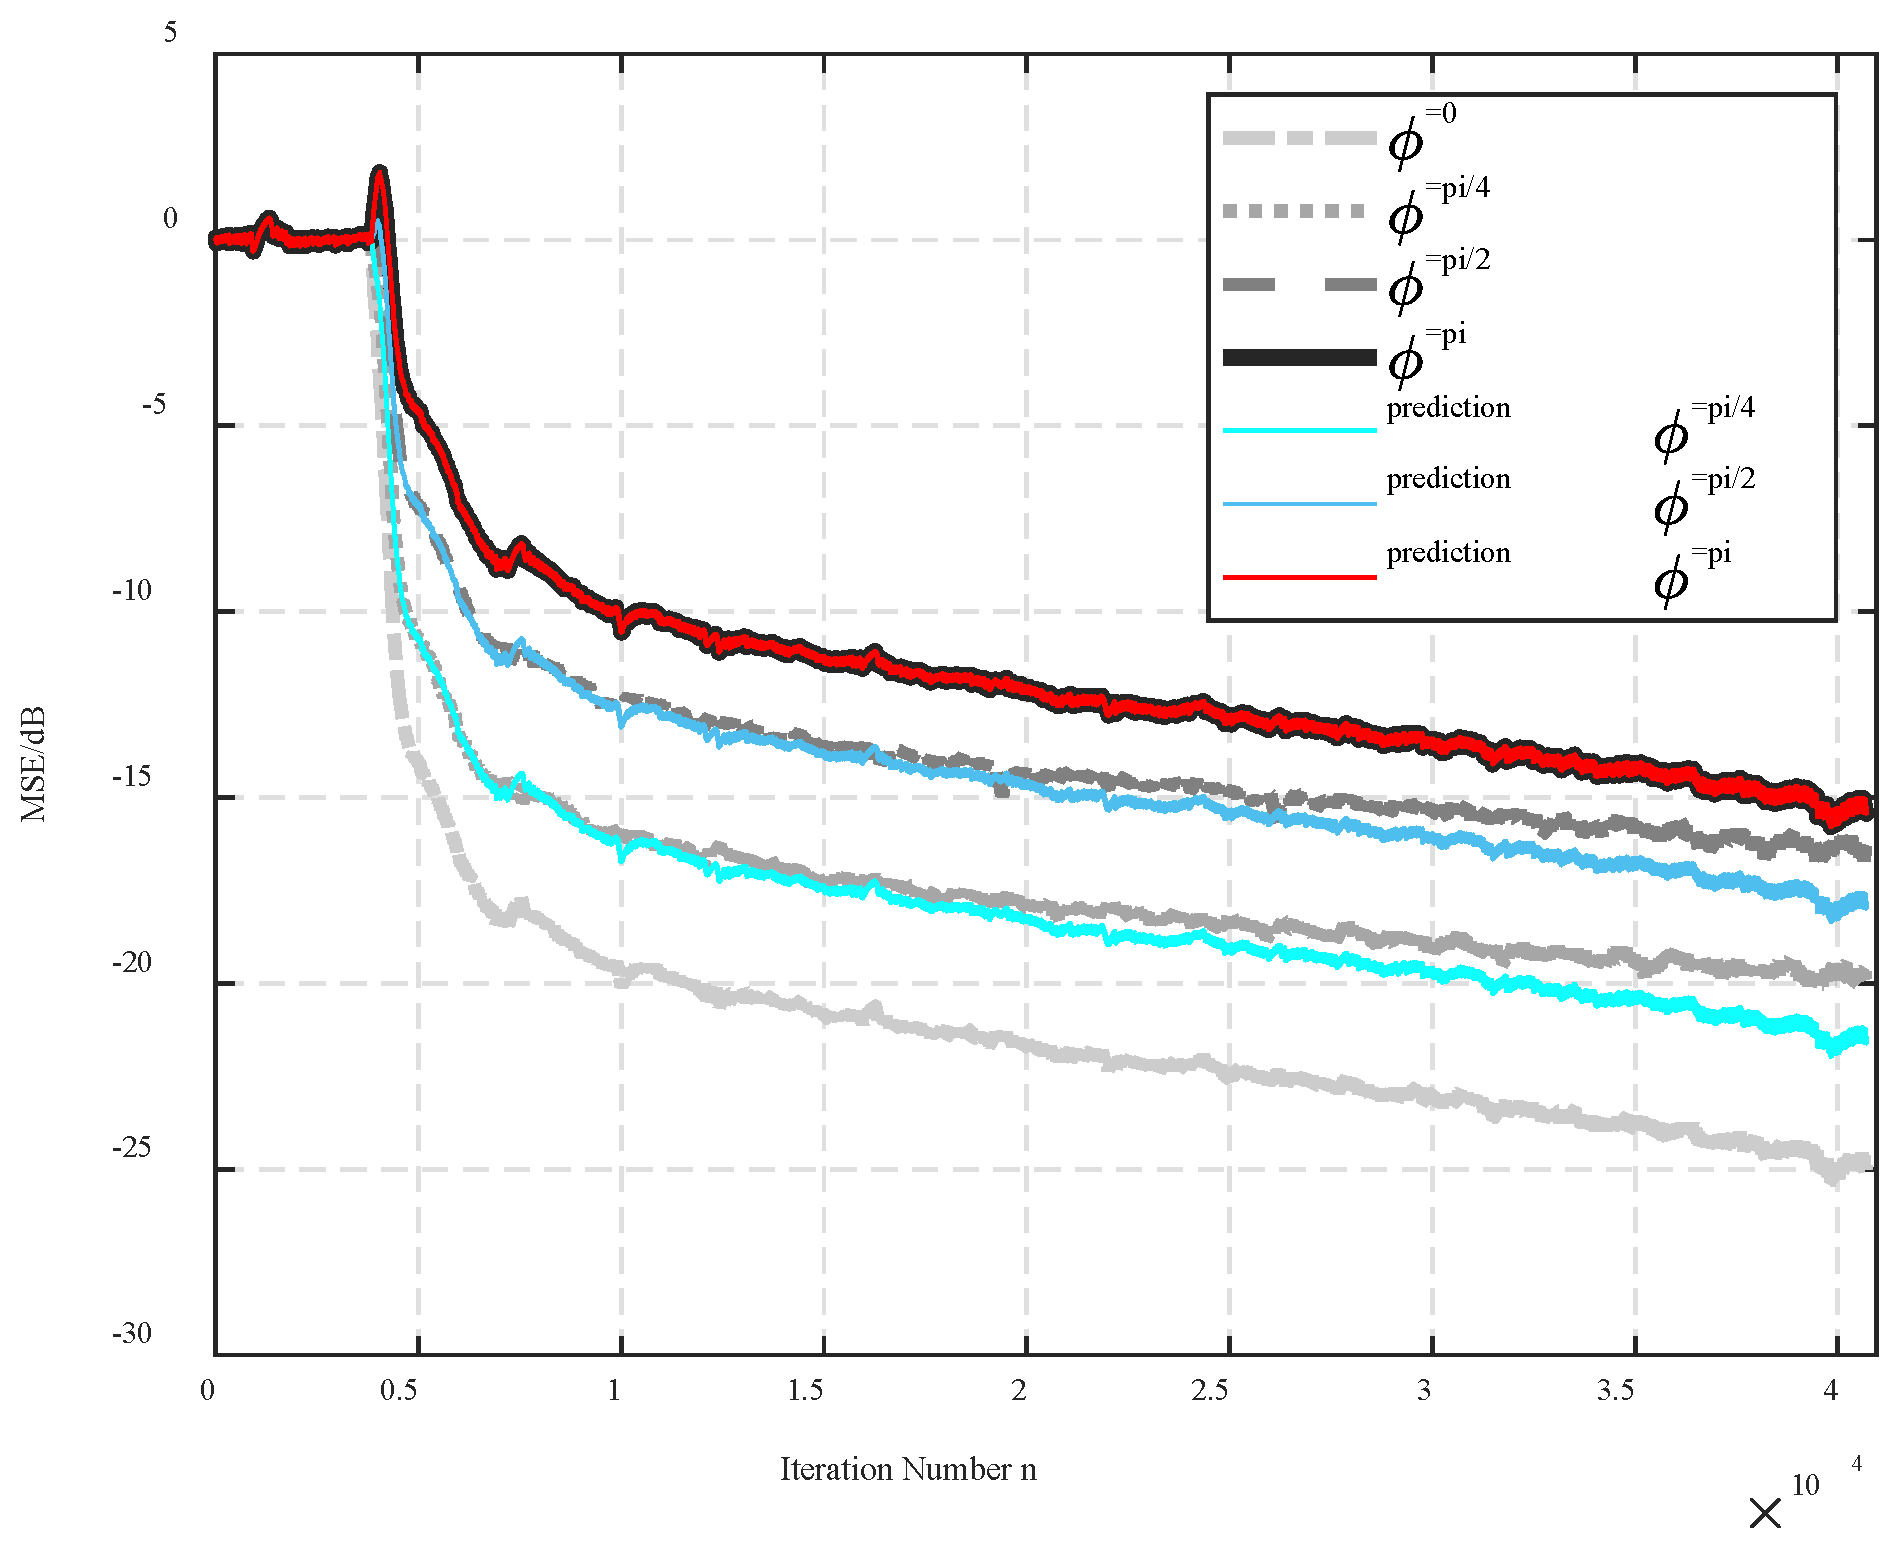
This case considered the nonstationary disturbance. The frequency of the disturbance signal changed linearly from 30 Hz to 150 Hz and from 150 to 30 Hz, and the phase error was in turn set to ϕ = 0 , π / 4 , π / 2 , π . The performances of the pseudo error MSE under different phase errors when the frequency of disturbance signal changed from 30 Hz to 150 Hz and from 150 Hz to 30 Hz are presented in Figure 6 and Figure 7, respectively. Where it can be seen that the phase error significantly decreased the performance of the adaptive system. At steady stage, the pseudo error MSE of ϕ = π was short of even 10dB than the pseudo error MSE of ϕ = 0 . The prediction results when the command and disturbance signals were out-of-phase are shown in Figure 6 and Figure 7, respectively. It can be seen that the ratio of Eq. (56) provided an excellent prediction of the performance when the command signal was out-of-phase with the disturbance signal, especially at the convergence stage. However, there was a certain discrepancy between the predicted and simulated performance in the steady state cause of the assumptions and the approximant.

4.3. Case 3

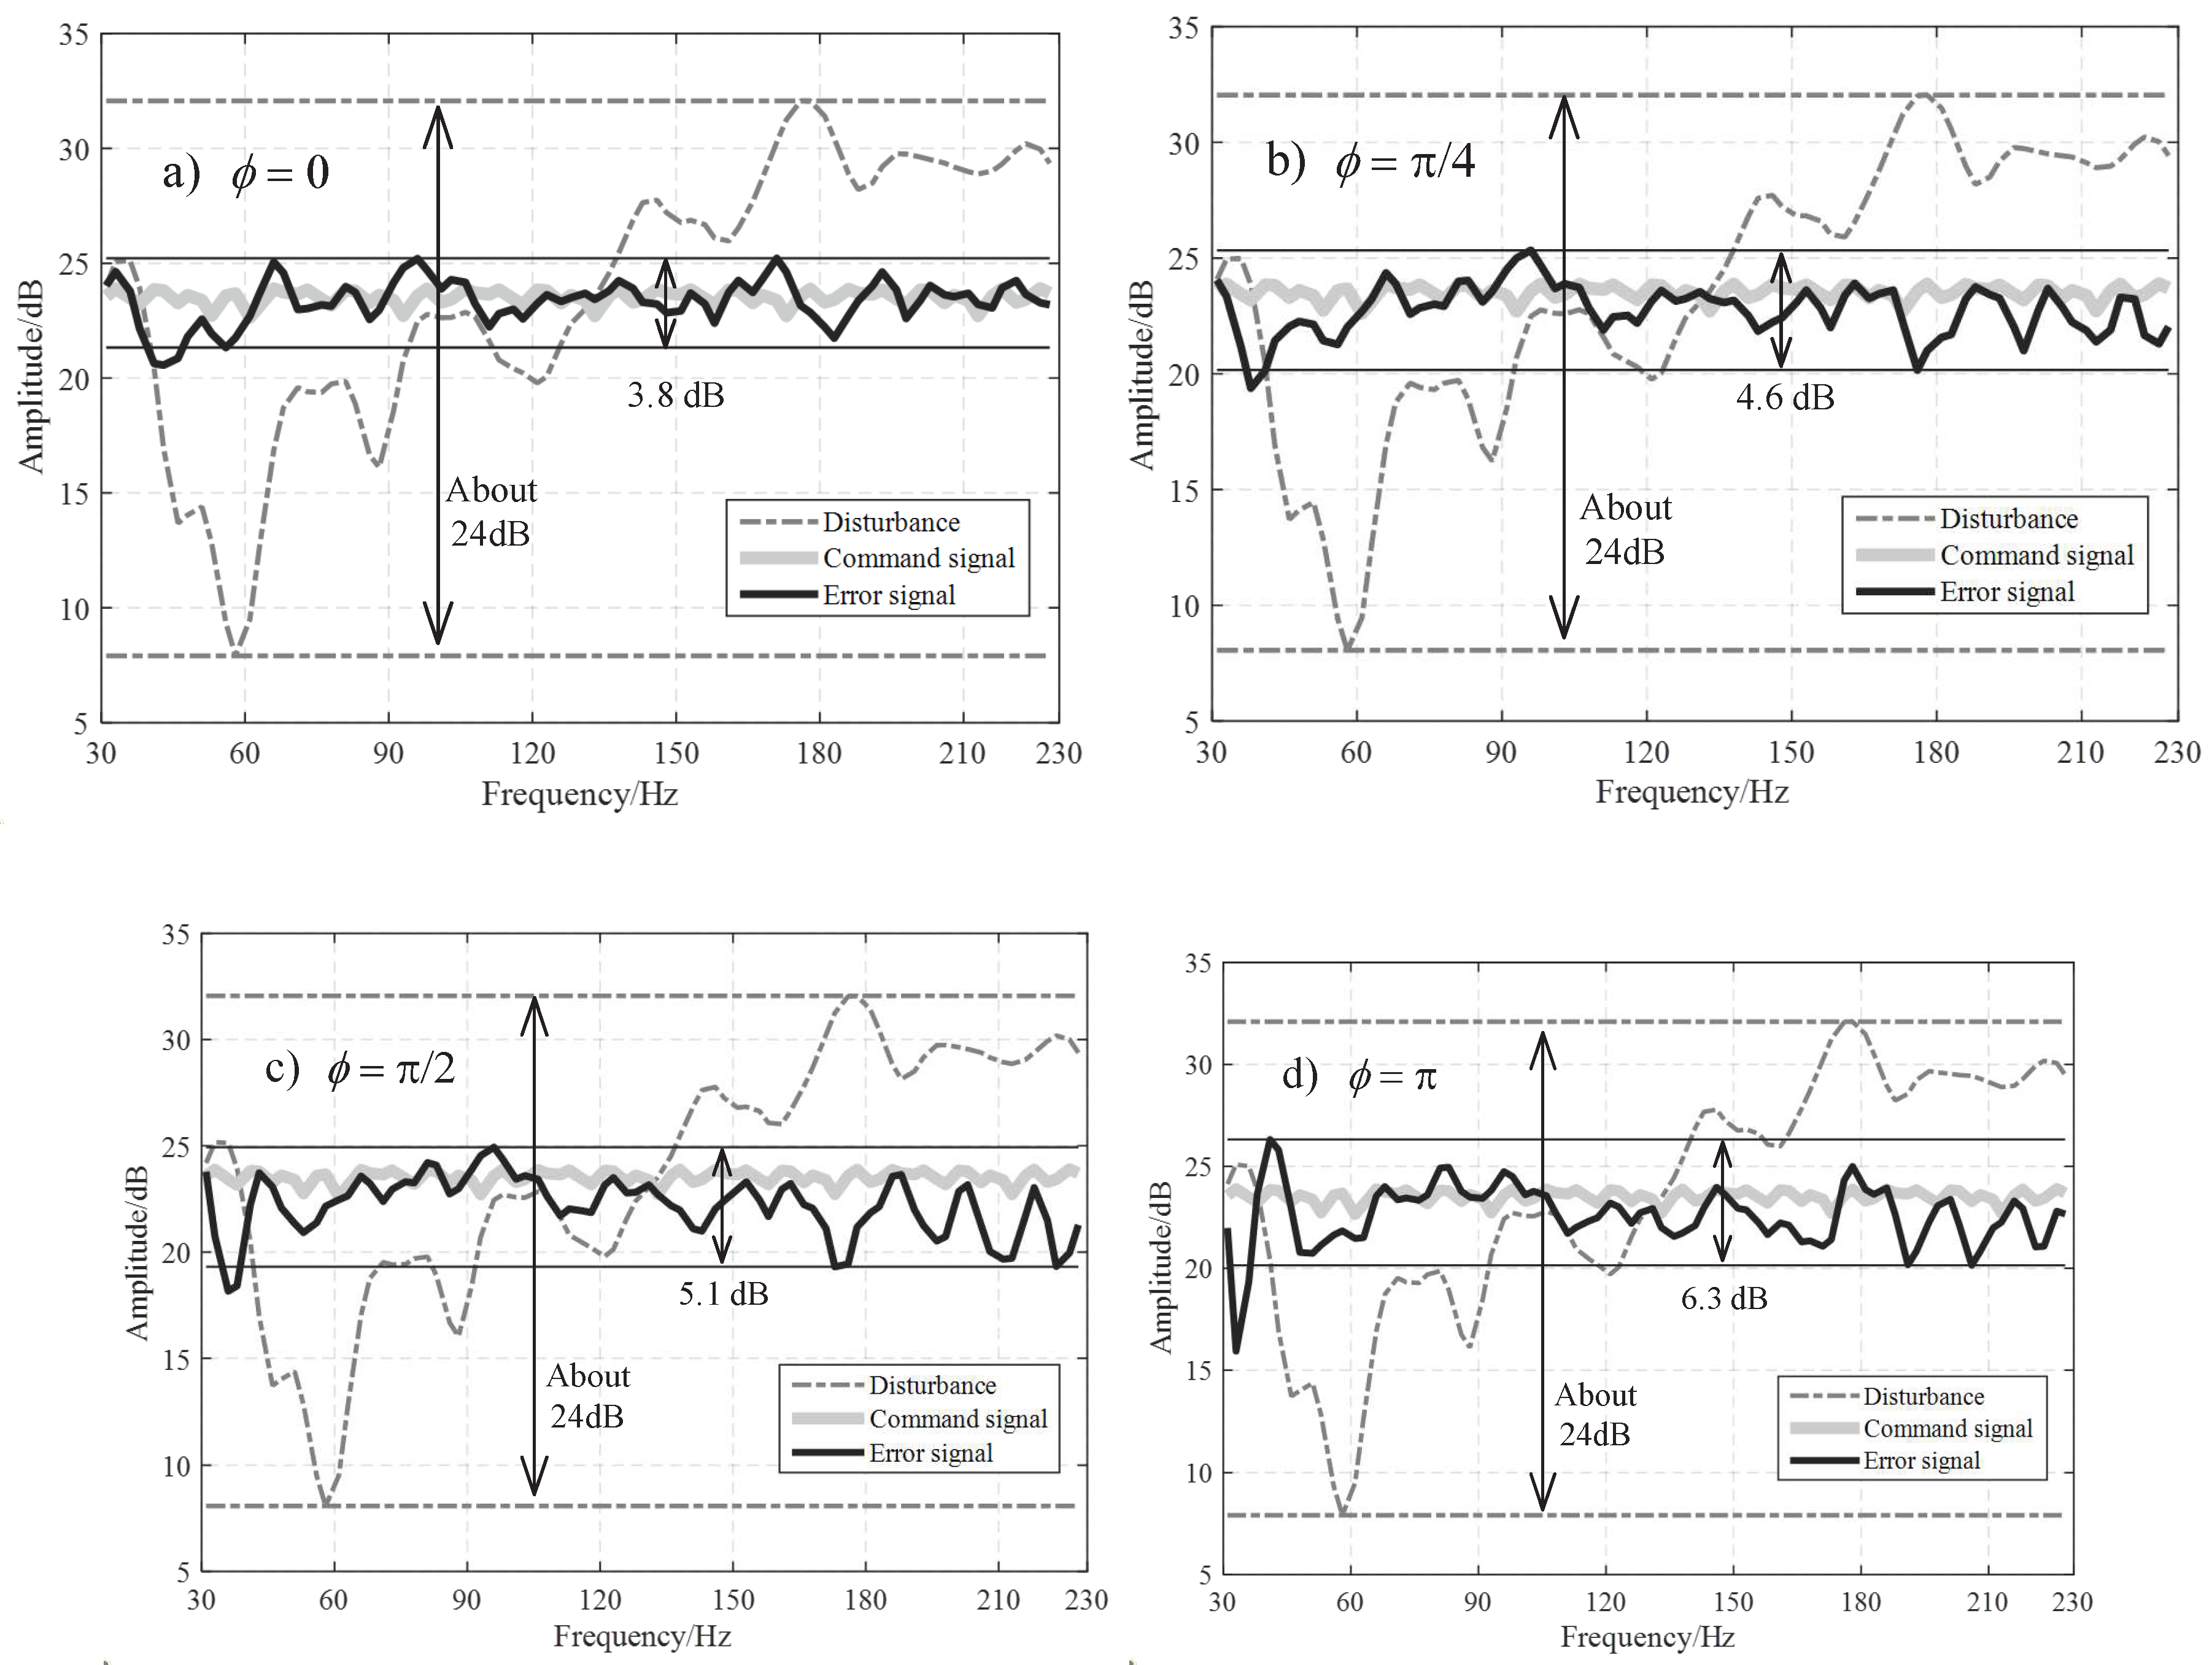
In this case, a real acoustic duct system was used, and the active sound profiling algorithm was employed to obtain the influence of the phase error, as mentioned above. The ASP performance under different phase errors in the steady-state was shown in Fig. 8. When the command signal was in phase with the disturbance signal (Figure 8 (a)), there was a superior control performance, reducing the disturbance amplitude range from approximately 24 dB to less than 4 dB. When the phase error increased (Figures 8(b)–8(d)), the profiled sound (error signal) limit had a significantly decrease in performance. The results indicated that the out-of-phase between command and disturbance signals could be adverse to the main objective of profiling the nonstationary noise.

5. Conclusions

In this paper, a detailed analysis of the PSC-FXLMS algorithm with the phase error between the disturbance and command signals is conducted. The convergence time constant and convergence rate performance changes with the phase error have been discussed in both stationary and nonstationary disturbance cases. Based on the analysis results, it can be concluded, for stationary disturbance, the phase error slightly increases the convergence rate but heavily increases the distance of the optimum vector from the initial value, leading to poor convergence time constant performance. A similar conclusion can also be drawn for nonstationary disturbance of every one-step update. The phase error leads to a large convergence time constant in every step, resulting in poor sound profiling performance.

Author Contributions

Conceptualization, Y.W. and F.L.; methodology, Y.W.; validation, F.L., Z.F. and L.Y.; formal analysis, L.Y.; investigation, Y.W.; resources, Y.W.; data curation, Y.W.; writing—original draft preparation, Y.W.; writing—review and editing, P.W.; visualization, Y.W.; supervision, Y.W.; project administration, Y.W.; funding acquisition, Y.W. All authors have read and agreed to the published version of the manuscript.

Funding

This research received no external funding.

Institutional Review Board Statement

Not applicable.

Informed Consent Statement

Not applicable.

Data Availability Statement

Some or all data, models, or codes generated or used during the study are proprietary or confidential in nature and may only be provided with restrictions.

Conflicts of Interest

The authors declare no conflict of interest.

References

  1. H. Sano, T. Inoue, A. Takahashi, K. Terai, Y. Nakamura, Active control system for low-frequency road noise combined with an audio system, IEEE Trans Speech Audio Process, 9 (7), (2001), 755-763. [CrossRef]
  2. J. Cheer, S.J. Elliott, Multichannel control systems for the attenuation of interior road noise in vehicles, Mech. Syst. Sig. Process., 60-61 (2015), 753-769. [CrossRef]
  3. G. Pinte, B. Stallaert, P. Sas, W. Desmet, J. Swevers, A novel design strategy for iterative learning and repetitive controllers of systems with a high modal density: Theoretical background, Mech. Syst. Sig. Process., 24 (2), (2010), 432-443. [CrossRef]
  4. B. Stallaert, G. Pinte, P. Sas, W. Desmet, J. Swevers, A novel design strategy for iterative learning and repetitive controllers of systems with a high modal density: Application to active noise control, Mech Syst Signal Proc, 24 (2), (2010), 444-454. [CrossRef]
  5. A. Gonzalez, M. Ferrer, M. de Diego, G. Pinero, J.J. Garcia-Bonito, Sound quality of low-frequency and car engine noises after active noise control, J. Sound Vib., 265 (3), (2003), 663-679. [CrossRef]
  6. I.T. Ardekani, W.H. Abdulla, Theoretical convergence analysis of FxLMS algorithm, Signal Process, 90 (12), (2010), 3046-3055. [CrossRef]
  7. Y. Ma, Y. Xiao, L. Ma, K. Khorasani, Statistical analysis of narrowband active noise control using a simplified variable step-size FXLMS algorithm, Signal Process, 183 (6), (2021), 108012. [CrossRef]
  8. M.J. Ji, S.M. Kuo, An active harmonic noise equalizer, in: Acoustics, Speech, and Signal Processing, 1993. ICASSP-93., 1993 IEEE International Conference on, 1993, pp. 189-192 vol.181.
  9. S.M. Kuo, M.J. Ji, Development and analysis of an adaptive noise equalizer, IEEE Trans Speech Audi Process, 3 (3), (1995), 217-222. [CrossRef]
  10. F. Liu, J.K. Mills, M.M. Dong, L. Gu, Active broadband sound quality control algorithm with accurate predefined sound pressure level, Appl Acoust, 119 (2017), 78-87. [CrossRef]
  11. J.W. Feng, W.S. Gan, Adaptive active noise equaliser, Electron Lett, 33 (18), (1997), 1518-1519. [CrossRef]
  12. J.W. Feng, W.S. Gan, A broadband self-tuning active noise equaliser, Signal Process, 62 (2), (1997), 251-256. [CrossRef]
  13. L.E. Rees, S.J. Elliott, Adaptive algorithms for active sound-profiling, IEEE Trans Audio Speech Lang Process 14 (2), (2006), 711-719. [CrossRef]
  14. V. Patel, J. Cheer, N.V. George, Modified phase-scheduled-command FxLMS algorithm for active sound profiling, IEEE-ACM Trans Audio Speech Lang Process, 25 (2017), 1495-1504. [CrossRef]
  15. Y. Wang, L. Gu, F. Liu, M. Dong, An adaptive algorithm for nonstationary active sound-profiling, Appl Acoust, 137 (2018), 51-61. [CrossRef]
  16. Y. Wang, L. Gu, F. Liu, M. Dong, Online secondary path modeling for active sound quality control systems, Appl. Acoust., 155 (2019), 44-52. [CrossRef]
  17. S.M. Kuo, S. Mallu, Adaptive active sound quality control algorithm, in: Ispacs 2005: Proceedings of the 2005 International Symposium on Intelligent Signal Processing and Communication Systems, 2005, pp. 737-740.
  18. S.M. Kuo, A. Gupta, S. Mallu, Development of adaptive algorithm for active sound quality control, J Sound Vib, 299 (1-2), (2007), 12-21. [CrossRef]
  19. S.M. Kuo, R.K. Yenduri, A. Gupta, Frequency-domain delayless active sound quality control algorithm, J Sound Vib, 318 (4-5), (2008), 715-724. [CrossRef]
  20. L.P.R. De Oliveira, B. Stallaert, K. Janssens, H. Van der Auweraer, P. Sas, W. Desmet, NEX-LMS: A novel adaptive control scheme for harmonic sound quality control, Mech. Syst. Sig. Process., 24 (6), (2010), 1727-1738. [CrossRef]
  21. J.A. Mosquera-Sanchez, W. Desmet, L.P.R. De Oliveira, Multichannel feedforward control schemes with coupling compensation for active sound profiling, J Sound Vib, 396 (2017), 1-29. [CrossRef]
  22. J.A. Mosquera-Sanchez, M. Sarrazin, K. Janssens, L.P.R. de Oliveira, W. Desmet, Multiple target sound quality balance for hybrid electric powertrain noise, Mech. Syst. Sig. Process., 99 (2018), 478-503. [CrossRef]
  23. J.A. Mosquera-Sanchez, W. Desmet, L.P.R. De Oliveira, A multichannel amplitude and relative-phase controller for active sound quality control, Mech. Syst. Sig. Process., 88 (2017), 145-165. [CrossRef]
  24. J.X. Liu, X.F. Chen, Adaptive Compensation of Misequalization in Narrowband Active Noise Equalizer Systems, Ieee-Acm T Audio Spe, 24 (12), (2016), 2390-2399. [CrossRef]
  25. L. Wang, W.S. Gan, Analysis of misequalization in a narrowband active noise equalizer system, J Sound Vib, 311 (3-5), (2008), 1438-1446. [CrossRef]
  26. S.J. Elliott, I.M. Stothers, P.A. Nelson, A Multiple Error Lms Algorithm and Its Application to the Active Control of Sound and Vibration, Ieee T Acoust Speech, 35 (10), (1987), 1423-1434. [CrossRef]
Figure 1. Block diagram of the command-FXLMS algorithm.
Preprints 75924 g001
Figure 2. Block diagram of the PSC-FXLMS algorithm.
Preprints 75924 g002
Figure 6. The MSE of the pseudo error under different phase errors when f changes from 30 Hz to 150 Hz.
Preprints 75924 g006
Figure 7. The MSE of the pseudo error under different phase errors when f changes from 150 Hz to 30 Hz.
Preprints 75924 g007
Figure 8. The ASP performance under different phase errors.
Preprints 75924 g008
Disclaimer/Publisher’s Note: The statements, opinions and data contained in all publications are solely those of the individual author(s) and contributor(s) and not of MDPI and/or the editor(s). MDPI and/or the editor(s) disclaim responsibility for any injury to people or property resulting from any ideas, methods, instructions or products referred to in the content.
Copyright: This open access article is published under a Creative Commons CC BY 4.0 license, which permit the free download, distribution, and reuse, provided that the author and preprint are cited in any reuse.
Prerpints.org logo

Preprints.org is a free preprint server supported by MDPI in Basel, Switzerland.

Subscribe

© 2024 MDPI (Basel, Switzerland) unless otherwise stated