1. Introduction
Propolis is a natural resin material commonly used as a glue or adhesive for beehives and is collected from various parts of plants from sprouts to buds [
1]. Propolis is known to have many benefits, especially in the health sector such as preventing and treating flu, scars, diabetes, dental caries, and others. This is motivated by propolis’s content, which have more than 300 bioactive compounds, including flavonoids, terpenoids, phenolics, hydrocarbons, minerals, coumarins, and other compounds [
2].
The application of propolis in the food industry has disadvantages, such as sharp aroma and taste, and propolis extraction can only be soluble in alcohol solvents [
3]. In addition, propolis's phenolic compounds are highly sensitive, such as easily oxidized and easily hydrolyzed at high temperatures [
4], and have low physicochemical stability and are limited in bioaccessibility and bioavailability [
5]. herefore, further processing is needed to maintain propolis's phenolic content and expand propolis products' application in the food industry.
Propolis extract can be encapsulated by complex coacervation methods and spray drying techniques; it can be an alternative to reduce some of the shortcomings mentioned. Microencapsulation of propolis with the spray drying technique can reduce unwanted taste and aroma and protect the bioactive compounds contained in propolis [
1]. The complex coacervation method produces microcapsules with high encapsulation efficiency values [
6]. Coating materials commonly used in encapsulation methods come from polymers of carbohydrates, proteins, lipids, gums, or others. The coating materials used are whey protein isolate (WPI) and high methoxyl pectin (HMP). The use of ingredients of protein and polysaccharides to complement each other as coating materials, where polysaccharides have low emulsifying properties while proteins have good emulsion stability [
7]. The proper mixing ratio and the total concentration of biopolymers resulted in a stable charge in the solution so that the encapsulation results were maximized and had a good encapsulation efficiency value [
8].
The study was conducted regarding the effect of the ratio of whey protein isolate (WPI) - pectin on the total phenolic stability of propolis microcapsules to determine the best ratio in optimizing the use of heating and storage temperatures to maintain the quality of phenolic in propolis microcapsules.
2. Materials and Methods
2.1. Materials
Propolis microcapsules were made using propolis extract (12.5% wb water content), commercial high methoxyl pectin, commercial whey protein isolate, maltodextrin DE 18, 1M HCL 37%, 0.1M NaOH, and distilled water. The propolis used comes from bees (Trigona sp.) South Sulawesi. Sodium Chloride (NaCl) for testing water activity. Glacial acetic acid, gallic acid, ethanol 96%, methanol, Na2CO3 7.5%, and Folin-Ciocalteau reagent for the encapsulation efficiency.
2.2. Preparation of Propolis Extracts
The propolis extraction process is prepared by following the modification method [
1]. 168 grams of crude propolis was added with 1200 mL of 70% ethanol solution and macerated for 48 hours. The solutions were filtered and stored in the freezer at -20 C for 10 hours. After that, centrifugation (Hermle Z306) was carried out for 2 x 10 minutes at a temperature of 10˚C at a speed of 4500 rpm. The centrifuged supernatant was then evaporated using a rotary vacuum evaporator (IKA RV 10) at a temperature of 60˚C.
2.3. Microencapsulation Process
2.3.1. Carrier Preparation
Carrier preparation is prepared by following the modification method [
3], the solution of whey protein isolate (0.025 - 0.05%), high methoxyl pectin (0.025 - 0.05%), and maltodextrin (75%) were done by dissolving several concentrations of the material with distilled water and adjusting to the treatment of a predetermined coating ratio. The whey protein isolate (WPI) solution was adjusted to a final pH of 7.8.
2.3.2. Microencapsulation
Propolis microcapsules are prepared by following the modification method [
9]. Propolis extract was added to whey protein isolate and then homogenized using a homogenizer (D-Lab 100), then a high methoxyl pectin solution was added. The homogeneous solution was adjusted to the final pH of 3.75, and the maltodextrin solution was added. The final solution was stored at 4⁰C for 24 hours.
The powder formulation was carried out using a spray dryer (Buchi Mini Spray Dryer B-290) and set at 150⁰C for inlet temperature, and the outlet temperature was monitored at 70-80 ˚C, aspiration at 90%, and pump rate at 25%.
2.4. Microcapsules Characterization
2.4.1. Encapsulation Yield
Testing the yield of propolis microcapsules prepared by the following method [
10]. The propolis extract, the coating material used, and the final product of the propolis microcapsules were weighed, then the yield was calculated using the formula:
2.4.2. Water Activity (aw)
The aw value is determined by the following method [
1], using the a
w meter (Aqualab LITE). Before use, the instrument was calibrated using a salt solution of NaCl. The sample was tested at room temperature.
2.4.3. Color Properties
Color properties on propolis microcapsules were prepared by the following method [
11], using a colorimeter (Spectrophotometer CM-5). The samples were put into a glass cup, and then the samples were tested. The data results show the values of L* (transparency), a* (redness), and b* (yellowness).
2.4.4. Encapsulation Efficiency
Encapsulation efficiency prepared by the following modification method was carried out by calculating the total phenolic in microcapsules (TPC) and surface phenolic microcapsules (SPC) [
12]. The total phenolic test in microcapsules (TPC) was done by dissolving propolis microcapsules with ethanol/acetic acid/aquadest (50:8:42) mixed reagent in the same ratio (1:1). Microcapsule phenolic surface (SPC) testing was carried out in the same way with different solvents, namely ethanol/methanol mix reagent (50:50).
Samples of propolis microcapsules (600 mg) were dissolved with a reagent mix. An aliquot of 0.5 mL sample was mixed with 0.5 mL of Folin-Ciocalteau reagent and 4 mL of 7.5% Na2CO3. After 30 minutes of incubation, the absorbances were measured at 760 nm using a UV spectrophotometer (UV-9200). Gallic acid was used as the standard.
The yield encapsulation efficiency is calculated using the formula:
2.4.5. Scanning Electron Microscopy (SEM)
The morphology of microcapsules was evaluated by scanning electronic microscopy or SEM (Hitachi TM 3000) to identify the surface morphology of the dry solid microcapsules [
10]. Microcapsule powder is spread as thin as possible, the sample is put into the chamber, and an image is taken at a particular magnification.
2.5. Stability of Microcapsules
2.5.1. Storage Stability
The storage stability test was prepared by the following modification method [
13]. Propolis microcapsules were stored in glass vials at room temperature (± 25°C) for 28 days and tested every 7 days (0, 7, 14, 21, 28).
2.5.2. Heating Stability
The heating stability test was prepared by the following modification method [
14]. Propolis microcapsules were stored in test tubes and heated in a water bath at 80˚C for 3 hours. Tests were carried out at every 1-hour range (0, 1, 2, 3).
2.6. Statistical Analysis
The results of the data were analyzed using SPSS 24 software. The data displayed ± standard deviation. The hypothesis analysis test used one-way ANOVA (Analysis of Variance) to determine significant differences between treatments with a 95% confidence level (α = 0.05). The follow-up test used to see the difference between treatments was carried out by the Tukey test.
3. Results
3.1. Microencapsulation Characterization
3.1.1. Encapsulation Yield
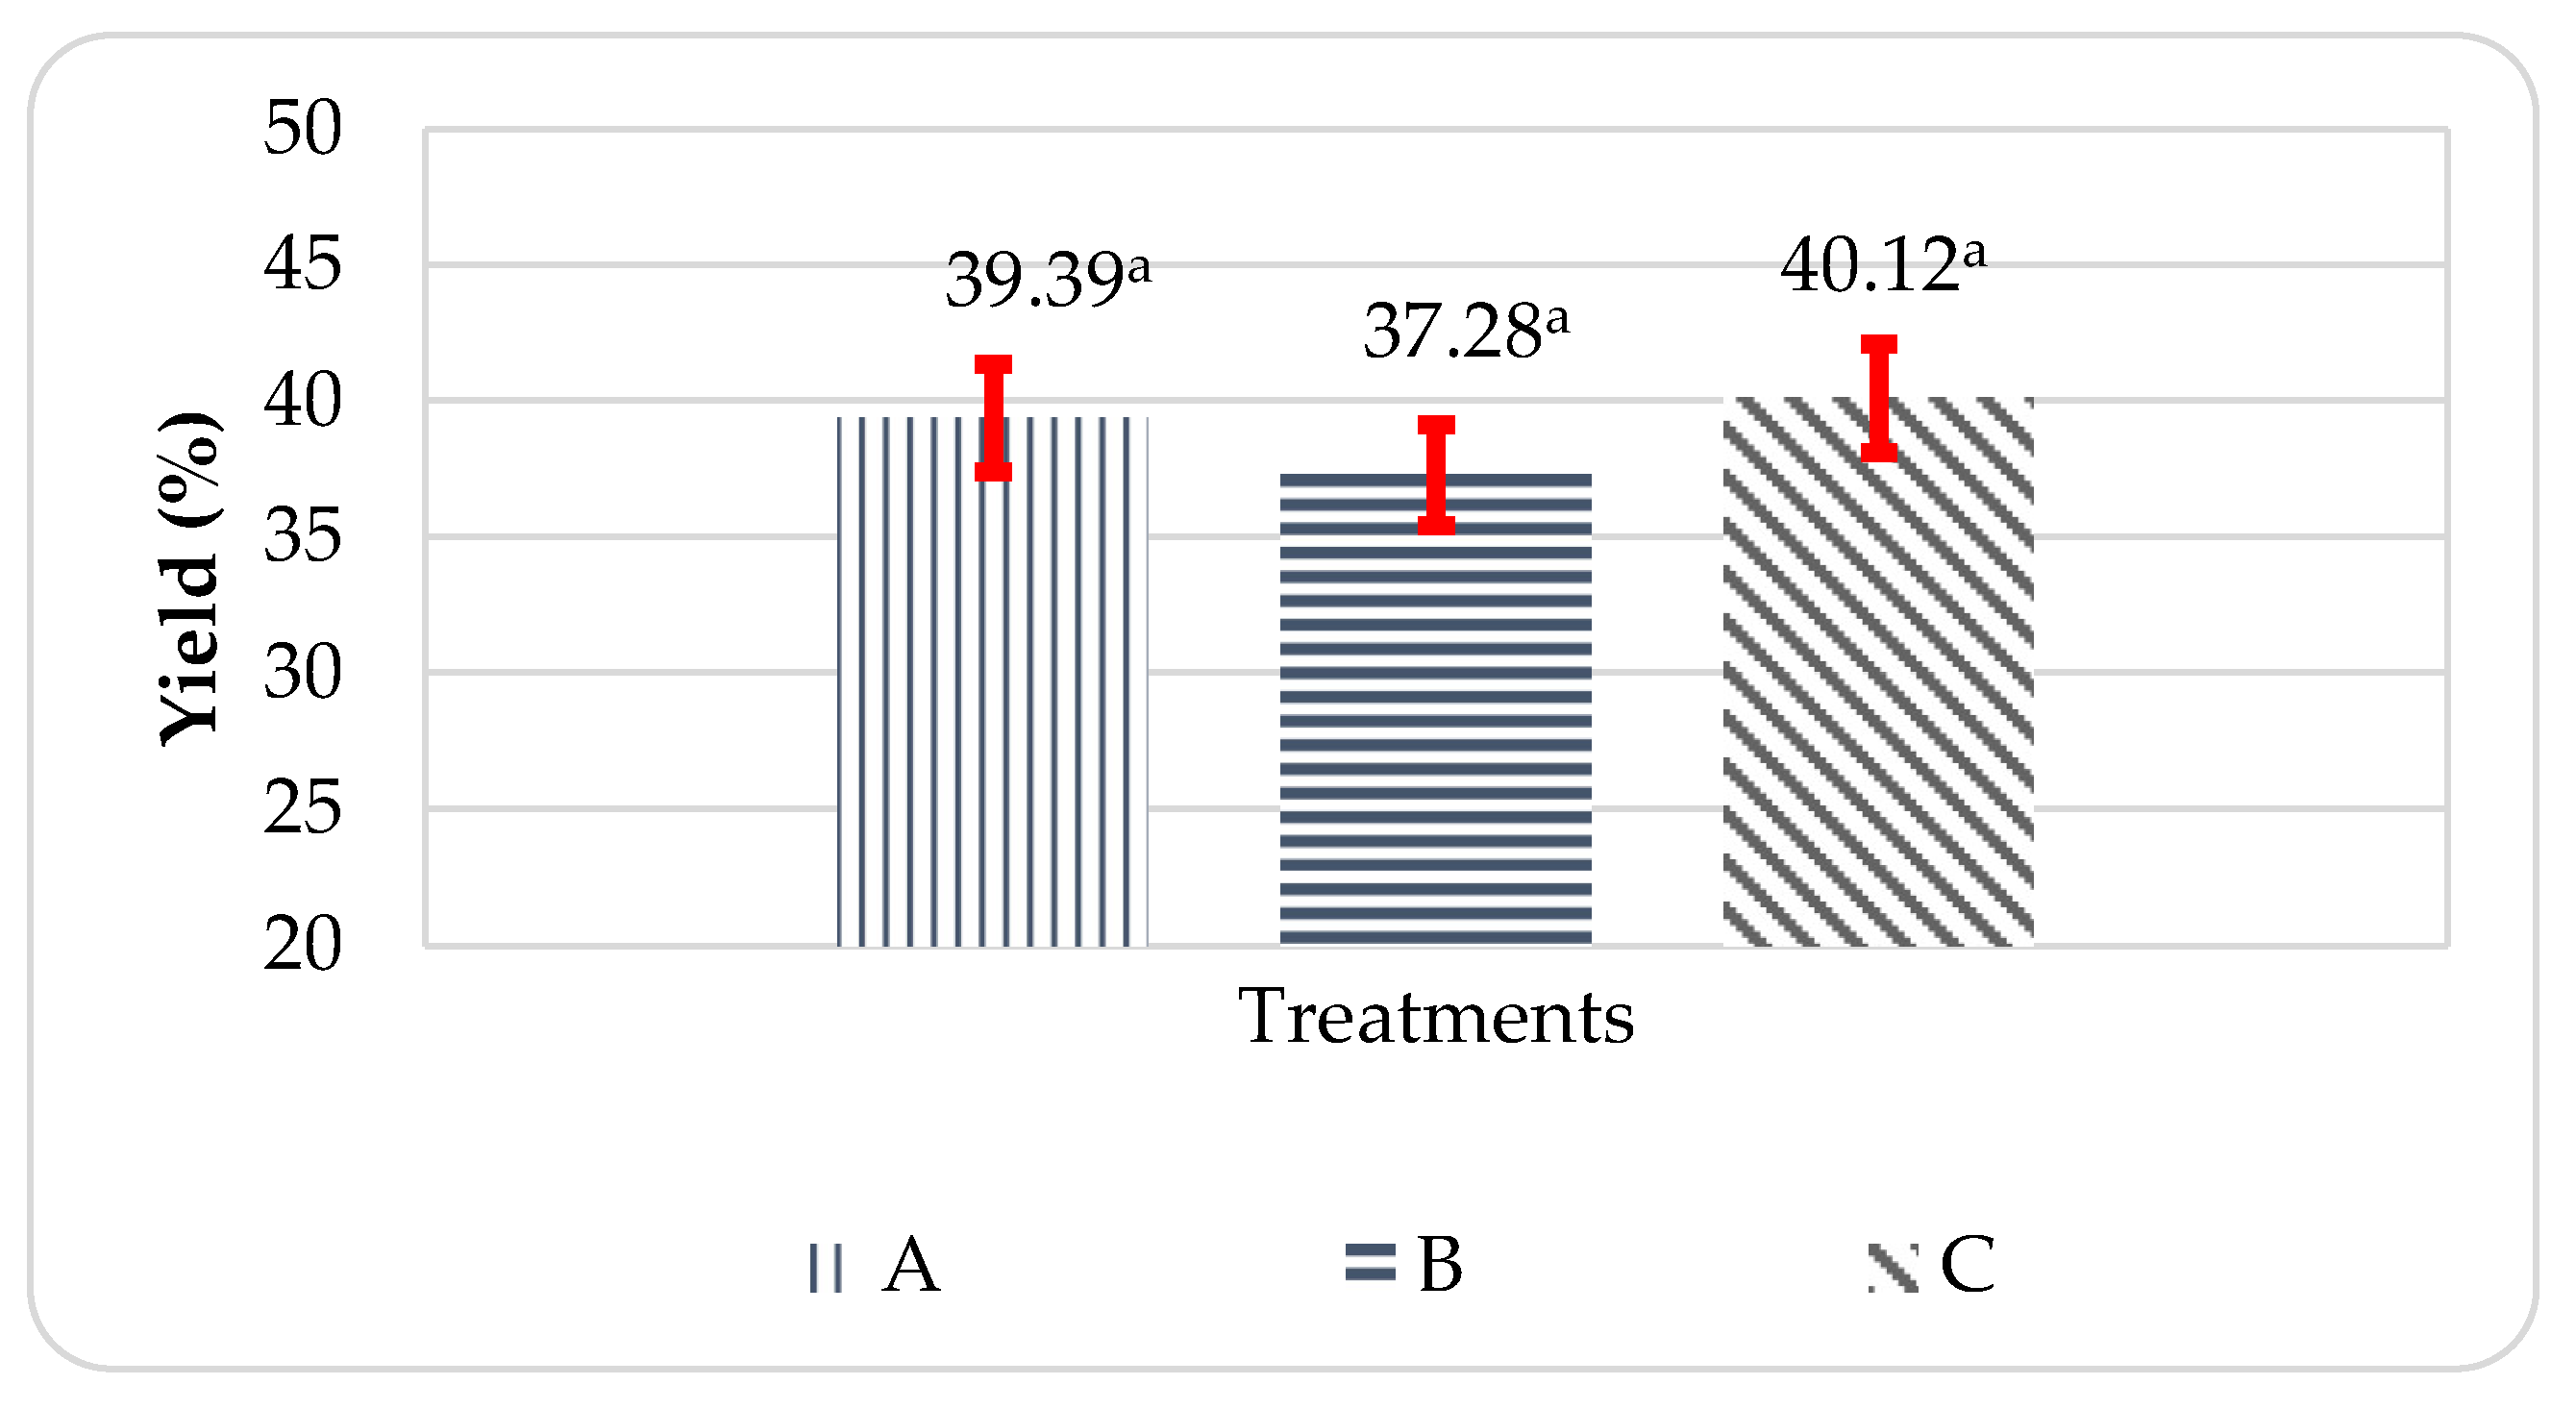
Based on the results in
Figure 1, the average yield of propolis microcapsules ranged from 37.279-40.116%. The yield amount of microcapsule above 50% is considered good [
15,
16]. Treatment C, or at a higher WPI ratio than pectin, was the best treatment to produce the highest yield value, while treatment B was the lowest treatment to produce yield compared to other treatments. The resulting study is in line where the optimum ratio of WPI and pectin complex formation is at 2:1, along with a decrease in pH from 3 to 4 [
17]. The lower the concentration of polysaccharides and proteins used, the lower the yield of coacervate produced [
18].
The results of the statistical analysis of variance (ANOVA) showed that the yield of propolis microcapsules had a Pvalue > 0.05, which means that there is no significant difference between the ratio to the yield value of the propolis microcapsules produced.
3.1.2. Water Activity (aw)
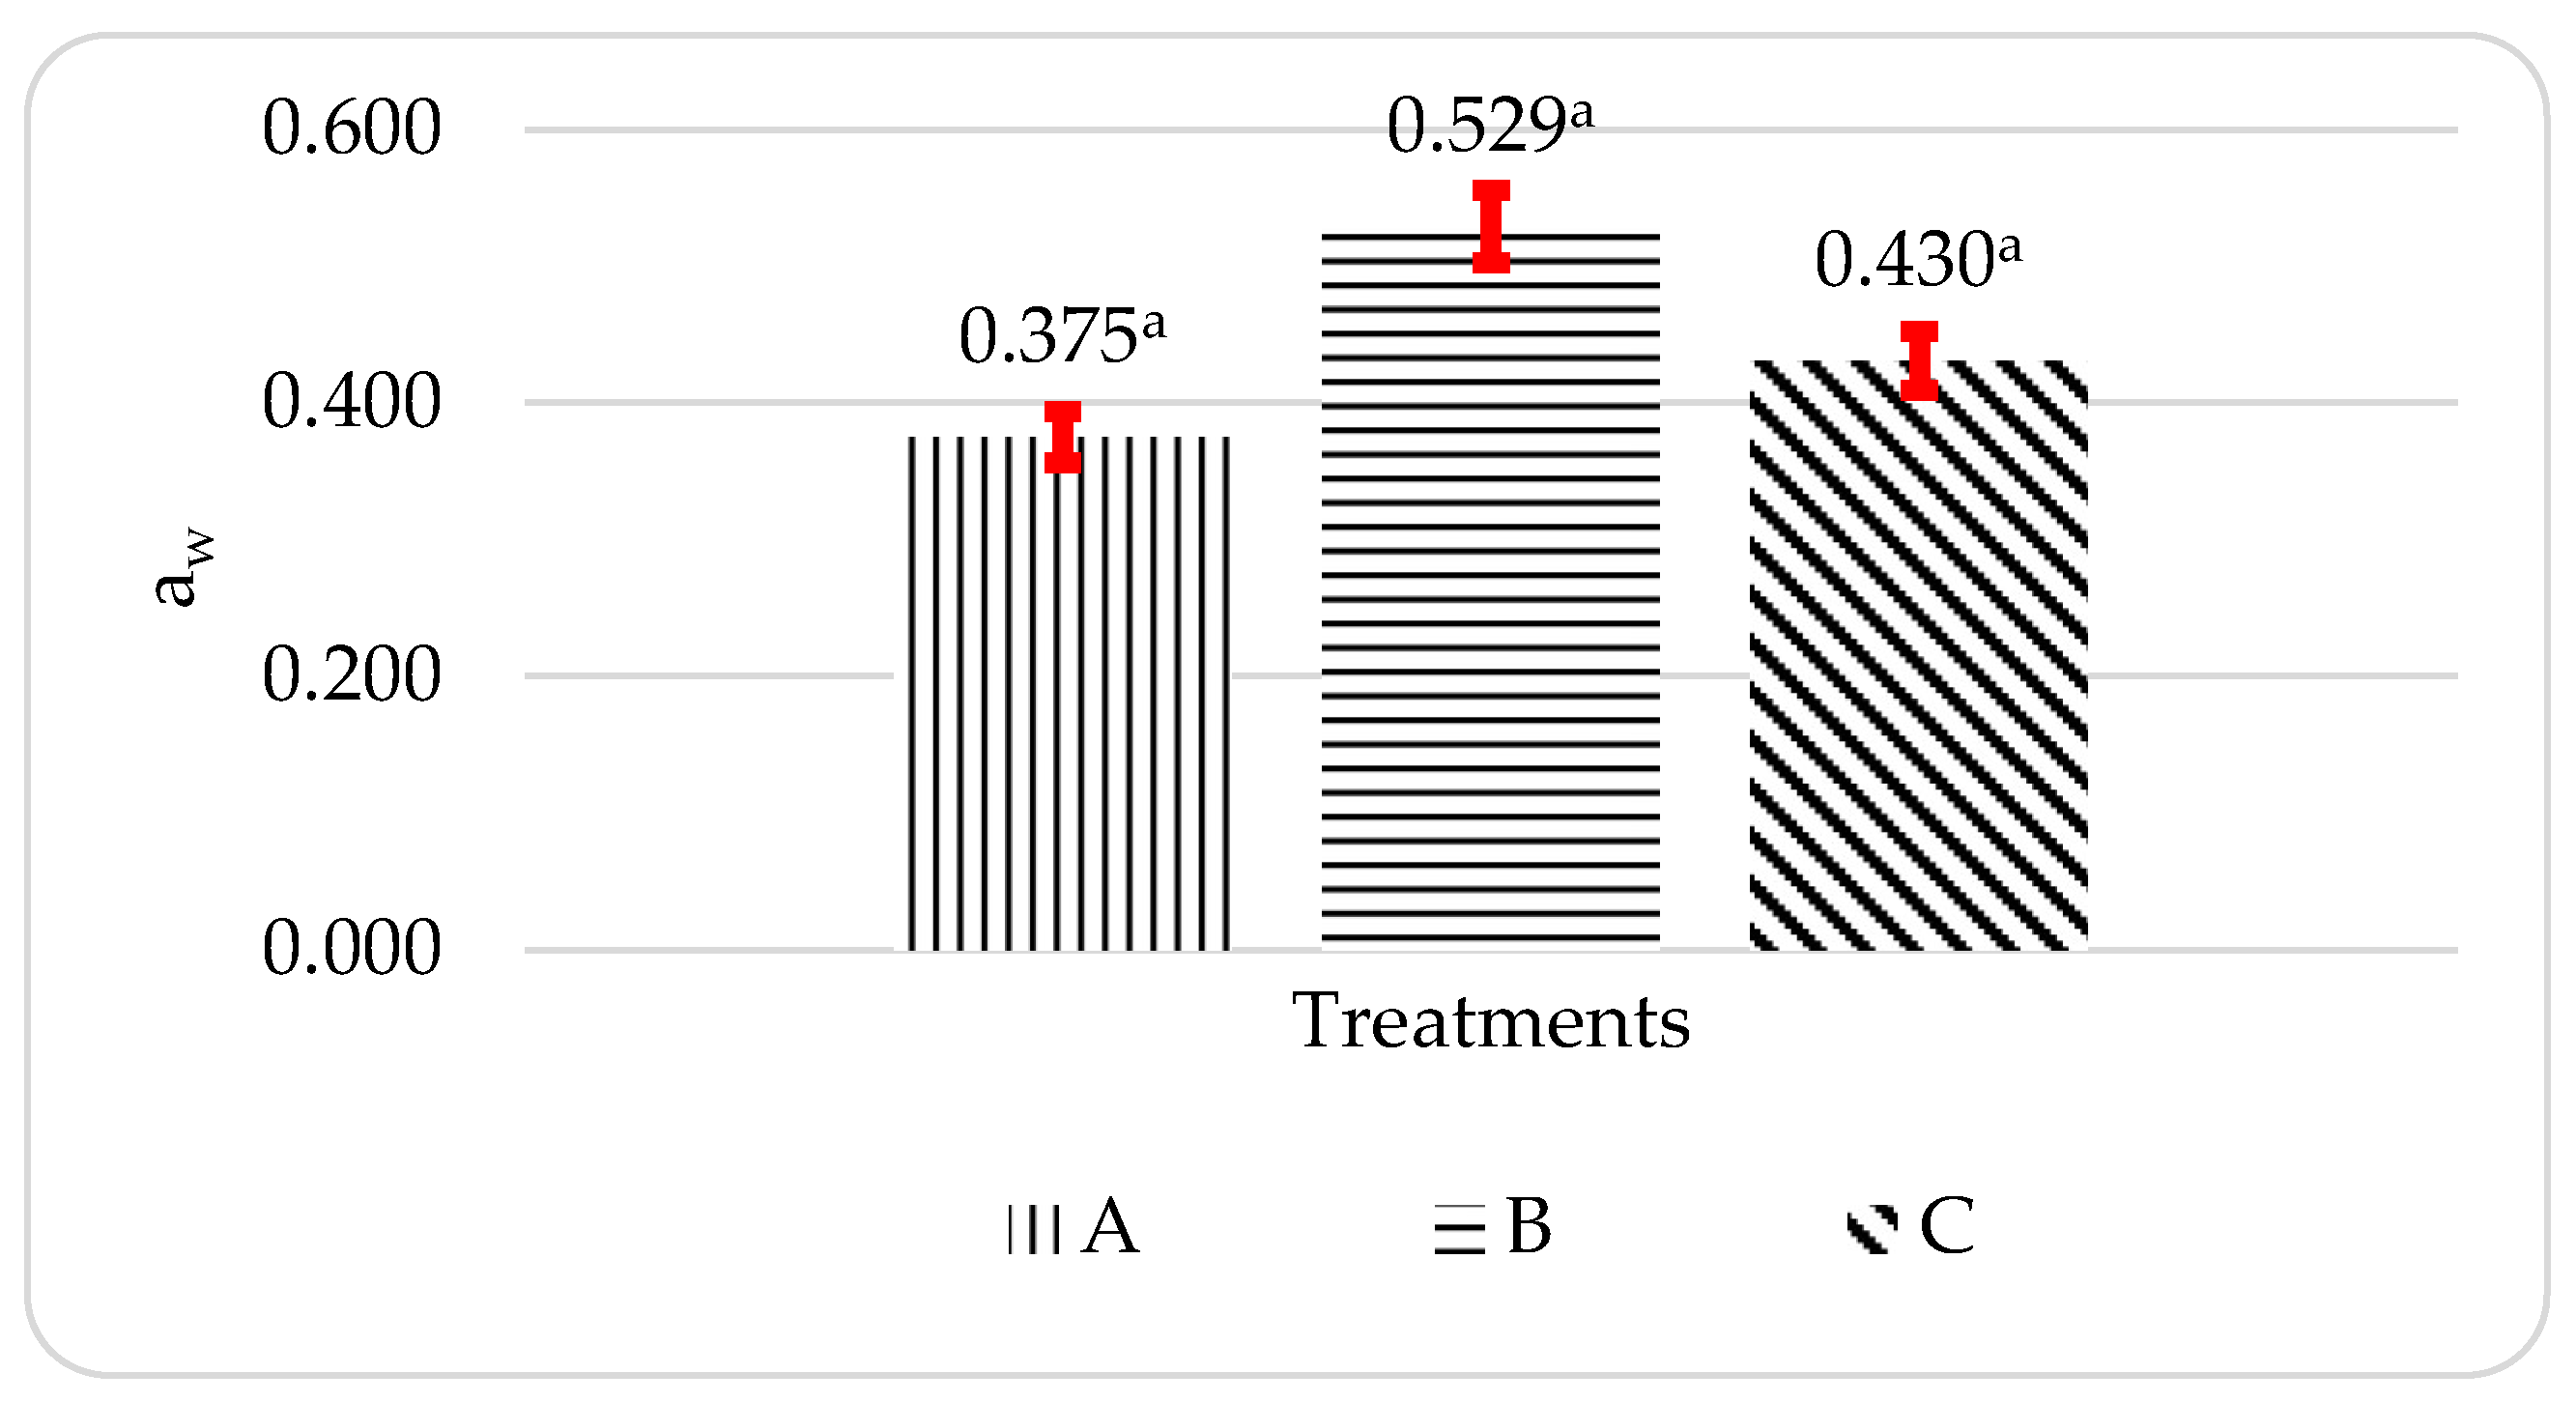
Figure 2 displays the a
w value of propolis microcapsules can be seen in
Figure 2, where the average a
w of propolis microcapsules is in the range of 0.375-0.529. The overall a
w value produced by propolis microcapsules can be good because foods with an a
w value < 0.60 have stable microbiological activity [
19]. The aw value of the propolis microcapsules tends to be low due to the presence of hydrocolloid materials such as pectin as a coating material. Gel formation in pectin is caused by hydrogen bonds between free carboxyl groups and between hydroxyl groups with water [
20]. It causes a decrease in food in free water, inhibiting microbial growth. The decrease in the aw value was accompanied by an increase in the concentration of the hydrocolloid used [
21]
The results of the statistical analysis of variance (ANOVA) showed that the aw of propolis microcapsules had a Pvalue > 0.05, which means that there is no significant difference between the ratio to the aw value of the propolis microcapsules produced.
3.1.3. Color Properties
Table 1 describes the color properties of propolis microcapsules. All propolis microcapsules had a high brightness level, as shown by the L* value ranging from 94.28-95.36. The formation of insoluble complexes can cause a high L* value during the coacervation of the solution. The insoluble complex shows the solution's charge balance at the coacervation time [
22]. The L* value decreased as the pectin ratio increased, pectin solution causes reduced the L* value [
23]. Propolis microcapsules also tend to be reddish and yellowish, as indicated by the positive a* and b* values. The color can be caused by the content of propolis extract in the microcapsules. The positive values of a* and b* can also be caused by the high outlet temperature during drying. An increase in outlet temperature can cause an increase in reddish and yellowish color [
24].
3.1.4. Encapsulation Efficiency
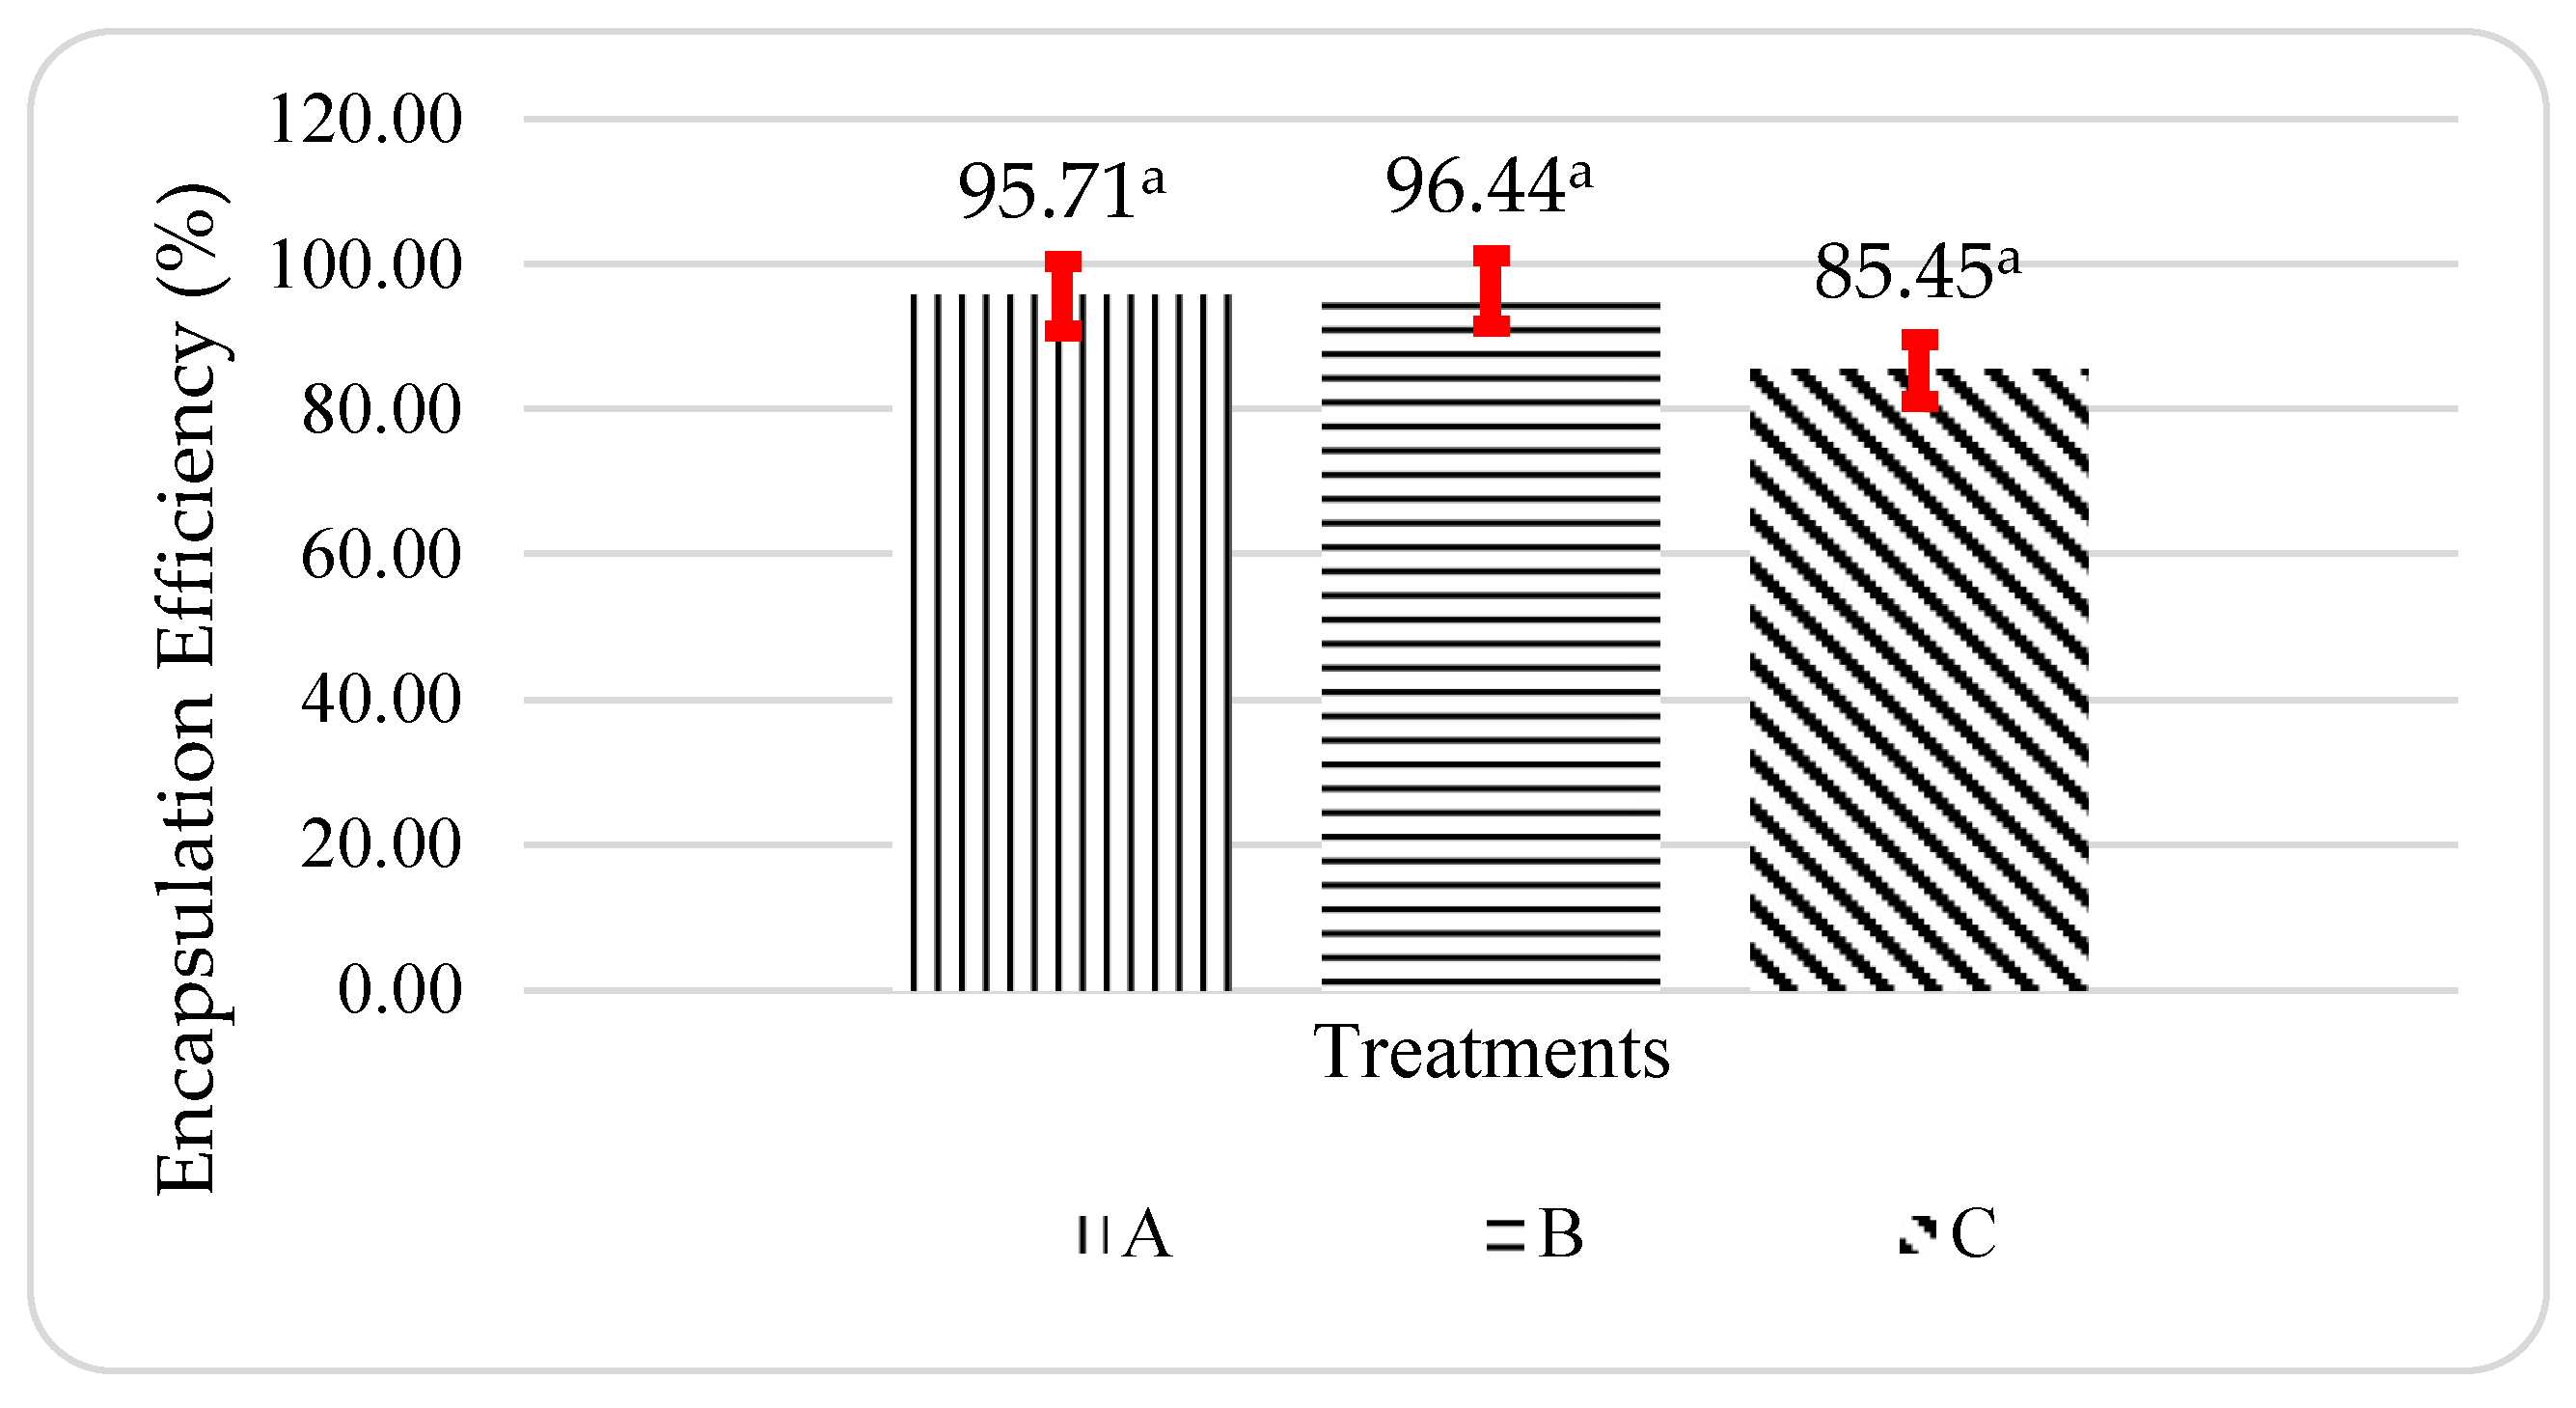
The average encapsulation efficiency of propolis microcapsules ranged from 85.45-96.44%, as shown in
Figure 3. Treatment B, or the ratio of WPI and pectin 1:1 was the best treatment for the value of encapsulation efficiency compared to other treatments. Decreasing the whey protein ratio in some carbohydrate coatings could increase the value of microencapsulated encapsulation efficiency [
25]. The high encapsulation efficiency value of the propolis microcapsules was due to the polysaccharide-protein interaction between WPI and pectin. The addition of pectin to form the polysaccharide-protein complexes can increase protection and protect proteins that can be denatured during spray drying [
26,
27].
The results of the statistical analysis of variance (ANOVA) showed that the encapsulation efficiency of propolis microcapsules had a Pvalue > 0.05, which means that there is no significant difference between the ratio to the encapsulation efficiency value of the propolis microcapsules produced.
3.1.5. Scanning Electron Microscope (SEM)
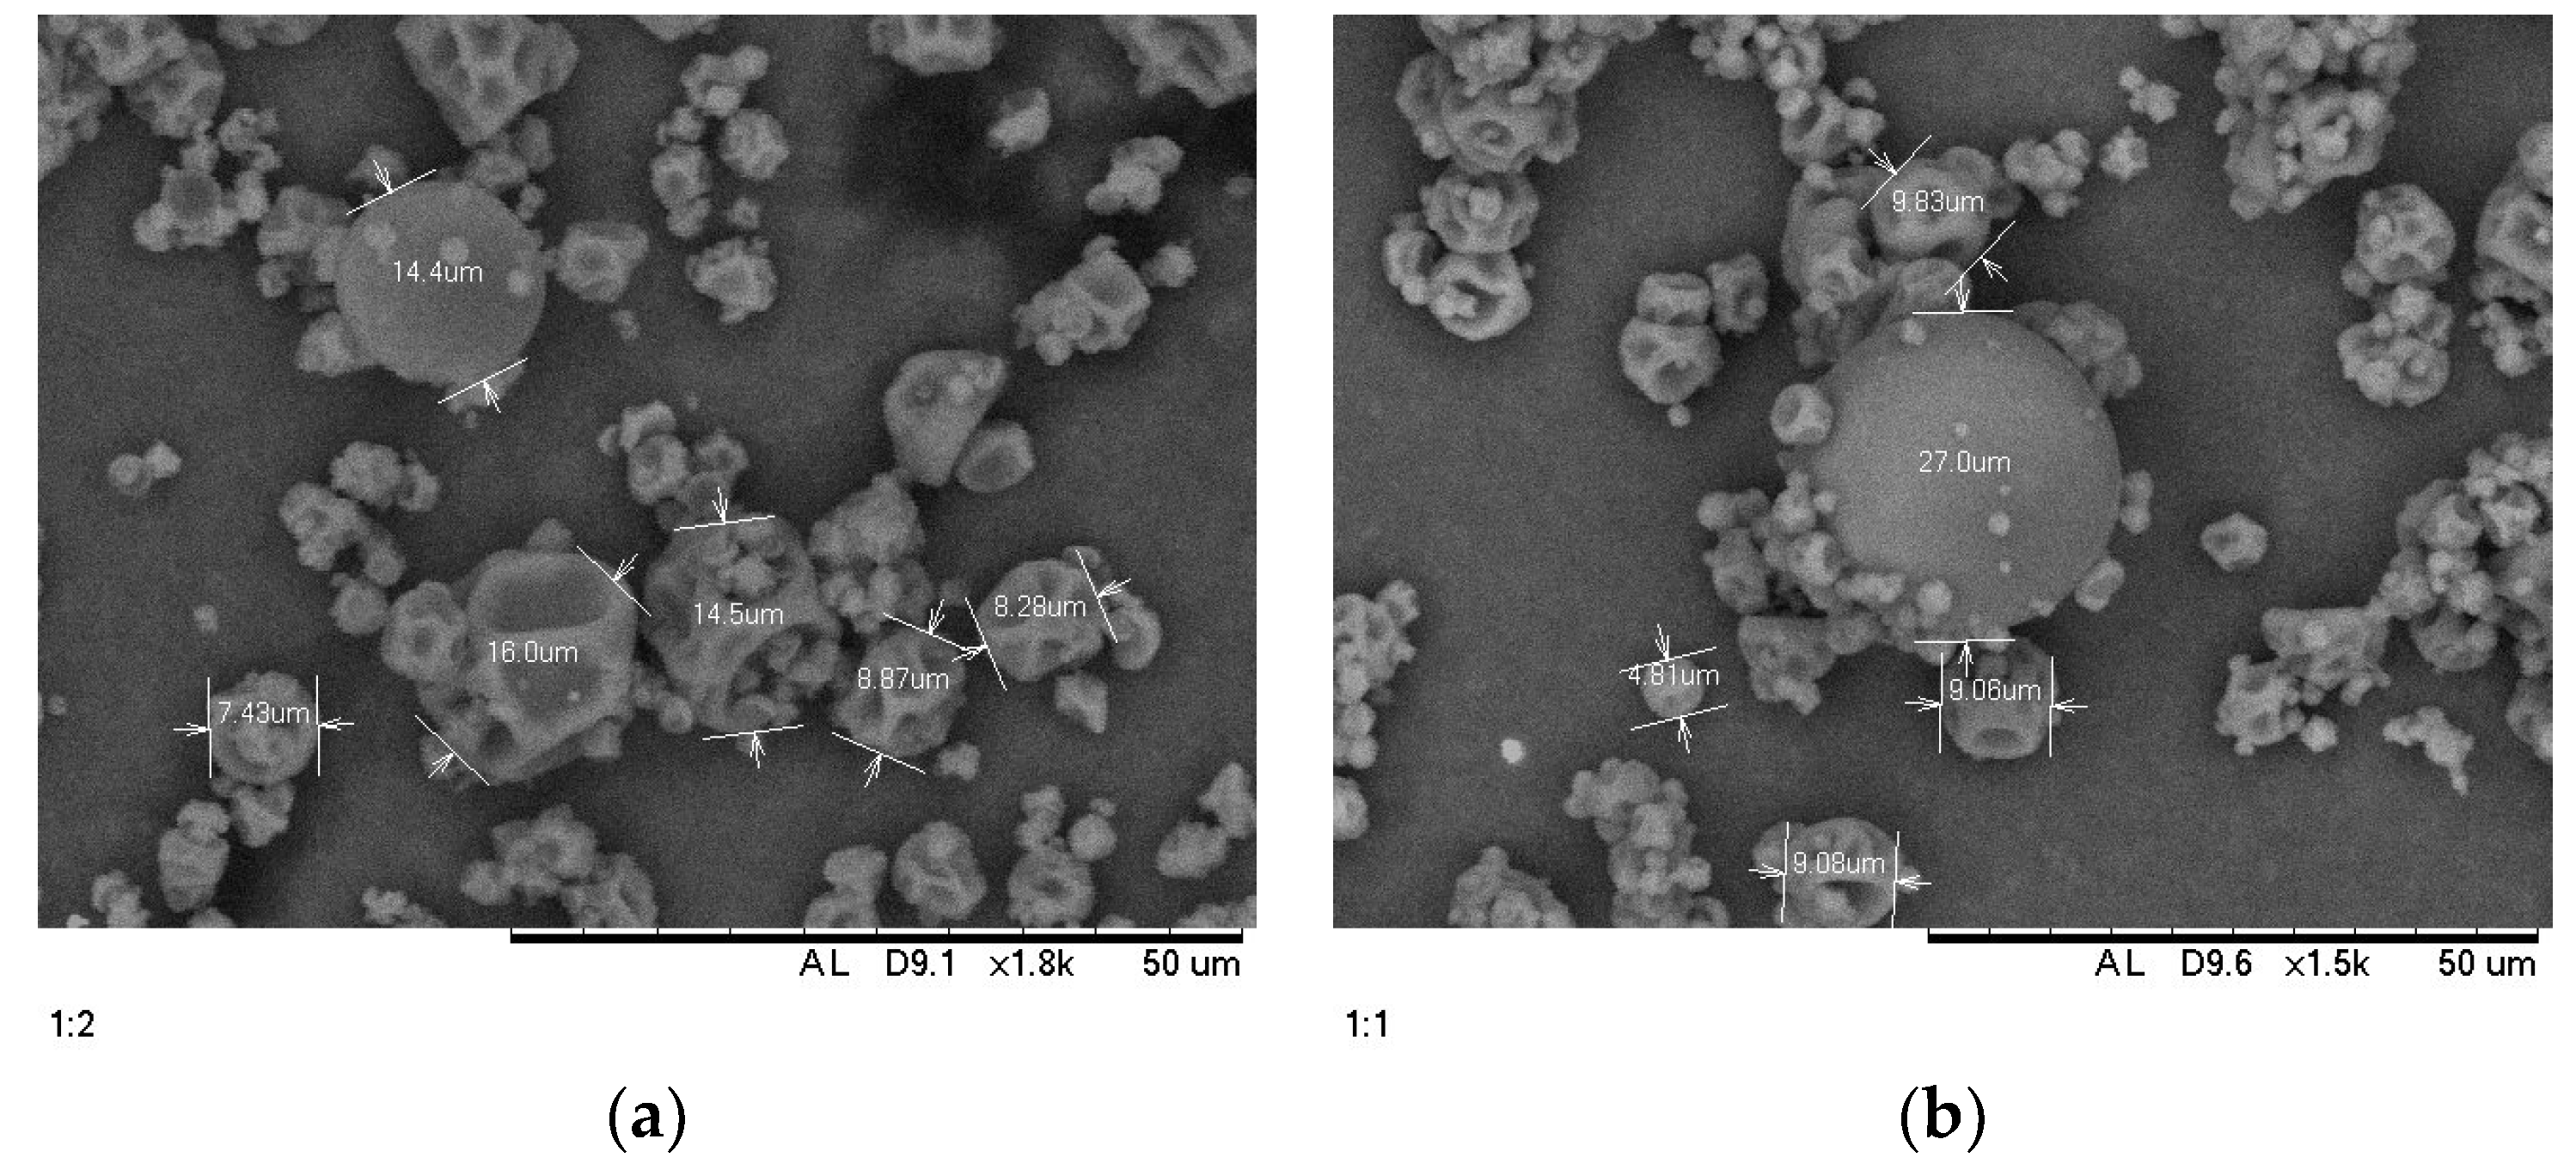
The results showed that the microcapsule structure of propolis at several magnifications showed that most of the particles in each ratio treatment were generally round shapes and irregular surfaces with sizes ranging from 30-50 µm. Irregular surfaces can be caused by rapid evaporation during the spray drying process, and the use of high temperatures can also affect the characteristics of the resulting microcapsules [
10,
28]. Protein as a wall material using the spray drying technique has the characteristics of a rough surface and aggregates of microcapsules [
29].The interaction between protein and polysaccharides can affect the surface of the microcapsules and can act as a plasticizer to produce a smoother surface [
30].
3.2. Stability of Microcapsules
3.2.1. Storage Stability
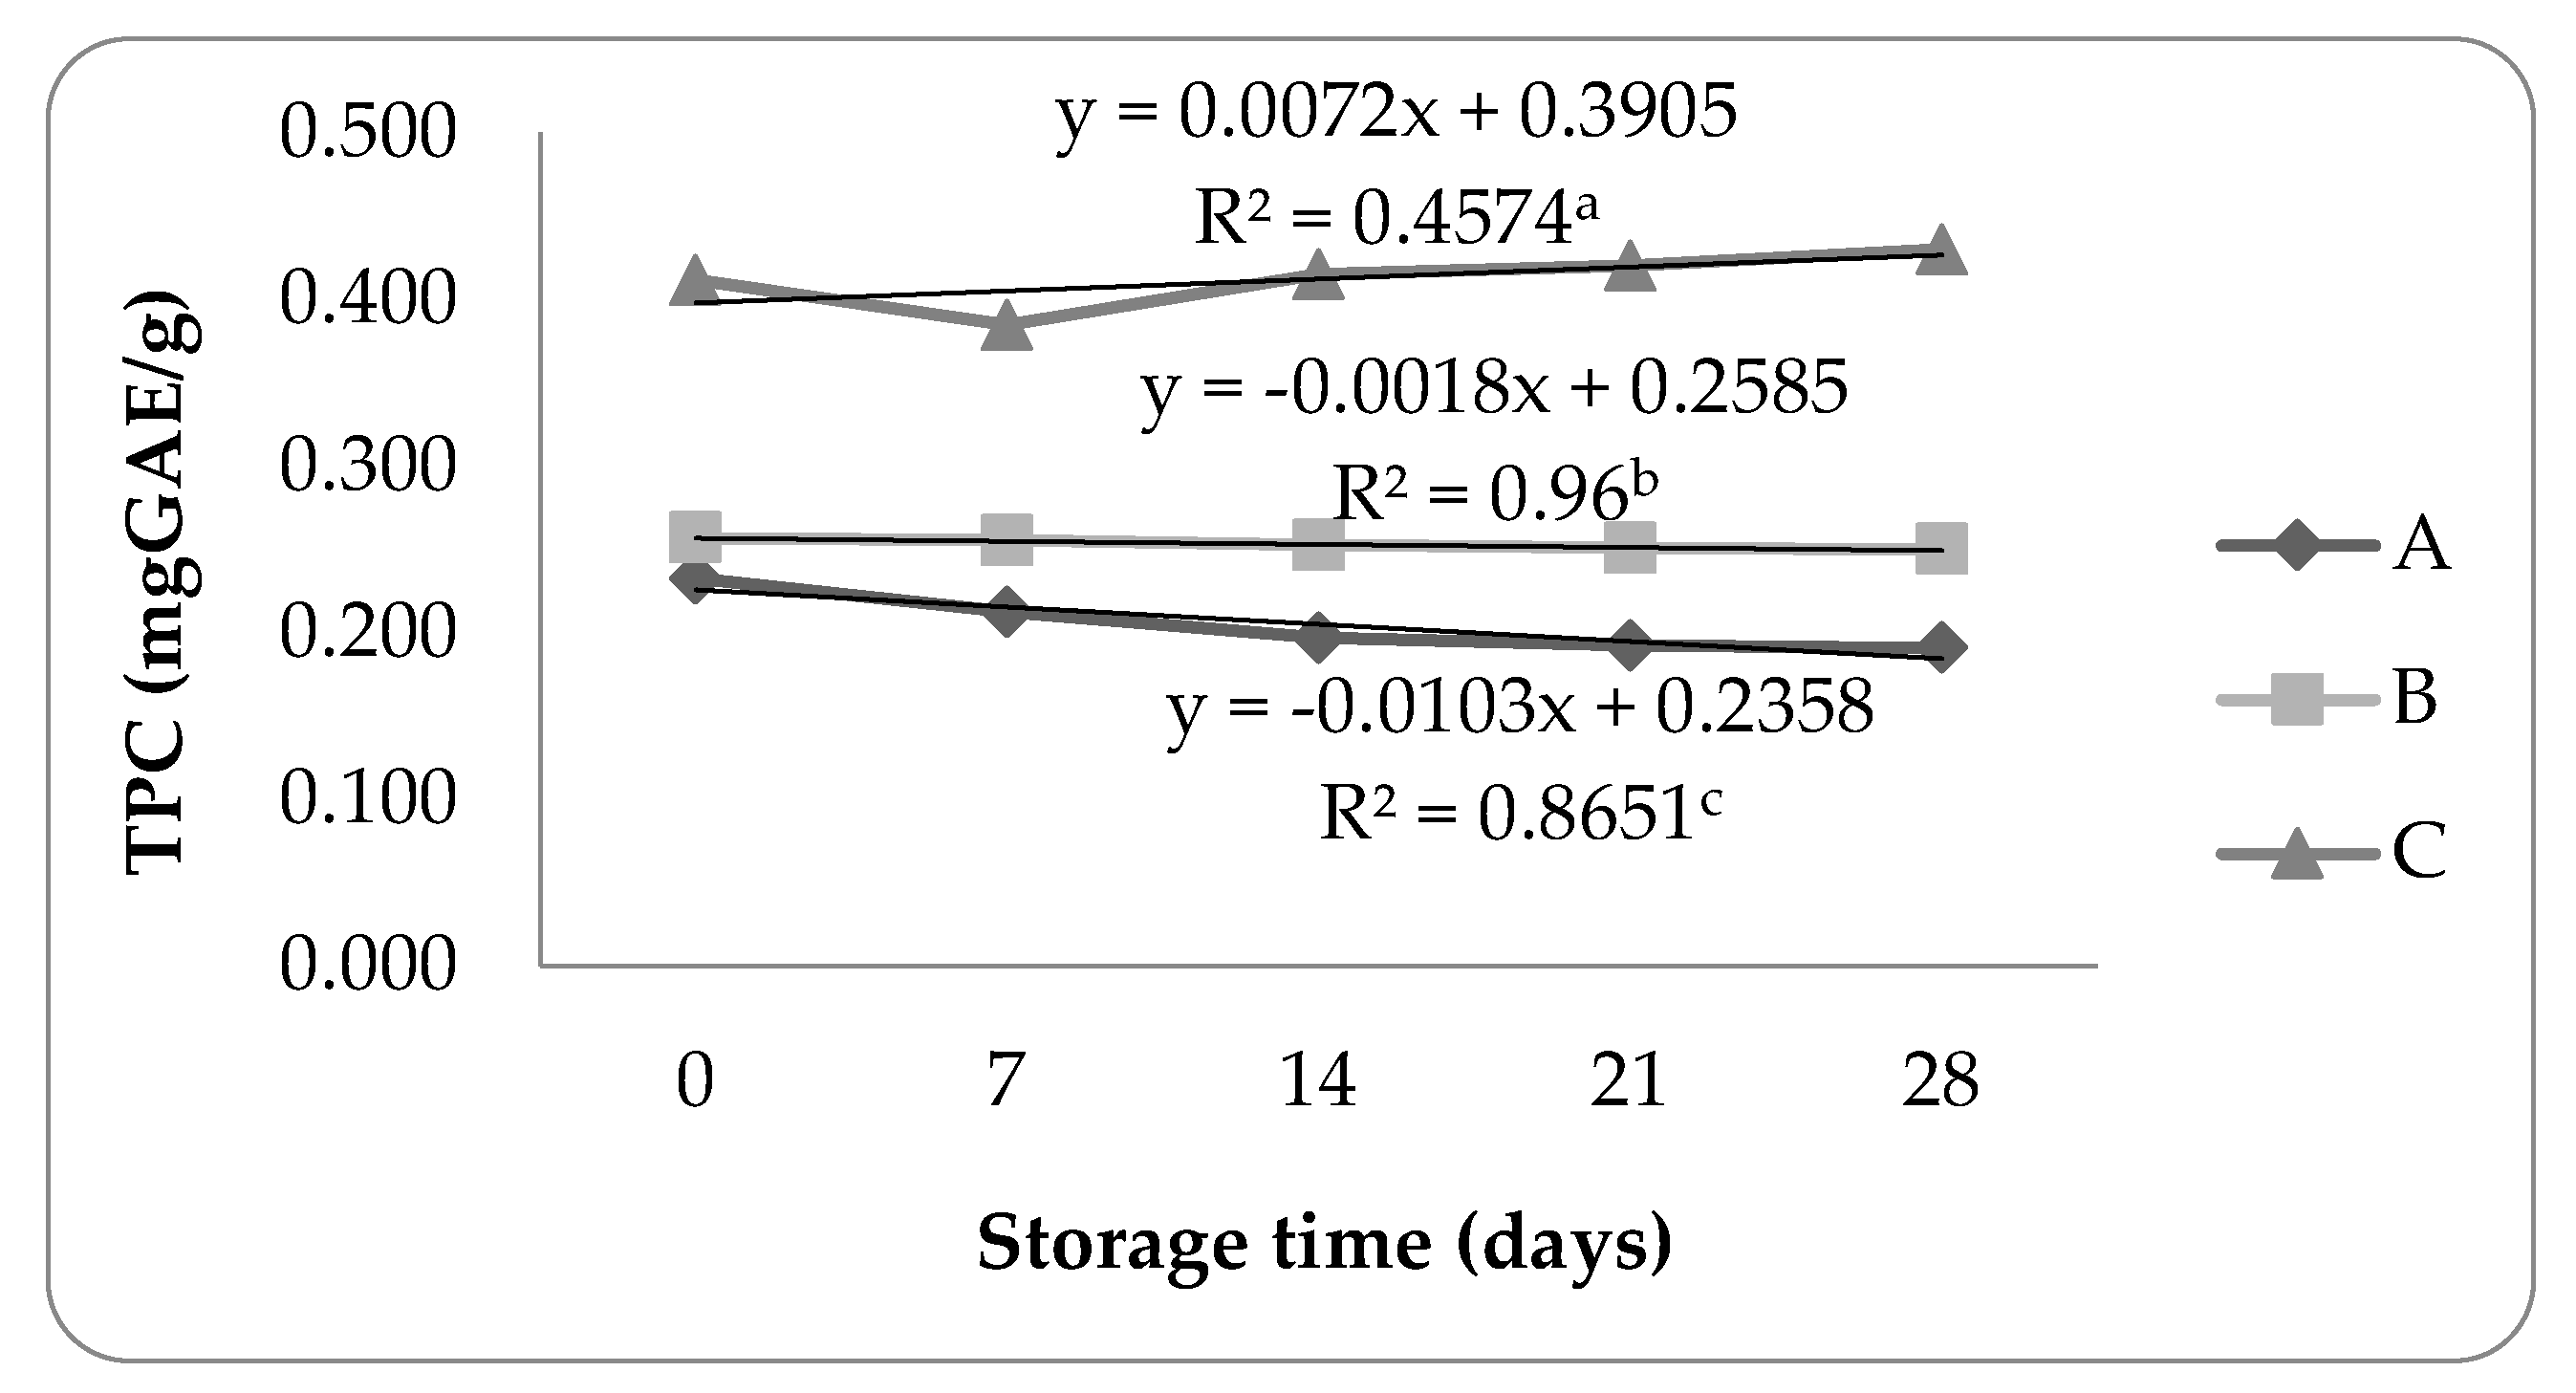
The storage stability identified by Folin-Ciocalteu methods are shown in
Figure 4.
Treatment B showed no drastic decrease in the total phenolic content during the storage period, indicated by the total phenolic retention value of propolis microcapsules which reached 97.31%. The decrease in the total phenolic content in propolis microcapsules could be caused by the degradation of polyphenol compounds [
31]. Treatment A showed a decrease in total phenolic content in the first 2 weeks of storage and tended to be stable for the rest of the storage period. Although there was a decrease, treatment A can be categorized as relatively stable compared to treatment C. Adding polysaccharides such as pectin can maintain phenolic compounds such as anthocyanins and increase antioxidant activity [
32]. In line with this statement, the total phenolic retention of propolis microcapsules in treatment A reached 82.18%.
The stability of the total phenolic content of propolis microcapsules in treatment C decreased in the first week and then increased until the end of the storage period. The increase in total phenolic compounds could be due to oxidized polyphenol reactions and the formation of new compounds, where these compounds interacted with the Folin-Ciocalteau reagent, which increased total phenolic content. The method of determining the total phenolic content with the Folin-Ciocalteau reagent is not specific because the reagent can be influenced by reducing sugars, ascorbic acid, organic acids, and other compounds [
33]. Overall, storage at room temperature did not affect the stability of the propolis microcapsules for treatments A and B.
The results of the statistical analysis of variance (ANOVA) showed that the total phenolic stability parameter of propolis microcapsules during storage had a Pvalue < 0.05, which means that there is a significant difference between the ratio to the total phenolic stability during storage.
3.2.2. Heating Stability
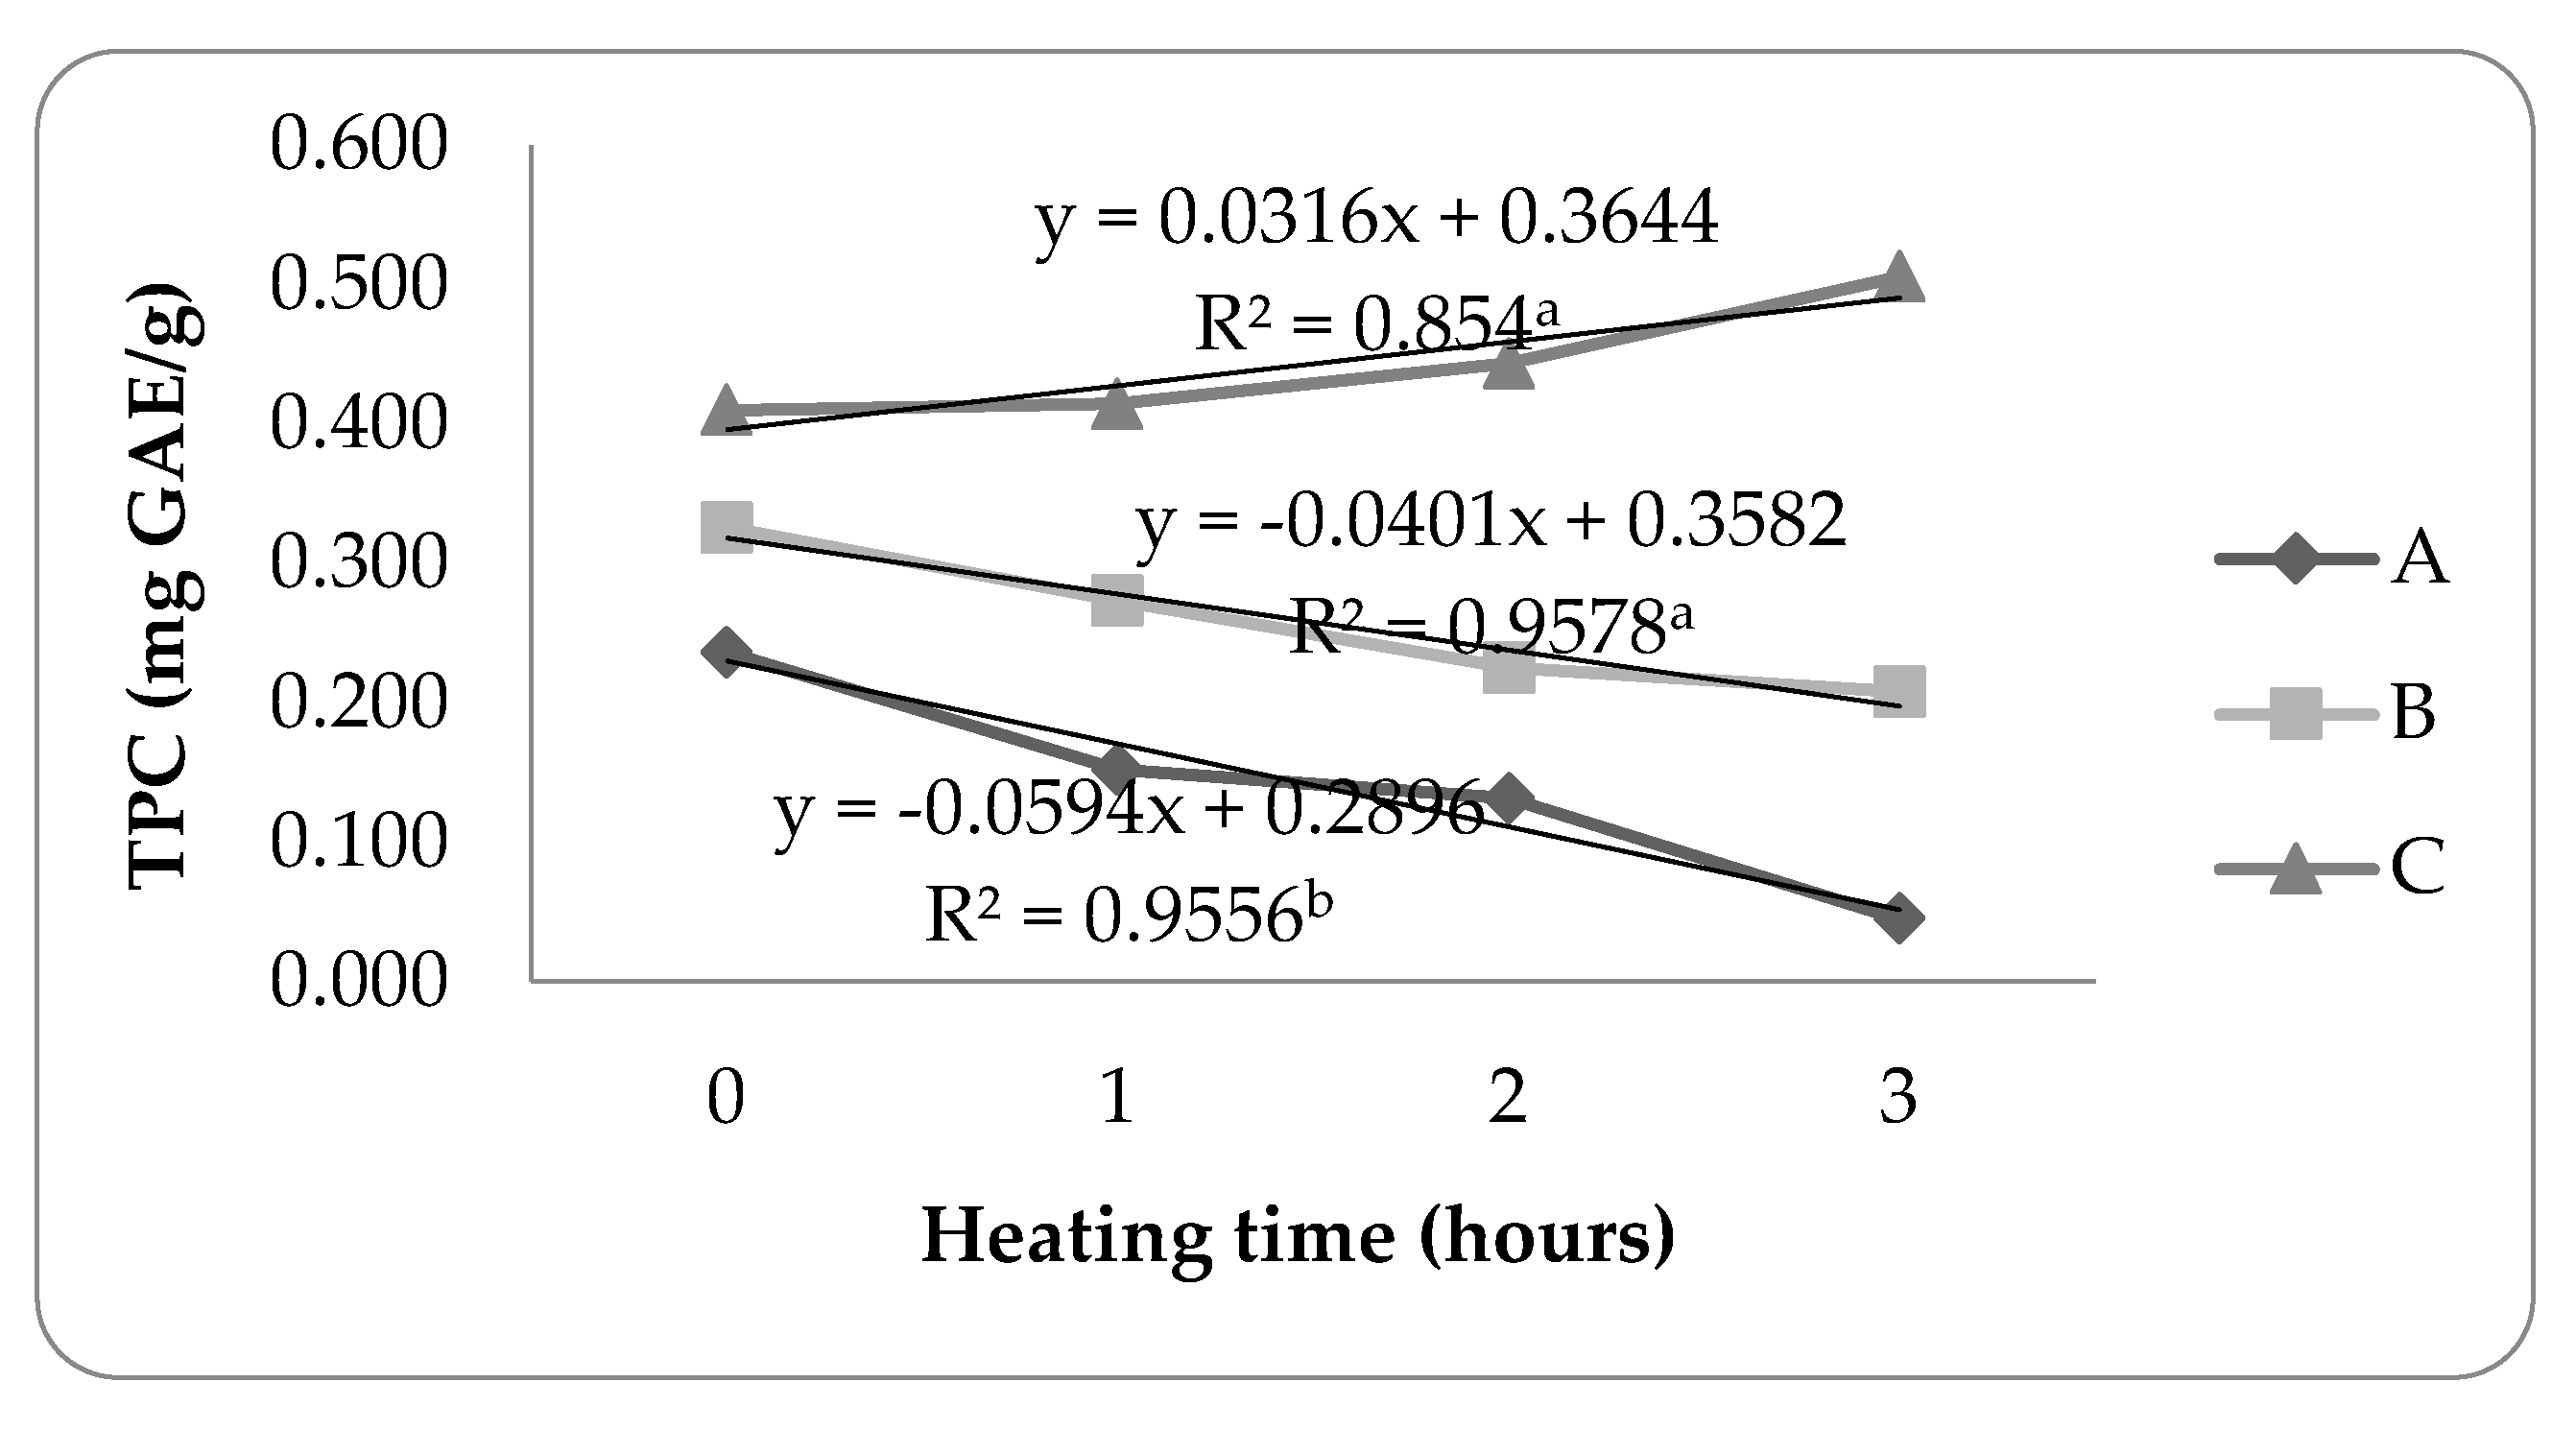
The heating stability identified by Folin-Ciocalteau methods are shown in
Figure 5.
Treatment B tends to decrease the total phenolic content during heating, indicated by the total phenolic retention value of propolis microcapsules produced by 63.86%. Treatment B had higher heating stability than treatments A and C, stability increase accompanied by reducing the use of the WPI ratio. The results are in line who stated that increasing the WPI ratio can reduce the total phenolic content due to its easily denatured nature [
34].
Treatment A showed a drastic decrease in the total phenolic content during 3 hours of heating. The total phenolic value content drastically decreased, resulting in the total phenolic of propolis microcapsule retention being very low, which only reached 19.07%. Meanwhile, the stability of the total phenolic content of propolis microcapsules in treatment C increased with the length of heating time. Whey protein has the main component of B-lactoglobulin these components can denature at temperatures above 70°C [
35].
The results of the statistical analysis of variance (ANOVA) showed that the total phenolic stability parameter of propolis microcapsules during heating had a Pvalue < 0.05, which means that there was a significant difference between the ratio to the total phenolic stability during heating.
4. Conclusions
The ratio of whey protein isolate (WPI) – pectin as wall materials did not significantly affect the physical characteristics of the propolis microcapsules. The different wall materials ratio of propolis microcapsules resulted in high encapsulation efficiency (85.45 – 96.44%), yield values tended to be low (37.279 – 40.116), and microbiology stable aw values (0.375 – 0.529). While on stability, the ratio of whey protein isolate (WPI) – pectin had a significant effect on the physical characteristics of the propolis microcapsules produced. Treatment A resulted in good stability of propolis microcapsules with total phenolic retention of propolis microcapsules during storage for 28 days (97.31%) and heating for 3 hours at 80⁰C (63.86%).
Author Contributions
Conceptualization, methodology, N.S.; supervision, project administration, N.S, M.J.L, Y.C. and M.H; data curation, writing—original draft preparation, writing—review and editing, N.S and D.S.A. All authors have read and agreed to the published version of the manuscript.
Funding
This research was funded by an Internal Research Grant from Universitas Padjadjaran, Bandung, Indonesia (grant number: 1959/UN6.3.1/PT.00/2021), and the APC was funded by Universitas Padjadjaran.
Institutional Review Board Statement
Not applicable.
Informed Consent Statement
Not applicable.
Data Availability Statement
Not applicable.
Acknowledgments
Authors would like to thank our colleagues from the Department of Food Industrial Technology, Universitas Padjadjaran for their continued support.
Conflicts of Interest
The authors declare no conflict of interest.
References
- Busch, V. M. ; Pereyra-Gonzalez, A.; Šegatin, N.; Santagapita, P.; Poklar Ulrih, R. N.; and Buera, M. P. “Propolis encapsulation by spray drying: Characterization and stability,” LWT - Food Sci. Technol., vol. 75, pp. 227–235, 2017. [CrossRef]
- Huang, S.; Zhang ,C. P.; Wang, K.; Li, G. Q.; and Hu, F. L. “Recent advances in the chemical composition of propolis,” Molecules, vol. 19, no. 12, pp. 19610–19632, 2014. [CrossRef]
- Nori, M. P.; Favaro-Trindade, C. S. ; de Alencar, S. M.; Thomazini, M.; de Camargo Balieiro, J. C.; and Castillo, C. J. C. “Microencapsulation of propolis extract by complex coacervation,” LWT-Food Sci. Technol., vol. 44, no. 2, pp. 429–435, 2011.
- Kotsiou, K. and Tasioula-Margari, M. “Monitoring the phenolic compounds of Greek extra-virgin olive oils during storage This work is in memory of Maria Tasioula-Margari, who was the thesis supervisor.,” Food Chem., vol. 200, no. December, pp. 255–262, 2016. [CrossRef]
- Wei and Q. Huang, “Assembly of Protein–Polysaccharide Complexes for Delivery of Bioactive Ingredients: A Perspective Paper,” J. Agric. Food Chem., vol. 67, no. 5, pp. 1344–1352, Feb. 2019. [CrossRef]
- Z.-J. Dong, S.-Q. Xia, S. Hua, K. Hayat, X.-M. Zhang, and S.-Y. Xu, “Optimization of cross-linking parameters during production of transglutaminase-hardened spherical multinuclear microcapsules by complex coacervation.,” Colloids Surf. B. Biointerfaces, vol. 63, no. 1, pp. 41–47, May 2008. [CrossRef]
- Q. Ru, Y. Wang, J. Lee, Y. Ding, and Q. Huang, “Turbidity and rheological properties of bovine serum albumin/pectin coacervates: Effect of salt concentration and initial protein/polysaccharide ratio,” Carbohydr. Polym., vol. 88, no. 3, pp. 838–846, 2012. [CrossRef]
- S. Warnakulasuriya and M. Nickerson, “Review on plant protein-polysaccharide complex coacervation, and the functionality and applicability of formed complexes,” J. Sci. Food Agric., vol. 98, Jun. 2018. [CrossRef]
- B. E. Ștefănescu et al., “Microencapsulation and Bioaccessibility of Phenolic Compounds of Vaccinium Leaf Extracts,” Antioxidants, vol. 11, no. 4, 2022. [CrossRef]
- A. Sulaeman, C. P. Nusa, and S. A. Marliyati, “Antioxidant Activity and Total Phenolic of Encapsulated Stingless Bee Propolis by Spray Drying Method,” vol. 16, no. 28, pp. 65–72, 2021.
- Y. Li, B. Tang, J. Chen, and P. Lai, “Microencapsulation of plum (Prunus salicina lindl.) phenolics by spray drying technology and storage stability,” Food Sci. Technol., vol. 38, no. 3, pp. 530–536, 2018. [CrossRef]
- A. Farrag, T. M. El-Messery, M. M. El-Said, T. N. Soliman, and H. M. F. El-Din, “Microencapsulation of grape phenolic compounds using whey proteins as a carrier vehicle,” J. Biol. Sci., vol. 18, no. 7, pp. 373–380, 2018. [CrossRef]
- J. Wang, H. Li, Z. Chen, W. Liu, and H. Chen, “Characterization and storage properties of a new microencapsulation of tea polyphenols,” Ind. Crops Prod., vol. 89, pp. 152–156, 2016. [CrossRef]
- F. Zanoni, M. Primiterra, N. Angeli, and G. Zoccatelli, “Microencapsulation by spray-drying of polyphenols extracted from red chicory and red cabbage: Effects on stability and color properties,” Food Chem., vol. 307, p. 125535, 2020. [CrossRef]
- B. R. Bhandari, N. Datta, R. Crooks, T. Howes, and S. Rigby, “A Semi-Empirical Approach To Optimise The Quantity Of Drying Aids Required To Spray Dry Sugar-Rich Foods,” Dry. Technol., vol. 15, no. 10, pp. 2509–2525, 1997. [CrossRef]
- J. Mujica-Álvarez et al., “Encapsulation of Vitamins A and E as Spray-Dried Additives for the Feed Industry,” Molecules, vol. 25, no. 6, 2020. [CrossRef]
- M. Raei, A. Rafe, and F. Shahidi, “Rheological and structural characteristics of whey protein-pectin complex coacervates,” J. Food Eng., vol. 228, 2018. [CrossRef]
- M. Bertrand, S. Xia, J. Cai, X. Zhang, D. Emmanuel, and J. Su, “Gelatin and pectin complex coacervates as carriers for cinnamaldehyde: Effect of pectin esterification degree on coacervate formation, and enhanced thermal stability,” Food Hydrocoll., vol. 87, 2018. [CrossRef]
- J. Chen et al., “Extraction temperature is a decisive factor for the properties of pectin,” Food Hydrocoll., vol. 112, 2021. [CrossRef]
- A. S. Raj, S. Rubila, R. Jayabalan, and T. V Ranganathan, “A Review on Pectin: Chemistry due to General Properties of Pectin and its Pharmaceutical Uses,” vol. 1, no. 12, pp. 10–13, 2012. [CrossRef]
- N. Azimi, S. Basiri, and A. Mortazavi, “Evaluation on the effects of hydrocolloids on sensory, texture and color properties of mulberry pastille,” Agric. Eng. Int. CIGR J., vol. 21, no. 3, pp. 242–249, 2019.
- A. Ye, “Complexation between milk proteins and polysaccharides via electrostatic interaction: Principles and applications - A review,” Int. J. Food Sci. Technol., vol. 43, no. 3, pp. 406–415, 2008. [CrossRef]
- P. Cserjési, K. Bélafi-Bakó, Z. Csanádi, S. Beszédes, and C. Hodúr, “Simultaneous recovery of pectin and colorants from solid agro-wastes formed in processing of colorful berries,” Prog. Agric. Eng. Sci., vol. 7, pp. 65–80, 2011. [CrossRef]
- U. Baysan, F. Elmas, and M. Koç, “The effect of spray drying conditions on physicochemical properties of encapsulated propolis powder,” Food Process Eng., no. November 2018, pp. 1–11, 2019. [CrossRef]
- H. Le-Tan et al., “Combination of whey protein and carbohydrate for microencapsulation of pumpkin (Cucurbita spp.) seed oil by spray-drying,” Int. Food Res. J., vol. 24, pp. 1227–1232, 2017.
- C. Ben Amara, N. Eghbal, P. Degraeve, and A. Gharsallaoui, “Using complex coacervation for lysozyme encapsulation by spray-drying,” J. Food Eng., vol. 183, pp. 50–57, 2016. [CrossRef]
- R. Berendsen, C. Güell, and M. Ferrando, “A procyanidin-rich extract encapsulated in water-in-oil-in-water emulsions produced by premix membrane emulsification,” Food Hydrocoll., vol. 43, pp. 636–648, 2015. [CrossRef]
- D. Yusa Ali, D. Purnama, and Y. Pranoto, “Optimasi Nanoenkapsulasi Asap Cair Tempurung Kelapa Dengan Response Surface Methodology Dan Karakterisasi Nanokapsul,” J. Teknol. dan Ind. Pangan, vol. 25, pp. 23–30, 2014. [CrossRef]
- M. L. Bruschi, M. L. C. Cardoso, M. B. Lucchesi, and M. P. D. Gremião, “Gelatin microparticles containing propolis obtained by spray-drying technique: preparation and characterization.,” Int. J. Pharm., vol. 264, no. 1–2, pp. 45–55, Oct. 2003. [CrossRef]
- M. M. Costa et al., “Effective stabilization of CLA by microencapsulation in pea protein.,” Food Chem., vol. 168, pp. 157–166, Feb. 2015. [CrossRef]
- J. H. Y. Galani, J. S. Patel, N. J. Patel, and J. G. Talati, “Storage of Fruits and Vegetables in Refrigerator Increases their Phenolic Acids but Decreases the Total Phenolics, Anthocyanins and Vitamin C with Subsequent Loss of their Antioxidant Capacity.,” Antioxidants (Basel, Switzerland), vol. 6, no. 3, Jul. 2017. [CrossRef]
- Corkovi, A. Pichler, I. Ivi, and J. Šimunovi, “Microencapsulation of Chokeberry Polyphenols and Volatiles : Application of Alginate and Pectin as Wall Materials,” 2021.
- C. Castro-López, E. J. Sánchez-Alejo, S. Saucedo-Pompa, R. Rojas, J. Aranda-Ruiz, and G. C. G. Martínez-Avila, “Fluctuations in phenolic content, ascorbic acid and total carotenoids and antioxidant activity of fruit beverages during storage,” Heliyon, vol. 2, no. 9, p. e00152, 2016. [CrossRef]
- T. Moreno, E. De Paz, I. Navarro, and A. Matías, “Spray Drying Formulation of Polyphenols-Rich Grape Marc Extract : Evaluation of Operating Conditions and Different Natural Carriers,” Food Bioprocess Technol., 2016. [CrossRef]
- S. M. Loveday, “β-Lactoglobulin heat denaturation: A critical assessment of kinetic modelling,” Int. Dairy J., vol. 52, pp. 92–100, 2016. [CrossRef]
|
Disclaimer/Publisher’s Note: The statements, opinions and data contained in all publications are solely those of the individual author(s) and contributor(s) and not of MDPI and/or the editor(s). MDPI and/or the editor(s) disclaim responsibility for any injury to people or property resulting from any ideas, methods, instructions or products referred to in the content. |
© 2023 by the authors. Licensee MDPI, Basel, Switzerland. This article is an open access article distributed under the terms and conditions of the Creative Commons Attribution (CC BY) license (http://creativecommons.org/licenses/by/4.0/).
