
Submitted:
07 June 2023
Posted:
07 June 2023
You are already at the latest version
Abstract
Based on the survey data of 5 large grain-producing provinces in China, we studied the promo-tion effect of the agricultural production trusteeship on high quality production of grain by using a propensity score matching method. The empirical results show that the high-quality production of grain level increased by 0.292, with an increase of 87.4% after participating in agricultural production trusteeship. Among them, the level of high efficiency, premiumization, greenization and branding of grain production has respectively increased by 0.234, 0.373, 0.208, and 0.158. However, there are differences in the facilitation effects of different trusteeship services, with the best promotion effect of agricultural material supply services, followed by post-harvest services, and then land management services and cultivating and harvesting services, the ATT is 0.287, 0.230, 0.158, and 0.139, respectively. Meanwhile, there are differences in the promotion effects for farm households with different factor endowments. The promotion effect is better for small farm households with 3 laborers or less, a land management scale of 10 mus or less, and 1 type of ag-ricultural machinery or less. Therefore, in order to give full play to the promotion effect of agri-cultural production trusteeship on high quality production of grain, the government should vigorously support its development and guide more smallholders to choose agricultural produc-tion trusteeship.
Keywords:
agricultural production trusteeship
; high-quality production of grain
; propensity score matching
1. Introduction
Grain security is “the top concern for the country” [1,2]. Grain security in the new era has a rich connotation, which requires a practical promotion of high-quality production of grain to achieve the goals of quantitative, qualitative and ecological grain security in a synergistic manner. To this end, the Chinese government has repeatedly stressed the high-quality development of the grain industry, and the grain authorities have also vigorously taken action for high-quality grain production. However, China’s grain production is still suffering from problems of the ageing, part-time and small-scale operation of farm households, resulting in insufficient ability or high costs for the grain growers to engage in high-quality production of grain [3,4,5,6]. Meanwhile, most of the technical personnel in China’s grain industry are gathered in the field of scientific research or in circulation links, with a relative shortage of professionals in the production sector. However, high quality production of grain needs professional support in production sector. Researchers have shown that agricultural production services can offer a large number of professional and technical personnel and advanced agricultural machinery for grain production [7], which can not only solve the technical and cost challenges that farm households face in grain production [8,9], but also help reduce the use of chemical fertilizers and pesticides [10,11,12]. The above studies affirm the role of agricultural production services in promoting the high-efficiency and greenization of grain production. Meanwhile, there is still a need for more systematic and in-depth research on the possibility of agricultural productive services for promoting high-quality production of grain at multiple levels in a coordinate manner.
Agricultural production trusteeship is a full-process, specialized and large-scale form of agricultural production service. By the end of 2021, China’s agricultural production trusteeship service area has exceeded 1.67 billion mu1, covering over 78 million small farm households2, making the most important agricultural production service form in China. Hence, the purpose of this paper is to carry on an in-depth and systematic study of the promotion effect of agricultural production trusteeship on high-quality production of grain in multiple dimensions such as high efficiency, premiumization, greenization and branding of grain production.
The chapters are organized as follows: first, literature review and theoretical framework. This part mainly reviews the connotation of high-quality production of grain and the relationship between high-quality production of grain and agricultural production trusteeship. Next, the data sources, research methods, and variable selection of this paper are introduced. Then, the empirical study is conducted. This section includes the overall promotion and heterogeneous effects of agricultural production trusteeship on high-quality production of grain.
2. Literature Review and Theoretical Framework
2.1. Literature review
2.1.1. Connotation and dimension of high-quality production of grain
Judging from the available literatures, there are not much researches on high-quality production of grain at present, and most of which focus on high-quality development of agriculture and that of grain industry. Some researchers argue that the high-quality development of agriculture should combine quality and efficiency promotion, greenization and sustainable development, so as to achieve the goals of “prospering agriculture by efficiency”, “prospering agriculture by quality” and “prospering agriculture by greenization” [13,14].
The high-quality development of grain industry is a proper part of high-quality development of agriculture [15]. Hence, many researchers carry on research on this subject. Drawing on the dimensions of high-quality economic development, Huifen Chen et al. studied the high-quality development of grain industry from the five dimensions of high efficiency, premiumization, coordination, greenization and internationalization [16]. Di Qi et al. proposed a way of high-quality development of grain industry based on the target of multidimensional security objectives of grain, with regard to quality, efficiency, structure and environment [17]. Xiang Fei et al. conducted research from the perspective of grain industry chain, with regard to product quality, circulation efficiency, large market construction, technological support for the industry chain and stability of industrial policies [15].
2.1.2. Relationship between agricultural production trusteeship and high-quality production of grain
Agricultural production trusteeship refers to a mode of agricultural operation in which farm households and other management entities entrust all or part of operational links in agricultural production to agricultural production service organizations for completion or assistance without transferring their land management rights [18]. This can effectively promote quality, efficiency and greenization of grain production. With regard to improvement of quality and efficiency, researchers have found that agricultural production services can improve the efficiency of the use of resource factors by optimizing factor inputs and can thereby promote sustainable grain production [19]. Agricultural technology promotion services, agricultural information services and agricultural product marketing services are conducive to improving the willingness and ability of farm households to produce and sell high-quality agricultural products [20,21]. And the production link outsourcing services help agricultural operators to have extra financial resources and energy to create brands for quality agricultural products [22,23]. And with regard to green production, researchers have found that agricultural production services can contribute to increase of green productivity in agriculture by motivating farm households to adopt green agricultural production techniques and to reduce the use of pesticides and chemical fertilizers [24,25].At the same time, they can break through the restriction of farm households’ low willingness of choosing green production and directly drive the farm households who have been offered the agricultural production services to practice green production.
2.1.3. Shortcomings of existing literatures and the main contributions of this paper
Although some researchers affirmed the promotion effect of various types of agricultural production services on grain efficiency and greenization production. There are still some shortcomings. For example, there is a lack of research on the connotation of high-quality production of grain. At the same time, most available literatures focused on the effect of individual services (e. g. green prevention and control techniques, soil testing formula fertilization, etc.) on grain production [26,27,28,29], or on the impact of agricultural production services on the individual dimensions of grain production (e. g. production efficiency, greenization, etc.) [30].
This paper will conduct a comprehensive and systematic study. The main contributions include: firstly, we will define the connotation of high-quality production of grain, then we will construct the indexes of high-quality production of grain from the four dimensions of high efficiency, premiumization, greenization and branding, in order to comprehensively measure the level of high-quality production of grain. Secondly, we will select a one-stop and all-inclusive form of agricultural production services, the agricultural production trusteeship, to study the coordinate promotion effect of the comprehensive service on high-quality production of grain. Furthermore, we will examine the heterogeneity of the promotion effect of agricultural production trusteeship on high-quality production of grain respectively from high-quality production dimensions, the trusteeship service links and the categories of farm households.
2.2. Theoretical framework
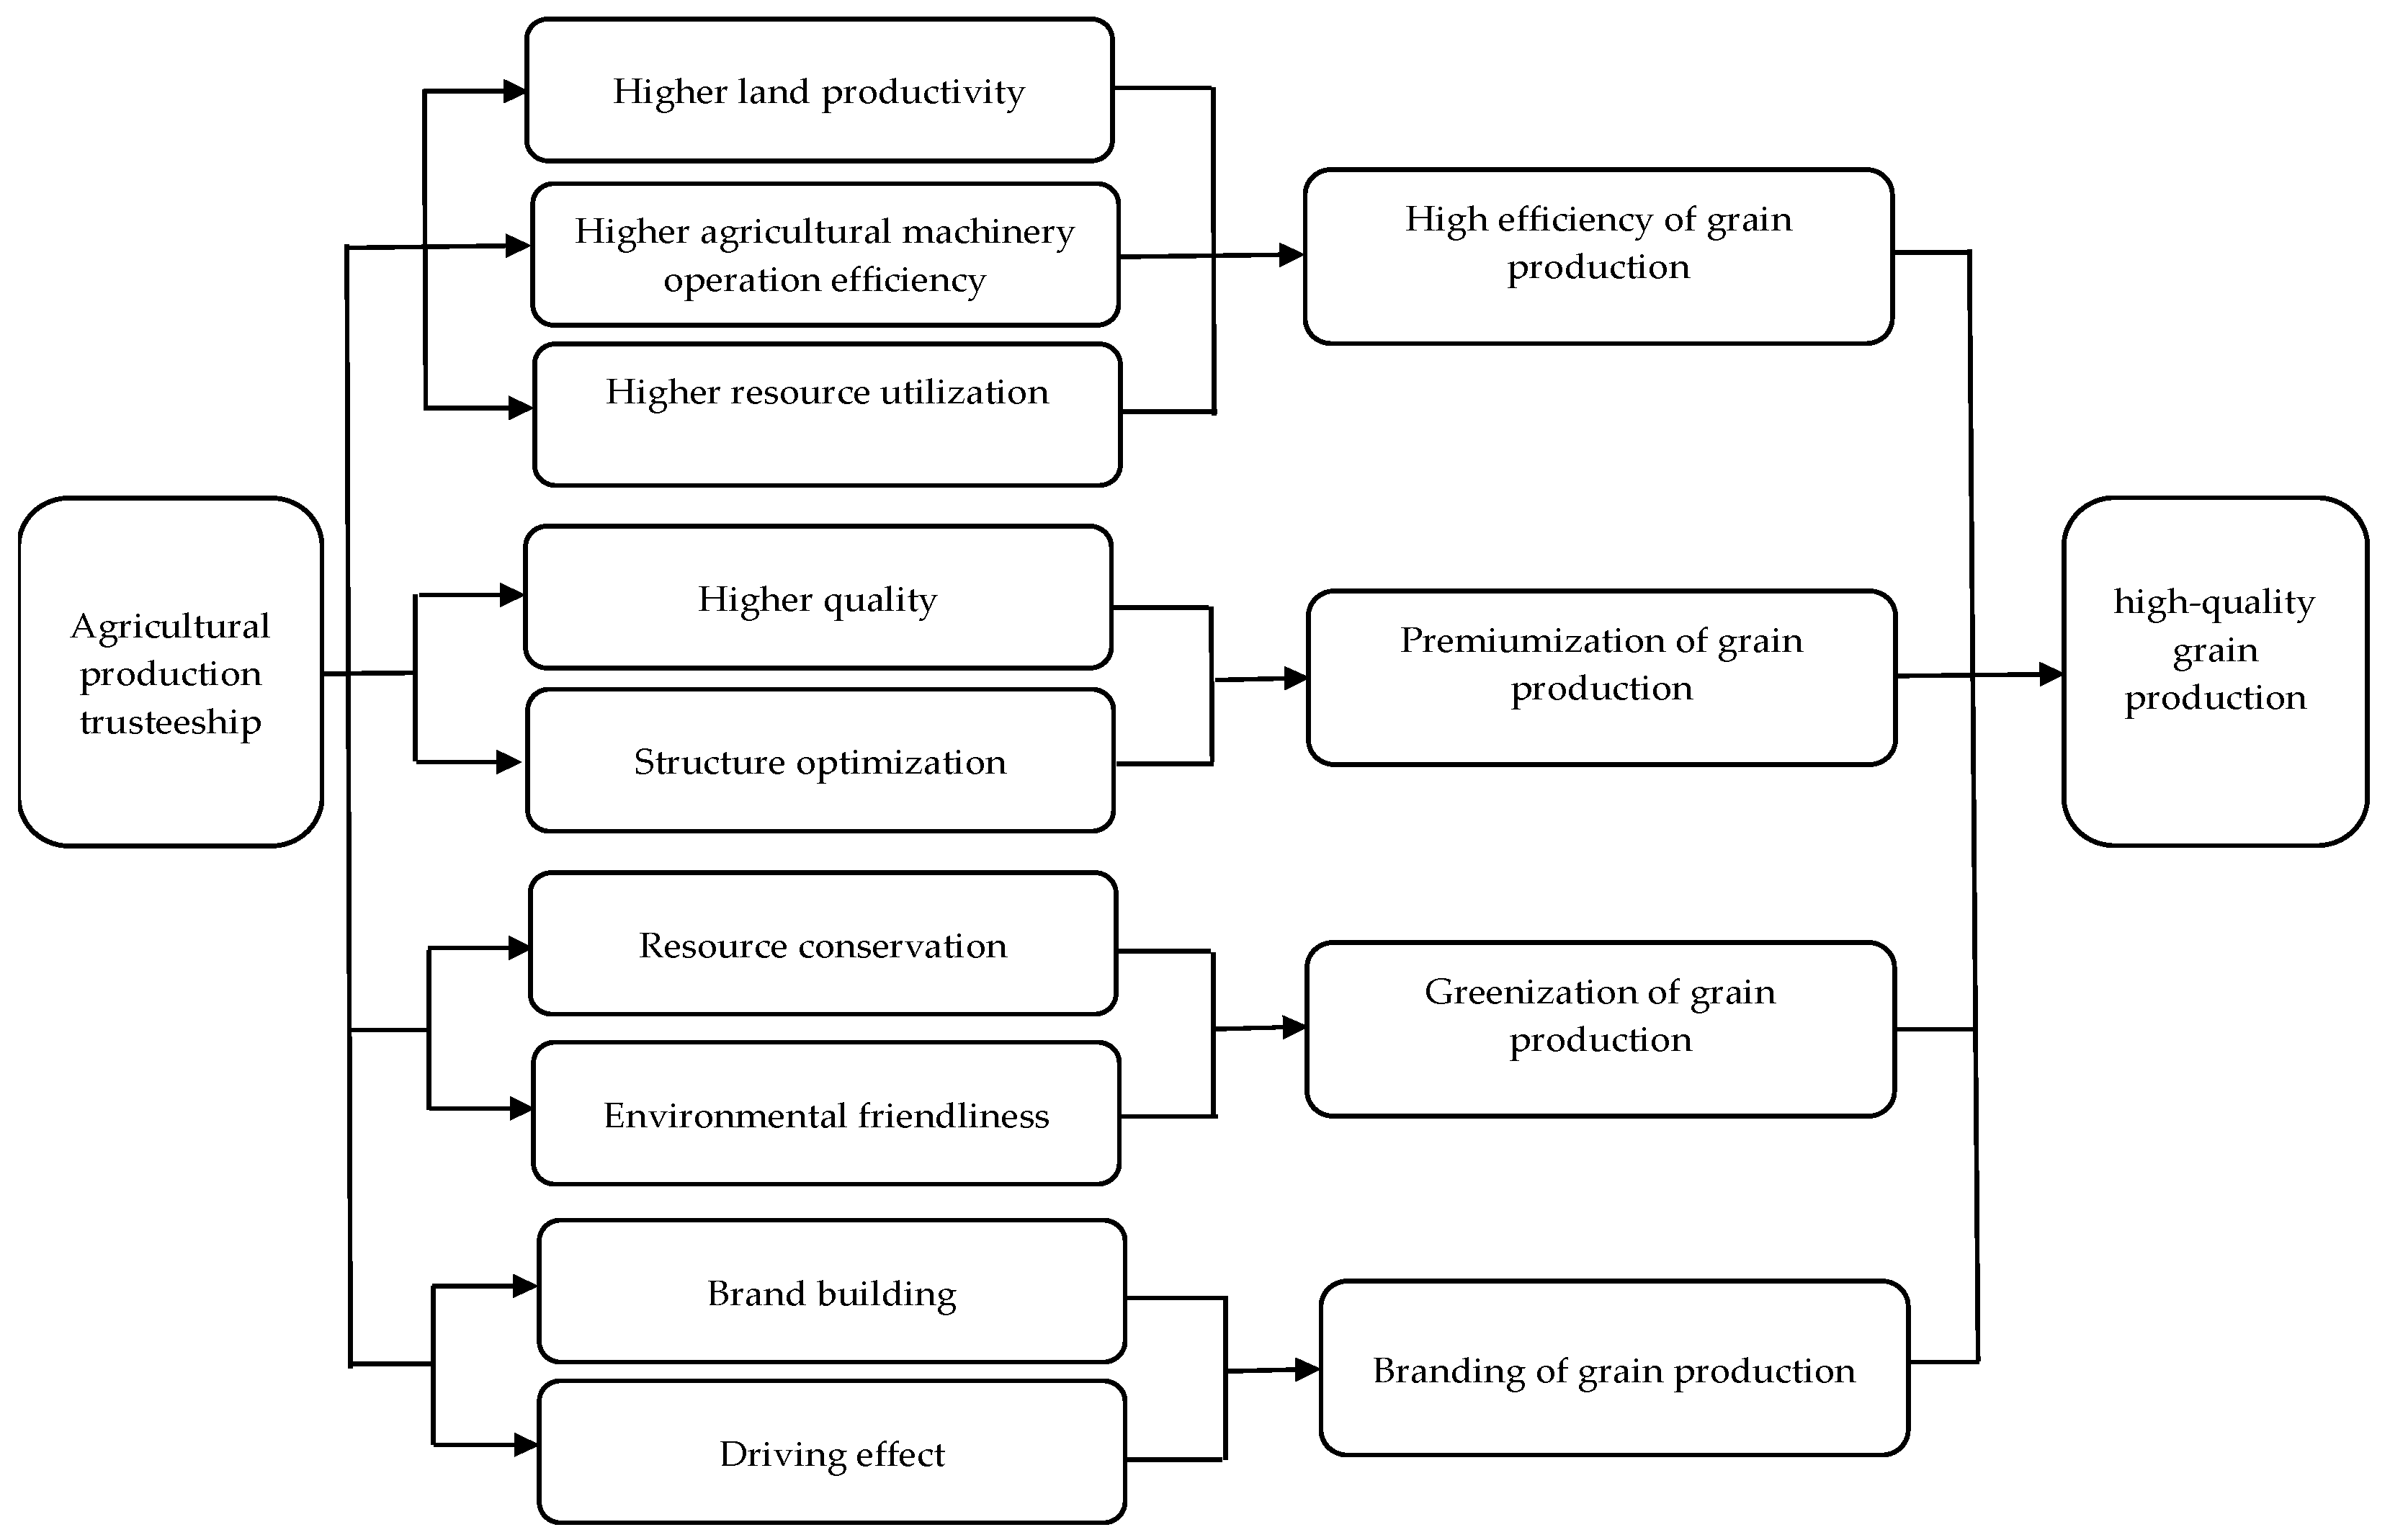
By drawing the connotation of high-quality development of agriculture and that of grain industry [15,31,32], we argue that high-quality production of grain is a way of producing and operating grain that is based on an assurance of efficient grain production. It includes high efficiency, premiumization, greenization and branding of grain production. And agricultural production trusteeship can promote it in the above four aspects.
2.2.1. Contributing to the high efficiency of grain production
Firstly, agricultural production trusteeship can improve the efficiency of land output. On the one hand, agricultural production trusteeship can free up more arable land by abolishing field ridges and reorganizing roads, and the utilization rate of arable land can be improved; on the other hand, the use of good seeds of grain and intensive, standardized and scientific planting services are also conducive to the increase of grain yield. Secondly, it can improve the efficiency of the use of agricultural machinery. Compared to the small-scale scattered operation of professional agricultural machinery households, agricultural production trusteeship is for large-scale operation on the large, connected patches of land, which significantly reduces losses of agricultural machinery when transferring from one patch of land to another. Besides, large-scale operation is also conductive to the improvement of the operation efficiency of the original small agricultural machinery and the use of high-efficiency large agricultural machinery [30]. Thirdly, it can improve the resource utilization efficiency. The intensive, standardized and scientific cultivation services are conducive to improving the use efficiency of chemical fertilizers, pesticides and other inputs [19,36]. Agricultural production trusteeship promotes the high efficiency of grain production by improving the output efficiency of various production factors.
2.2.2. Contributing to the premiumization of grain production
On the one hand, agricultural production trusteeship is conductive to the improvement of the quality. It can greatly improve the grain quality through the use of good seeds, green cultivation and scientific management [37]. Meanwhile, the post-production drying, and storage services help to reduce the degree of post-harvest decline of the grain quality, thus improving the quality of grain along the whole chain [38]. On the other hand, it is conductive to structural optimization. The agricultural production trusteeship organization can better grasp the market demand, produce the high-quality grain and special grain that is urgently needed by the market, and avoid the oversupply of common grain, thus the grain structure can be optimized. As can be seen, agricultural production trusteeship can contribute to the premiumization of grain production in terms of both grain quality improvement and structural optimization.
2.2.3. Contributing to the greenization of grain production
Firstly, agricultural production trusteeship can promote resource conservation. The use of chemical fertilizers, pesticides, and seeds can be effectively reduced by applying technologies such as soil testing formula fertilization, integrated prevention and control, and seed coating [10,11,12]. Meanwhile, the application of sprinkler and drip irrigation technology can effectively save water resources. Secondly, it is beneficial to environmental friendliness. Agricultural production trusteeship service usually adopts low-toxic and environment-friendly pesticides, fertilizers and other green inputs, which, together with the use of green technologies such as integrated prevention and control and straw return, can effectively reduce the possible non-point source pollution caused by grain cultivation. Through resource conservation and environmental friendliness, agricultural production trusteeship can thus promote greenization of grain production.
2.2.4. Contributing to the branding of grain production
Brand building is inseparable from brand awareness and scale foundation, but small farm households hardly have the awareness and capability of establishing a brand. Even if some new operation entities have certain brand awareness, it is difficult for them to build high-quality grain brands due to small operation scale, shortage of funds and lack of publicity channels. Agricultural production trusteeship service organizations can give play to its scale advantage, organizational advantage and professional advantage, and organize farm households to produce high quality grain on one end and build brands on the other. Through building high quality grain brands, agricultural production trusteeship organizations can help achieve high quality and good prices of grain in order to protect the income of the farm households and stimulate their motivation to grow grain.
Figure 1.
Mechanism of agricultural production trusteeship in promoting high-quality production of grain.
Figure 1.
Mechanism of agricultural production trusteeship in promoting high-quality production of grain.
3. Data Sources, Research Methods and Variable Selection
3.1. Data sources
The data used in this paper were obtained through the questionnaire survey conducted between October and December 2020 among the farm households in Henan, Shandong, Anhui, Jiangsu and Hebei provinces in China. The selection of the provinces for survey is mainly based on two considerations: firstly, the wheat cultivation area is wide and the yield is higher; secondly, the agricultural production trusteeship services are carried out earlier and more mature. Therefore, the five provinces, including Henan Province and Shandong Province, which are the major wheat cultivation provinces3 in China and where the agricultural production trusteeship services are well developed4, were selected. In accordance with the sampling criteria that the study sites should represent different regions and different levels of economic development, a combination of stratified and random sampling was used to select 3 counties (or cities or districts) in each province that carry out agricultural production trusteeship. Then from each of the counties (or cities or districts), 3 townships (or towns) where agricultural production trusteeship services were carried out were further selected, and then from each of the 3 townships (or towns), 2 administrative villages where agricultural production trusteeship services were carried out were further selected, and finally from each of the administrative villages 10-20 farm households were randomly selected. The research was conducted by means of one-to-one interviews with the farm households, with questions in the questionnaires asked and with questionnaires filled in personally by us researchers ourselves. The questions included in the questionnaires are related to individual characteristics, family characteristics, grain production characteristics, social relationship characteristics, etc. After removing questionnaires with omitted key information, with missing variables, with contradictory information, or with outliers, a total of 1174 valid questionnaires were obtained, with an effective rate of 93.92%.
3.2. Research methodology
On the one hand, farm households’ choice of agricultural production trusteeship is a non-random “self-choosing” behavior, which will be influenced by the individual, family, operation and social characteristics of the decision makers, and these factors will also affect the quality of their grain production. Therefore, the research on the promotion effect of agricultural production trusteeship on high-quality production of grain has endogenous problems, which makes it impossible to evaluate the effect accurately. On the other hand, although it is possible to observe each farm household’s grain production situations before and after his choice of agricultural production trusteeship, each control variable of sample farm households may vary before and after their choice of agricultural production trusteeship, resulting in the variables uncontrolled. Therefore, we can only simulate the situation when the farm households do not participate in agricultural production trusteeship, and then compare the simulated situation when the farm households do not participate in agricultural production trusteeship with the situation in which they do. And to solve the above-mentioned problems, we have adopted the Propensity Score Matching method (PSM) [39,40] in this research to test the promotion effect of agricultural production trusteeship on high-quality production of grain.
First, farm households who are now under agricultural production trusteeship (experimental group) and those who are not under agricultural production trusteeship (control group) are separated according to observable variables. To this end, we use the fitting value of the conditional probability of the farm households when they choice agricultural production trusteeship as the propensity score, which is estimated through the Logit model:
Where i denotes an individual farm household,=1 denotes the farm household i’s choice of agricultural production trusteeship, and denotes a series of control variables that may affect the farm household i’s choice of agricultural production trusteeship. After estimating the propensity score, the experimental and control groups are matched by constructing a counterfactual framework. A good matching estimator requires a large common support domain for the propensity score of the farm households who have chosen agricultural production trusteeship and those who have not after matching. Meanwhile, to ensure the robustness of the matching results, we use k-nearest neighbor matching, caliper matching, kernel matching, local linear regression matching and spline matching for estimation. The effect of agricultural production trusteeship on promoting high quality production of grain can be expressed by the Average Treatment effect (ATT) of the farm households participating in agricultural production trusteeship, i.e.,
Wheredenotes the high-quality production of grain situation when the farm household i is under agricultural production trusteeship, and denotes the high-quality production of grain situation when he is not under agricultural production trusteeship after matching. Due to the fact that the grain production situations of the farm households who are now under agricultural production trusteeship before they are under agricultural production trusteeship cannot be measured, we simulate the characteristics of the farm households in the control group through various matching methods to make the matched experimental and control groups of the farm households have no significant differences in characteristics in other situations than in those that they are or not under agricultural production trusteeship. Then it can be taken that we can observe simultaneously the high-quality production of grain situations of the same farm household before and after he is under agricultural production trusteeship.
3.3. Variable selection and descriptive statistics
3.3.1. Explained variable
We have explained the high-quality production of grain situations from the perspective of farm households, which can better describe the production process of grain and can avoid the limitations of examining high quality production in terms of finished grain products only. Hence, the explained variable is the level of high-quality production of grain of farm households, which is measured by the index of high-quality production of grain. On the basis of the above definition of high-quality production of grain, we design the evaluation index system for high-quality production of grain in the four dimensions of high efficiency, premiumization, greenization and branding, as are shown in Table 1.
High efficiency is the primary prerequisite for high-quality development of grain production. The most direct manifestation of high efficiency is the improvement of the utilization efficiency of various production factors [19,30,33,34,35,36]. Hence, agricultural machinery efficiency, land production efficiency and resource utilization efficiency are adopted in this research to reflect the high efficiency of grain production.
Premiumization is the essential requirement of high-quality production of grain. As consumer demand has escalated, food consumption has shifted from having enough to eat to eating better, which naturally requires quality food supply. Premium grain supply requires both the improvement of grain quality and the optimization of grain structure [37,38]. To meet the above requirements, it is necessary to select high-quality grain varieties and to standardise their cultivation. Hence, we adopt the indexes of the two elements of use of high-quality seeds and standardized production to measure the premiumization of grain production.
Greenization forms an important part of high-quality production of grain. The goal of green production is resource conservation and environmental friendliness [10,11,12,41], which requires the use of green inputs and green agricultural production technologies. Hence, we adopt the above two indexes to measure the greenization of grain production.
Branding is the ultimate expression and guarantee of high-quality production of grain. High-quality grain can enhance the product image through product certification and brand building, thereby realizing high quality and good prices of grain and forming a positive interaction between production and marketing. Therefore, we have adopted “the achievement or not of high quality and good prices of grain” to reflect the branding of grain.
Drawing on available researches [42,43], we adopt entropy weight method to measure the high-quality production of grain level from the four dimensions of high efficiency, premiumization, greenization and branding.
Firstly, the indexes of the four dimensions of high efficiency, premiumization, greenization and branding are standardized by the following formula:
Where refers to the standardized index of each dimension, i denotes the individual farm household, j (j=1,2,3,4) denotes the four dimensions of high quality grain production, is the maximum value of the j-th dimension of the farm household i, and is the minimum value of the j-th dimension of the farm household i. High efficiency, premiumization, greenization and branding are all positively relative to high quality grain production, and thus the indexes of the four dimensions have directionally consistent measures without the need for inverse treatment.
Then, the information entropy of the indexes of the four dimensions of high efficiency, premiumization, greenization and branding is calculated with the following formula:
Where = , and if =0, then ln=0.
Then, the weight of the indexes of the four dimensions of high efficiency, premiumization, greenization and branding is calculated with the following formula:
Where specific weights for the indexes of the four dimensions of high efficiency, premiumization, greenization and branding of grain production are shown in Table 1.
Finally, the comprehensive index of high-quality production of grain is calculated using the following formula:
3.3.2. Core explanatory variable
We have focused on the promotion effect of agricultural production trusteeship on high-quality production of grain. Grain cultivation requires a range of services before, during and after grain production, including agricultural materials supply service, ploughing service, seeding service, production management service, harvesting service and post-harvest service. Agricultural production trusteeship organizations can provide the above mentioned six types of services for grain production in a one-stop, all-inclusive manner. Since most farm households need agricultural materials supply or mechanized farming and harvesting services, regardless of whether they purchase agricultural production trusteeship services, in this paper, farm households who are under agricultural trusteeship service are defined as those who purchase four or more kinds of trusteeship services from the same trusteeship organization, while farm households who are not under agricultural production trusteeship are defined as those who purchase less than four kinds of services from the same trusteeship organization.
3.3.3. Control variables
When PSM is used for analysis, it is important to include in the model, as far as possible, the variables that affect both farm households’ choice of agricultural production trusteeship and high-quality production of grain. Finally, we select the individual characteristics (Age and Educational background) of the grain-cultivation decision-makers, family characteristics (number of agricultural labor force, part-time business, total household income, proportion of grain income and market distance), operation characteristics (scale of operation, degree of land fragmentation, types of agricultural machinery and traffic conditions), social characteristics (information acquisition channels, availability of farm machinery household resources, membership of cooperative organizations, government publicity campaigns, and professional cultivation guidance) as control variables that affect farm households’ choice of agricultural production trusteeship and high-quality production of grain. See Table 2 for the definition and descriptive statistics of each variable.
4. Empirical Results and Analysis
4.1. Estimation of the decision-making model of the farm households to choose agricultural production trusteeship
The probability of farm households’ choice of agricultural production trusteeship is estimated by using Logit model. The estimation results are shown in Table 3. The variables of individual characteristics, family characteristics, management characteristics and social characteristics of the grain decision makers have a significant influence on the possibility of their choice of agricultural production trusteeship. Among them, age, educational background, part-time business, total family income, proportion of grain income, market distance, traffic conditions, information acquisition channels, membership of cooperative organizations, government publicity campaigns and professional cultivation guidance have significant positive effects on farm households’ choice of agricultural production trusteeship. The variables of the number of agricultural labor force, degree of land fragmentation, types of agricultural machinery, and availability of farm machinery household resources have a significant negative effect on farm households’ choice of agricultural production trusteeship.
4.2. Common support domain and balance test
4.2.1. Common support domain
To ensure matching quality requires a common support domain check [44]. As shown in Figure 2, the probability distribution of propensity scores of the farm households in the experimental group and those in the control group varies greatly before matching, with the experimental group concentrating in the higher value domain, while the control group concentrating in the lower value domain. After matching, the difference of probability distribution of propensity score of the two groups of farm households is obviously reduced, and the common support domain is larger. Referring to the above data tables, 28 samples are lost in the experimental group and 80 samples are lost in the control group, with about 90.8% of the samples in the common support domain and a good match.
4.2.2. Balance test
After matching, it is necessary to test for significant differences in the control variables between the experimental group and the control group of farm households. This is called a balance test [44]. As shown in Table 4, the Pseudo value significantly decreases from 0.299 before matching to 0.013 after matching; the LR statistic significantly decreases from 486.15 to 20.2-20.7, and the joint significance test of control variables changes from 1% significance level to high probability rejection, with the mean deviation and median deviation decreasing to within 10%. As a result, the total deviation after matching is significantly lower and the matching result is more satisfactory.
4.3. Overall promotion effect of agricultural production trusteeship on high-quality production of grain
To ensure the robustness of the regression results, five matching methods, i. e. k-nearest neighbor matching, caliper matching, kernel matching, local linear regression matching and spline matching, are used in this paper to estimate the promotion effect of agricultural production trusteeship on high-quality production of grain. As shown in Table 5, the five estimates are highly similar, with the average treatment effect (ATT) passing the test at the significance level of 1%. According to the ATT average, the high-quality production of grain level of farm households is 0.292 higher (an increase of 87.4%) after they are under agricultural production trusteeship compared to the level that would have been achieved if they had not been under agricultural production trusteeship. Among them, the levels of high efficiency, premiumization, greenization and branding increase by 0.234, 0.373, 0.208 and 0.158 respectively, with an increase of 54.8%, 119.9%, 66.7% and 31.7% respectively. This is thus proved that agricultural production trusteeship can promote the high efficiency, premiumization, greenization and branding of the grain production of the farm households, which then promote the high-quality production of grain in multiple dimensions in a synergistic manner.
The conclusion of this paper is in good agreement with the available research. With regard to high efficiency, Long Qian et al. suggest that large-scale agricultural machinery service can improve labor productivity [45]; the research by Yajuan Li also argues that socialized service can improve the utilization efficiency of chemical fertilizer resources [19]; meanwhile, Tao Chen and Siyu Yang suggest agricultural materials supply and agricultural machinery service can significantly and positively affect the yield of rice and wheat [7,30]. In this paper, we find that agricultural production trusteeship can promote the high efficiency of grain production in a coordinate manner from three aspects: utilization efficiency of agricultural materials, that of agricultural machinery and grain yield. With regard to premiumization, we find that agricultural production trusteeship can synergistically promote the premiumization of grain production in terms of both the use of good varieties and the standardized services. And the research by Michael J Edney also suggests that the adoption of good seeds can significantly improve the quality of wheat [37]; the research by Rani Puthukulangara Ramachandran also shows that post-harvest storage, transportation and marketing services can prevent food spoilage [38]. With regard to greenization, Chunfang Yang argues that the socialized service of green production significantly reduces the fertilizer application amount of the rice farmers in Jiangsu Province of China [11]; the research by Zhong Ren suggests that the socialized service of agriculture significantly and positively affects the application behavior of organic fertilizer of the farm households in Shandong Province of China, and the application of organic fertilizer can reduce agricultural non-point source pollution significantly [10].
It is thus obvious that this research maintains a high consistency with previous studies, yet is more in-depth and comprehensive. In this paper, we not only study the impact of individual services on individual aspects of high-quality production of grain, but also construct a comprehensive system of indexes to study the synergistic promotion effect of production trusteeship services on high quality production of grain in a multi-dimensional and multi-faceted way.
4.4. Heterogeneity analysis of agricultural production trusteeship in promoting high-quality production of grain
4.4.1. Heterogeneity of different trusteeship services in promoting high-quality grain production
As mentioned above, agricultural production trusteeship services can be divided into six categories: agricultural material supply services, ploughing services, seeding services, land management services, harvesting services and post-harvest services. Most farm households need three types of services, i. e. ploughing, seeding and harvesting, and these three types of services are mechanical services. Therefore, in the further study of the effects of different trusteeship services on high-quality grain production, ploughing, seeding and harvesting services are grouped in the same category of services. This paper will study the effect of agricultural material supply services, ploughing, seeding and harvesting services, land management services and post-harvest services on promoting high-quality grain production respectively.
As shown in Table 6, agricultural material supply services have the best overall promotion effect on high-quality grain production, followed by post-harvest services, production management services and ploughing, seeding and harvesting services. Of these, agricultural material supply services are particularly effective on promoting premiumization of grain production, with an ATT of 0.443, an increase of almost 160%. This may be related to the fact that agricultural material supply services can be a good promoter of the use of good seeds. The promotion effect of post-harvest services on premiumization of grain production is also obvious, with an ATT of 0.29, an increase of nearly 60%. This may be due to the fact that the post-harvest drying, storage and agency services can prevent the post-harvest quality decline of grain.Production management services, such as unified prevention and control, are particularly effective on promoting greenization of grain production, while ploughing, seeding and harvesting services are more conductive to the promotion of premiumization and high efficiency of grain production.
The above conclusions are also strongly supported by previous relevant studies. For example, research by Vitor Henrique Vaz Mondo indicates that the use of good seeds can positively affect the yield and quality of corn in Pirabicaba of Brazil [34]; the research by Rani Puthukulangara Ramachandran affirms that the application of grain storage techniques is very important to prevent grain deterioration [38]. Chunfang Yang and Zhong Ren also argue that integrated prevention and control services, precision fertilization (or soil testing formula fertilization) and the use of organic fertilizers are all beneficial to the green development of agriculture [10,11]. The study by Chen Tao shows that agricultural services are highly correlated with high efficiency of agricultural production [7]. These studies confirm the contribution of individual agricultural production services to individual aspects of grain production. However, using the same sample, we can not only study the effects of individual services on individual aspects of high-quality production of grain and their integrated effects, but also compare the various effects. This is more helpful to find out what services are more conductive to high-quality production of grain, and can thus break through the dilemma that the results of previous studies are not suitable for comparison due to different samples.
4.4.2. Heterogeneity of promotion effects for farm households with different factor endowments
Considering the promotion effect of agricultural production trusteeship for farm households with different factor endowments varies, the sample farm households are categorized into different groups based on the average value of the variables of the number of household labor force and household types of agricultural machinery, and the sample farm households are categorized into two groups: those whose scale of operation is 10 mus or less and those whose scale of operation is more than 10 mus, based on the statistical standards5 for small farm households in China. As is shown in Table 7, the promotion effect of agricultural production trusteeship on farm households with a small number of labor force is better than that of farm households with a large number of labor force; the promotion effect on the small-scale farm households with less agricultural machinery is better than that on the large-scale farm households with more agricultural machinery. The above results may be explained by the fact that the farm households with a large number of labor force, a large scale of operation or more types of agricultural machinery are mostly specialized grain growers. With a better resource endowment, the specialized grain farmers enjoy an inherently higher level of high-quality production of grain. And small farm households, with a small number of agricultural labor force and a small scale of operation or capital, have an originally low level of high-quality production of grain. After the small farm households are under agricultural production trusteeship, the promotion effect of the trusteeship services on their high-quality production is remarkable. At present, Chinese grain producers are still mainly small farm households, so agricultural production trusteeship will continue to play the important role in boosting high-quality production of grain in China.
The findings of this paper are highly consistent with previous related studies. The research by Siyu Yang et al. indicates that agricultural machinery service has a greater impact on the land productivity of small-scale farms [30]; Ma Li et al. even suggest that socialized services promote the organic integration of small farm households with modern agriculture, which can better motivate small farm households to engage in modern agricultural production [18]. Based on these, we carry out a more in-depth and systematic study to classify small farm households not only in terms of their scale operation, but also in terms of their number of labor force and scale of capital, and then we compare the promotion effects of agricultural production trusteeship services on high-quality production of each type of farm households.
5. Conclusions and Insights
Based on research data from October to December 2020 in five major wheat-producing provinces, including Henan, Shandong, Anhui, Hebei and Jiangsu provinces, we investigated the promotion effect of agricultural production trusteeship on high-quality production of grain of the trusteeship farm households using propensity score matching method. The research findings are as follows:
- Agricultural production trusteeship can promote high-quality production of grain through promoting high efficiency, premiumization, greenization and branding of grain production, with promotion of premiumization the most effective, followed by that of high efficiency, greenization and branding.
- The promotion effects of different trusteeship services on high-quality production of grain differ, with agricultural material supply services being the most effective, followed by post-production services, and then production management and ploughing, seeding and harvesting services. Specifically, agricultural material supply services, ploughing, seeding and harvesting services and post-production services are the most effective on promoting premiumization of grain production, and production management services have the most significant driving effect on greenization of grain production.
- Compared to farm households with better resource endowments, the agricultural production trusteeship has a better promotion effect on the high-quality production of grain by the small farm holders with a small number of labor force, a small scale of operation and fewer types of agricultural machinery.
Based on the conclusions above, the following insights can be drawn:
- Agricultural production trusteeship can effectively promote high-quality production of grain and help secure grain security of China. Hence, the government should strongly support the development of agricultural production trusteeship and enrich the content of agricultural production trusteeship.
- Given the differences in the effectiveness of different trusteeship services in promoting high-quality production of grain, the government should focus on supporting the service links with significant promotion effect.
- Given the fact that agricultural production trusteeship has a better driving effect on small farm households, and that small farm households are still the mainstay of grain cultivation in China. Hence, it is important to raise the awareness of agricultural production trusteeship of the small holders and to guide more small holders to choose agricultural production trusteeship.
Author Contributions
Conceptualization, X.S. and Y.W.; methodology, X.S., Y.W. and X.L.; software, Y.W. and X.L.; validation, X.L.; formal analysis, J.L. and S.S.; investigation, X.S., Y.W. and X.L.; resources, J.L.; data curation, Y.W. and X.L.; writing—original draft preparation, X.S.; writing—review and editing, F.Z.; visualization, X.L.; supervision, X.S. and J.L.; project administration, X.S.; funding acquisition, X.S. All authors have read and agreed to the published version of the manuscript.
Funding
This research was funded by the Key Project of Social Science Planning of Shandong Province, China, grant number 22BJJJ02.
Institutional Review Board Statement
Not applicable.
Data Availability Statement
All data can be obtained by email from the corresponding author.
Conflicts of Interest
The authors declare no conflict of interest.
References
- Xue, Y.; Xu, Y.; et al. The Effect of Uncertainty of Risks on Farmers’ Contractual Choice Behavior for Agricultural Productive Services: An Empirical Analysis from the Black Soil in Northeast China. Agronomy 2022, 12, 2677. [Google Scholar] [CrossRef]
- Cao, C.; Chen, X. Can Industrial Integration Improve the Sustainability of Grain Security? Sustainability 2021, 13, 13618. [Google Scholar] [CrossRef]
- Liu, X.; Xu, Y.; Engel, B. A.; et al. The impact of urbanization and aging on food security in developing countries: The view from Northwest China. Journal of Cleaner Production 2021, 292, 126067. [Google Scholar] [CrossRef]
- Xu, N.; Zhang, L.; Leng, X. Sustainable Food Production from a Labor Supply Perspective: Policies and Implications. Sustainability 2022, 14, 15935. [Google Scholar] [CrossRef]
- He, Y.; Zang, L.; Luo, E. The Impact of Part-Time Employment on the Grain-Growing Decisions of Smallholder Farmers in the Main Grain-Producing Areas of China Based on the Mediating Effect of Agricultural Production Services. Sustainability 2023, 15, 369. [Google Scholar] [CrossRef]
- Jiao, X.; Zhang, H.; Chong, W.; et al. Science and Technology Backyard: A novel approach to empower smallholder farmers for sustainable intensification of agriculture in China. Journal of Integrative Agriculture 2019, 18, 1657–1666. [Google Scholar] [CrossRef]
- Chen, T.; Rizwan, M.; Abbas, A. Exploring the Role of Agricultural Services in Production Efficiency in Chinese Agriculture: A Case of the Socialized Agricultural Service System. Land 2022, 11, 347. [Google Scholar] [CrossRef]
- Tang, L.; Liu, Q.; Yang, W. Do agricultural services contribute to cost saving? Evidence from Chinese rice farmers. China Agricultural Economic Review 2018, 10, 323–337. [Google Scholar] [CrossRef]
- Huan, M.; Li, Y.; Chi, L.; Zhan, S. The Effects of Agricultural Socialized Services on Sustainable Agricultural Practice Adoption among Smallholder Farmers in China. Agronomy 2022, 12, 2198. [Google Scholar] [CrossRef]
- Ren, Z. Effects of risk perception and agricultural socialized services on farmers’ organic fertilizer application behavior: Evidence from Shandong Province, China. Frontiers in Public Health 2023, 11, 1056678. [Google Scholar] [CrossRef] [PubMed]
- Yang, C.; Zeng, H.; Zhang, Y. Are Socialized Services of Agricultural Green Production Conducive to the Reduction in Fertilizer Input? Empirical Evidence from Rural China. International Journal of Environmental Research and Public Health 2022, 19, 14856. [Google Scholar] [CrossRef]
- Huang, J.; Huang, Z.; Jia, X. Long-term reduction of nitrogen fertilizer use through knowledge training in rice production in China. Agricultural Systems 2015, 135, 105–111. [Google Scholar] [CrossRef]
- Shen, Z.; Wang, S.; Boussemart, J.P. Digital transition and green growth in Chinese agriculture. Technological Forecasting and Social Change 2022, 181, 121742. [Google Scholar]
- Cui, X.; Cai, T.; Deng, W. Indexes for Evaluating High-Quality Agricultural Development: Empirical Study from Yangtze River Economic Belt, China. Social Indicators Research 2022, 164, 1101–1127. [Google Scholar] [CrossRef]
- Fei, X.; Feng, J. Research on the High-Quality Development Model of China’s Grain Industry from the Perspective of Rural Revitalization. Wireless Communications and Mobile Computing 2022, 2661237. [Google Scholar] [CrossRef]
- Chen, H.; Yang, J. A Research on the connotation of on High Quality Development of Grain Industry. Quality and Market 2021, 59–61. [Google Scholar]
- Qi, D.; Qi, H.; Fan, Q. Construction of Evaluation Index System for High-quality Development of Grain Industry. Statistics and Decision 2022, 38, 106–110. [Google Scholar]
- Ma, L.; Wang, Y.; Teng, Y. Evolutionary game analysis of stakeholders under the whole process trusteeship mode of agricultural production. Kybernetes 2022, 51, 2877–2901. [Google Scholar] [CrossRef]
- Li, Y.; Huan, M.; Jiao, X.; et al. The impact of labor migration on chemical fertilizer use of wheat smallholders in China-mediation analysis of socialized service. Journal of Cleaner Production 2023, 394, 136366. [Google Scholar] [CrossRef]
- Gao, Y.; Zhao, D.; Yu, L.; et al. Influence of a new agricultural technology extension mode on farmers’ technology adoption behavior in China. Journal of Rural Studies 2020, 76, 173–183. [Google Scholar] [CrossRef]
- Mokotjo, W.; Kalusopa, T. Evaluation of the agricultural information service (AIS) in Lesotho. International Journal of Information Management 2010, 30, 350–356. [Google Scholar] [CrossRef]
- Sun, D.; Rickaille, M.; Xu, Z. Determinants and impacts of outsourcing pest and disease management: Evidence from China’s rice production. China Agricultural Economic Review 2018, 10, 443–461. [Google Scholar] [CrossRef]
- Deng, X.; Xu, D.; Zeng, M.; et al. Does outsourcing affect agricultural productivity of farmer households? Evidence from China. China Agricultural Economic Review 2020, 12, 673–688. [Google Scholar] [CrossRef]
- Chen, Z.; Tang, C.; Liu, B.; et al. Can Socialized Services Reduce Agricultural Carbon Emissions in the Context of Appropriate Scale Land Management? Frontiers in Environmental Science 2022, 10, 1039760. [Google Scholar] [CrossRef]
- Chen, X.; Liu, T. Can Agricultural Socialized Services Promote the Reduction in Chemical Fertilizer? Analysis Based on the Moderating Effect of Farm Size. International Journal of Environmental Research and Public Health 2023, 20, 2323–2323. [Google Scholar] [CrossRef] [PubMed]
- Gao, Y.; Niu, Z.; Yang, H. Impact of green control techniques on family farms’ welfare. Ecological Economics 2019, 161, 91–99. [Google Scholar] [CrossRef]
- Zhao, F.; Li, F.; Zhou, J.; et al. Soiltesting formula fertilization with organic fertilizer addition for target yield cannot stand long due to stem lodging of rice. Frontiers in Plant Science 2022, 13, 1091156. [Google Scholar] [CrossRef]
- Yu, W.; Yue, Y.; Wang, F. The spatial-temporal coupling pattern of grain yield and fertilization in the North China plain. Agricultural Systems 2022, 196, 103330. [Google Scholar] [CrossRef]
- Zhang, H.; Garratt, M.P.D.; Bailey, A.; et al. Economic valuation of natural pest control of the summer grain aphid in wheat in South East England. Ecosystem Services 2018, 30, 149–157. [Google Scholar] [CrossRef]
- Yang, S.; Li, W. The Impact of Socialized Agricultural Machinery Services on Land Productivity: Evidence from China. Agriculture 2022, 12, 2072. [Google Scholar] [CrossRef]
- Wang, D.; Abula, B.; Lu, Q.; et al. Regional Business Environment, Agricultural Opening-Up and High-Quality Development: Dynamic Empirical Analysis from China’s Agriculture. Agronomy 2022, 12, 974. [Google Scholar] [CrossRef]
- Tang, Y.; Chen, M. The Impact of Agricultural Digitization on the High-Quality Development of Agriculture: An Empirical Test Based on Provincial Panel Data. Land 2022, 11, 2152. [Google Scholar] [CrossRef]
- Wang, H.; Xiong, R.; Zhou, Y.; et al. Grain yield improvement in high-quality rice varieties released in southern China from 2007 to 2017. Frontiers in Sustainable Food Systems 2022, 6, 986655. [Google Scholar] [CrossRef]
- Mondo, V.H.V.; Cicero, S.M; Dourado-Neto, D.; et al. Effect of seed vigor on intraspecific competition and grain yield in maize. Agronomy Journal 2013, 105, 222–228. [Google Scholar] [CrossRef]
- Rajala, A.; Niskanen, M.; Isolahti, M.; et al. Seed quality effects on seedling emergence, plant stand establishment and grain yield in two-row barley. Agricultural and Food Science 2011, 20, 228–234. [Google Scholar] [CrossRef]
- Wang, Y.; Tanaka, T.S.T.; Li, K. Decreasing input–output balance by reducing chemical fertilizer input without yield loss in intensive cropping system in the Coastal Area of southeast Lake Dianchi, Yunnan Province, China. Plant Production Science 2016, 19, 81–90. [Google Scholar] [CrossRef]
- Edney, M.J.; O’Donovan, J.T.; Turkington, T.K.; et al. Effects of seeding rate, nitrogen rate and cultivar on barley malt quality. Journal of the Science of Food and Agriculture 2012, 92, 2672–2678. [Google Scholar] [CrossRef] [PubMed]
- Ramachandran, R.P. Integrated approach on stored grain quality management with CO2 monitoring-A review. Journal of Stored Products Research 2022, 96, 101950. [Google Scholar] [CrossRef]
- Zhang, Y.; Zhao, X.; Fu, B. Impact of energy saving on the financial performance of industrial enterprises in China: An empirical analysis based on propensity score matching. Journal of Environmental Management 2022, 317, 115377. [Google Scholar] [CrossRef]
- Kim, C.; Ko, J. Unintended Consequences of Housing Policies: Evidence from South Korea. Sustainability 2023, 15, 3407. [Google Scholar] [CrossRef]
- Liu, Y.; Sun, D.; Wang, H.; et al. An evaluation of China’s agricultural green production: 1978–2017. Journal of Cleaner Production 2020, 243, 118483. [Google Scholar] [CrossRef]
- Liu, X.; Zhang, Y.; Leng, X.; et al. Exploring the optimisation of mulching and irrigation management practices for mango production in a dry hot environment based on the entropy weight method. Scientia Horticulturae 2022, 291, 110564. [Google Scholar] [CrossRef]
- Li, Q.; Hu, H.; Ma, L.; et al. Evaluation of energy-saving retrofits for sunspace of rural residential buildings based on orthogonal experiment and entropy weight method. Energy for Sustainable Development 2022, 70, 569–580. [Google Scholar] [CrossRef]
- Li, L.; Han, J.; Zhu, Y. Does farmland inflow improve the green total factor productivity of farmers in China? An empirical analysis based on a propensity score matching method. Heliyon 2023, 9, e13750. [Google Scholar] [CrossRef]
- Qian, L.; Lu, H.; Gao, Q.; et al. Household-owned farm machinery vs. outsourced machinery services: The impact of agricultural mechanization on the land leasing behavior of relatively large-scale farmers in China. Land Use Policy 2022, 115, 106008. [Google Scholar] [CrossRef]
| 1 | In China, the statistical standard for land area is usually "mu" (1 mu=666.67 square meters), so the land area in this article is expressed in mu. |
| 2 | See China’s Ministry of Agriculture and Rural Affairs - Bearing Steady the Heavy Responsibility of Grain Production for Consolidating the Foundation of a Strong Nation. http://www.ghs.moa.gov.cn/xczx/202210/t20221021_6413824.htm
|
| 3 | Henan, Shandong, Anhui, Jiangsu and Hebei are the top 5 provinces in the country in terms of wheat production. In 2019, the wheat sowing area and total production of these 5 provinces were 17,213.43 thousand hectares and 107,316.6 thousand tons respectively, accounting for 72.55% and 80.33% of the national wheat sowing area and national production respectively. |
| 4 | By the end of 2019, the area under agricultural production trust in Hebei, Anhui, Shandong and Henan provinces had all exceeded 100 million mus or more, and the area under agricultural production trust in Jiangsu province had reached more than 50 million mus. |
| 5 | According to data from the third agricultural census, China now has 230 million farm households, with an average household scale of operation of 7.8 mus, and of these farm households, 210 million are small-scale ones operating on less than 10 mus of cultivated land, accounting for more than 98% of agricultural operation entities. |
Figure 2.
Density function before and after propensity score matching.
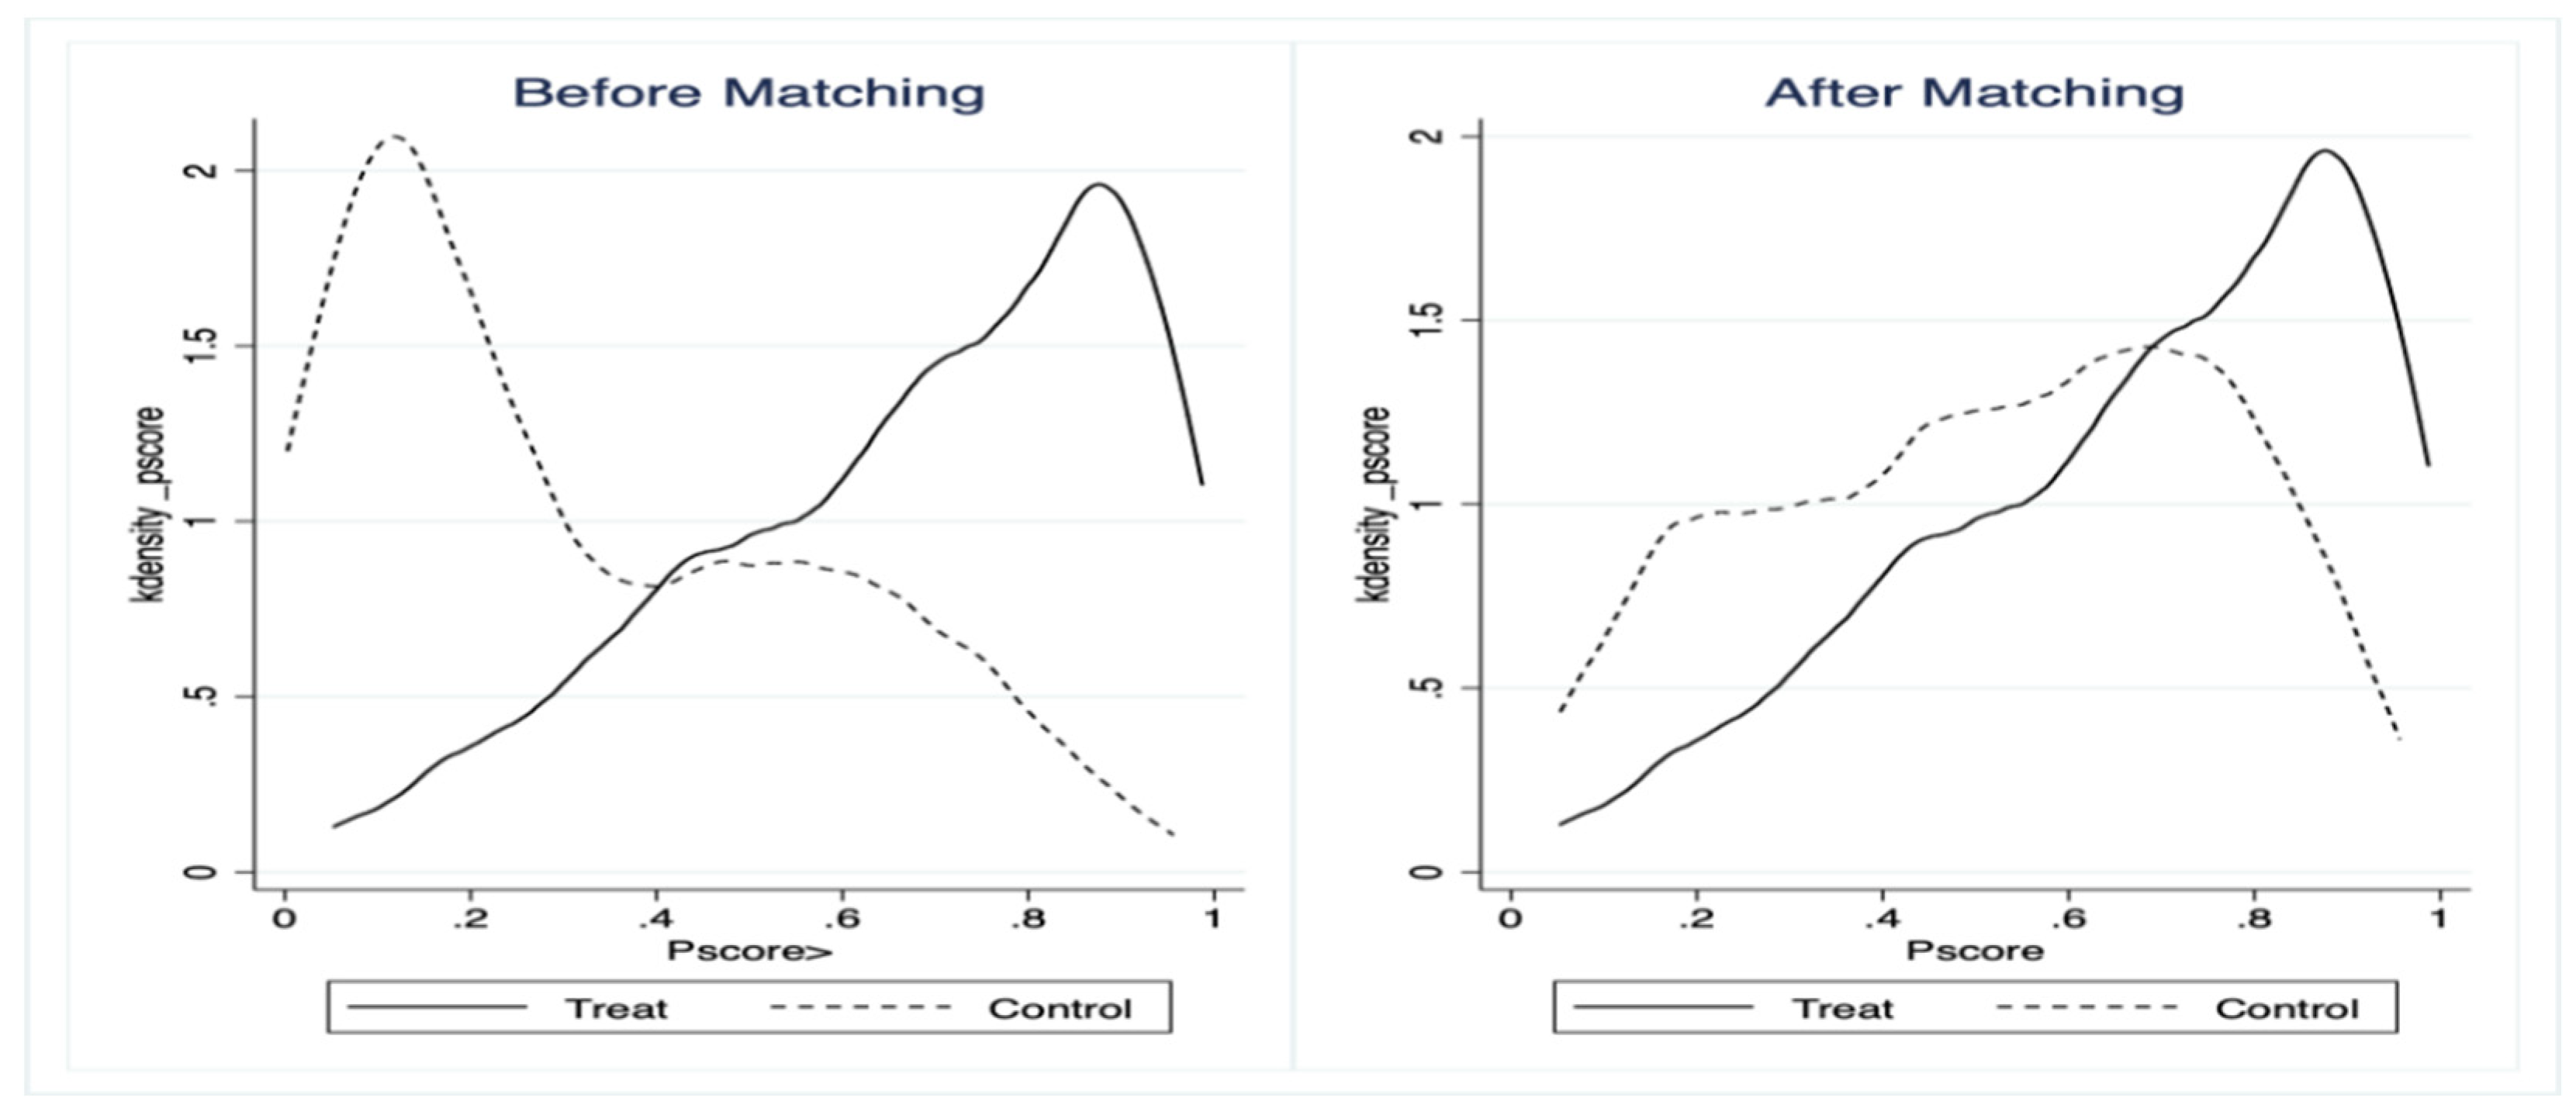

Table 1.
Index system for evaluation of farm households’ high quality grain production level and its weights.
Table 1.
Index system for evaluation of farm households’ high quality grain production level and its weights.
| Dimension indexes | Element indexes | Measurement method |
|---|---|---|
| High efficiency of grain production (0.15308) |
Efficiency of farm machinery operation (0.05696) |
Relative to average level of operation, the agricultural operators’ assessment of the operational efficiency of the agricultural machinery they use: very low=1, relatively low=2, fairly average=3, a little bit higher=4, much higher=5 |
| Efficiency of land output (0.04942) |
Yield of wheat per mu in 2020(kg/mu) | |
| Efficiency of resource utilization (0.04669) |
Relative to average use, the agricultural operators’ assessment of the amount of agricultural inputs used: much more=1, more=2, fairly average=3, less=4, much less=5 |
|
| Premiumization of grain production (0.49035) |
Use of high-quality seeds (0.32074) |
Whether high-quality seeds are used: yes=1, no=0 |
| Standardized production (0.16961) |
The number of the four links of unified seed supply, unified farm machinery operation, unified land management and unified marketing which the farm households have used: 0,1, 2, 3 or 4 |
|
| Greenization of grain production (0.32883) |
Use of green inputs (0.27415) |
Types of green pesticides (including biopesticides, pollution-free pesticides, etc.) and green fertilizers (including organic fertilizers, green fertilizers, etc.) used: 0, 1 or 2 |
| Use of green production technology (0.05468) |
The number of the 6 green agricultural production techniques of seed coating, deep tillage and subsoiling, soil testing formula fertilization, green prevention and control techniques, sprinkler and drip irrigation, and straw returning used: 0, 1, 2, 3, 4, 5 or 6 |
|
| Branding of grain production (0.02774) |
High quality and good price mechanism (0.02774) |
The agricultural operator’s assessment of the price of wheat sold relative to the market price: low=1, slightly lower=2, fairly average=3, slightly higher=4, much higher=5 |
Table 2.
Definition and descriptive statistics of the variables.
| Variable name | Variable definition and assignment | Mean | Standard deviation |
|---|---|---|---|
| High-quality production of grain | This is the high-quality grain production index, the higher the value of which, the higher the high-quality grain production level | 0.461 | 0.256 |
| High efficiency of grain production | This is the efficient grain production index, the higher the value of which, the higher the grain production efficiency level | 0.527 | 0.174 |
| Premiumization of grain production | This is the premium grain production index, the higher the value of which, the higher the grain production premiumization level | 0.477 | 0.379 |
| Greenization of grain production | This is the green grain production index, the higher the value of which, the higher the grain production greenization level | 0.396 | 0.308 |
| Branding of grain production | This is the branding index of grain production, the higher the value of which, the higher the branding level of grain production | 0.569 | 0.189 |
| Whether participating in the agricultural production trusteeship | Whether or not farm households were under agricultural production trusteeship in 2020: yes=1, no=0 | 0.497 | 0.5 |
| Age | This is the age of grain production decision-makers (years) | 56.5 | 10.347 |
| Education background | This is the educational background of grain production decision-makers: primary school and below=1, junior high school=2, senior high school=3, college=4, undergraduate and above=5 | 1.814 | 0.792 |
| Number of agricultural labor force | This was the number of household agricultural labour force in 2020 (persons) | 1.884 | 0.557 |
| Part-time business | Whether or not the agricultural labor force was working or doing business during the agricultural leisure time in 2020: yes=1, no=0 | 0.653 | 0.476 |
| Total household income | This was the total household income in 2020: less than RMB 50,000 =1, between RMB 50,000 and RMB 100,000= 2, RMB100,000 or above=3 | 1.973 | 0.76 |
| Proportion of grain income | This is the proportion of grain income in total household income in 2020: below 20%=1, 20% or between 20% and 50%=2, 50% or between 50% and 80%=3, 80% or above=4 | 2.225 | 1.081 |
| Market distance | This is the distance between farm households and large agricultural markets (km) | 3.959 | 2.514 |
| Scale of Operation | This was the household Area of wheat planted in 2020 (mu) | 21.488 | 151.374 |
| Degree of land fragmentation | This was the number of patches of land/scale of operation in 2020 | 0.476 | 0.489 |
| Types of agricultural machinery | This is the household types of farm machinery, including ploughing machinery, subsoiler, seeder (or seed and fertilizer co-sowing machine), fertilizing machinery, motor-driven pesticide application equipment, watering equipment, harvester, agricultural conveyor and thresher, calculated in round-off numbers | 1.383 | 1.437 |
| Traffic conditions | This is the accessibility of large agricultural machinery to the cultivated land: very inconvenient=1, not very convenient=2, general=3, relatively convenient=4, very convenient=5 | 4.118 | 0.865 |
| Information acquisition channels | These are the six channels for farm households to get access to agricultural information, including relatives and friends, television, mobile phone or computer, cooperatives and other organizations, village committees or government departments, and agricultural materials distributors, calculated in round-off numbers | 3.423 | 1.301 |
| Availability of farm machinery household resources | Whether or not farm households have farm machinery household resources: yes=1, no=0 | 0.794 | 0.405 |
| Membership of cooperative organizations | Whether or not farm households joined organizations such as cooperatives: yes=1, no=0 | 0.491 | 0.5 |
| Government publicity situation | This is the number of agricultural production trusteeship publicity campaigns targeted by government departments in a year | 3.428 | 1.921 |
| Professional cultivation guidance | This is the number of on-site cultivation instruction by professional technicians within a year | 2.501 | 2.073 |
Note: The variable of Age, Market distance and Scale of operation have been logarithmized in the regressions in order to reduce the effect of the dimension.
Table 3.
Logit model of farm households’ decision-making in choosing agricultural production trusteeship.
Table 3.
Logit model of farm households’ decision-making in choosing agricultural production trusteeship.
| Variable Name | Estimated value of coefficient | Standard deviation | Z value |
|---|---|---|---|
| Age | 3.068*** | 0.507 | 6.05 |
| Education background | 0.327*** | 0.1 | 3.27 |
| Number of agricultural labor force | -0.515*** | 0.143 | -3.61 |
| Part-time business | 0.652*** | 0.197 | 3.3 |
| Total household income | 0.719*** | 0.119 | 6.06 |
| Proportion of grain income | 0.177** | 0.083 | 2.12 |
| Market distance | 0.305* | 0.168 | 1.82 |
| Scale of operating | -0.056 | 0.12 | -0.47 |
| Degree of land fragmentation | -0.667*** | 0.226 | -2.95 |
| Type of agricultural machinery | -0.313*** | 0.061 | -5.18 |
| Traffic conditions | 0.556*** | 0.116 | 4.81 |
| Channels of information acquisition | 0.241*** | 0.083 | 2.91 |
| Availability of farm machinery household resources | -0.418** | 0.179 | -2.33 |
| Membership of cooperative organizations | 0.470** | 0.204 | 2.3 |
| Government publicity campaigns | 0.324*** | 0.044 | 7.38 |
| Professional cultivation guidance | 0.144*** | 0.039 | 3.68 |
| Constant term | -18.370*** | 2.303 | -7.98 |
| LR statistics | 483.397*** | ||
| Pseudo | 0.297 | ||
| Sample size | 1174 | ||
Note: The results of k-nearest neighbor matching (k=4) are listed in this table, and the results of other matching methods are similar and so are not listed here. *, **and*** indicate that it is significant at the statistical levels of 10%, 5% and 1% respectively.
Table 4.
Balance test of control variables before and after matching.
| Matching methods | LR statistics | P-value | Mean deviation (%) | Median deviation (%) | |
|---|---|---|---|---|---|
| Before matching | 0.299 | 486.15 | 0.000 | 35.3 | 28.5 |
| K-nearest neighbor matching | 0.013 | 20.7 | 0.19 | 4.9 | 5.4 |
| Caliper matching | 0.013 | 20.2 | 0.211 | 3.9 | 3.1 |
| Core matching | 0.013 | 20.33 | 0.206 | 4.1 | 3.8 |
| Local linear regression matching | 0.013 | 20.35 | 0.205 | 4.3 | 3.6 |
| Spline matching | 0.013 | 20.35 | 0.205 | 4.3 | 3.6 |
Note: This table shows the results of the balance test for the control variable of the equation of high-quality grain production index. The balance test results of other equations are similar and are not reported in this case.
Table 5.
Overall promotion effect of agricultural production trusteeship on high-quality grain production.
Table 5.
Overall promotion effect of agricultural production trusteeship on high-quality grain production.
| Matching method | K-nearest neighbor matching |
Caliper matching |
Core matching |
Local linearity regression matching |
Spline matching |
Average |
|---|---|---|---|---|---|---|
| High-quality grain production | ||||||
| Experimental group | 0.626 | 0.626 | 0.626 | 0.626 | 0.626 | 0.626 |
| Control group | 0.327 | 0.334 | 0.335 | 0.334 | 0.34 | 0.334 |
| ATT | 0.3*** (0.022) |
0.292*** (0.02) |
0.291*** (0.02) |
0.292*** (0.025) |
0.286*** (0.02) |
0.292 |
| High efficiency of grain production | ||||||
| Experimental group | 0.661 | 0.661 | 0.661 | 0.661 | 0.661 | 0.661 |
| Control group | 0.425 | 0.426 | 0.427 | 0.425 | 0.431 | 0.427 |
| ATT | 0.236*** (0.011) |
0.235*** (0.011) |
0.234*** (0.011) |
0.237*** (0.013) |
0.23*** (0.01) |
0.234 |
| Premiumization of grain production | ||||||
| Experimental group | 0.684 | 0.684 | 0.684 | 0.684 | 0.684 | 0.684 |
| Control group | 0.297 | 0.312 | 0.314 | 0.311 | 0.32 | 0.311 |
| ATT | 0.388*** (0.037) |
0.372*** (0.034) |
0.37*** (0.033) |
0.373*** (0.042) |
0.364*** (0.033) |
0.373 |
| Greenization of grain production | ||||||
| Experimental group | 0.52 | 0.52 | 0.52 | 0.52 | 0.52 | 0.52 |
| Control group | 0.311 | 0.31 | 0.311 | 0.313 | 0.314 | 0.312 |
| ATT | 0.209*** (0.029) |
0.21*** (0.026) |
0.21*** (0.026) |
0.207*** (0.034) |
0.206*** (0.023) |
0.208 |
| Branding of grain production | ||||||
| Experimental group | 0.657 | 0.657 | 0.657 | 0.657 | 0.657 | 0.657 |
| Control group | 0.498 | 0.499 | 0.499 | 0.498 | 0.503 | 0.499 |
| ATT | 0.159*** (0.014) |
0.158*** (0.014) |
0.158*** (0.013) |
0.159*** (0.017) |
0.153*** (0.014) |
0.158 |
Note: ***indicate that it is significant at the statistical levels of 1% respectively; the standard deviations are shown in brackets.
Table 6.
Promotion effects of different trusteeship services on high quality grain production.
| Types of Trusteeship services | High-quality grain production | High efficiency of grain production | Premiumization of grain production | Greenization of grain production | Branding of grain production | ||
|---|---|---|---|---|---|---|---|
| Agricultural material supply | Experimental group | 0.614 | 0.618 | 0.701 | 0.482 | 0.619 | |
| Control group | 0.327 | 0.463 | 0.269 | 0.333 | 0.558 | ||
| ATT | 0.287*** (0.015) |
0.155*** (0.01) |
0.433*** (0.022) |
0.149*** (0.021) |
0.06*** (0.013) |
||
| Ploughing, seeding and harvesting services |
Experimental group | 0.558 | 0.613 | 0.597 | 0.467 | 0.63 | |
| Control group | 0.418 | 0.479 | 0.392 | 0.421 | 0.511 | ||
| ATT |
0.139*** (0.025) |
0.134*** (0.015) |
0.205*** (0.039) |
0.046*** (0.03) |
0.119*** (0.015) |
||
| Production management services | Experimental group | 0.597 | 0.621 | 0.62 | 0.546 | 0.676 | |
| Control group | 0.439 | 0.516 | 0.479 | 0.337 | 0.514 | ||
| ATT | 0.158*** (0.017) |
0.105*** (0.011) |
0.141*** (0.027) |
0.208*** (0.021) |
0.162*** (0.012) |
||
| Post-harvest services | Experimental group | 0.685 | 0.676 | 0.759 | 0.573 | 0.743 | |
| Control group | 0.455 | 0.536 | 0.47 | 0.388 | 0.549 | ||
| ATT | 0.23*** (0.017) |
0.14*** (0.012) |
0.29*** (0.026) |
0.185*** (0.025) |
0.194*** (0.015) |
||
Note: The results of k-nearest neighbor matching (k=4) are listed in this table, and the results by other matching methods are similar and so are not listed here. *** indicate that it is significant at the statistical levels of 1% respectively; standard deviations are shown in brackets.
Table 7.
Promotion effect of agricultural production trusteeship on the high-quality grain production by trusteeship farmers with different factor endowments.
Table 7.
Promotion effect of agricultural production trusteeship on the high-quality grain production by trusteeship farmers with different factor endowments.
| Grouping variables | High-quality grain production |
High efficiency of grain production | Premiumization of grain production | Greenization of grain production |
Branding of grain production | |
|---|---|---|---|---|---|---|
| Number of labor force | ||||||
| 3 persons or less | Experimental group | 0.62 | 0.662 | 0.655 | 0.544 | 0.665 |
| Control group | 0.309 | 0.411 | 0.248 | 0.337 | 0.505 | |
| ATT | 0.311*** (0.026) |
0.25*** (0.014) |
0.408*** (0.043) |
0.207*** (0.035) |
0.16*** (0.016) |
|
| More than 3 persons | Experimental group | 0.62 | 0.645 | 0.732 | 0.441 | 0.623 |
| Control group | 0.375 | 0.436 | 0.434 | 0.248 | 0.495 | |
| ATT | 0.245*** (0.039) |
0.209*** (0.019) |
0.298*** (0.068) |
0.193*** (0.049) |
0.127*** (0.029) |
|
| Scale of operation | ||||||
| 10 mus or less | Experimental group | 0.613 | 0.654 | 0.663 | 0.514 | 0.662 |
| Control group | 0.297 | 0.406 | 0.252 | 0.296 | 0.484 | |
| ATT | 0.316*** (0.026) |
0.248*** (0.014) | 0.411*** (0.043) |
0.218*** (0.034) |
0.178*** (0.017) |
|
| More than 10 mus | Experimental group | 0.648 | 0.673 | 0.714 | 0.538 | 0.653 |
| Control group | 0.385 | 0.446 | 0.381 | 0.352 | 0.52 | |
| ATT | 0.263*** (0.033) |
0.227*** (0.017) |
0.333*** (0.065) |
0.186*** (0.047) |
0.132*** (0.027) |
|
| Types of agricultural machinery | ||||||
| 1 type or less | Experimental group | 0.621 | 0.656 | 0.652 | 0.555 | 0.652 |
| Control group | 0.328 | 0.426 | 0.277 | 0.346 | 0.277 | |
| ATT | 0.293*** (0.026) |
0.23*** (0.014) |
0.375*** (0.044) |
0.209*** (0.037) |
0.375*** (0.044) |
|
| More than 1 type | Experimental group | 0.619 | 0.664 | 0.717 | 0.449 | 0.646 |
| Control group | 0.355 | 0.436 | 0.361 | 0.296 | 0.506 | |
| ATT | 0.264*** (0.028) |
0.229*** (0.014) |
0.355*** (0.046) |
0.153*** (0.036) |
0.139*** (0.02) |
|
Note: The results of k-nearest neighbor matching (k = 4) are listed in this table, while the results of other matching methods are similar and so are not listed here. *** indicate that it is significant at the statistical levels of 1% respectively; standard deviations are shown in brackets.
Disclaimer/Publisher’s Note: The statements, opinions and data contained in all publications are solely those of the individual author(s) and contributor(s) and not of MDPI and/or the editor(s). MDPI and/or the editor(s) disclaim responsibility for any injury to people or property resulting from any ideas, methods, instructions or products referred to in the content. |
© 2023 by the authors. Licensee MDPI, Basel, Switzerland. This article is an open access article distributed under the terms and conditions of the Creative Commons Attribution (CC BY) license (http://creativecommons.org/licenses/by/4.0/).
Copyright: This open access article is published under a Creative Commons CC BY 4.0 license, which permit the free download, distribution, and reuse, provided that the author and preprint are cited in any reuse.


